GeoCareer: ITC Also Turns Its Gaze To The Netherlands
New Construction Since 2015 Mainly Within Built-Up Areas
Maak kennis met Tailormap – de nieuwste en modernste open source web GIS viewer
Tailormap is snel, intuïtief en gebouwd voor de toekomst.
Ideaal voor organisaties die hun geo-informatie slim willen ontsluiten.
Probeer Tailormap nu één maand gratis
Neem contact op via info@tailormap.nl en ontdek de voordelen zelf. Bezoek ons op 17 en 18 november tijdens GeoBuzz!
https://github.com/tailormap/
Kom langs bij onze stand en ervaar live wat Tailormap voor jouw organisatie kan betekenen. We ontmoeten je graag!
Tel: +31 30-2142081
https://www.tailormap.nl/
Publisher Durk Haarsma
E-mail: durk.haarsma@geomares.nl
Editor-in-Chief
Roelof Boekhold (vanaf 2026)
E-mail: hoofdredacteur@geo-info.nl
Central Editorial Team
Herman de Haan
E-mail: herman.de.haan@geomares.nl
GIN Editorial Board
Carline Amsing, Marien de Bakker, Jasper Hogerwerf, Arno Kijzerwaard, Peter Weenink.
Design Persmanager, The Hague
Contributors to this Issue
Hennie Genee, Wijand van Riel, Chrit Lemmen, Brad Hillas, Marèse Peters, Lars Langhorst, Christelle van den Berg, Gerjan Meijer, Jan Willem van Eck, Remco Takken, Janneke van den Elshout en Joris van Duin.
Advertising Sales
Jan Henk Hoekstra
Phone: 06 - 53 42 34 81
E-mail : jan.henk.hoekstra@geomares.nl
Subscriptions
Phone: 0514 561854
E-mail : info@geomares.nl
Personal Membership: € 105
Student Membership: free
GIN Membership (Company/Organisation):
Bronze: € 600, silver: € 1.000, gold € 1500
Geo-Info Subscription: € 225
Strategic Partnership: variable Members abroad pay additional postal fees: within Europe €30 (excl. 21% VAT) and outside Europe €55 (excl. 21% VAT). A €2 annual discount applies with automatic payment.
Subscriptions may start at any time and continue automatically unless cancelled at least two months before expiry. Business subscriptions cannot be terminated mid-term.
The information, text, images, photographs and illustrations in this magazine, as well as its design, are protected by copyright law and other applicable legislation. No part of this publication may be reproduced, made available to third parties, or made public without prior written permission from the copyright owner. Contributors to this publication grant permission for their materials to be reused in other communications of Geo-Informatie Netherlands.
ISSN 1572-5464 (print), ISSN 2211-0739 (online)
Geomares
P.O. Box 112, 8530 AC Lemmer 0514 56 1854 info@geo-info.nl
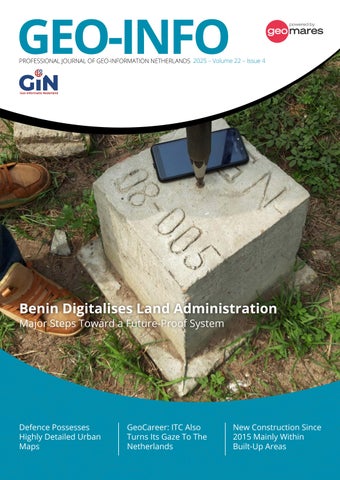
Land Administration in Benin
In the Republic of Benin, major progress is being made towards a modern, digital land administration system.
With e-Foncier Bénin, more than 530,000 parcels have already been mapped, granting millions of citizens access to legal security and economic opportunity.
22
Fair Compensation in Peat Landscapes
Higher water levels in peat areas are necessary to reduce CO2 emissions but have severe financial impacts on farmers. The Peat Meadow Compensation System (CSV) quantifies these damages and ensures fair compensation. Friesland is taking the lead.
Collaborating Computational Models
Computational models can work together more effectively when standardised.
Geonovum and VU Amsterdam explored interoperability and provided recommendations. Linked models assist governments in making complex decisions on water, housing, and traffic.
The Netherlands hosts many such models.
06 08 10 20
Project Approach Ring South Groningen
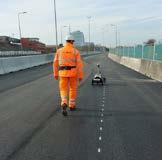
In the “Approach Ring South” project in Groningen, advanced surveying techniques were applied.
Surveyors from Geomaat used innovative technologies such as the Streetmapper and Robotplotter during this complex infrastructure project. construction locations.
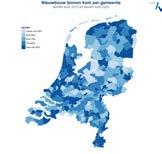
New Construction Within Built-Up Areas
Three-quarters of all new construction completed since 2015 has taken place within built-up areas. This results in densification: urban areas are becoming fuller, with smaller buildings. However, there are significant regional differences in construction locations.
32 26 28
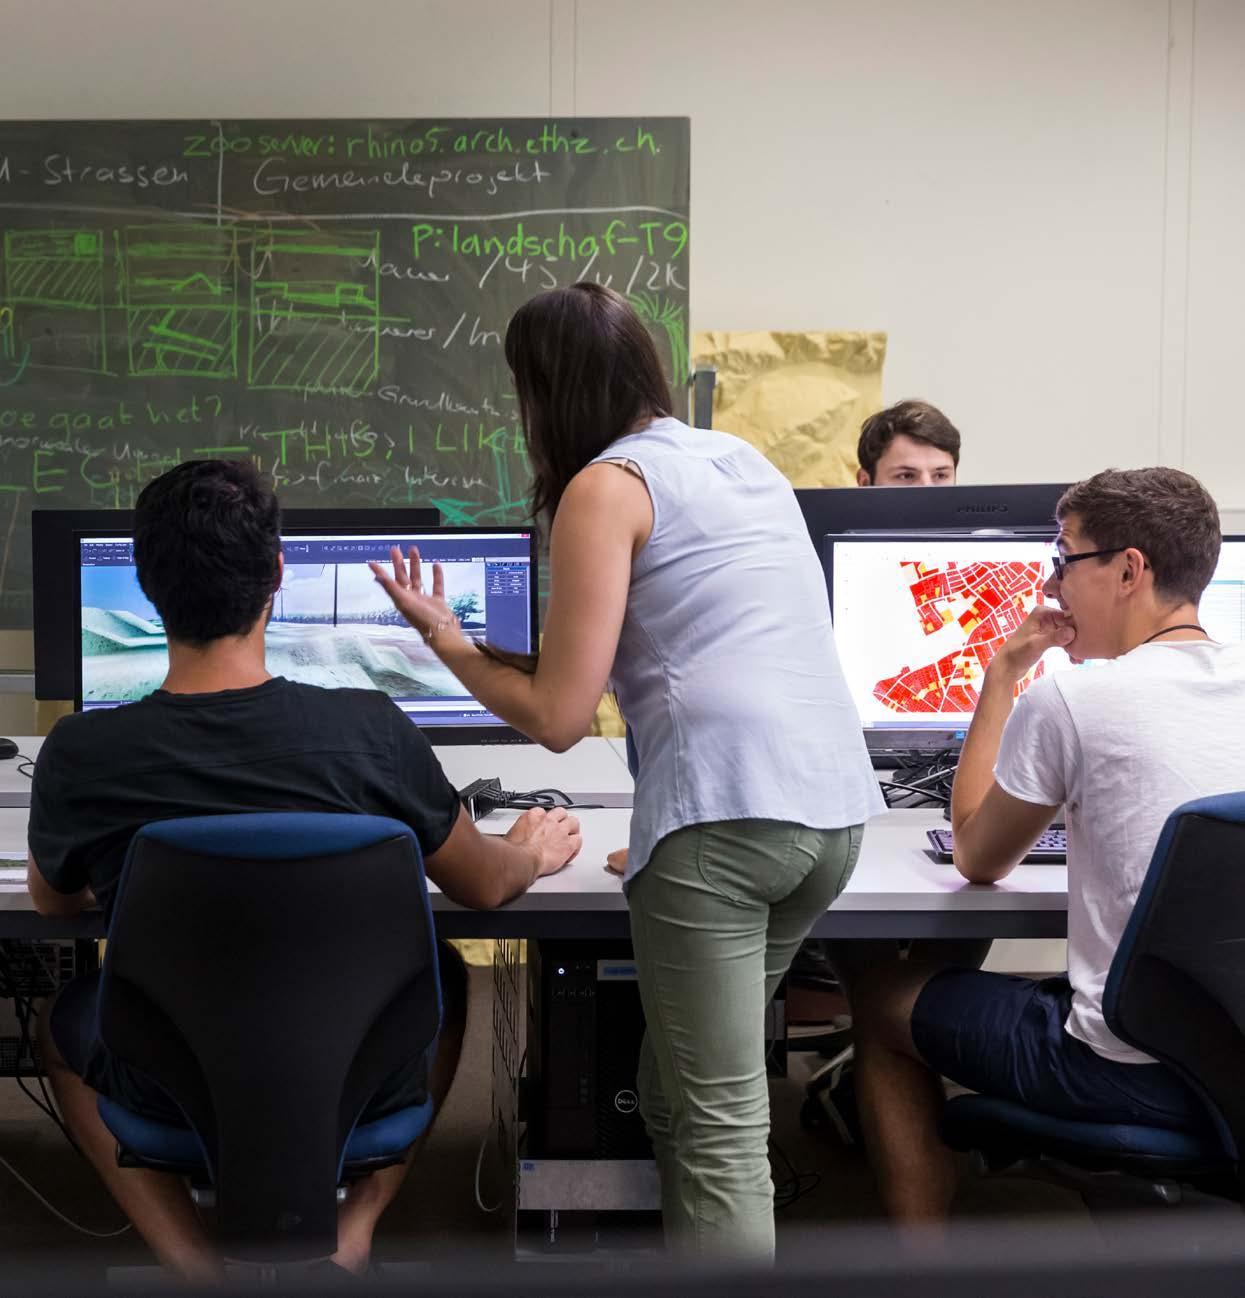
For three-quarters of a century, the ITC Faculty has been connecting geo-information with global development. What began with aerial photography has evolved into GeoAI and citizen science. Today, ITC also turns its gaze to the Netherlands, where spatial data are urgently needed for societal transitions.
Growing into a Mature GIS Organisation
The use of Geographic Information Systems (GIS) in the Netherlands dates back roughly 50 years. Systematic application within government organisations and private companies is a more recent development.
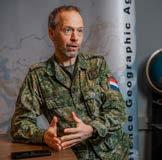
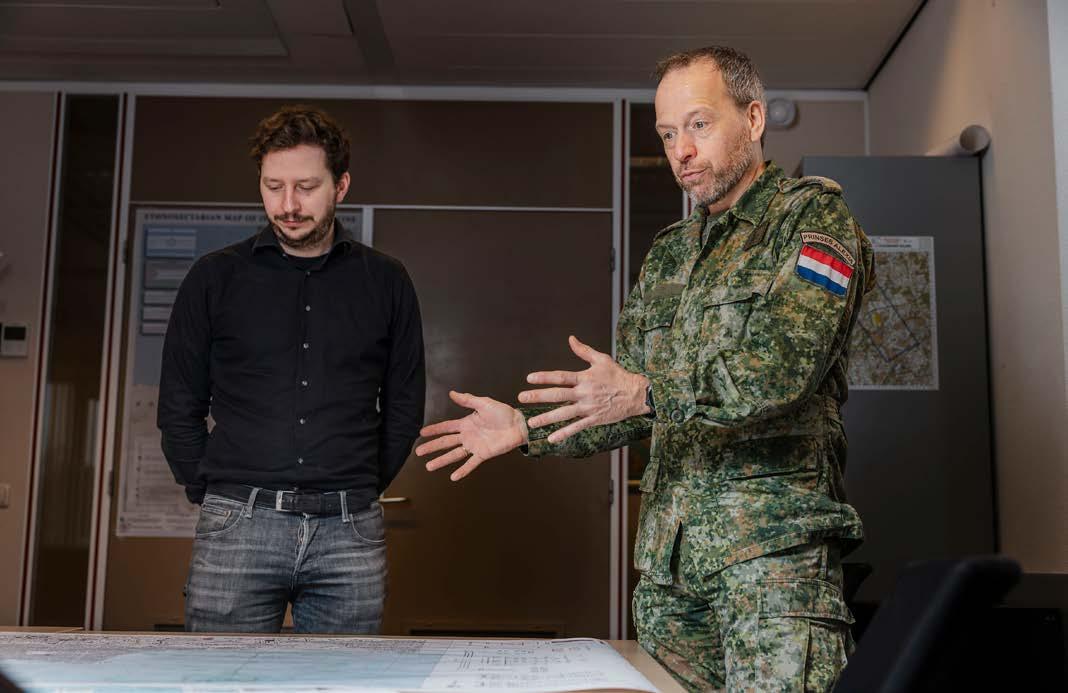
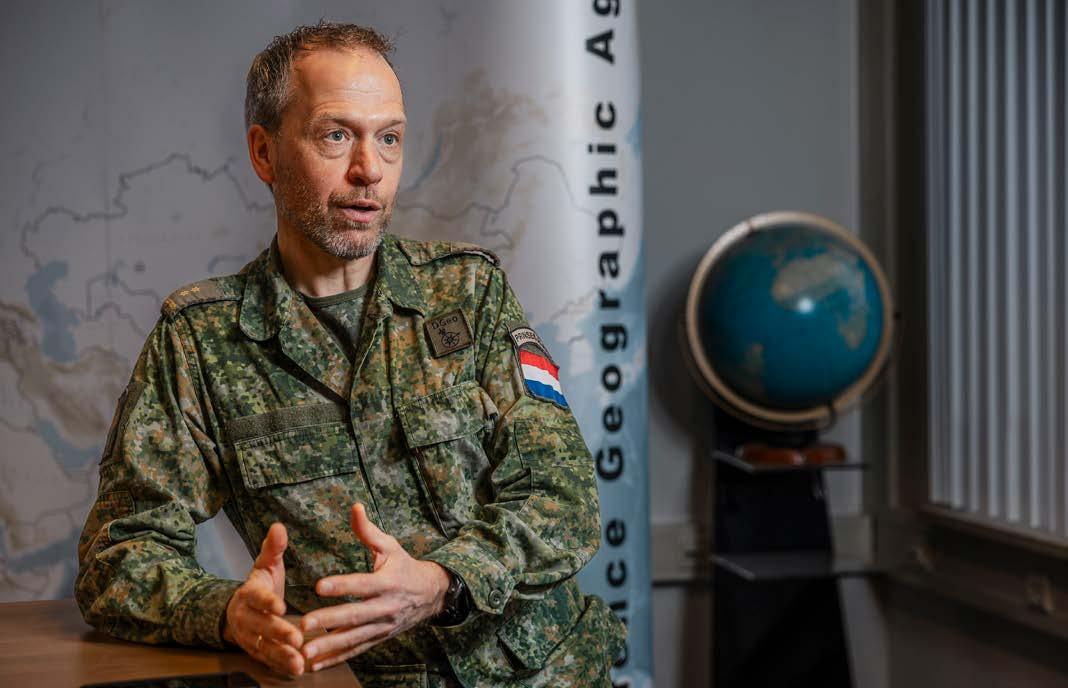
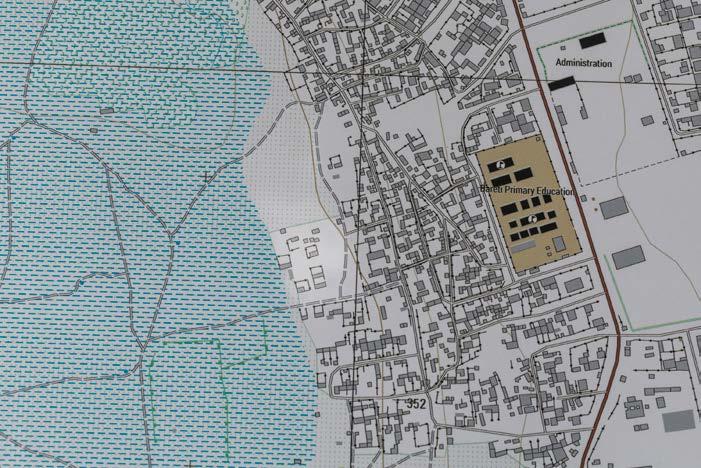
Extremely Detailed Urban Maps
Satellite imagery reveals urban secrets down to the level of property boundaries. The Defence Geography Service produces military maps at a 1:5,000 scale — ten times more detailed than standard maps. The Netherlands cooperates with 31 other countries on these detailed city maps.
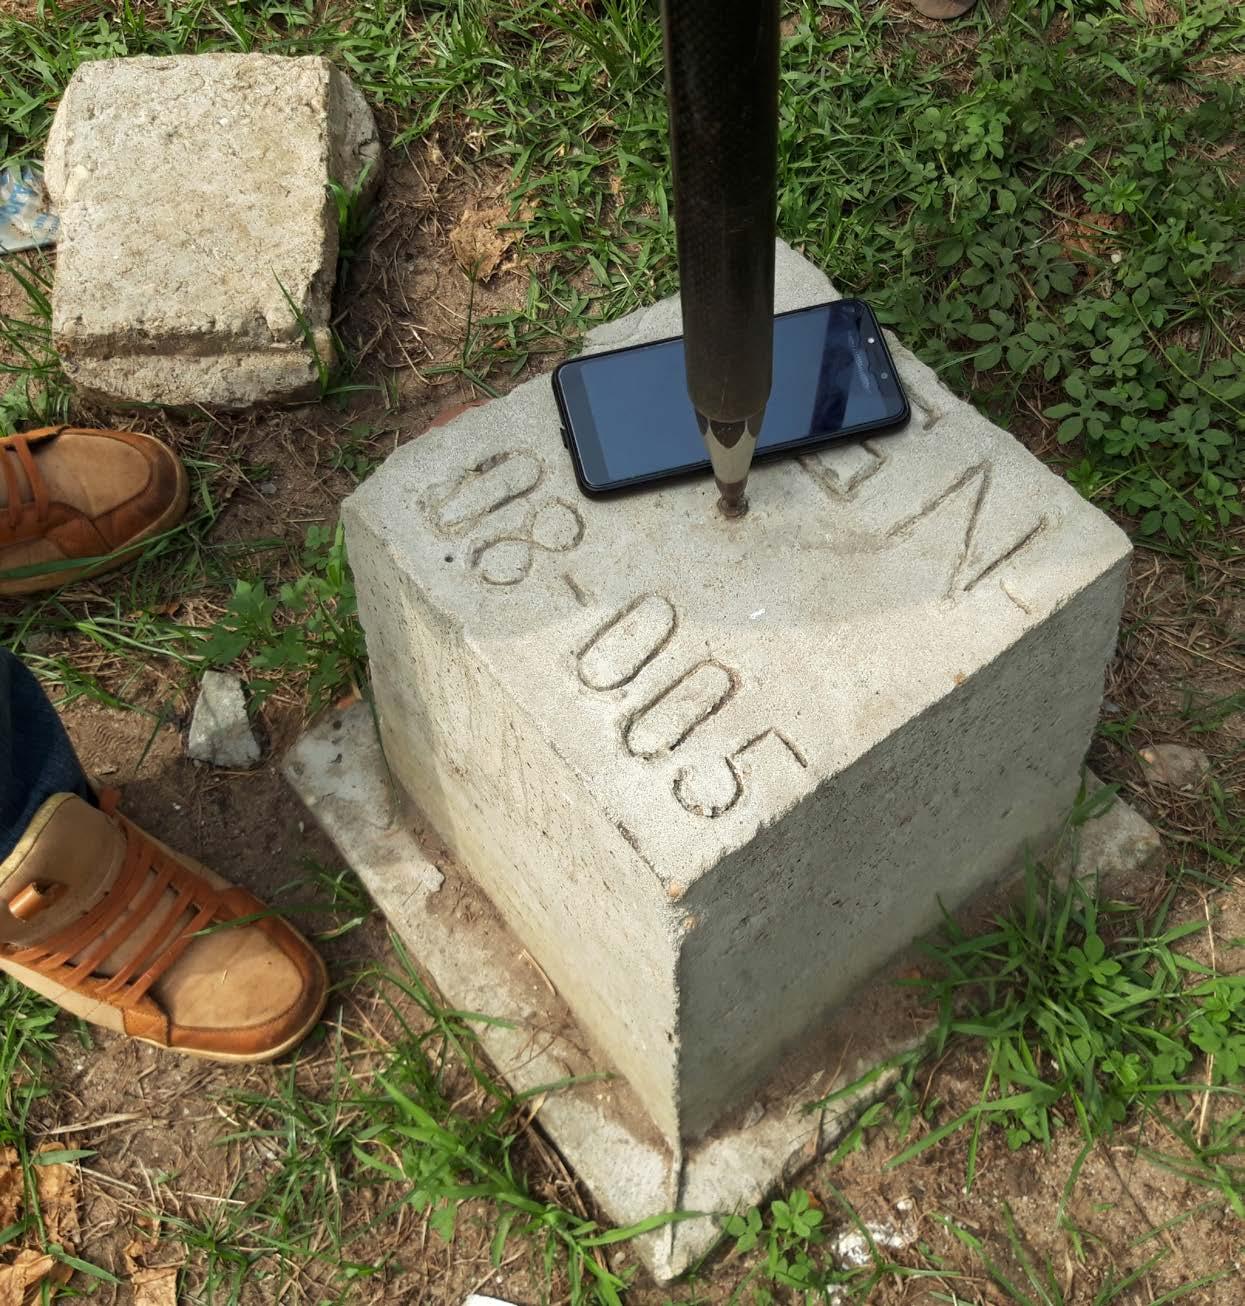
On the front page
In Benin, efforts are underway to modernize and digitalize land administration. Read more about this in the cover story on page 6.
ITC Also Turns Its Gaze To The Netherlands
Shape the Future with Geodata
Welcome to the final issue of this year’s Geo-Info. The range of articles in this issue covers nearly all the hot topics currently shaping our society: housing, climate, defence, and the Netherlands’ international relations. As geo-professionals, we naturally focus on the role of “geo” in each of these topics — and as you might expect, that role is far from insignificant.
Researchers Marion Plegt and Diane Stiemer at the Netherlands’ Cadastre found in their article “New Construction Since 2015 Mainly Within Built-Up Areas” (page 20) that, according to the Landscape Monitor, most of the newly built houses in the Netherlands still amount to “just another street added.” In Friesland, years of work have gone into creating a climate-resilient peat meadow landscape. Higher water levels are essential to counter CO2 emissions and land subsidence, yet they also have direct financial implications for agriculture. On page 22, you will find the article “Balancing Agriculture and Societal Challenges in Balance” by Gerjan Meijer, which discusses the Peat Meadow Compensation System (CSV) — a framework designed to balance sustainable water management with futureoriented agriculture.
Later in this issue, on page 32, we publish an interview with Lieutenant Colonel Clemens Roos, Head of the Defence Expertise Centre for Geography at the Royal Netherlands Army, about the newest and most accurate mapping data available. This article explicitly looks beyond national borders, much like the opening story of this issue (page 6) by Christelle van den Berg, International Portfolio Manager at Kadaster International. She leads a consortium of Dutch partners
— MDF Consultancy, VNG International, and the Cadastre — that, in collaboration with l’Agence Nationale du Domaine et du Foncier (ANDF), the national agency responsible for land administration in Benin, developed the land registration system e-Foncier Bénin.
At the heart of this issue, you will also find the GeoCareer section, with this year’s special focus on education — naturally the starting point for many careers in the geo sector. In an interview with Jaap Zevenbergen, professor at the ITC Faculty of the University of Twente, he explains how this faculty has been advancing countries in the Global South for 75 years with knowledge on geo-information and earth observation (see page 26). Zevenbergen says: “We want to inspire young people to shape the future with geodata.” That sounds like a wonderful motto — not only for this edition of Geo-Info, but also for GeoCareer and perhaps even GeoBuzz, the annual event that will once again take place in ’s-Hertogenbosch on 17 and 18 November.
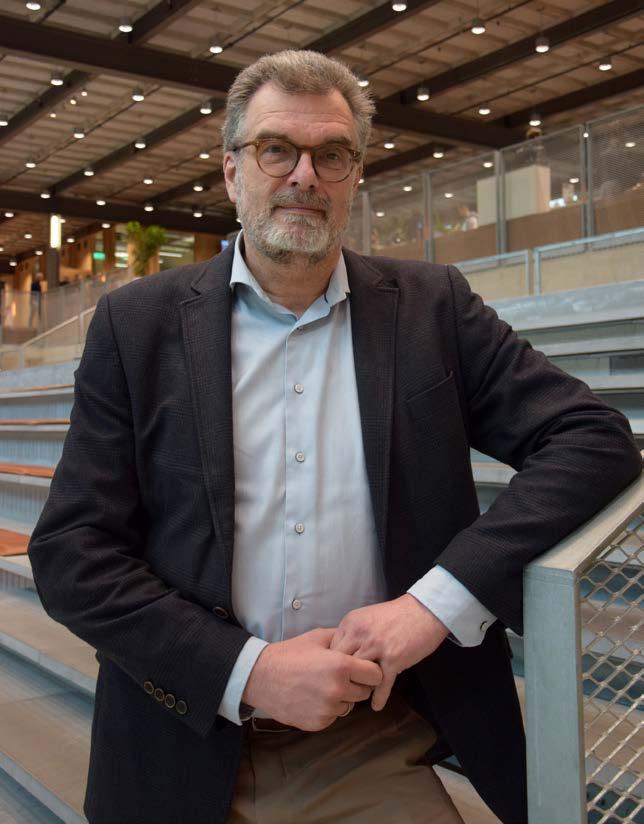
Finally, we are very pleased to announce that we have found a new editor-in-chief. Roelof Boekhold will take the helm from the first issue of next year onward. Roelof, who retired a couple of months ago, was until recently Product Manager Geo at ProRail and brings extensive experience and in-depth knowledge of the geo sector. You are likely to meet him soon — if not at GeoBuzz, then somewhere else in the near future. Roelof, a warm welcome and best of luck!
Durk Haarsma Publisher, Geo-Informatie Nederland
Al vijftien jaar uw vertrouwde partner voor landmeetkundige inwinningsapparatuur en software voor digitaal inmeten en het verwerken, visualiseren en delen van geo-informatie.
De juiste software en hardware oplossingen voor iedere projectfase:
•• Landmeetapparatuur
•• 3D machinebesturing
•• Dronemapping
•• 3D laserscanning
•• KLIC graafschadepreventie
•• Training en ondersteuning
Vermogenweg
Ambassadeurs Geo-Informatie Nederland
Benin Builds a Future-Proof Land Administration
By Christelle van den Berg
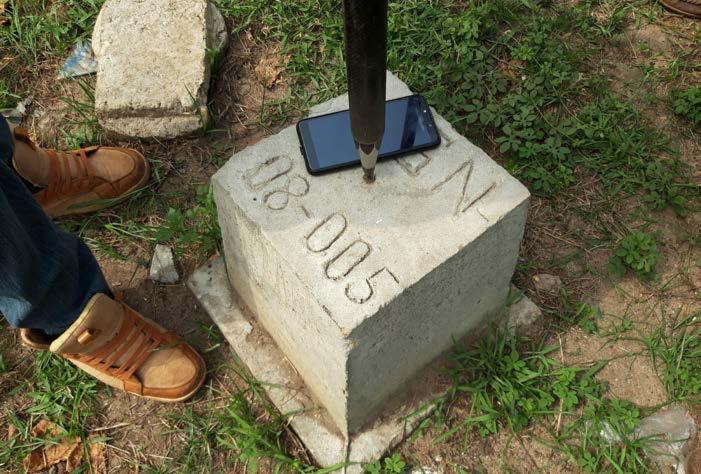
Benin, a French-speaking, relatively stable country in West Africa, is taking major steps toward a modern, digital system for land administration. Although the country has, for several years now, had national legislation in this field (Code Foncier et Domanial), the number of formally registered parcels with a formal land title (Titre Foncier) is still limit ed. The existing procedures are complex, time-consuming and unaffordable for many citizens. To improve that situation, a large-scale reform proje ct was launched in 2018 that lays the foundation for a national digital land administration.
The heart of this reform is the fully digital land registration system e-Foncier Bénin (e-FB). This system makes it possible to record ownership information and parcel boundaries on an integrated digital map. This accelerates administrative processes, while also making them more transparent and more accessible for, among others, citizens, municipalities and financial institutions.
The digital map forms the visual backbone of the system. For the first time, Benin has
a uniform, up-to-date representation of parcels directly linked to legal data. The system is designed to eventually map the entire country — all 77 municipalities in Benin.
More Than Registration: Strengthening Ownership
The project is not only about technology, but mainly about people. In twelve municipalities, more than 530,000 parcels have now been mapped and the presumed owners
have been registered. This process takes place through a careful and participatory procedure, in which local communities, together with traditional leaders and government institutions, determine who is presumed to own the land. Special emphasis is placed on the active involvement of vulnerable groups such as small farmers, young people and women. In this way, their perspectives and interests are included in decision-making. Although they have equal rights under the law, deliberate attention is paid to ensuring that these rights are also recognised and applied in practice.
The registration of “presumed ownership” forms an important intermediate step toward formal titles. This registration can relatively easily be converted into a permanent land title (Titre Foncier) if the presumed owner
In Benin, more than 530,000 parcels have now been mapped across twelve municipalities.
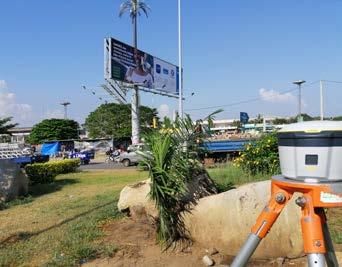
Surveying in the public space of Benin.
wishes to do so. A Titre Foncier provides the highest level of legal protection by the Beninese government. Owners thus gain access to the formal economy: a parcel with registered ownership rights can, for example, serve as collateral for a loan.
Maintaining Data
A reliable cadastre stands or falls with up-to-date data. Therefore, parallel to the technical development, much attention is being devoted to procedures for maintaining data. In April 2025, the Beninese government adopted legislation that authorises and obliges parties — from municipalities to notaries — to register changes in (presumed) ownership.
In addition, in all twelve municipalities participating in the project, local teams have been established that are responsible for maintaining the data in e-FB. Staff received intensive training to work with the system and to maintain data according to fixed standards. In this way, a sustainable process emerges in which the cadastre remains up to date and continues to evolve along with social and spatial developments.
Knowledge Transfer and Capacity Building
An important component of the project is training and capacity strengthening. In addition to municipal staff, national institutions such as IGN Benin (the topographic service), notarial associations and private surveyors are also involved. By training them in digital work processes and data quality, a broadly supported foundation is being created for a modern, professional land administration.
A Dutch consortium supports ANDF in developing training programmes, manuals and quality procedures, so that Beninese organisations will ultimately be able to perform the management and maintenance of the system independently.
About the Author
Christelle van den Berg is International Portfolio Manager at the Cadastre.
christelle.vandenberg@kadaster.nl
From Certainty on Paper to Certainty in Practice
To ensure the transition from a project-based to a structural approach, the Beninese government established a National Land Programme (Programme National Foncier, PNF) in 2024. The purpose of this programme is to realise a functioning and sustainable cadastre in all 77 municipalities. The World Bank is providing a loan to the Beninese government to make this financially possible.
The reform of land administration in Benin illustrates how digital technology, legal innovation and international cooperation can reinforce one another. Whereas a formal Titre Foncier was previously accessible only to a small, affluent group, the so-called fit-for-purpose approach now offers a scalable and affordable solution. As a result, millions of citizens gain new prospects for legal certainty.
At the same time, knowledge and capacity are growing within ANDF and the participating municipalities to keep data up to date and develop new applications. Step by step, responsibility is thus shifting from international support to national embedding. This is a crucial step toward a sustainable land administration.
The experience in Benin shows that modernising land administration is more than a technical task. It is a social process that builds trust and creates new opportunities for economic growth and spatial development.
Support from the Dutch Consortium
The e-Foncier Bénin land registration system has been developed since 2019 by l’Agence Nationale du Domaine et du Foncier (ANDF), the national agency responsible for land administration in Benin. ANDF is supported by a consortium of Dutch partners: MDF Consultancy, VNG International and the Cadastre. With financial support from the Netherlands Embassy in Benin, government, knowledge institutions and companies are joining forces to modernise the Beninese land administration. International expertise and local practical experience complement one another and thus open the way to new forms of digital land administration and capacity building.
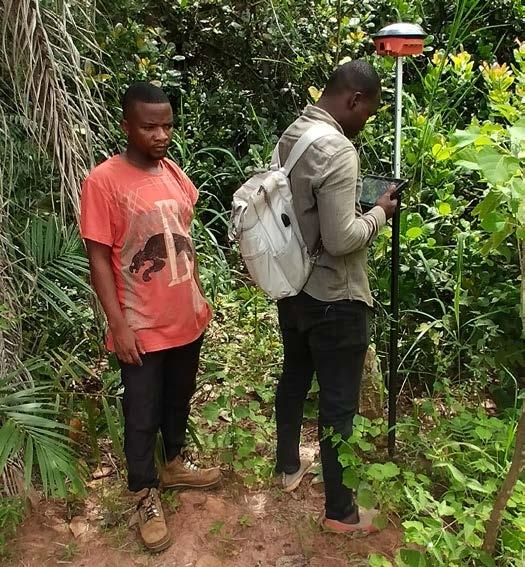
The use of a GNSS receiver for measuring parcel boundaries.
Exploring Interoperability of Computational Models Completed
Collaborating Models Offer New Opportunities for Digital Twins
By Marèse Peters
Digital twins help governments make complex decisions about our living environment. Within the Dutch Metropolitan Innovations (DMI) programme, Geonovum contributes to knowledge development and standardisation in the field of digital twins. One initiative within this effort is the Digital Twin as a Service (DTaaS) project. In this context, Geonovum and Vrije Universiteit Amsterdam conducted an exploratory study on the interoperability of computational models. How can these models be better aligned so that governments can work with digital twins more efficiently and effectively?
Eric Koomen of VU Amsterdam and Michel Grothe of Geonovum share their findings.
Why This Focus on Computational Models?
Michel: “A digital twin consists of three key components: data, visualisations, and computational models. At Geonovum,
we have traditionally focused on data standardisation, and to some extent on visualisation as well. However, computational models were largely unexplored territory for us. That prompted this study: what does
standardisation look like for computational models? Since we had limited expertise in that area, we partnered with Eric, who comes from the modelling community and has extensive knowledge of GIS and digital twins.”
Standardised computational models can be linked — enabling governments to make better, data-driven decisions.
Why Is Standardisation of Computational Models Important?
Eric: “When computational models are standardised, they can ‘communicate’ with each other. That enables coupling between models — something that is particularly valuable for the complex, strategic challenges governments face in urban development, nature conservation, and water management. For example, you might want to link hydrological models to housing models, which in turn draw input from demographic models.”
Michel: “And don’t forget the more operational use cases. For instance, TNO developed Urban Strategy (now part of Scenexus), a model that allows real-time calculation of the impacts of a temporary road closure on traffic flow, noise pollution, and fine dust emissions in an area. Such applications rely on the ability to connect different computational models.”
How Did You Approach This Exploration?
Michel: “We interviewed around twenty experts in computational modelling and digital twins to learn what they are working on and to what extent models can currently interoperate. We also identified key challenges that still need attention in the Netherlands.”
Eric: “Our experts came from a broad spectrum — including academic organisations such as Wageningen University, Deltares, KNAW-NIOO, and the eScience Center, as well as private-sector parties like Tygron, Ucrowds, ObjectVision, Nelen & Schuurmans, and Scenexus. From the public sector, we engaged with Rijkswaterstaat, RIVM, and the Netherlands Environmental Assessment Agency (PBL). It’s a very diverse field.”
What Were the Key Findings?
Michel: “There are a great many computational models in the Netherlands — possibly close to a thousand. From an efficiency standpoint alone, it makes sense to move toward standardisation. A logical first step is to ensure that models are well described: how do they work, what can they do, and what are their limitations? The concept of fit for purpose is crucial — users must understand what a model can and cannot validly be used for. There is also growing interest in a quality control framework for computational models. At Wageningen University, such a framework has already been developed, and it is attracting attention from many other organisations.”
What Are Your Main Recommendations?
Michel: “We compiled all the insights from the interviews into about twenty-five recommendations, grouped according to the European Union’s interoperability model: semantic, operational, technical, and legal. Semantic interoperability means that everyone should share the same understanding of the data input and output in a model. Operational interoperability concerns organisational cooperation — the ability of institutions to find each other and collaborate effectively. Our study shows that a fair amount of collaboration already exists in the Netherlands. On the technical side, significant progress is being made as well. At Geonovum, we are organising a testbed to make computational models accessible via a standardised API. Organisations in the water sector are developing a similar technical interface. Finally, we also considered legal interoperability, since some models are embedded in legislation, which brings additional
About the Interviewees
Eric Koomen works at Vrije Universiteit Amsterdam. Michel Grothe works by Geonovum.
requirements. We concluded by highlighting the user aspects of computational models as a separate but vital category.”
Who Should Act on These Recommendations?
Michel: “We will, of course — at Geonovum. But ideally, all organisations working with computational models and digital twins should take action. During our expert workshop, we brought these stakeholders together to stimulate collaboration.”
Eric: “We immediately saw new connections forming. For example, the Ministry of Housing, Spatial Planning and the Environment (VRO) is interested in developing a quality framework for computational models in cooperation with Wageningen University, and the PBL has also joined that initiative.”
What’s Next for the Coming Six Months?
Michel: “As part of the DTaaS programme, we will host a follow-up meeting later this year, where these topics will be discussed further. We will also propose concrete activities that emerged from this exploration. In addition, Geonovum plans to make progress on the standardisation of model descriptions.”
Eric: “Now it’s time to put this into practice. Let’s see what happens when we actually connect these models — what works, what doesn’t, and where the challenges lie. That, I believe, is the most important step forward.”
Scan the QR code for the Geonovum report Exploration of the interoperability of computational models and digital twins.
Project Approach Ring South Groningen
By Lars Langhorst
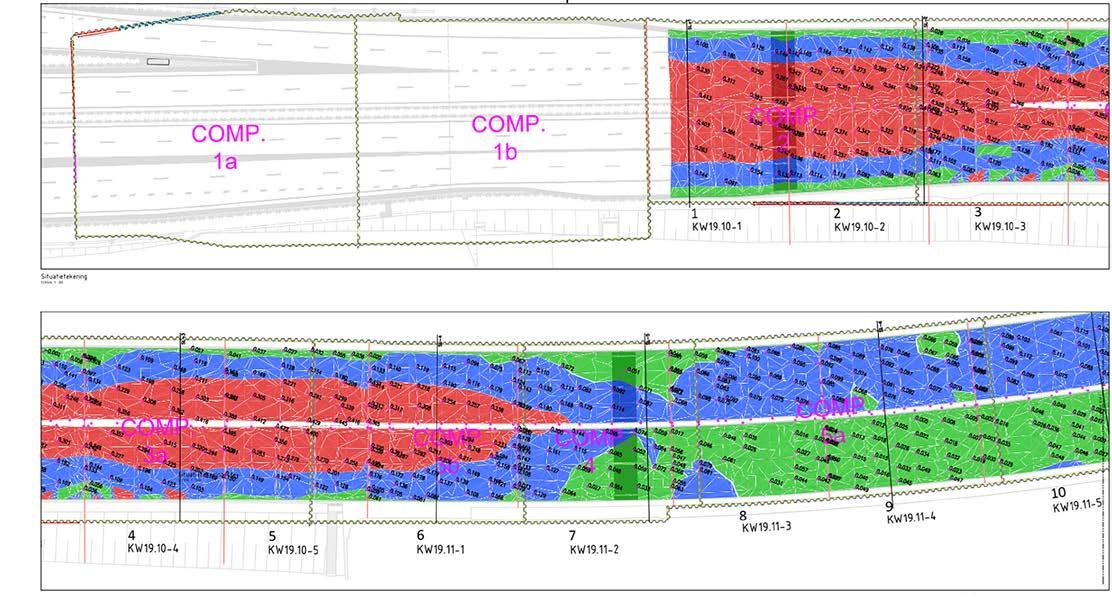
Precise and increasingly advanced surveying techniques are indispensable in the infrastructure sector, where geodata form the key to a more efficient design, accurate execution and sustainable development. The large-scale construction project Approach Ring South Groningen is a good example of this. The project aims to improve accessibility, traffic flow, liveability and safety in and around the largest city in the north of the Netherlands. Throughout the entire process, surveying played a crucial role. The surveyors of Geomaat were closely involved in the preparation, execution and completion of this complex project.
The project (2019–2024, €927 million) was divided into five sub-areas: West, Julianaplein, Zuiderplantsoen, Helpman/Coendersborg and East. Major interventions included transforming the largest intersections into grade-separated junctions and lowering and partially covering the N7 motorway. In addition, the route was partly shifted, three viaducts were constructed and several intersections were redesigned. This has reduced congestion and improved
accessibility for both the city and the region. By lowering and greening the road, the noise level has decreased and the appearance of the city has improved. The quality of life in the surrounding neighbourhoods has increased as a result.
The surrounding area has also benefited from the new infrastructure. For example, a bicycle and pedestrian tunnel was built at Esperantostraat and a safe cycling route was created from Laan van de Vrijheid to
Leonard Springerlaan. Cyclists can now travel comfortably and safely under the ring road without having to cross busy slip roads or hinder other traffic. This has greatly improved traffic safety and the liveability of the direct surroundings for residents, local businesses and visitors.
Surveyors in Action
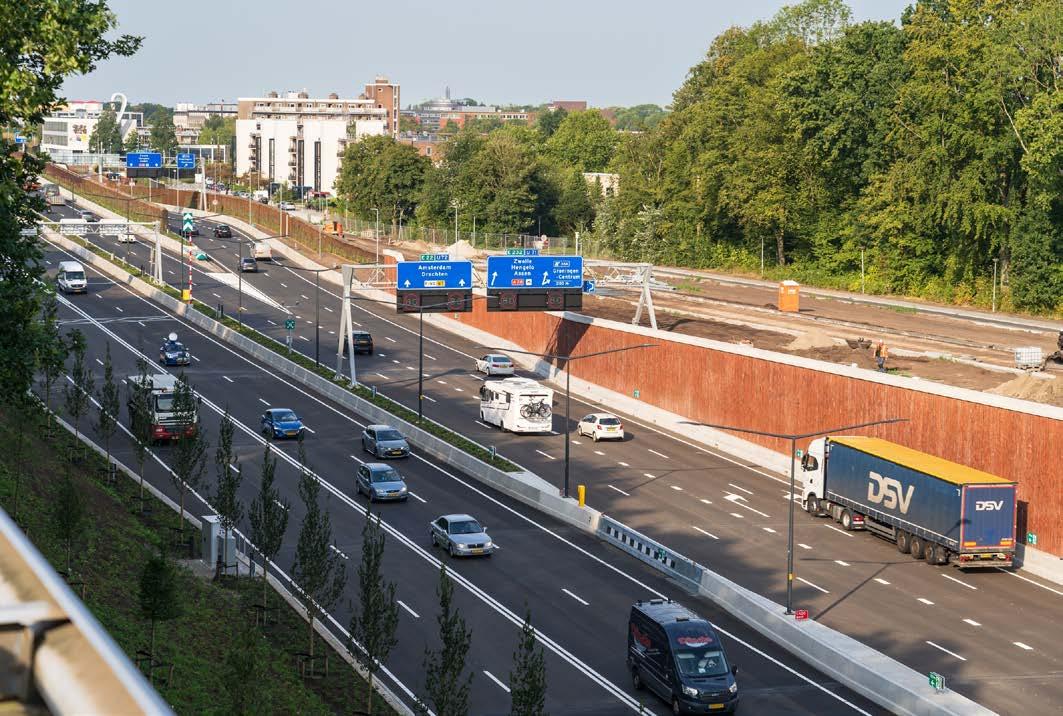
The contribution of the surveyors and setting-out engineers was crucial to the
The newly completed ring road in Groningen, opened after six years of construction. (Photo: Sander van der Werf / Shutterstock)
Measurements and scans were compared during construction to create an accurate model for designers and engineers. (Photo: Geomaat)
success of Approach Ring South. They showed flexibility, helped solve complex challenges and contributed to quality, safety and efficiency through proactive monitoring.
1. Precision in Tunnel Geometry: Optimal Concrete Layer Through Digital Accuracy
During the construction of the tunnels, the surveyors provided detailed 3D models, which allowed the engineers to determine in advance the exact thickness of the concrete equalising layer. In this way, deviations from previous construction phases could be corrected. In the dynamic tunnel environment, the surveyors used total stations to quickly, efficiently and accurately measure hundreds of points — an important basis for recording the unique tunnel shapes. Without this data, costefficient and timely delivery would not have been possible.
2. Flexibility in the Field: Always the Right Measuring Instrument
Depending on the location and desired accuracy, the surveyors chose the most suitable instrument for each situation. For general terrain measurements, GPS was sufficient, while total stations were used in confined tunnel spaces. The Streetmapper — Geomaat’s mobile 3D scanner — was used where possible to efficiently collect large amounts of data. Traditional measuring methods also proved valuable, especially in places where there was no GPS signal or where the scanner could not be deployed.
3.. Proactive Monitoring: Safety for People and the Environment
The surveyors went beyond the traditional measurements. Using innovative measuring techniques, they continuously monitored:
• Settlements (levelling and hundreds of wall bolts)
• Groundwater levels (monitoring wells)
• Vibrations (vibration sensors)
• Drainage (settlement beacons)
Real-time data ensured that damage to surrounding buildings was prevented and that immediate action could be taken if subsidence was detected.
Safe Surveying with Smart Technology
Throughout the entire project, safety was paramount. Two technologies in particular contributed significantly to safe and efficient surveying:
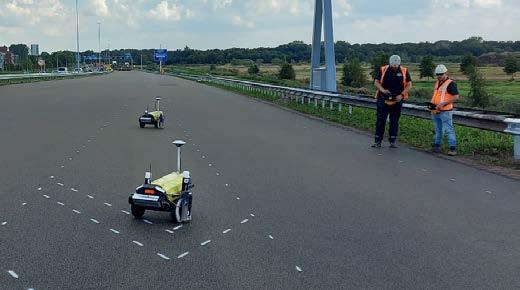
Robotplotter
The Robotplotter works remotely and marks points and lines without the surveyors having to stand close to traffic. Operated with GPS or TPS (Total Positioning System — an advanced navigation and positioning system that combines various techniques to determine locations with high accuracy), it can automatically operate in straight lines. This allows the work to be carried out quickly and safely, even near heavy traffic.
Robotplotters work quickly, accurately and autonomously, allowing operators to stay safely away from traffic. (Photo: Geomaat)
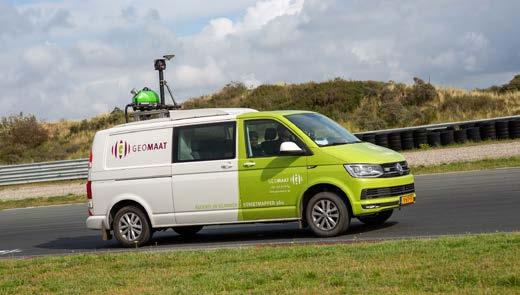
Streetmapper
The Streetmapper is a mobile 3D scanner that moves with the flow of traffic and requires no road closures. As a result, measurements can be performed without disrupting traffic. This innovative measuring method is changing the profession: more data can be
The Streetmapper by Geomaat
The Streetmapper-IV is an advanced mobile 3D mapping system capable of capturing up to two million points per second. It combines RIEGL laser-scanning technology with differential GNSS and an inertial measurement unit (IMU), achieving an accuracy of up to 5 millimetres.
The system is designed for rapid and detailed mapping of infrastructure, ranging from highways to urban environments.
Geomaat processes the Streetmapper scans using a proprietary, continuously refined AI model.
This model automatically recognises objects such as road markings, light poles, traffic signs, and guardrails, and adds an additional layer of logical validation, including the analysis of detected object velocities.
Dynamic elements such as cars, cyclists, and pedestrians are automatically filtered out, leaving only the static infrastructure.
This sophisticated integration of AI and point cloud processing significantly increases the value of the scans.
The conversion from raw point clouds to classified objects now occurs almost in real time — a process that, only a few years ago, could take several weeks.
As a result, mobile scanning data can now be deployed in projects requiring immediate access to up-to-date information.
Although the process is largely automated, Geomaat continues to refine the AI model to further reduce the need for human intervention.
New datasets are immediately incorporated into the training data, enabling the system to continuously improve itself. Labeling this training data represented a significant investment: thousands of hours were spent manually assigning labels to objects in the scans.
Thanks to the steady inflow of new measurement data, the model becomes smarter and more efficient with every project, steadily enhancing the processing of mobile mapping scans.
About the Author
Lars Langhorst (MSc) has a background in Geomatics and now works on digitalisation in the field of asset monitoring. At Sweco, Lars develops digital solutions for the surveying sector and uses data to help engineers make data-driven decisions at every stage
collected, faster, more accurately and safely. Measurements with the Streetmapper are suitable for a wide range of applications and analyses. They make it possible to record the situation in detail and compare it at different times. This reduces the amount of time spent on site and the number of follow-up visits required for repeat measurements.
A Lasting Legacy
Now that the project has been completed, the municipality of Groningen is focusing on follow-up projects, such as the creation of the Zuiderplantsoen park above the newly covered section of the ring road. This park will provide space for nature, recreation and encounters. Several city roads are also being redesigned to improve traffic flow and safety.
Conclusion
The Approach Ring South project has had a major impact on Groningen’s infrastructure and living environment. The goals of improved accessibility, traffic flow, liveability and safety have been achieved. The surveyors and setting-out engineers of Geomaat have made an indispensable contribution to this. Thanks to innovative techniques such as the Robotplotter and Streetmapper, work could be carried out more safely, faster and more accurately. The Approach Ring South is a fine example of how traditional surveying and new technology go hand in hand. vervanging, renovatie en slimme reconstructie, waarbij traditionele landmeetkunde en state-of-the-art mapping hand in hand gaan.
Team Leader Surveying
Richard Kainama, team leader surveying at Geomaat, led a team of eight to ten surveyors and three work planners. The work consisted of driving stakes in the traditional way, mapping the surroundings with GPS, levels and total stations, and performing scans — both mobile with the Streetmapper and stationary. Geomaat ensured that the design correctly matched reality and worked closely with MUG. Various design agencies were involved in both preparation and implementation. Geomaat also played a control role, checking whether the geometry of the design matched the actual situation.
The Streetmapper captures millions of points per second while driving, without disrupting traffic. (Photo: Geomaat)
Why Maps Are Never Neutral
Algorithms are everywhere, even in places you might not immediately expect. Take, for example, the Mercator projection: the algorithm that underlies most online maps. This mathematical formula converts geographic coordinates into a flat surface. Gerardus Mercator, the brilliant Flemish cartographer and mathematician who devised this projection about 500 years ago, did so with a clear purpose: to simplify marine navigation using as few instruments as possible.
That this projection distorts the world’s appearance is something we actually know quite well — yet it was brought freshly to my attention when I saw a map titled “How Many Countries Fit in Africa?” My neighbours also pointed me to a long article in NRC with the same message. Several African NGOs show that Africa appears much smaller on many maps than it actually is. The map shows that India, China, the United States and large parts of Europe all fit within Africa — while on a Mercator map, the continent seems far more compact.
Interestingly, Mercator’s algorithm actually represents countries around the equator quite accurately. It is the northern regions — Europe, North America, Greenland — that are enlarged. Mercator made that choice deliberately: sailors could draw a straight line between two points on his map and maintain a constant course — a *loxodrome*. Navigational convenience took precedence over area accuracy. For sixteenth-century seafaring, that made perfect sense.
But when that same map became the standard for atlases and classrooms, its context changed. What was intended as a navigational aid became a worldview. It conveniently suited Western powers that their continents appeared larger. This is how
bias in algorithms arises — not necessarily out of malice, but because the world changes while the formula remains the same. Today, Mercator’s algorithm is still the most widely used projection, because it is very well suited for web maps.
We in the Netherlands understand better than most that local context matters. After all, we have our own *Rijksdriehoekstelsel* (RD coordinate system). The RD system was not created out of stubbornness, but out of practicality — and indeed, very Dutch practicality — for fiscal reasons: the taxation of land ownership. In the nineteenth century, every cadastral parcel had to be mapped and measured precisely to determine its taxable area. For the Dutch, it would be unthinkable for an international map service to systematically distort the shape of the Netherlands simply because it was ‘technically more convenient.’ We care about how our country appears on the map.
But context goes beyond geography alone. It also depends on what you want to achieve. For computational models — such as those for nitrogen dispersion or water quality — the chosen projection is often less crucial. But once you communicate the results, it becomes essential. A nitrogen map in Mercator projection exaggerates northern areas, while the same data in an equal-area projection tells an entirely different story. Context determines the choice: where are you, and what are you trying to communicate?
We recognise this mechanism in our own professional practice: technical choices have consequences, even in visualisations. The goal is not to ban Web Mercator or other projections, but to make explicit when and why we choose a particular projection. By acknowledging that even a 500-year-old algorithm is not neutral.
Wijnand van Riel Freelance Data Architect at the Informatiehuis Water (Information House for Water) Wijnandvanriel@WeLinkData.nl
GIN Trip to INTERGEO 2025: Three Days of Knowledge, Innovation, and Geo-Friendship
By Jan Willem van Eck en Carline Amsing
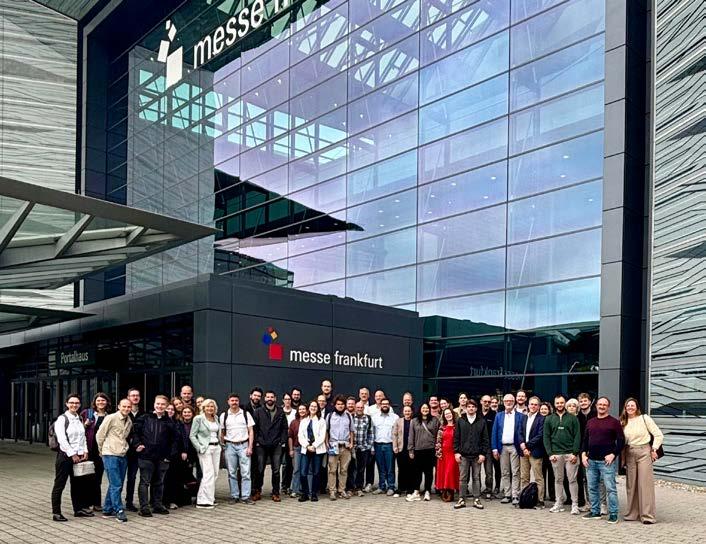
From 7 to 9 October 2025, a diverse group of students, young professionals, and geo-specialists from government, industry, and academia travelled to Frankfurt am Main for the first GIN Study Trip to INTERGEO. For three days, the group immersed themselves in the latest developments in the geo-domain, explored international innovations, and built valuable professional connections. The result: an inspiring and energising journey full of knowledge, discovery, and collaboration.
An International Kickoff with the German–Dutch Networking Reception
The trip began with a German–Dutch networking event, organised in cooperation with the Netherlands Business Support Office (NBSO) Frankfurt. With over 120 participants, the turnout exceeded expectations. In an informal setting, new contacts were forged between Dutch and German organisations active in the geosector. The evening, supported by NBSO sponsorship, set the tone for three days of exchange and collaboration.
INTERGEO 2025: Innovation in Full Scope
On the exhibition floor of INTERGEO, which welcomed over 17,000 international visitors, participants discovered the newest developments in sensing, drones, GNSS, LiDAR, 3D modelling, and AI applications in geoinformation. Even though the audience was highly international, it was striking how many Dutch professionals one still encountered.
The 50 participants of the GIN trip explored the fair extensively thanks to free admission passes provided by Basetime BV, Leica Geosystems, and Geometius. The innovations in AI, data analytics, and real-time geo-solutions left a strong impression. Students and young
professionals particularly valued the practical applications — from data acquisition to smart visualisation.
Even for those fluent in geo, getting “lost” at INTERGEO is part of the experience. Some exhibition texts were quite bold — at times prompting reflection: what to make of names
like VISiONERDS or GeoGIS Consultants? Meanwhile, the BND (Germany’s intelligence agency) was refreshingly direct: Wir suchen Terroristen — “We are recruiting!”
The buzzword of the year: Autonomous — devices and robots that perform measurements independently, with humans increasingly taking a back seat.
The group comprised students, young professionals, and geo-experts from government, business, and academia. (Photo: Jan Willem van Eck)
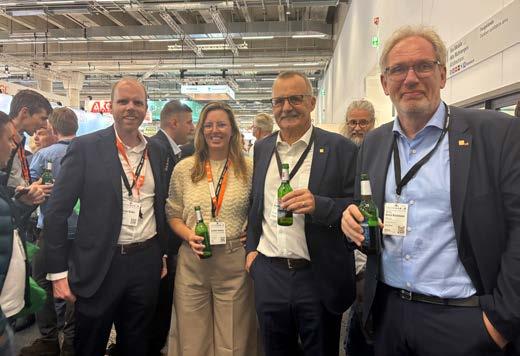
Schnitzels and Conversations
Wednesday evening featured a Dutch-themed dinner, centred on relaxation and connection. Over plates of classic German schnitzels, participants enjoyed lively conversation and laughter. New bonds naturally formed between students and experienced professionals, making it the perfect occasion to raise a glass to the organisation team behind the GIN trip.
“It was fantastic to talk informally with people from the field,” said one student afterward. “It really gave me perspective on all the possibilities within geo.”
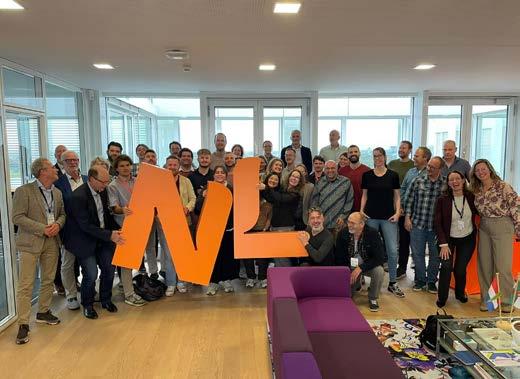
An Inspiring Finale in Düsseldorf
On Thursday afternoon, the group travelled to the Netherlands Consulate in Düsseldorf for a content-driven closing programme. Tom Escher (Landesamt für Natur, Umwelt und Klima NRW) presented his research “Aerial Image-Based Recording of Soil Sealing Using AI – A Treasure Trove for Climate, Water, Soil and Planning.” He demonstrated how AI and aerial imagery help monitor surface sealing — vital information for climate adaptation and spatial planning.
Next, Elke Hohmann presented on the Rheinisches Revier as an example of a European Net Zero Valley — a region where energy transition, landscape restoration, and economic renewal go hand in hand. This combination of applied innovation and policy-driven vision inspired many.
“It was fantastic to talk informally with people from the field,” said one student afterward. “It really gave me perspective on all the possibilities within geo.”
More Than a Study Trip
Beyond the official programme, the trip acted as a catalyst for new connections and ideas. Students broadened their professional networks, young professionals gained international perspective on geo-innovation, and seasoned experts saw how new generations bring fresh energy to the field. Six student scholarships from the Ormeling Fund provided financial support for young talents, while Leica Geosystems’ sponsorship made the trip more affordable for all participants.
Returning Home Energised
After three intense days filled with knowledge, innovation, and camaraderie, the group returned to the Netherlands on Thursday evening, tired but deeply satisfied. The bus ride back to Arnhem was anything but quiet — discussions about collaboration plans, new research ideas, and even early suggestions for a GIN trip 2026 were already underway.
The GIN trip to INTERGEO 2025 was made possible by NBSO Frankfurt, Leica Geosystems, Basetime BV, Geometius, GeoBusiness Nederland, Earth Valley, and the Netherlands Consulate in Düsseldorf. Special thanks to Tom Escher (LANUK) and Elke Hohmann for their inspiring contributions.
See You Next Year!
The GIN Trip 2025 has clearly whetted the appetite for more. A follow-up day has already been scheduled, and with new connections, fresh insights, and renewed enthusiasm, participants are already looking forward to the next edition in 2026. Will you join us then?
Networking on the exhibition floor. (Photo: Jan Willem van Eck)
Visiting the Netherlands Consulate in Düsseldorf. (Photo: Jan Willem van Eck)
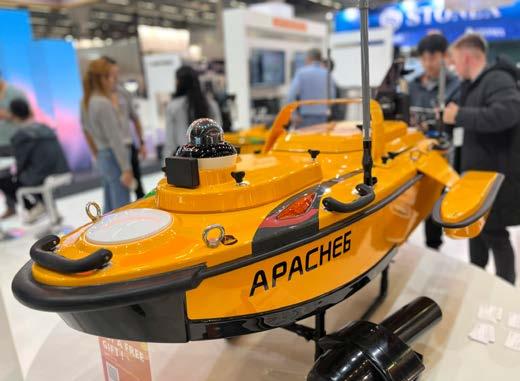
Drones — not only in the air, but also on land and water. (Photo: Jan Willem van Eck)
and surroundings
‘No maps, no atlases’
An Exploration in a World Without Maps
By Peter Weenink
“I will tell you honestly,” said the shopkeeper after a brief discussion in broken English, “this is an Islamic country,” he added reproachfully, wagging his finger, “no maps, no atlases!” And that was the end of it.
At home, I had already spent considerable time searching for maps of Oman, my chosen holiday destination. Two weeks of travelling through this vast country — more than seven times the size of the Netherlands — required a proper road map. And Google Maps? I didn’t fully trust it.
Of course, I had prepared for my trip, reading and researching in advance. I had found several maps online, but all of them were practically useless in scale — 1:1,350,000 or even 1:1,500,000. The Oman Tourist
Organisation offered one official map, but detailed road maps were unavailable. A pity, though partly understandable: in the desert, you follow the only road that exists, and in cities, online navigation may still suffice.
The Search for Maps
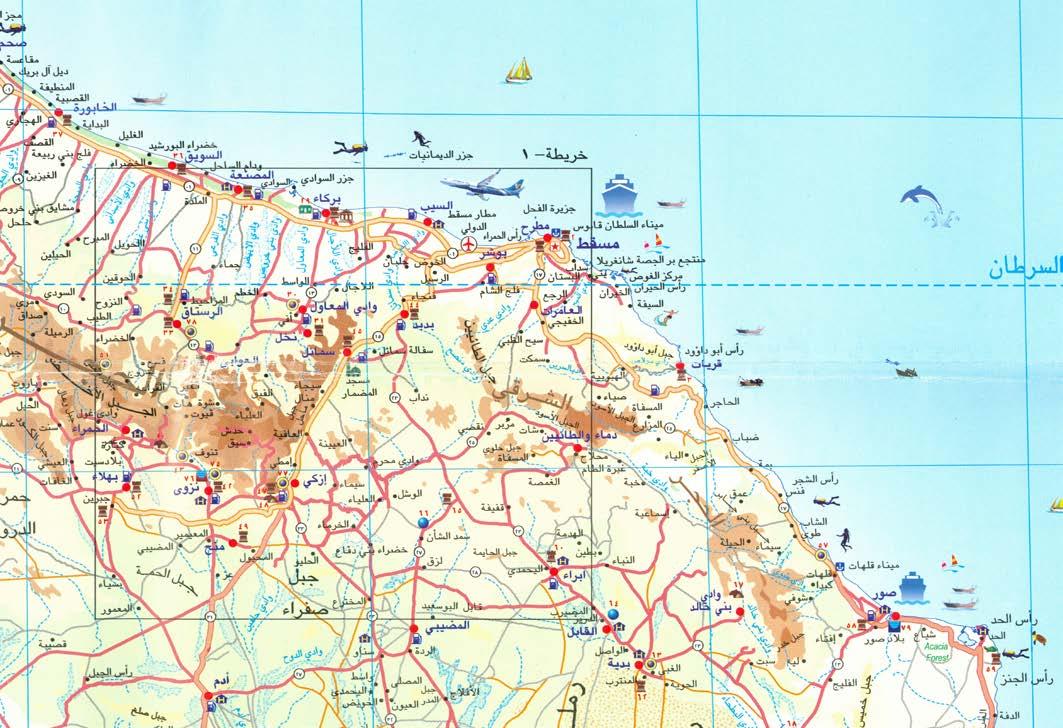
I embarked on various searches through the large shopping malls of Muscat, the capital. Bookshops? Rarely found. “Salam,” they would say, “try over there, perhaps ask
Muscat
around.” On to the next mall. Muscat is vast, and thus, as in other Islamic countries I’ve travelled to, an entire holiday day was spent searching for maps and atlases. “Maps? Atlases? No, we don’t sell those here.” Maps and atlases still seem to be regarded as an undesirable form of information.
Even my faithful travel companion, the Kabouter Bosatlas (my miniature world atlas), could not help me much. Mildly irritated, I would ask, “How do you visit your family or friends in another town?” The answer came in shrugs and polite laughter.
“Countries, places, or roads in a book or on a map? We don’t have such things here. Why would you need them?” “Study books? Yes, there they are — on economics, astronomy, physics, chemistry, or ICT for secondary school — but maps? No!”
Fortunately, I had taken photos of Arabic atlas covers from earlier travels, and showing these sparked brief glimmers of recognition in some shopkeepers’ eyes. “Sorry, we don’t have those. You can order them online if you’re studying geography,” they would say. Indeed, I could have done that back home in the Netherlands — but I wanted to find and buy maps locally, in the very country I was visiting. Shukran — thank you for your help!
Disappointing. No maps, no atlases. What has happened to the Islamic world? There was once a golden age of cartography and exploration, a legacy of science and discovery that enriched the world. Why now does this knowledge seem so deliberately concealed?
A Discovery in a Bookshop
And then, unexpectedly, in one of the malls: a second-hand bookstore, filled exclusively with books. I combed through every shelf of academic titles, and there it was at last — a street map of Muscat, from 1998 no less! Yet in a country like Oman, not many streets are added or closed over the years. Obtaining information directly from the Oman National Survey Authority would have taken too much time; my tour through the Sultanate — and the next country — awaited.
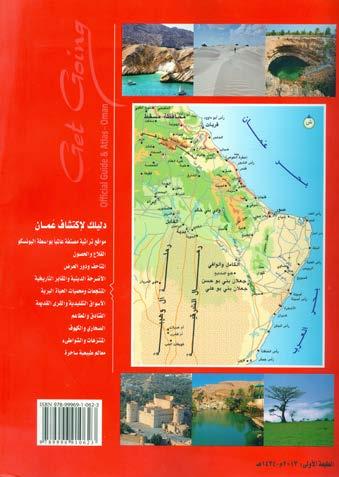
At Muscat airport, in the tax-free zone, there was — unsurprisingly — no alcohol, but there was one copy of the Oman Official Guide & Atlas (2017) for a rather steep price.
In the Kingdom of Saudi Arabia
Next destination: Saudi Arabia (KSA) — a vast kingdom in transition, guardian of Islam’s holy places, modernising rapidly toward its Vision 2030 with numerous historic and infrastructural projects.
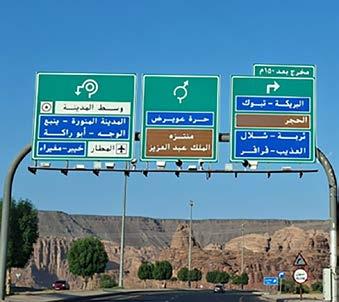
With a newly open attitude toward the world, visitors are now invited to discover the land of deserts, holy cities, dates, and camels. But could geography be found on a map or in an atlas? Only with difficulty. Even here, maps were scarce, and Google Maps seemed to hold a monopoly. Navigating via road signs could itself feel like solving a puzzle.
The word Bookstore is known, but not Bookshop; the English Library refers not
to a lending library but to a bookshop, which adds to the confusion. In the holy city of Medina, small bookstores sell only Qur’ans, certainly not maps. Here too, one may wonder: Why would you need such geographic knowledge? Clearly, religion takes precedence in these places.
On the last day of my journey through the kingdom, in Jeddah, a local guide — helpful and understanding — directed me to two major bookstores. There, at last, I bought several Middle Eastern atlases, including an older Saudi Arabian atlas and, as highly recommended by the vendor, a recent atlas depicting the Prophet Mohammed’s (PBUH) journey from Medina to Mecca.
An Open Map
I am laying my cards on the table with you — Open Map. Oman and Saudi Arabia are beautiful countries. I do not speak Arabic, though basic English was widely understood. Very little on maps is printed in English. The Arabic script, with its elegant forms, makes for a graceful label, in contrast to our Latin alphabet. As for the legend, it does not fail to include the essentials: the camel, the date palm, and the wadi!
References
10 Maps from Muslim Civilisation: https://www.1001inventions.com/ maps/ Survey of Oman: https://www. nsaomangeoportal.gov.om/en Saudi Survey: https://sgs.gov.sa/en
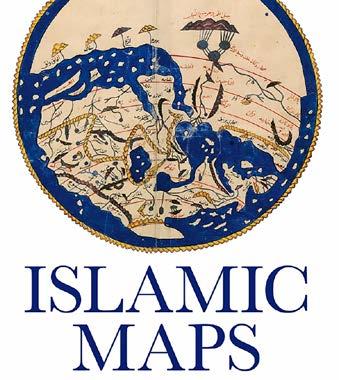
The book “Islamic Maps”
Oman Official Guide — read the text right-toleft, numbers left-to-right!
Road signs near Al Ula (northwest Saudi Arabia)
The Man Who Straightened the World
By Hennie Genee
In this fourth instalment on the history of geodesy, cartography, and astronomy, we focus on the life, work, and enduring legacy of Gerard Mercator — the Flemish scholar of the sixteenth century who not only guided seafaring but also shaped our worldview for centuries to come, far beyond the horizon of his own time.
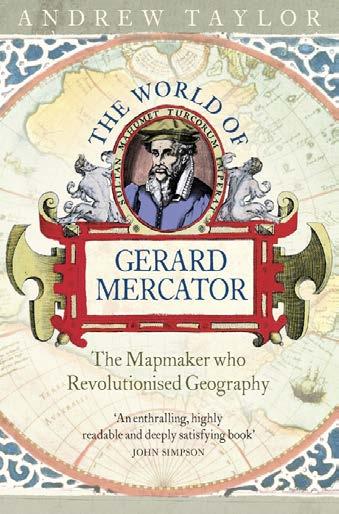
Few maps have influenced the world as profoundly as those of Gerard Mercator (1512–1594). In The World of Gerard Mercator – The Mapmaker Who Revolutionised Geography (Andrew Taylor, 2004), the life of this remarkable man is vividly portrayed — a mathematician and craftsman who, in an era of religious tension and scientific discovery, laid the foundations for modern cartography. Taylor’s book demonstrates how Mercator not only aided navigation but also shaped the way humans perceive the Earth — a vision that endures to this day.
From Rupelmonde to the World
Gerard de Kremer — better known as Gerardus Mercator — was born in Rupelmonde, Flanders, the son of
a shoemaker. From an early age, his fascination with knowledge and science far exceeded any interest in his father’s trade. He studied at the University of Leuven, where he apprenticed under Gemma Frisius, one of the leading mathematicians and geographers of the age. Under Frisius’ guidance, Mercator mastered the fundamentals of astronomy, geodesy, and instrument making. He designed his own astrolabes, compasses, and globes, and became a master of translating the three-dimensional world into two dimensions.
Imprisonment and Flight
In the sixteenth century, science was rarely separate from religion or politics. Mercator, a humanist in the spirit of Erasmus, believed that faith and reason could strengthen
Cover of the book “Gerard Mercator” by Andrew Taylor
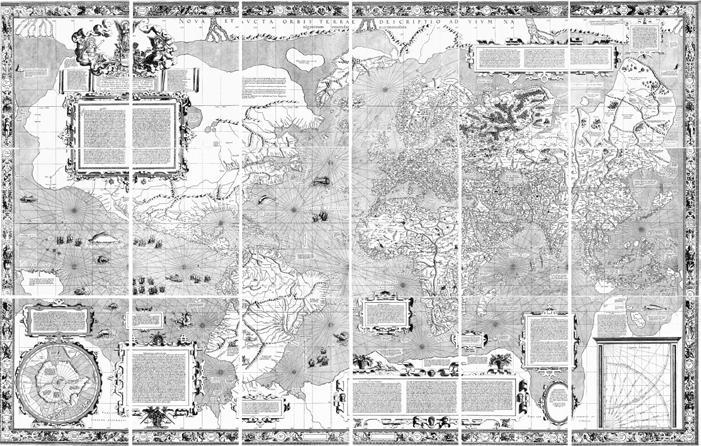
one another — a conviction that proved controversial under Spanish rule in Flanders. In 1544, he was arrested on suspicion of heresy, partly due to his correspondence with like-minded intellectuals. After seven months in prison, he narrowly escaped execution and fled with his family to Duisburg, in the more tolerant Duchy of Cleves. There, he found peace, protection, and intellectual freedom. In Duisburg, Mercator began what would become his life’s work: a comprehensive depiction of the world, compiled through maps, globes, and writings he collectively called the Cosmographia. Mercator’s 1569 World Map (Source: cabinet.ox.ac.uk)
The Map That Changed Navigation
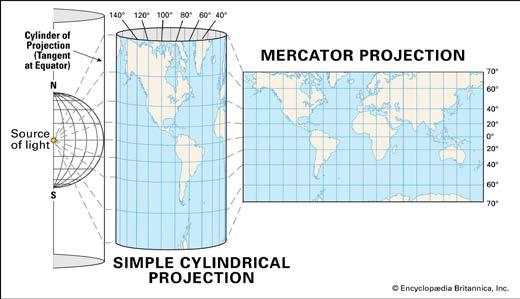
In 1569, Mercator published his most famous work: a world map on a new projection that enabled sailors to plot straight courses. The Mercator projection was brilliant in its simplicity. By stretching the lines of latitude so that angles remained constant, straight lines on the map corresponded to constant compass bearings — crucial for navigation. This was a technical masterpiece and a revolution in maritime cartography. For the first time, sailors could plan linear routes across long distances. That continents appeared distorted was accepted as the price of practicality: for navigation, direction and calculability outweighed the true proportions of landmasses.
Science, Faith, and Enterprise
Taylor portrays Mercator as a thoughtful, devout, and persistent man — free from vanity yet deeply conscientious. His maps were not merely commercial artefacts but intellectual expressions of divine order. At the same time, he was a pragmatic entrepreneur: his globes, instruments, and maps found buyers among merchants, universities, and royal courts. His network included notable contemporaries. Gemma Frisius remained his mentor, while Abraham Ortelius — who would later publish the first atlas — became both friend and rival. Together, they stood at the dawn of an intellectual revolution in which geodesy, cartography, navigation, and trade became deeply intertwined.
The Legacy of the Projection
Mercator’s projection remained the standard for nautical charts for centuries and later dominated atlases and classrooms. Only in the twentieth century did serious criticism arise: the projection enlarges regions near the poles while shrinking those near the equator. On many Mercator maps, Greenland appears almost as large as Africa, though Africa is in reality about fourteen times bigger. This distortion was never ideologically motivated, yet it undeniably influenced the mental geography of generations of students and policymakers. Maps shape worldviews.
About the Author
The Map in Debate
Hennie Genee wrote this article in a personal capacity and works as Strategic Portfolio Manager DSO at the Ministry of VRO. hennie.genee@minbzk.nl
The debate over map projections has reignited in recent years. The African Union now advocates for equal-area projections, such as the Equal Earth projection, which depict continents in correct proportion. In many modern atlases, the Mercator has been replaced by the Robinson projection, which offers a more visually balanced representation. Yet the Mercator projection remains surprisingly resilient. Major digital platforms — including Google Maps and OpenStreetMap — use a modified version known as the Web Mercator projection. Not because it is the most accurate geographically, but because it is technically efficient: easy to compute, well suited for tile-based rendering, and allows seamless zooming. Here, two worlds collide: one of technology, where usability and speed prevail, and one of representation, where maps also serve as cultural and political symbols.
Between Science and Worldview
In his biography, Taylor makes clear that Mercator never viewed his work apart from a broader quest for order and meaning. For him, cartography was more than measuring and drawing; it was an attempt to understand creation. His maps were a synthesis of faith, mathematics, and craftsmanship — a reflection of the Renaissance spirit in which humanity re-examined its place in the cosmos. It is thus unsurprising that Mercator’s work remains a subject of debate today. His projection reminds us that every map is a choice — a compromise between form, function, and perspective. Whoever makes a map not only determines how the Earth appears, but also how we perceive it.
Epilogue
Mercator died in 1594, yet his legacy endures. He gave humankind a new means of orientation — and a lasting reminder that knowledge is never neutral. Taylor’s book portrays him as a visionary who united science, faith, and enterprise in a single image of the world. The projection that once helped sailors find their way home still holds up a mirror centuries later: How do we see the world — and who defines that image?
References
• Taylor, A. (2004). The World of Gerard Mercator: The Mapmaker Who Revolutionised Geography. HarperCollins.
• Heyrman, R. (2025). De Mercatorprojectie en desinformatie. LinkedIn.
• Wikipedia. Gerardus Mercator.
• Wikipedia. Equal Earth projection.
• Royal Museums Greenwich. The Mercator Projection Explained.
Cylindrical and Mercator projections (Source: Encyclopedia Britannica)
New Construction Since 2015 Mainly Realized Within Built-up Areas
By Marion Plegt en Diane Stiemer
The Dutch landscape is gradually changing. A street with newly built houses, a demolished barn, a newly planted row of trees or, conversely, a removed hedgerow — all relatively minor changes that, over time, can significantly alter the streetscape. To monitor such transformations in the landscape, the Landscape Monitor was established in 2015. Based on one of its six indicators — the Buildings Indicator — combined with the delineation of built-up areas from the Basic Registration Topography (BRT), researchers Marion Plegt and Diane Stiemer examined how built-up areas changed between 31 December 2015 and 31 December 2022.
In principle, the Netherlands aims to concentrate construction as much as possible within existing built-up areas, as stipulated in the Ladder for Sustainable Urbanisation. However, the term “builtup area” is not unambiguous. There are legally defined boundaries for built-up
areas under various acts — such as the Road Traffic Act, the Roads Act, and the Nature Conservation Act. In addition, other geographical classifications exist, such as the boundaries of residential places (as recorded in the BAG), neighbourhoods and districts, and
population centres (as defined by Statistics Netherlands, CBS).
For this study, the boundaries of built-up areas were taken from the BRT, which are annually updated in TOP10NL. These boundaries are uniformly defined for all
municipalities, based on the locations of place-name signs along access roads and delineated according to visible topographical features in the landscape. This makes the BRT dataset the most suitable source for this study. According to its definition, approximately 15% of the Dutch land area — just over 500,000 hectares — lies within built-up areas. Between 2015 and 2022, these areas expanded by about 8,000 hectares.
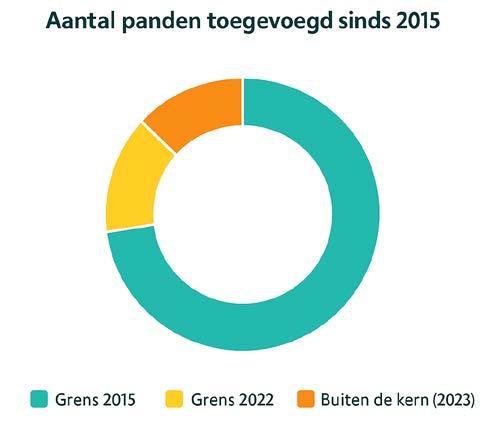
Consistent with policy objectives, most buildings are located within built-up areas, and the majority of new construction also takes place there. By the end of 2022, the Netherlands contained almost 14 million buildings in total — encompassing not only dwellings but also distribution centres and sheds. The vast majority (89%) of all existing buildings were located within the 2015 built-up area boundaries. Of these, approximately 820,000 buildings were constructed after 2015 and can thus be classified as new constructions. Around 75% of these new buildings were realised within the 2015 built-up area boundaries.
In Most Buildings No Dwellings Realized
Of the more than 820,000 new buildings, roughly 270,000 — or onethird — contain one or more dwellings. This implies that the majority of newly constructed buildings do not include residential units. A single building can contain multiple residential units (addressable objects). For example, an apartment building counts as one building, while each apartment constitutes a separate residential unit. Within the 270,000 new buildings that do contain dwellings, a total of 450,000 residential units were created. Of these, more than 80% are located within the 2015 built-up area boundaries.
Buildings within Built-up Areas Smaller than Those Outside
Newly added buildings within the built-up area generally have smaller ground-floor areas than those located outside it. Here, the analysis focuses on the footprint of the building — i.e., only the surface area of the ground floor, not the total floor area across multiple levels. Within the 2015 built-up area boundaries, new buildings have an average ground-floor area of 150 m². In areas that became part of the built-up area only by 2022, the average is slightly lower at 140 m². The largest buildings are constructed outside built-up areas, with an average footprint of 290 m² per building. This difference reflects
About the Authors
Marion Plegt is a researcher at Kadaster. marion.plegt@kadaster.nl
Diane Stiemer is a researcher at Kadaster. diane.stiemer@kadaster.nl
contrasting building patterns: within built-up areas, space is limited and compact forms of construction are preferred, whereas outside built-up areas there is more room for larger structures.
Densification of Built-up Areas
The concentration of new construction within built-up areas has led to increased densification. In 2015, approximately 17.6% of the surface area within built-up areas was covered by buildings, rising to 18.4% in 2022 — based on the boundaries in force for each respective year. The most substantial densification occurred in Geldermalsen, Zuilichem, and Gilze.
However, not all built-up areas have become denser. In roughly 20% of cases, the proportion of built-up land remained stable or even declined. Two key factors explain why new construction does not always result in densification:
1. Demolition and replacement. Part of the new construction replaces previously existing buildings. Of the 820,000 new buildings constructed after 2015, approximately 150,000 were built on sites where older structures had been demolished. This means that nearly 20% of new construction represents replacement rather than expansion.
2. Expansion of built-up boundaries. The built-up area boundaries in TOP10NL are revised annually, and these boundaries gradually shift outward, increasing the total surface area of built-up land each year. Some of these newly added zones have a lower building density, meaning that the overall built-up area includes a relatively larger proportion of undeveloped land.
Regional Differences
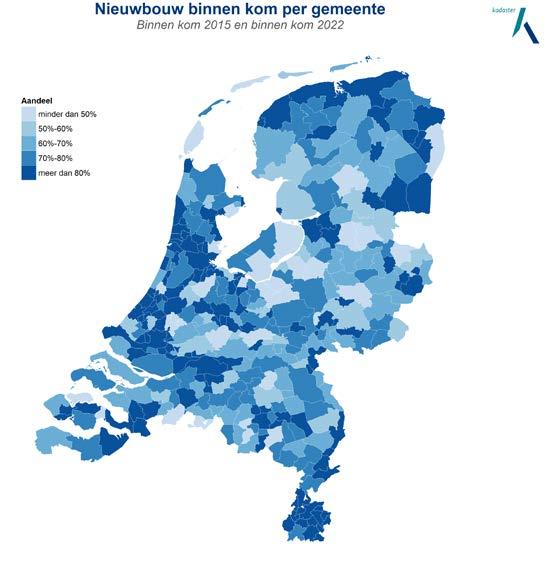
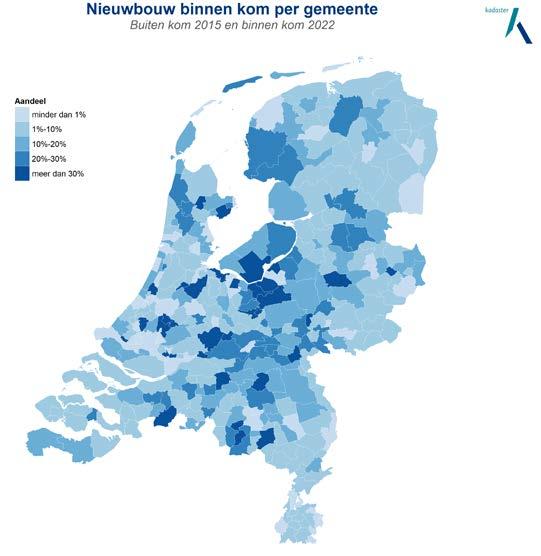
The extent to which new construction occurs within built-up areas varies substantially between regions. In just under half of all Dutch municipalities, more than 80% of new construction took place within the 2015 built-up boundaries. Conversely, in 31 municipalities, more than half of new construction occurred outside those boundaries. This group includes municipalities where the built-up boundaries have expanded in the intervening years. For instance, in Waddinxveen, Zuidplas, Eemnes, and Rozendaal, over half of all new construction took place outside the 2015 boundaries, yet within the expanded 2022 built-up area.
Fair Compensation in the Peat Landscape Balancing Agriculture and Societal Challenges
By Gerjan Meijer
The transition towards a climate-resilient peat meadow landscape requires tailored solutions, cooperation, and mutual understanding among the agricultural sector, water management authorities, and government bodies. Higher groundwater levels are necessary to reduce soil subsidence and CO2 emissions, but these measures also have financial implications for agriculture.
The Peatland Compensation Framework (CSV) provides a transparent and well-substantiated overview of these consequences. Developed and tested in the province of Fryslân, the framework’s goal is to find a balance between sustainable water management and a future-proof agricultural sector.
In the Netherlands, an increasing proportion of peat soils is drying out—partly due to climate change, but primarily as a result of decades of water management aimed at maximising agricultural productivity. To enable the use of heavy machinery and promote grass growth, groundwater levels have been lowered in many areas. In the long term, this has led to significant drawbacks: when peat soils dry, the peat oxidises. The organic matter in the soil slowly ‘burns’ when exposed to oxygen, causing the ground to sink and releasing substantial amounts of CO 2. This not only damages buildings, infrastructure, and ditches but also results in a considerable increase in greenhouse gas emissions.
Under the Dutch Climate Agreement, it has been decided that emissions from peatland areas must be reduced by one million tonnes of CO2-equivalent by 2030. A key measure to achieve this goal is to raise groundwater levels. By bringing the water table closer to the surface, peat remains wetter, oxidation slows down, and CO2 emissions decrease. However, higher water levels also present new challenges for farmers: wetter conditions make land management more difficult and less profitable.
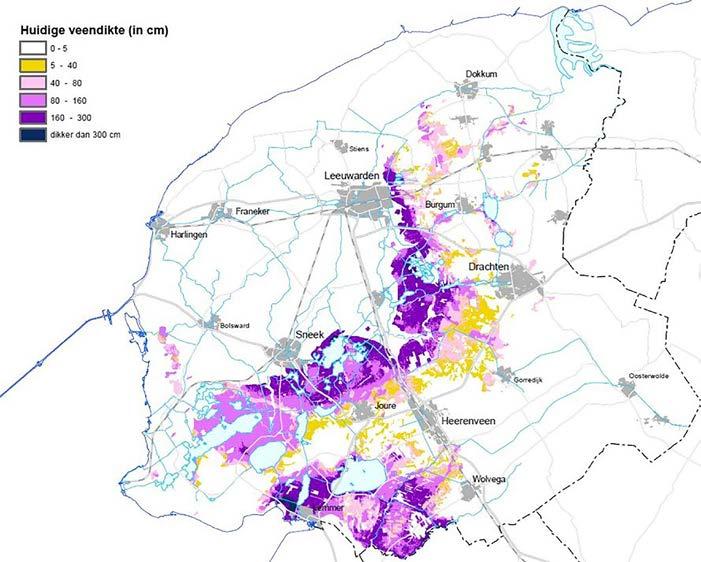
In the province of Fryslân, the peatland issue is clearly visible—about one-third of the province consists of peat meadow areas. To tackle the effects of soil subsidence and CO2 emissions, the province and Wetterskip Fryslân jointly developed the
peatland programme ‘Foarút mei de Fryske feangreiden’.
The programme aims to reduce CO2 emissions, slow soil subsidence, strengthen the water system, and preserve the
Frisian peat meadow. (Source: Province of Fryslân)
characteristic peat meadow landscape. The ambition is to achieve a reduction of 0.4 megatonnes of CO2-equivalent per year. This target can only be met if groundwater levels are raised across large parts of the region.
For the agricultural sector, this presents a major challenge. Higher water tables reduce soil bearing capacity, making it harder to cultivate land or graze livestock. Grass yields decline under wetter conditions, and the nutritional value may decrease as well. As a result, farmers face lower incomes while their fixed costs remain constant—or even increase. It is essential to strike a balance between climate objectives and agricultural interests.
Why a Compensation Framework?
To calculate and fairly compensate the agricultural losses incurred by farmers,
the Peatland Compensation Framework (CSV) was developed. It is the outcome of a collaboration among the Province of Fryslân, Wetterskip Fryslân, LTO, Countus, Weusthuis & Partners, Kadaster, and Wageningen University & Research (WUR). A stakeholder advisory group consisting of agricultural representatives reviewed the proposals to ensure that practical knowledge from farmers was integrated into the design.
The CSV is based on the principle of loss compensation (nadeelcompensatie). This principle means that anyone who suffers losses as a result of a general policy measure—in this case, the raising of water levels—has the right to a reasonable reimbursement. Farmers can choose between financial compensation or land-based compensation. By allocating additional land, farmers can expand their holdings and offset reduced productivity per
hectare, thereby maintaining income levels while supporting more sustainable water management.
To allocate compensatory land, land consolidation (herverkaveling) is applied, allowing land parcels to be exchanged and reorganised more efficiently. The CSV distinguishes between three types of damages: capital loss, income loss, and other damages.
Capital Loss
Capital loss refers to the decrease in land value due to a raised water level. To determine this objectively, the CSV employs the system of land classification and agricultural market values, as used in land consolidation projects.
Land classification expresses the agricultural productive capacity of parcels, primarily determined by soil type and water table depth. Extremely dry or overly wet
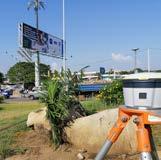
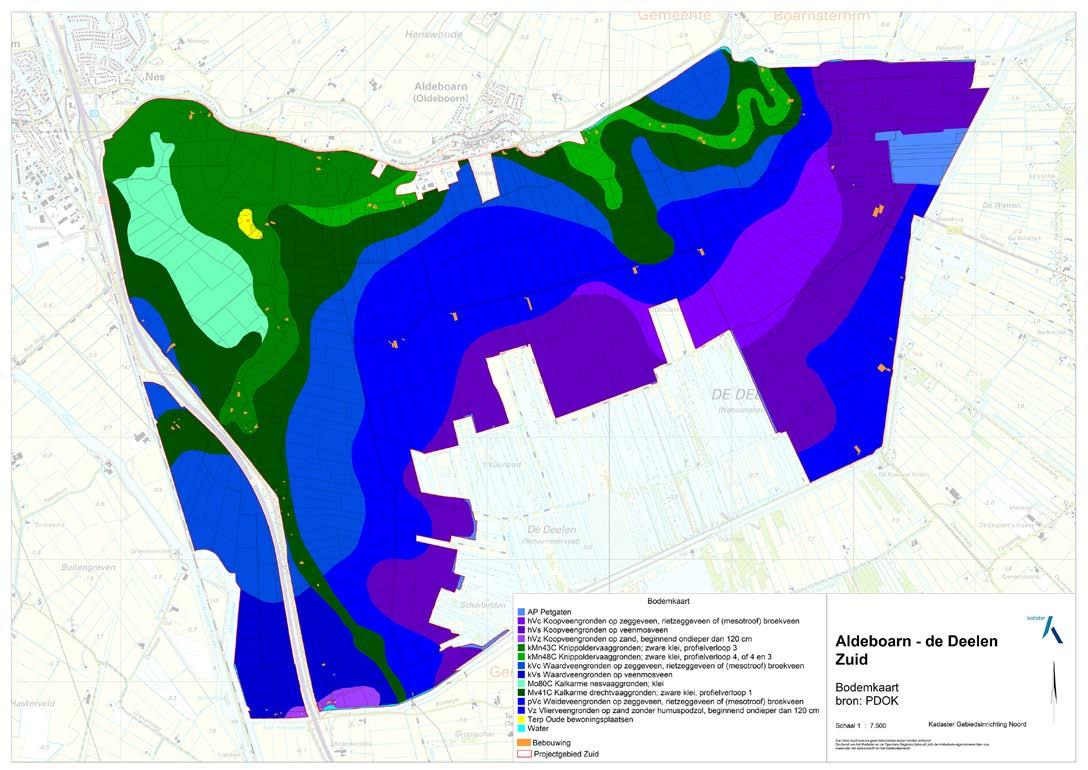
Soil area Aldeboarn–De Deelen South. (Source: Kadaster, PDOK)
Compensation Framework for Peatland Areas Compensation Framework for Peatland Areas
conditions lead to lower yields. To assess this, data on soil composition, elevation, and groundwater levels are entered into the Waterwijzer Landbouw (WWL) — a calculation tool developed by Wageningen University & Research.
The WWL estimates expected yields for both current and future conditions, evaluating biomass (total grass yield), nutritional value expressed in kVEM (energy value), and protein yield (DVE). These parameters together define the productivity of each parcel. The results are then translated into land classes, where higher yields correspond to higher classes.
To assign a monetary value to each class, market research is conducted to determine current agricultural land values in the area. By comparing present and future values, an accurate picture of the depreciation per parcel is obtained. This depreciation forms the basis for the calculation of capital loss, which can then be converted into landbased compensation, ensuring that the total business value of the farmer remains stable.
The distribution of compensation depends on the type of land use: owner-users receive the full capital loss; in leasehold (erfpacht) arrangements, the loss is shared between owner and leaseholder; under standard tenancy (pacht), the landowner receives compensation for capital loss, while the tenant is compensated for income loss.
During a so-called preference session (wenszitting), landowners and users indicate whether they prefer financial, land-based, or mixed compensation. Based on these preferences, a reallocation plan is drawn up collaboratively. Since this involves a statutory land consolidation, unanimous approval is not required.
Income Loss
Income loss concerns the reduction in grass and milk yields caused by wetter conditions. Again, the Waterwijzer Landbouw calculations serve as the foundation, supplemented by additional effects such as shorter working and grazing periods.
About the Author
Gerjan
Meijer is a senior project leader at Kadaster. gerjan.meijer@kadaster.nl
In addition to lower yields, costs increase: farmers may need to purchase extra feed or build additional manure storage because cows spend fewer days grazing outdoors. Operational costs also rise, particularly when machinery access becomes limited due to soil saturation.
These disadvantages are balanced against financial benefits, such as eligibility for higher EU Common Agricultural Policy (CAP) subsidies when farm area increases, and greater manure application capacity. By integrating all these factors, the CSV provides a transparent and balanced assessment of total income loss.
Other Damages
‘Other damages’ include cost items outside the standard categories, such as drainage systems that no longer function properly under higher water levels, and taxes owed when opting for monetary compensation. Since not all consequences of water-level adjustments can be easily quantified, the CSV explicitly includes this third category, allowing for individual assessment of special cases.
Practical Application: Aldeboarn–De Deelen
The CSV was first applied and tested in the Aldeboarn–De Deelen region. Here, farmers and landowners actively participated in shaping and evaluating the framework. Their experiences and suggestions led to refinements and improvements. Significant attention was also given to data quality. For example, elevation maps from Kadaster were compared with field measurements from Wetterskip Fryslân to ensure data reliability.
The framework is currently under review by the European Commission, which will
determine whether it complies with state aid regulations. Once approved, the first full-scale implementation of the CSV will take place in Aldeboarn–De Deelen Zuid.
Towards Broader Application
Although developed in Fryslân, the CSV can be effectively applied to other peatland regions in the Netherlands. Other provinces have already expressed interest. A desk study in a polder in Utrecht showed that regional variations exist — such as subsidiary drainage systems, water infiltration installations, and different land uses — requiring further adaptation of the framework.
The compensation framework demonstrates that societal challenges and agriculture need not be in opposition. On the contrary, it could also provide solutions in other rural policy contexts, particularly where interventions affect land value or land use potential. This creates space for nature restoration, water management, and climate adaptation, while allowing active farmers in the area to maintain income and long-term prospects.
Legal Role in Land Consolidation
Kadaster has a statutory role in land consolidation and acts as an independent authority ensuring that property rights and procedures comply with the standards set by the Environment and Planning Act (Omgevingswet). During the development of the Peatland Compensation Framework, Kadaster contributed expertise on how best to integrate loss compensation mechanisms into the consolidation process.
Geocareer
Started a complete Geo-ICT training program
Unique in the Netherlands.
Growing Towards a Mature GIS Organisation
Geoversity: Platform for the Global Geo Community Mentorship Programme
Alessandro Della Bella, D-BAUG / ETH Zurich
ITC Provides Geodata for Spatial Transitions — Worldwide, and Now Also Close to Home
By Janneke van den Elshout
For three-quarters of a century, the Faculty of Geo-Information Science and Earth Observation (ITC) has helped countries advance through knowledge of geo-information and earth observation. But the world is changing, and the need for spatial thinking is now growing within the Netherlands as well. “We don’t want to contribute only to development far away,” says Professor Jaap Zevenbergen, “but also to inspire young people here to help shape the future with geodata.”
The ITC faculty began in 1950 as the International Training Centre for Aerial Survey, with a mission that was both technical and idealistic: to use aerial photography to help countries develop. “It was about knowing what a country looks like, how the land is used, and making maps to support progress,” Zevenbergen explains. This Dutch expertise in land and water management, agriculture, and geology became the foundation of what would later evolve into a global leader in geoinformation.
A Strong Legacy of Mapmakers and World Builders
“Over the decades, ITC has remained faithful to its core mission, but technology and context have changed dramatically — from analogue aerial photographs taken from small aircraft to satellite imagery, drones, AI-based analysis, and cloud-based data integration. We were applying machine learning methods long before the current AI hype,” says Zevenbergen. “What is now called generative AI is new, but the idea of self-learning systems has been our everyday reality for years.”
Geodata with a Human Compass
Despite major technological advances, ITC’s human-centred perspective has never
changed. The faculty develops geo-solutions not for the sake of data itself, but for the people who need them to move forward. “We do this always with development in mind — to help communities shape their own future.”
De mens is daarbij niet alleen gebruiker, People are not only users of geoinformation, but increasingly co-creators of it. Citizen science projects engage citizens directly — both figuratively and literally — in the process of data collection. “Citizens help gather information and thus gain ownership over the issues at stake. This increases both engagement and data quality.”
World-Famous Outside the Netherlands
Anyone active in the international geo community knows ITC. Alumni who once studied in Enschede can be found in nearly every country. Yet, for many years, the saying held true: “ITC is world-famous outside the Netherlands.” Domestic recognition remained limited, partly because the institution had long been strongly internationally oriented.
That focus yielded great results: projects such as ILWIS (Integrated Land and Water Information System) were pioneering
efforts in GIS development. ITC also became influential in fields such as disaster risk management, biodiversity, and climate adaptation. “We have always sought to make our knowledge inclusive,” Zevenbergen explains, “so that even people in informal settlements could secure their land rights — a kind of pro-cadastre.”
The Shift: From the Global South to Local Engagement
In recent years, awareness has grown that spatial challenges are urgent everywhere, including Europe. Climate change, energy transition, urban densification, and water management all demand the same geoexpertise that ITC has long applied abroad. Therefore, the faculty is increasingly engaging with the Dutch and European educational and professional landscape. ITC is already a partner in the GIMA master’s programme (Geo-Information Management and Applications), together with TU Delft, Utrecht University, and Wageningen University, and it aims to further expand with programmes tailored for Dutch students.
“Our Master’s in Geo-information Science and Earth Observation has now existed for 25 years,” says Zevenbergen. “But we also want to make that knowledge accessible to
students closer to home — for example through a bachelor’s degree that shows how spatial thinking supports major societal transitions.”
Learning by Doing
A hallmark of ITC’s educational philosophy is learning by doing. Students — until recently often professionals from their own countries — bring real-world experience and learn collaboratively in international groups. “That leads to lively discussions,” Zevenbergen notes. “How do you approach water management or urban growth?”
ITC aims to preserve that approach for Dutch students as well, by addressing issues faced by local companies and governments. The faculty sees a new generation emerging — students eager to pursue a geo-career straight after high school or a bachelor’s programme. “We want them to feel how relevant this field is — that nearly every societal issue has a spatial dimension. Whether it’s energy, food, migration, or climate — without geodata, you can’t see the connections.”
Sharper Focus and National Collaboration
After decades of broad growth, ITC is now concentrating on four key themes: GeoAI, Urban Futures, Disaster Resilience, and Resource Security. This sharper focus is partly driven by national cutbacks in
About the Author
Janneke van den Elshout is a science communications officer at the University of Twente
development cooperation, which led to staff reductions in October 2025, when more than twenty colleagues were informed that their positions would end.
These themes form the backbone for both research and education. “We remain broad, but within these frameworks people can focus and collaborate,” Zevenbergen explains. “This also helps us show more clearly what we contribute as a faculty, both internationally and nationally.”
In addition, ITC is strengthening ties with organisations such as GIN (Geo-Informatie Nederland) and GeoSamen, where governments, businesses, and knowledge institutions within the geo-sector meet. “GIN connects the geo field in the Netherlands. For ITC, that’s valuable, because it helps us align with what’s happening here — and hopefully reach young people who might otherwise never encounter geo-information.”
An Open Outlook — Inward and Outward
Since its integration into the University of Twente (2010), ITC has been more closely connected to other disciplines and to the Dutch academic landscape. “We’ve always been a close-knit international community, but it’s good that we’re now explicitly open to collaboration within the Netherlands. The issues we address — climate, urban growth, water management — affect everyone. That calls for broader engagement.”
Geodata and the Future
ITC intends to uphold its original mission — sharing knowledge for a better world — while continuously renewing itself. “We have always worked to support development in distant countries,” Zevenbergen summarises. “Now we also want to contribute to the development of people and communities here.”
With new programmes, stronger ties within the Netherlands and Europe, and a continued focus on global challenges, ITC seeks balance between heritage and innovation. The message is clear: Those who wish to understand and improve the world must learn to think spatially — whether that world lies in Enschede or far beyond.
Professor Jaap Zevenbergen
From Insight to Impact
Growing into a Mature GIS Organisation
By Marien de Bakker
The use of Geographic Information Systems (GIS) in the Netherlands dates back roughly 50 years. Systematic application within government organisations and private companies is a more recent development. This raises the question: can we now speak of GIS maturity, much like discussions of ICT maturity in the 1990s or data maturity in the early 2000s?
During Esri Connect last spring, Astrid Weijs (Management Consultant) and Marc Hoogerwerf (Advisor Esri Advantage Program and Technical Consultant) presented a framework for assessing an organisation’s GIS maturity. Time, then, for an interview to better understand what they mean by this concept
What Do You Mean by ‘Maturity’?
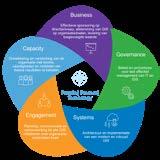
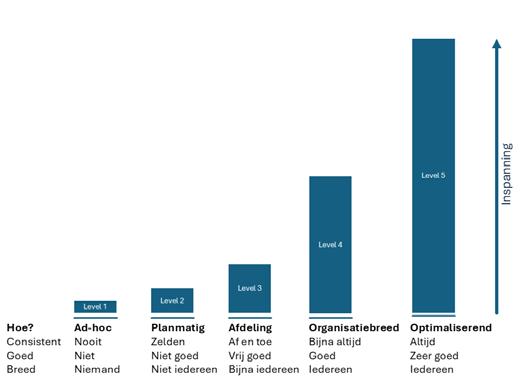
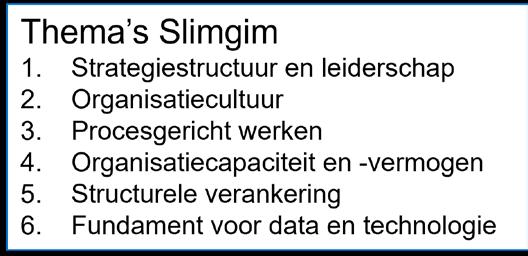
“We use this definition: ‘the extent to which an organisation effectively uses, manages, and integrates [GIS | Data | AI] into its processes and decision-making.’ We apply the Slimgim Model, developed by Paul Giroux, for assessing GIS maturity based on the Capability Maturity Model (CMM). This model consists of five levels of maturity (see Figure 1) and helps organisations understand where they currently stand. It also defines six key themes (see Figure 2). From this, it is clear that Slimgim is not just about technology — it explicitly addresses governance, business processes, and knowledge management within the organisation.”
Why Is This Important for Organisations? What Is Its Added Value?
“A thorough maturity assessment is an excellent starting point for targeted improvement. The Slimgim (www.slimgim.info) approach is a self-evaluation method in which participants engage in substantive discussions to reach a shared consensus. We facilitate these discussions. The value lies not only in the outcome but especially in the process of achieving a shared understanding. In practice, we often see that the primary focus is on delivering impressive GIS solutions, with less attention to what we call the foundation — the essential prerequisites for success. A stronger foundation (i.e., a higher maturity level) enables organisations to accelerate their use of data and GIS. This is crucial given the many organisational and societal challenges they face. Moreover, this foundation becomes even more important if you want to unlock the potential of Artificial Intelligence (AI).”
Figure 1: GIS maturity according to Slimgim — how consistent, effective, and widespread is each success factor?
Figure 2: The six themes of the Slimgim model.
How Do You Approach This Within an Organisation?
“Together with the client, we discuss expectations for the workshop and select participants who can represent a broad range of perspectives. We typically allocate two half-day sessions with six to eight participants to discuss the 51 success factors across the six themes mentioned earlier. Each success factor is scored on a scale from 1 to 5, depending on how well it is currently implemented in the organisation. Participants also estimate expected changes over the coming year. Consensus is essential, so the right people must be present — ideally from different functional, technical, and managerial backgrounds. The findings, conclusions, and recommendations are compiled into a report, followed by a feedback session. To ensure follow-up, we aim to involve senior management or the executive team — sometimes directly in the workshop, but more often through preinterviews and post-session engagement. This involvement can help prioritise actions. As Esri consultants, our role is primarily facilitative: we guide the method, ensure robust analysis and reporting, and provide concrete actions so that the organisation can immediately begin improving.”
Fifty-one Factors Sounds Like a Lot. Do Participants Experience It as Demanding?
“We deliberately chose Slimgim because it is a robust, independent, and scientifically grounded methodology. Paul Giroux introduced it in 2014, and it has since proven its effectiveness, particularly in the United States and Canada. Reaching consensus across 51 factors indeed requires effort, but with structured facilitation and time management, it is entirely feasible. The real value lies in the shared dialogue and collective insight that emerges — something participants consistently confirm after completing workshops. Its thoroughness is precisely why clients choose this approach. Interestingly, not all participants are Esri customers — the method is technology-neutral. Recently, for example, we carried out a GIS maturity assessment at a municipality that uses open-source GIS.”
You report on Five Areas: Business, Governance, Systems, Engagement, and Capacity (See Figure 3). Can You Provide an Example for Each?
“Yes. To cluster recommendations, we use the five pillars of the Geospatial Program Framework (https://www.esri.com/en-us/
path-to-geospatial-excellence/overview), which we apply within Esri.”
Examples include:
• Business: engaging senior management in GIS; developing a GIS vision.
• Governance: formalising responsibilities.
• Systems: creating a data catalogue; developing an information architecture for integration.
• Engagement: improving collaboration with business intelligence and data science teams.
• Capacity: ensuring that GIS knowledge is developed and secured across the organisation — for example through a GIS training plan or knowledge-sharing sessions.
Are There Big Differences Between Technically Oriented Staff and Managers?
“What’s particularly valuable is that sharing perspectives from different roles leads to mutual understanding. Sometimes a session produces real eye-openers — a manager may think certain things are well organised, only to discover they are not. That can shift priorities for investment or projects. Understanding each other’s position is, in itself, a significant outcome.”
What Is Your Long-term Vision on This Topic, and What Is Needed to Achieve It?
““Our vision is that our clients will harness the full power of GIS — within their own organisations and in addressing societal challenges. To achieve this, greater awareness is needed among business leaders, senior management, and executives. Once that awareness exists, organisations can develop a vision and strategy for data, GIS, and AI — and translate these into operational practice. For successful implementation, multidisciplinary collaboration and a continuous improvement mindset are crucial. Regular maturity assessments can provide direction and positive reinforcement. Ideally, in the future, we would no longer need to talk about GIS maturity at all — because it will have become a natural part of every organisation’s daily operations.”
For more information, also read this article:
Figure 3: The five pillars of the Geospatial Program Framework used to report GIS maturity findings.
A Look Back at the Pilot at HAS Green Academy The GIN Mentorship Programme
The geo-sector is brimming with knowledge, innovation, and collaboration — and that is precisely what the GIN Mentorship Programme brought to life this spring. Between February and June 2025, a pilot of the mentorship initiative took place, a collaboration between Geo-Informatie Nederland (GIN) and the HAS Green Academy. With 32 Applied Geo-Information Science students and ten mentors from government, academia, and industry, the pilot proved a resounding success.
Learning Together, Growing Together
The programme began with an introductory classroom session, followed by three mandatory contact moments between students and mentors: an introduction, a midterm update, and a final meeting. In small groups of three to four students per mentor, experiences were shared, questions asked, and career paths explored. Thanks to the efforts of lecturers Vincent Wissink and Jesper Giesbers, students could, wherever possible, be matched with mentors whose expertise aligned with their personal interests.
The mentors expressed enthusiasm about the students’ openness and curiosity. Mentor Annemieke Verbraeck (GeoDelta) remarked: “Finding an internship is usually a very individual process, so it was great for students to observe each other’s search journeys and exchange advice.”
Students, in turn, indicated that conversations with geo-professionals gave them clearer insight into their future careers in the field.
Learning from the Pilot
The pilot yielded valuable insights: both mentors and students experienced the benefits of structured contact and personal guidance. For the next edition, attention will be given to improving the matching process based on interests and providing clearer expectations and objectives for both mentors and students.
Continuation in 2026
Given the pilot’s success, the mentorship programme will continue in 2026 —
again in collaboration with HAS Green Academy — with the ambition to expand participation to include students from other geo-education programmes. The GIN Mentorship Programme demonstrates the power of connection between students and professionals. Together, we are building a strong, engaged, and future-oriented geocommunity.
Would you like to play a role in nurturing young geo-professionals during the first half of 2026? Sign up via info@geo-info.nl to become a mentor and contribute to the next edition of the Mentorship Programme!
Geoversity: A Platform for the Global Geoscience Community
Geoversity is a website for lifelong learning and knowledge sharing. Launched by the University of Twente’s Faculty of Geo-information Science and Earth Observation (ITC) in 2024, the platform is a learning hub for the global geoscience community, designed for anyone interested in Earth observation, geospatial data, and the science behind understanding our changing world.
The platform offers a diverse selection of non-credit e-learning courses, such as UAVs in Precision Agriculture, Advanced Agent-Based Modelling, or GeoTechE: Geotechnology Ethics, among many others. Users can follow individual learning paths and participate in courses of varying duration and style of delivery, learning at their own pace, collaborating and interacting online.
Some courses are fully online, others are hybrids. There are free and paid courses, all of which offer opportunities to boost the skills and knowledge of geospatial professionals, scientists, students, decisionmakers, and individuals interested in geospatial science. Geoversity represents a growing community of up to 8K users.
As well as hosting courses, Geoversity is a dynamic content hub that regularly publishes free podcasts, videos, and articles
explaining the latest innovations and issues in the geospatial field. Visitors can learn about new research in a range of accessible formats and are encouraged to continue exploring related content on the website. This content is designed to keep the global geo community inspired and informed, as well as to pique the interest of those thinking about joining a course.
The platform reflects over 70 years of ITC expertise in geoinformation science and education. Every course and piece of content is shaped by the Geoversity team in collaboration with ITC’s academic departments. The ambition is to offer further courses and content with a growing network of partner organisations.
Currently, there are 19 topic areas to explore, from Artificial Intelligence to Climate Change, Digital Twins, Natural Resources Management, UAVs, and many
more, with further topics to be added in the future. This organisation of topics allows learners to explore tailored content that aligns with their unique interests and areas of expertise.
Geoversity supports the UN’s Sustainable Development Goals and empowers people to use geospatial data to drive positive change and address global challenges like climate change, biodiversity protection and resource security.
Future plans for the website include expanding into credit-bearing courses, creating regional digital education hubs that help to ‘train the trainers’, and turning Geoversity into a kind of marketplace for geo learning to address global challenges.
Brad Hillas Geoversity Editor
b.m. hillas@utwente.nl
DGeo Produces More Detailed Urban Maps at a Scale of 1:5,000
Satellite Imagery Reveals
the Secrets of Cities
By Captain Joris van Duin
“The terrain dictates” — this timeless lesson is ingrained in every soldier’s mind from the very first days of training. When it comes to up-to-date satellite imagery and topographic maps, military personnel rely on the Defence Geography Service (DGeo). At their headquarters in ’t Harde, staff work day and night to produce and deliver these essential tools. The latest addition to their portfolio: highly detailed urban maps.
It may sound less glamorous than the PzH 2000NL howitzer, Leopard tank, or CV90 infantry fighting vehicle, yet without the work of DGeo, these cornerstones of the Royal Netherlands Army could not operate effectively. Anyone who visits the team of thirty specialists at the Lieutenant Colonel
Tonnet Barracks will leave impressed. From 3D models of mountain ranges to sociogeographical data of Baghdad, and from topographic maps of Kyiv to aeronautical charts, the range of products is vast — and each one made with precision. Recently, DGeo has begun producing a
new class of maps. While the standard NATO operational maps use a 1:50,000 scale — perfect for an overview of larger areas — this scale reveals only major roads and neighbourhood outlines in urban environments. For soldiers on the ground, that is no longer sufficient.
Lieutenant Colonel Clemens Roos (right) and geo-information adviser Paolo Kors (left) explain the importance of detailed urban mapping.
Focus on Urban Terrain
“Modern military operations increasingly take place in populated areas,” explains Lieutenant Colonel Clemens Roos, Head of the Defence Expertise Centre, DGeo. “We’ve seen in our own missions and in conflicts like the war in Ukraine that operations are often conducted where civilians live. That means we need far more detailed maps.” He continues: “Within an international datasharing programme, we began developing urban maps at a much finer scale — 1:5,000.” At this scale, 1 centimetre on the map represents 50 metres on the ground.
“This level of detail allows users to see buildings, alleys, guardrails, electricity poles, and even hedges or walls. These are the elements that matter when you’re operating in a city. Soldiers can orient themselves effectively.”
It marks remarkable progress compared with earlier decades, when Roos himself began his career as an airmobile infantry officer. “Back then, we were glad to have any map at all. If none were available, we
would sketch one by hand with our platoon commanders. At least we had a rough idea of the area. Thankfully, those days are long gone — technology and tools have advanced tremendously.”
Behind the Maps
At DGeo’s design tables, Dirk Boon and Paolo Kors, geo-information advisers, demonstrate their latest tools. They first display a sociogeographical map of Baghdad — dots
High-resolution satellite imagery forms the foundation of every map.”
A French example map of a city in Africa reveals intricate details.
indicate population density, while their colours represent demographic factors such as religion or language. Then comes their newest product: ultra-detailed city maps.
On the table lies a French reference map of an African city. An intricate network of lines reveals the area’s hidden details.
Crystal-Clear Satellite Imagery
“High-resolution satellite imagery forms the foundation of our maps,” says Kors. “That’s only the beginning — the real challenge lies in interpreting and categorising objects. How do you show whether something is a residence, a fuel depot, or a warehouse?
Especially when collaborating with 31 other
countries, agreeing on a shared legend takes a lot of coordination. You want one standard — not thirty different symbols for the same object. Shared language is key.”
His colleague Boon demonstrates on his computer. On screen appears the same map, now divided into hundreds of digital layers. “You can turn individual features on or off — railways, military structures, religious buildings, and so on. That’s the power of digital geodata and software,” he explains.
“Satellite imagery gives us a clear picture of all objects in a city,” Boon continues. “We then interpret the images: is a building a
school, a logistics hub, or a military site? Can we identify public utilities? It’s painstaking work, but it ensures the armed forces always have the best possible information position.”
Supporting Operations Worldwide
That, ultimately, is DGeo’s mission. Roos explains: “We aim to provide the armed forces with the most detailed and validated information possible — anywhere in the world. Units can request all kinds of geographic data: maps, satellite imagery, elevation data, you name it. Whether for missions, exercises, or special operations — we support them all.”
Do units know how to find DGeo? “There’s still room for improvement,” Roos admits. “During exercises, we bring printed maps, and digital versions are available in the ELIAS command application. But with the geoinformation and software available today, units could do much more — provided they invest in knowledge and capacity in this area.”
That’s where DGeo comes in — now also providing detailed maps for dozens of cities. Which ones are next? Roos smiles: “Without naming specifics, let’s just say our focus is on the eastern flank.”
Foto’s: SM Aaron Zwaal
International Cooperation
Under the Multinational Geospatial Co-production Program (MGCP), the armed forces of 32 nations share digital map data using identical legends and symbols. Topographers from all participating countries create these maps using satellite imagery at a 1:50,000 scale, in close cooperation with institutions such as the Dutch Cadastre (Kadaster). To receive maps from others, each country must also contribute its own. In recent years, several nations have begun producing more detailed urban maps. The Netherlands recently met the stringent certification standards by digitally processing all data for Paramaribo. As a result, the country now has access to a shared international database containing dozens of detailed city maps.
Geo-information adviser Dirk Boon demonstrates how interpreting satellite photos is key to accuracy.
After Paramaribo, shown here in digital map form, DGeo focuses on cities along the eastern flank.
Leica TS20
The standard for productivity
Built for surveyors who race the clock, brave the elements, and demand precision – Leica TS20 delivers speed and accuracy that define productivity.