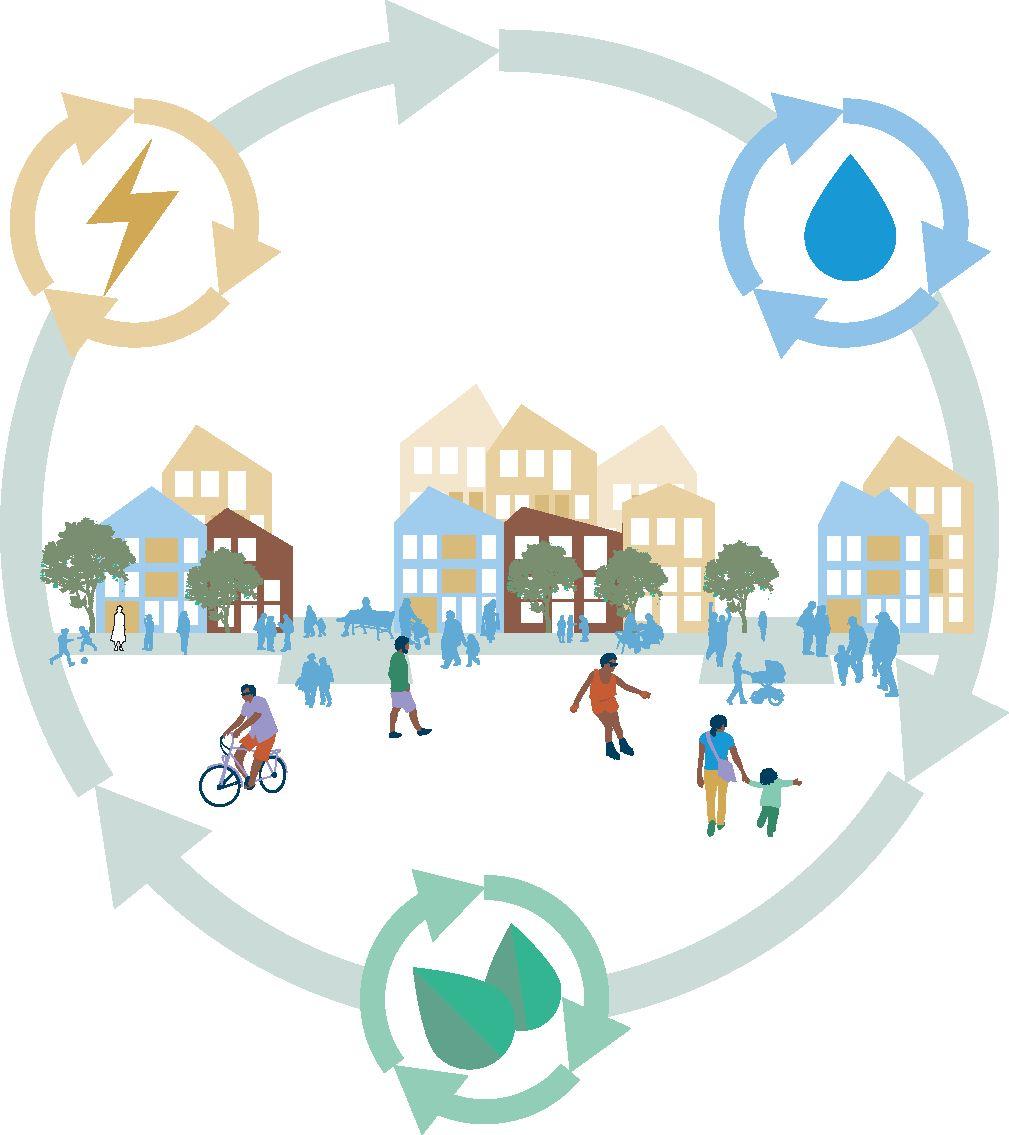
Mixed, multi-modal cities and neighborhoods, characterized by “gentle density”, offer a path to a lower emissions world
Per capita emissions in compact, mixed-use, multi-modal cities are typically 2-3x lower than the countries in which those cities are locatedregardless of whether the countries’ average per capita emissions are low or high
Source: Michael Mehaffy, “Urban Form and Greenhouse Gas Emissions,” November 2015
The environmental challenge
associated with sprawl seems obvious – but also overwhelming
Atlanta and Barcelona have similar populations—in fact, Barcelona’s is slightly larger—but Atlanta takes up 26x more space
The built-up area of Atlanta and Barcelona represented at the same scale
Atlanta
2.5 million people (1990) 4,280 km2 (built-up area)
Barcelona
2.8 million people (1990) 162 km2 (built-up area)
Source: Sources: Bertaud, Alain, and Harry W. Richardson, “Transit and Density: Atlanta, the United States and Western Europe,”
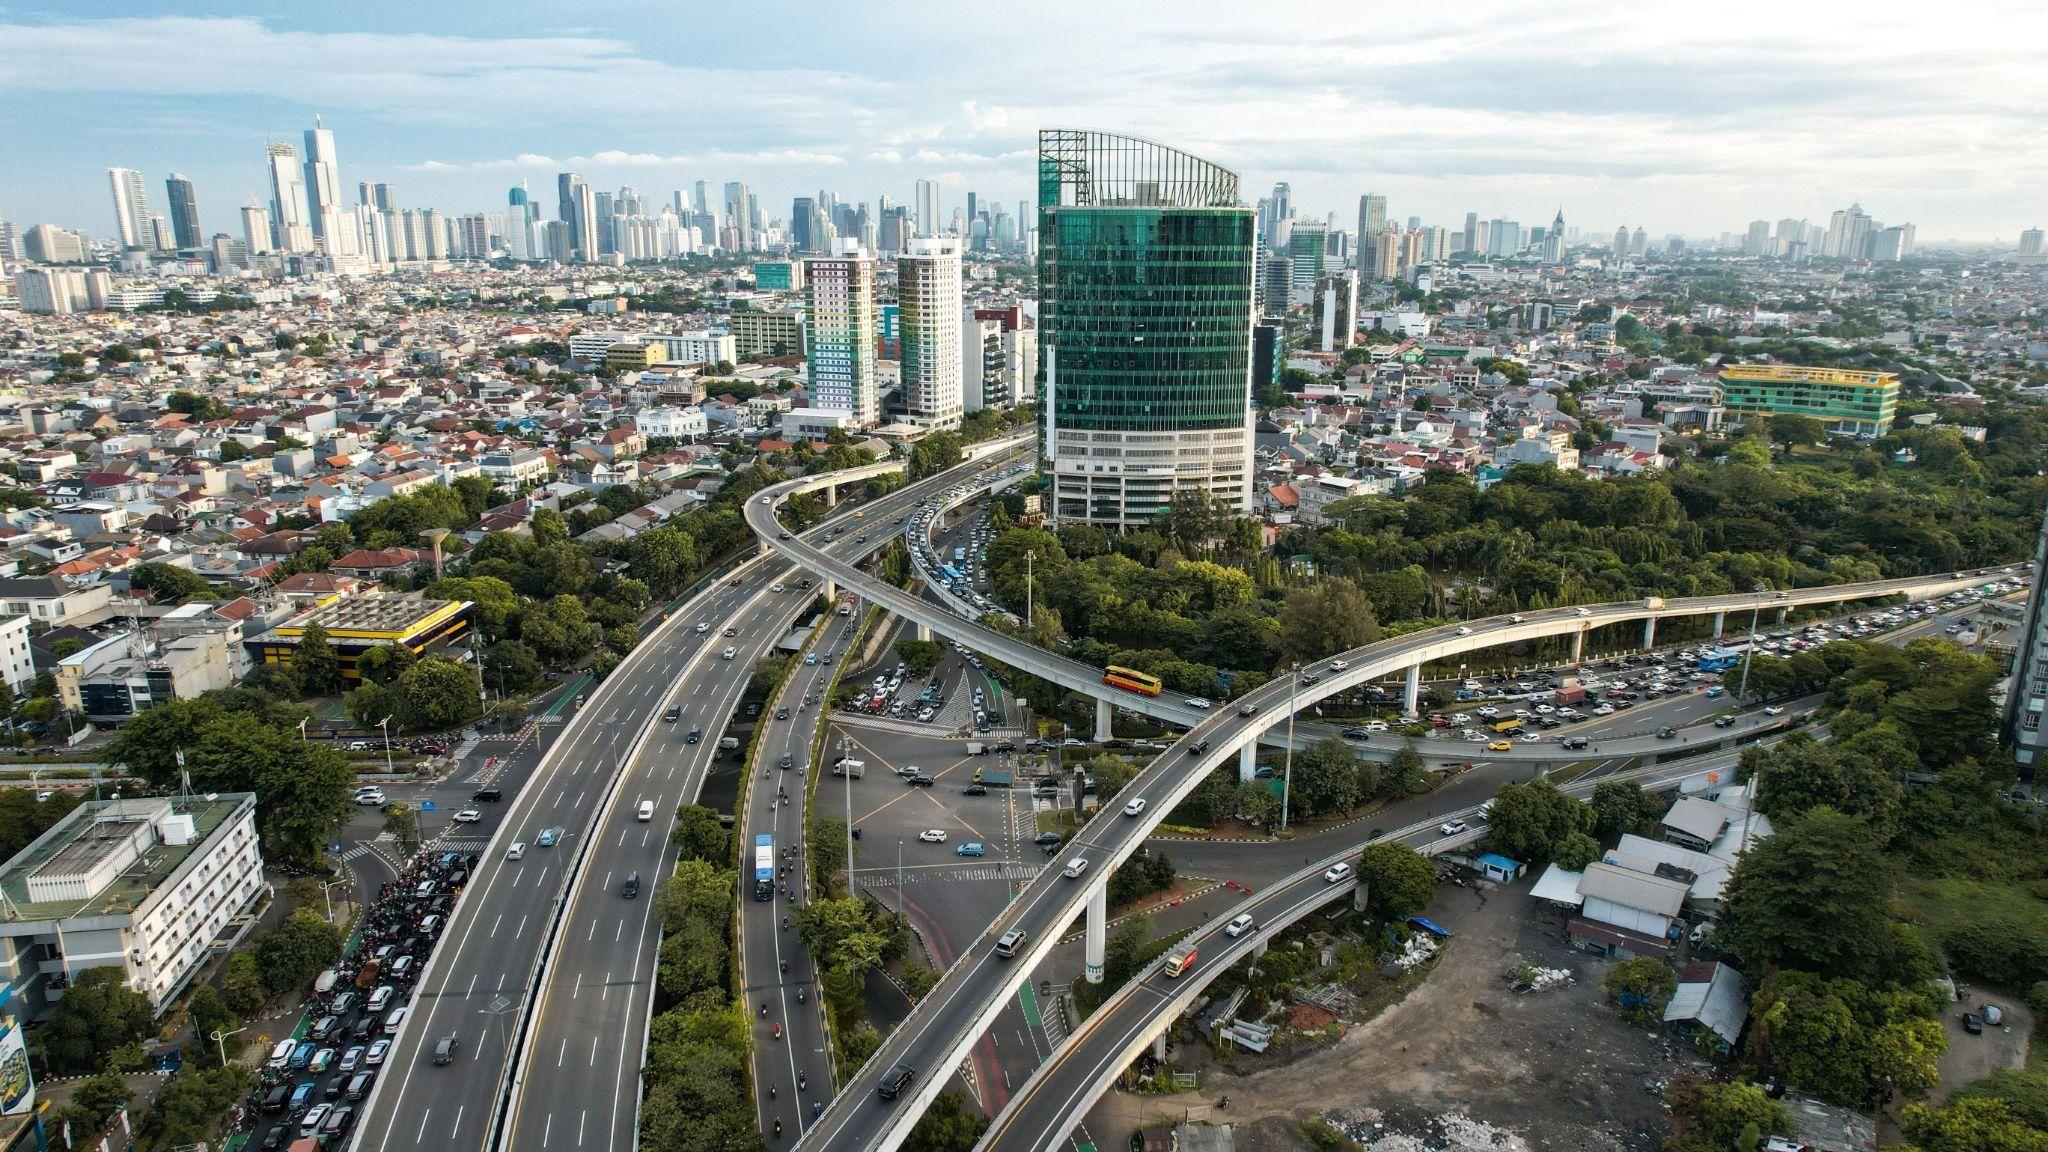
By 2050, the world’s urban population will double.
How we accommodate that growth will make-or-breakour climate goals.
Urban Population Growth in Select Regions, 2015 - 2050
Much of that growth will be in regions where the building stockhas not yet been built.
Source: UN World Urbanization Prospects
The current trajectory is not good…
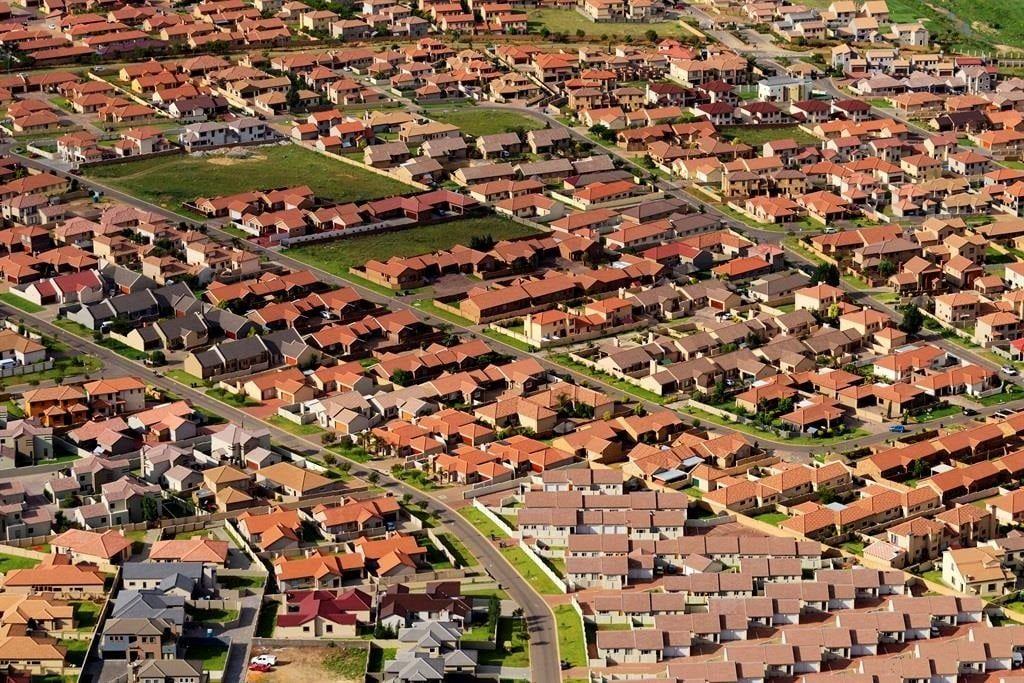
Global percent change in urban population vs. urban area
We are converting undeveloped land faster than the urban population is growing.
Sources: Güneralp et al. (2020)
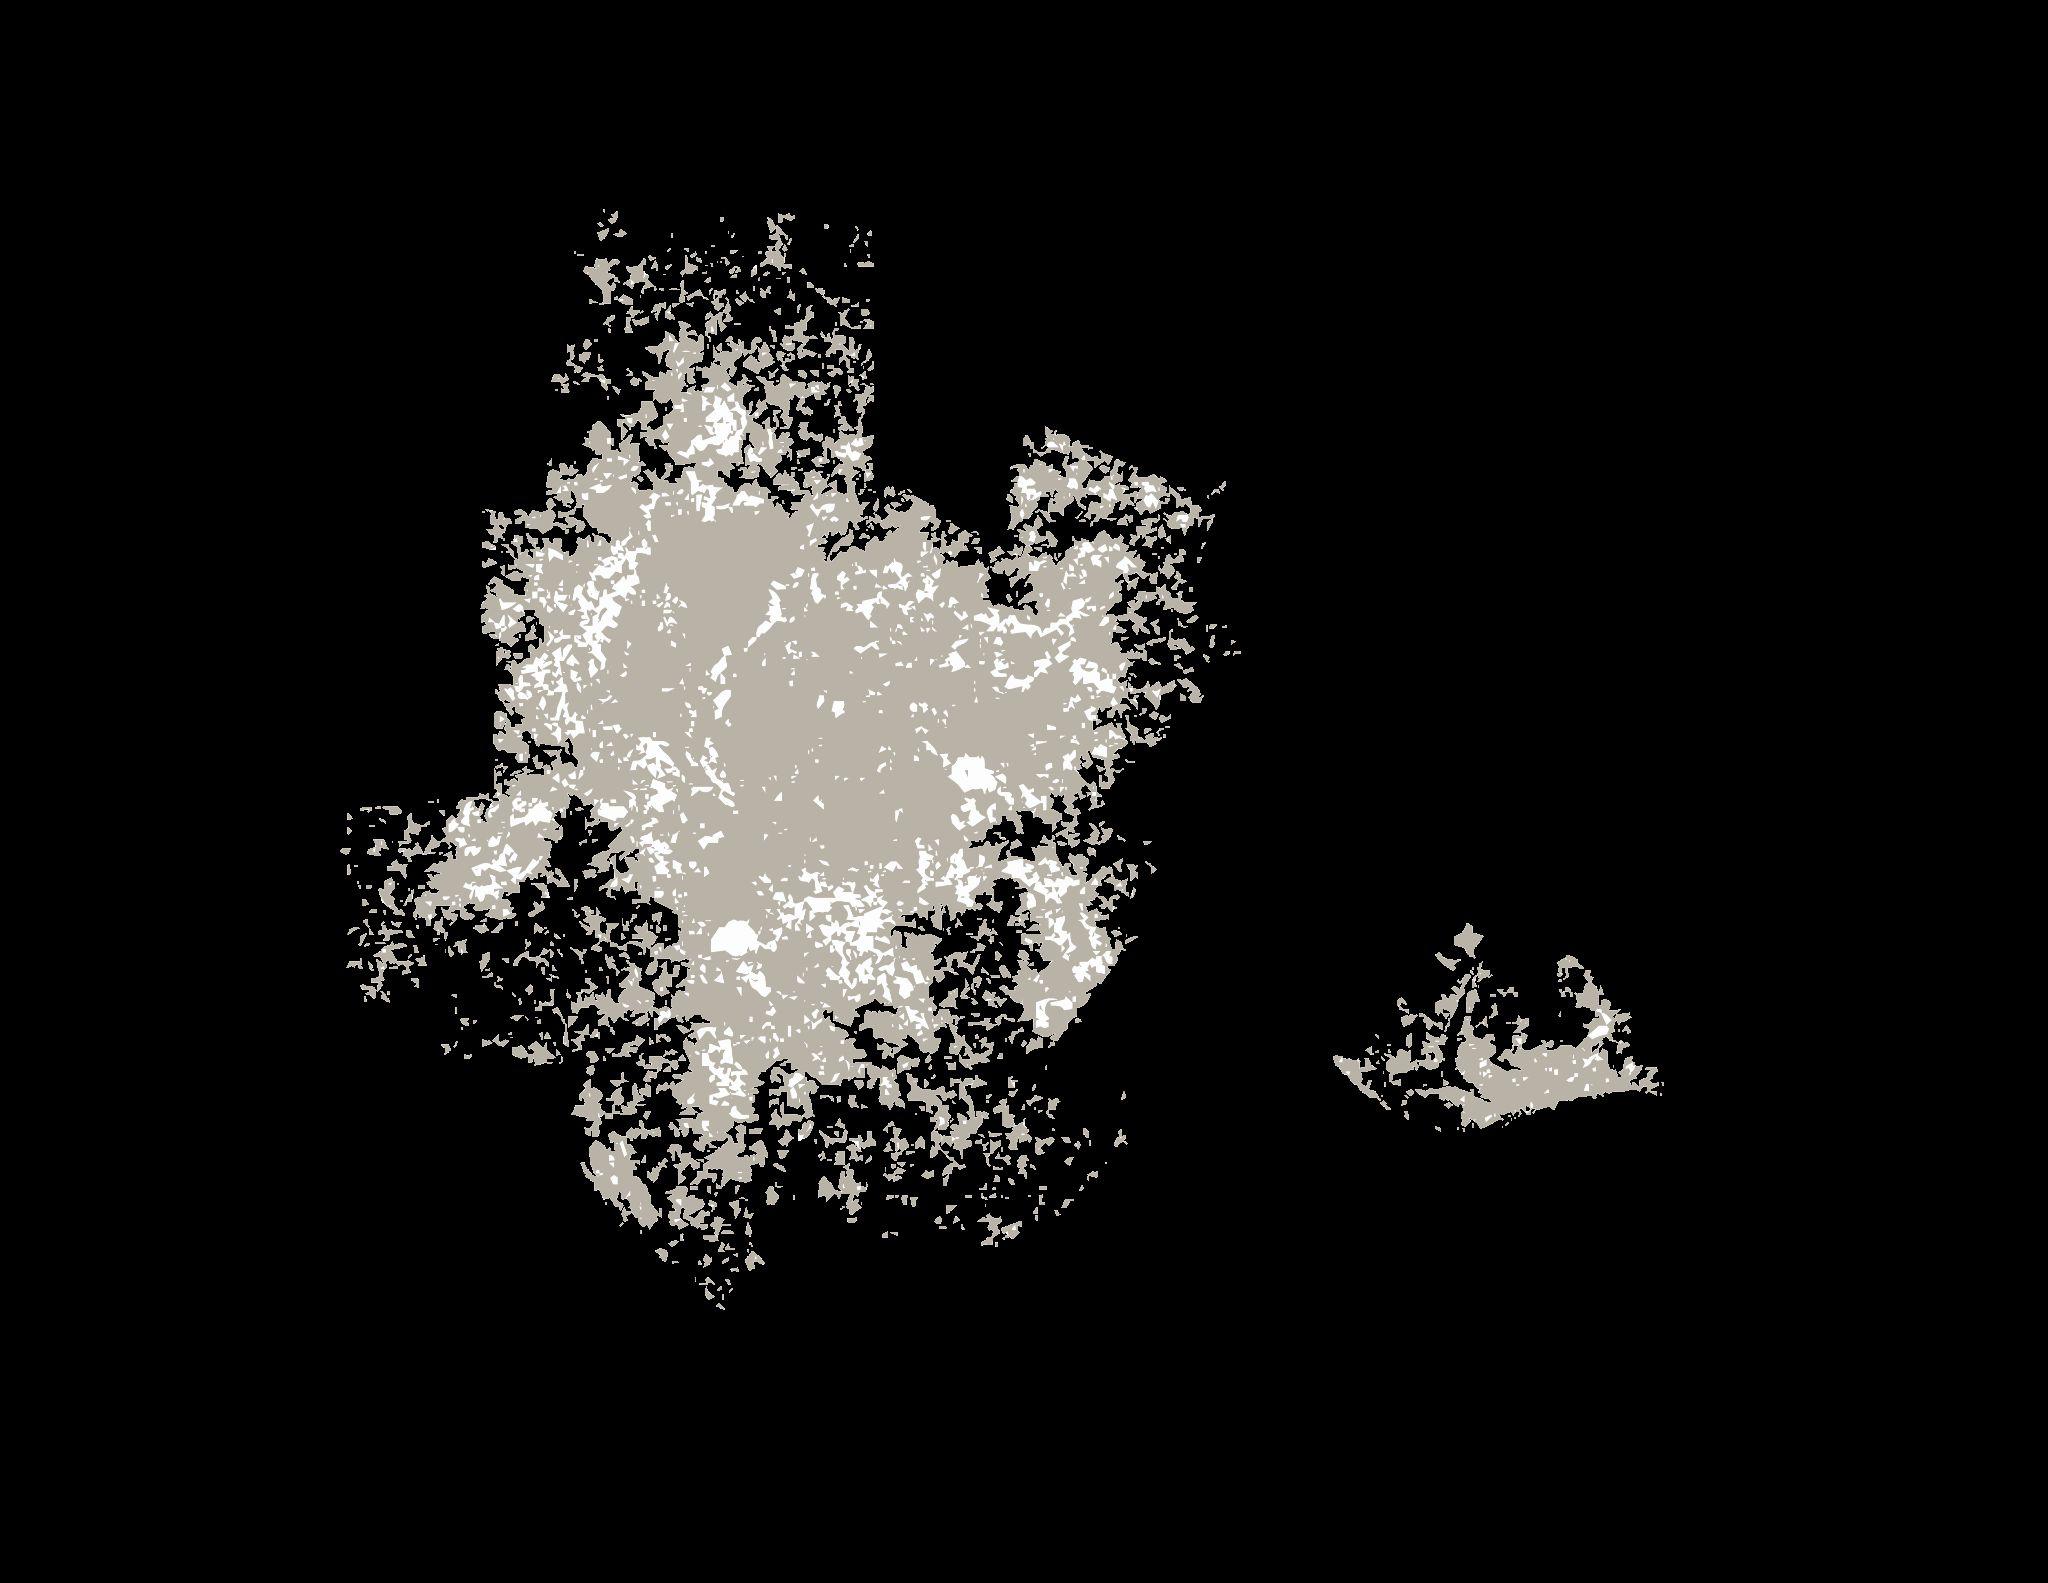
…in almost all regions across the world
In all regions except for East Asia (excluding China), urban land area growth is outpacing urban population growth.
Global percent change in urban population vs. urban area, 2000-2010
South Africa
Sources: Güneralp et al. (2020)
Johannesburg,
Shanghai, China
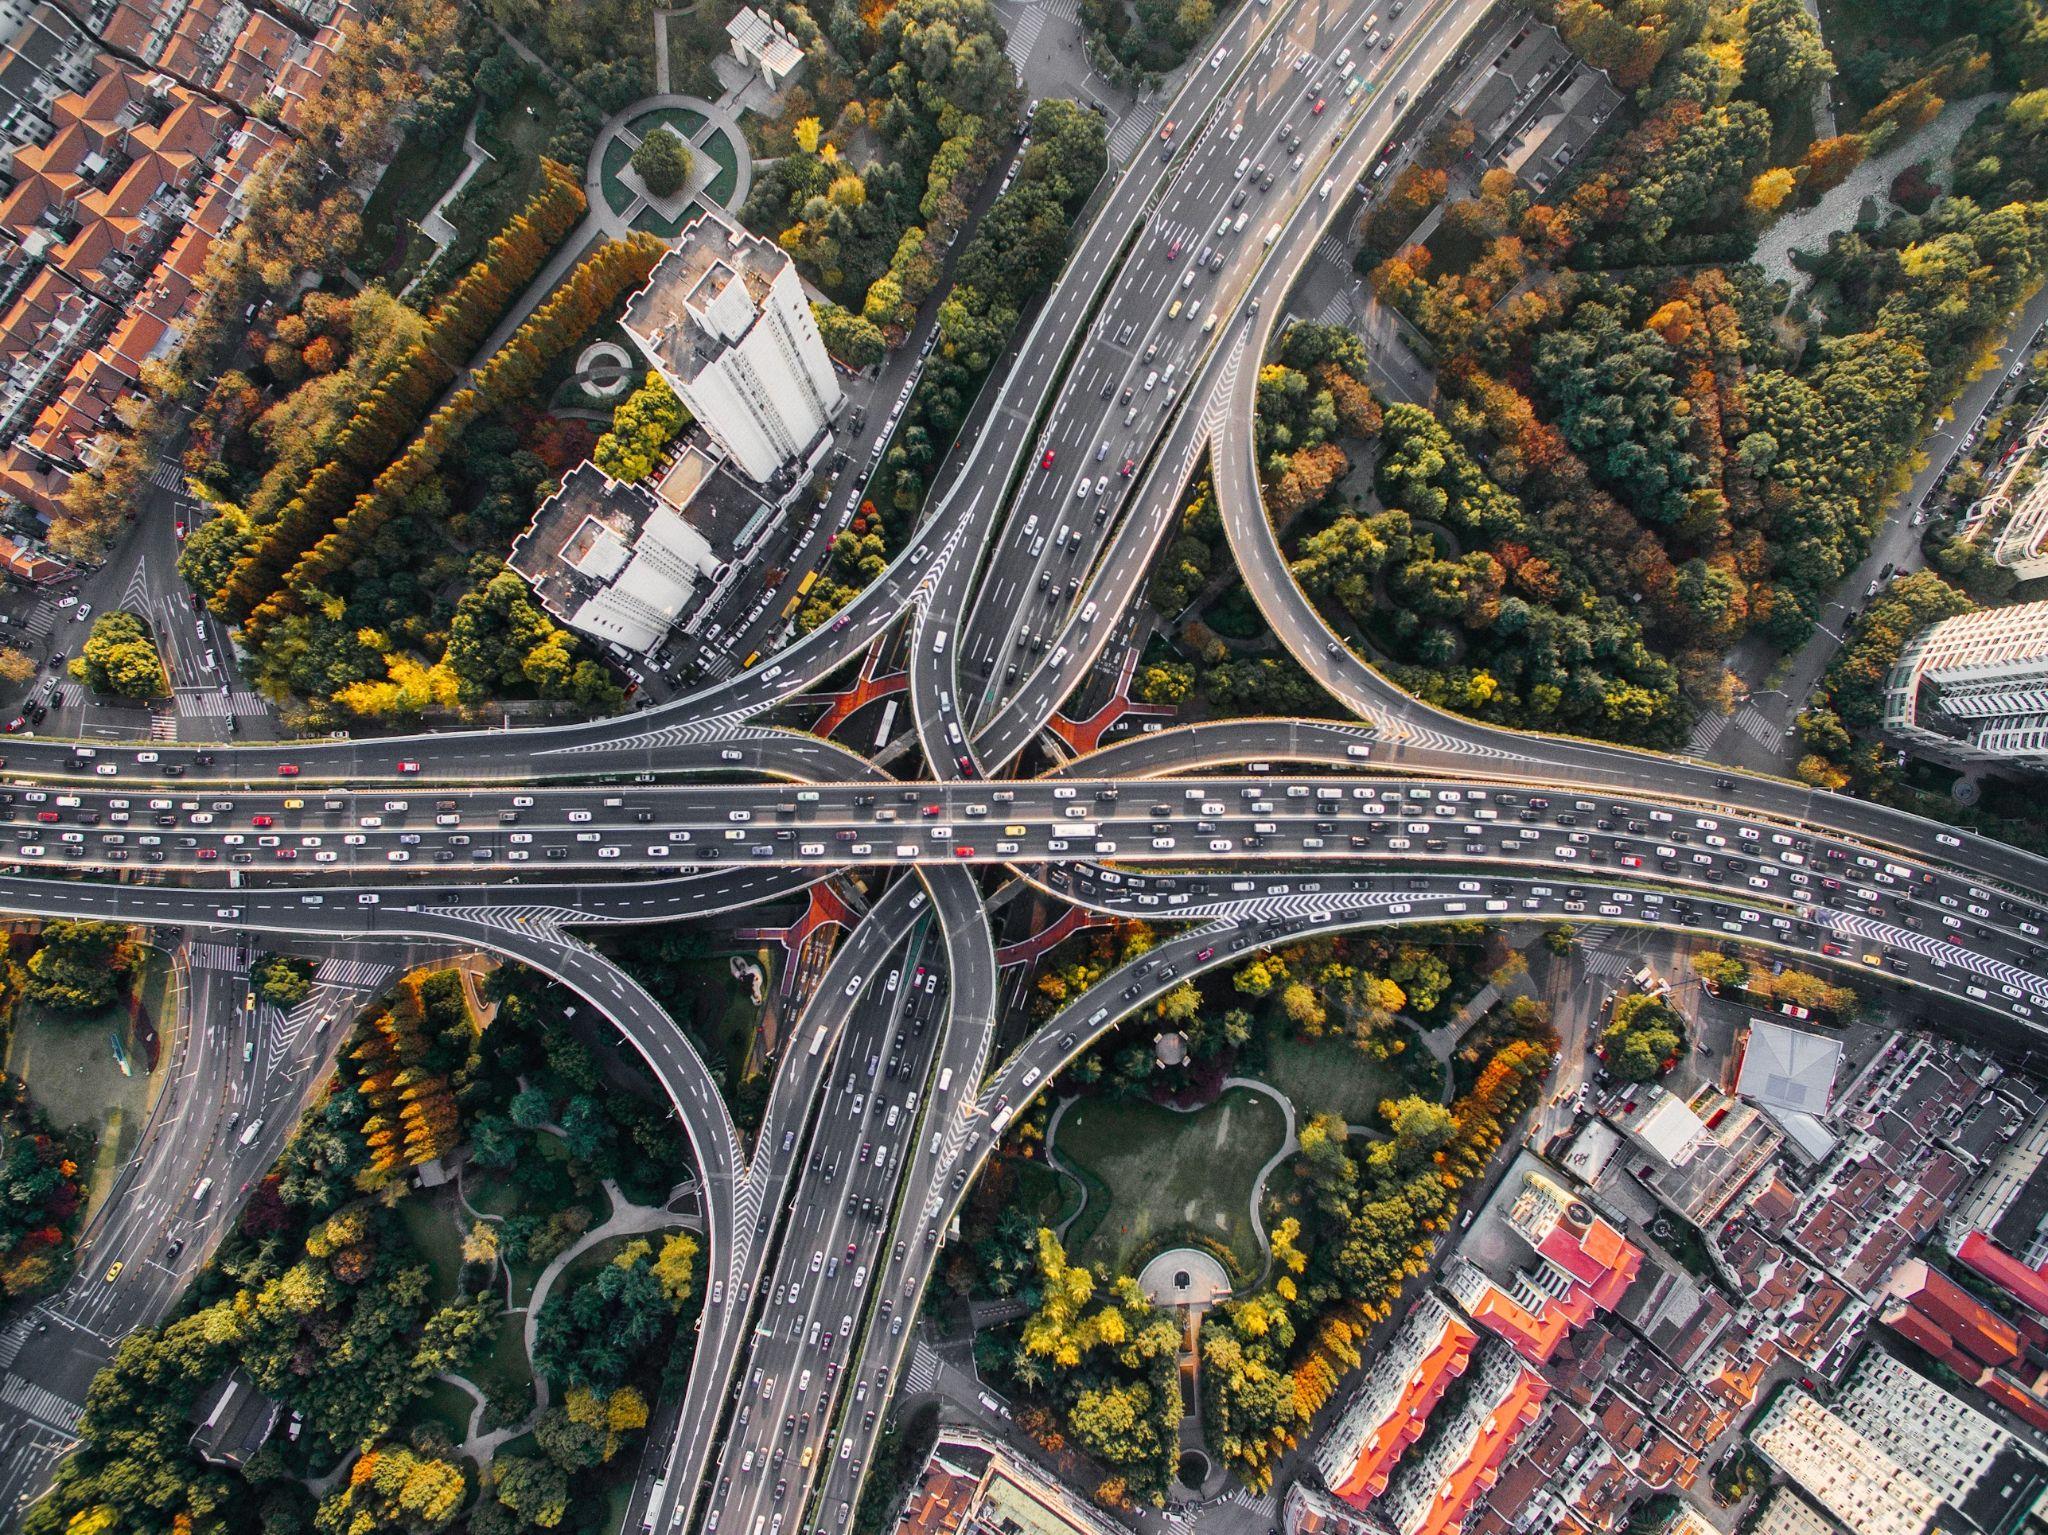
Urban form drives emissions in five main ways
Sprawl drives car dependency — and vice versa
Low-density development makes it harder to serve people with mass transit or for people to walkand bike. The more reliant we are on personal cars, the more space we need for roads and parking—leading to even more sprawl.
PKM per capita traveled by car vs. population density in cities in middle-income countries
Forum. Photos by Denys Nevozhai and Jacek Dylag on Unsplash
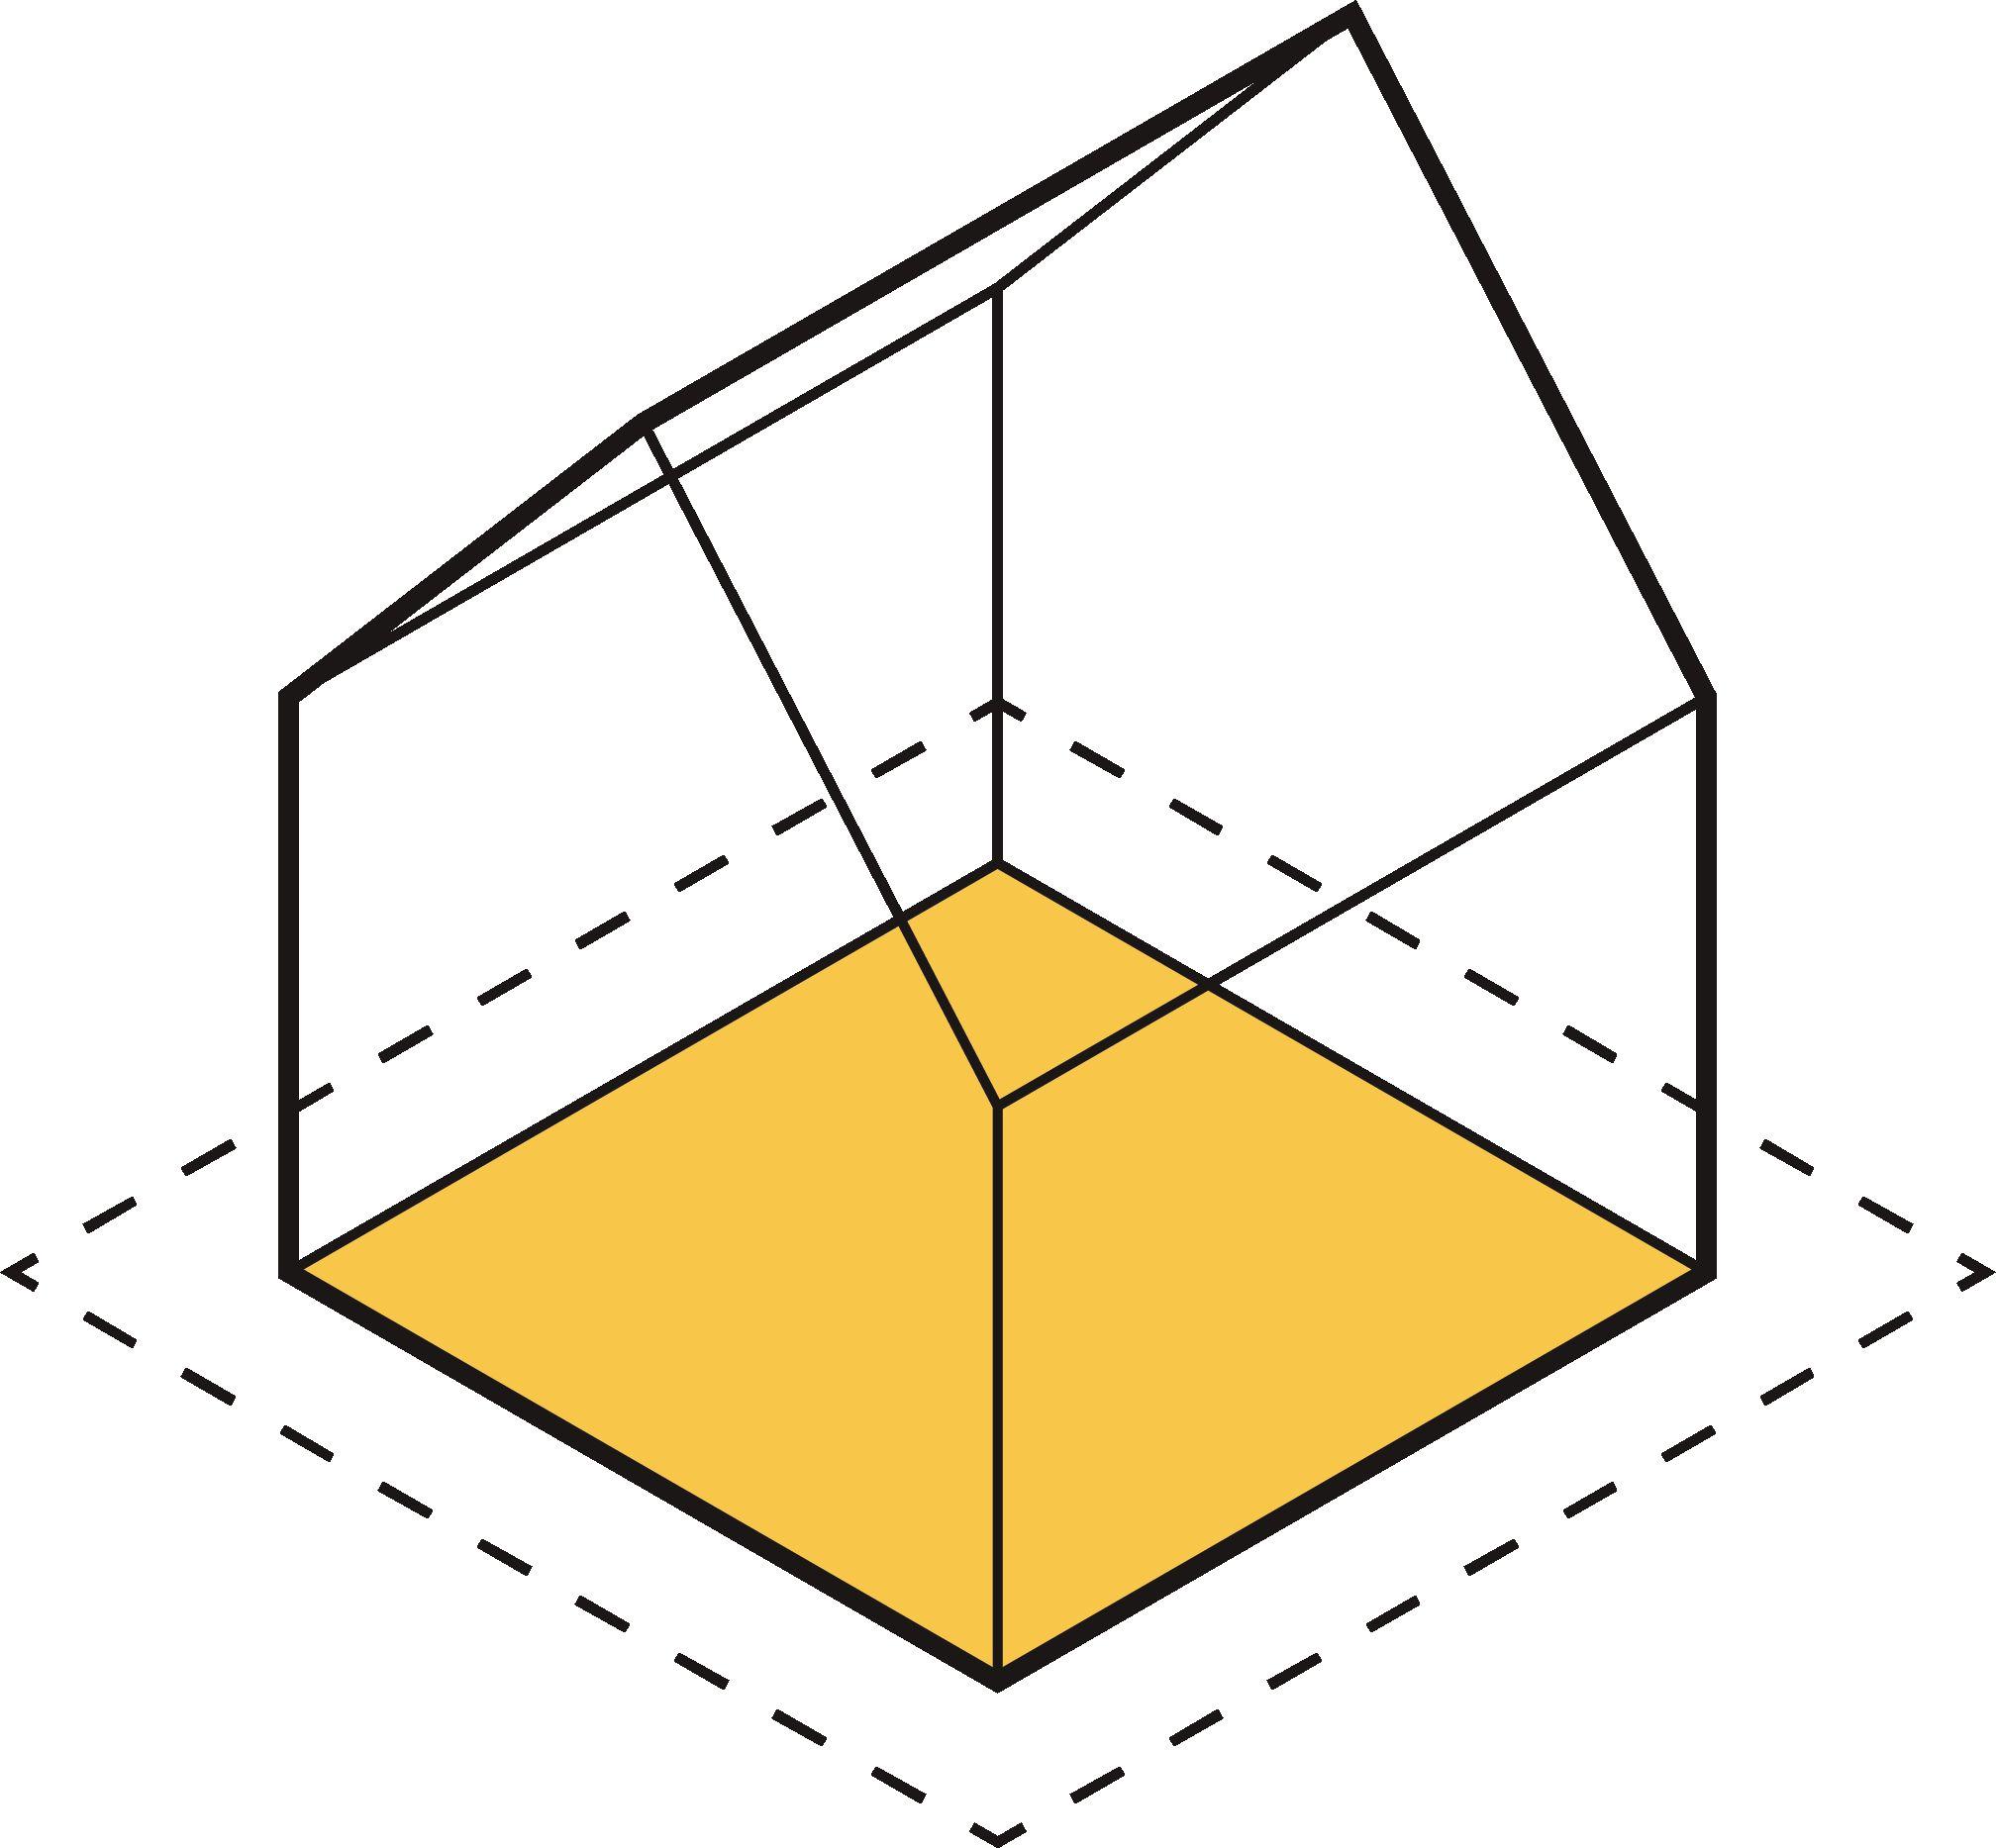
Sprawl means more material use and embodied carbon
In Canada, single family detached homes have 2x more embodied carbon than townhouses. The embodied carbon in multifamily homes would be even lower. Source: Builders for Climate Action & Passive Buildings Canada, “Emissions
Sprawl means more material use and embodied carbon
Relationship between urban area and road material stock
There is strong positive correlation between urban land area and road material stock(granular, asphalt, concrete, and cement).
London, Istanbul, and Buenos Aires all have similar metropolitan populations around 15 million - but London has 3-4x more road material stockon account of its sprawl.
Source: Rousseau et. al (2022)
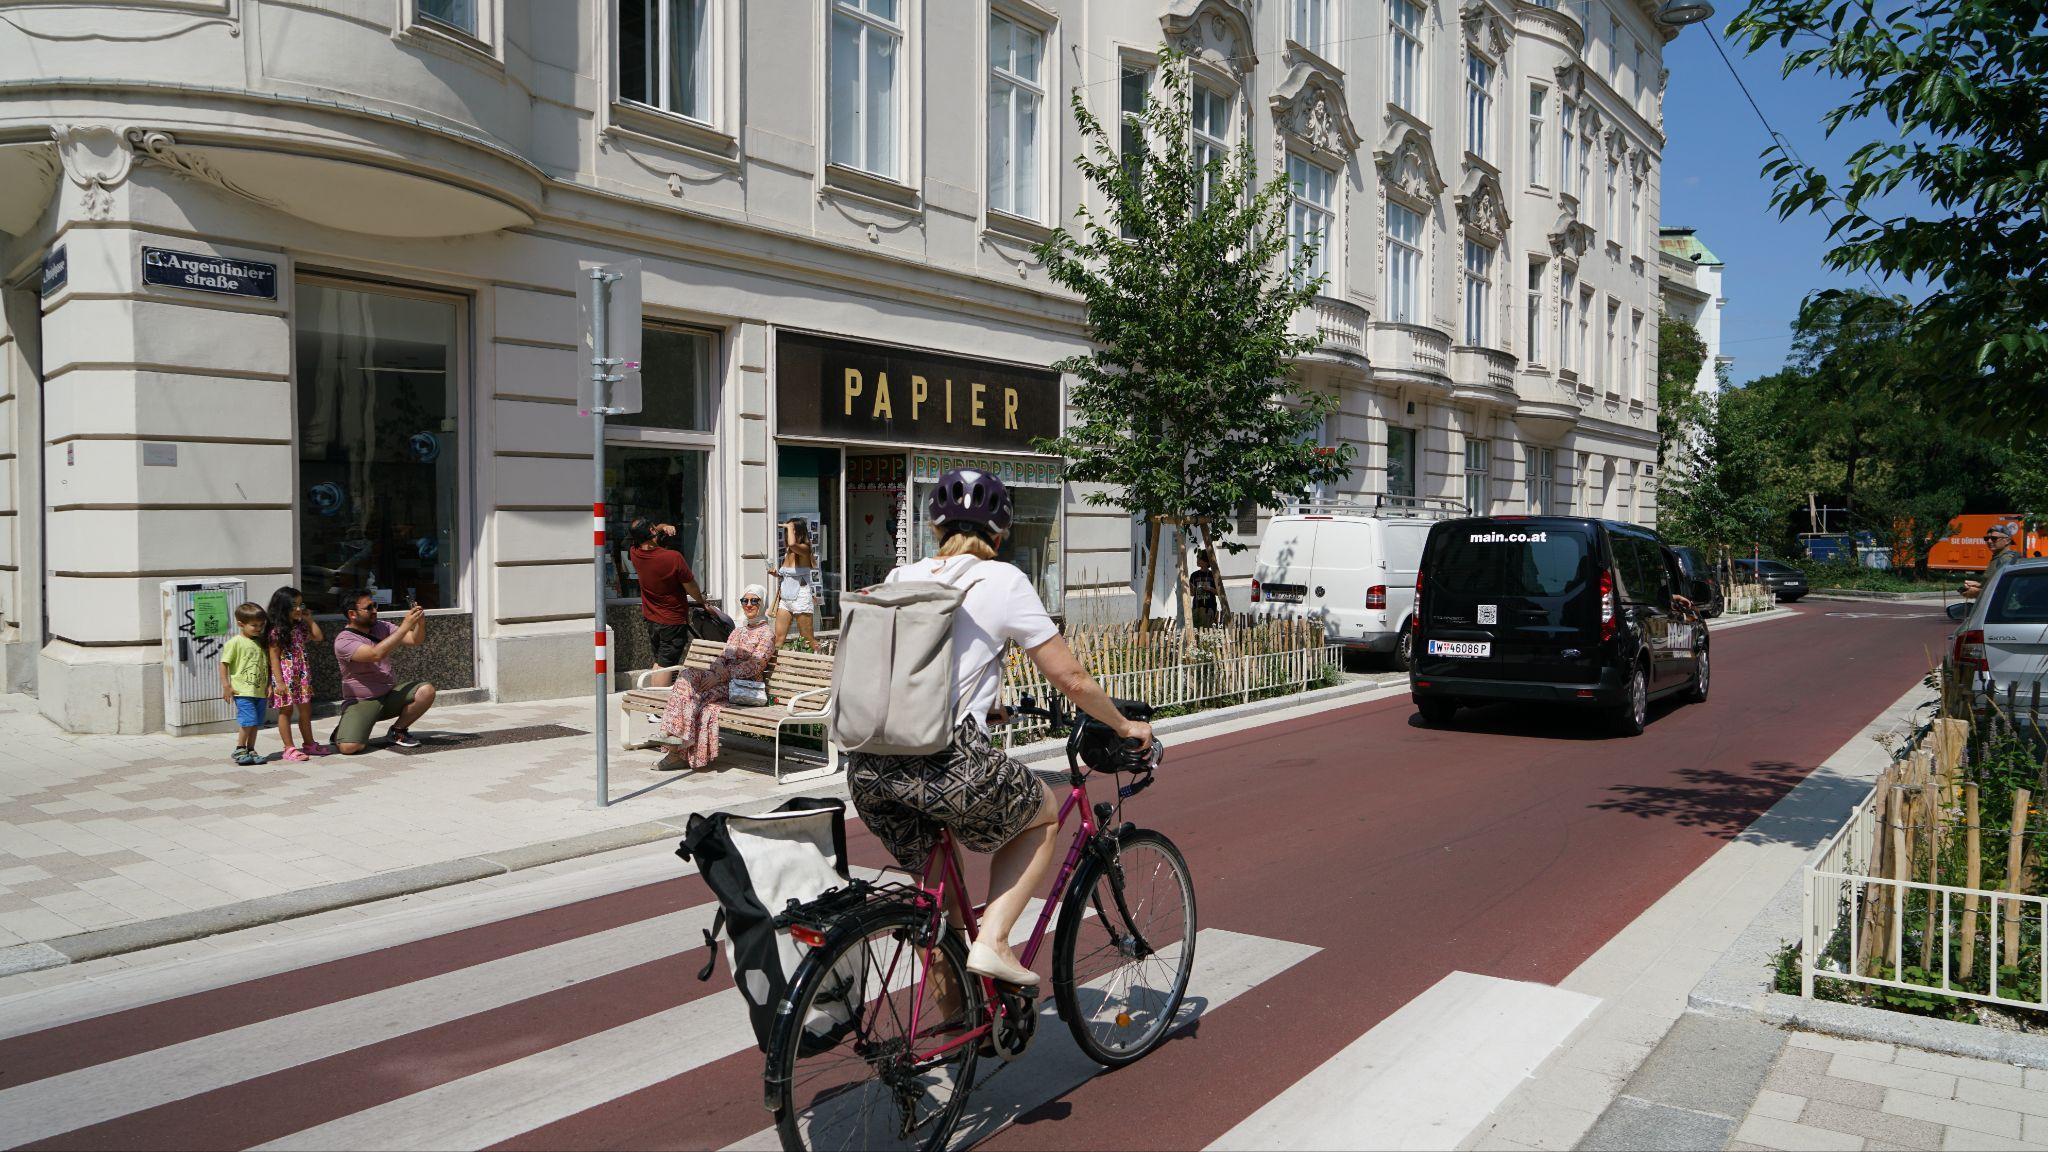
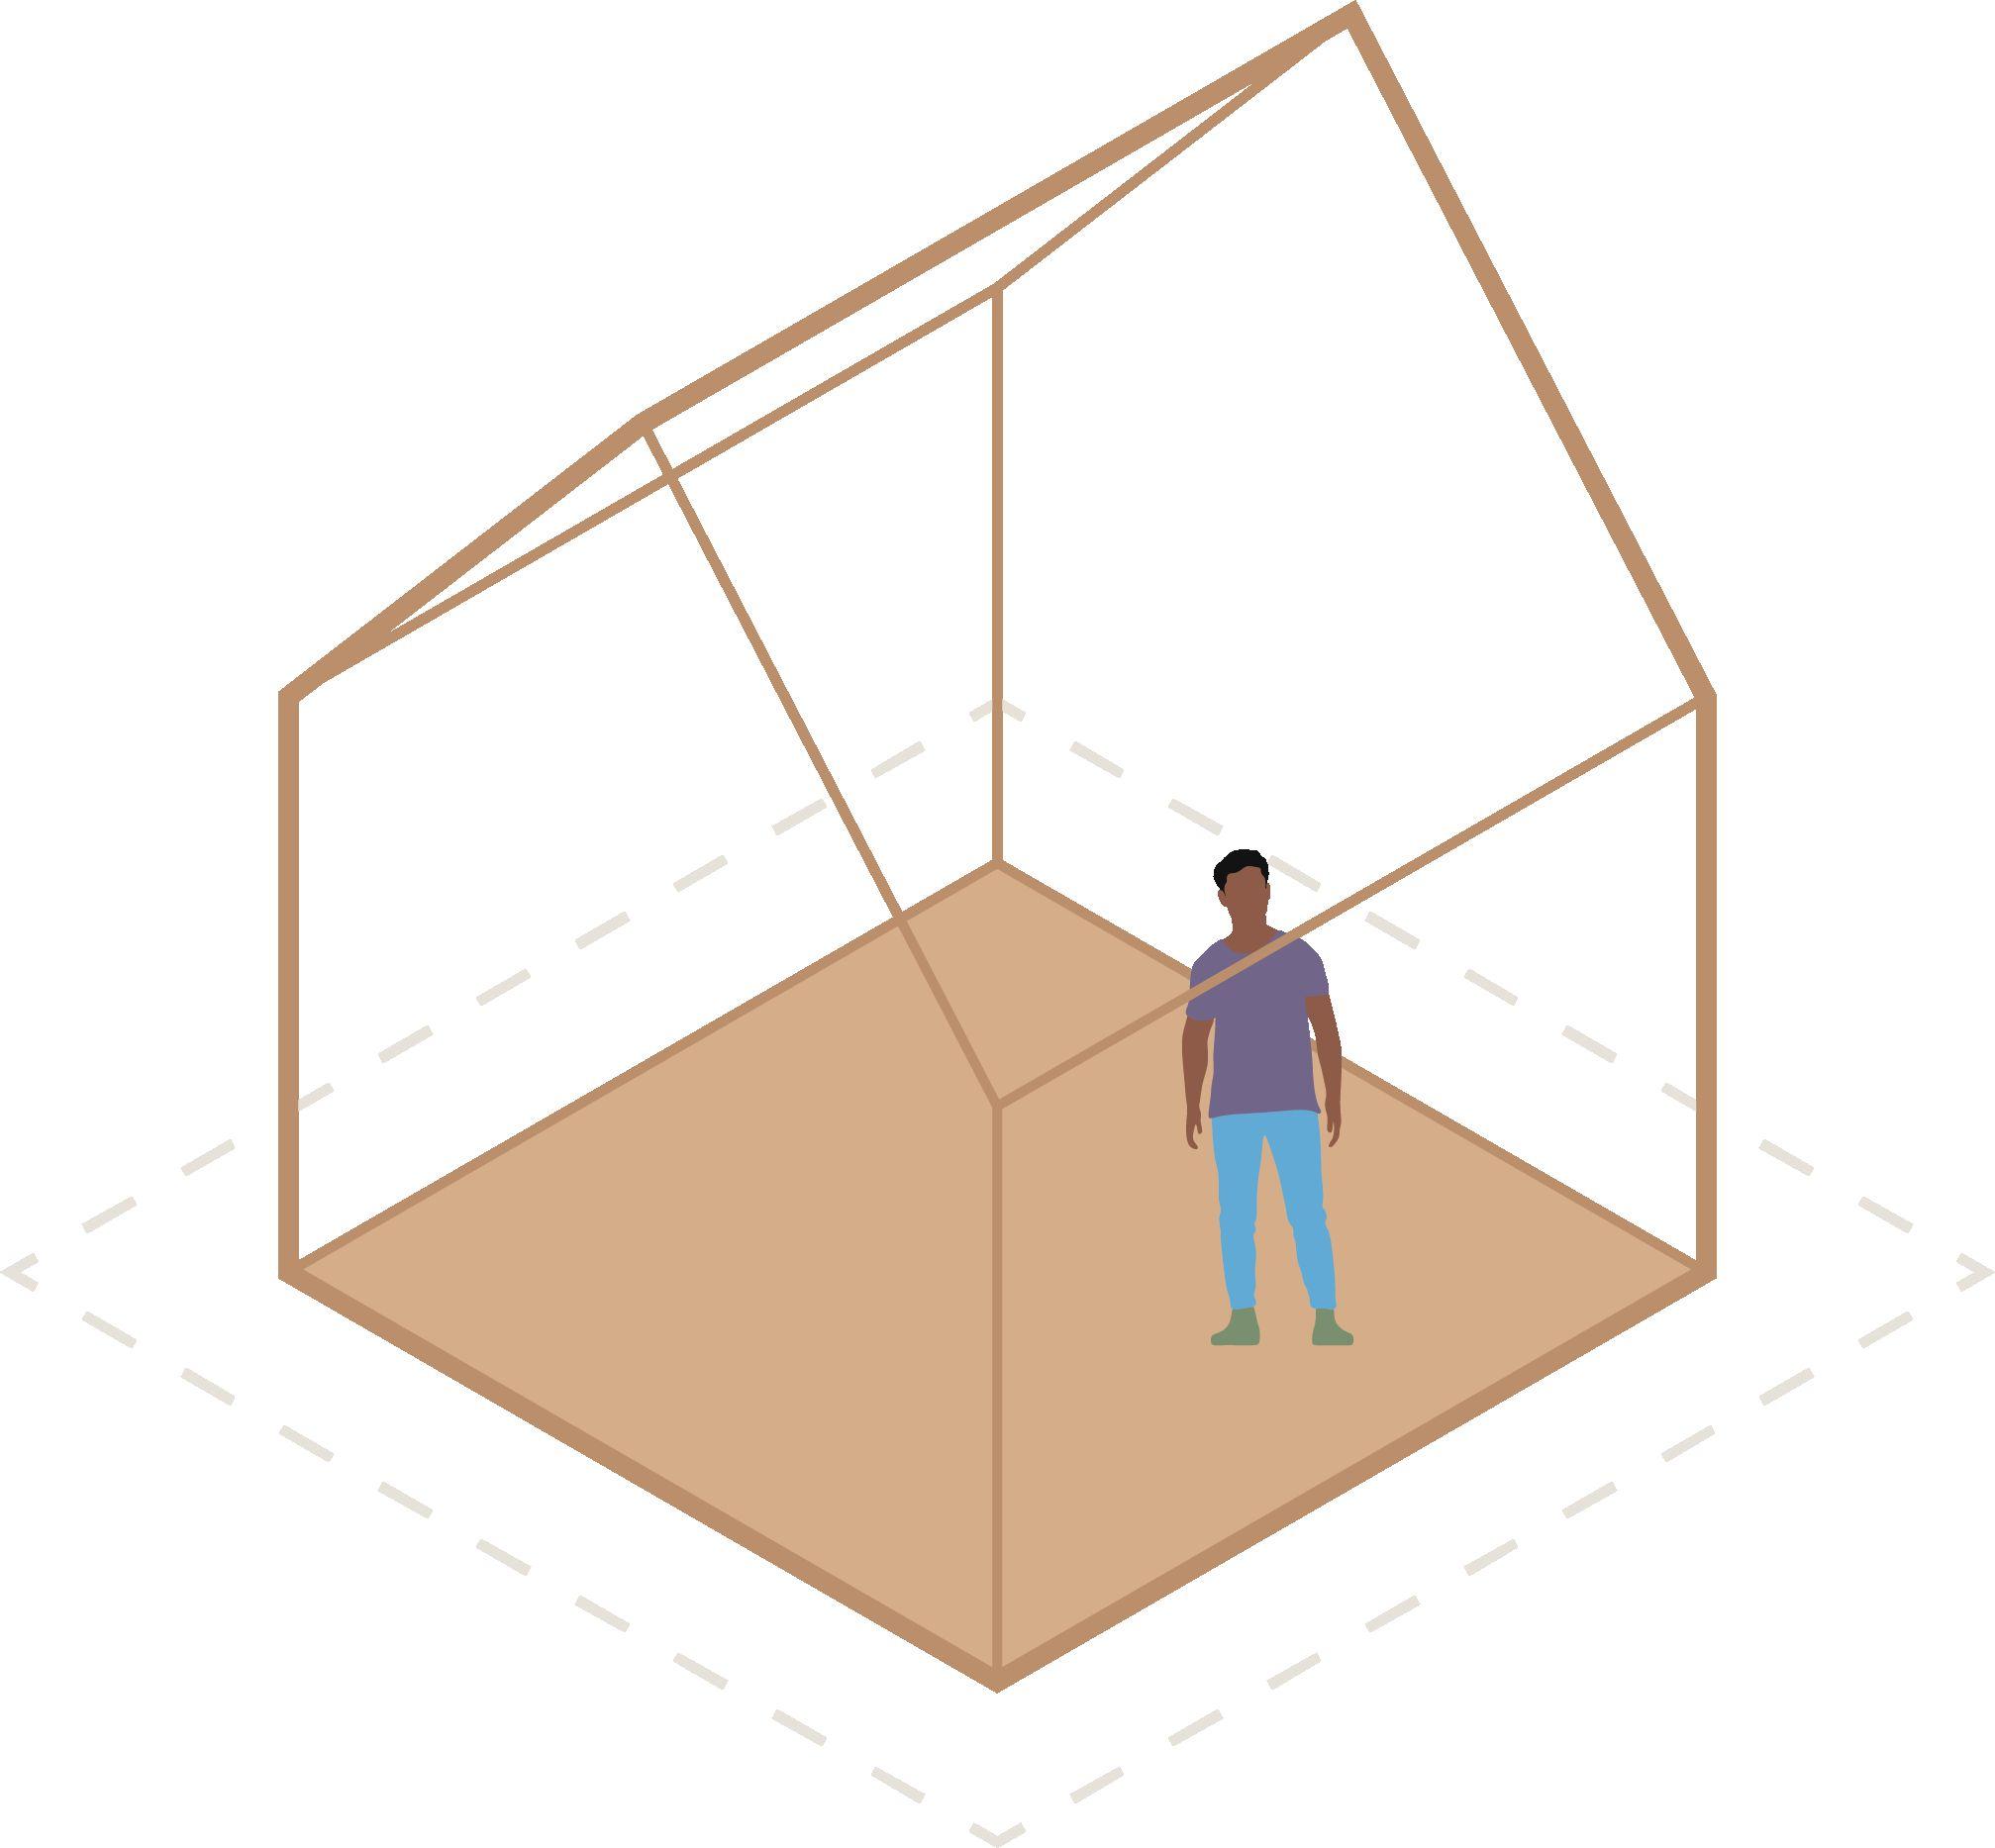
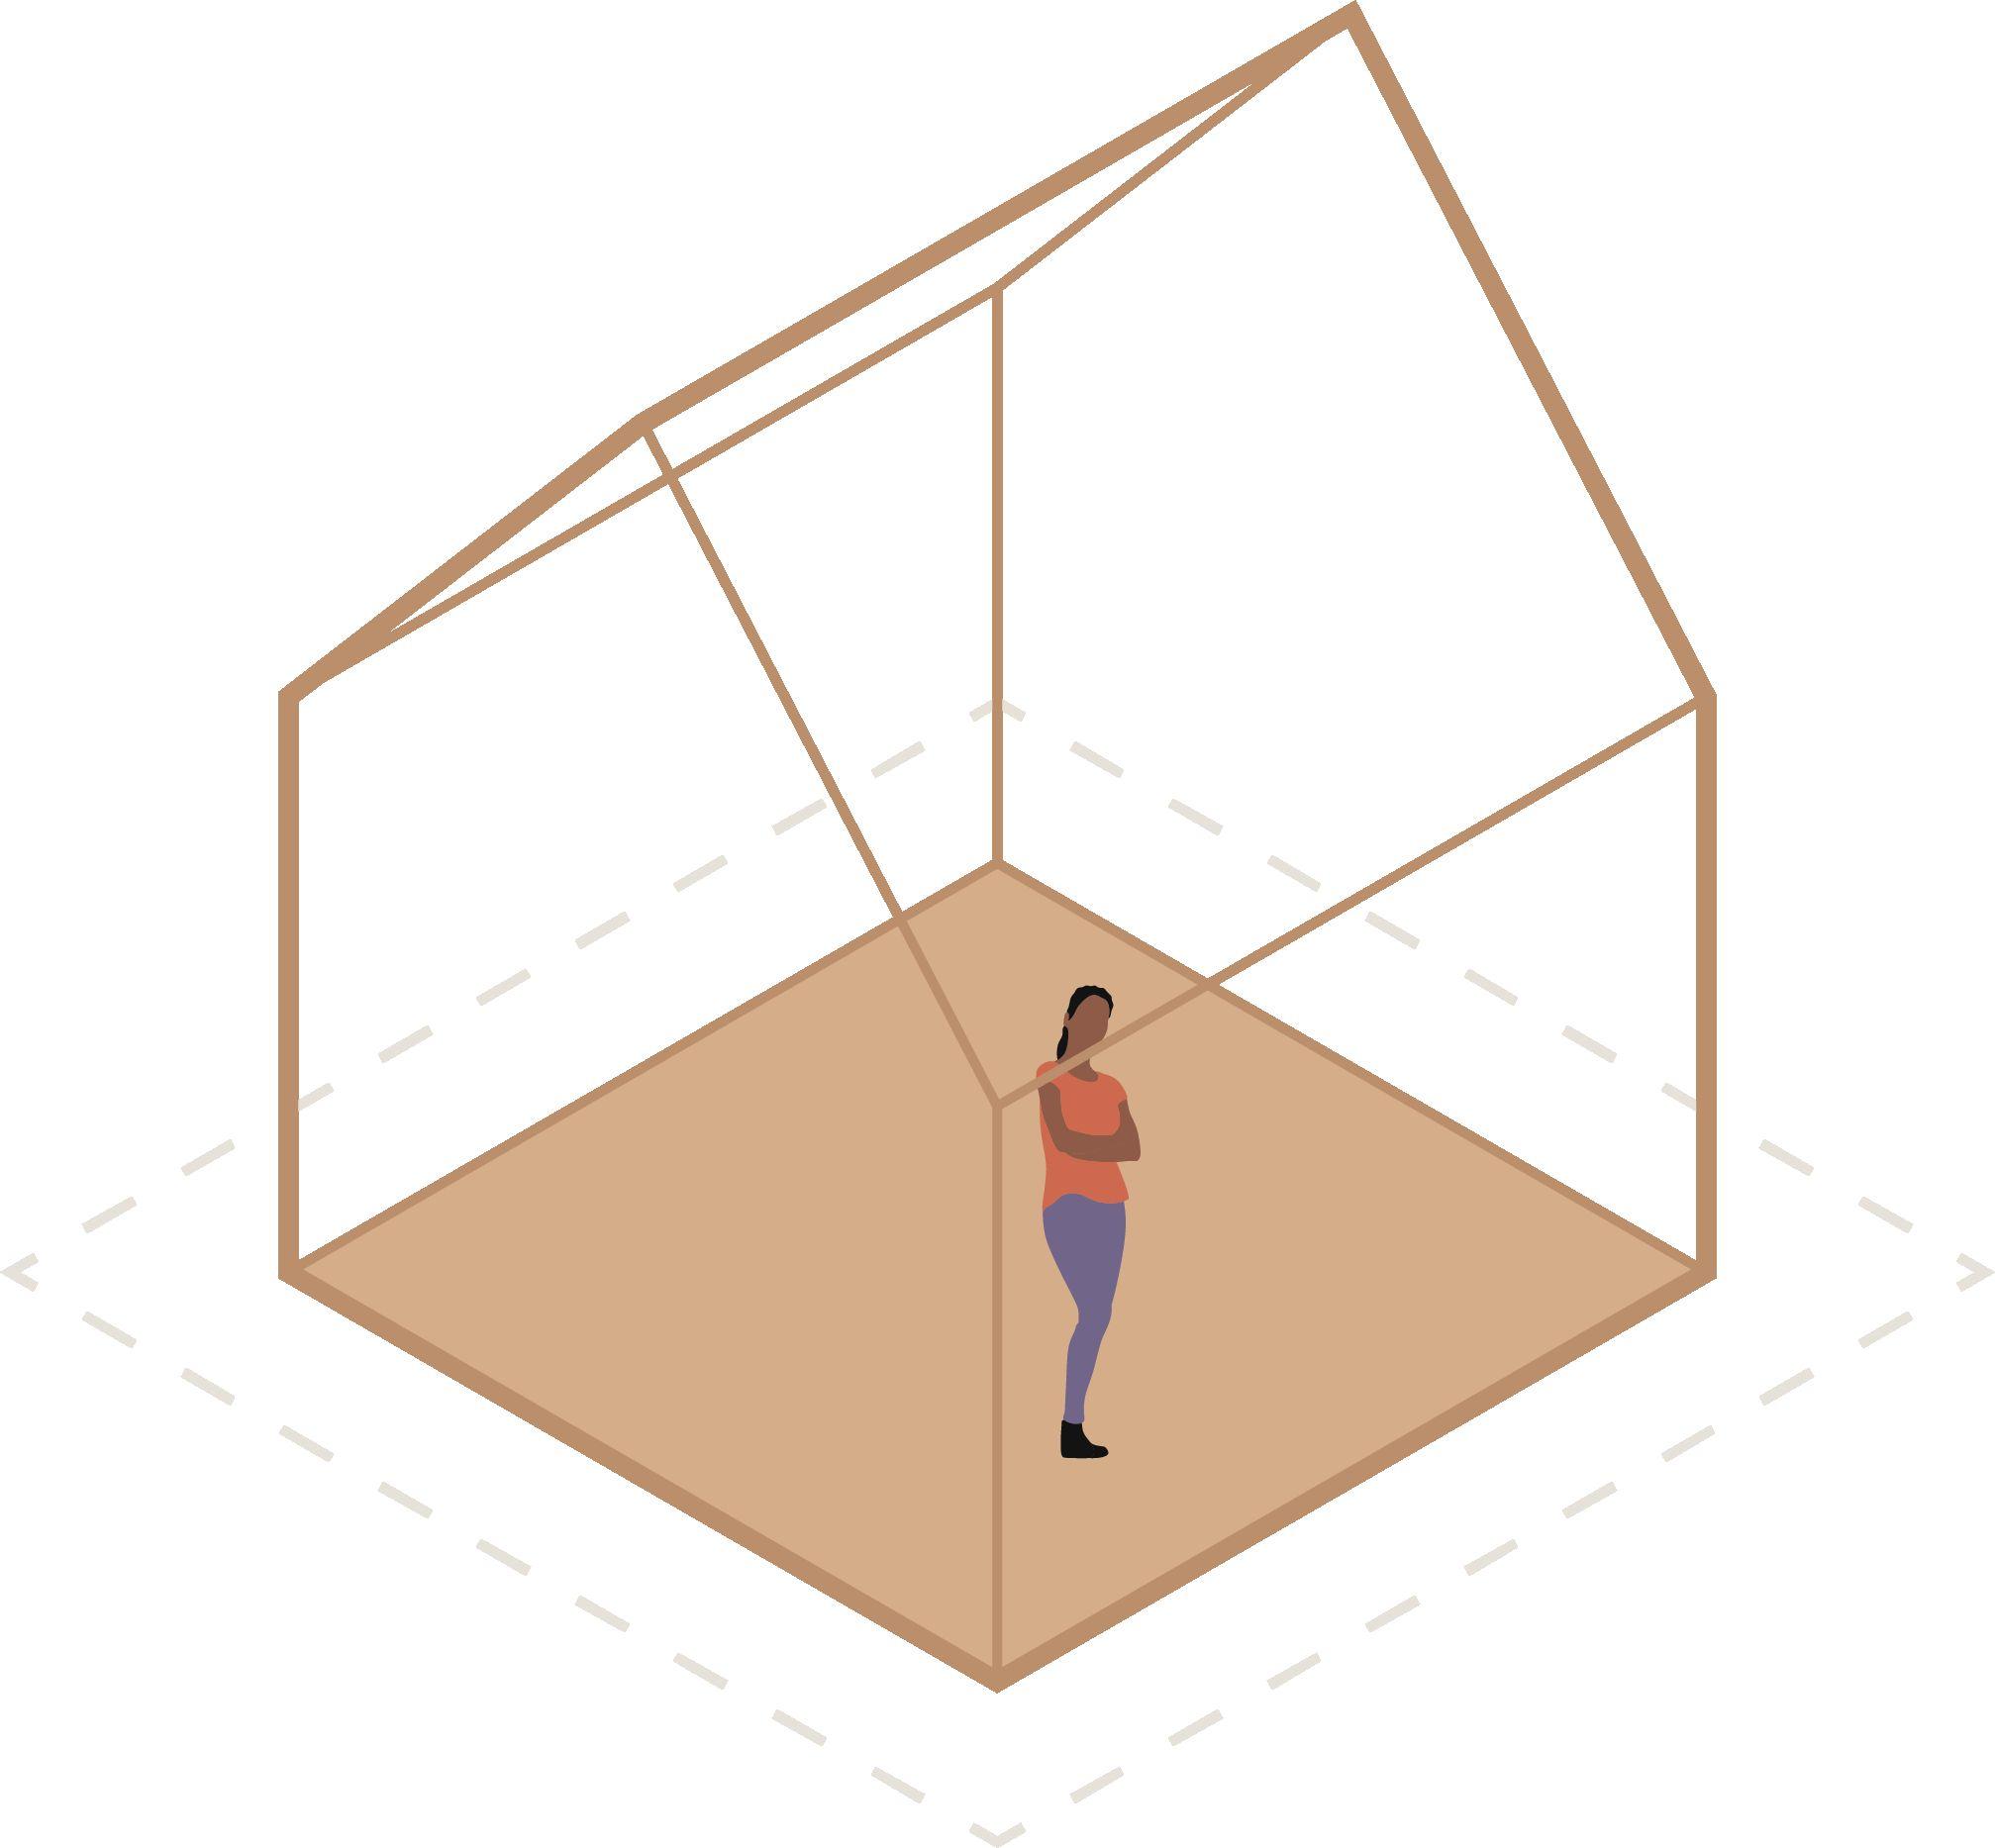
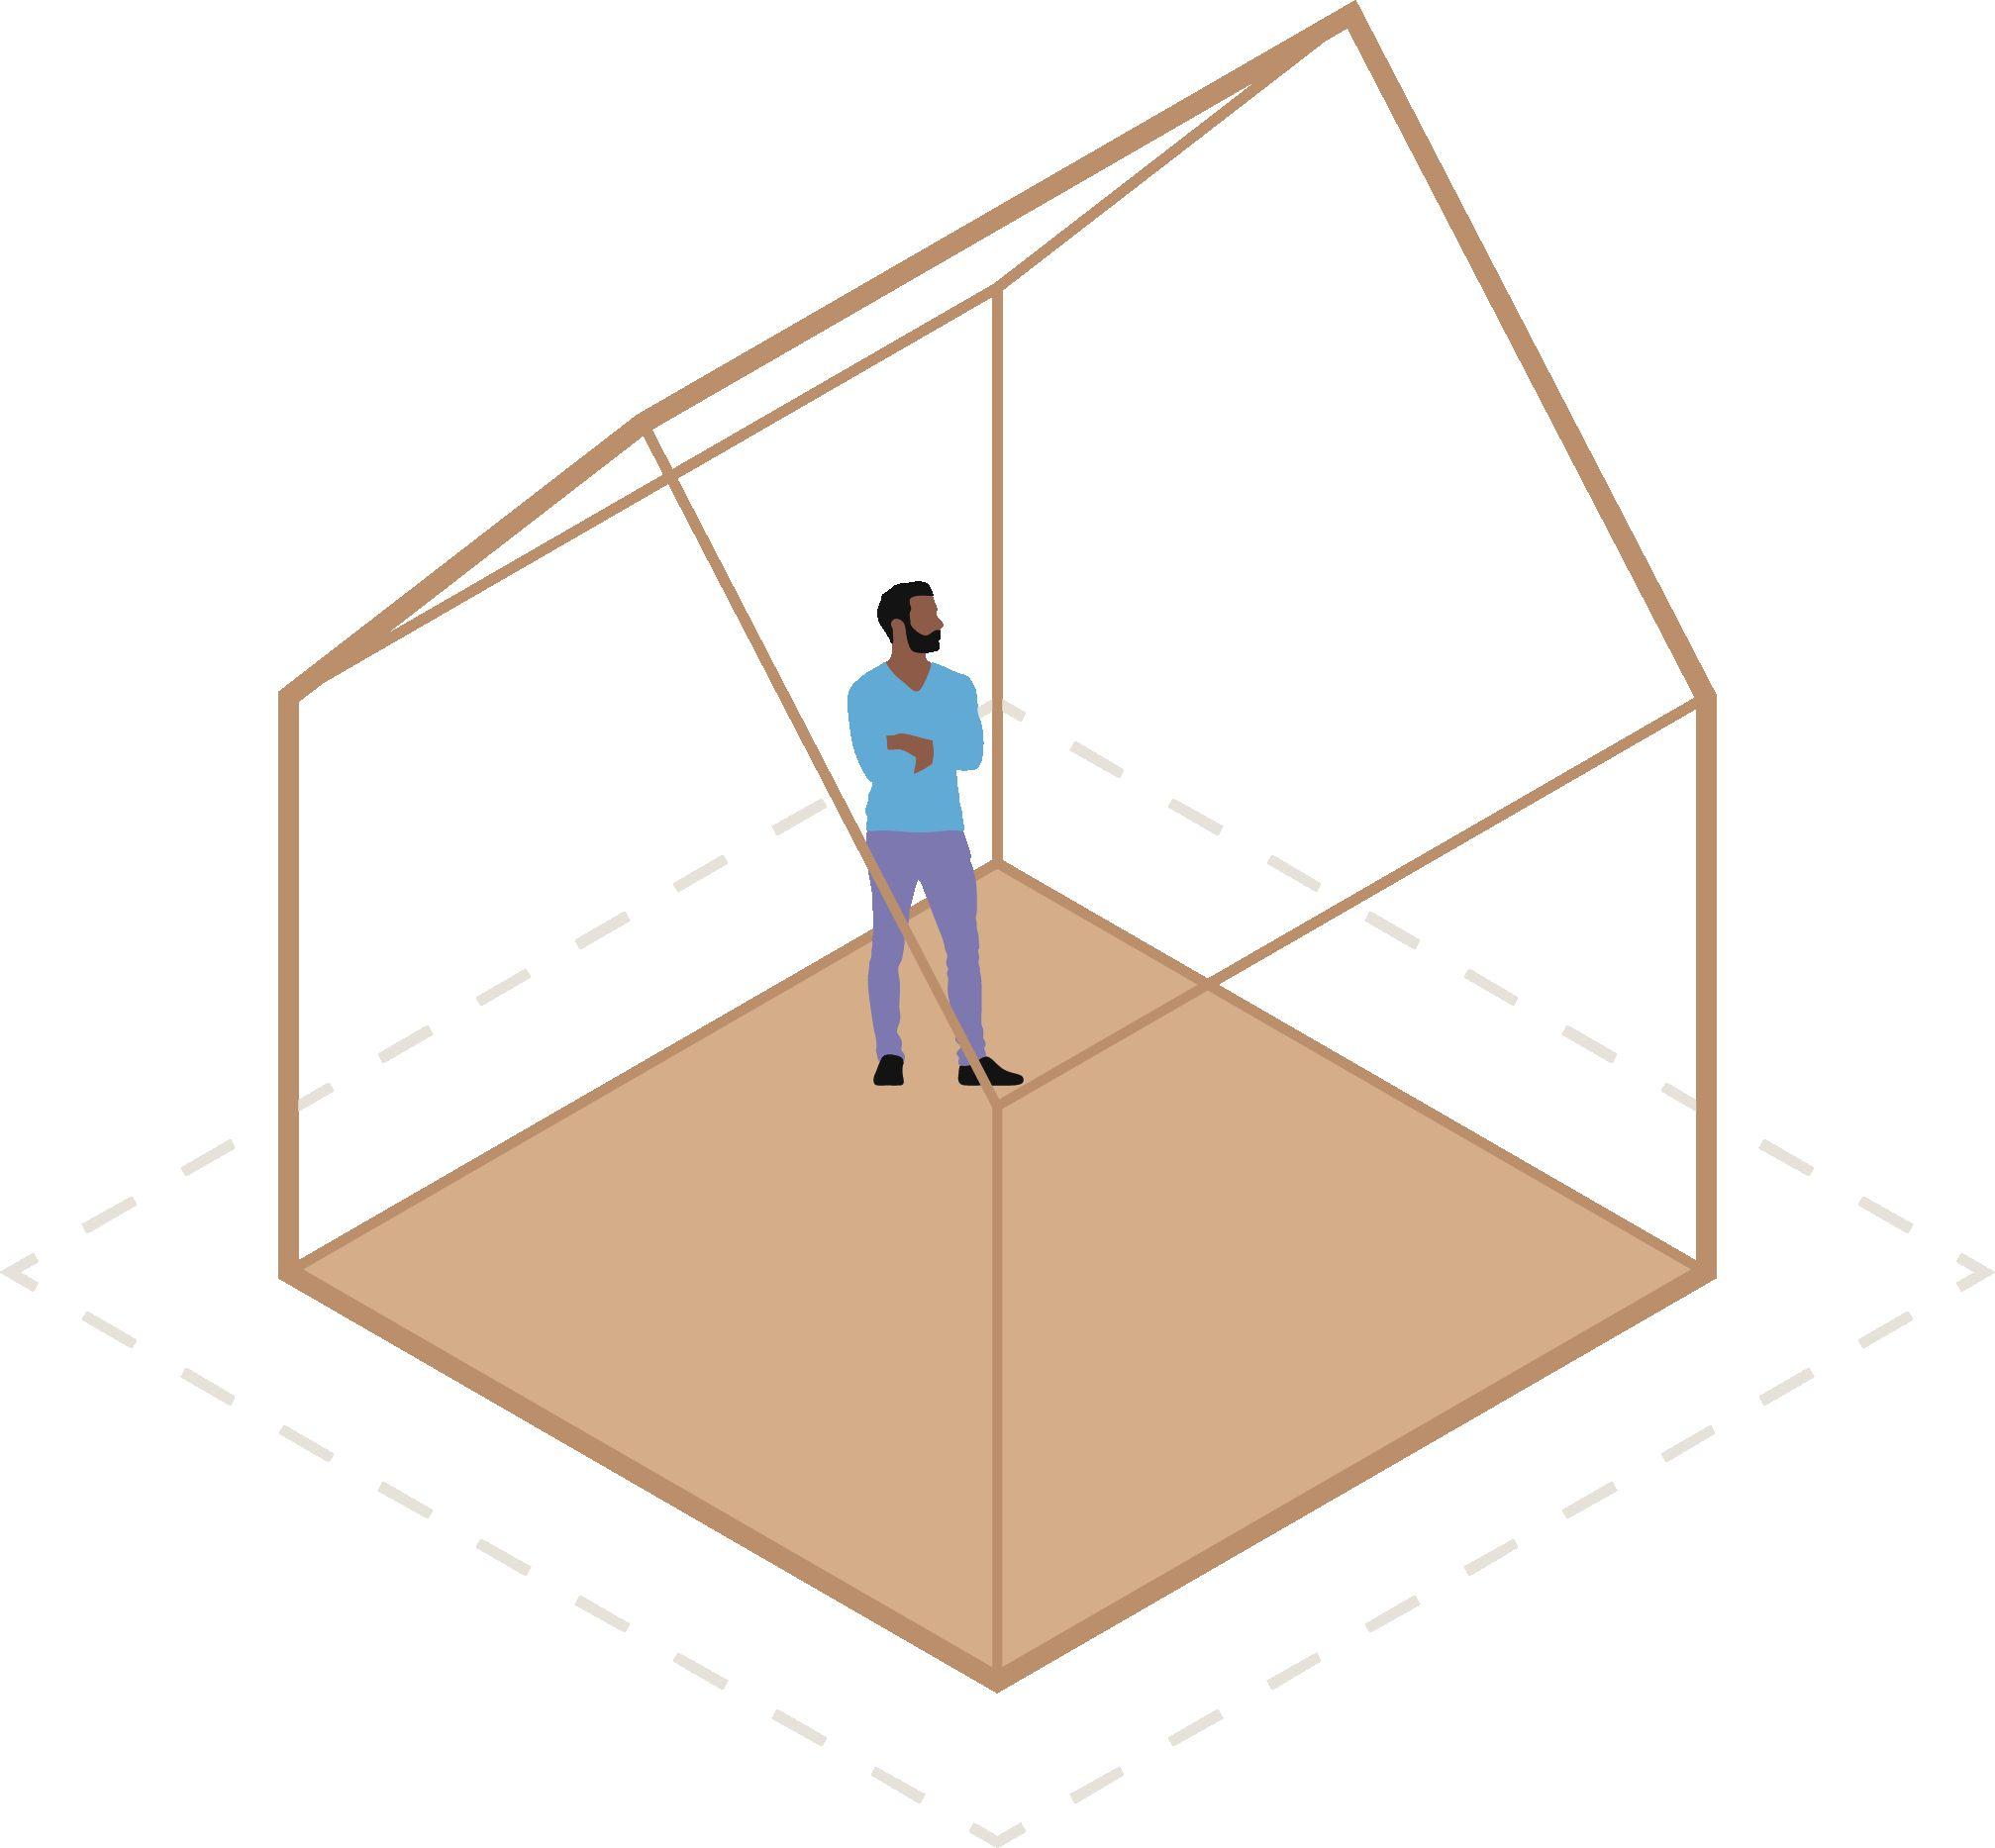
Sprawl means more energy use
In Canada, the average home has 2.5 rooms per person, compared to 1.9 in Japan.
The average American dwelling unit is at least 50 to 75 percent larger than the average European unit.
In the U.S. 47% of detached SFhomes have 2+ refrigerators compared to 6% of MFapartments with 5+ units
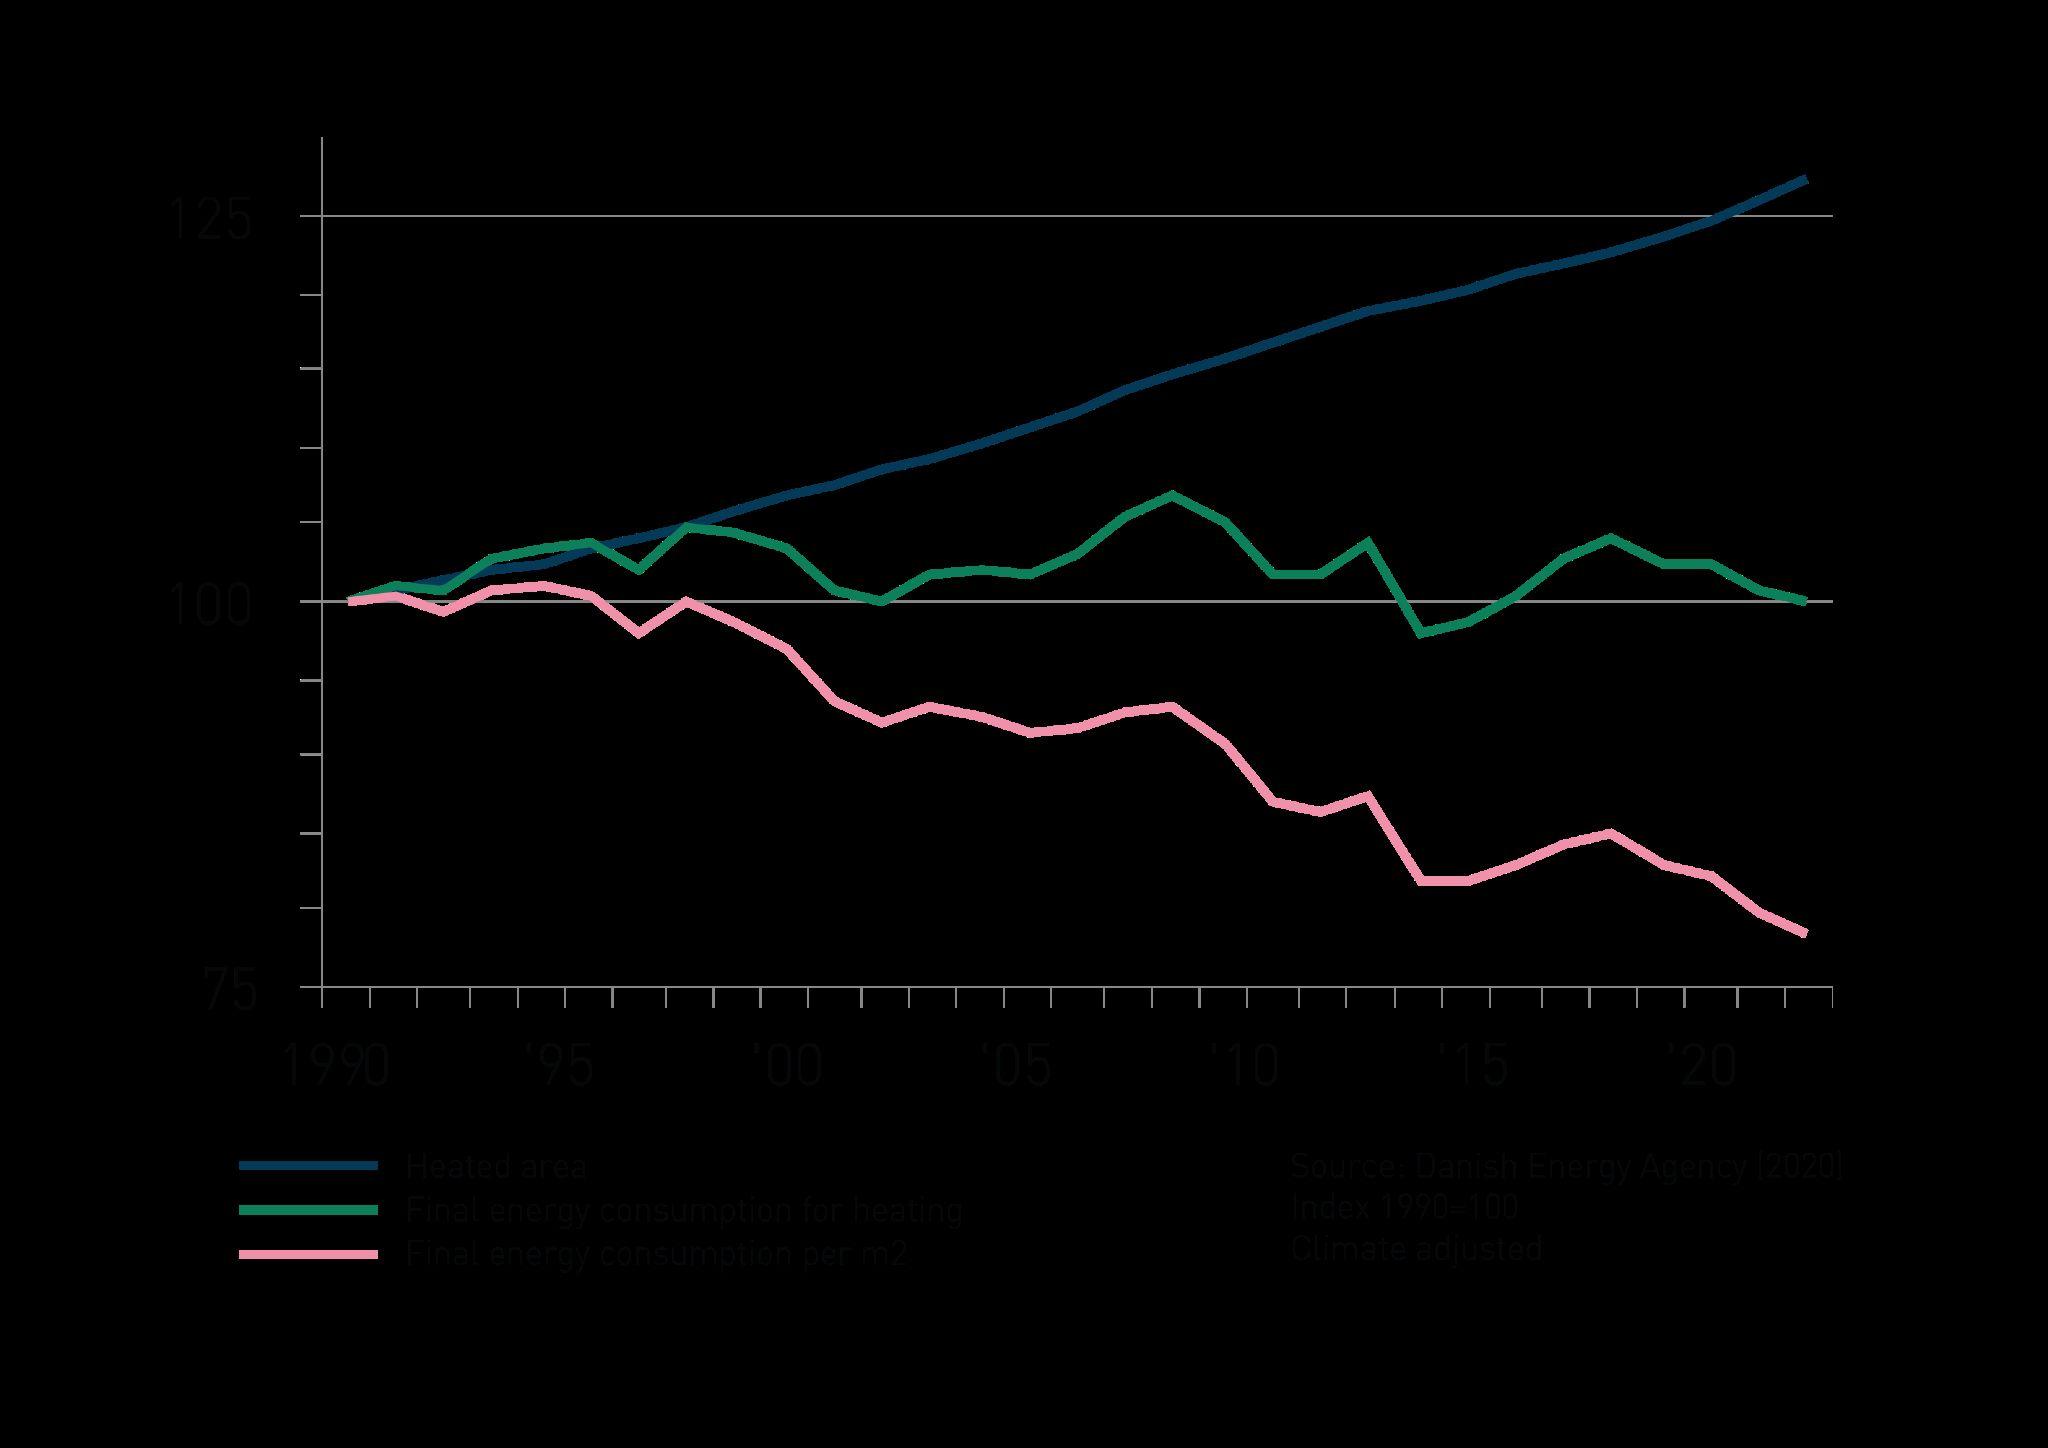
We’re becoming more more efficient on a per-square-foot basis, but not on a per-person basis
As energy efficiencies have increased, we are building bigger houses, negating the benefits that could be associated with these advancements Source:
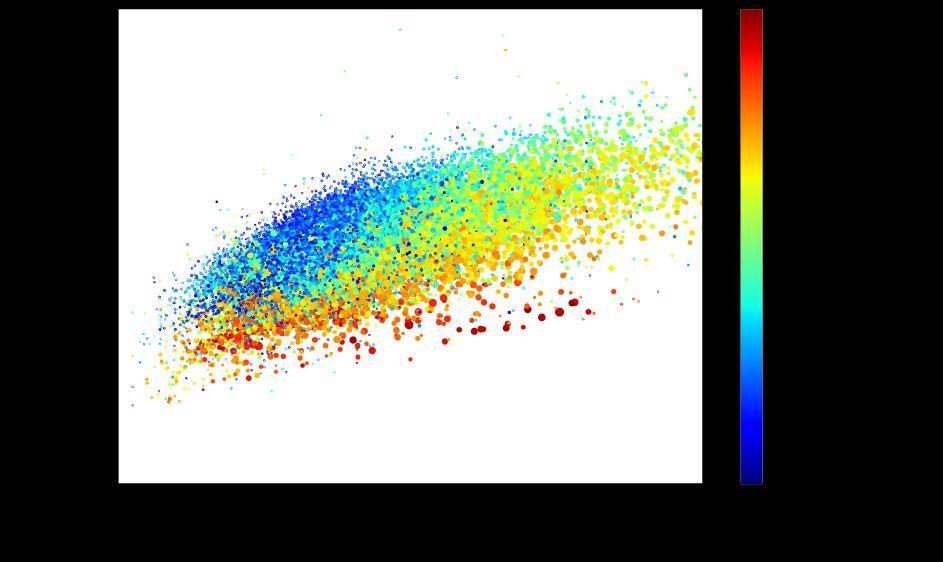
Sprawl means more food waste
More than half of food waste occurs in homes. A key contributor to household food waste is bulk purchases, which is encouraged and reinforced by bulkstores in suburban areas.The United States produces more household food waste than Germany, France, and the United Kingdom combined. Food waste is typically lower in urban areas where smaller and more frequent purchases are possible.
The effects of urban population density on annual food waste per person
Sources: NRDC, Feeding A City: Food Waste and Food Need Across America; Forbes, “The Enormous Scale Of Global Food Waste”; ReFED, “Where does Food Waste Occur?”; PBS SoCal, “Buying in BulkCreates More Waste”, Eurostat, “Food waste per capita in the EU remained stable in 2021.”
Each dot represents a city in the United States
Percapita food waste (lbs/person) EU average: 290 lbs
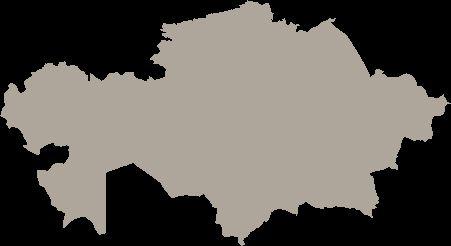
Sprawl means forest
loss
Urban expansion has already caused direct and indirect losses of 1% of forests and shrublands. Continued expansion threatens another 5-8% of remaining forestland through 2050.
Direct and indirect forest and shrubland loss from urban expansion, 2024-2050 (million ha)
Business-as-usual sprawl
(Urban land expansion = 2x urban population growth)
260 million hectares roughly the size of Kazakhstan
Steady-state density
(Urban land expansion = urban population growth)
130 million hectares roughly the size of Peru Efficient
of Myanmar
Sources: RMI analysis based on Peng Gong et al., “Annual maps of global artificial impervious area (GAIA) between 1985 and 2018,” January 2020; Jasper van Vliet, “Direct and indirect loss of natural area from urban expansion,” August 2019; Karen Seto et al., “Global forecasts of urban expansion to 2030 and direct impacts on biodiversity and carbon pools,” September 2012; and Our World in Data, “Urbanization,” 2024.
If sprawl drives emissions, then achieving better urban form is one of most powerful things we can do for the climate
Urban infill is one of the top three climate action levers within local government control across many California jurisdictions, including—in addition to San Francisco—Los Angeles, San Diego, and Sacramento.
GHG Reduction Potential in 2030 from Local Policies, San Francisco
In San Francisco, infill development is 2x as impactful as the next-best method to reduce emissions.
Source: CoolClimate Network, California
The relationship between urban form and emissions holds across income levels
A household with $80Kin annual income could account for 20t CO2e/year or 80t CO2e/year—depending on where they live.
Source: RMI analysis based on UC Berkeley CoolClimate data.
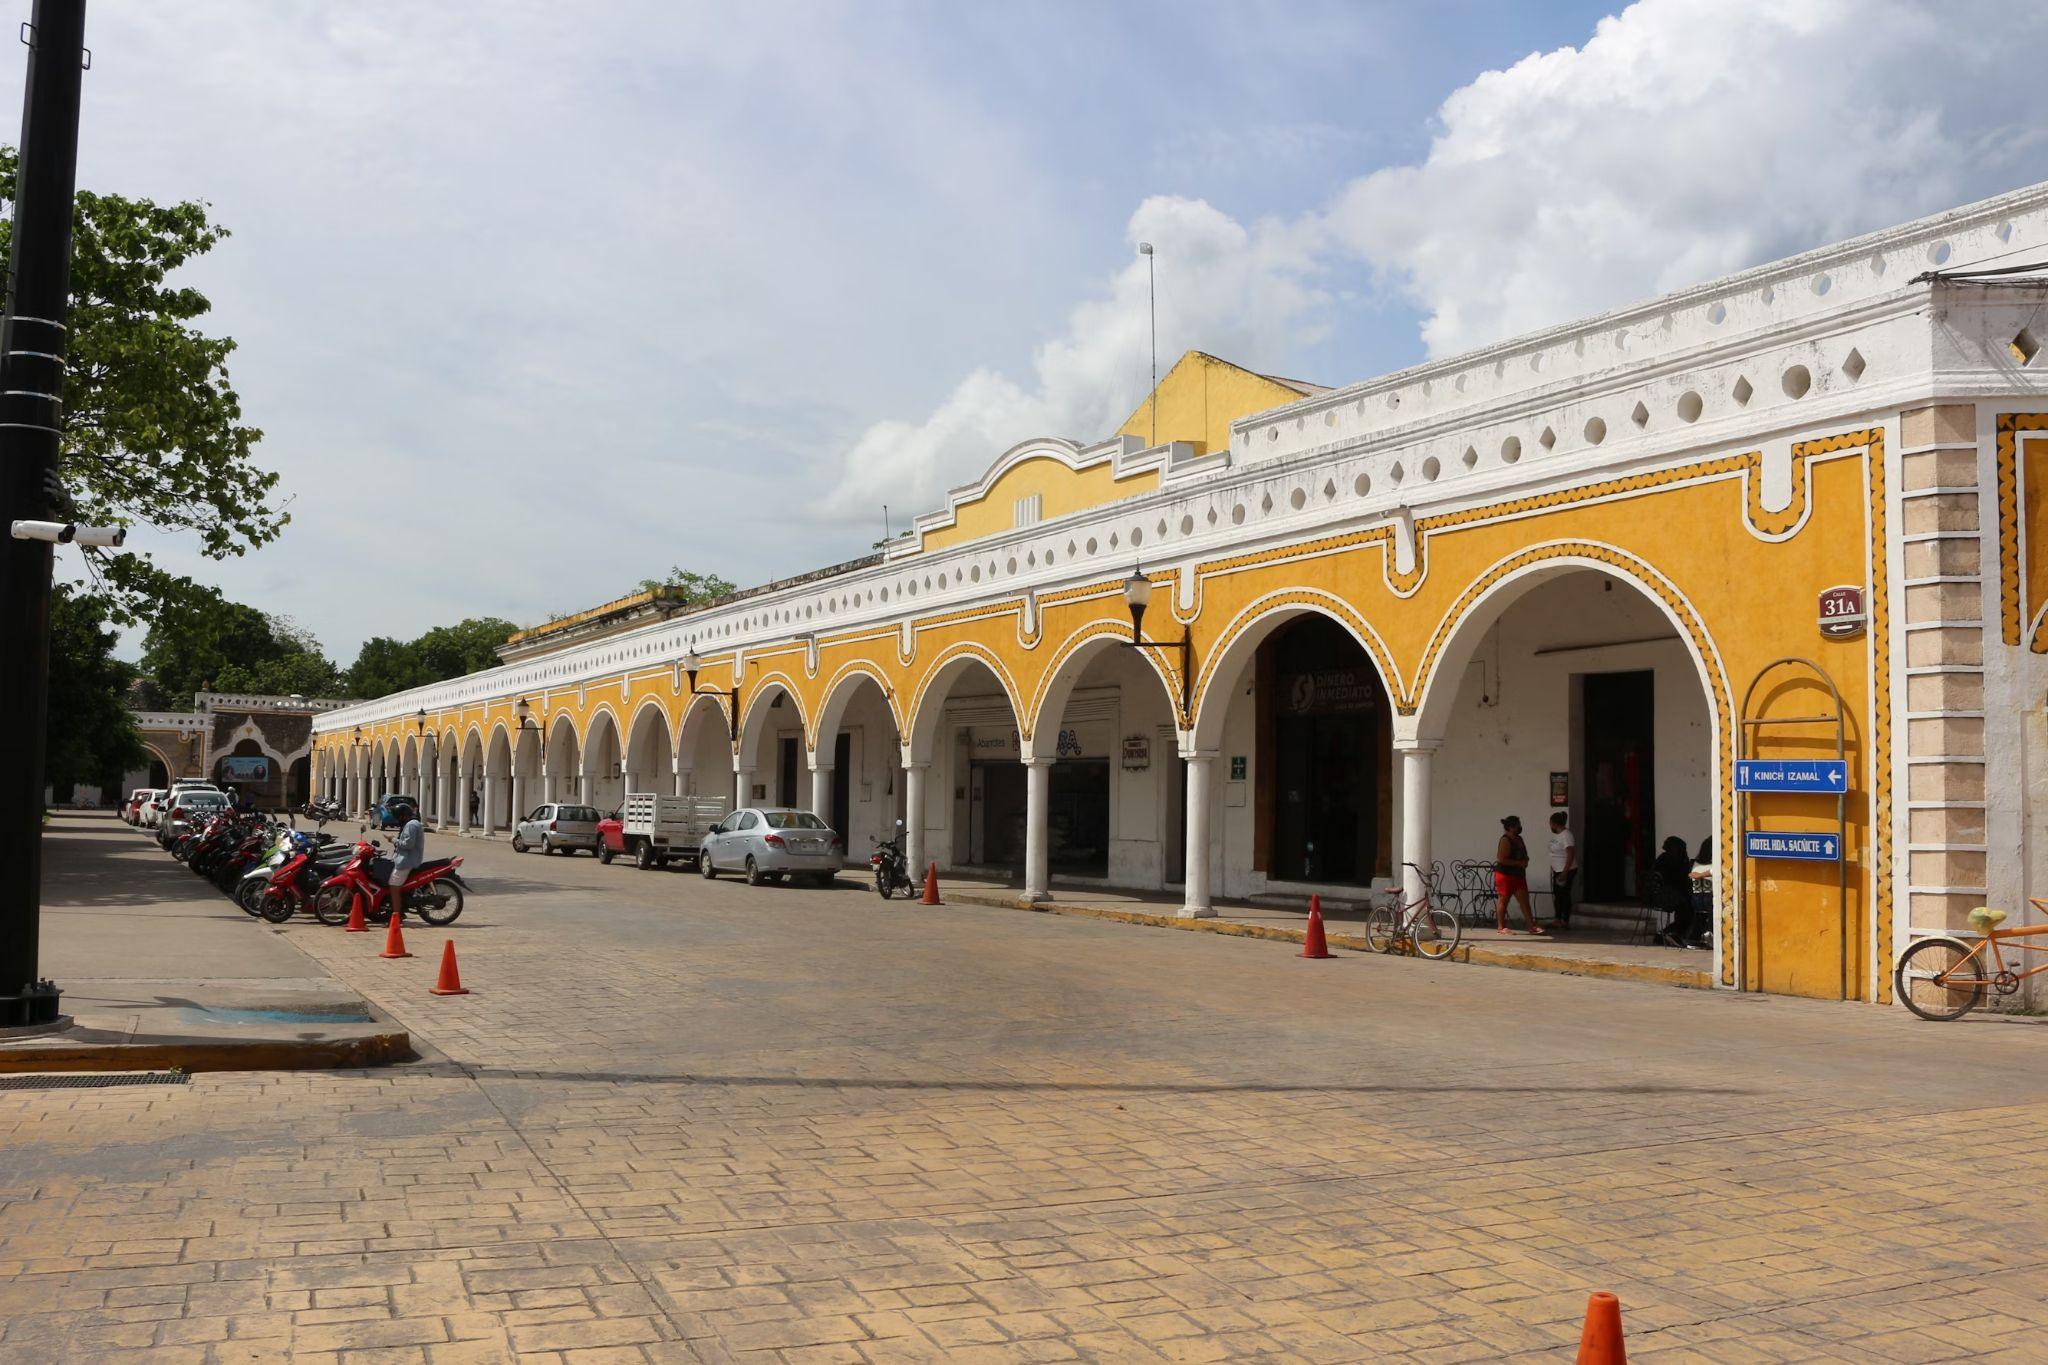
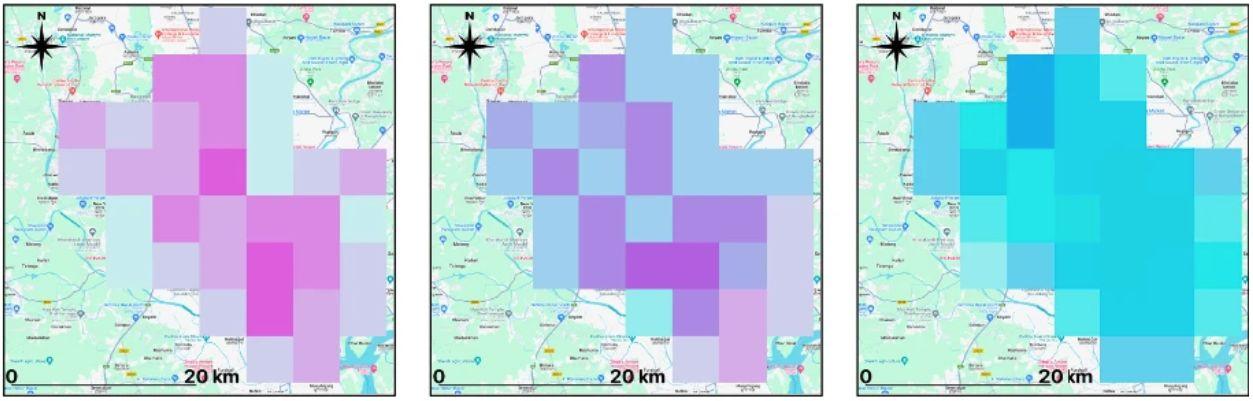
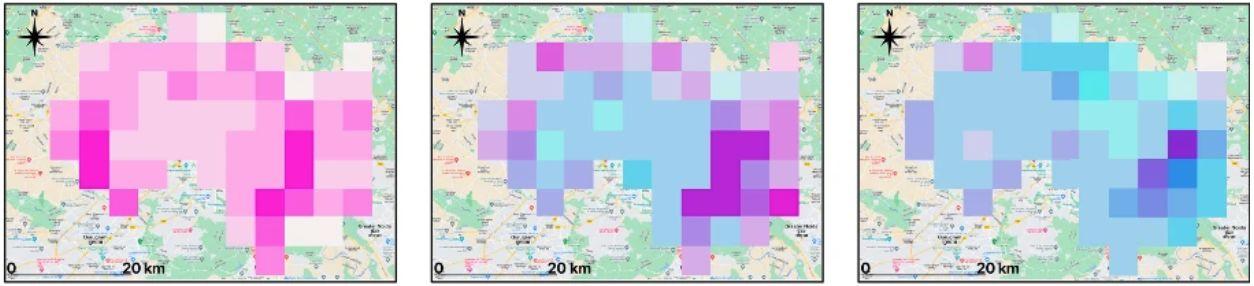
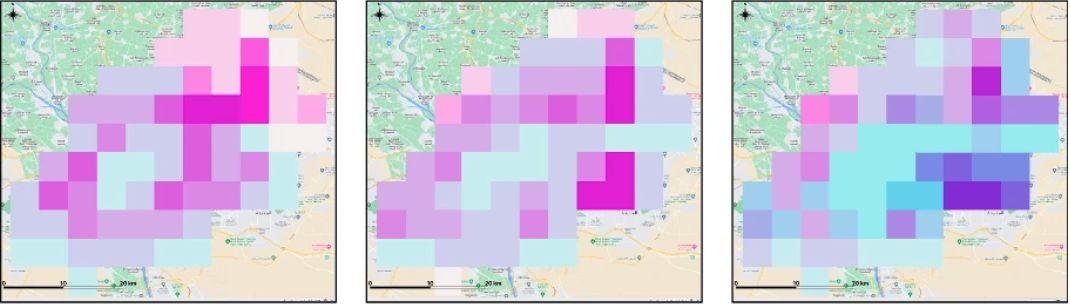
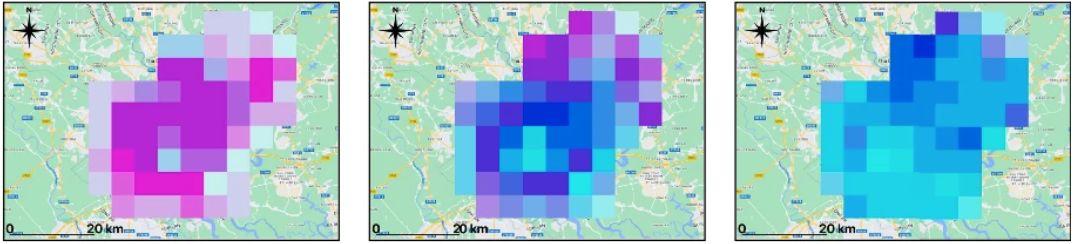
Climate-aligned urbanism has similar emissions reduction (or avoidance) potential across the world
Mérida, Mexico
Chongqing, China
Amman, Jordan
Public transportation
Proximity of jobs and housing
Densification
Small blocks
Proximity of jobs and housing
Transit-oriented development
Small blocks
Photos by Tulip Sunflower on Unsplash, Gilbert Sopakuwa on Flickr,
Climate-aligned urbanism would make it much easier, faster, and cheaper to get to net-zero emissions.
Globally, climate-aligned urbanism could mean:
~450 million fewer EVs in 2050
~15,000 fewer solar facilities in 2035
~5,000 fewer onshore wind turbines in 2035
1.8x the number of passenger cars in Europe today
3-4x the number of solar facilities in the U.S. today
2x the number of wind turbines in Japan today
Note: These numbers are purely indicative and intended only to demonstrate the order of magnitude of potential impact.
Sources: [EVs] Institute for Transportation and Development Policy, “The Compact City Scenario – Electrified,” Dec 2021; Eurostat, “Passenger cars in the EU,” July 2024; [Solar/Wind] RMI analysis based on IEA World Energy Outlook 2023, IPCC AR6 Chapter 5, and Rystad Global Materials Demand Outlook 2022; U.S. Geological Survey, “The U.S. Large-Scale Solar Photovoltaic Database,” August 2024; International Energy Agency Wind Technology Collaboration Programme, “Wind Energy in Japan.”
Urban land use, urban form, and urban design are largely missing from the global climate discourse
Number of NDCs with national vs. urban mitigation responses by sector
Source: UN Habitat, SDU. Resilience and UNDP, "URban Content of NDCs: Local climate action explored through in-depth country analyses: 2024 Report"
Urban land use, urban form, and urban design are largely missing from the global climate discourse
Of over 600 official events at Climate Week NYC…
<20
<10 focused on the urban scale (including events focused on resilience and adaptation)
Zero
Zero
Zero focused on cities focused on public transit focused on bikes / bike lanes focused on shared spaces
Source: UN Habitat, SDU. Resilience and UNDP, "URban Content of NDCs: Local climate action explored through in-depth country analyses: 2024 Report"
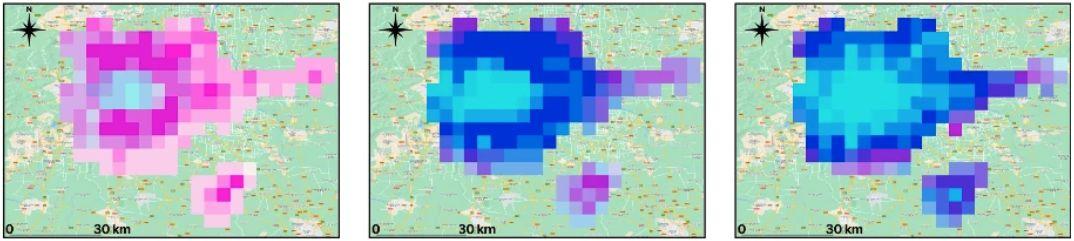
Thankfully, there are signs of positive change in the world’s biggest cities.
Urbanization pattern studies across multiple cities show that urban sprawl is starting to give way to urban vertical growth in the last three decades.
Sources: S. Frolking, R. Mahtta, T. Milliman, T. Esch & K. Seto. "Global urban structural growth shows a profound shift from spreading out to building up" 05 August 2024
Dhaka (25.4kper km2)
Delhi (15.2kper km2)
Cairo (12.4kper km2)
Ho Chi Minh City (8.1kper km2)
Beijing + (7.6kper km2)
Seoul + (7.5kper km2)
Lagos + (7.0kper km2)
Tehran + (3.7kper km2)
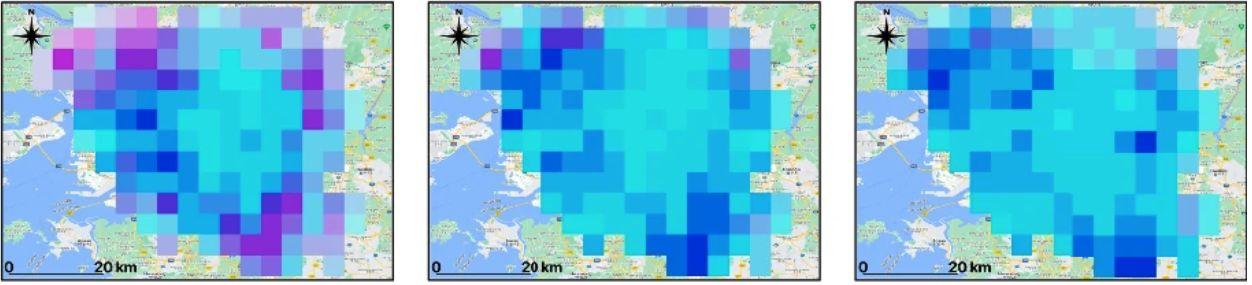
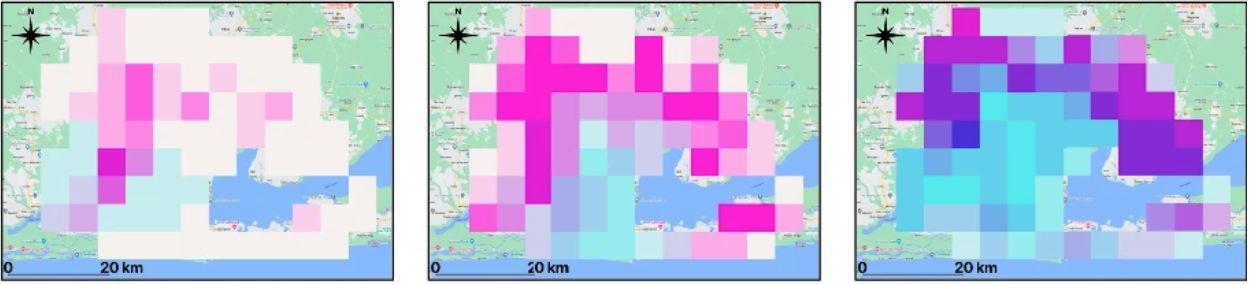
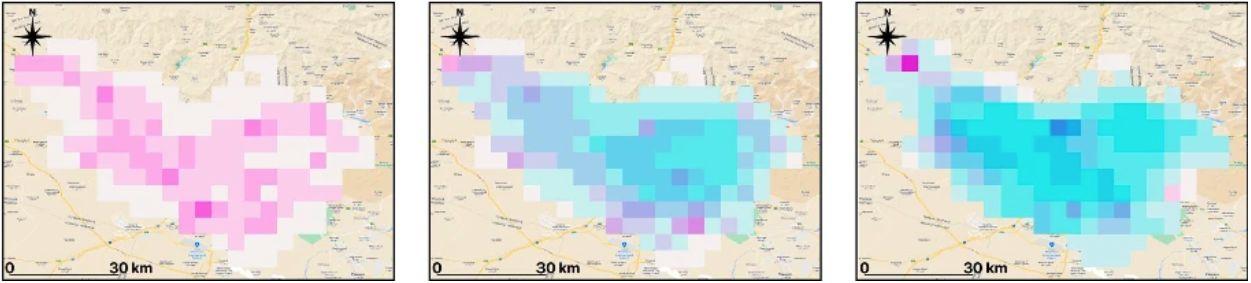
But we need that change to happen faster – and spread to the smaller cities driving most urban growth.
Urbanization pattern studies across multiple cities show that urban sprawl is starting to give way to urban vertical growth in the last three decades.
Urban growth patterns across four regions, 2010-2020
Sources: S. Frolking, R. Mahtta, T. Milliman, T. Esch & K. Seto. "Global urban structural growth shows a profound
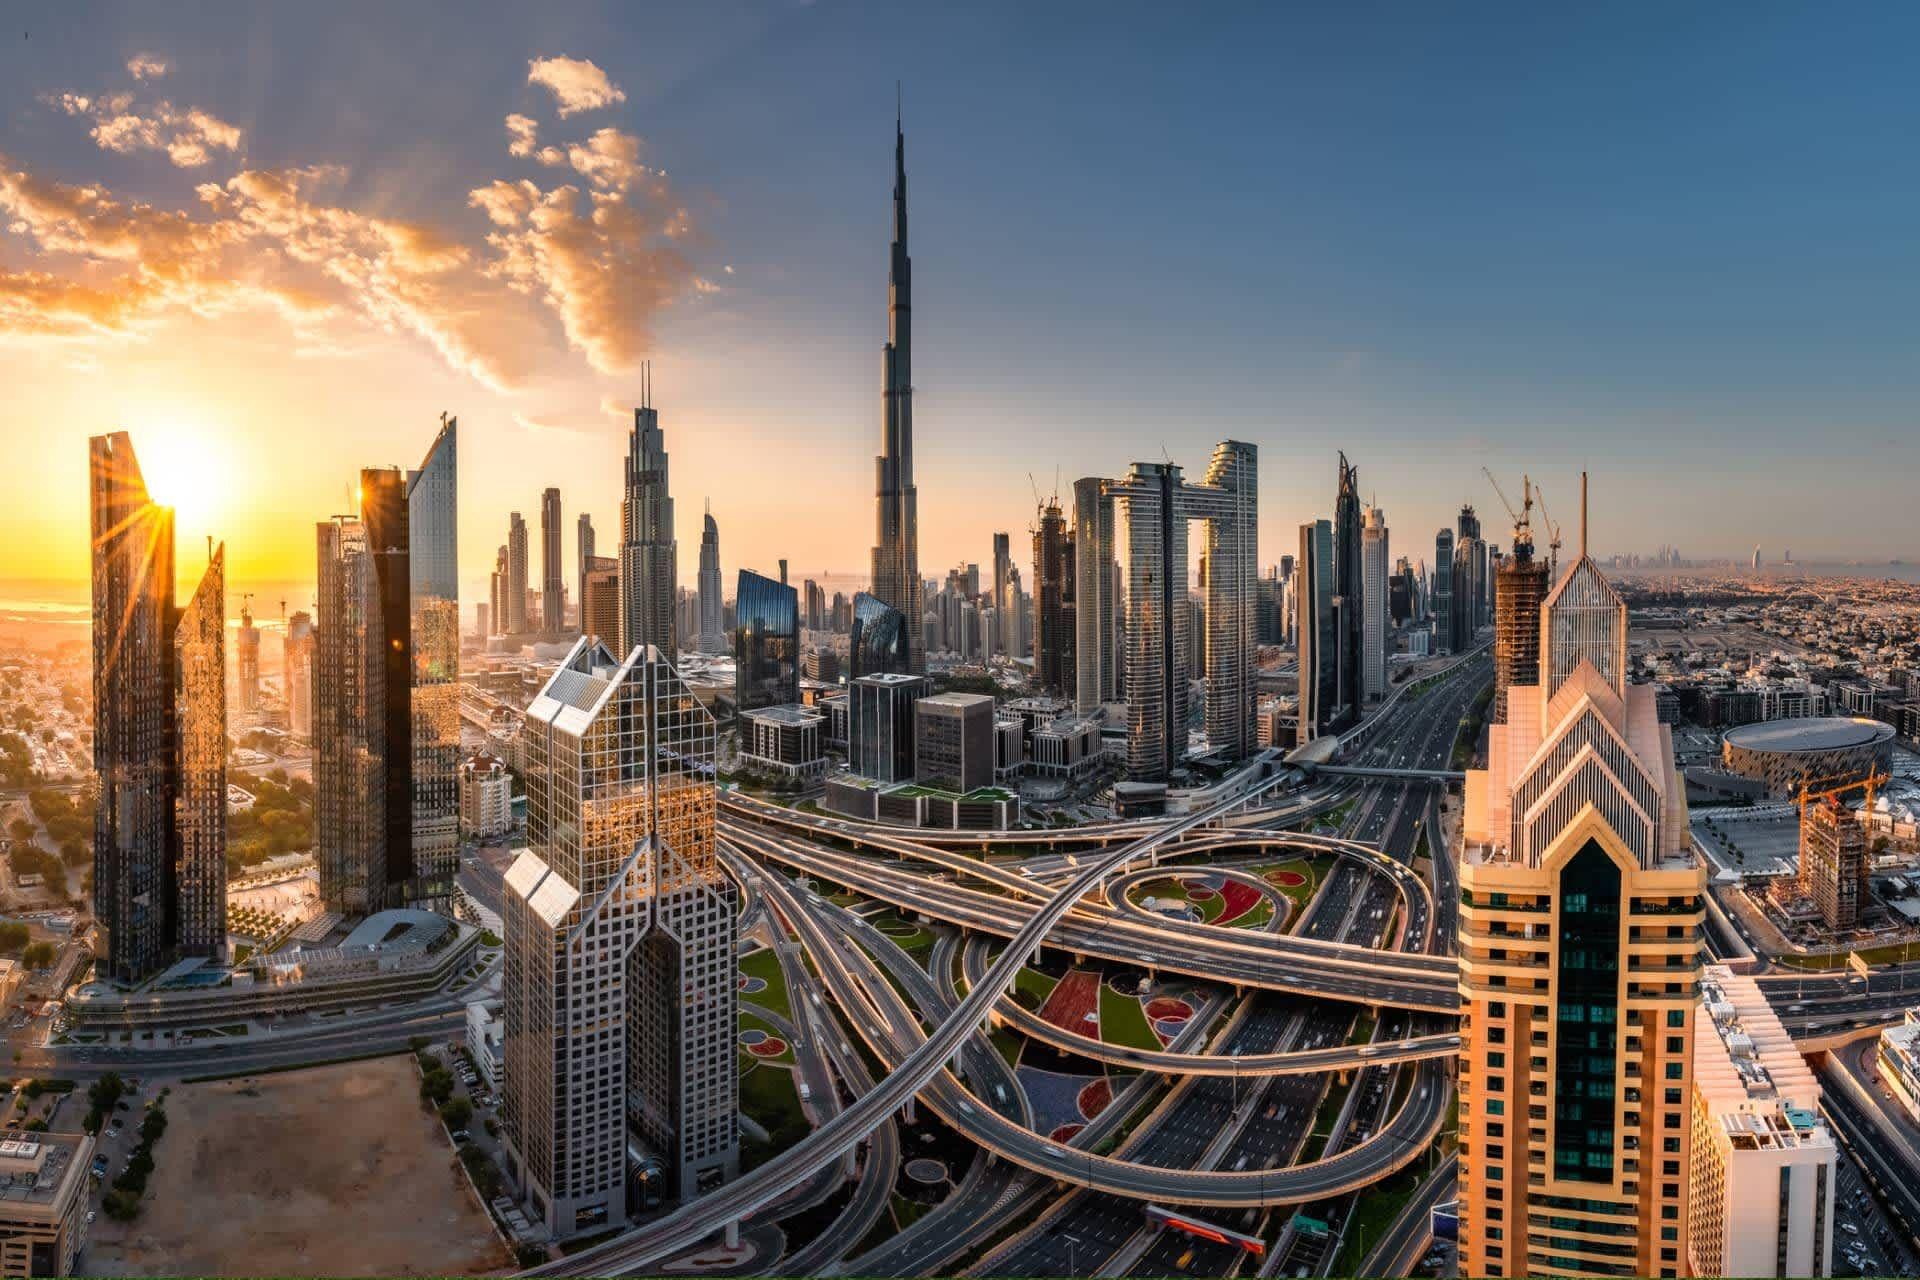
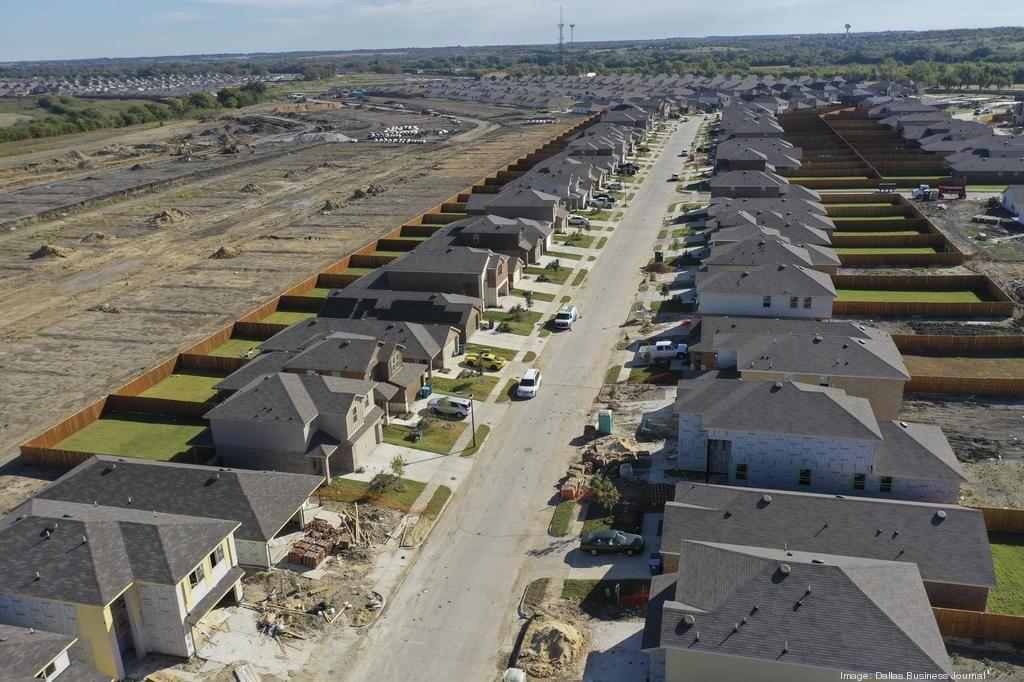
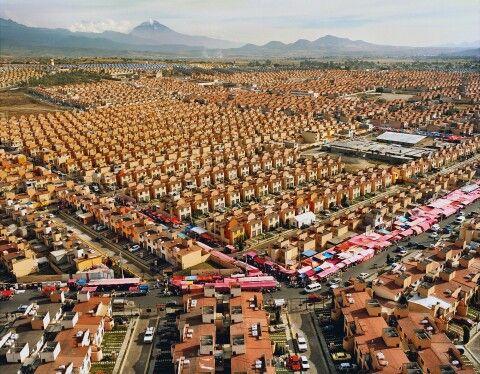
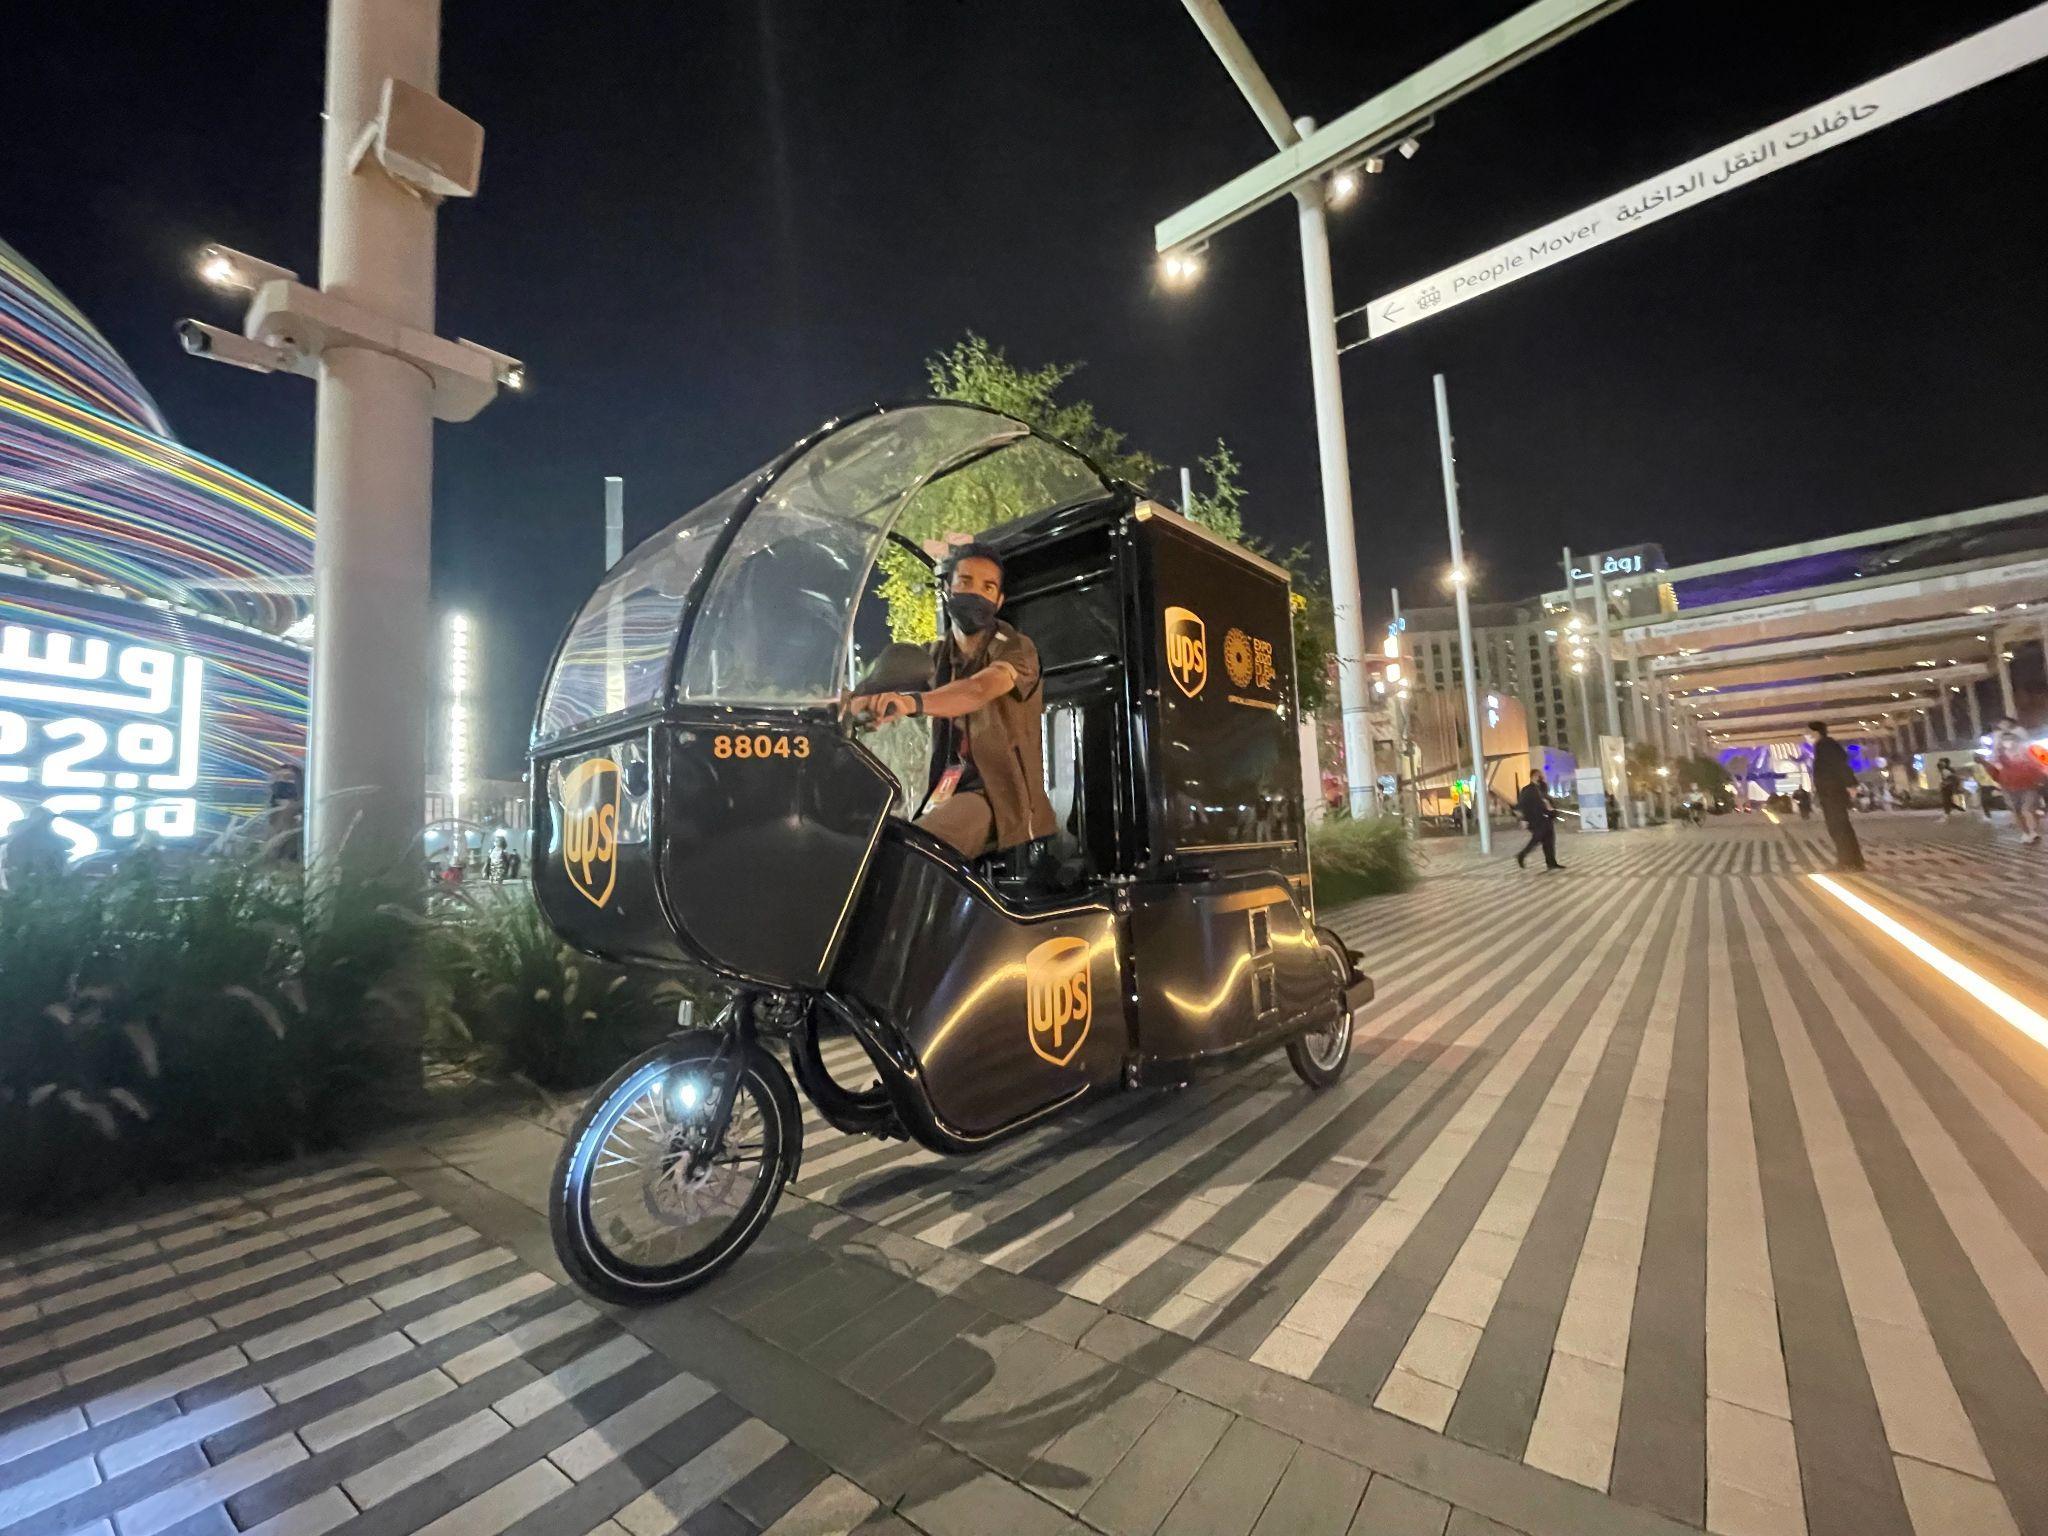
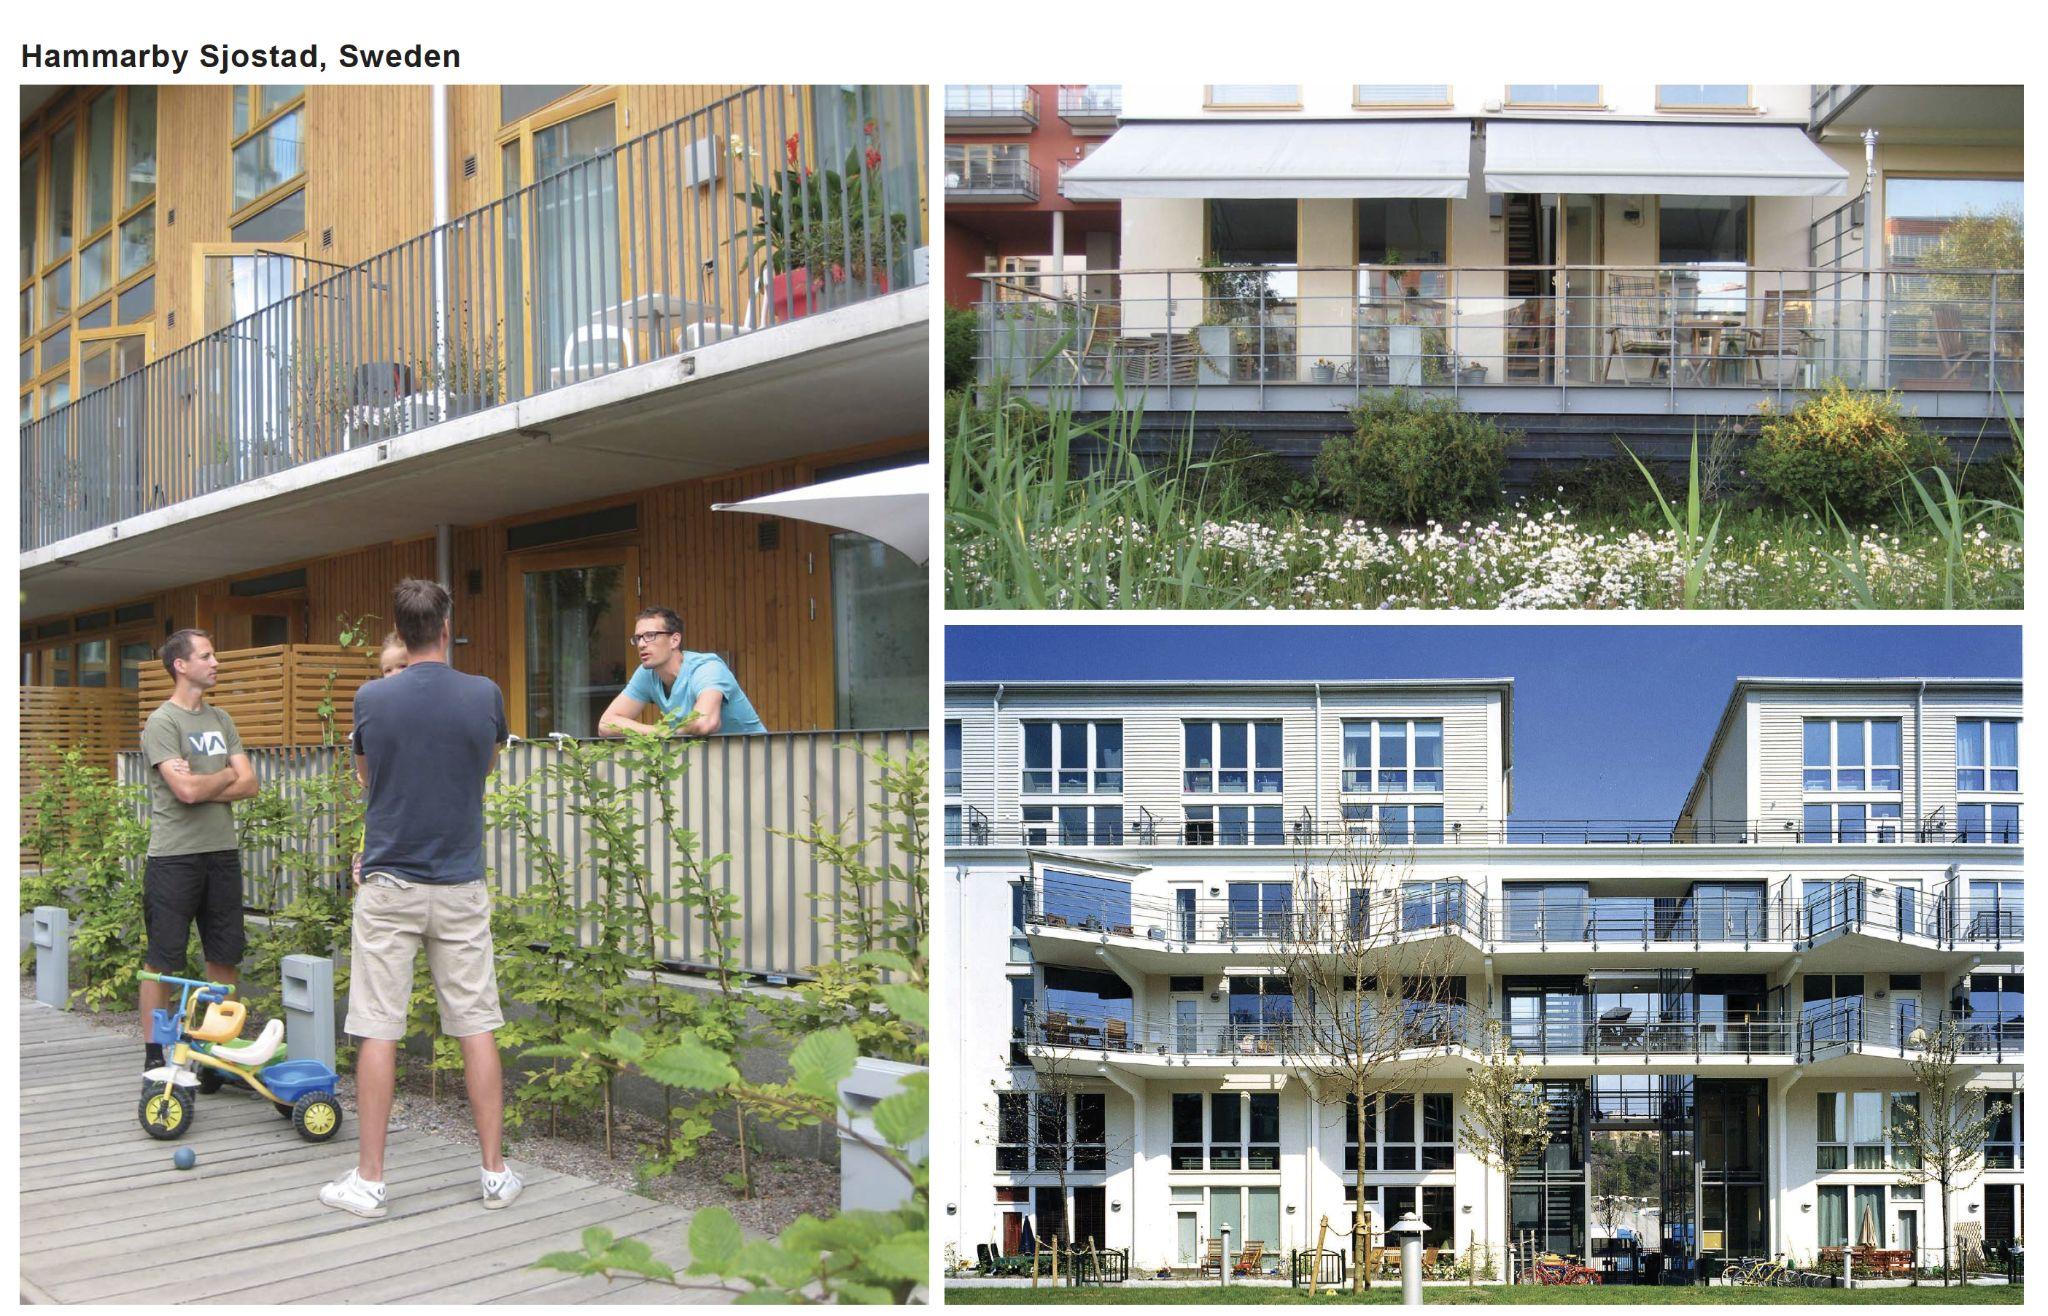
This may sound like an urban planning problem. But it’s also a challenge of imagination.
Safety, comfort, and opportunity can be low or high density — but is almost always packaged as disconnected and mechanized.
Dubai, UAE
Dallas, TX, USA
Beijing, China
Mexico City, Mexico
Salt Lake City, UT, USA
Source: Unsplash
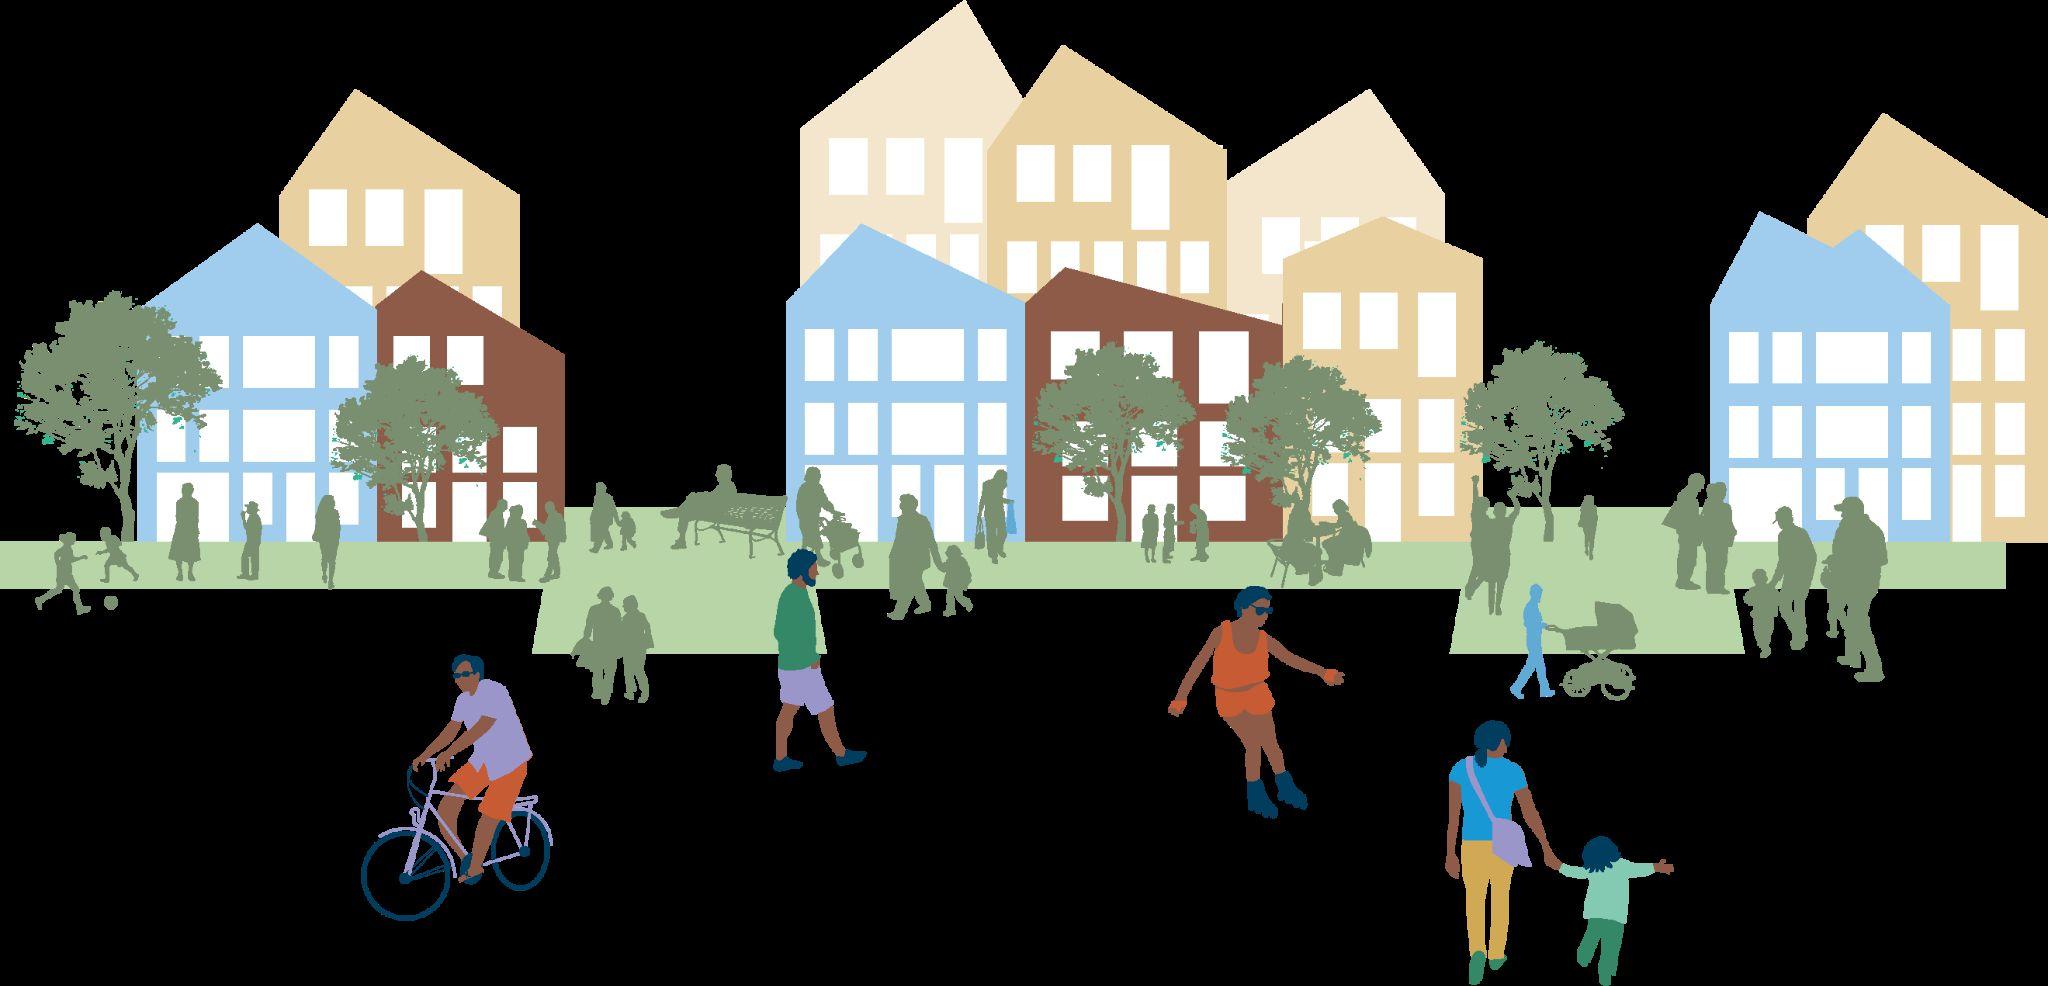
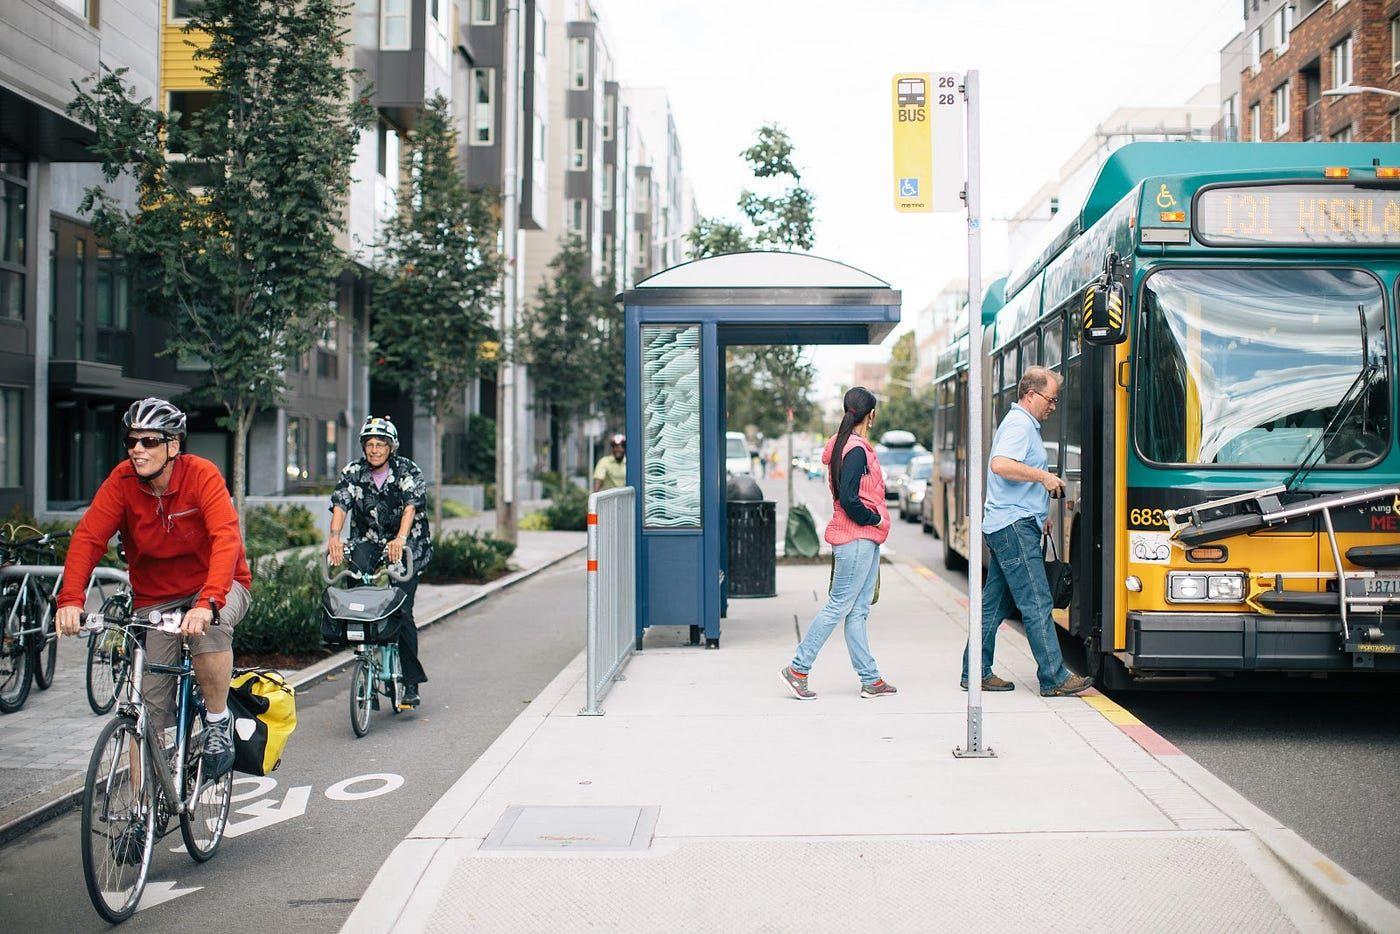
Making climate-aligned urbanism work requires a completely different kind of infrastructure.
Human-scale streets that efficiently combine modes and choices
Places to move about safely regardless of age or ability
Connections directly from buildings to streets
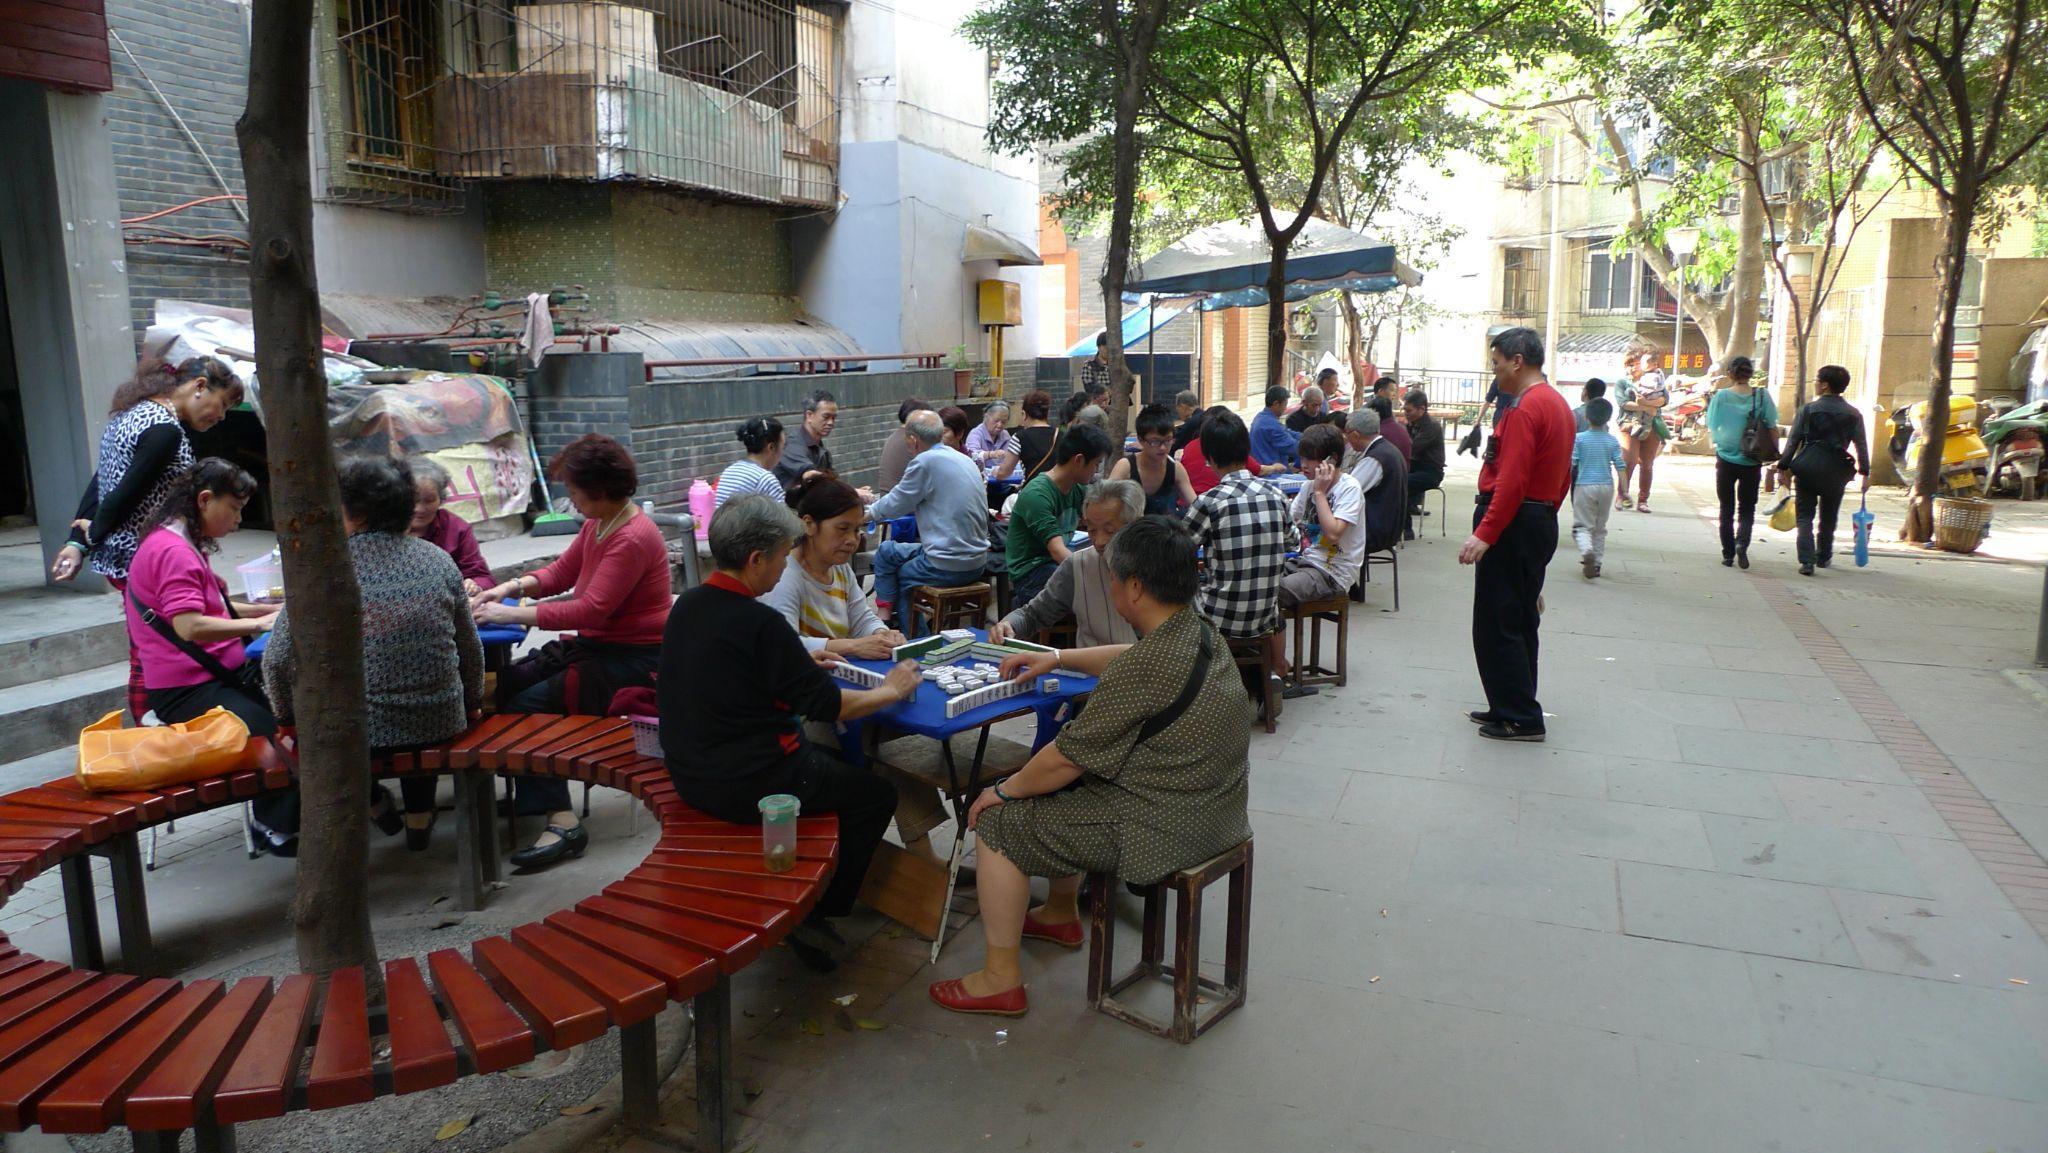
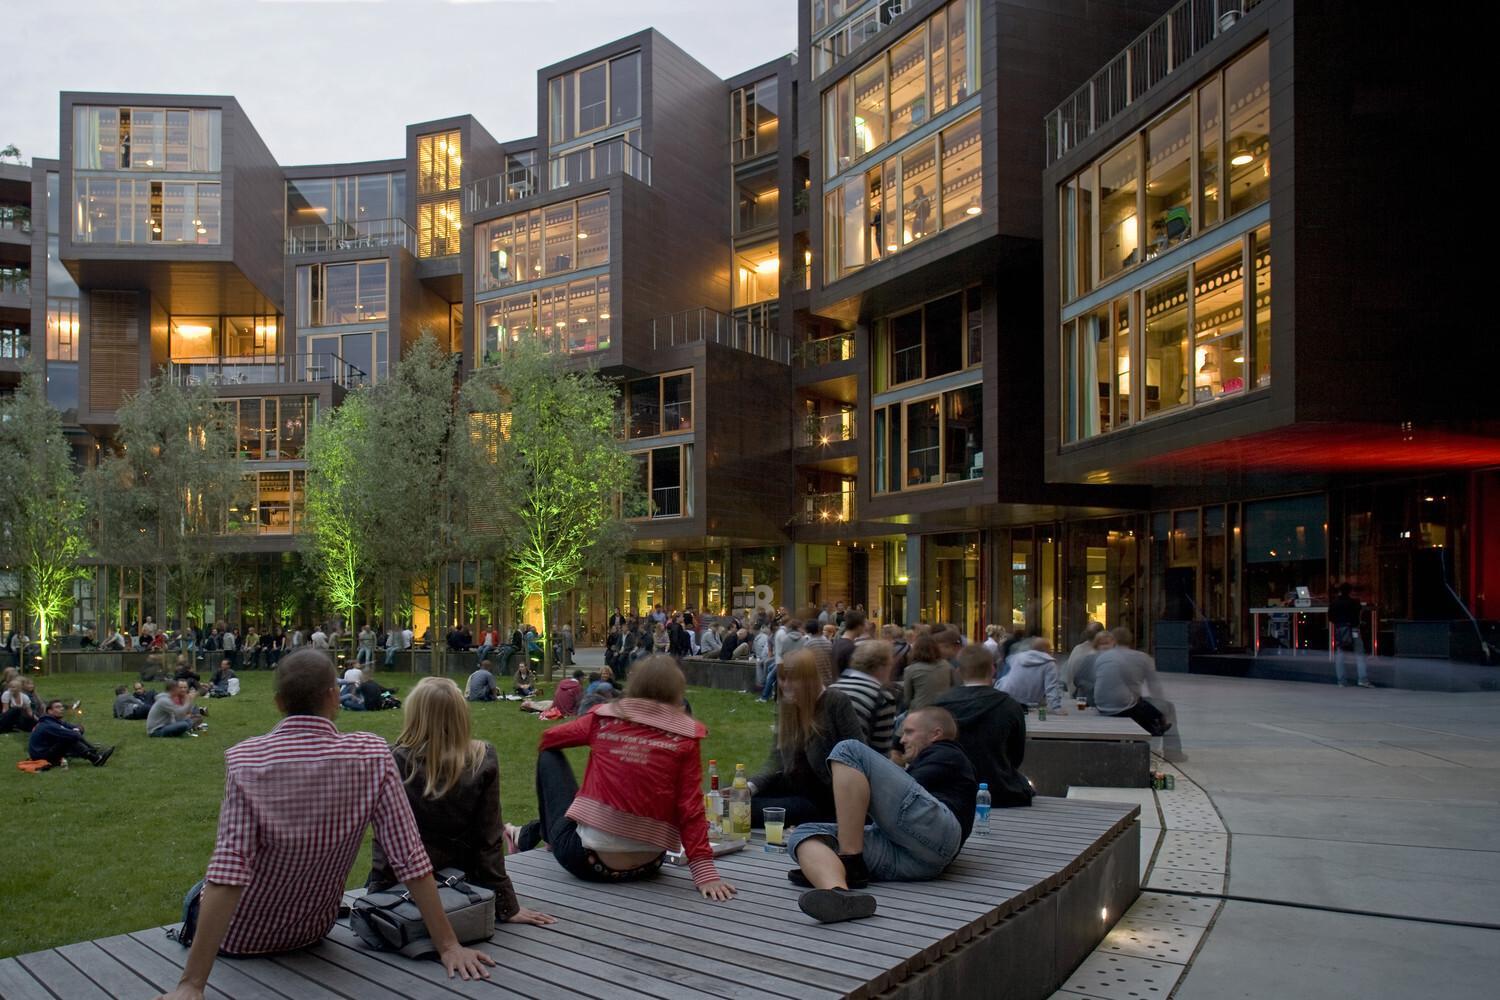
Third places where friends can gather and share their city
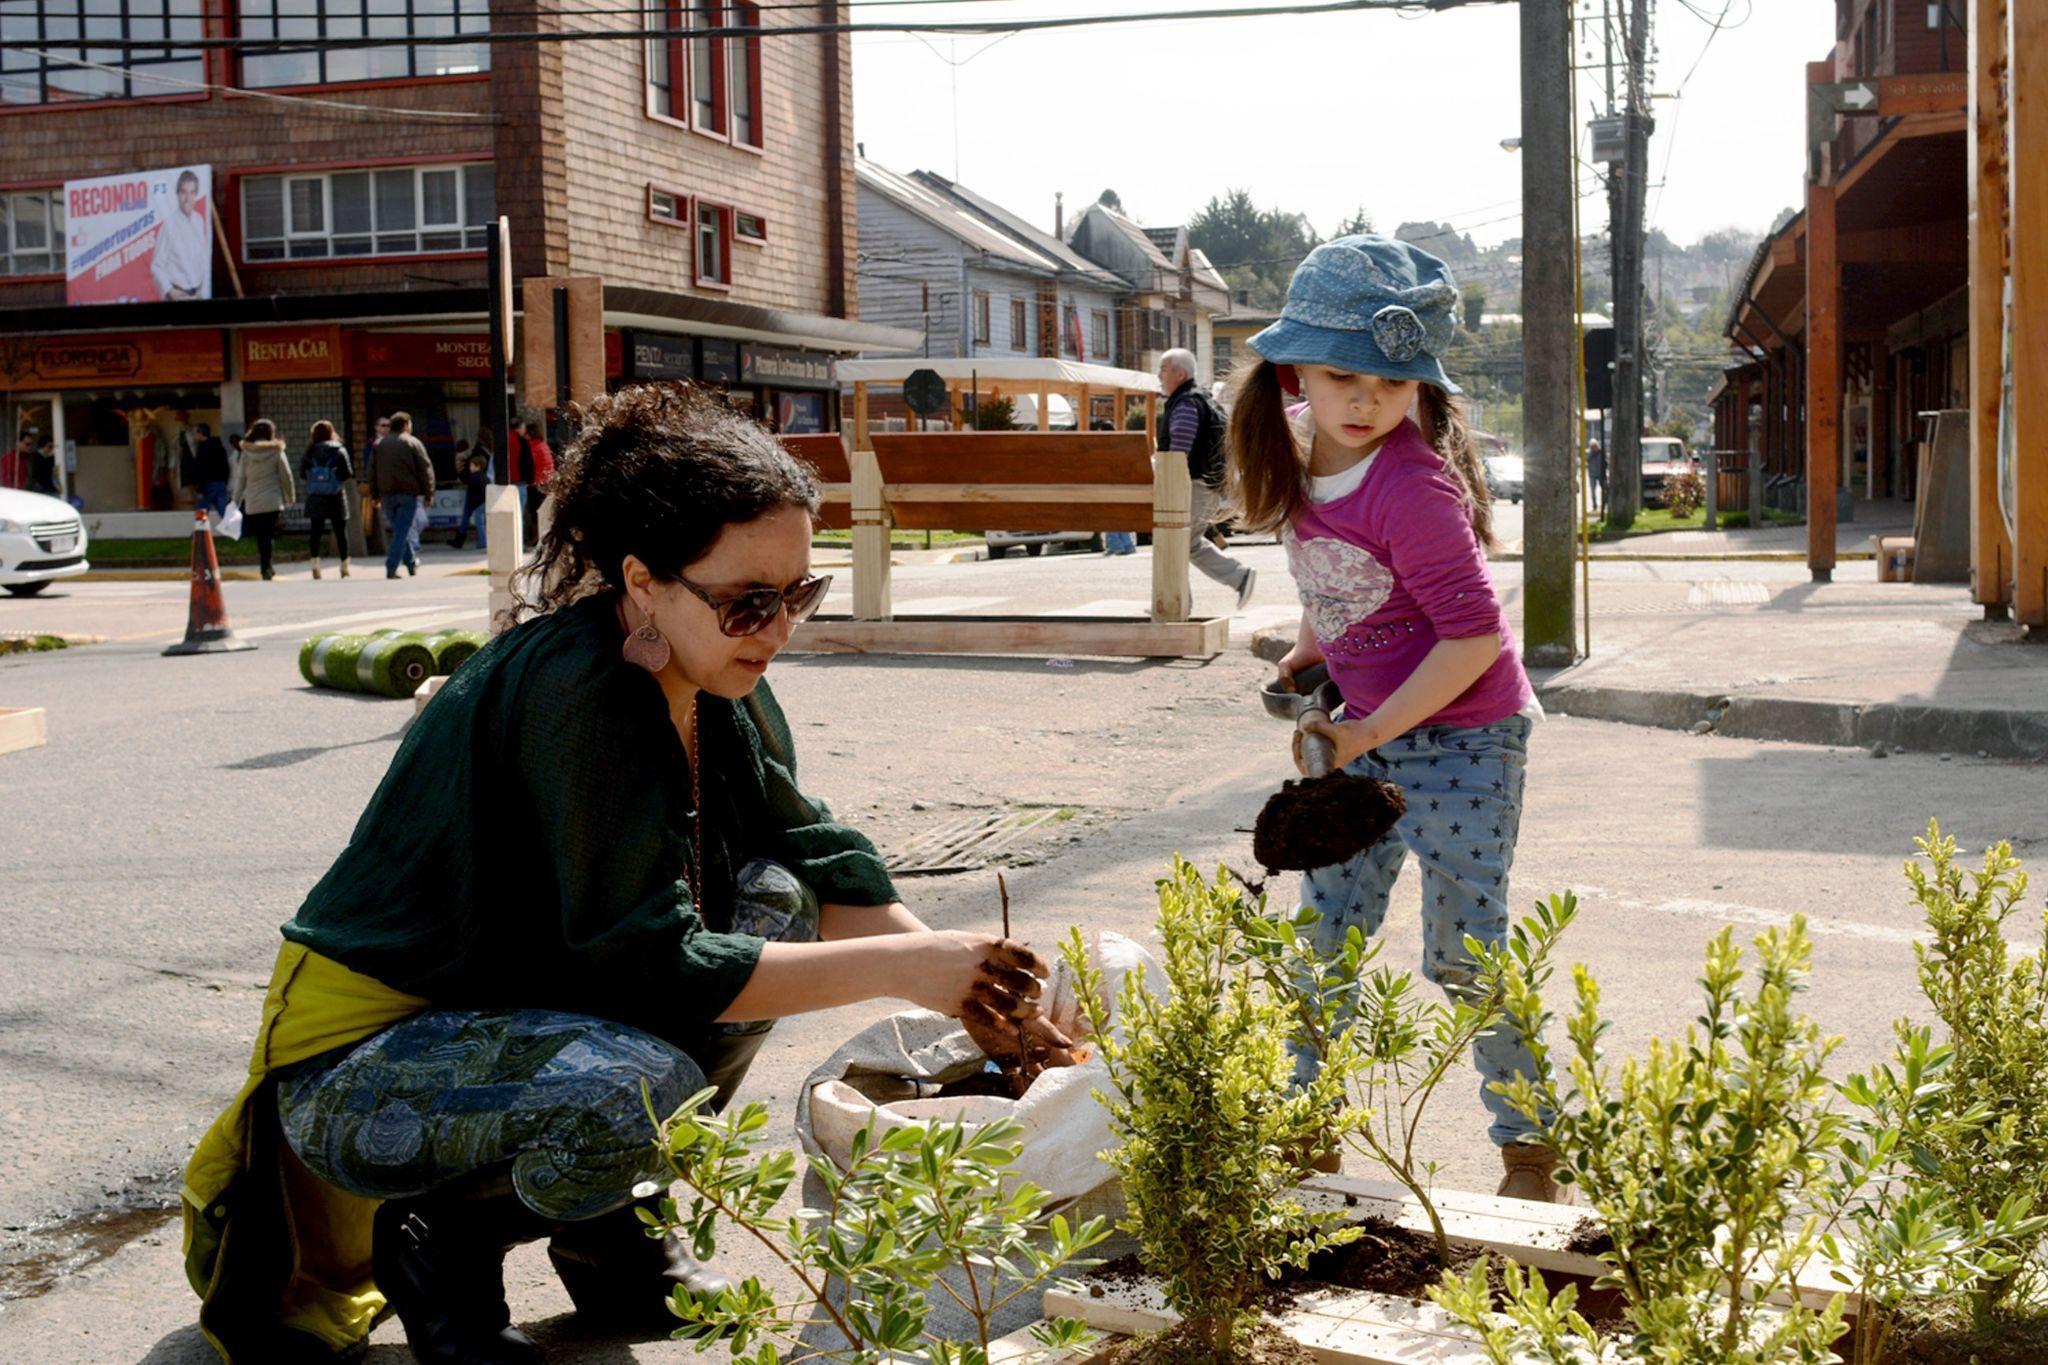
Neighborhoods that can be shaped by residents
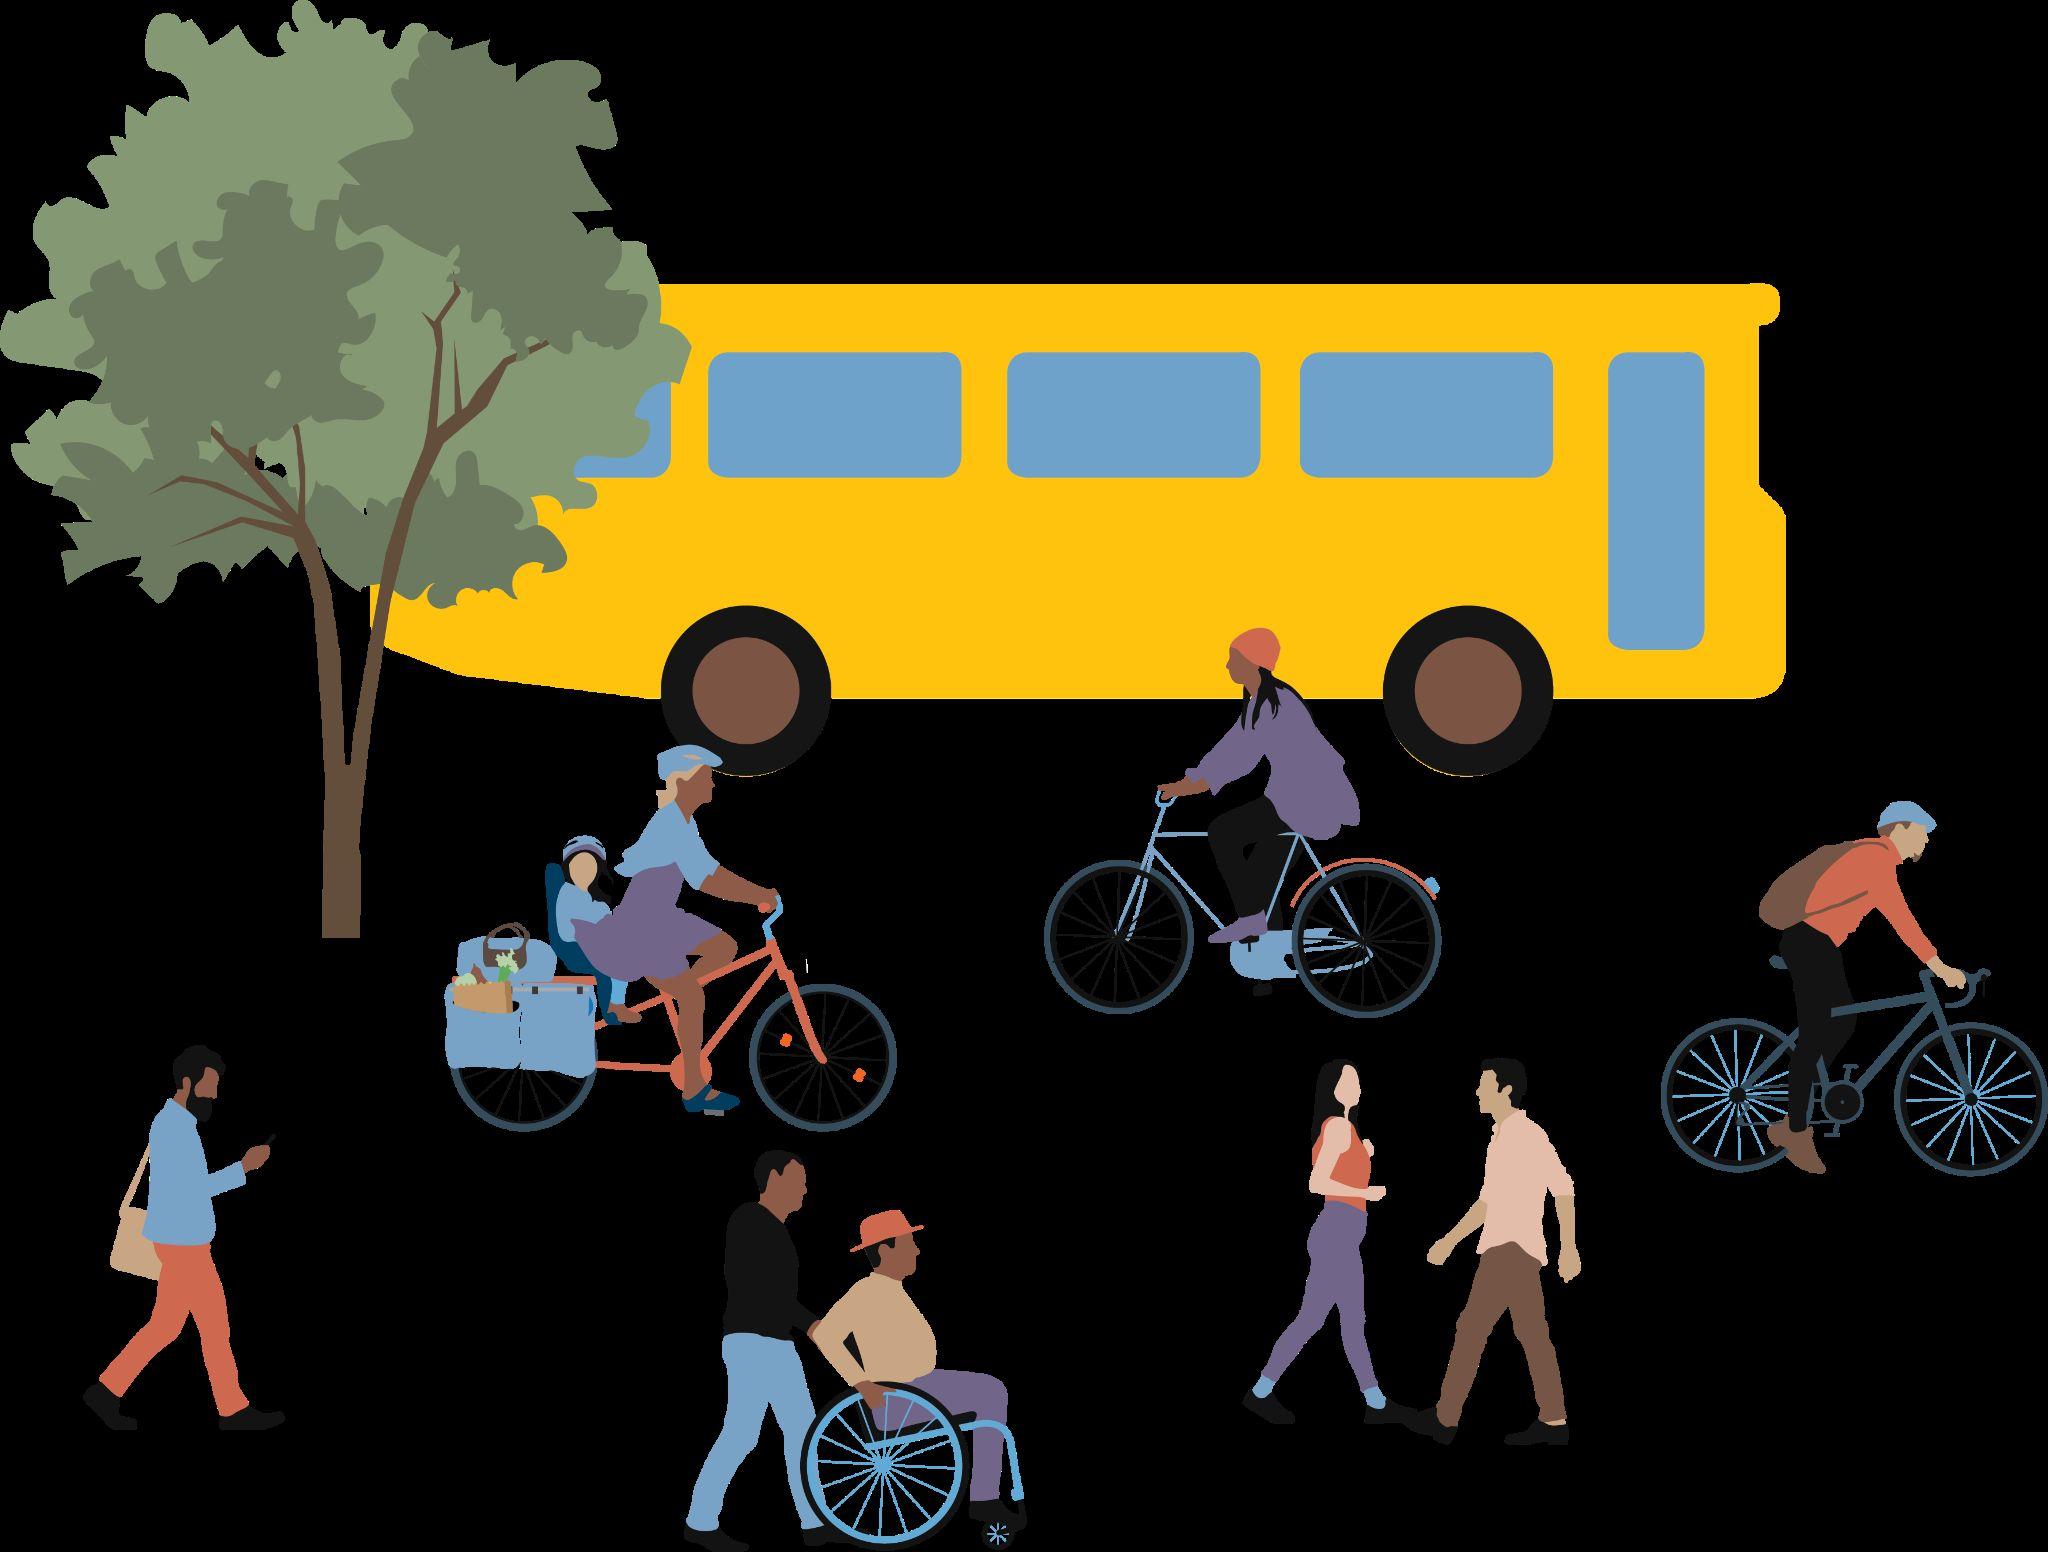
What is different about Climate-Aligned Urbanism? It changes the way residents:
A
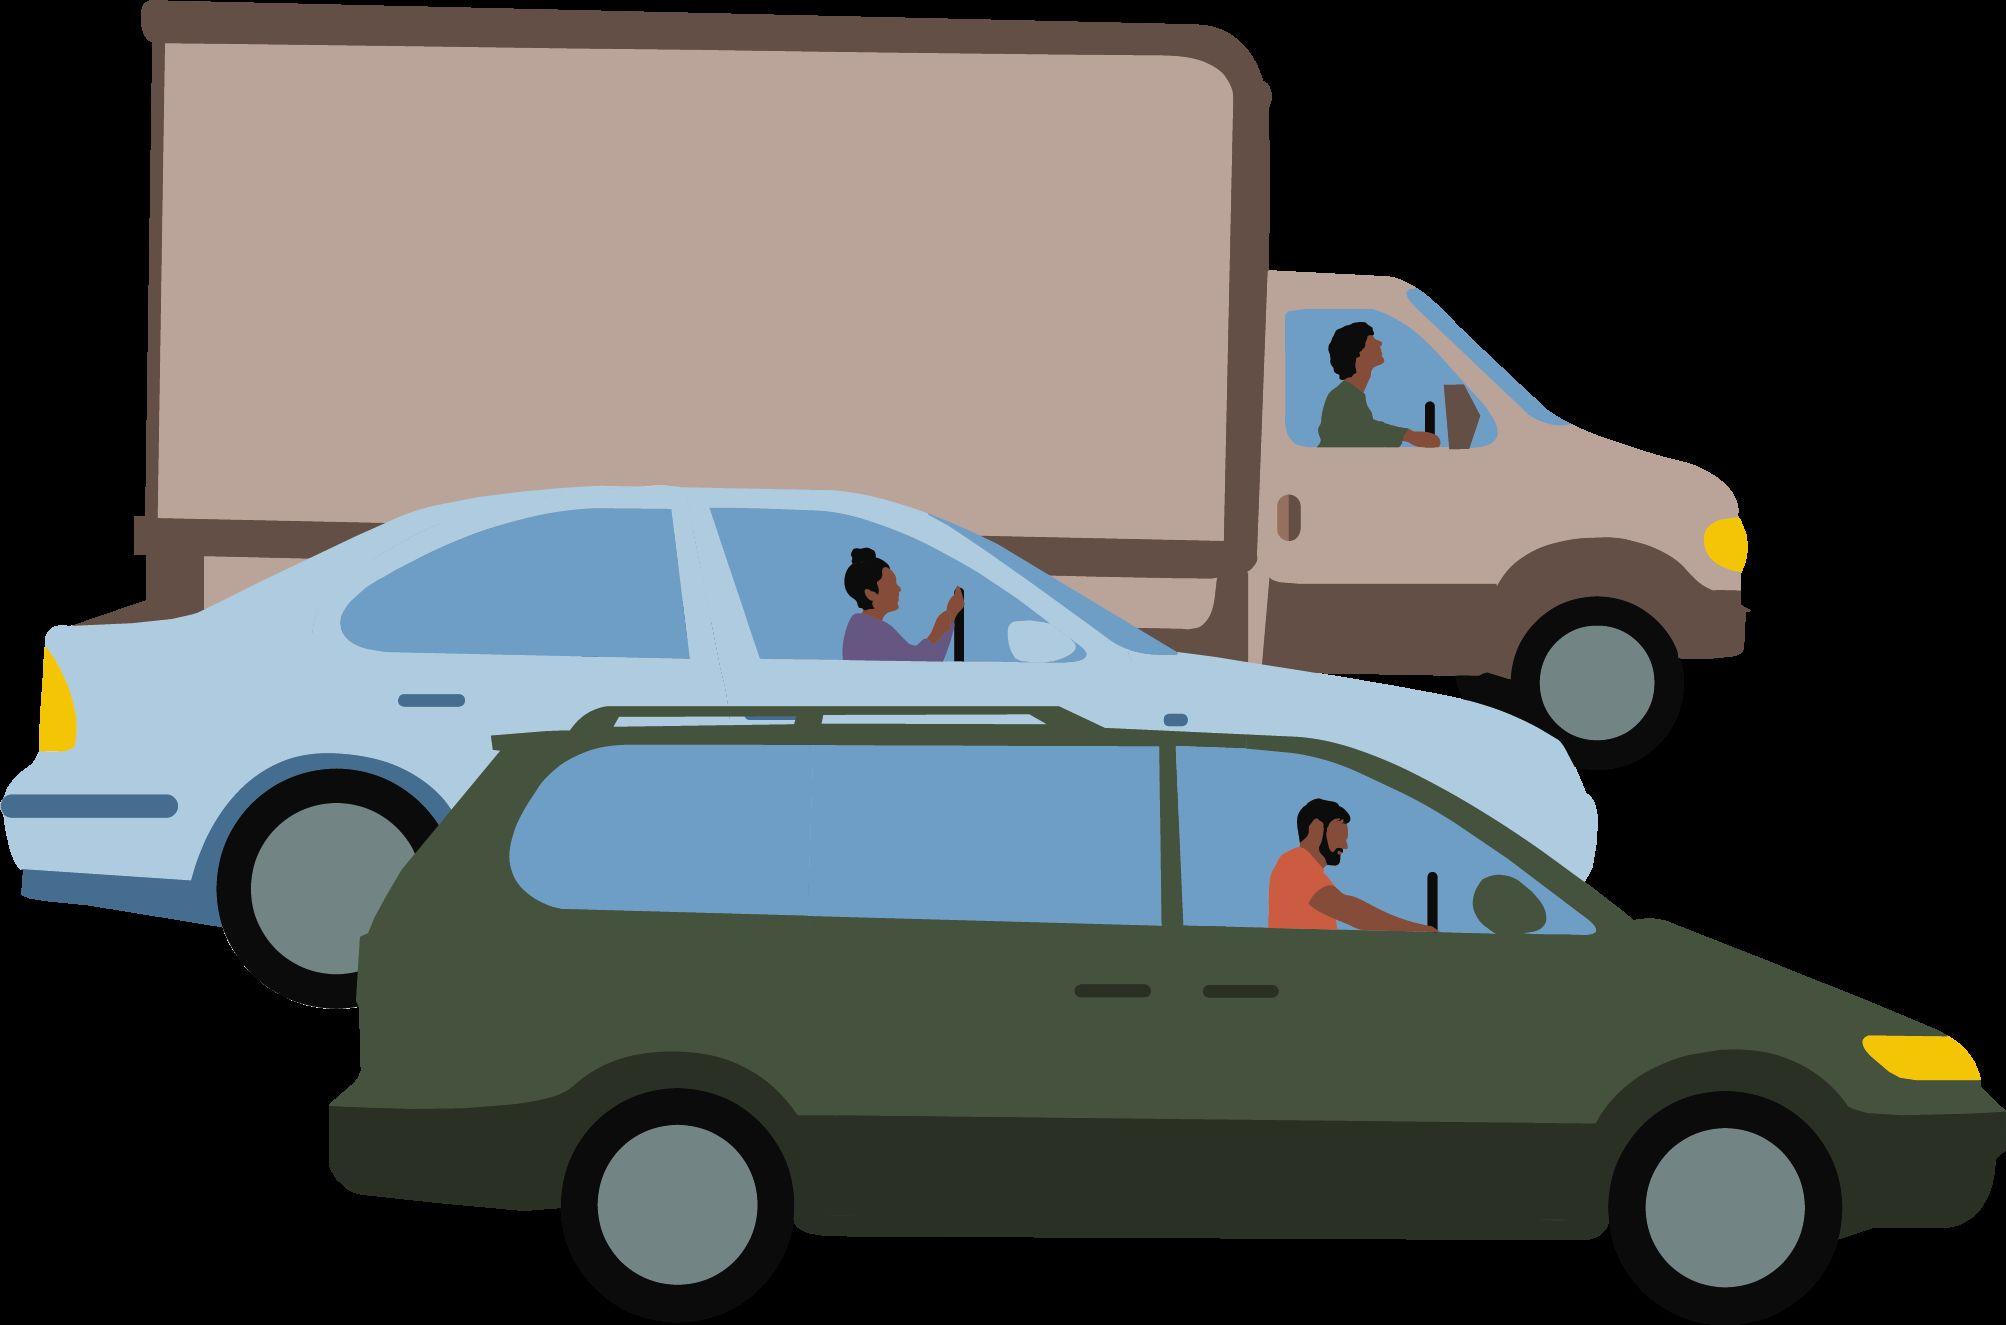
different way to move
Less
time alone behind the wheel …
… more time in active mobility together.
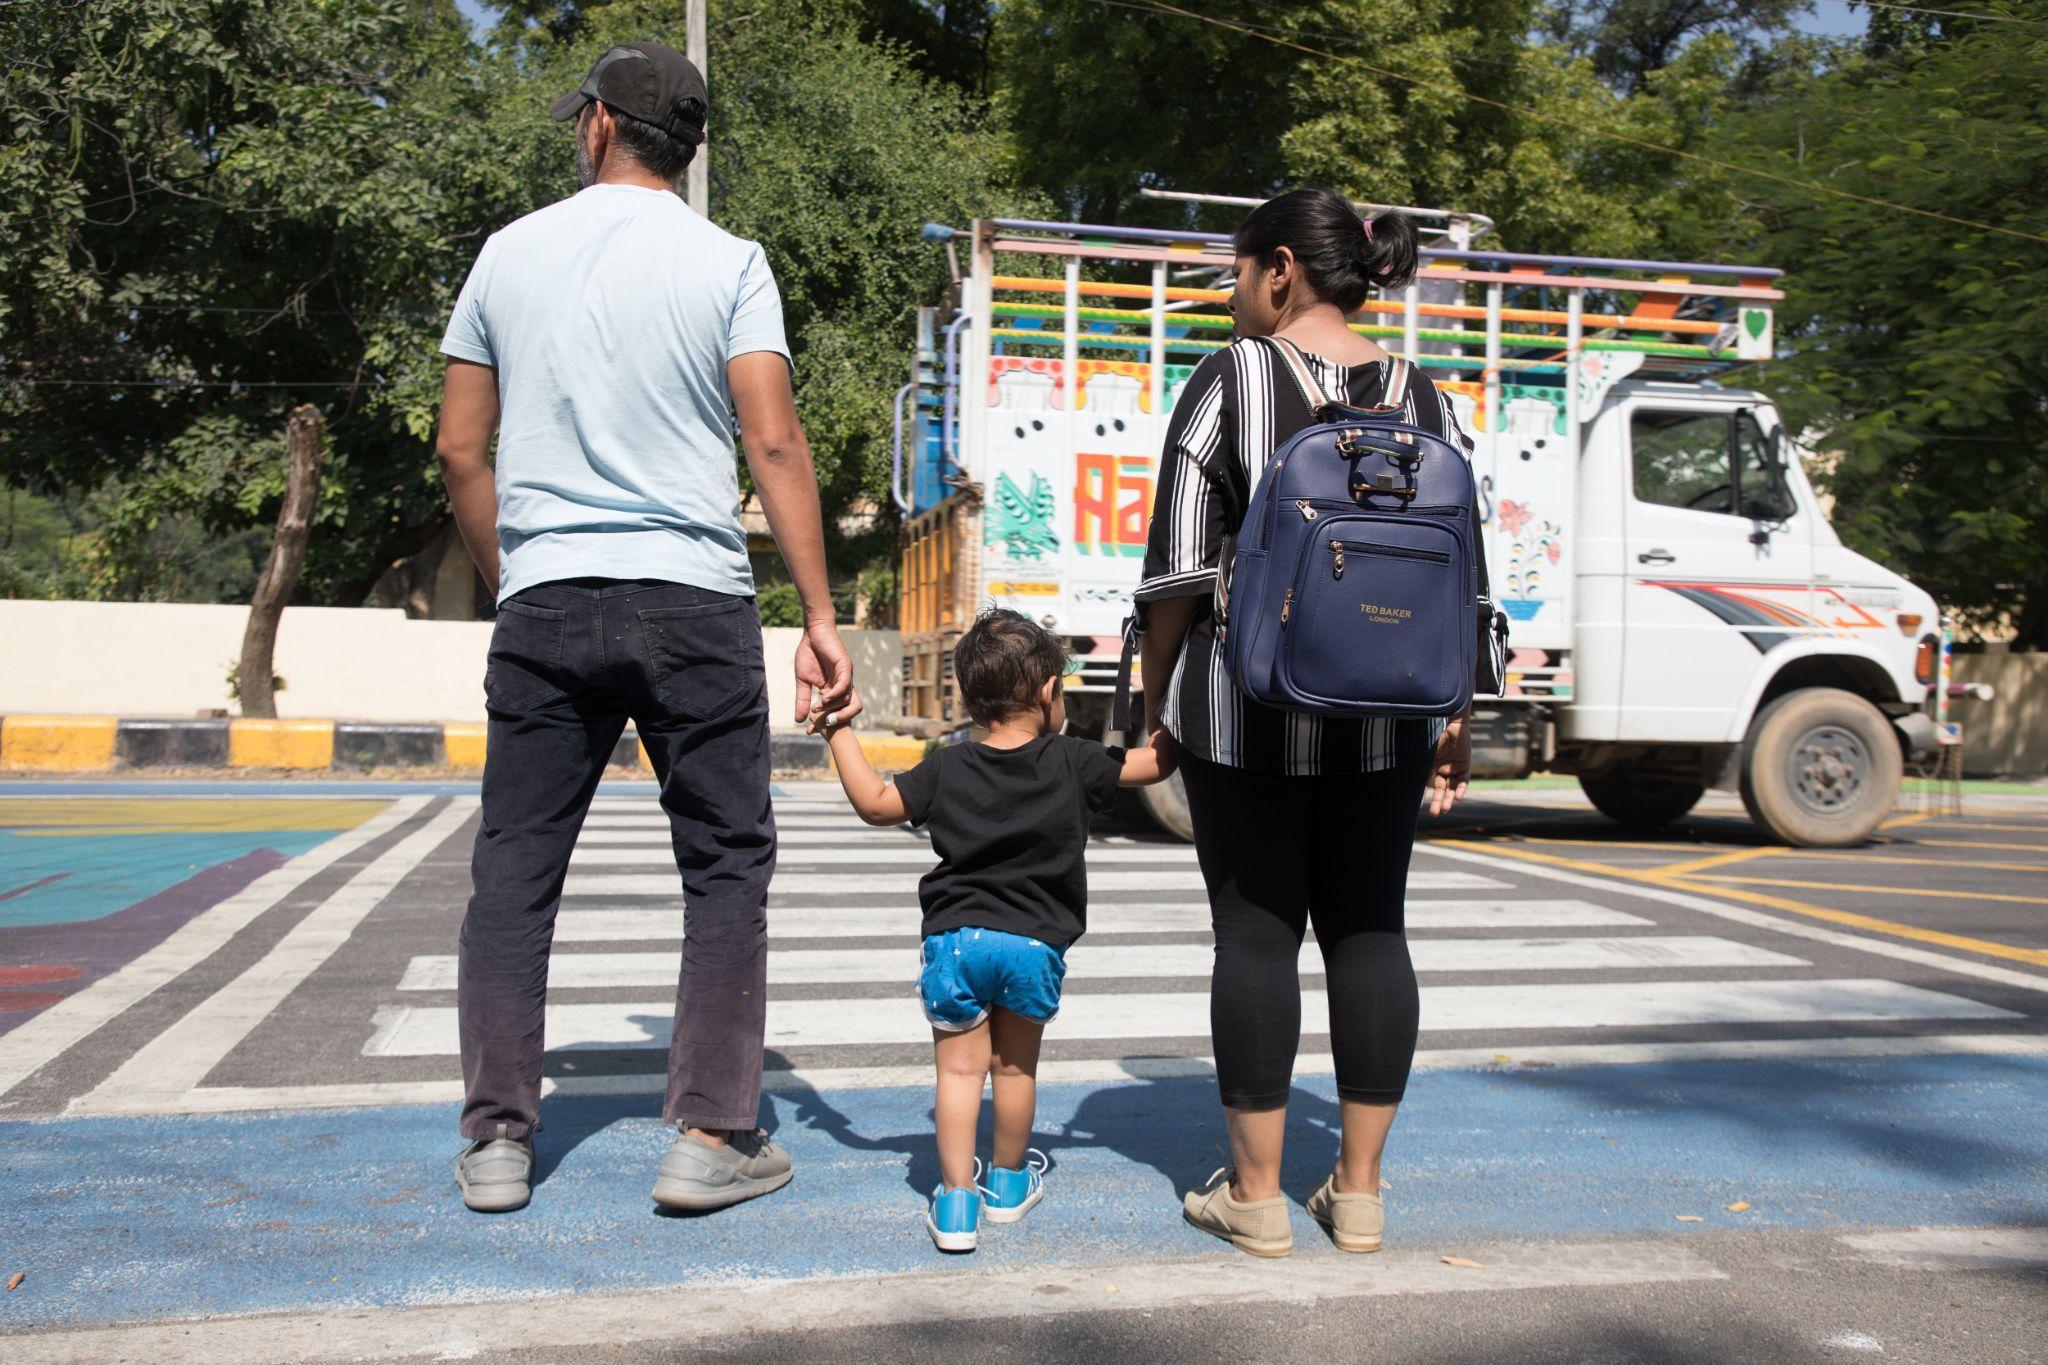
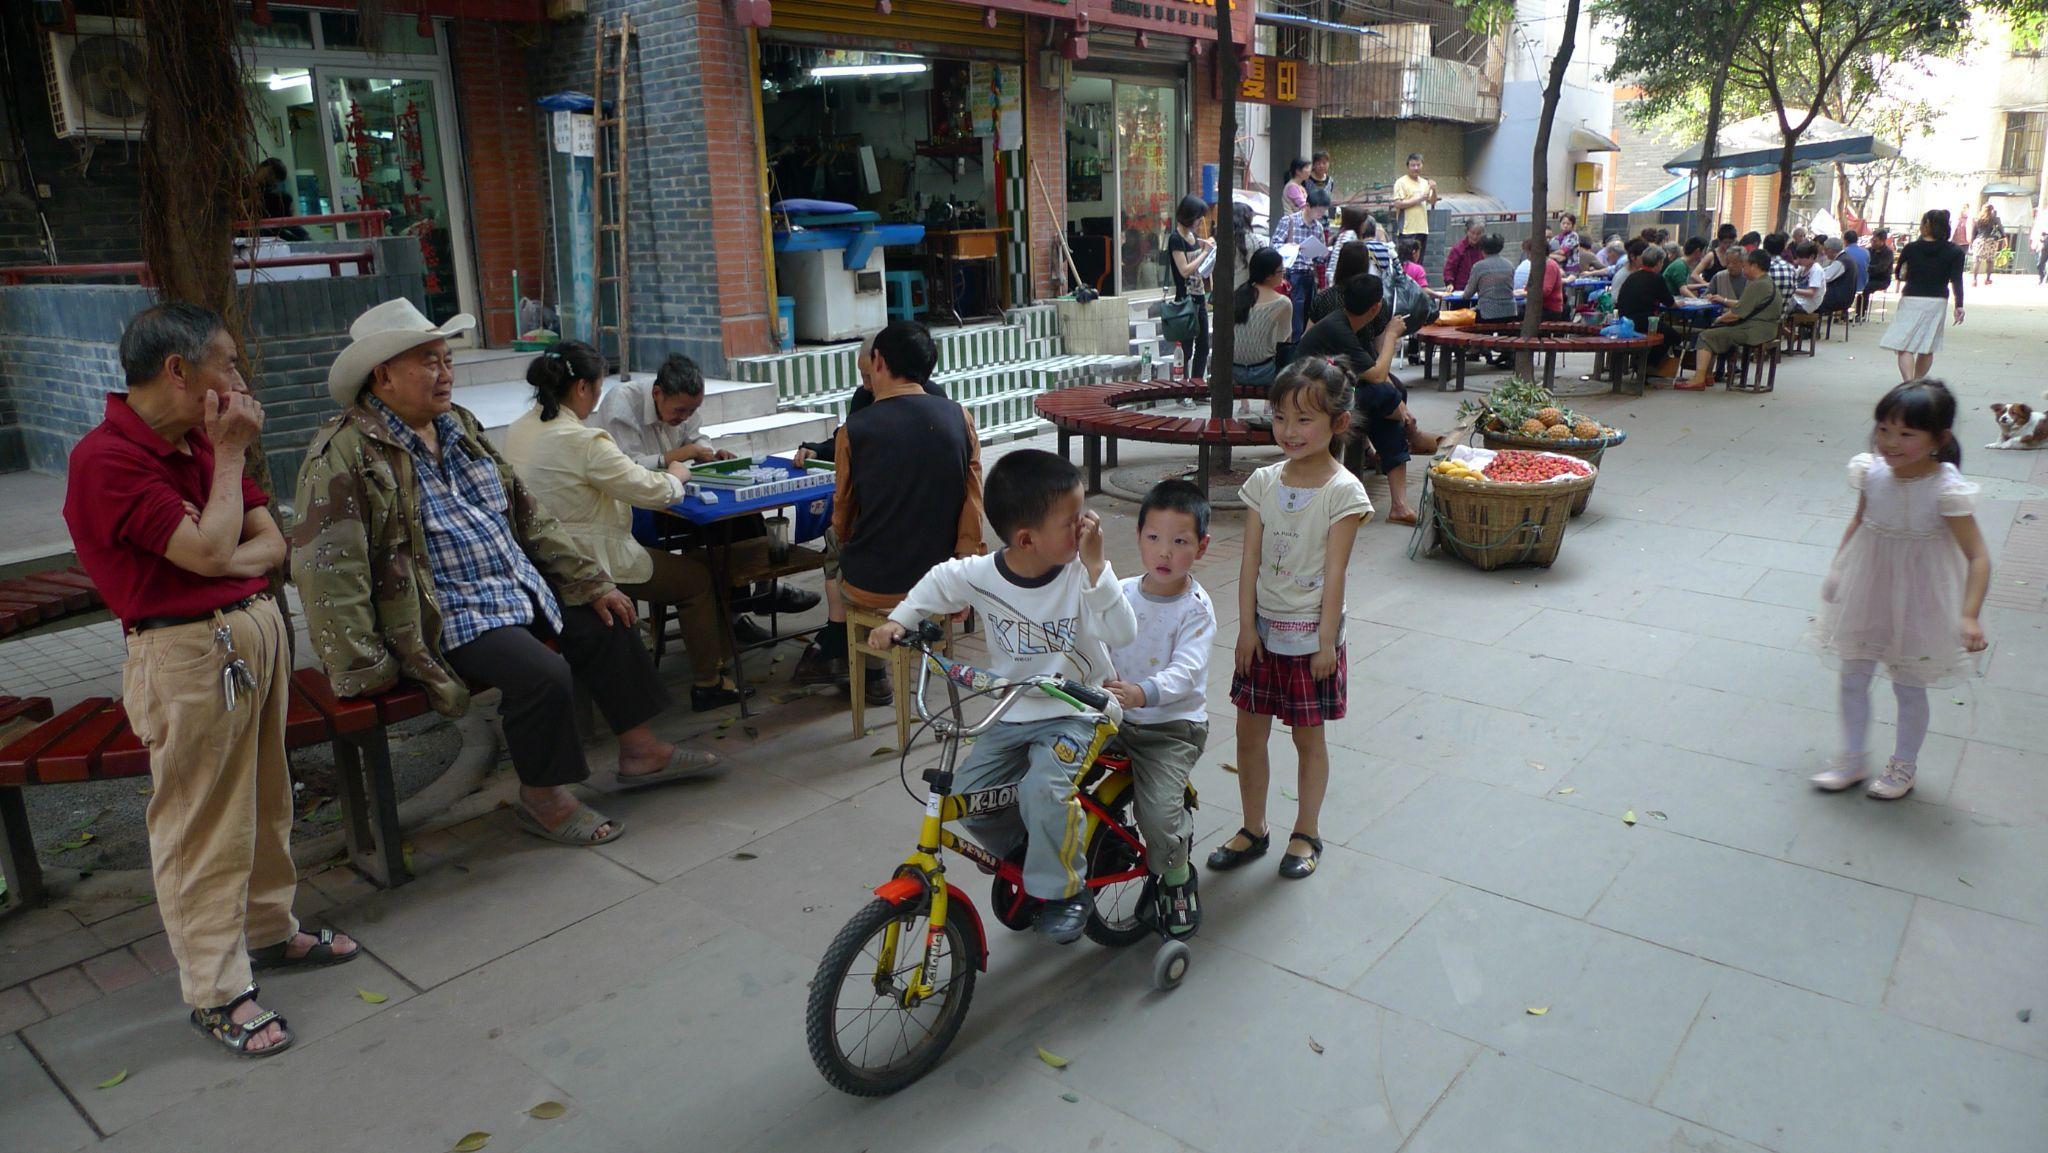
Climate-aligned urbanism offers a different way to move…
With everyday amenities and services located more compactly and integrated with transport, people can move around in more social, active ways.
Photo: Bernard Van Leer Foundation
Photo: Gehl
Photo: Gehl
A different way to consume
Less duplicative ownership …
… more shared tools, resources, and projects.
Climate-aligned urbanism offers a different way to consume…
Compact cities bring us closer to one another so we can share resources and build community more efficiently.
Photo: Bernard Van Leer Foundation
Photo: Berkeley Public Library
Photo: North Market, CC BY-SA 4.0, via Wikimedia Commons
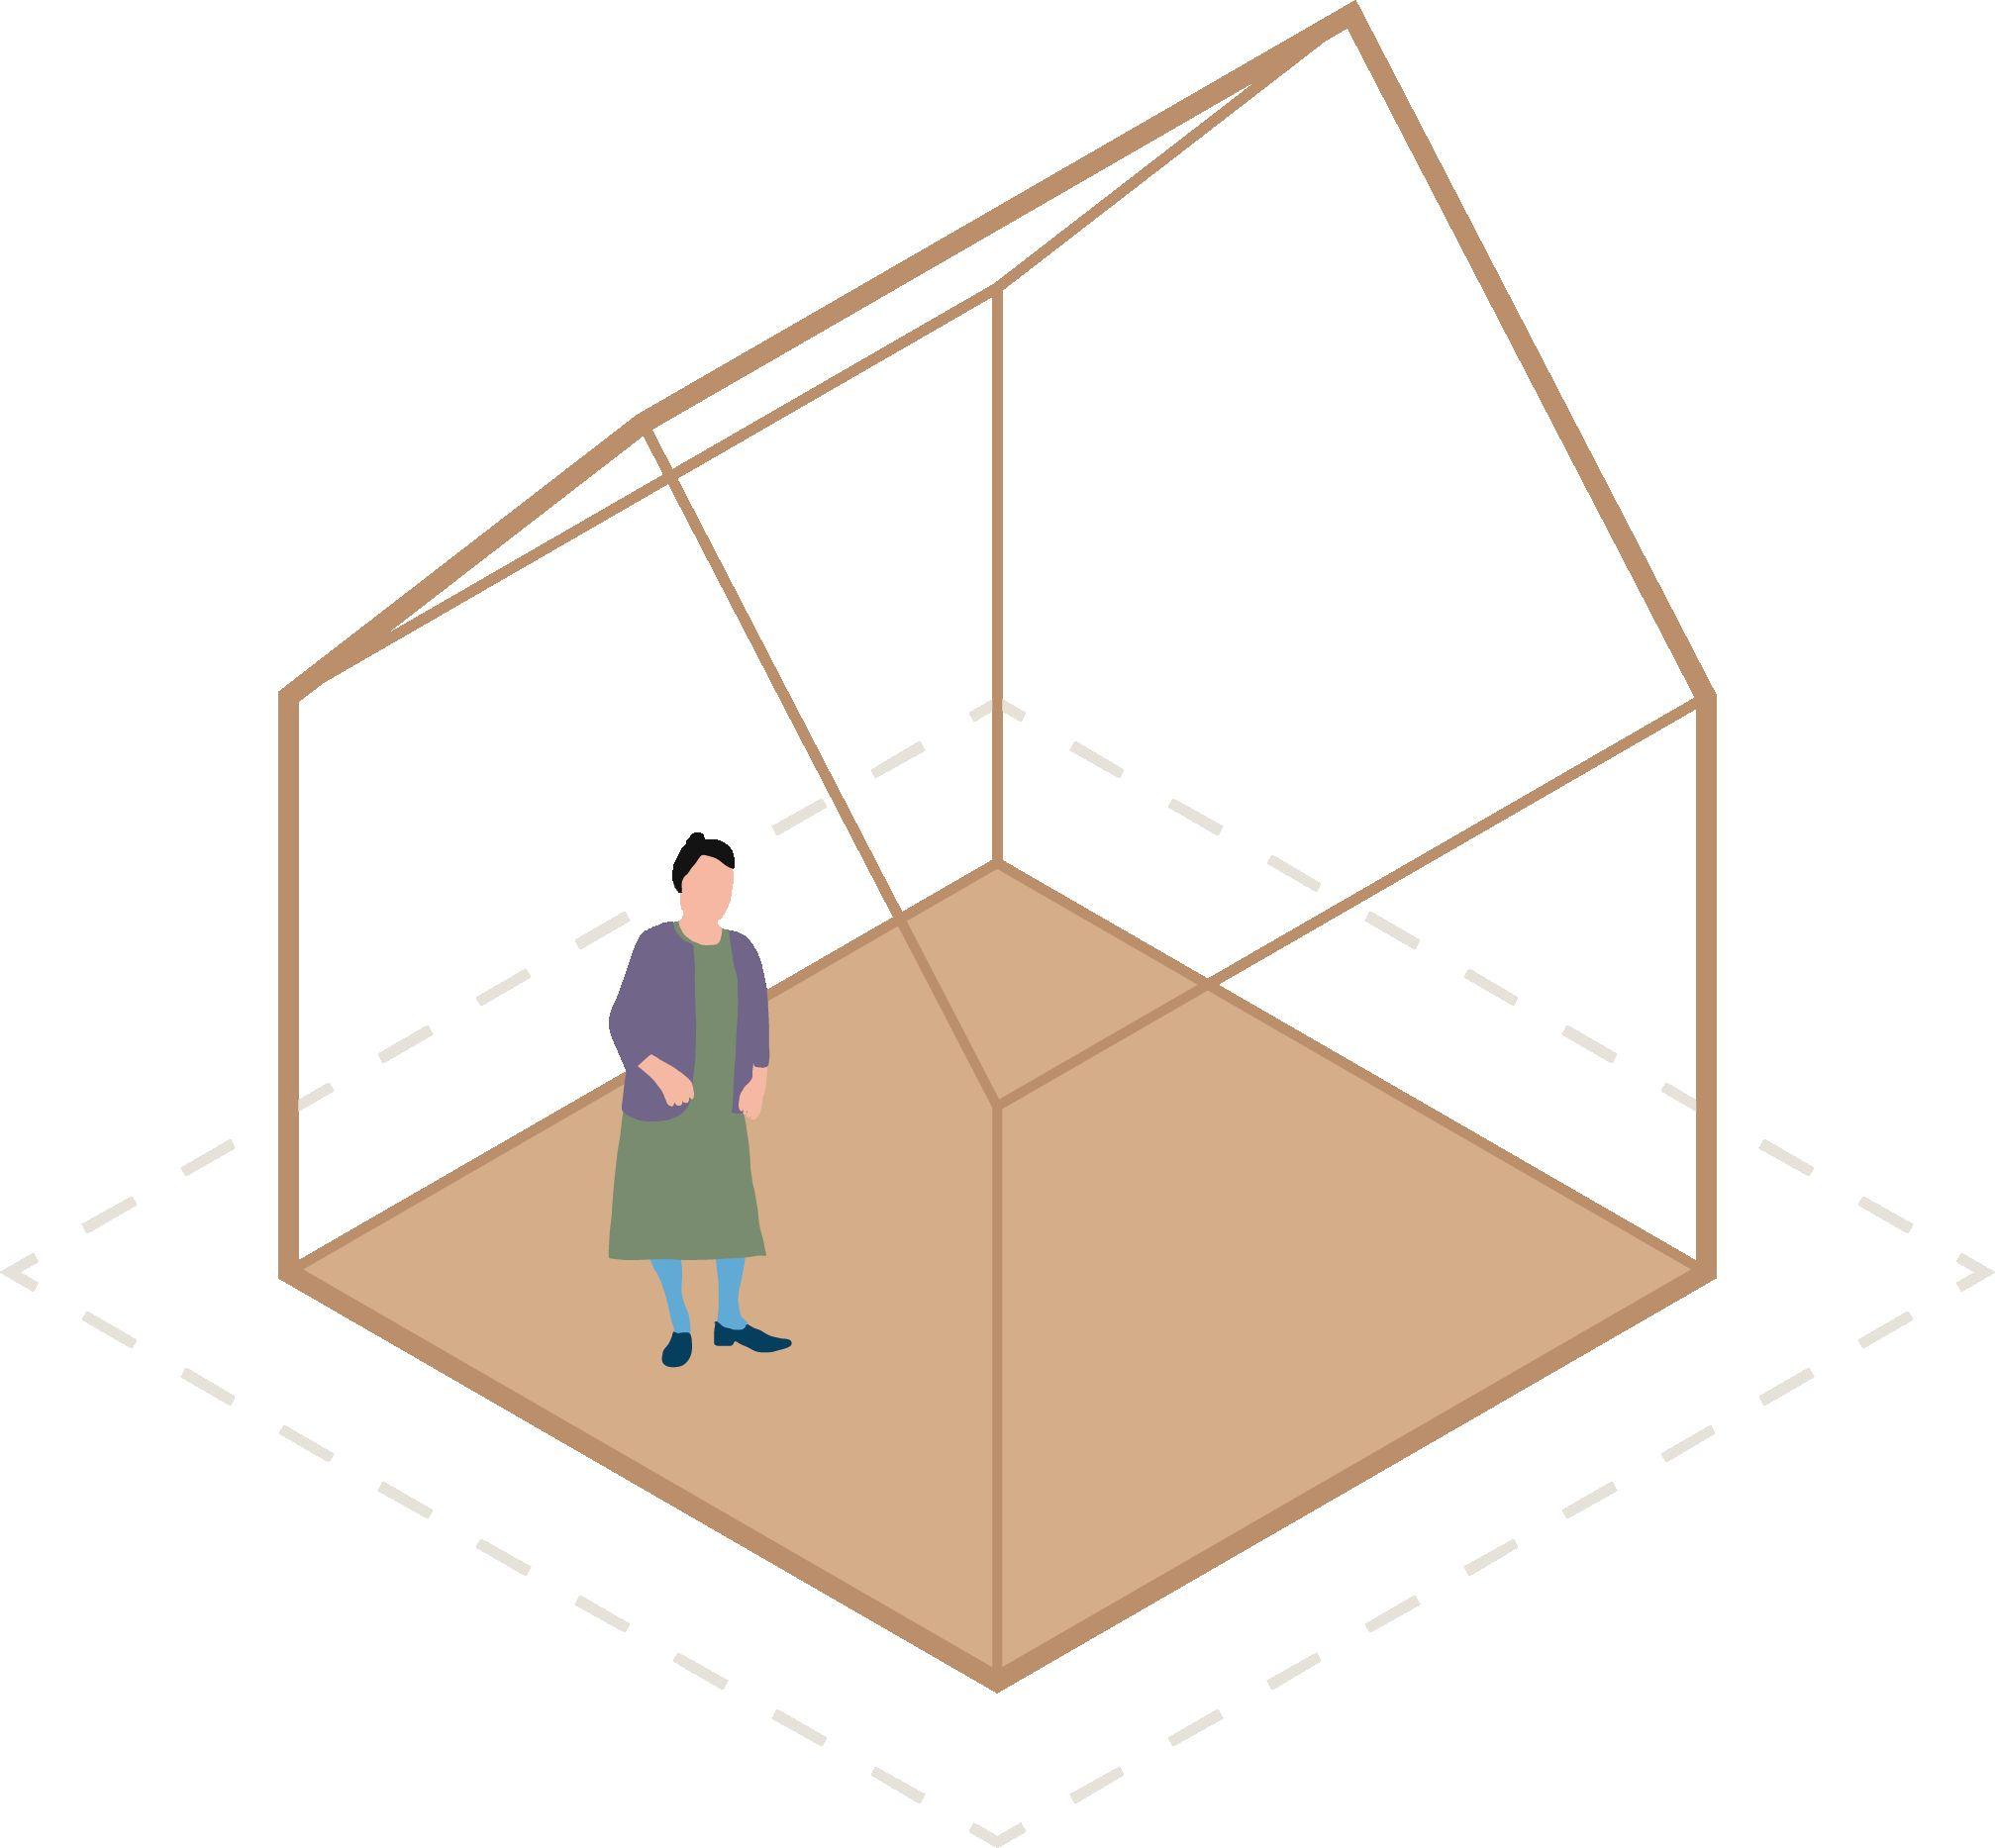
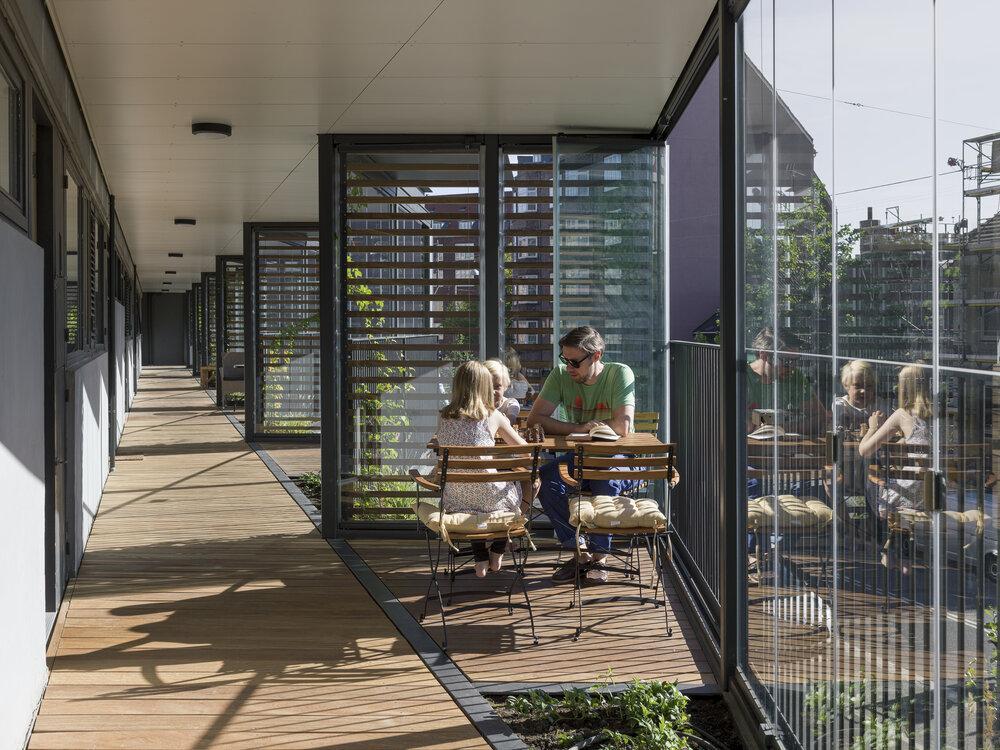
A different way to live
Fewer single-user, inflexible buildings …
… more flexible, repurposable spaces shared between uses and users
Climate-aligned urbanism offers a different way to live…
Architecture can enable us to live in neighborhoods where we interact with and depend on each other, making the most out of the buildings we create.
Photo: City of Buenos Aires
Photo: Gehl
Photo: Lundgaard & Tranberg Architects
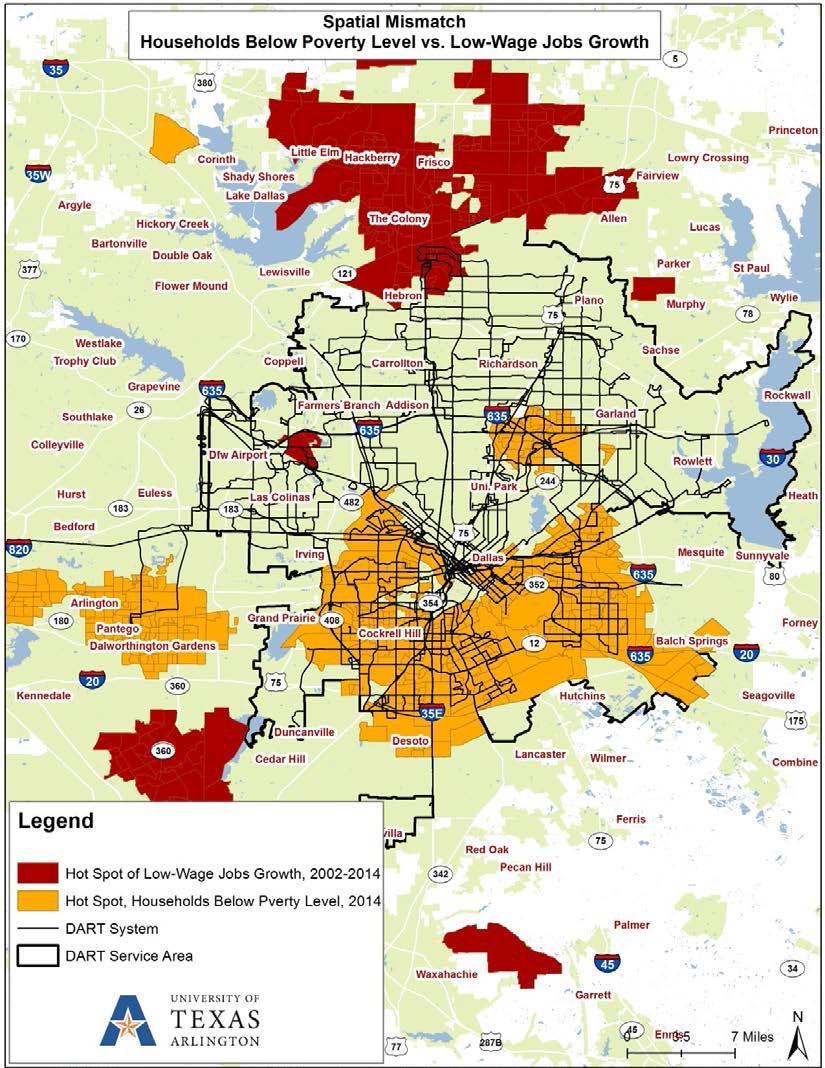
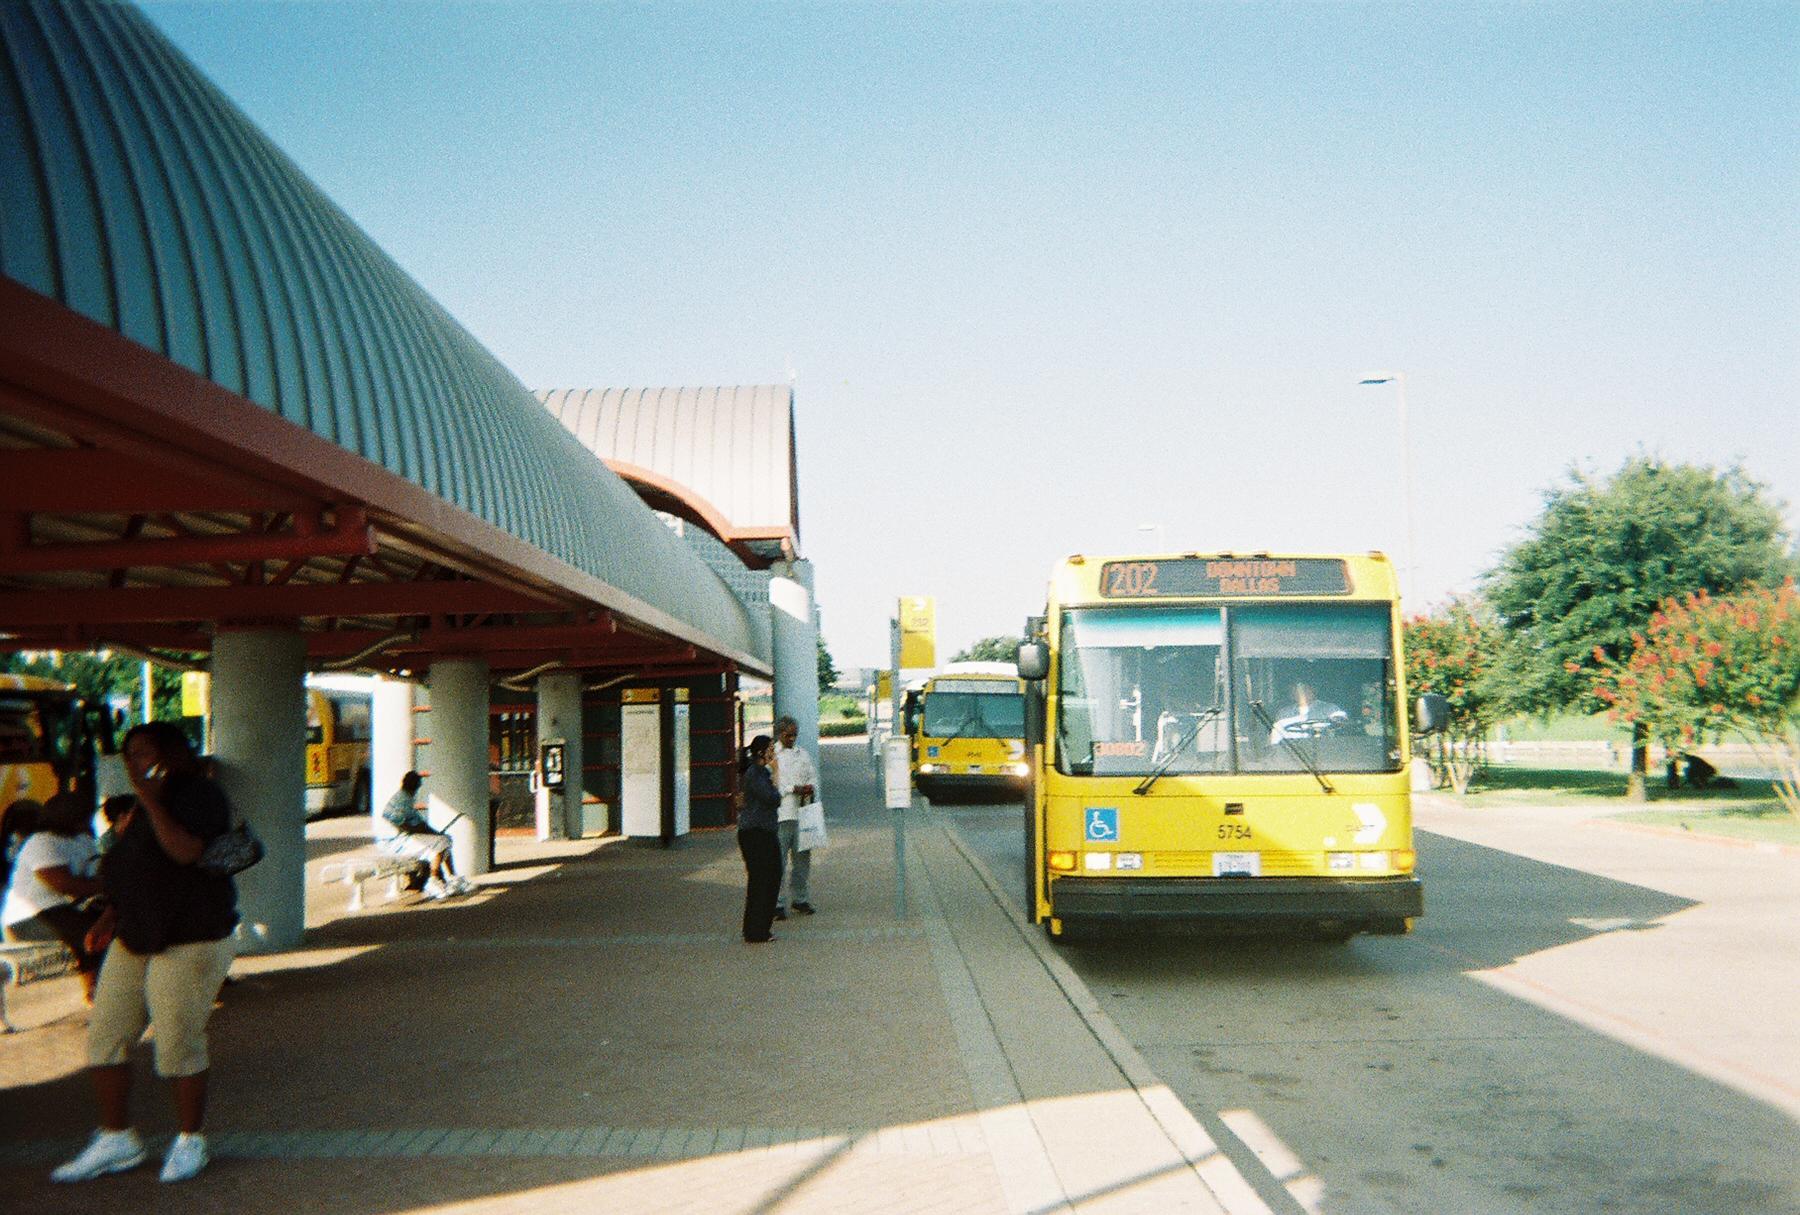
Without a peoplecentered approach, even “good” planning tools can lead to bad outcomes
Building a transit network is necessary — not sufficient — to advance climate friendly cities. To change behavior, we must always consider the human experience.
65% of residents living in the Dallas transit-dependent core have access to fewer than 4% of regional jobs by a 45-minute transit (and walking) commute time
Source: City of Dallas, Transportation Equity and Access to Opportunity for Transit-Dependent Population in Dallas, 2017.
People underestimate the costs of car ownership because many expenses are upfront or lackday-to-day salience; other modes charge per trip, making the expense seem higher.
Source: Uber, One Less Car: Shifting to a sustainable transport future, 2023. https://uber.app.box.com/s/gdso9de1fwc58glg6nvjiz23aicls0cb
Source: Unsplash
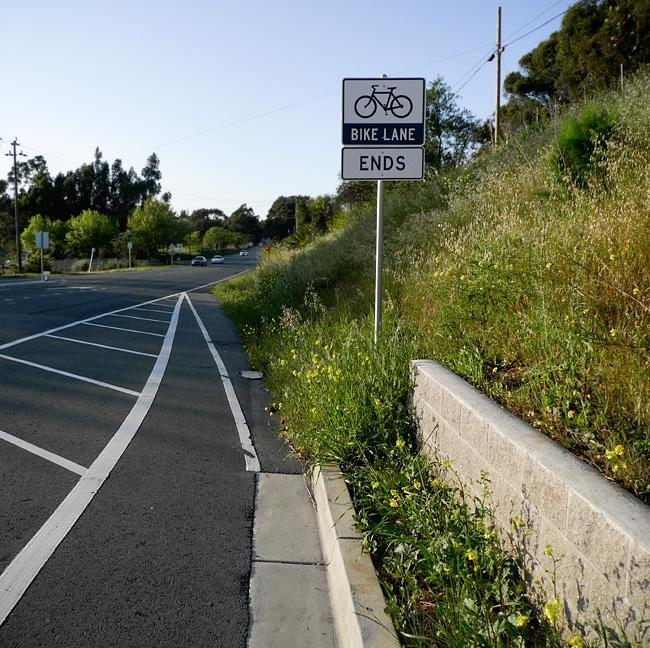
It’s the eye level urban design details that make or break planning and policy
To really change people’s behavior, the sustainable choice must be the easiest, most dignified, and practical choice.
Sources: The Friday Cyclotouriste, DH Pace, NewYorkTimes, Kurt Iveson
Investment in infrastructure of dispersion
Dependency
Roadway width, low place value
Demand Personal cars and private amenities
Dependency movement efficiency, high place value
…and climate-aligned urbanism are path dependent.
Investment in infrastructure of connection
Behavior
Underused public spaces and imbalanced economies
Behavior
Vibrant public spaces and local economies
and
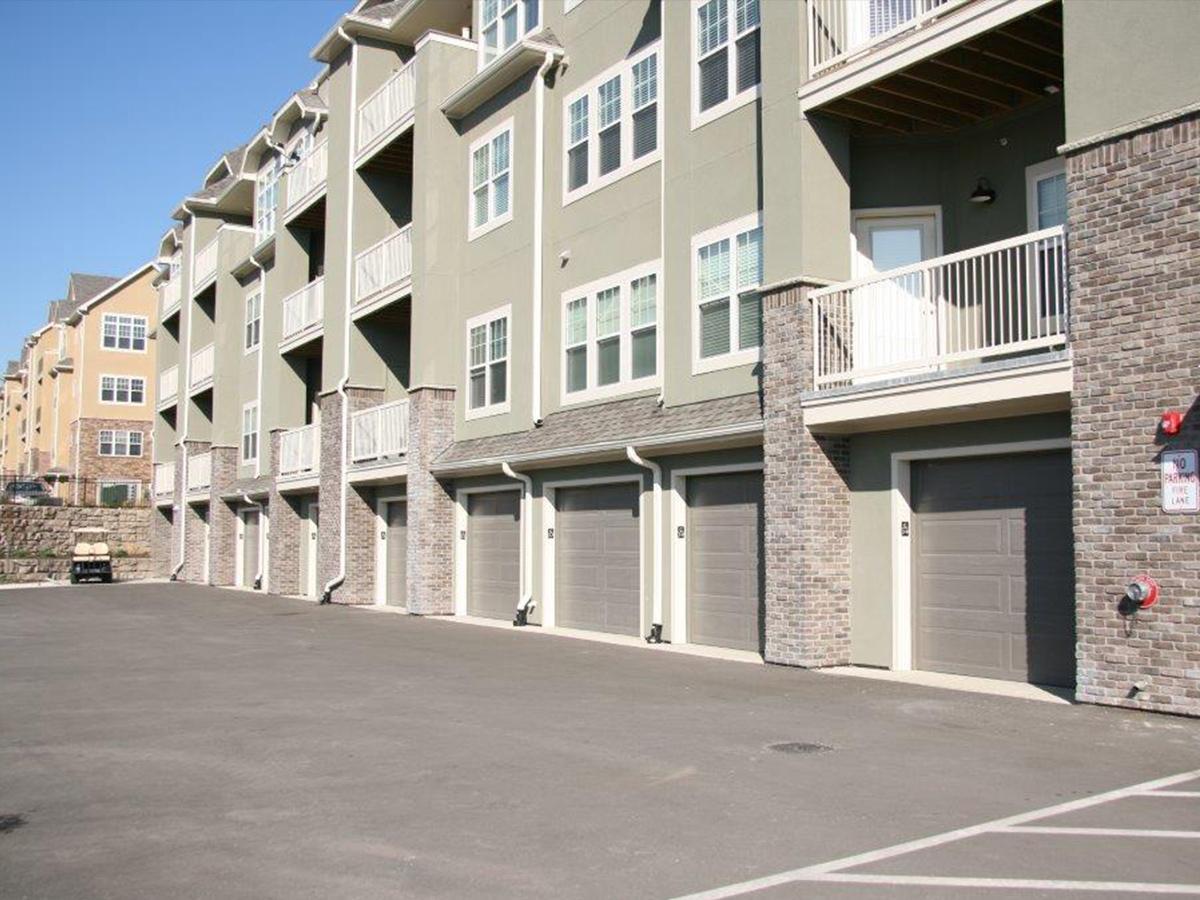
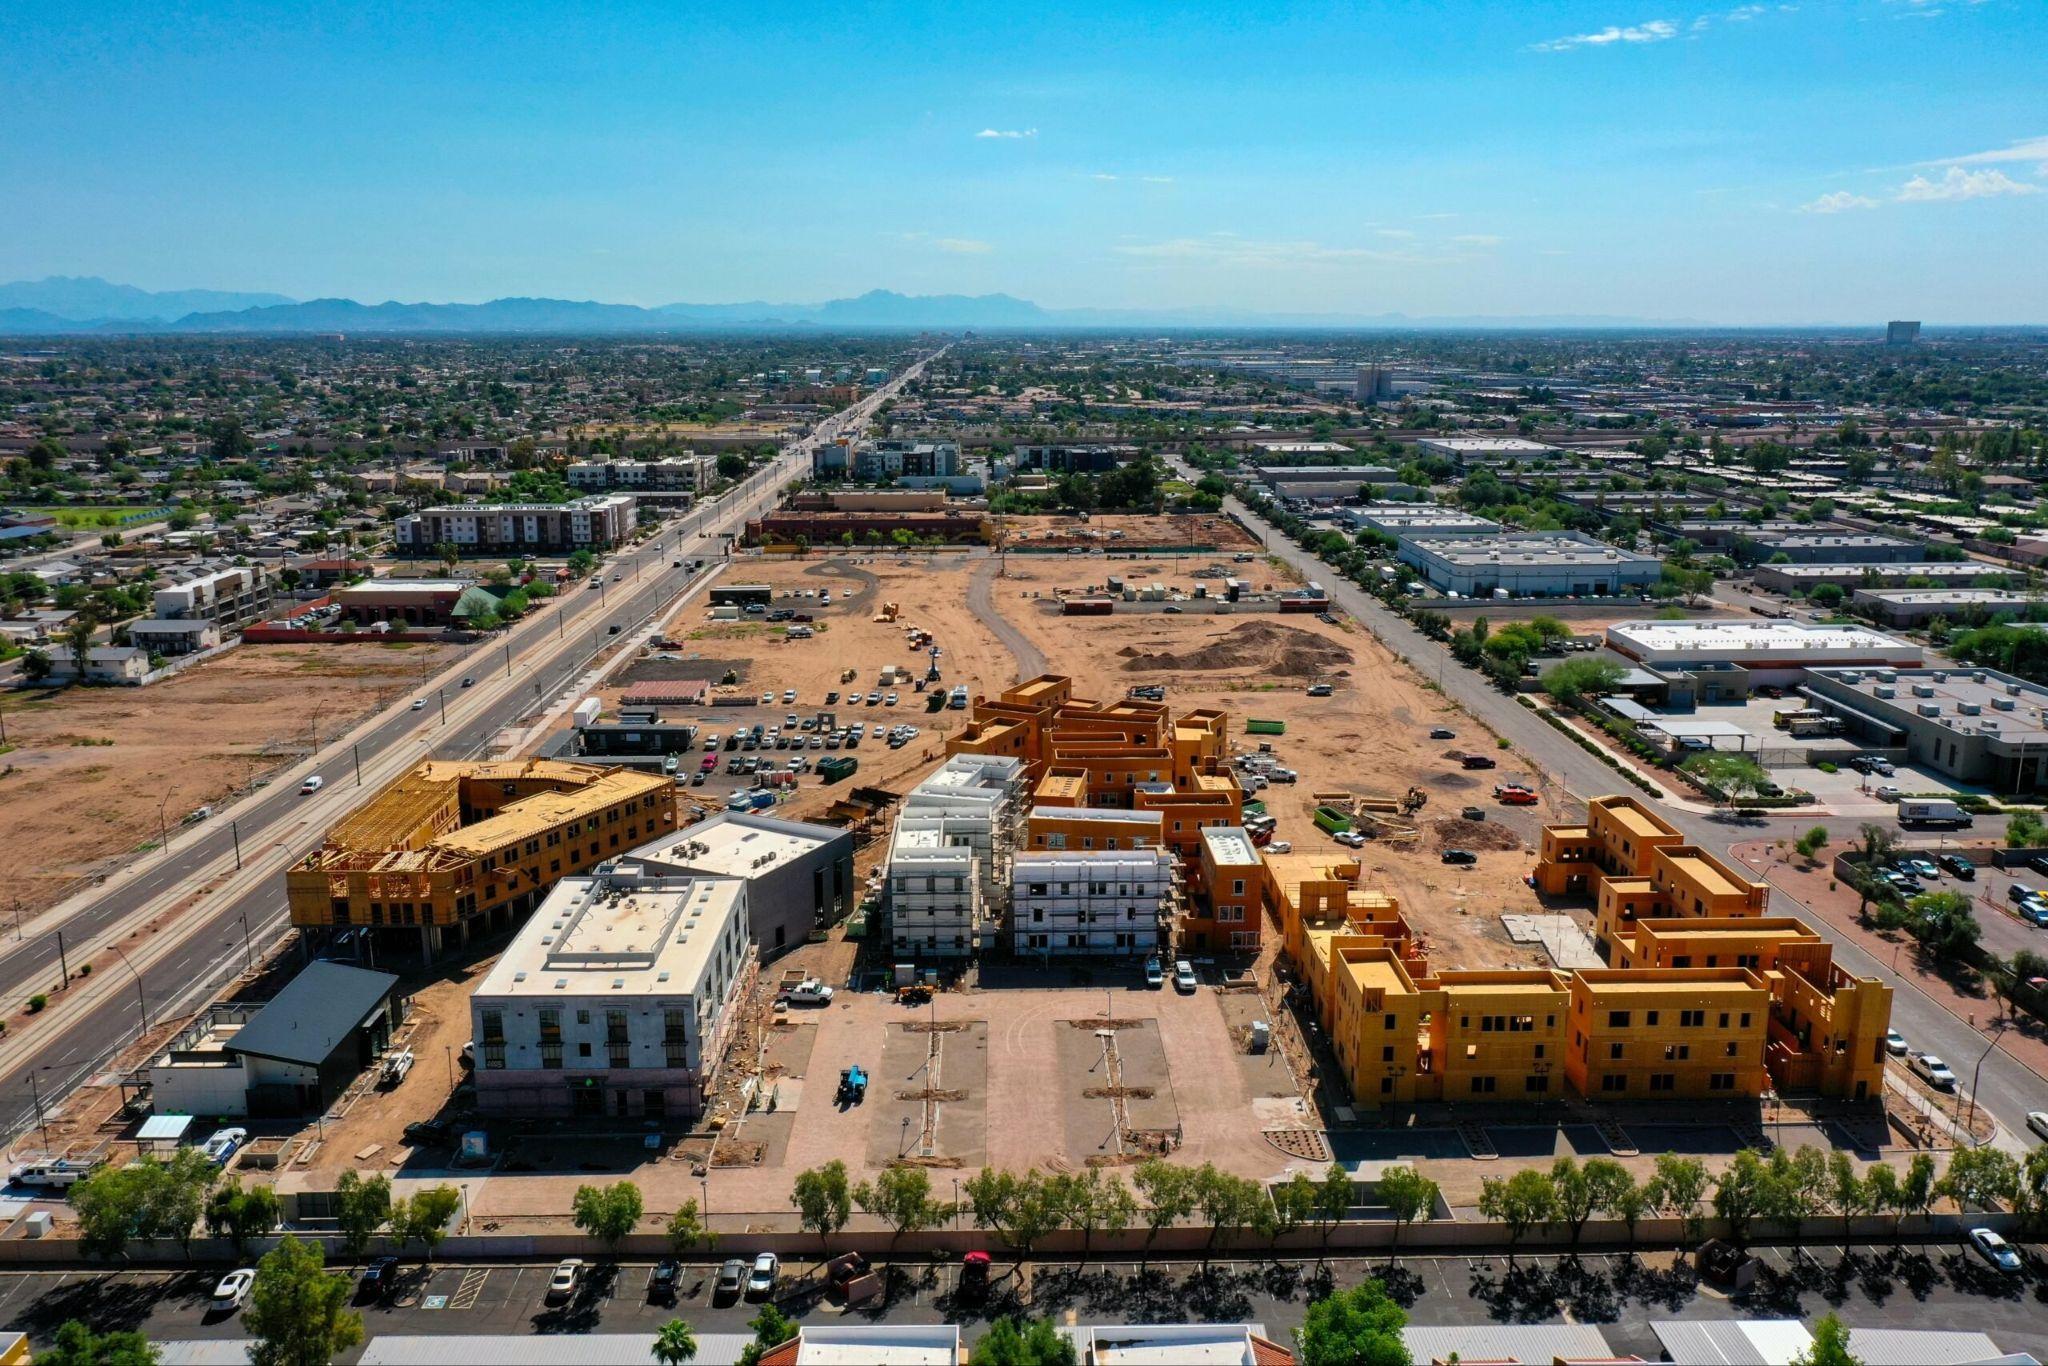
We need to ensure new developments make the right choices
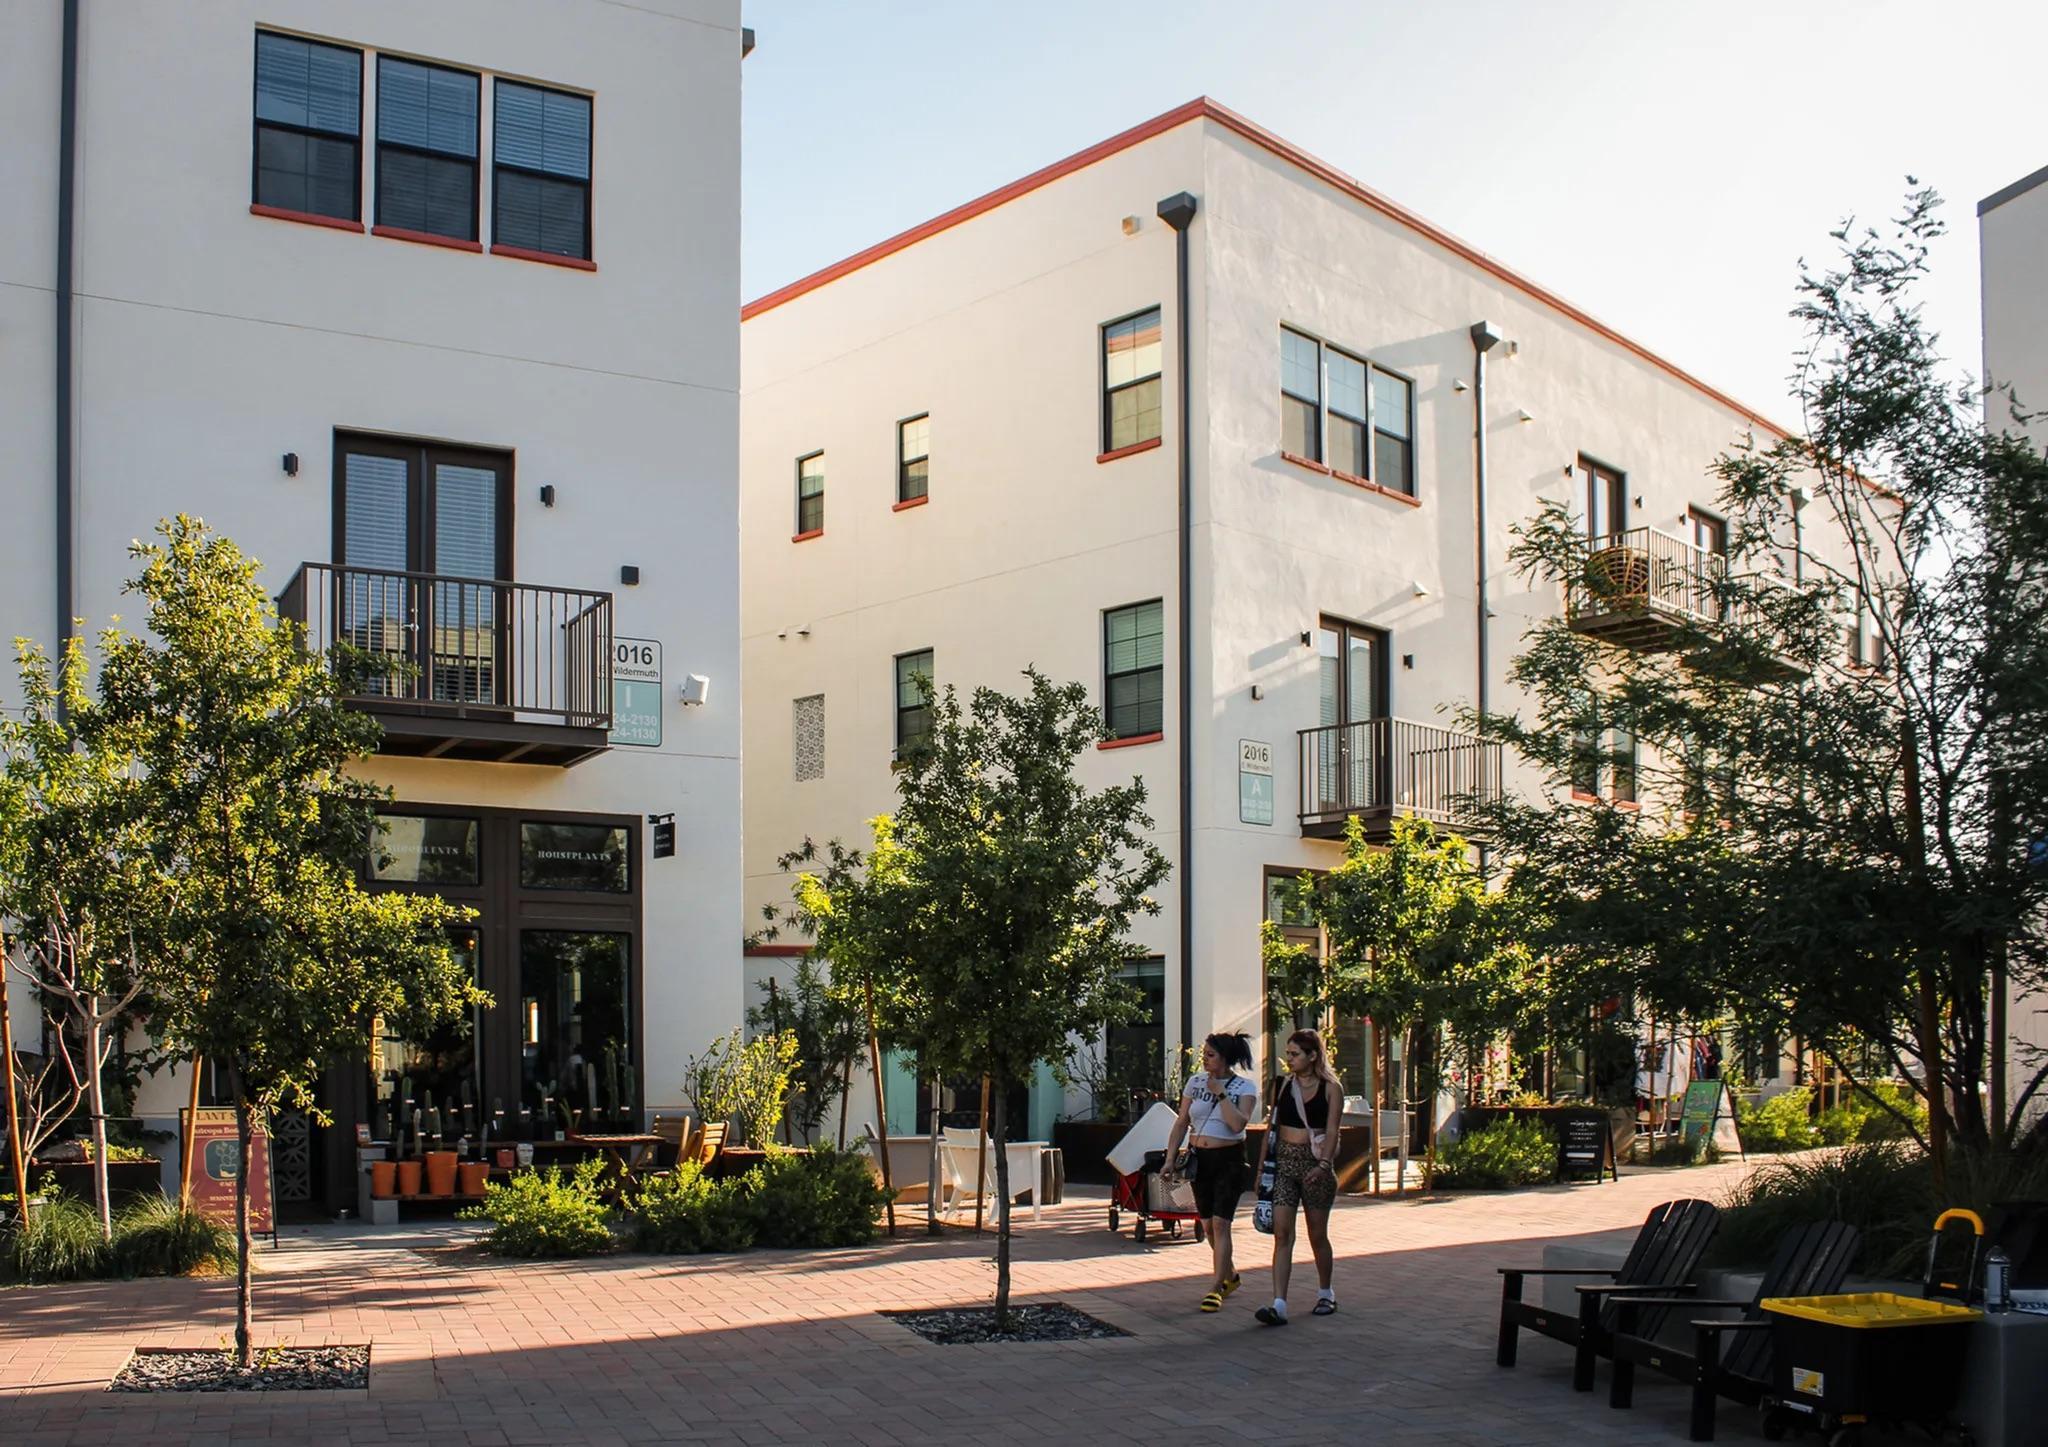
New neighborhoods in growing cities should embrace more compact, efficient form.
Culdesac, Tempe, USA →
Source: Culdesac
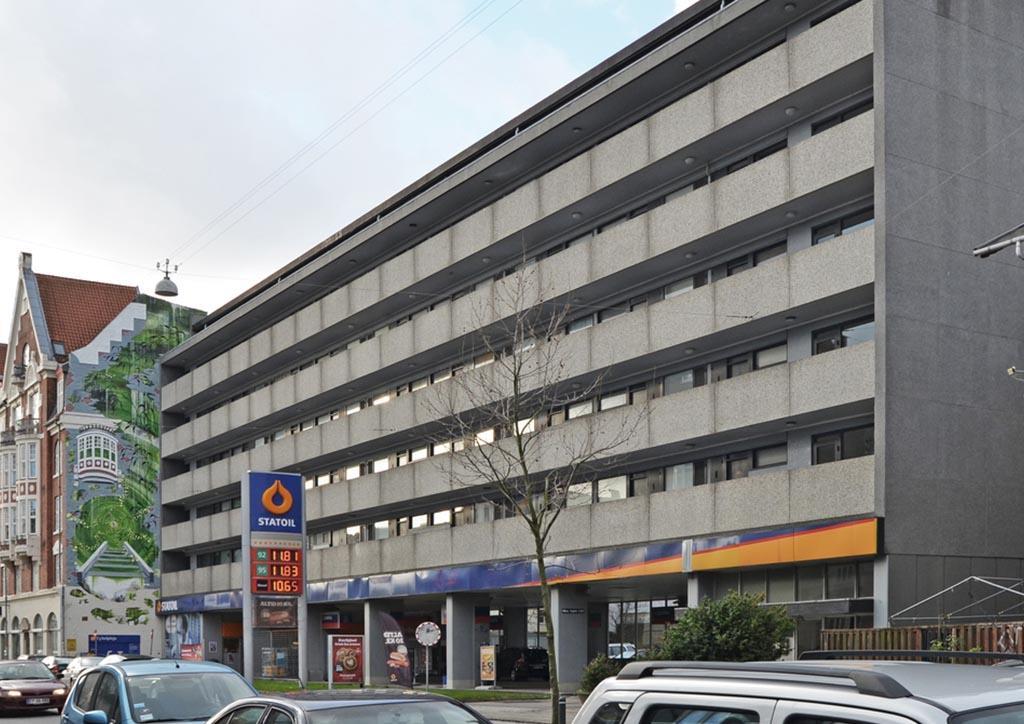
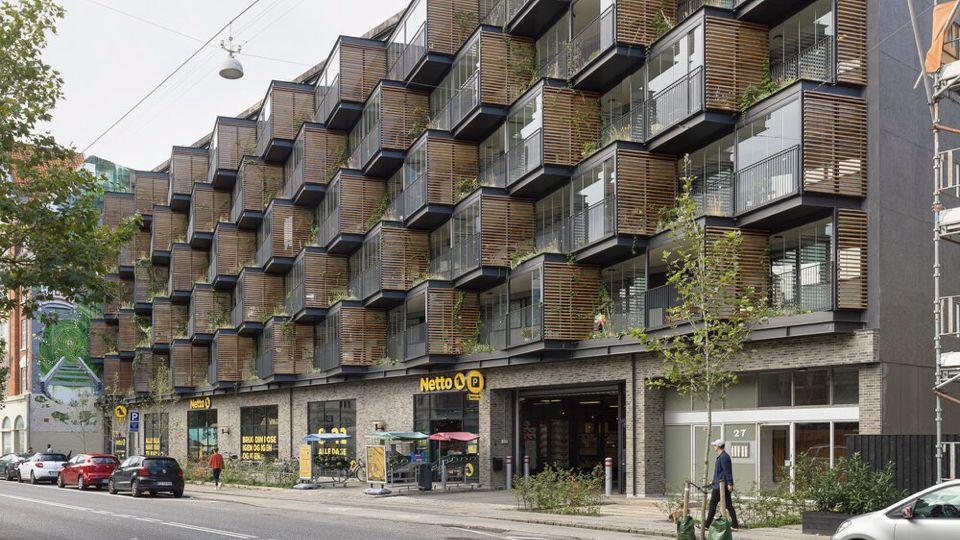
And, we need to retrofit what we’ve already built
Starting over isn’t an option for the climate — retrofitting preserves our past investments, both economically and in terms of carbon.
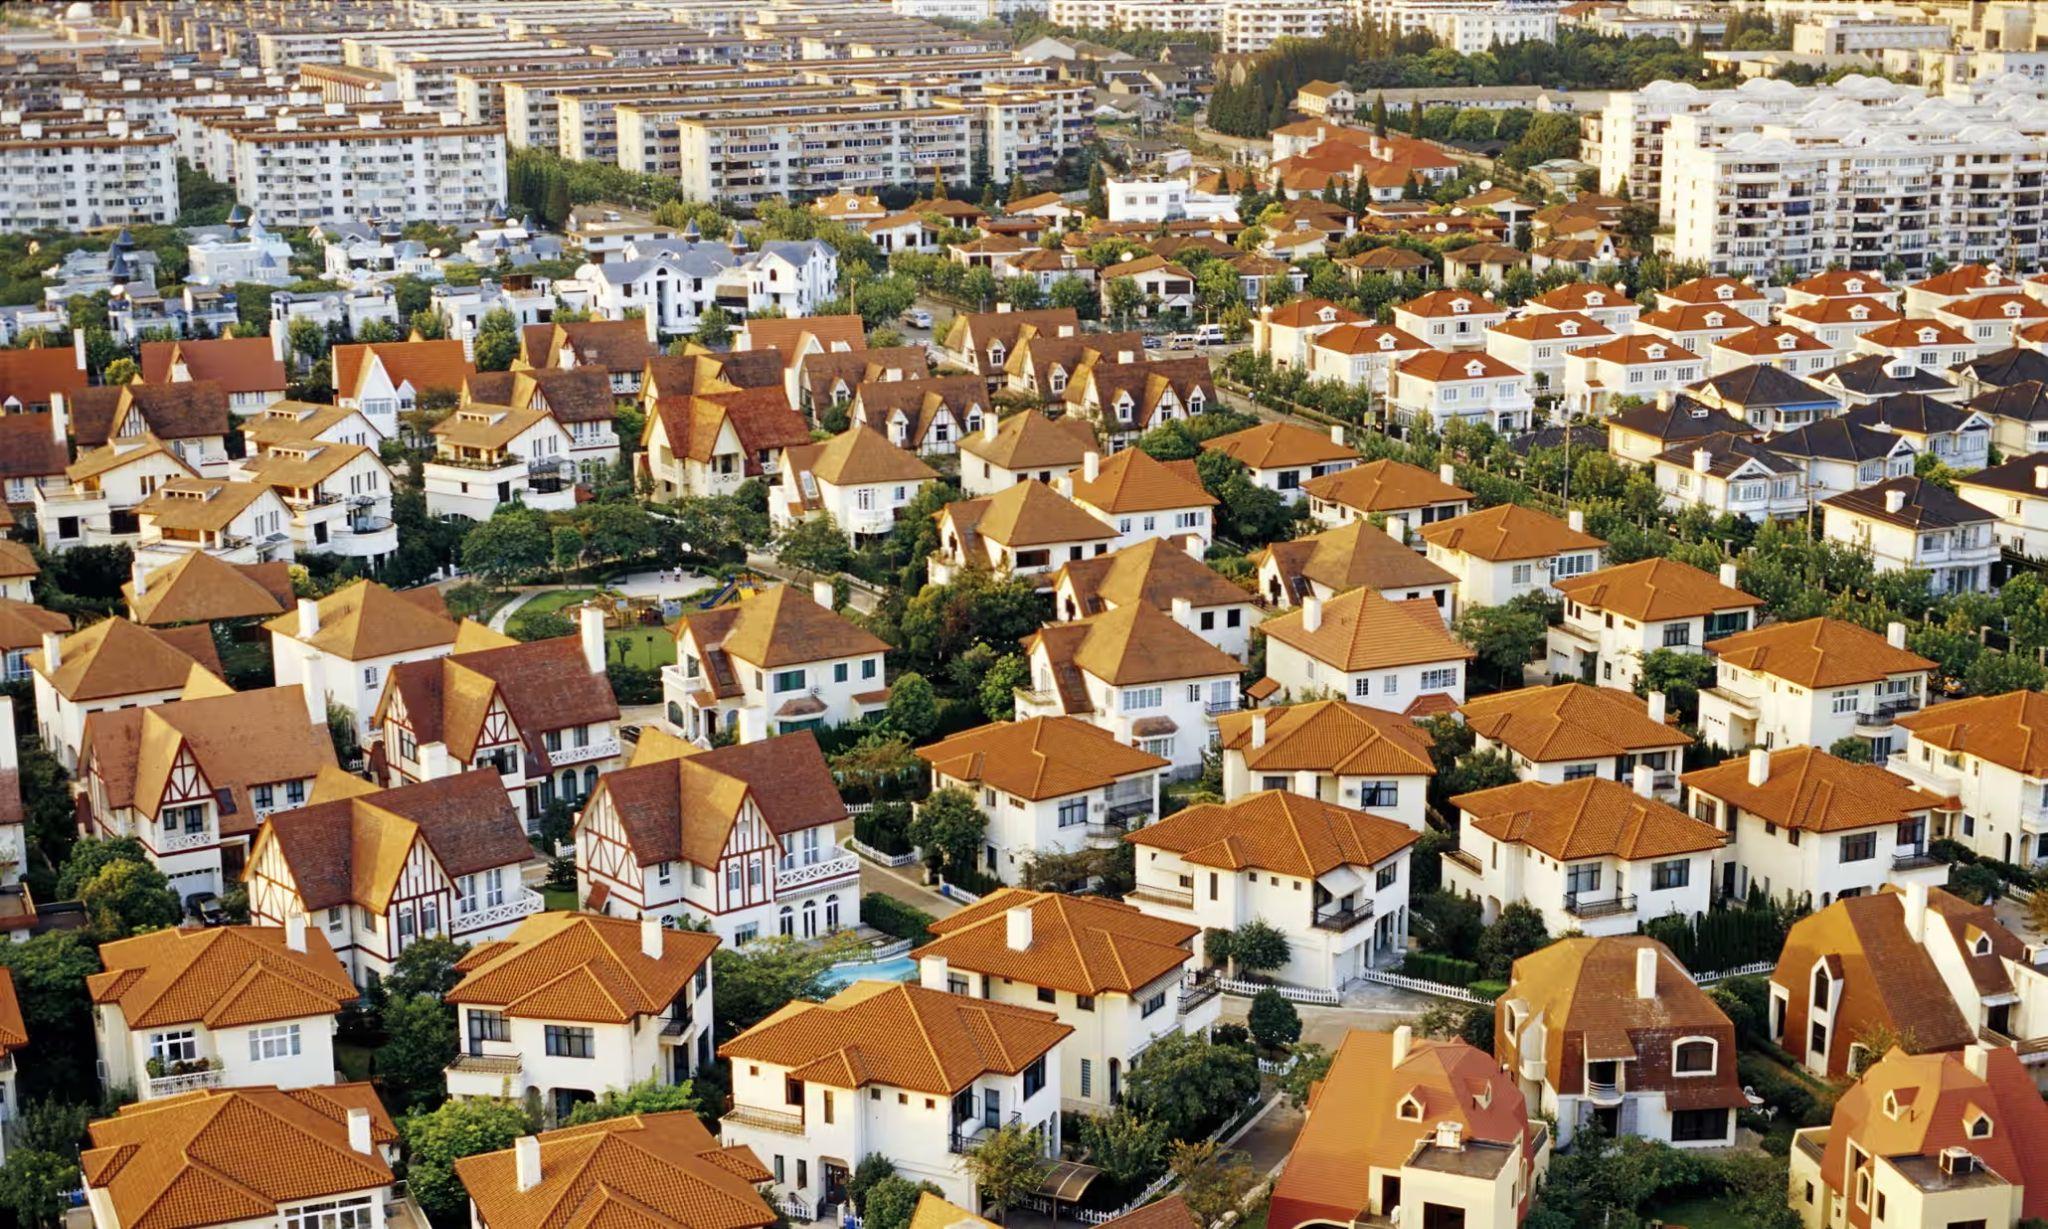
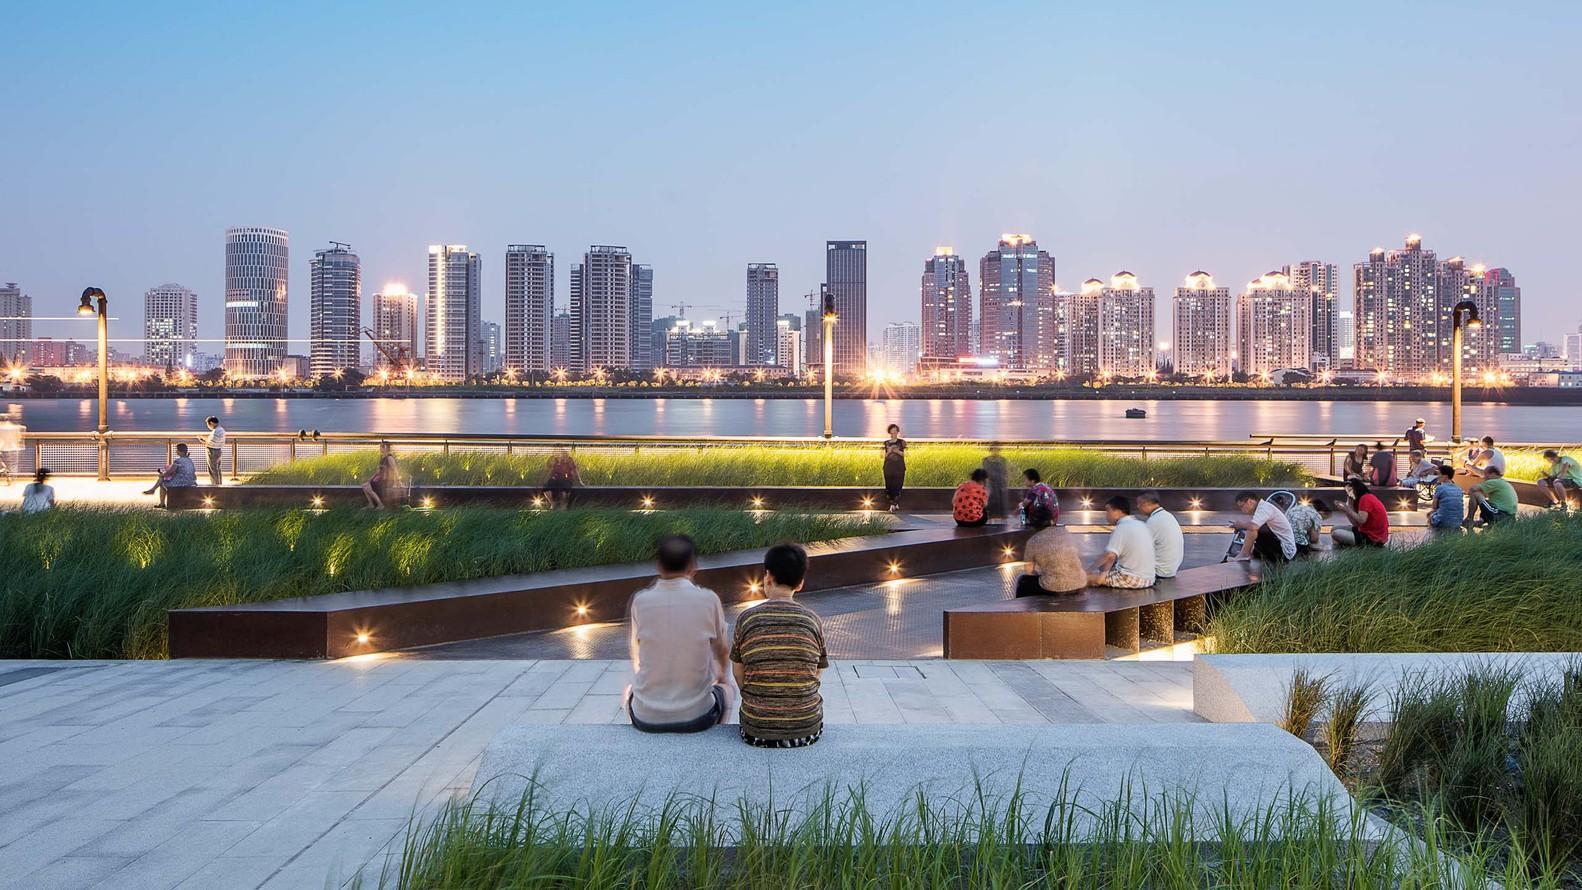
Shanghai, China →
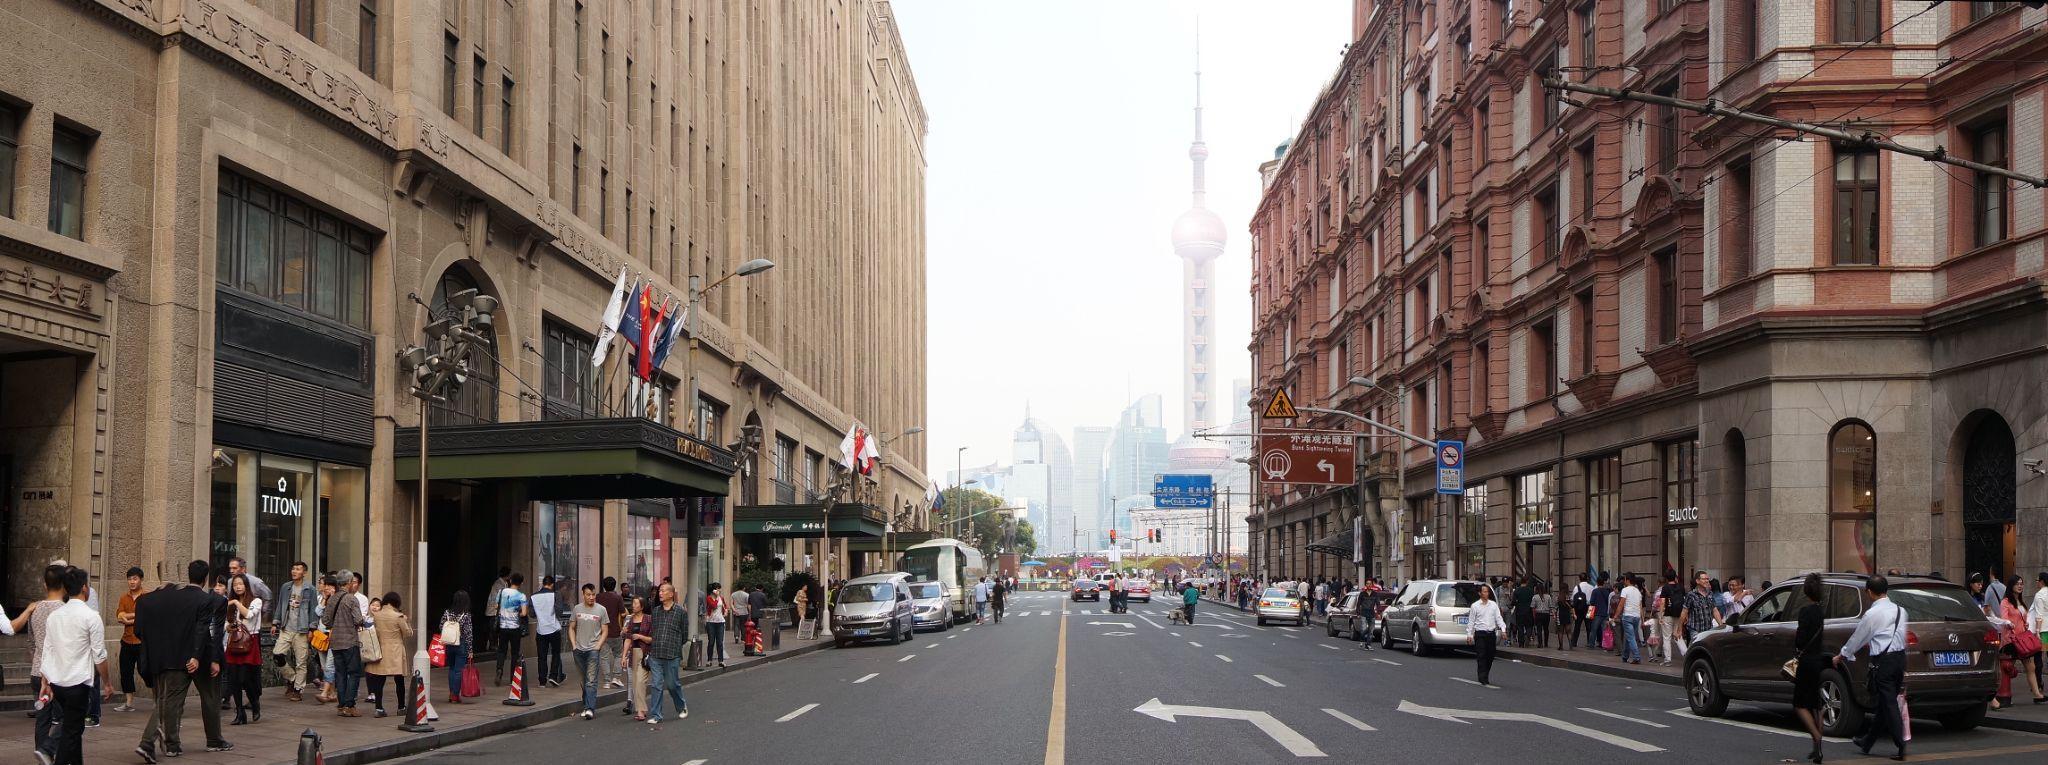
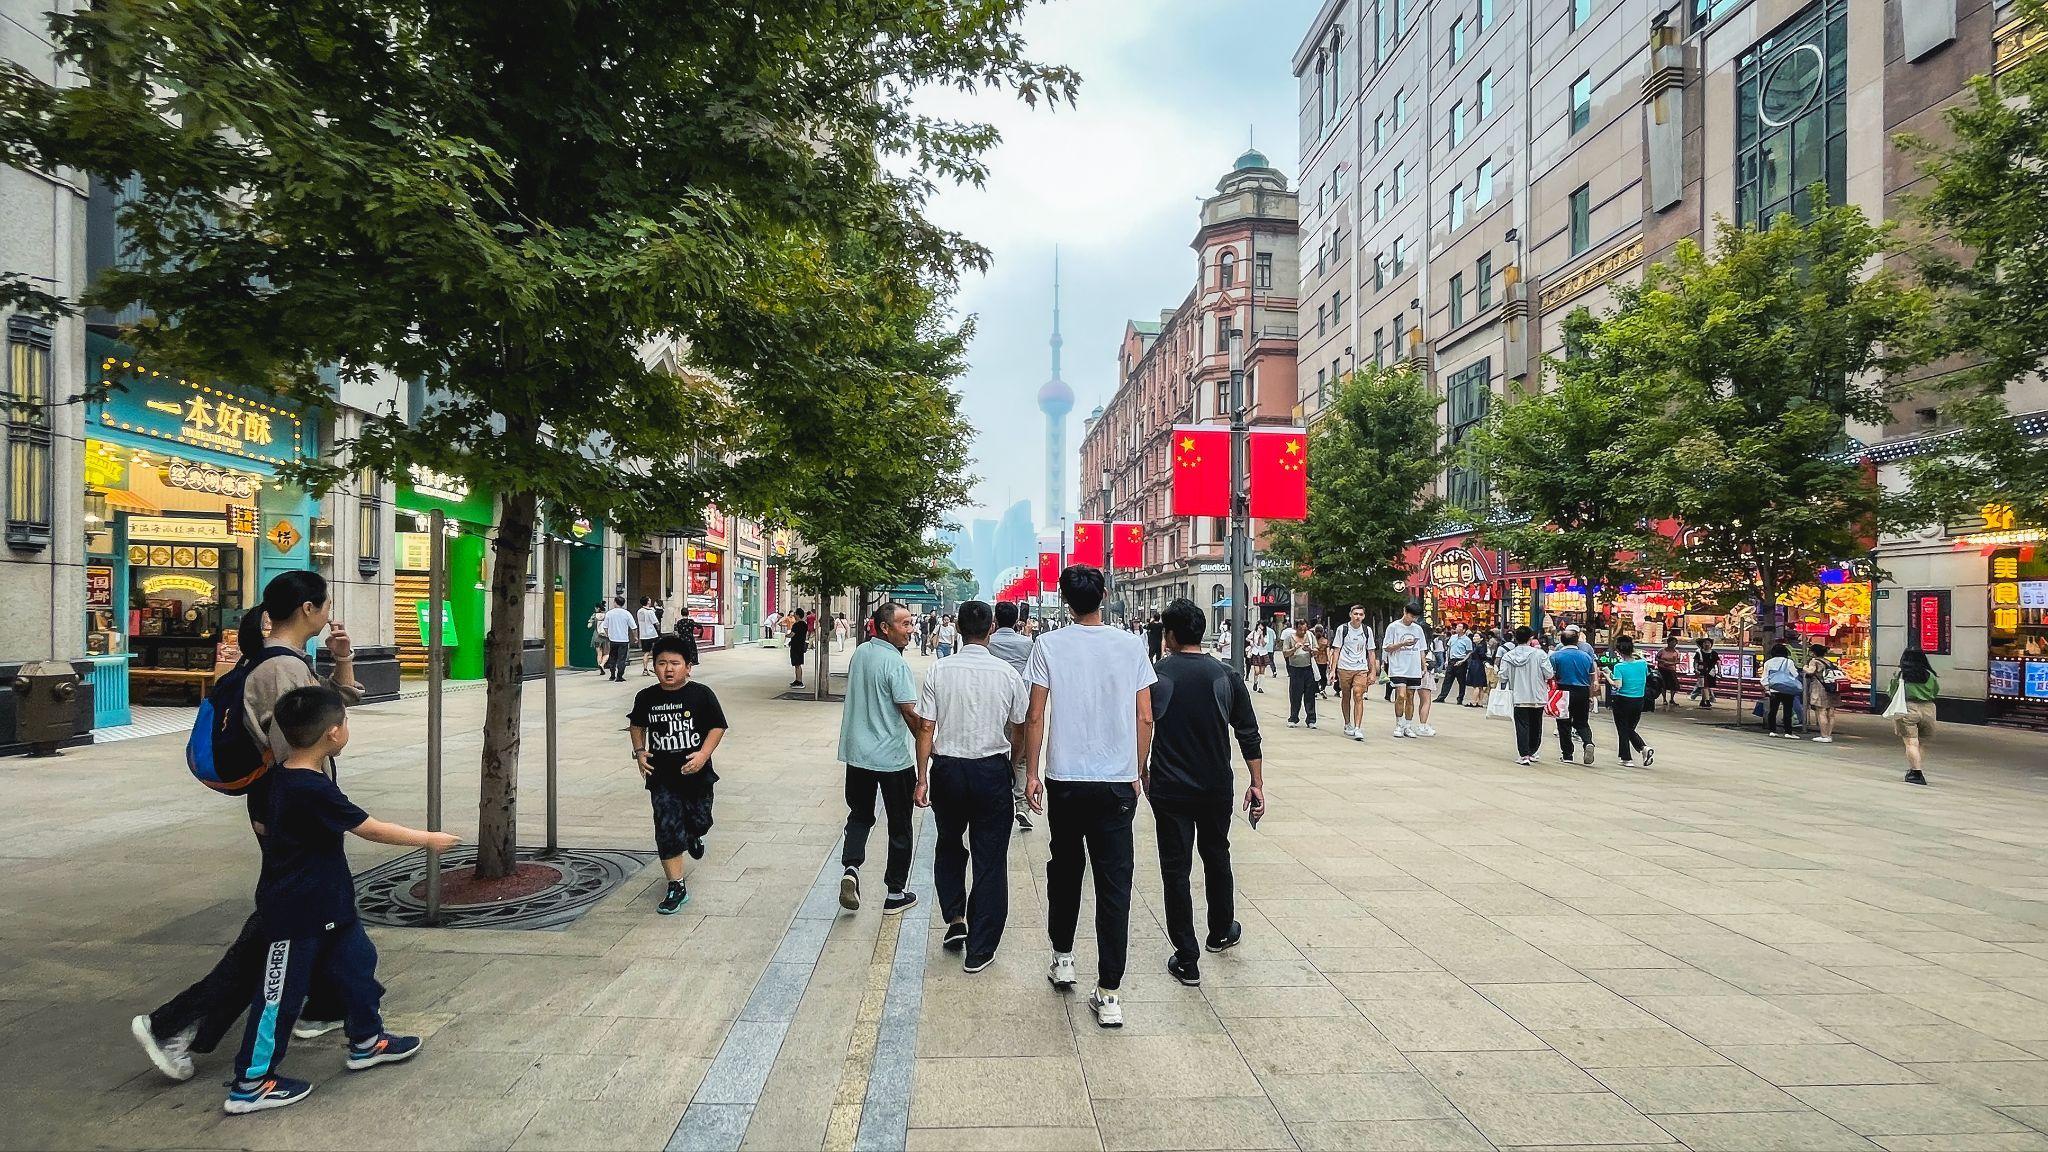
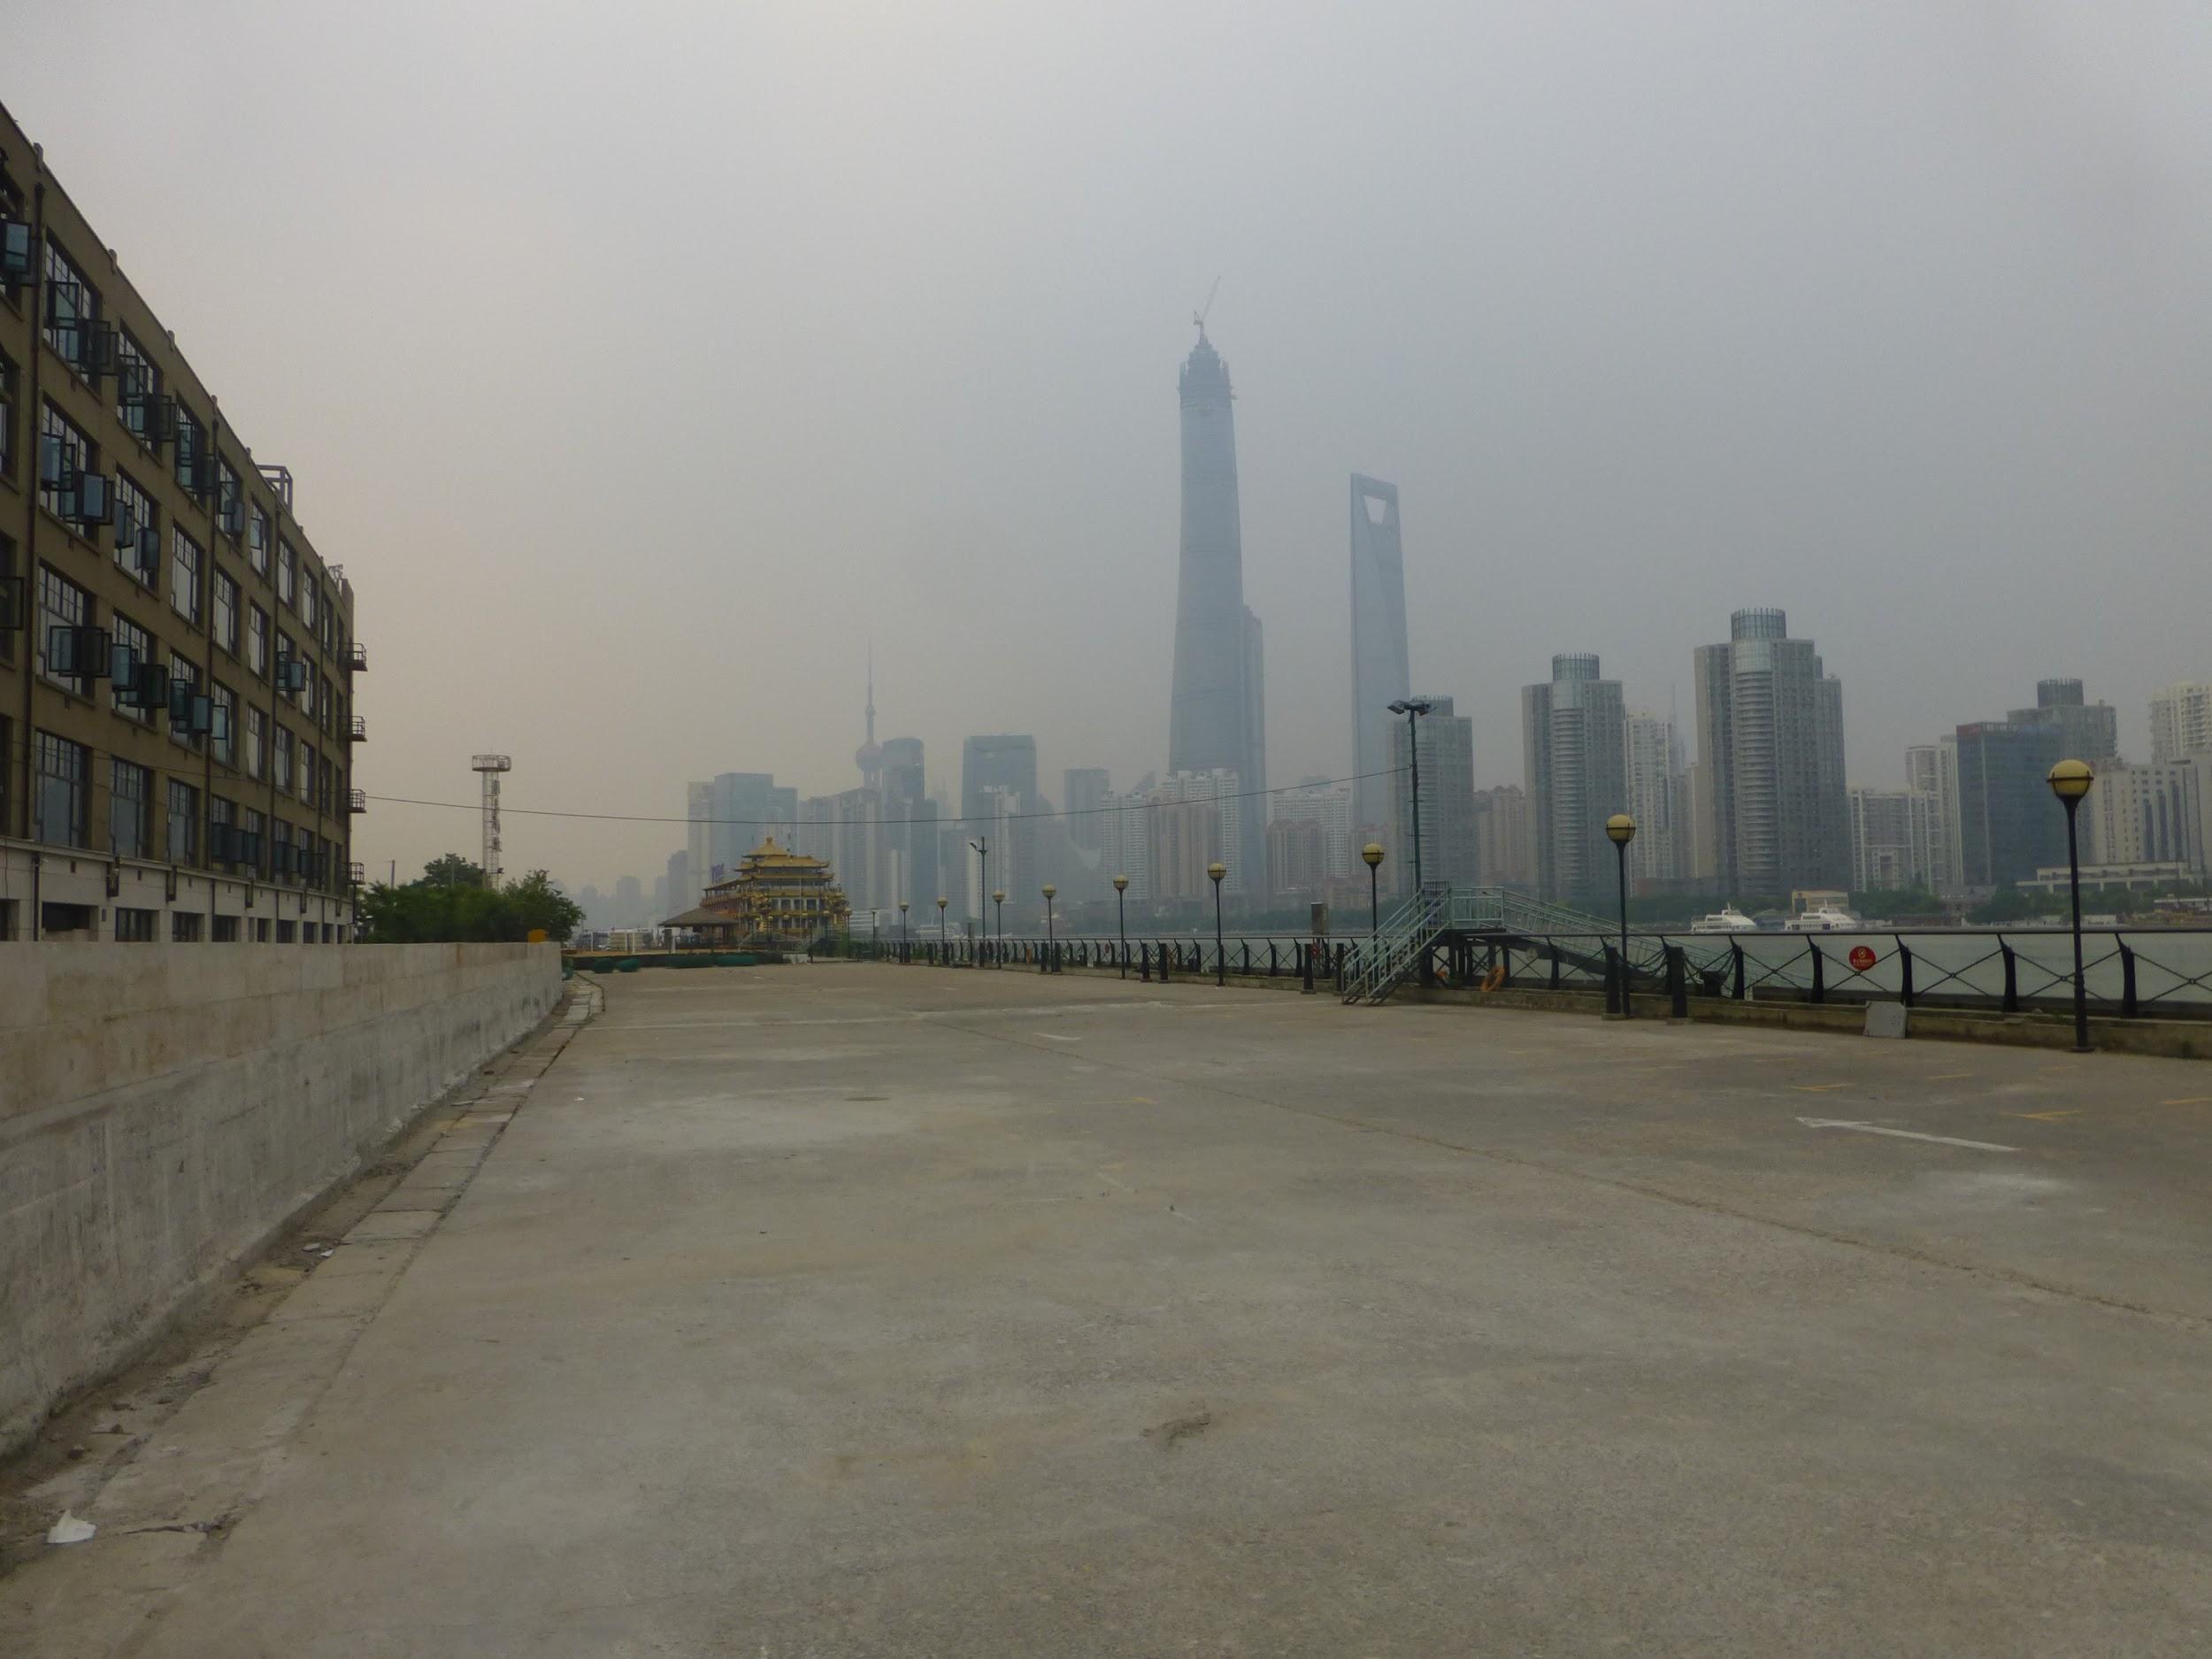
Connecting people and the river in Shanghai
Shanghai’s riverfront before Huangpu River today
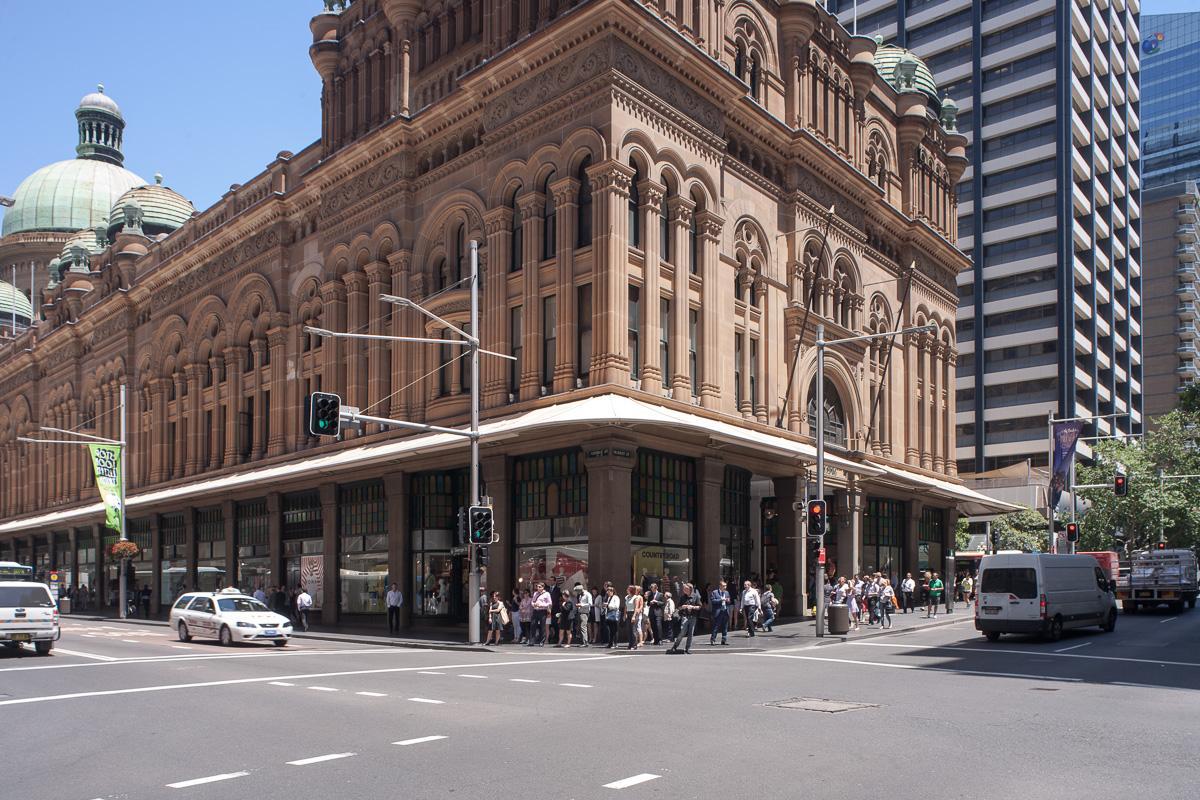
Making multimodal streets in Sydney
Sydney’s George Street before George Street today
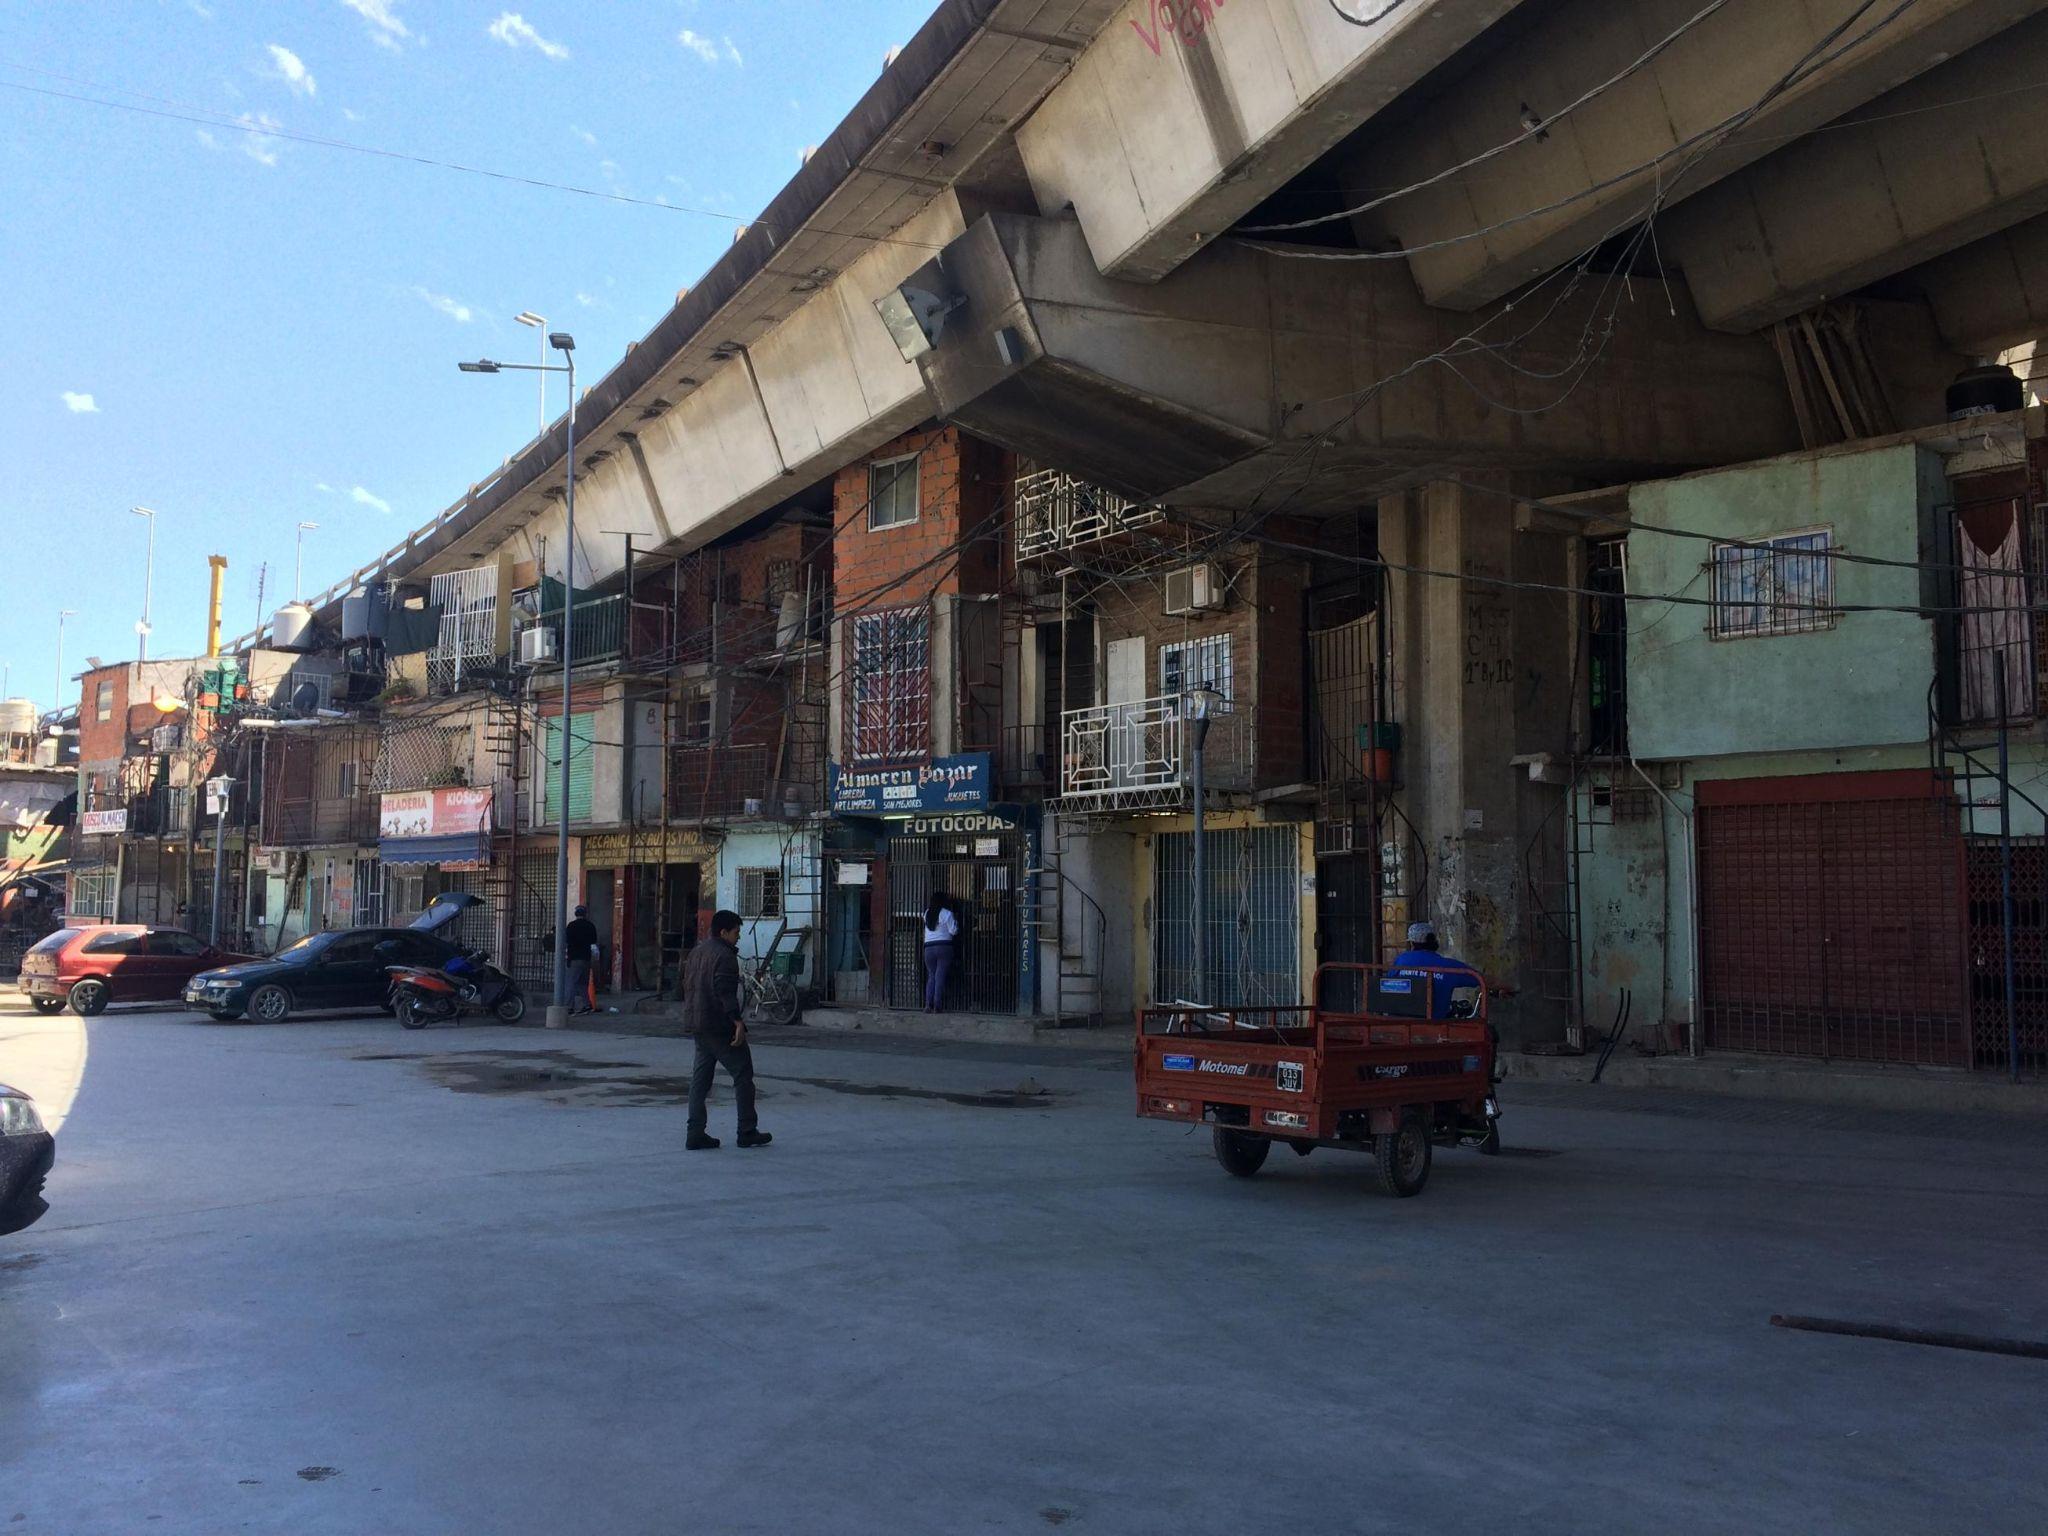
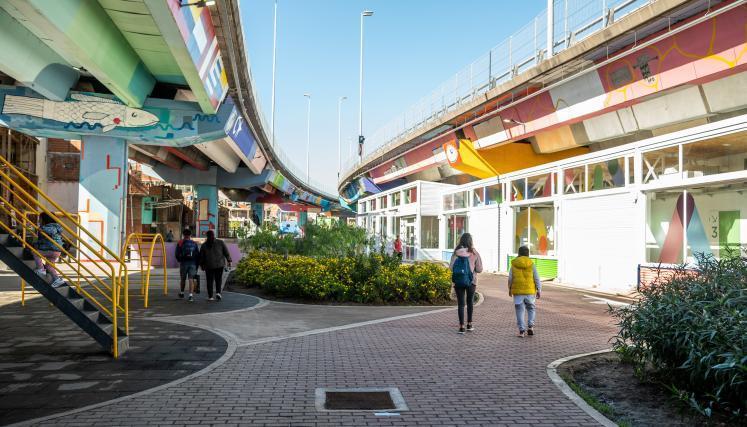
Repurposing infrastructure in Buenos Aires
Barrio 31 before Barrio 31 today
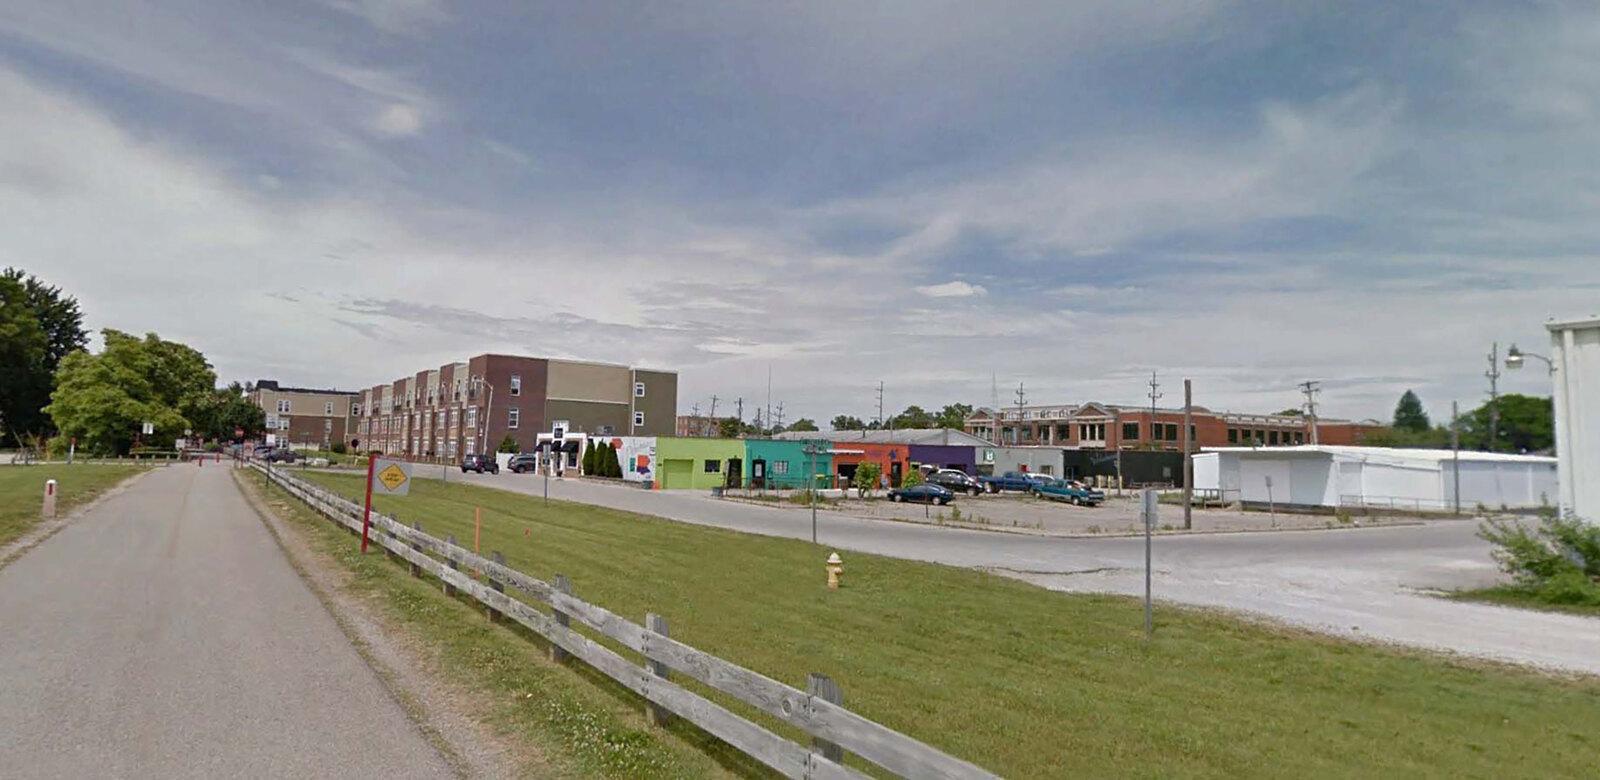
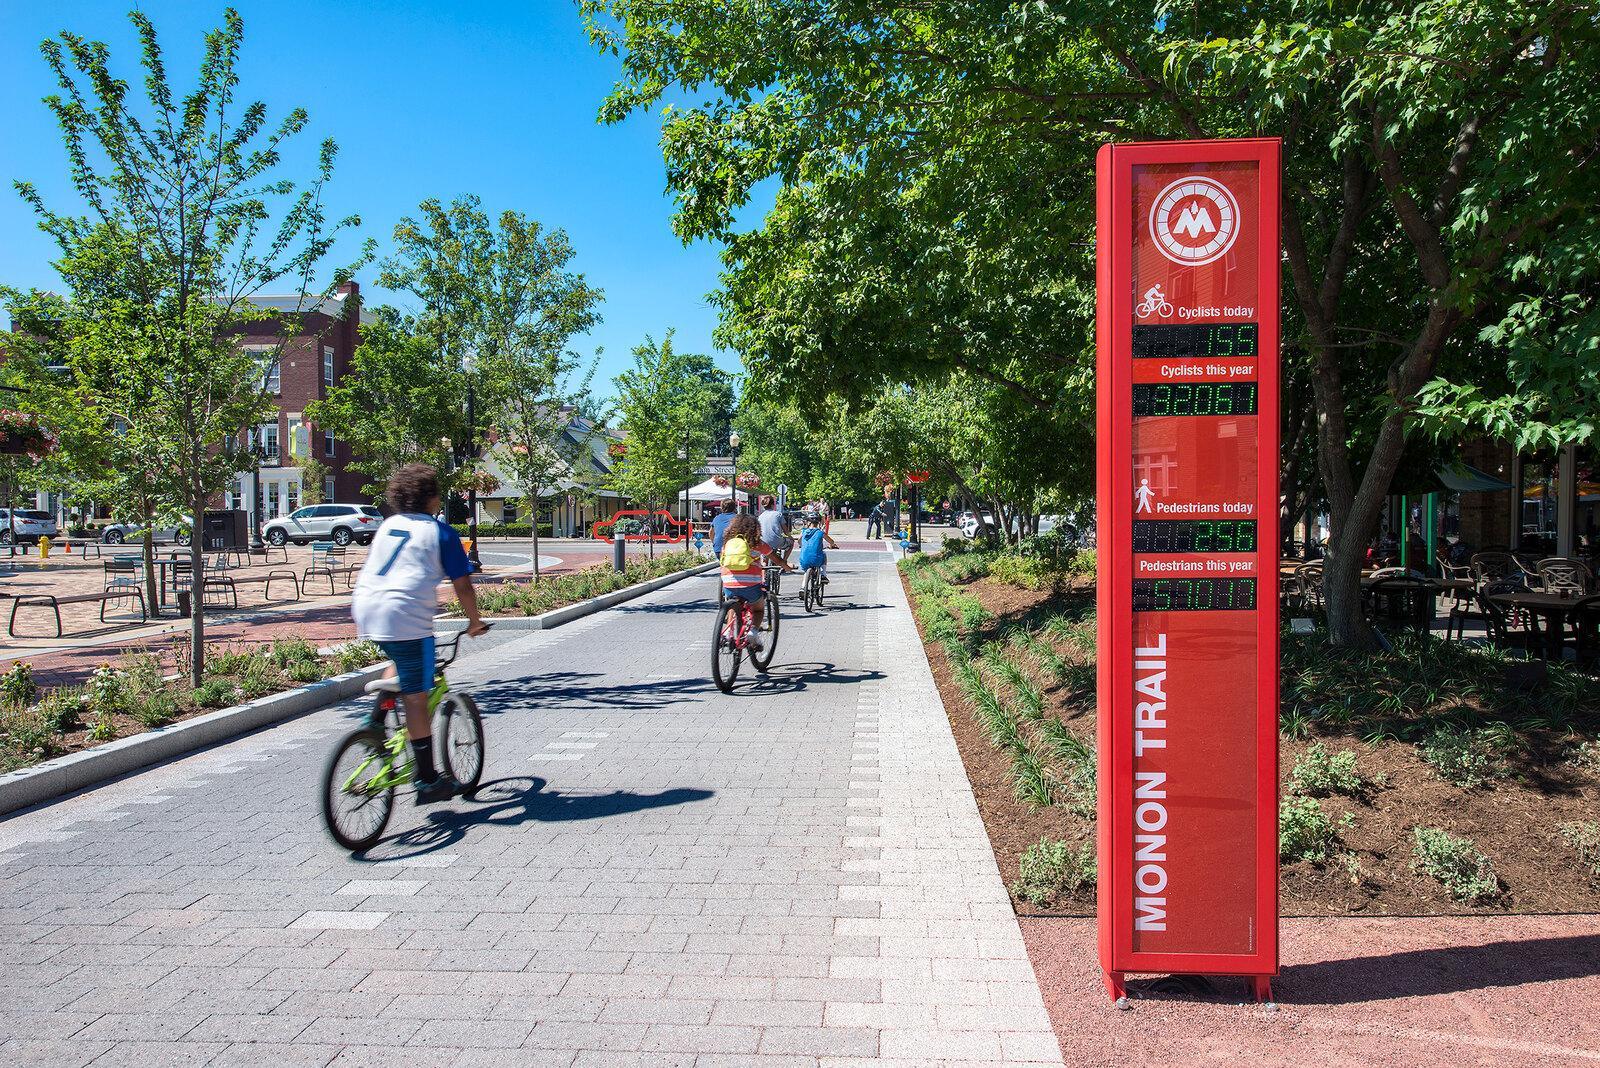
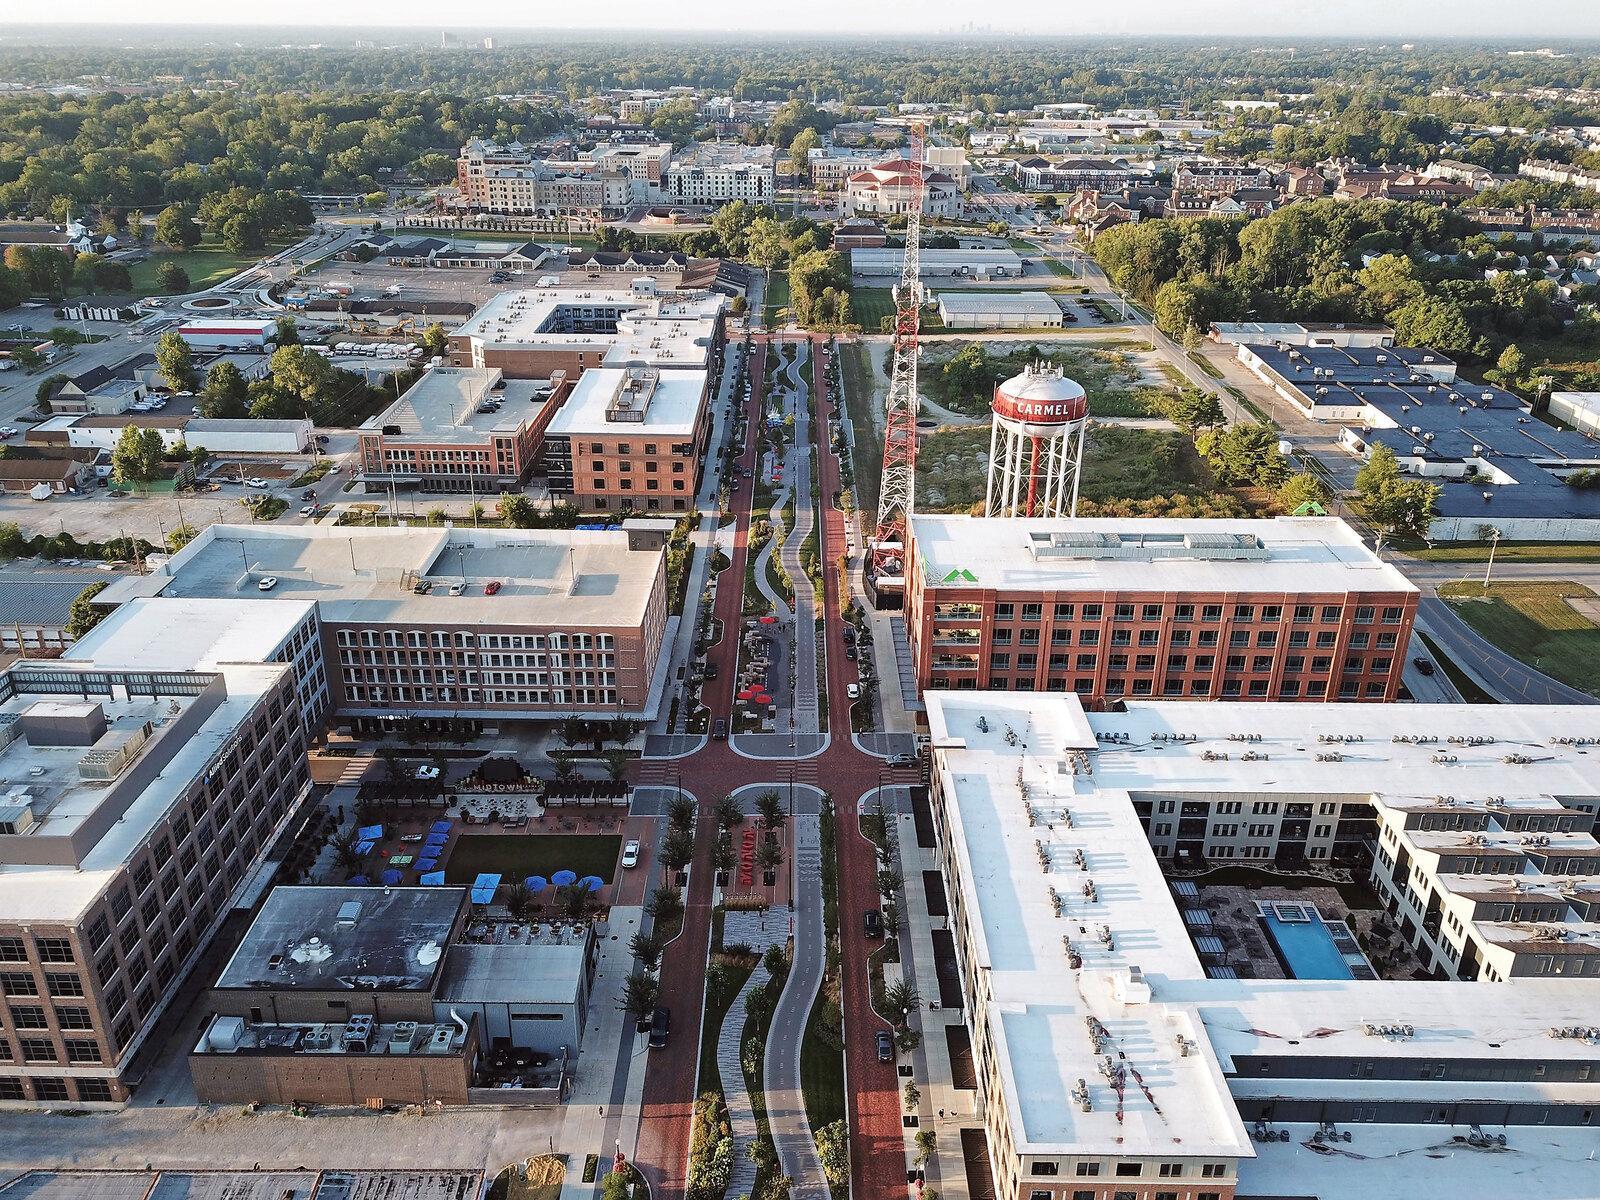
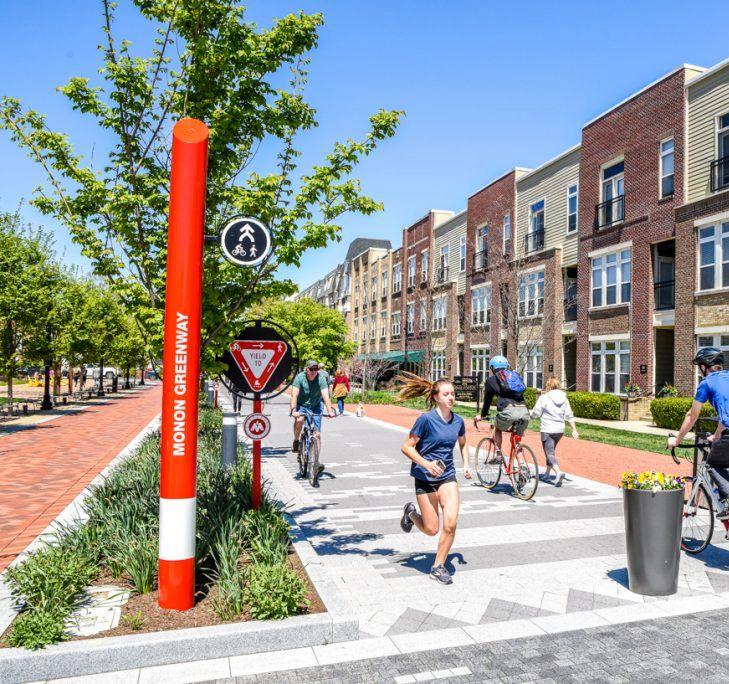
Developing around biking in Carmel, Indiana
Carmel, Indiana before The Monon Trail is now a spine of housing and commercial redevelopment
Source: Joshua Kirsh, City of Carmel
Climate-aligned cities are not places of scarcity. They’re places of abundance, giving us more of what we want.
More Health & Wellbeing
Urban design accounts for > 65% of the likelihood that residents will get the minimum weekly exercise recommended by the World Health Organization.
122 intersection per km2 = Most people likely to walk2.5
Basic mobility needn’t be expensive. Walking, cycling and transit is the most affordable transportation where it is available, amounting to $5,000 - $10,000 annual savings over driving.
In the US, the cost of operating a car is >$10k or 77% of federal minimum wage.
Climate-aligned urbanism advances economic activity across scales, from the street to the neighborhood, and up to the city itself.
In a meta-analysis of 37 studies, pedestrians and cyclists were found to spend 1.5X more at local businesses per trip than drivers.
Climate-aligned urbanism in both dense neighborhoods and suburbs commands a 35-44% premium over dispersed development.
Climate-aligned urbanism is significantly more economically productive peracre than dispersed development, better balancing city infrastructure costs and tax base.
Volker, J. M. B., & Handy, S. (2021). Economic impacts on local businesses of investments in bicycle and pedestrian infrastructure: a review of the evidence. Transport Reviews, 41(4), 401–431. https://doi.org/10.1080/01441647.2021.1912849
Source: Tracy Hadden Loh, PhD, Christopher B. Leinberger, and Jordan Chafetz. “Foot Traffic Ahead”(2019).
Climate-aligned urbanism isn’t just about emissions — it’s about meeting the needs of an urbanizing population to realize its best life without trading back to business-as-usual.
Making the future irresistible
Climate-aligned urbanism isn’t just about emissions — it’s about meeting the needs of an urbanizing population to realize its best life without trading back to business-as-usual.
Planning
Look out for how code and plans work at eye level — consider human behavior and whether the most sustainable behaviors are the easiest and most enjoyable.
Public Policy
Finance & Development
Tie climate investments to health, equity, and economic development goals that climate-aligned urbanism is better at delivering.
Consider the economic value delivered by lively places. Balance the investment in infrastructure with the economic productivity of the land it serves.