
_01 Sonic Skeleton
Location: Penny, Brigittenauer Lände 156,Vienna
Individual work
Instructor: Hani Rashid
Site Area: 80,000 sqft
Project Time: 2023 Summer
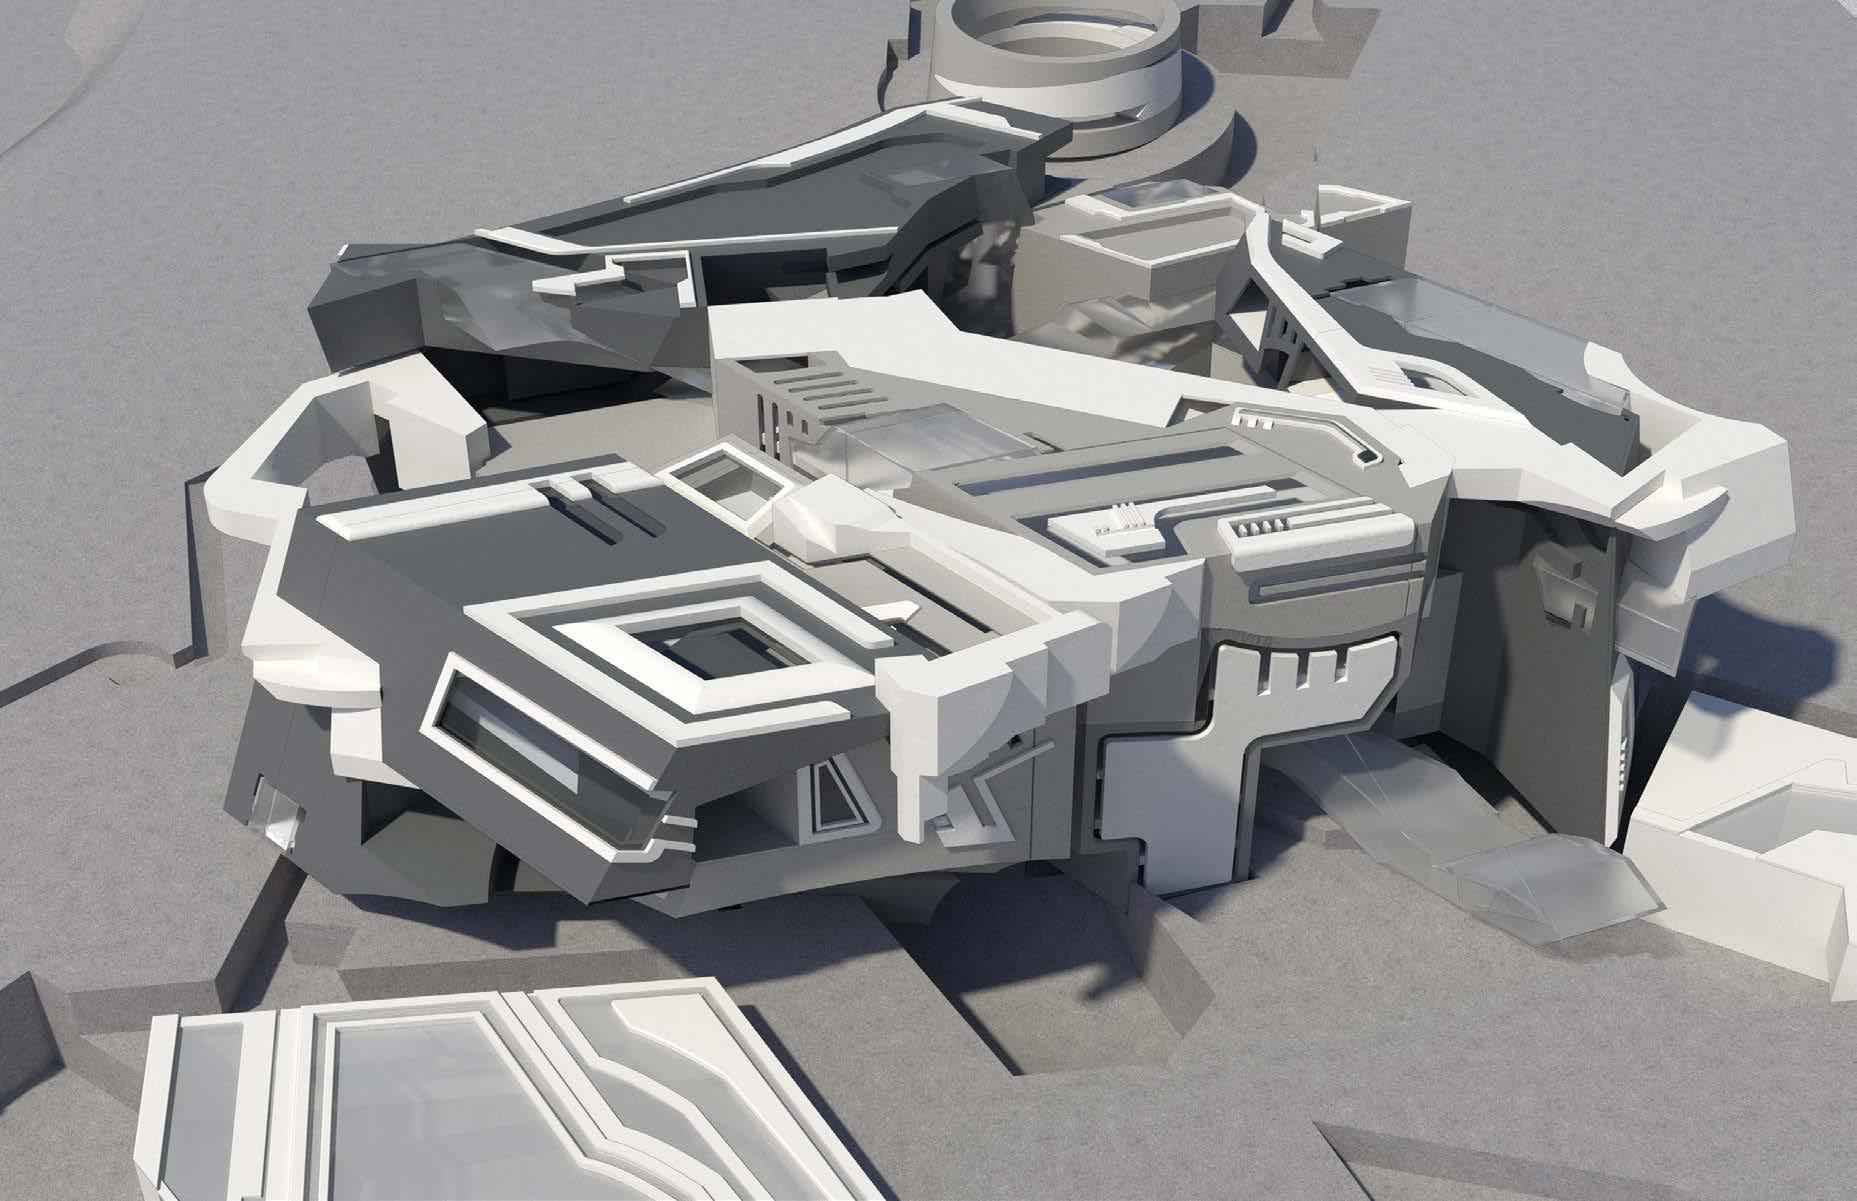
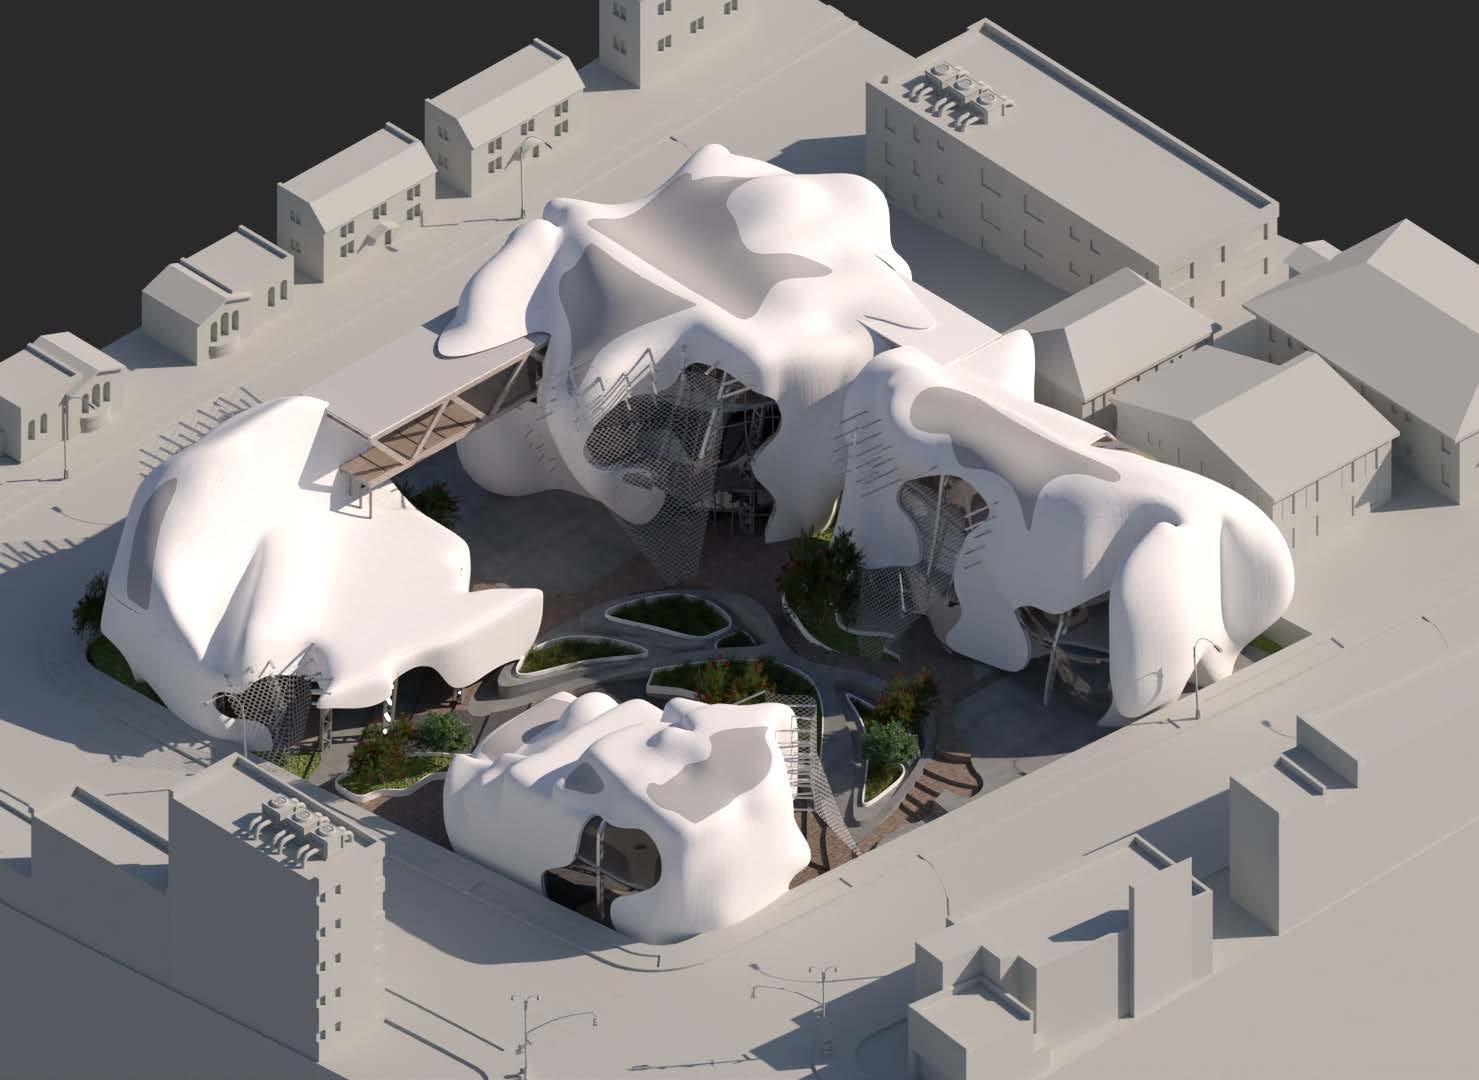
This is an experimental soundscape design, utilizing the building’s structural skeleton as an acoustical transmission media based on “Bone Conduction Technology”.
There are many mediums that can simulate the reverberant effects of indoor soundscapes. However, there is very little experimental data on the direct use of the building structure as a solid medium for the simulation of sound transmission. For such an experimental design, it was attempted to use AI techniques to learn the idiosyncrasies of the sound of bone conduction in different material mediums and forms to simulate the possible sound field effects in the architectural space.




Detailed Steps




feature space plot is similar to a scattergram. It plots the frequency of occurrance of brightness value pairs in the two-dimensional feature space of de�ined by two images. The input images are usually two bands of multispectral imagery, but any two overlapping images with the same dimensions can be used. The higher the frequency of a value pair, the brighter it is represented in the feature space plot. Note that this tool provides a means of visualizing the relation between two raster images, which is often the necessary step before either correlation analysis or regression analysis. The tool is intended to work with images of an integer data type, or with images with a �loat data type that have a large enough range that they can be rounded to integer values in a meaningful way.
From internet)

Image regression


This tool performs a bivariate linear regression analysis on two input raster images. The �irst image is considered to be the independent variable while the second image is considered to be the dependent variable in the analysis. The tool will output a text report summarizing the regression model, an Analysis of Variance (ANOVA), and the signi�icance of the regression coef�icients. The regression residuals can optionally be output as a new raster image and the user can also optionally specify to standardize the residuals.
Note that the analysis performs a linear regression; two variables may be strongly related by a non-linear association (e.g. a power function curve) which will lead to an apparently weak �itting regression model. In fact, non-linear relations are very common among spatial variables, e.g. terrain indices such as slope and contributing area. In such cases, it is advisable that the input images are transformed prior to the analysis.(From internet)
Image correlation
This tool can be used to estimate the Pearson product-moment correlation coef�icient (r) between two images. The r-value is a measure of the linear association in the variation of the input variables (images, in this case). The coef�icient ranges from -1, indicated a perfect negative linear association, to 1, indicated a perfect positive linear association. An r-value of 0 indicates no correlation between the test variables.
Note that this index is a measure of the linear association; two variables may be strongly related by a non-linear association (e.g. a power function curve) which will lead to an apparent weak association based on the Pearson coef�icient. In fact, non-linear associations are very common among spatial variables, e.g. terrain indices such as slope and contributing area. In such cases, it is advisable that the input images are transformed prior to the estimation of the Pearson coef�icient, or that an alternative, non-parametric statistic be used, e.g. the Spearman rank correlation coef�icient.
The user must specify the names of two or more input images. All input images must share the same grid, as the coef�icient requires a comparison of a pair of images on a grid-cell-by-grid-cell basis. If more than two image names are selected, the correlation coef�icient will be calculated for each pair of images and reported in the text output as a correlation matrix. Caution must be exercised when attempted to estimate the signi�icance of a correlation coef�icient derived from image data. The remarkably high N-value (essentially the number of pixels in the image pair) means that even small correlation coef�icients can be found to be statistically signi�icant, despite being practically insigni�icant.
NoData values in either of the two input images are ignored during the calculation of the correlation between images.(From internet)
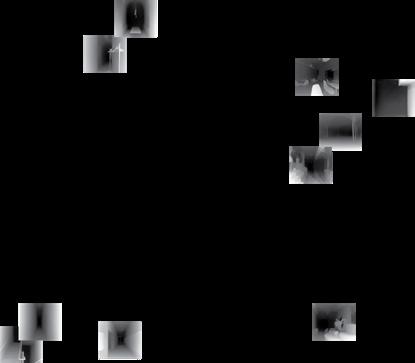
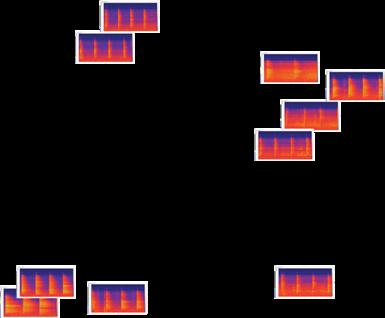
-Inspired by applying the FeatureSpacePlot system, the 2-dimensional coordinates are divided into four intervals, and the "Depth picture distribution equation" and "Spectogram picture distribution equation" series are obtained through Ai iteration.




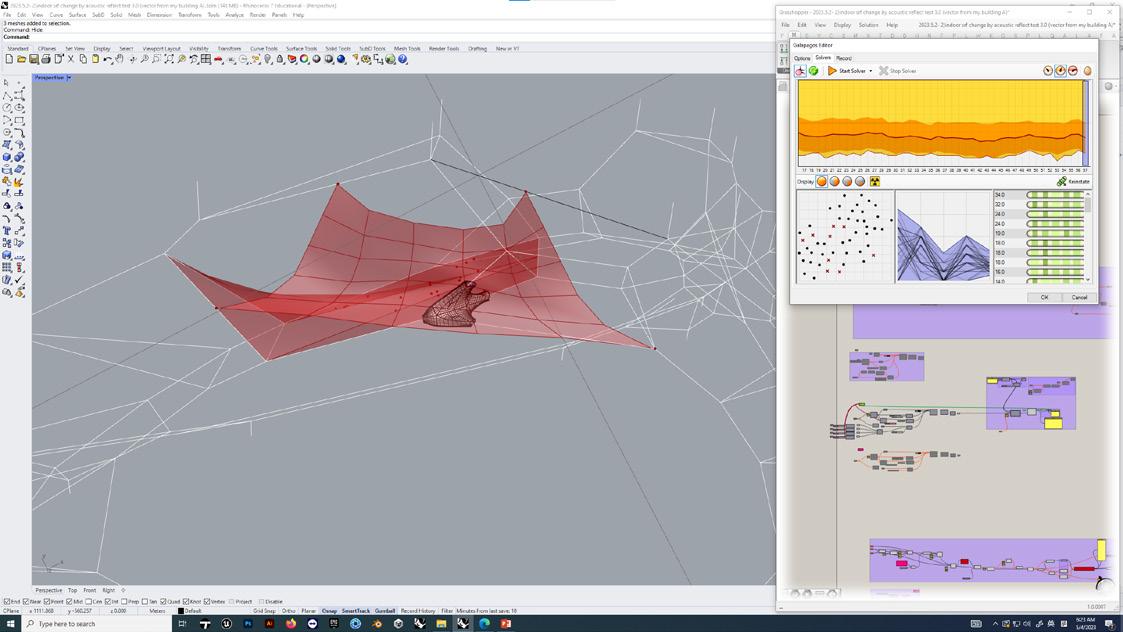
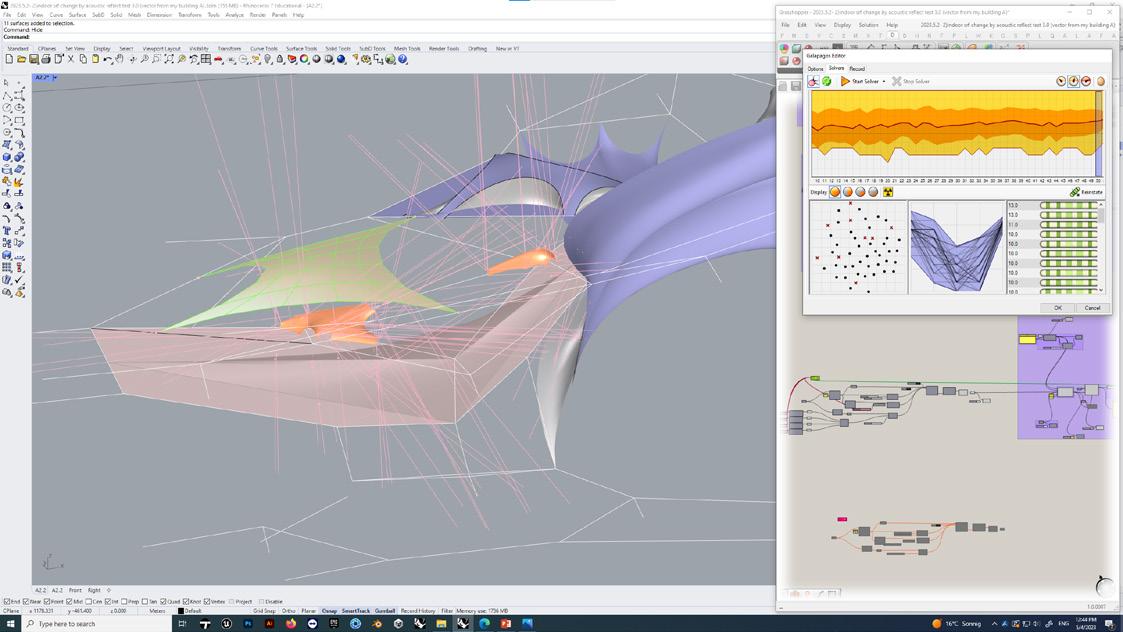


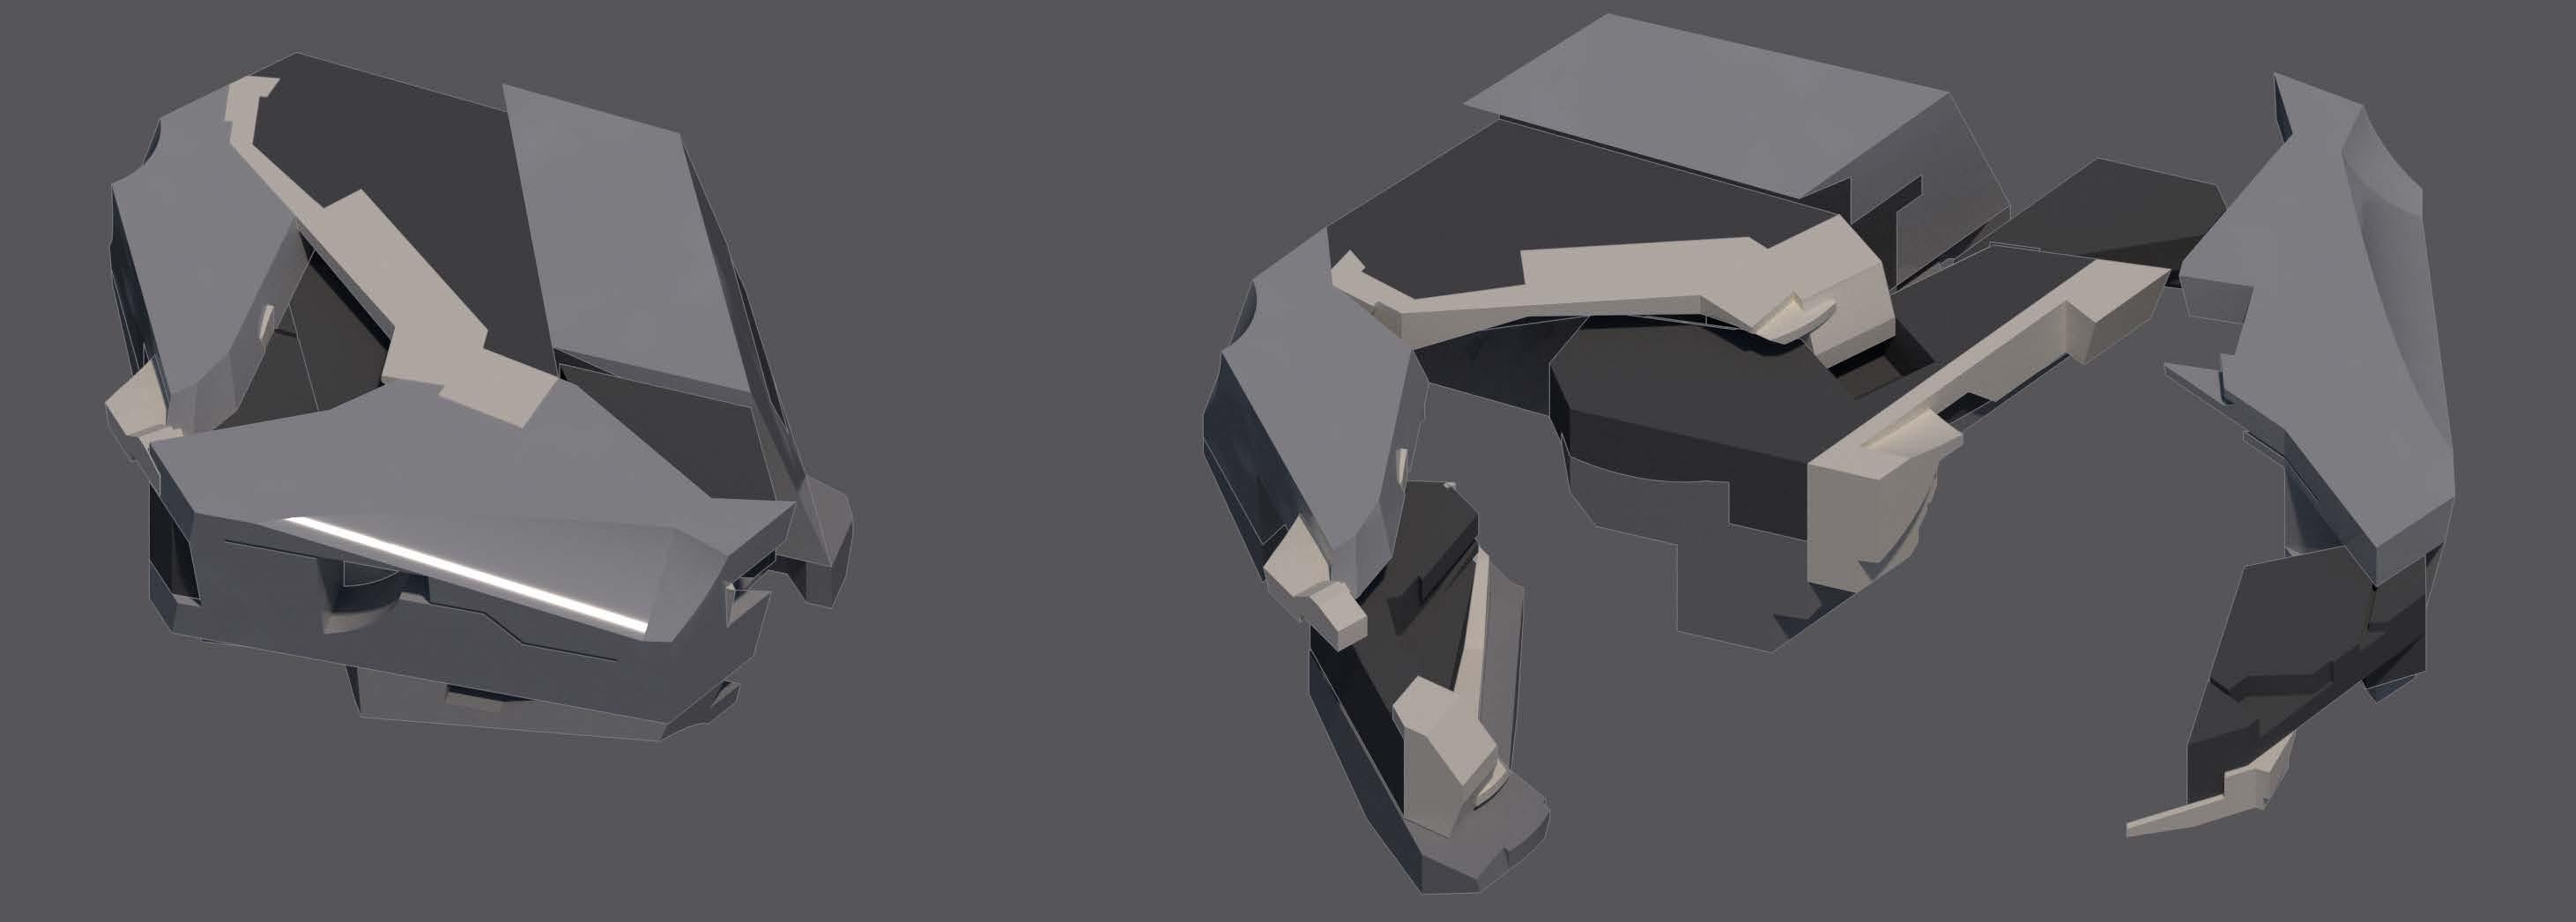
- Perform operations on different numbers of fulcrums to obtain structural geometric models with numbers of 3, 4, 5, and 8
-Change the parameters of the 3-corner model to obtain triangular models with different degrees of solidity. The final model has multiple chambers and branches.


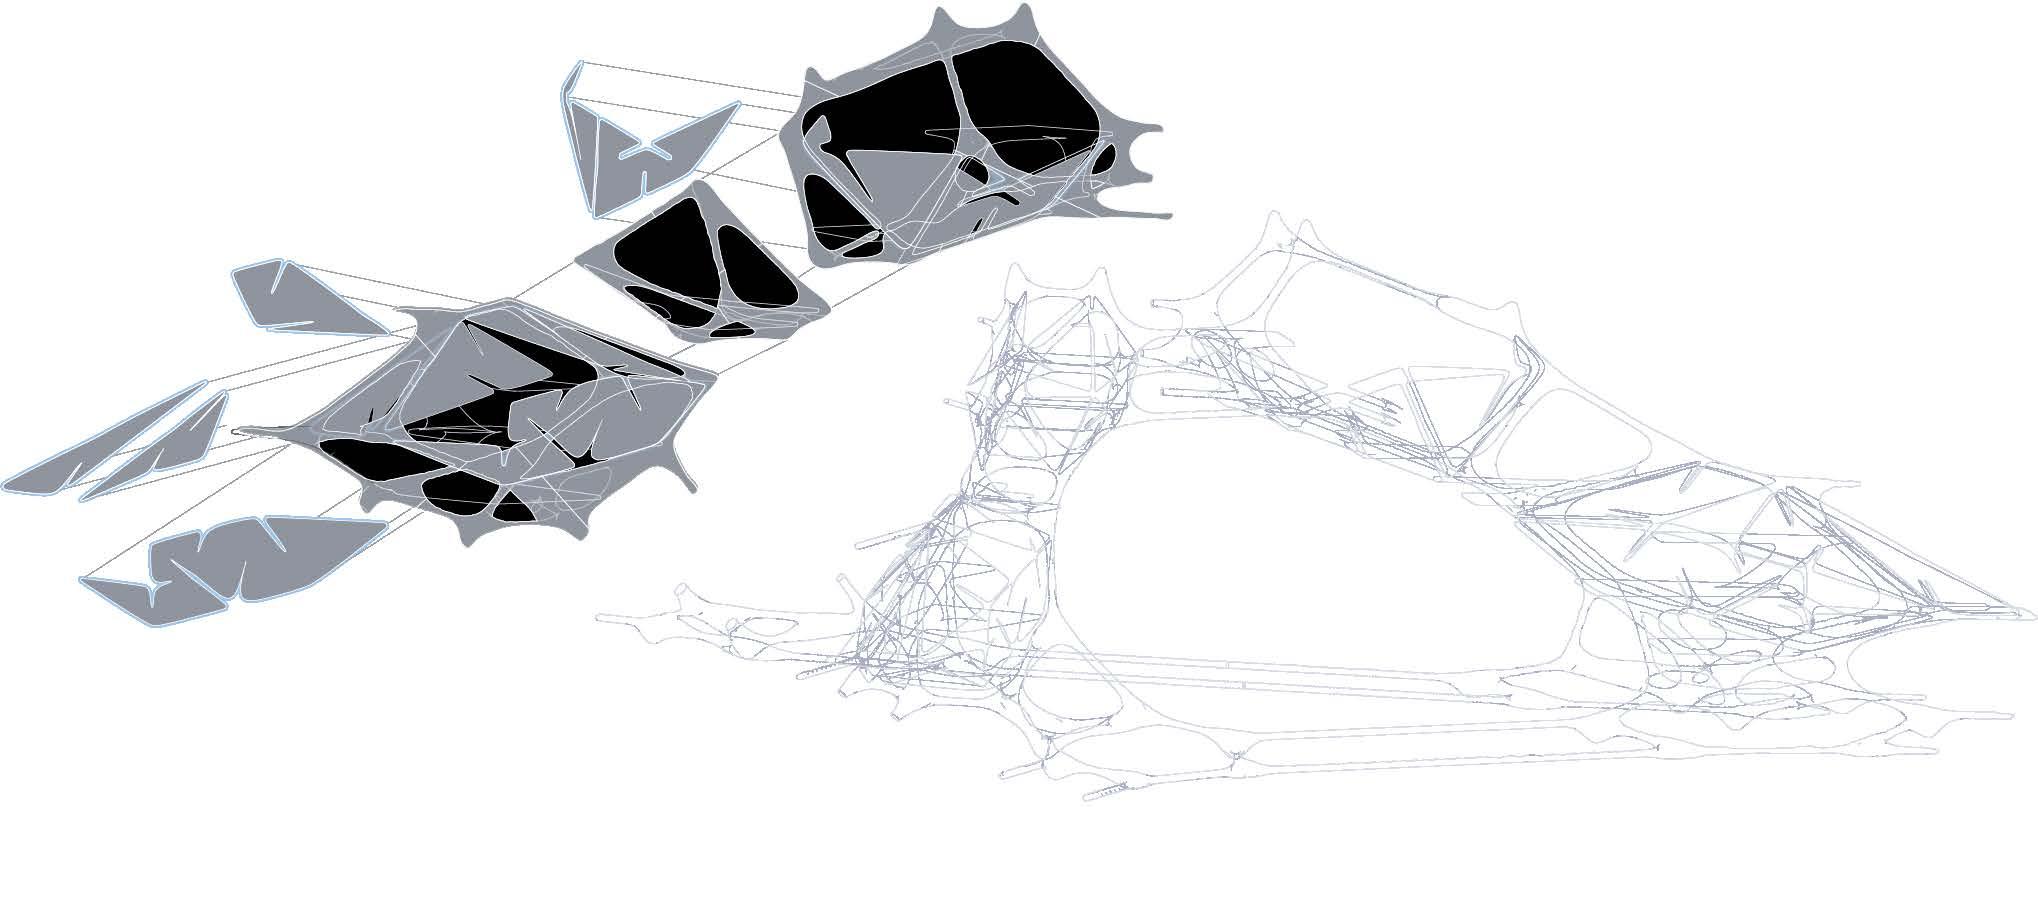
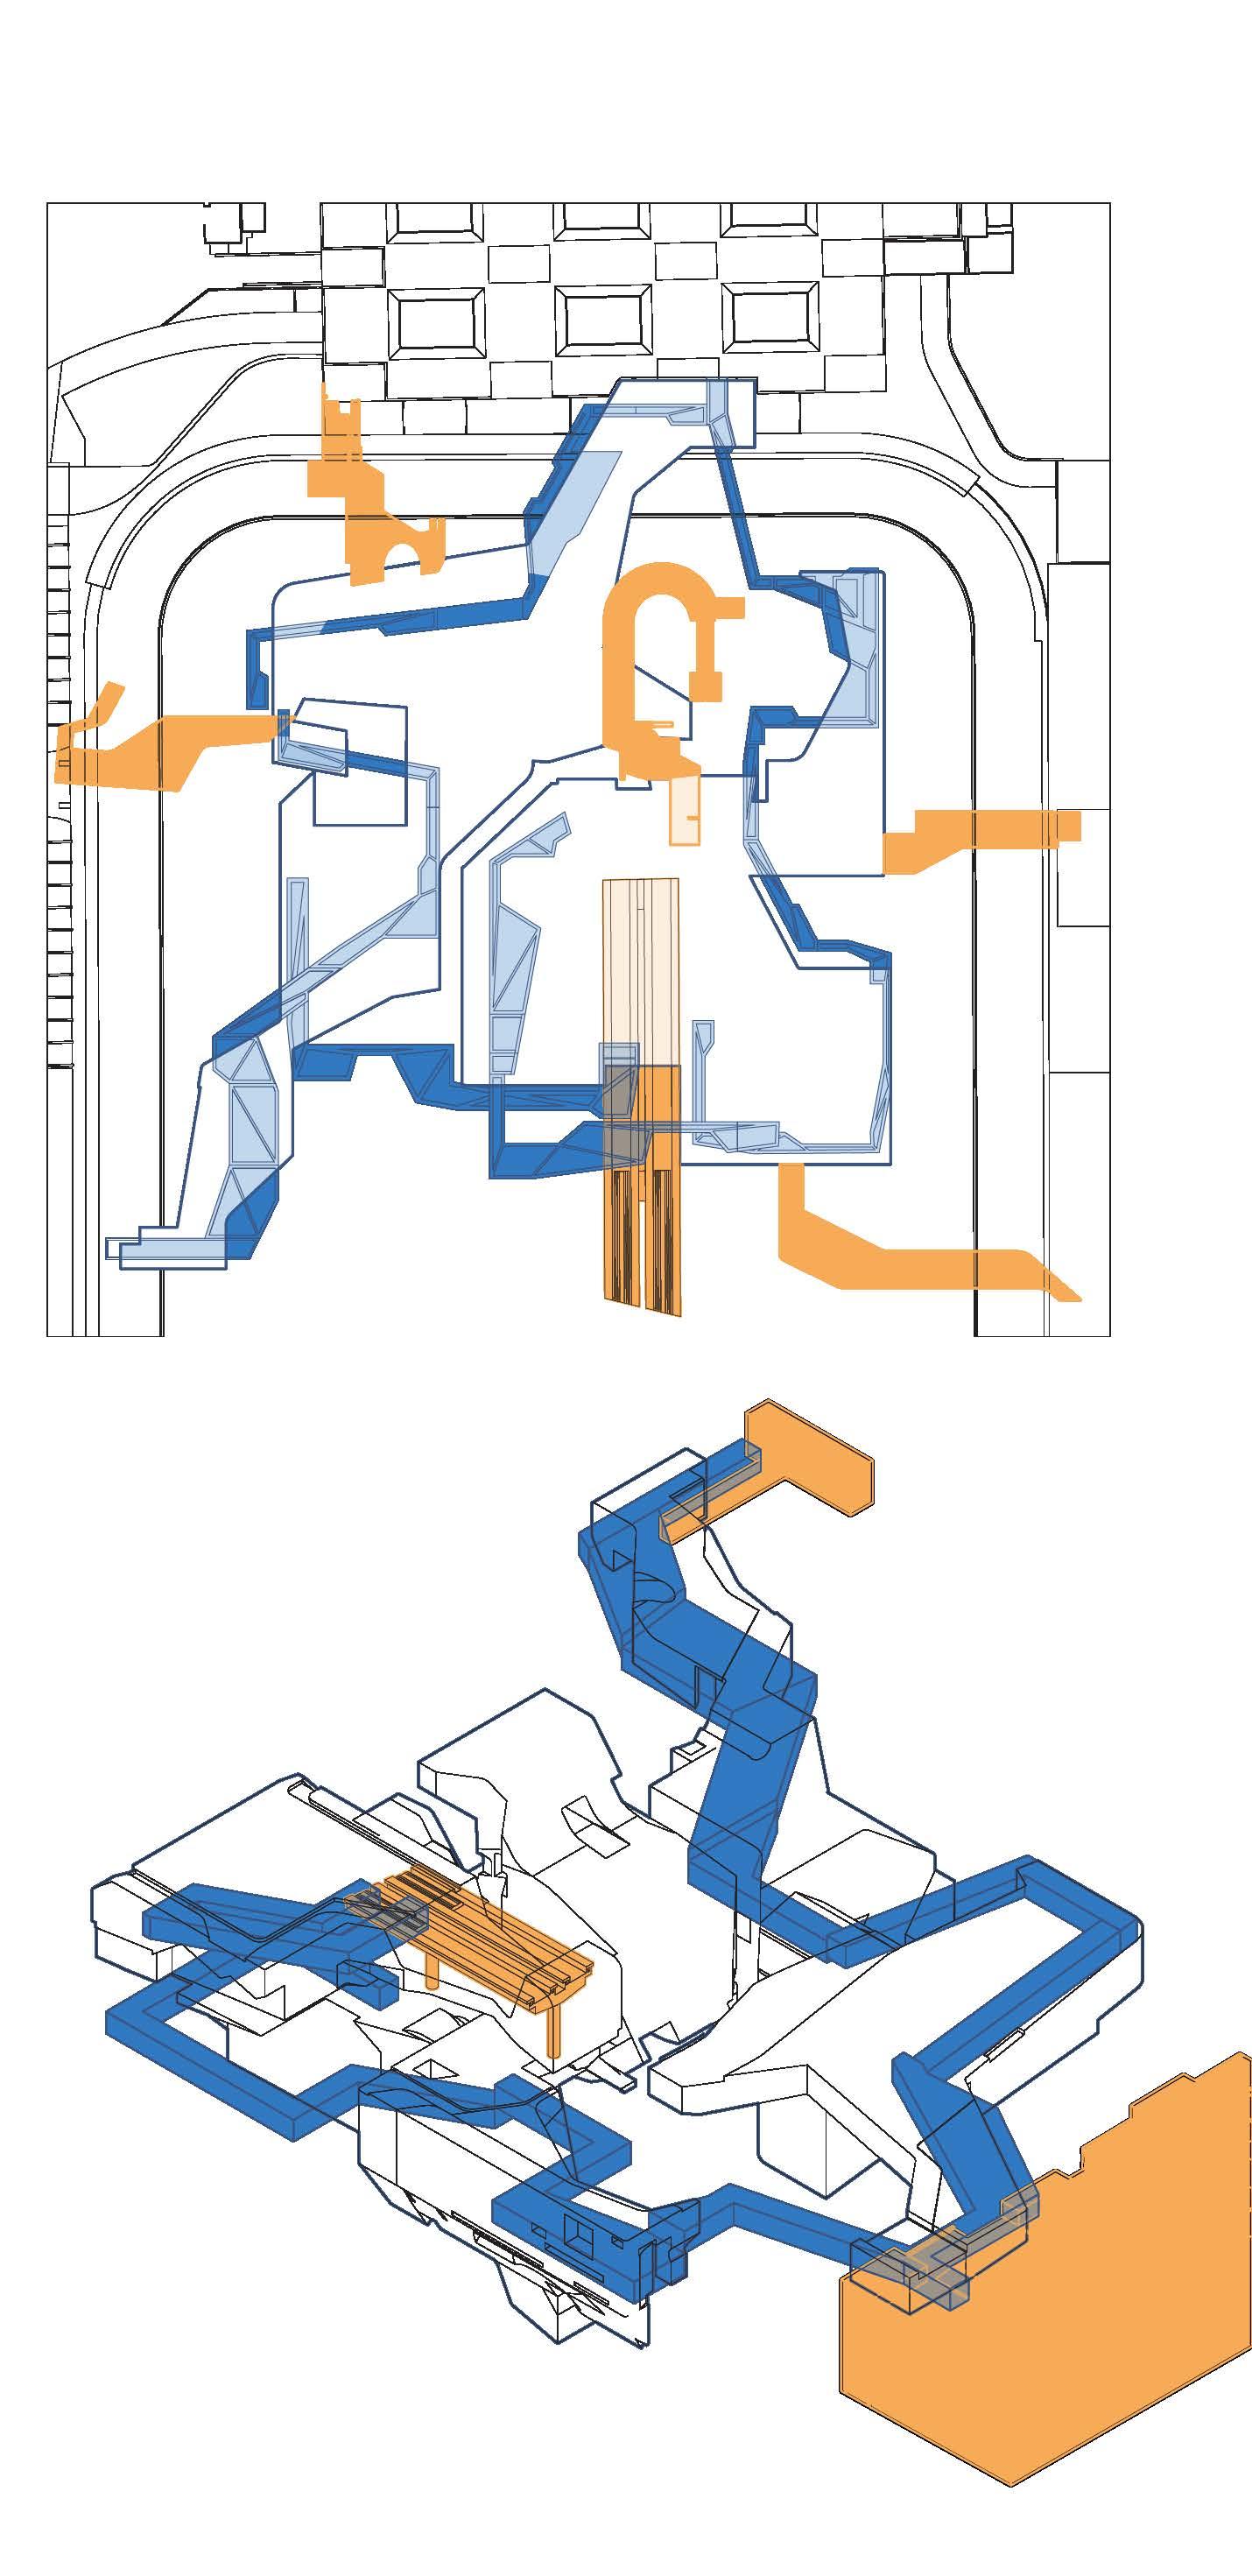
Skeleton Structure and Sound Transmission System
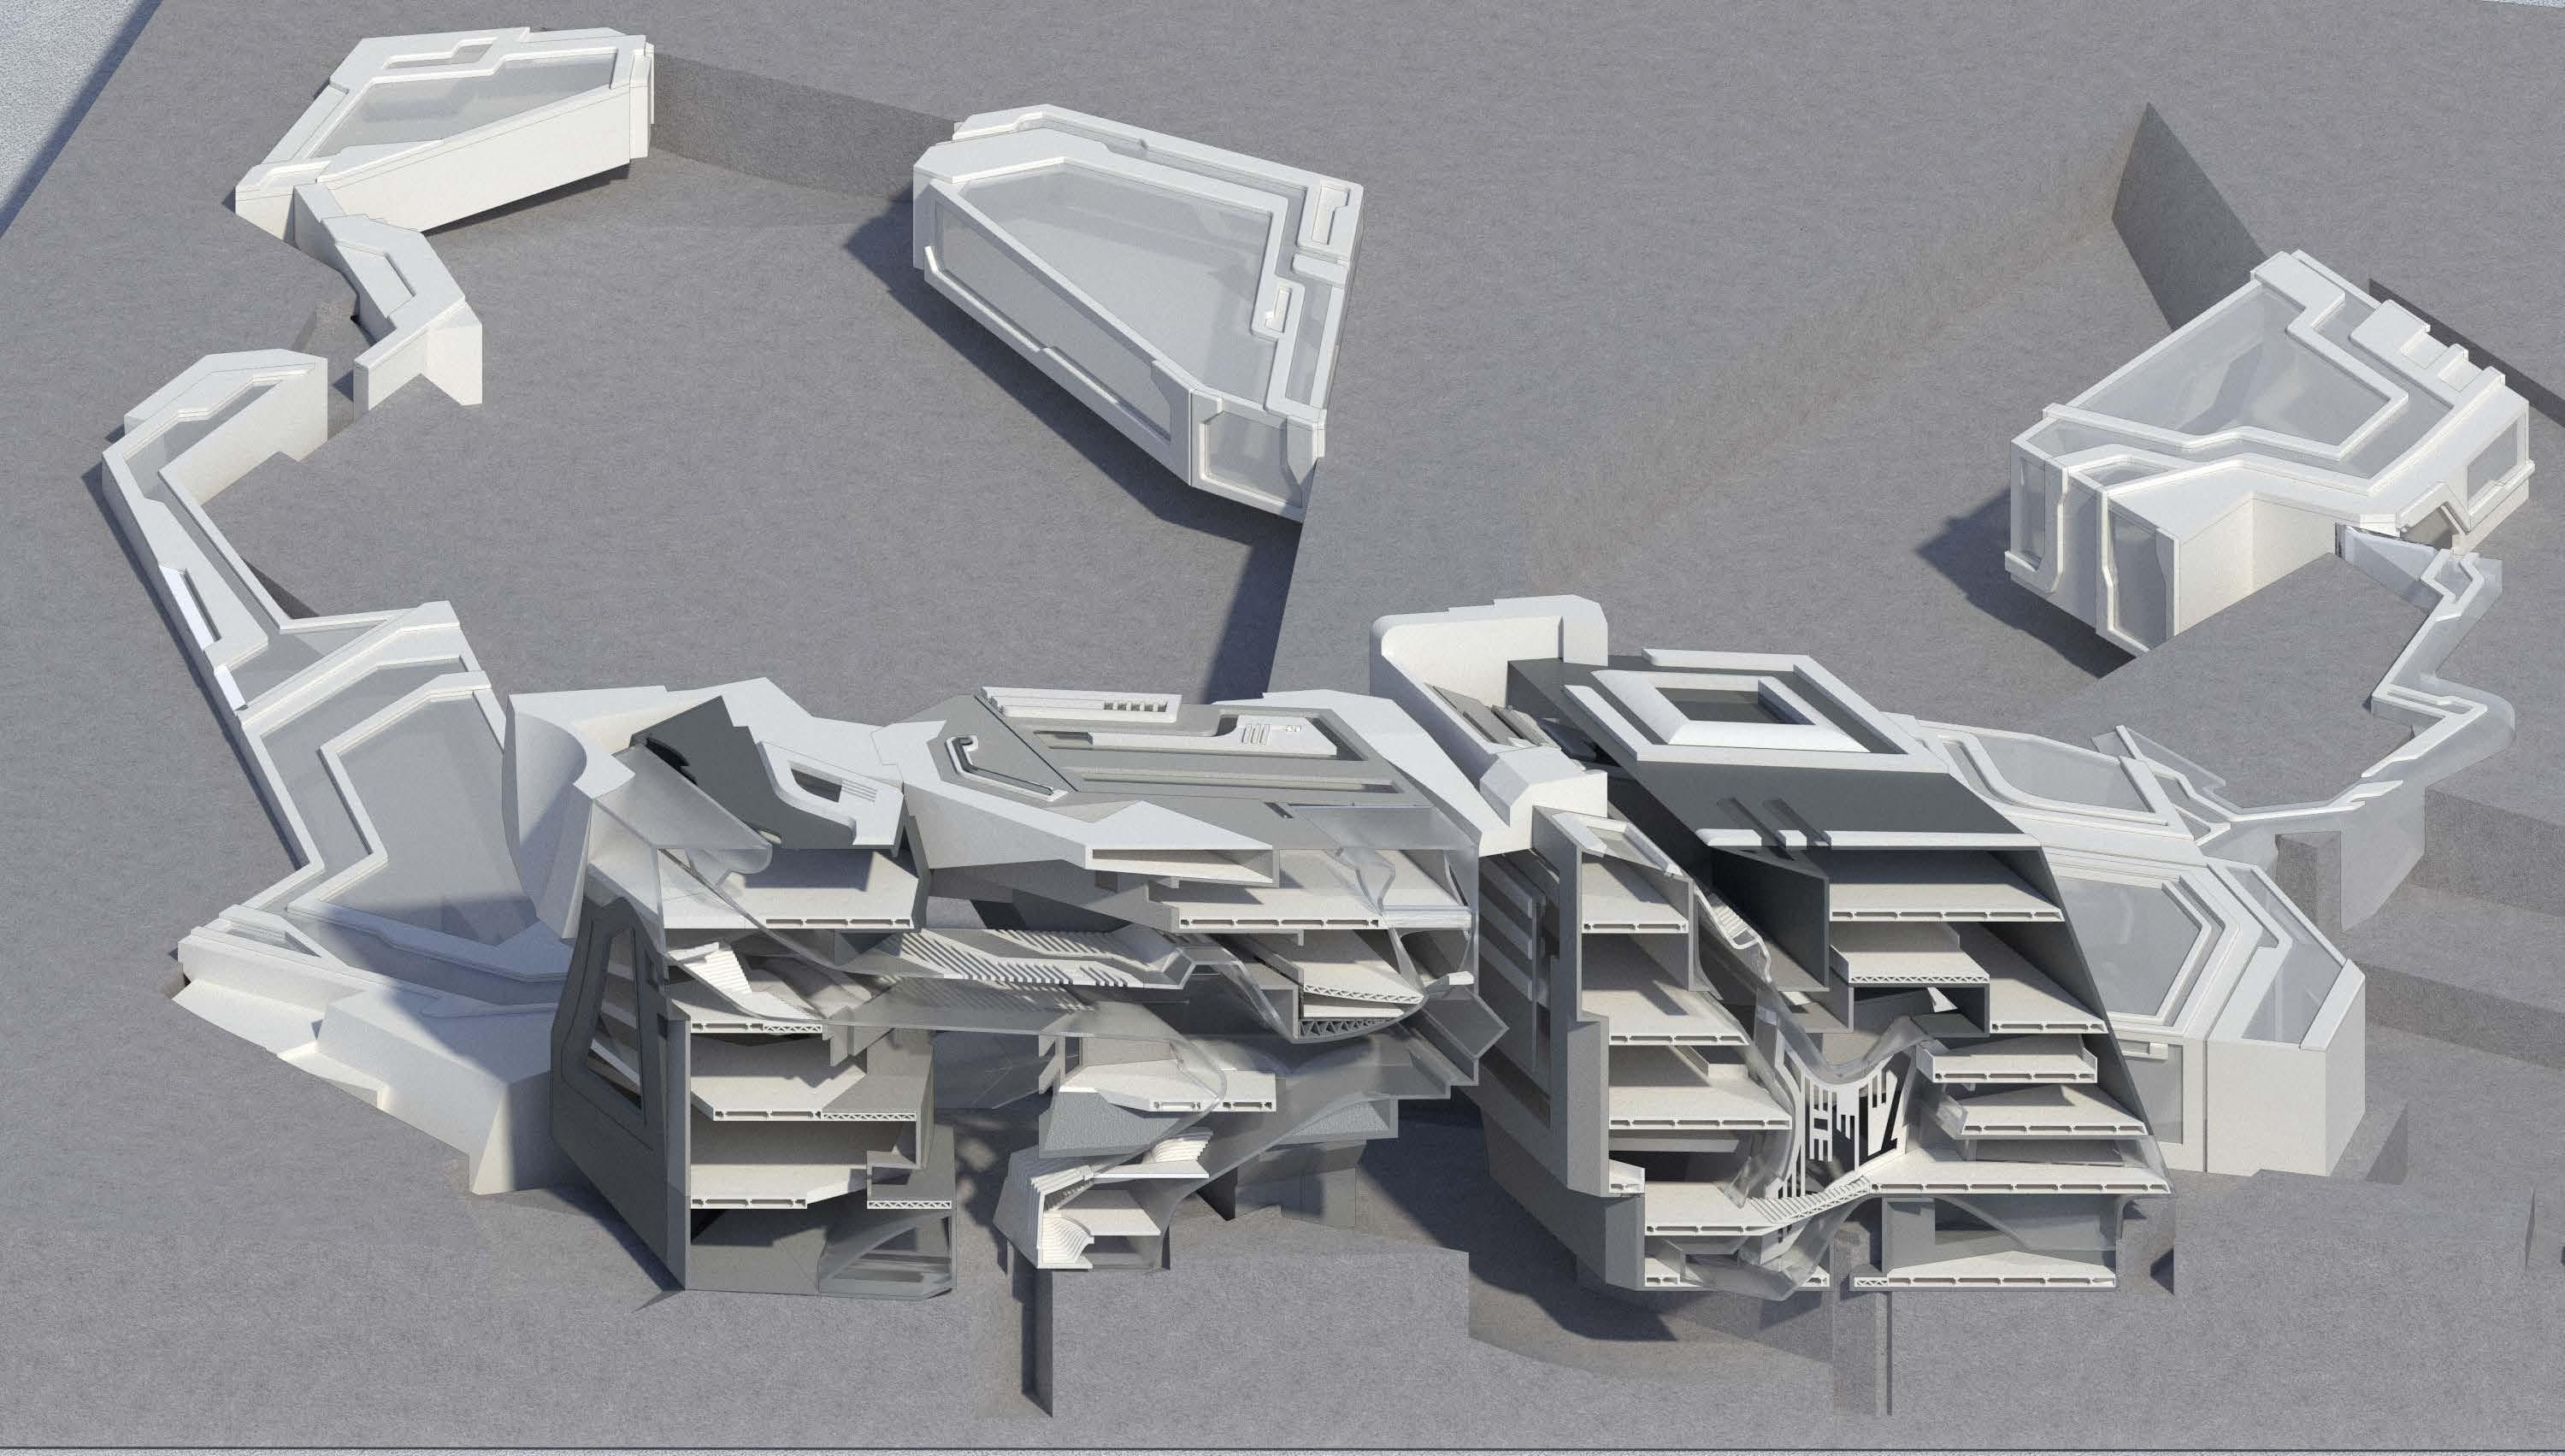
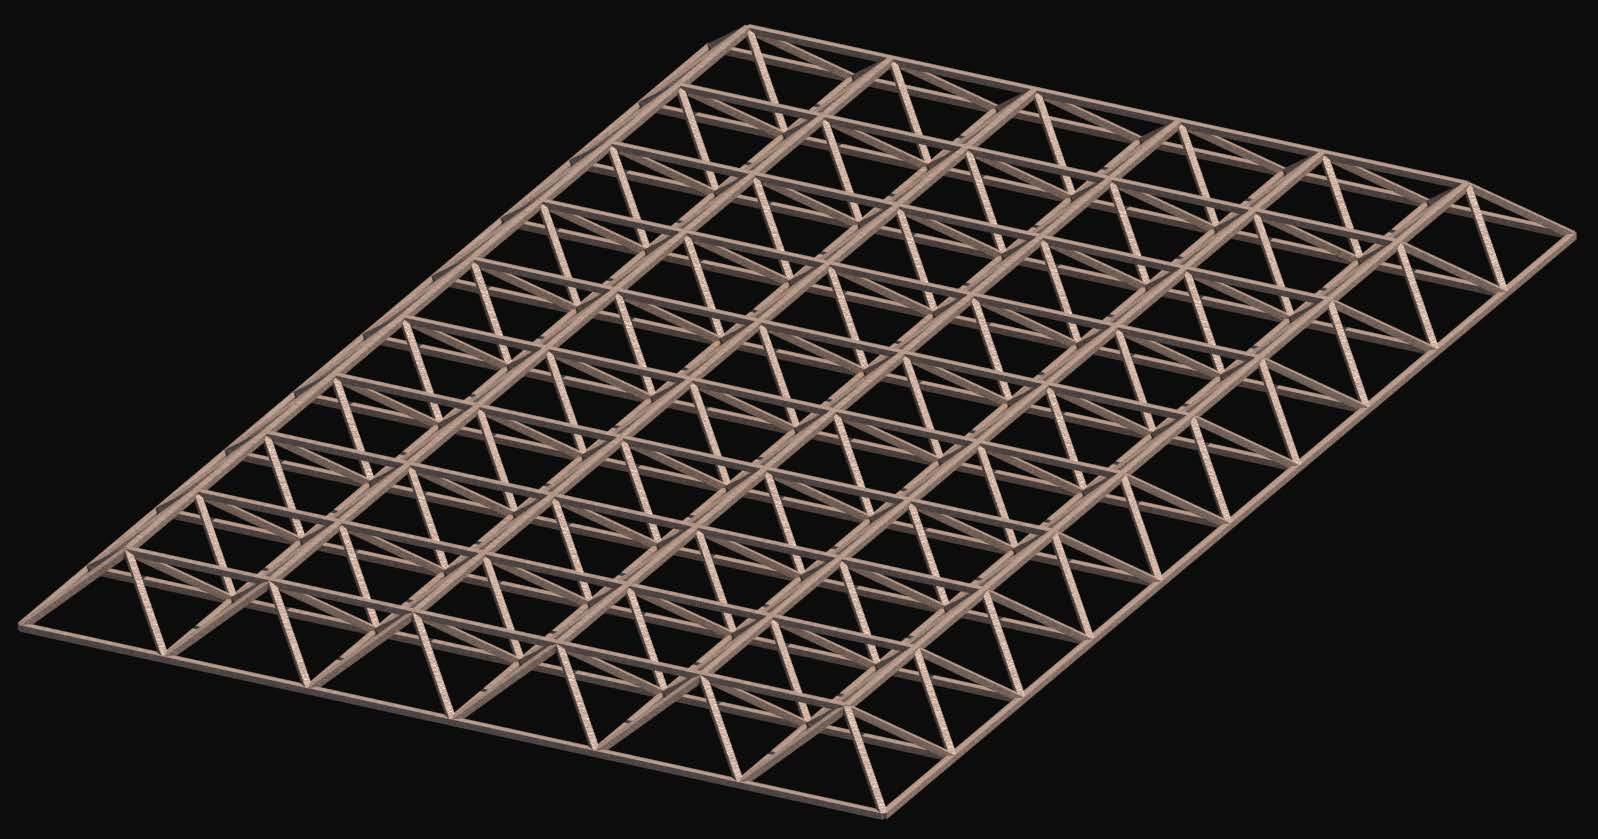
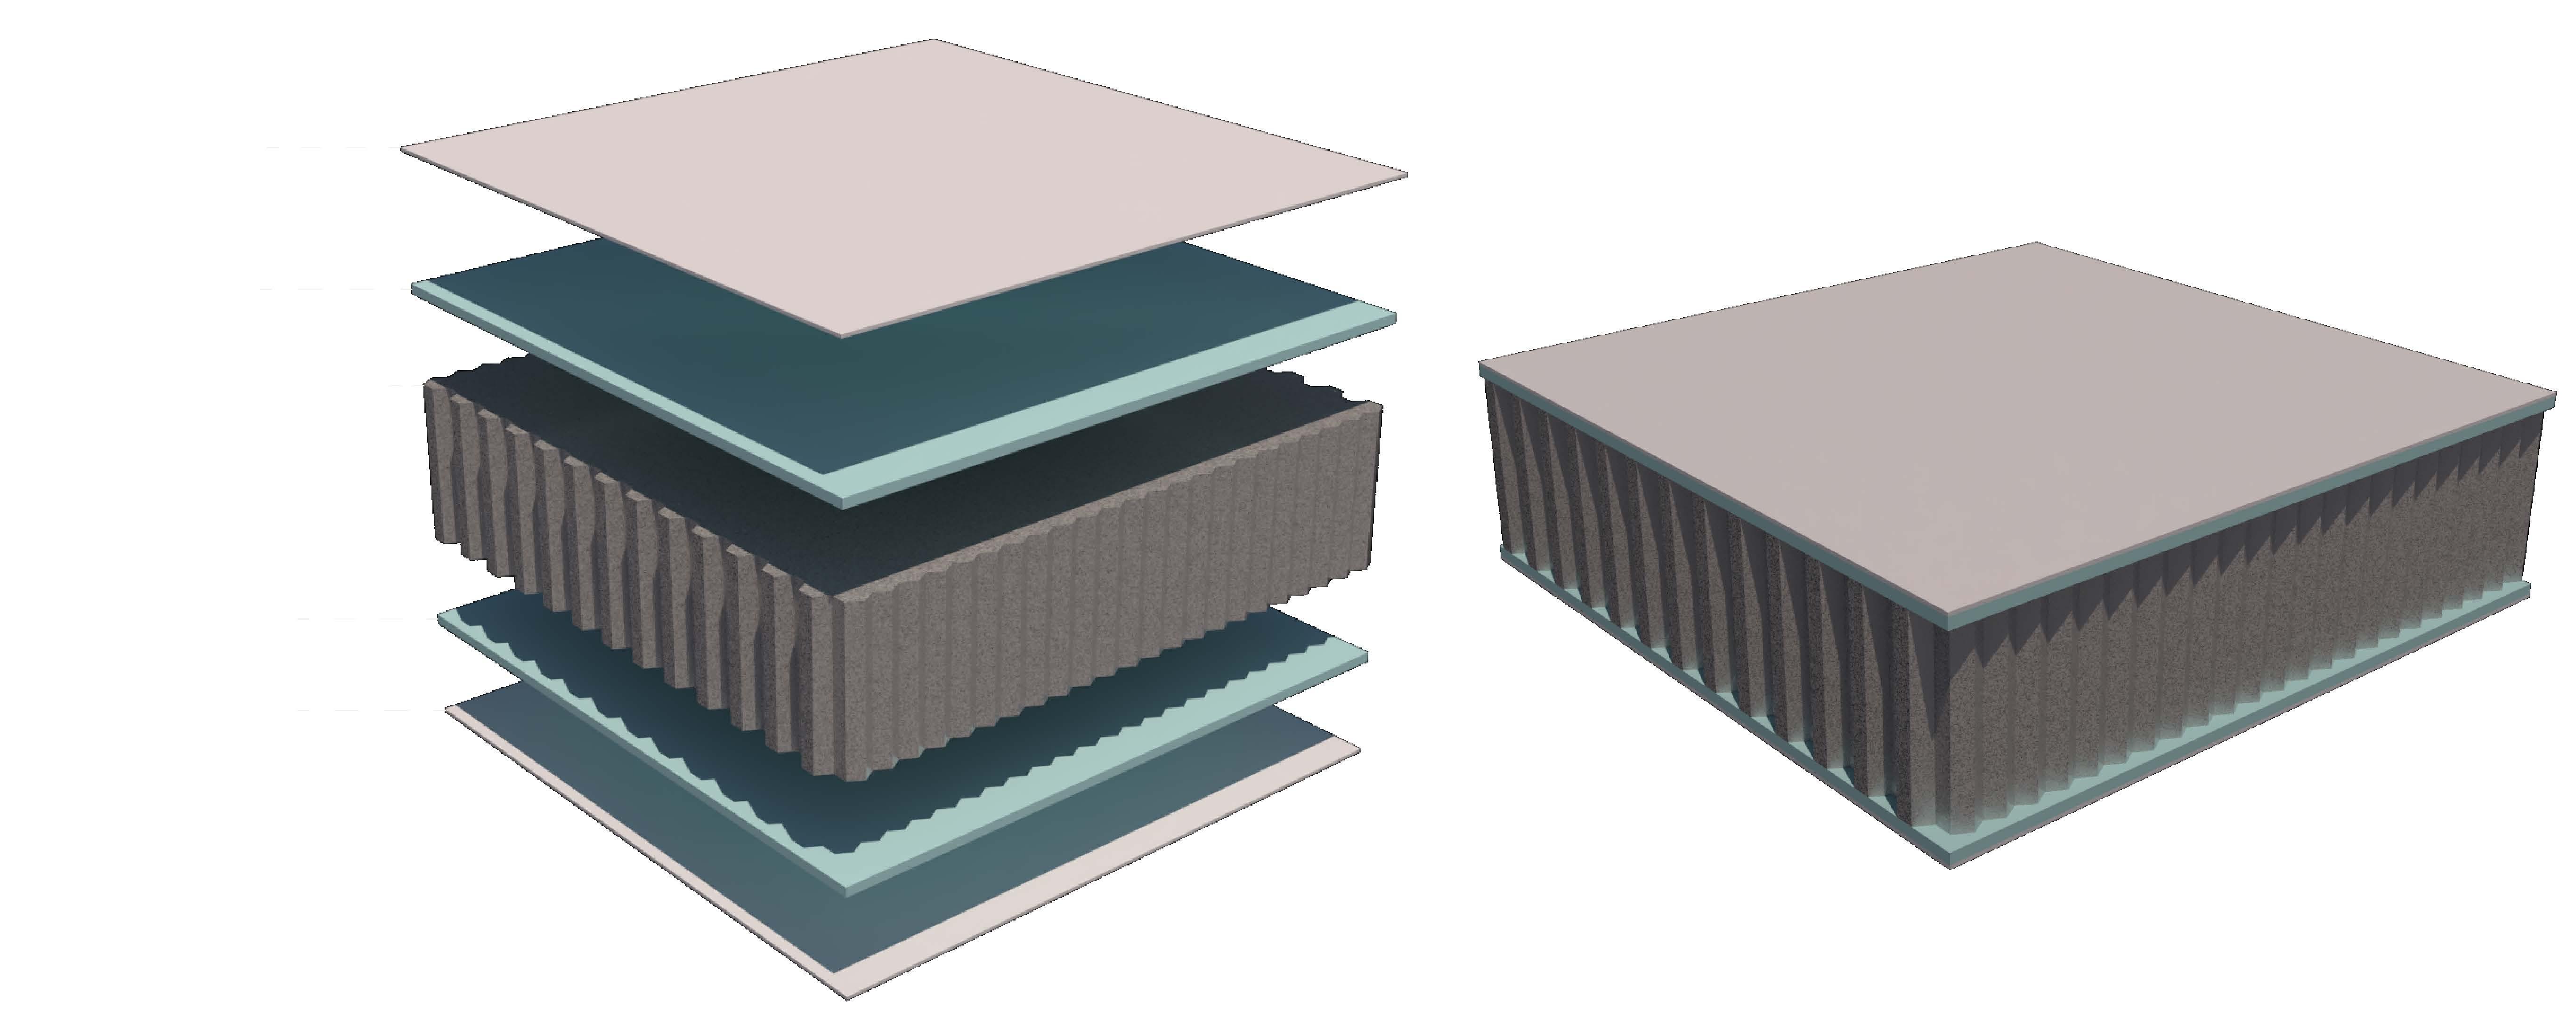
The structure of the building uses steel as the sound transmission medium to connect the indoor sound structure of the entire building. Because of the specific shape of the structure, the building has cavities of different sizes. The spacing between the walls of the chamber reflects sound so that each room has a different reverberation effect.


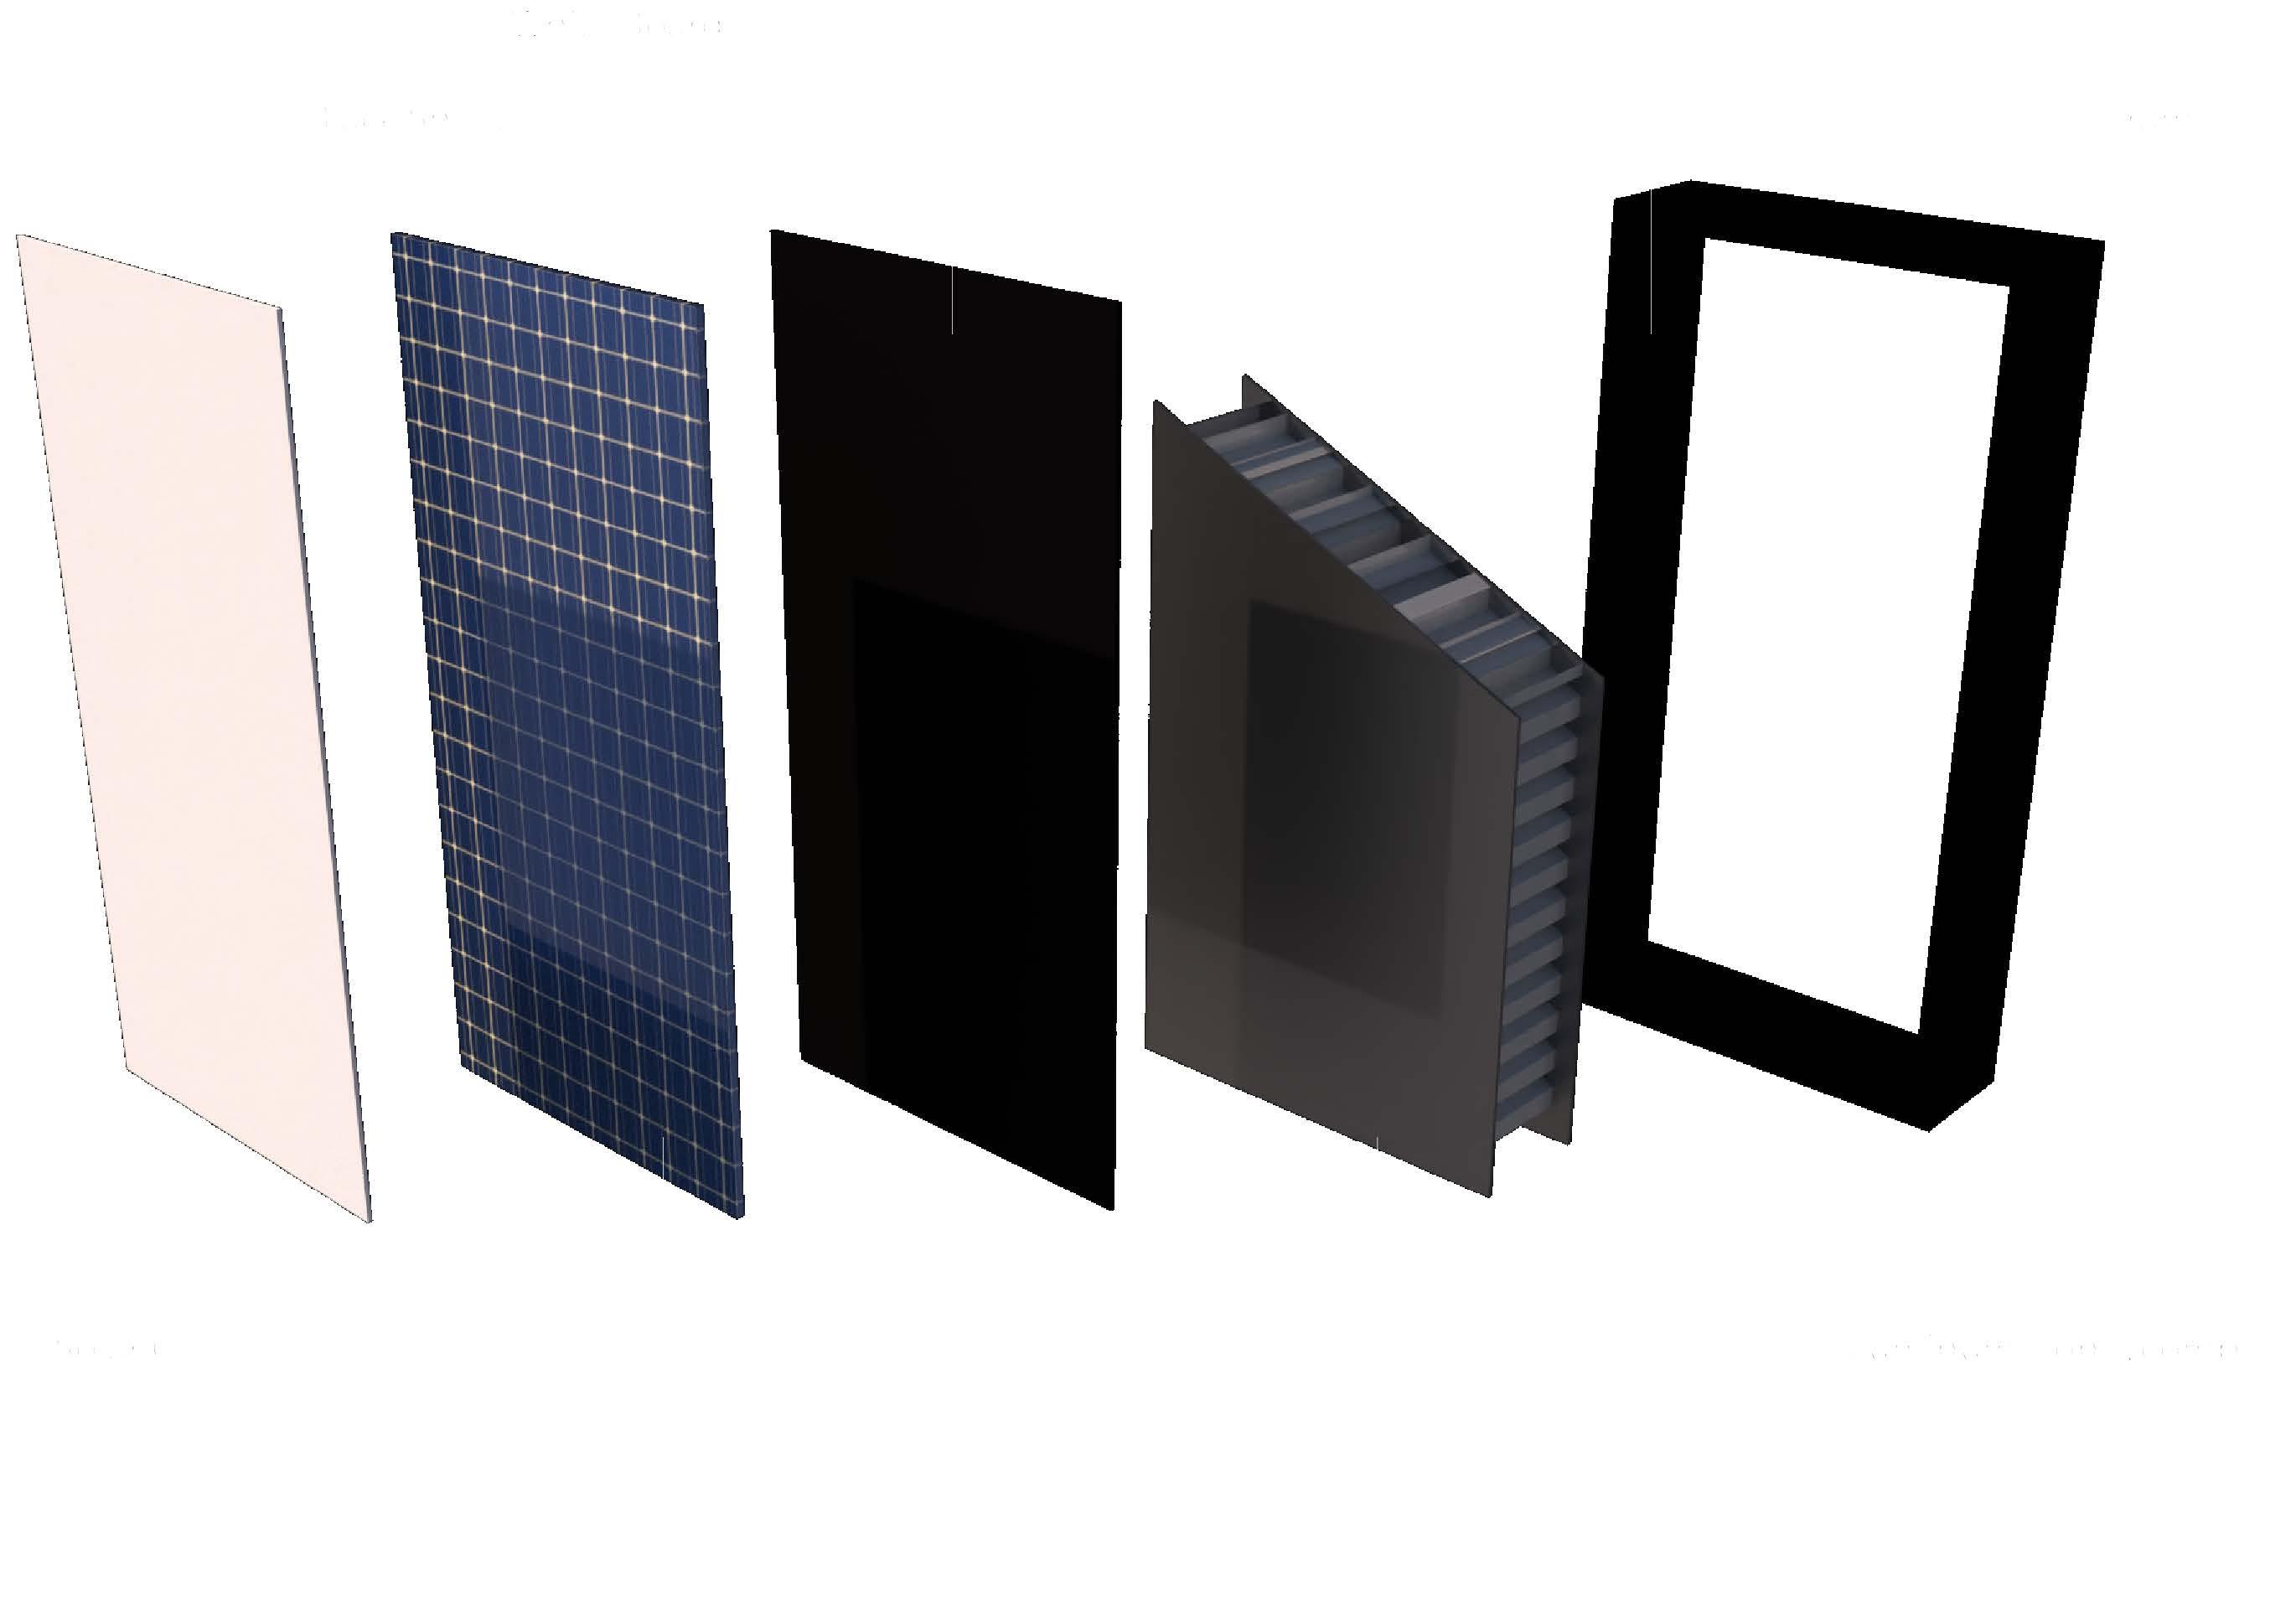
Building Material Ideas

Volume pieces support and interlock each other, there are track communication channels between the volumes.
Use the frame structure to connect the subspace of the volume piece

The marble falls freely, the design of different devices changes the direction and speed of the marble movement.
Breaking the conventional architectural design idea of “designing space first and processing paths later”, we explore the possibility of defining paths first and then attaching spaces. I.
The detail groups design as the interpolation structure, with the purpose of emphasizing the track protruding from the volume pieces.
Different volume and detail components are affected by specific track devices. Spatial interaction with devices through means of connectivity, coverage, interleaving.
Linear movement and Spatial playability

Volume geometry design to create a marble movement glimpse moment by partially covering track. Frame structure and Interpolation details emphasizing the track protruding from the volumes.


