JKG Q1 INDUSTRIAL market report 2023 | GALLELLI REAL ESTATE Gallelli Real Estate 3005 Douglas Blvd #200 Roseville, CA 95661 P 916 784 2700 GallelliRE.com
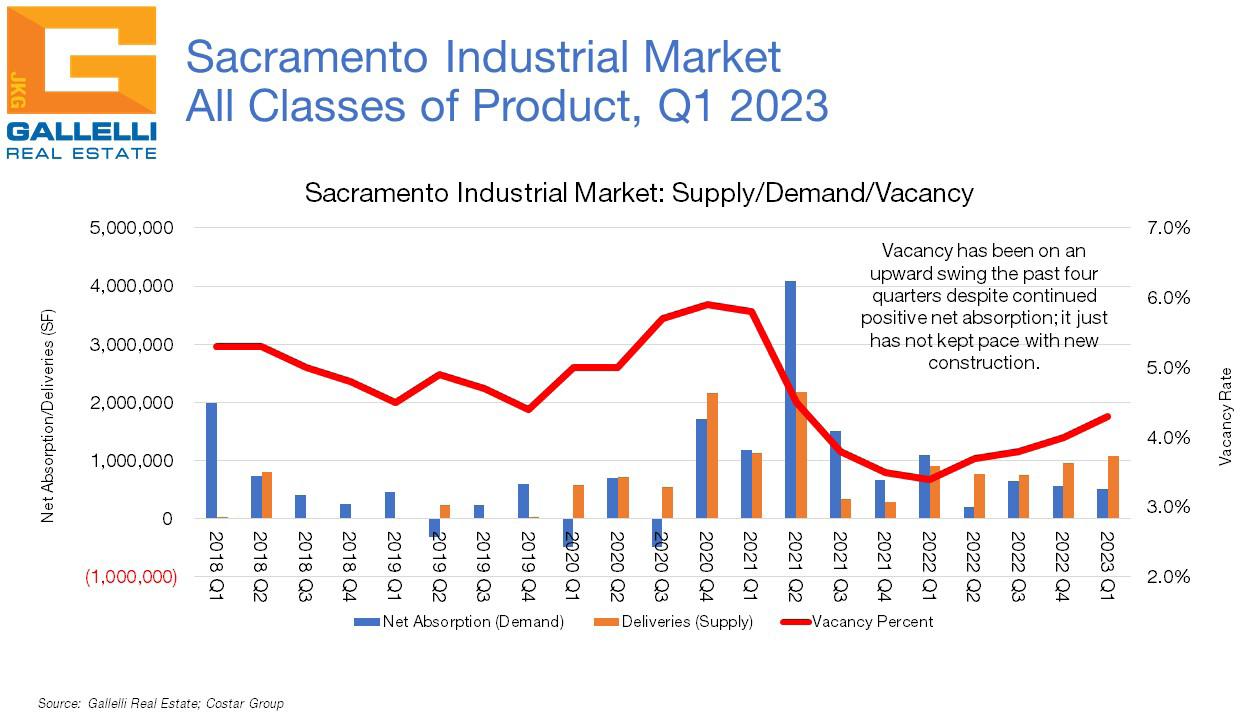
As of the close of Q1 2023, total industrial vacancy in the Sacramento region stood at 4.3%. This is up from the 4.0% rate recorded at the close of 2022 and marks the fourth consecutive quarter that vacancy levels have increased after setting the region’s record low of 3.4% exactly one year ago. This still reflects an incredibly tight market—the ten-year average for vacancy in the region is 7.3%. In fact, the greatest challenge that the Sacramento market has faced over the last two years has simply been a shortage of available industrial product.
Industrial warehouse and distribution space, which accounts for 79% of the region’s 163 million square foot (MSF) inventory, experienced a slight uptick in vacancy from 3.5% to 3.6% while accounting for 579,000 square feet (SF) of positive net absorption (occupancy growth). The region’s 19.0 MSF industrial flex market experienced modest negative net absorption to the tune of -75,000 SF as local vacancy for that asset type increased from 6.5% to 6.9%. Meanwhile, Sacramento’s 15.1 MSF manufacturing market remained flat with vacancy holding steady at just 2.0%.
market overview Direct Vacancy Rate Net Absorption Average Asking Rate (NNN) Sacramento Unemployment Under Construction United States Unemployment 4.3% ±2,447,238 SF ±504,000 SF $0.80 3.5% 4.3%
Vacancy up as new deliveries outpace positive net absorption
Q1 23
This most recent uptick in vacancies is primarily due to new construction. Just under 1.1 MSF of new industrial distribution space was delivered to market in Q1. Buzz Oates added two additional buildings (339,000 and 239,000 SF) to Metro Air Park in the Natomas/Northgate submarket while Christy Enterprises added a new 92,000 SF multitenant warehouse building in that same trade area at 3755 Pell Circle. The West Sacramento submarket accounted for the remainder of new projects delivered over the first three months of 2023; LBA Logistics added 155,000 SF and 136,000 SF distribution buildings at 3765 and 3783 Channel Drive. Meanwhile, Invesco delivered a new 148,000 SF multitenant warehouse building at 3095 Mary Place, while Dermody Properties added an additional 99,000 SF building to their LogistiCenter at West Sacramento project.
This wave of new construction will only intensify over the course of 2023; there is just under 2.5 MSF of additional new construction in the development pipeline with deliveries slated through early next year. Most of this new product will be coming online over the next six months. Metro Air Park continues to be one of the focal points for new industrial development—there is 1.4 MSF of product under construction currently in the Natomas/Northgate submarket. Meanwhile, the Roseville/Rocklin, Sunrise and West Sacramento trade areas also have projects in the works.
Is the industrial party over?

Meanwhile, net absorption both nationally and locally has been coming back to earth. From 2005 through 2015, the U.S. market averaged net absorption of 165 MSF annually. From 2016 through 2020, that total climbed to 255 MSF. In 2021 the market recorded 516 MSF of positive net absorption. Last year, it posted 401 MSF of net absorption.
The Sacramento market averaged 1.2 MSF of net absorption annually from 2005 through 2015. From 2016 through 2020, it averaged 2.5 MSF. Locally, we recorded a whopping 7.5 MSF of net absorption in 2021 and an additional 2.5 MSF of positive gains last year. This number came in at 504,000 SF during the first quarter of the year, which—assuming the same pace through the remainder of 2023—would place us in the 2.0 MSF range for growth. But we also think it a fair assumption that given the region’s shortage of available supply in recent years, that most of the new speculative construction in the pipeline will move briskly even if overall demand levels are coming back to earth. Clearly big picture economic fundamentals will determine this, but even with headwinds, we anticipate what would—by any historical measure—be another strong year for industrial growth ahead.

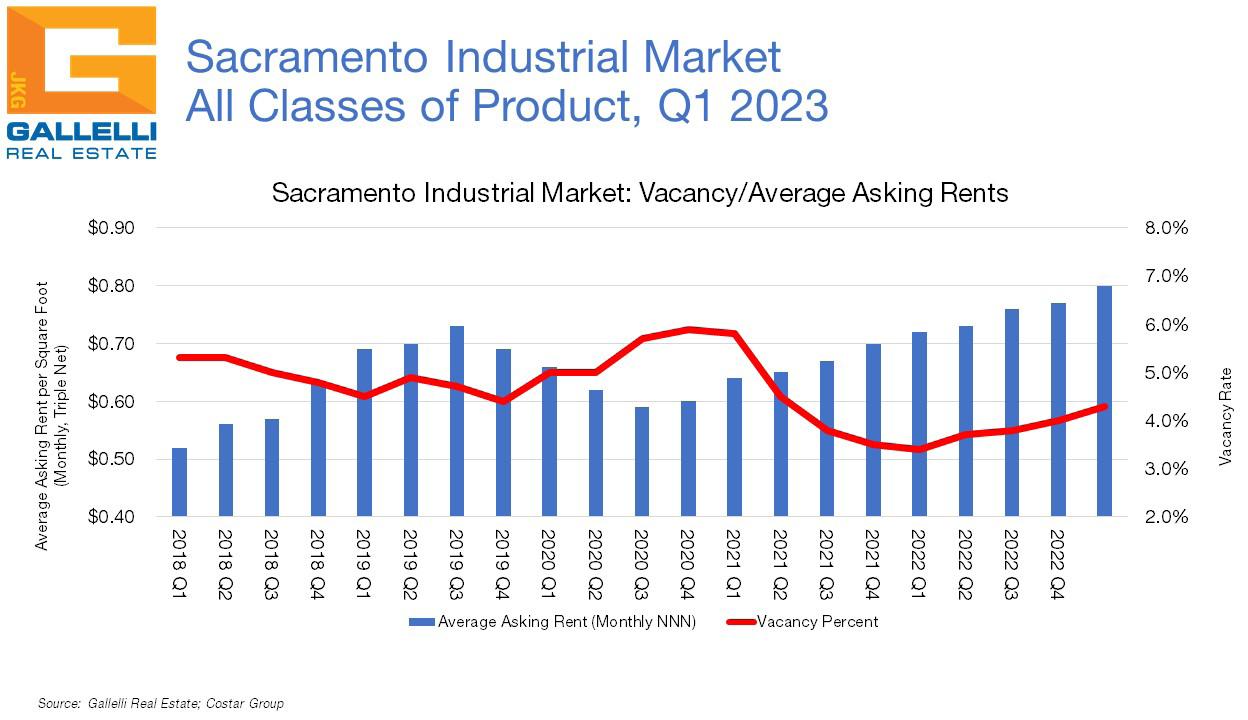
There is one factor, however, where we do see growth in greater question and that is rents. The current average asking rent for industrial space in the region is $0.80 per square foot (PSF) on a monthly triple net basis. While inflationary pressures and rising construction costs have been part of the mix over the past 18 months, this trend has been playing out locally for much longer. The average asking rent for industrial space in the Sacramento region has doubled over the past decade (it stood at $0.40 PSF in Q1 2013). This metric is up 11.1% over the past twelve months. We anticipate rent growth to slow over the next year from recent levels that simply are not sustainable in the long run. Slightly slower demand, rising vacancy rates and a steady pipeline of new product will help to move the market a little closer to equilibrium, though conditions will still considerably favor landlords in the near-term.
Is the industrial market slowing? Yes, but it remains the strongest of all commercial real estate sectors in terms of demand. The market may be downshifting, but it is going from white hot to hot.
INDUSTRIAL MARKET STATISTICS: Criteria based on: 10,000 SF and above, includes owner occupied, does not include flex buildings
Sacramento Regional Totals
Q1 23 industrial market report JKG Submarket Inventory Existing Vacant SF Vacancy Direct (%) Total Availability (%) Net Absorption SF Delivered SF Under Construction Avg. Asking Rate (NNN) Q1-23 YTD Warehouse / Distribution Auburn 1,961,987 1,800 0.10% 0.10% - - - - $0.64 Davis/Woodland 13,040,249 452,376 3.50% 0.10% (109,727) (109,727) - - $0.57 Downtown 1,443,117 147,882 10.20% 12.00% 14,515 14,515 - - $0.83 East Sacramento 335,069 22,000 6.60% 3.90% 13,200 13,200 - - $1.20 Elk Grove/Laguna 4,652,772 36,960 0.80% 1.40% 35,810 35,810 - - $0.85 Folsom/El Dorado Hills 1,861,850 19,338 1.00% 3.30% 17,129 17,129 - - $1.04 Mather 3,284,870 157,373 4.80% 2.50% (14,835) (14,835) - - $0.78 McClellan 11,644,927 246,329 2.10% 2.90% 125,092 125,092 - - $0.75 Northgate/Natomas 17,576,350 1,279,417 7.30% 12.30% 169,195 169,195 670,461 1,398,617 $0.72 Northeast Sacramento 4,188,189 209,347 5.00% 10.20% (29,459) (29,459) - - $0.77 Power Inn 22,116,094 360,675 1.60% 4.20% (54,478) (54,478) - - $0.94 Richards 3,395,956 202,240 6.00% 9.60% 10,790 10,790 - - $0.69 Roseville/Rocklin 12,723,461 258,174 2.00% 3.10% 170,931 170,931 - 26,685 $0.57 South Sacramento 2,058,798 47,498 2.30% 4.60% (12,549) (12,549) - - $0.97 Sunrise 8,290,492 164,206 2.00% 6.90% 118,346 118,346 - 471,515 $0.80 West Sacramento 19,877,090 1,059,647 5.30% 10.20% 124,896 124,896 401,888 550,421 $0.76 Totals 128,451,271 4,665,262 3.6% 6.7% 578,856 578,856 1,072,349 2,447,238 $0.74
Warehouse/Distribution 128,451,271 4,665,262 3.6% 6.7% 578,856 578,856 1,072,349 2,447,238 $0.74 Manufacturing 15,078,080 161,810 1.1% 2.0% 945 945 - - $0.73 Flex 19,041,105 1,291,988 6.8% 8.3% (75,428) (75,428) - - $1.00 Totals 162,570,456 6,119,060 4.3% 6.4% 504,373 504,373 1,072,349 2,447,238 $0.80
Adam Rainey Associate Vice President 916 784 2700 arainey@GallelliRE.com Gallelli Real Estate 3005 Douglas Blvd #200 Roseville, CA 95661 P 916 784 2700 Aman Bains Associate Vice President 916 784 2700 abains@GallelliRE.com Pat Ronan Vice President 916 784 2700 pat@GallelliRE.com Gary Gallelli President 916 784 2700 gary@GallelliRE.com

