Georgia Trauma Annual Report
Trauma Injury Care


“Alone we can do so little; Together we can do so much!”


Michael Johnson Director, Office of EMS and Trauma
April Moss Deputy Director, Systems of Care
Stacee Smith Trauma Coordinator
Danlin Luo Trauma Epidemiologist
Marie Probst Trauma Registrar
The Georgia Trauma Annual Report 2024 provides a demographic and epidemiological analysis of trauma cases reported to the Georgia Trauma Registry through the ImageTrend Patient Registry. Data were downloaded on April 8, 2025. Georgia’s Designated Trauma Centers (DTCs) participate in the National Trauma Data Bank (NTDB).
In 2024, 34 DTCs submitted a total of 45,820 trauma cases. Seven facilities were designated as Level I, eight as Level II, ten as Level III, and eight as Level IV. One Level I pediatric facility and two Level II pediatric facilities are included in these totals. Records were included if the field “State Inclusion” was marked “True.”
The 2024 reporting year marks the second year that Georgia Trauma Registry data were imported from the ESO data system into the ImageTrend Patient Registry. Not all variables available in the 2022 ESO dataset such as some from the Georgia Quality Improvement Program (GQIP) were available for 2024. Therefore, while the 2024 analysis aligns closely with the 2023 report, it is not directly comparable with 2022 data.
Facility information, including trauma level designations, is provided to give readers an overview of Georgia’s trauma system. Inclusion criteria are outlined in Appendix 1. This report analyzes time to definitive care, patient demographics, injury characteristics, payment sources, injury intent, mortality, and outcome measures.
The mission of Georgia’s trauma system is to save lives and improve outcomes through coordinated trauma care and injury prevention. The Georgia Trauma Registry is committed to collecting accurate, timely data and providing information that advances the health and safety of Georgia’s citizens.
The purpose of this report is to inform the medical community, policymakers, and the public about trends and issues that characterize trauma care across the state. Findings support ongoing work in epidemiology, injury prevention, research, education, acute care, resource allocation, and policy development.
The Georgia Department of Public Health, Office of EMS and Trauma, extends sincere appreciation to all trauma centers that contributed data, and to the trauma coordinators, registrars, and staff whose dedication ensures continuous improvement in data quality and trauma system performance.
Contact Information:
Office of EMS and Trauma
Michael Johnson, Director of the Office of EMS and Trauma, Michael.johnson@dph.ga.gov
April J. Moss, Deputy Director Systems of Care, April.moss@dph.ga.gov
Stacee Smith, Trauma Coordinator, Stacee.Smith2@dph.ga.gov
Marie Probst, Trauma Registrar, marie.probst@dph.ga.gov
Danlin Luo, Ph.D., Trauma Epidemiologist, danlin.luo@dph.ga.gov
The mission of the Georgia Office of EMS and Trauma is to reduce death and disability by providing regulation, guidance, and leadership to enable the assessment, planning, development, and promotion of statewide Emergency Medical Services and time-sensitive systems of care.
A Healthy and Safe Georgia – exceptional patient outcomes through comprehensive, statewide, integrated, data-driven, equitable, and peoplecentered Emergency Medical Services and time-sensitive systems of care
DPH’s workforce is guided by the following core values in carrying out our public health work:
• People – We value our employees as professional colleagues. We treat our customers, clients, partners, and those we serve respectfully by listening, understanding, and responding to their needs.
• Excellence – Commitment, accountability, and transparency for optimal, efficient, effective, and responsive performance.
• Partnership – Internal and external teamwork to solve problems, make decisions, and achieve common goals.
• Innovation – New approaches and progressive solutions to problems. Embracing change and accepting reasonable risk.
• Science – The application of the best available research, data, and analysis leading to improved outcomes
• Know what trauma resources are available at each hospital and transport patients to the most appropriate facility in a timely manner.
• Strengthen Georgia’s Emergency Medical Services system.
• Ensure trauma patients receive appropriate, timely treatment.
• Save lives, reduce disability, and improve quality of life.
• Have access to a designated trauma hospital nearby.
• Have peace of mind knowing that, when emergencies occur, patients will receive the right care whether that means treatment locally or transfer to a higher-level trauma center.


All facilities seeking trauma designation must meet specific criteria established by the Georgia Department of Public Health, Office of EMS and Trauma (OEMST). The Department utilizes the Resources for Optimal Care of the Injured Patient published by the American College of Surgeons (ACS) as the guiding document for trauma system standards. All designated hospitals must submit trauma registry data to OEMST and maintain an active performance improvement process with thorough documentation.
Level I Trauma Center- A Level I Trauma Center serves as a regional resource and tertiary care facility central to the trauma system. These centers provide leadership and comprehensive care for every aspect of injury, from prevention through rehabilitation. Level I facilities have major responsibilities for education, research, and system planning.
Level II Trauma Center- A Level II Trauma Center provides initial definitive trauma care for patients regardless of injury severity. These centers may be academic, public, or private institutions located in urban, suburban, or rural settings. In regions without a Level I center, a Level II center assumes leadership roles in education and system coordination.
Level III Trauma Center- Level III Trauma Centers provide prompt assessment, resuscitation, emergency operations, and stabilization, and arrange transfer to a higher-level trauma center when necessary. Each facility must have well-trained emergency department physicians and general surgeons available. These hospitals maintain transfer agreements and standardized treatment protocols to ensure continuity of care.
Level IV Trauma Center - Level IV facilities provide the initial evaluation and stabilization of injured patients, with most requiring transfer to a higher-level trauma center. A Level IV facility must have 24-hour emergency coverage by a physician or mid-level provider. Specialty coverage may be limited, but a wellorganized resuscitation team and clearly defined transfer plans are essential
Level I Trauma Centers
WellStar MCG Health (AUMC)
Grady Memorial Hospital Atlanta
Atrium Health Navicent
Memorial Health Univ. Medical Center
Northeast GA Medical Center
WellStar Kennestone Hospital
Level III Trauma Centers
Advent Health Redmond
Level II Trauma Centers
Atrium Health Floyd
Doctors Hospital of Augusta
Northside Gwinnett Medical Center
Piedmont Athens Regional
Piedmont Columbus Regional - Midtown
Phoebe Putney Memorial Hospital
WellStar North Fulton Hospital
Level IV Trauma Centers
Atrium Health Floyd Polk Crisp Regional
Fairview Park Hospital
Hamilton Medical Center
John D. Archbold Memorial Hospital
Effingham Health System
Emanuel Medical Center
Memorial Health Meadows
Morgan Medical Center
Piedmont Cartersville WellStar Paulding
Piedmont Henry Hospital
Piedmont Walton Hospital
South Georgia Medical Center
WellStar Cobb Hospital
Pediatric Trauma Centers
CHOA @ Egleston Level I
CHOA @ Scottish Rite Level II
Children’s Hosp of GA - Aug Univ Level II
Burn Centers
Joseph M. Still Burn Center
Grady Burn Center
WellStar Spalding Regional
WellStar West GA
• Thirty-four Designated Trauma Centers submitted data in 2024.
o Six Level I adult centers
o One Level I pediatric center
o Seven Level II adult centers
o Two Level II pediatric centers
o Ten Level III adult centers
o Eight Level IV adult centers
* Note: Augusta University Hospital is a Level I adult center with an additional Level II pediatric designation. The facility submitted data as a single trauma hospital and is counted under Level I.
• Injury frequency peaks among individuals aged 18–34, primarily from motor-vehicle traffic (MVT) incidents, and rises again between ages 60–88, when fall-related injuries increase.
• Falls are most frequent among children aged 0–9 and adults over 63.
• Males account for 66.3% of all cases through age 71; beyond age 71, females represent the majority of patients.
• Mechanisms of injury are categorized according to the NTDB-published External Cause of Injury Matrix and Trauma Type Map (https://www.facs.org/quality-programs/trauma/tqp/centerprograms/ntdb).
• Falls account for 53.0% of cases, increasing among children under age 9 and adults over 63.
• Motor-vehicle traffic (MVT) injuries account for 24.1% of cases, peaking between ages 18–34.
• Firearm injuries represent 5.8% of cases, with highest frequency between ages 16–24.
• Suffocation and firearm injuries have the highest case-fatality rates 18.2% and 15.9%, respectively.
The Injury Severity Score (ISS) quantifies trauma severity on a scale from 1–75, with higher scores indicating more severe injuries. This report groups injuries as follows:
• Minor: ISS 1–8
• Moderate: ISS 9–15
• Severe: ISS 16–24
• Very Severe: ISS > 24
Key findings:
• Nearly half (43.3%) of registry patients sustained minor injuries, and 40.5% sustained moderate injuries.
• Case-fatality rates increased with injury severity, reaching nearly 26.2% among the very severe group.
• Median length of stay (LOS) rose progressively with injury severity.
• Median ventilator days were the shortest for minor and moderate injuries and longest for the very severe group.
• Median intensive care unit (ICU) days increased with severity when ISS exceeded 15; the minor and moderate groups had equivalent median ICU durations.
• The overall mortality rate was 3.7%.
• Case fatality rates were highest among patients aged 20–24 years.
• The male case-fatality rate (4.7%) exceeded the female rate (2.4%).
• The greatest number of deaths resulted from falls, followed by MVT injuries and firearm injuries.
• Suffocation and firearm injuries had the highest case-fatality rates among all mechanisms, with firearms reaching 15.9%.
• Medicare was the most frequent primary payer, accounting for 34.8% of cases.
• Private/Commercial insurance ranked second, covering 27.0% of cases.
• Self-pay was the third largest category at 13.7%.
• Medicaid ranked fourth at 12.4%.
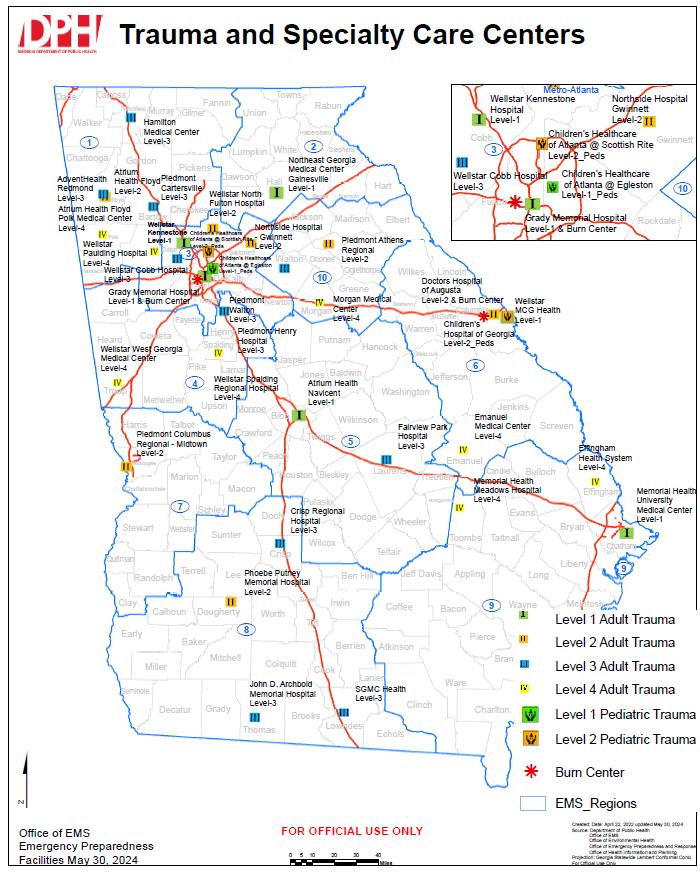
Table 1: Facilities by Level
>50% of designated trauma centers are Level III or Level IV
Figure 1: Facilities by Level
This chart shows the overall counts of facilities by designation level
*Six Adult & One Pediatric ** Seven Adult & Two Pediatric
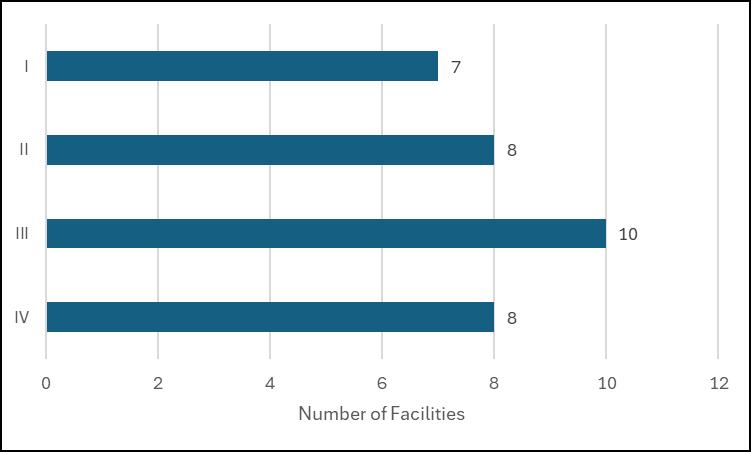
Table 2: Incidents by Facility Level
~84.2% of trauma patients were treated in a Level I or Level II trauma facility.
Figure 2A: Incidents by Facility Level
This chart shows the trauma case counts by facility designation level
2 B : Percentage of Incidents by Facility Level
The Emergency Medical Services (EMS) system plays a critical role in preventing further injury, initiating resuscitation, and ensuring the safe and timely transport of injured patients. Patients should be transported directly to the trauma center most appropriately equipped and staffed to manage their injuries. The tables and figures in this section display data illustrating where patients originated prior to arriving at a Designated Trauma Center (DTC).
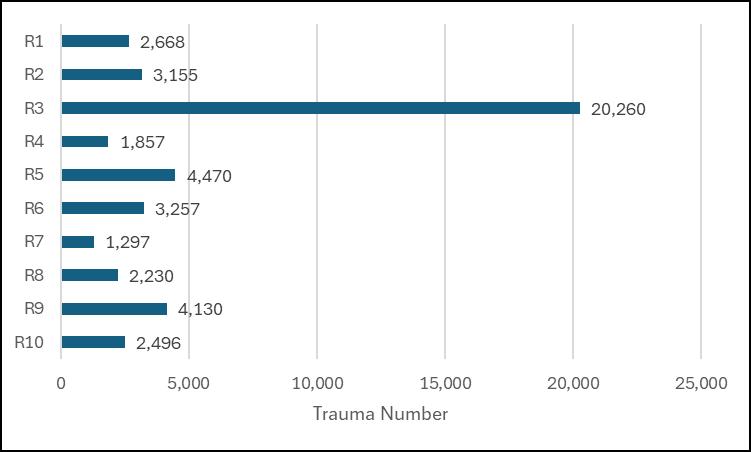
The frequency of trauma patients in Table 3 represents the number treated in DTCs located across Georgia’s EMS regions. Facilities in EMS Region 3 treated the largest portion of trauma patients (44.2%) in 2024.
Among 45,820 total Records,
• 34,723 patients arrived directly from the scene (non–inter-facility transfers).
o Of these, 28,279 met inclusion criteria for analysis and are classified as the S Group (Scene Group).
o Records involving police or private/public vehicle transport and walk-ins were excluded from this group.
• 11,097 patients were transferred from another medical facility and are classified as the R Group (Referring Group).
The table below summarizes the number and percentage of patients in each group by ISS category
3: Incidents by Destination
The time to definitive care analysis is presented in two parts. The first examines cases involving medical transport from the scene of injury to the emergency department of a designated trauma center, where definitive trauma care was provided. The second examines cases in which patients were transferred from a referring hospital to another facility for definitive care.
In 2024, a total of 45,820 trauma cases were reported statewide. Of these, 28,279 cases (61.7%) involved patients who arrived directly from the scene of injury classified as the Scene Group (S Group) and 11,097 cases (24.2%) involved patients transferred from another facility classified as the Referring Group (R Group). The remaining 6,444 cases (14.1%) involved patients who arrived by other means, such as private vehicle, law enforcement transport, or walk-in.
The S Group represents patients transported by EMS directly from the scene of injury. Of the 34,723 noninter-facility transfer records, 28,279 met the inclusion criteria for analysis. Records involving private, police, or walk- in transport were excluded.
The following time intervals were analyzed using records with valid data for the corresponding fields:
1. EMS Notification to Scene Arrival (Tables 5A1, 5A2, 5A3)
• Valid data in 26,078 cases (92.2%)
• Used to calculate the median time from EMS notification to scene arrival.
2. Scene Arrival to Scene Departure (Tables 5B1, 5B2, 5B3)
• Valid data in 25,904 cases (91.6%)
• Used to calculate the median time spent at the scene.
3. Scene Departure to Emergency Department (ED) Arrival (Tables 5C1, 5C2, 5C3)
• Valid data in 25,920 cases (91.7%)
• Used to calculate the median time for EMS transport from scene to hospital.
4. EMS Notification to Emergency Department (ED) Arrival (Tables 5D1, 5D2, 5D3)
• Valid data in 26,116 cases (92.4%)
• Used to calculate the total median prehospital time, from dispatch to hospital arrival.
In each category, the remaining 7–8% of cases were excluded from time-based analysis due to missing or incomplete date/time entries.
Table 5A1: S Group, All ISS, Median Time from EMS Notification Time to EMS Scene Arrival Time
This table shows the median overall time (HH:MM:SS) from EMS notification to scene arrival for all Injury Severity Scores (ISS). The median total time from EMS notification to scene arrival was 10 minutes
Table 5A2: S Group, ISS <=15, Median Time from EMS Notification Time to EMS Scene Arrival Time
This table shows the median time (HH:MM:SS) from EMS notification to scene arrival for patients with an Injury Severity Score (ISS) less than or equal to 15, grouped by hospital designation level
Table 5A3: S Group, ISS >15, Median Time from EMS Notification Time to EMS Scene Arrival Time
This table shows the median time (HH:MM:SS) from EMS notification to scene arrival for patients with an Injury Severity Score (ISS) greater than 15, grouped by hospital designation level.
Table 5B1: S Group, All ISS, Median Time from EMS Scene Arrival Time to EMS Scene Departure Time
This table shows the median overall time (HH:MM:SS) from EMS scene arrival to scene departure for all Injury Severity Scores (ISS). The median total time from EMS scene arrival to scene departure was 19 minutes.
Table 5B2: S Group, ISS<=15, Median Time from EMS Scene
Arrival Time to EMS Scene
Departure Time
This table shows the median time (HH:MM:SS) from EMS scene arrival to scene departure for patients with an Injury Severity Score (ISS) less than or equal to 15, grouped by hospital designation level.
Table 5B3: S Group, ISS>15, Median Time from EMS Scene
Arrival Time to EMS Scene
Departure Time
This table shows the median time (HH:MM:SS) from EMS scene arrival to scene departure for patients with an Injury Severity Score (ISS) greater than 15, grouped by hospital designation level
Table 5C1: S Group, All ISS, Median Time from EMS Scene Departure
Time to Hospital ED Arrival Time
This table shows the median overall time (HH:MM:SS) from EMS scene departure to hospital ED arrival for all ISS. The median total time from EMS scene departure to hospital ED arrival was 25 minutes
Table 5C2: S Group, ISS<=15, Median Time from EMS Scene Departure Time to Hospital ED
Arrival Time
This table shows the median time (HH:MM:SS) from EMS scene departure to hospital emergency department (ED) arrival for patients with an ISS less than or equal to 15, grouped by hospital designation level.
Table 5C3: S Group, ISS>15, Median Time from EMS Scene
Departure Time to Hospital ED
Arrival Time
This table shows the median time (HH:MM:SS) from EMS scene departure to hospital emergency department (ED) arrival for patients with an Injury Severity Score (ISS) greater than 15, grouped by hospital designation level.
Table 5D1: S Group, All ISS, Median Time from EMS Notification Time to Hospital ED Arrival Time
This table shows the median overall time (HH:MM:SS) from EMS notification to hospital emergency department (ED) arrival for all Injury Severity Scores (ISS). The median total time from EMS notification to hospital ED arrival was 57 minutes.
Table 5D2: S Group, ISS<=15, Median Time from EMS
Notification Time to Hospital ED Arrival Time
This table shows the median time (HH:MM:SS) from EMS notification to hospital emergency department (ED) arrival for patients with an Injury Severity Score (ISS) less than or equal to 15, grouped by hospital designation level.
Table 5D3: S Group, ISS>15, Median Time from EMS
Notification Time to Hospital ED Arrival Time
This table shows the median time (HH:MM:SS) from EMS notification to hospital emergency department (ED) arrival for patients with an Injury Severity Score (ISS) greater than 15, grouped by hospital designation level.
Table 5D4: S Group, ISS All, Median Time from EMS Notification Time to Hospital ED Arrival Time
In destination EMS Region 5, the median total time from EMS notification to hospital ED arrival was the longest, at 62 minutes
Table 5D5: S Group, ISS <=15, Median Time from EMS
Notification Time to Hospital ED Arrival Time
In destination EMS Region 5, patients with an ISS less than or equal to 15 had the longest median total time from EMS notification to hospital ED arrival, at 63 minutes
Table 5D6: S Group, ISS >15, Median Time from EMS Notification Time to Hospital ED Arrival Time
In destination EMS Region 5, patients with an Injury Severity Score (ISS) greater than 15 had the longest median total time from EMS notification to hospital emergency department (ED) arrival, at 61 minutes
Table 5D7: S Group, Median Time from EMS Notification Time to Hospital ED Arrival Time by ISS groups and Quarters
In Q3 and Q4, the median total time for all ISS was one minute longer than in Q1 and Q2
Table 5D8: S Group, All ISS, Median Time by EMS Region and Discharge
The table lists the number of patients discharged alive or deceased, along with the corresponding median time to definitive care for each EMS region. Trauma patients who survived their injuries in destination EMS Region 5 had the longest median time to definitive care (1:02:00 HH:MM:SS). Trauma patients who died from their injuries in destination EMS Region 2 had the longest median time to definitive care (0:57:00 HH:MM:SS).
Figure 5D9: S Group, All ISS, Median Time by EMS Region and Discharge Status
This figure shows the cumulative number of trauma patients by discharge status across EMS regions, plotted against their median total time to definitive care. All Injury Severity Scores (ISS) are represented. Trauma patients who survived their injuries in destination EMS Region 5 had the longest median time to definitive care (1:02:00 HH:MM:SS), while those who died from their injuries in destination EMS Region 2 had the longest median time (0:57:00 HH:MM:SS).

Table 5D10: S Group, ISS <=15, Median Time by EMS Region and Discharge Status
The table lists the number of patients discharged alive or deceased, along with the corresponding median time to definitive care for each EMS region. Trauma patients with an Injury Severity Score (ISS) less than or equal to 15 who survived their injuries in destination EMS Region 5 had the longest median time to definitive care (1:03:00 HH:MM:SS). Trauma patients with an ISS less than or equal to 15 who died from their injuries in destination EMS Region 5 also had the longest median time to definitive care (1:03:00 HH:MM:SS)
Figure 5D11: S Group, ISS <=15, Median Time by EMS Region and Discharge Status
This figure shows the cumulative number of trauma patients by discharge status across EMS regions, plotted against their median total time to definitive care. Trauma patients with an Injury Severity Score (ISS) less than or equal to 15 are represented. Patients who survived their injuries in destination EMS Region 5 had the longest median time to definitive care (1:03:00 HH:MM:SS), and those who died from their injuries in the same region also had the longest median time (1:03:00 HH:MM:SS).
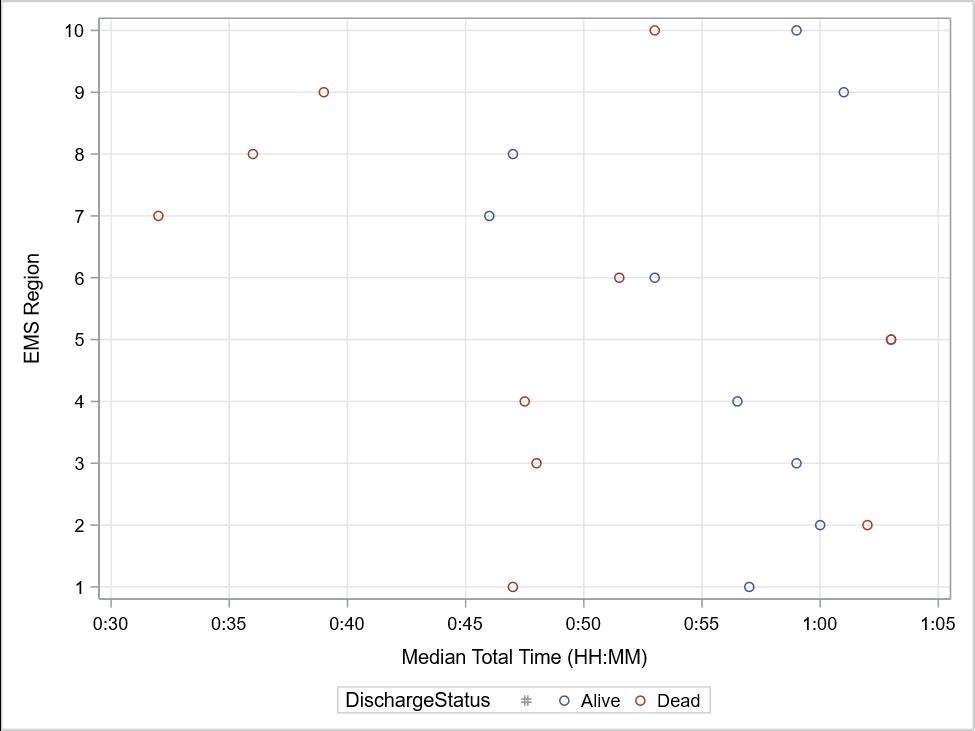
Table 5D12: S Group, ISS >15, Median Time by EMS Region and Discharge Status
The table lists the number of patients discharged alive or deceased, along with the corresponding median time to definitive care for each EMS region. Trauma patients with an Injury Severity Score (ISS) greater than 15 who survived their injuries in destination EMS Region 5 had the longest median time to definitive care (1:02:00 HH:MM:SS). Trauma patients with an ISS greater than 15 who died from their injuries in destination EMS Region 2 had the longest median time to definitive care (0:57:00 HH:MM:SS).
Figure 5D13: S Group, ISS >15, Median Time by EMS Region and Discharge Status
This figure shows the cumulative number of trauma patients by discharge status across EMS regions, plotted against their median total time to definitive care. Trauma patients with an Injury Severity Score (ISS) greater than 15 are represented. Patients who survived their injuries in destination EMS Region 5 had the longest median time to definitive care (1:02:00 HH:MM:SS), while those who died from their injuries in destination EMS Region 2 had the longest median time (0:57:00 HH:MM:SS).
As noted earlier in this report, the second part of the time to definitive care analysis examines cases in which patients were transferred from a referring hospital to another facility for definitive trauma care. In 2024, a total of 45,820 trauma cases were reported statewide. Of these, 11,097 cases (24.2%) involved interfacility transfers, forming the dataset for the Referring Group (R Group) analysis.
Because EMS transport data prior to arrival at the referring hospital are not available, the time analysis begins with the patient’s arrival at that facility. In other words, for the R Group, the referring hospital functions as the scene of origin.
1. Time from EMS Notification to EMS Scene Arrival Time (Tables 6A1, 6A2, 6A3)
• Valid data in 9,009 cases (81.2%)
• Used to calculate the median time from EMS notification to arrival at the referring hospital.
2. Time from EMS Scene Arrival Time to EMS Scene Departure Time (Tables 6B1, 6B2, 6B3)
• Valid data in 8,953 cases (80.7%)
• Used to calculate the median time spent at the referring hospital prior to departure.
3. Time from EMS Scene Departure Time to Destination Hospital Arrival Time (Tables 6C1, 6C2, 6C3)
• Valid data in 9,025 cases (81.3%)
• Used to calculate the median time for EMS transport from the referring hospital to the receiving facility.
4. Time from EMS Notification Time to the Final Destination Hospital ED Arrival Time (Tables 6D1, 6D2, 6D3)
• Valid data in 9,044 cases (81.5%)
• Used to calculate the total median time from EMS notification to arrival at the receiving hospital emergency department.
5. Time from Referral Hospital Arrival Time to the Final Destination Hospital ED Arrival Time (Tables 6E1, 6E2, 6E3)
• Valid data in 9,948 cases (89.6%)
• Used to calculate the median time from arrival at the referring hospital to arrival at the receiving hospital ED.
6. Time from EMS Notification Time to Final Destination Hospital ED Arrival Time by Four Quarters, by EMS Region and Discharge Status (Tables 6F1, 6F2, 6F4, 6F6, Figures 6F3, 6F5, 6F7)
• Valid data in 9,044 cases (81.5%)
• Used to compare median times from EMS notification to receiving hospital ED arrival by calendar quarter, EMS region, and patient discharge status.
In each category, records with incomplete or missing date/time values (approximately 10–19% of cases) were excluded from time-based analyses.
Table 6A1: R Group, All ISS, Median Time from EMS Notification Time to EMS Scene Arrival Time
This table shows the median overall time (HH:MM:SS) from EMS notification to EMS scene arrival for all ISS. The median total time from EMS notification to EMS scene arrival was 23 minutes.
Table 6A2: R Group, ISS <=15, Median Time from EMS Notification Time to EMS Scene Arrival Time
This table shows the median time (HH:MM:SS) from EMS notification to EMS scene arrival for patients with an ISS less than or equal to 15. The median total time from EMS notification to EMS scene arrival was 23 minutes (00:23:00).
Table 6A3: R Group, ISS >15, Median Time from EMS Notification Time to EMS Scene Arrival Time
This table shows the median time (HH:MM:SS) from EMS notification to EMS scene arrival for patients with an ISS greater than 15. The median total time from EMS notification to EMS scene arrival was 22 minutes.
Table 6B1: R Group, All ISS, Median Time from EMS Scene Arrival Time to EMS Scene Departure Time
This table shows the median overall time (HH:MM:SS) from EMS scene arrival to EMS scene departure for all ISS. The median total time from EMS scene arrival to EMS scene departure was 25 minutes
Table 6B2: R Group, ISS <=15, Median Time from EMS Scene
Arrival Time to EMS Scene
Departure Time
This table shows the median time (HH:MM:SS) from EMS scene arrival to EMS scene departure for patients with an ISS less than or equal to 15. The median total time from EMS scene arrival to EMS scene departure was 24 minutes.
Table 6B3: R Group, ISS >15, Median Time from EMS Scene
Arrival Time to EMS Scene
Departure Time
This table shows the median time (HH:MM:SS) from EMS scene arrival to EMS scene departure for patients with an ISS greater than 15. The median total time from EMS scene arrival to EMS scene departure was 29 minutes.
Table 6C1: R Group, All ISS, Median
Time from EMS Scene Departure
Time to Destination Hospital
Arrival Time
This table shows the median overall time (HH:MM:SS) from EMS scene departure to destination hospital arrival for all ISS. The median total time from EMS scene departure to destination hospital arrival was 46 minutes.
Table 6C2: R Group, ISS <=15, Median Time from EMS Scene
Departure Time to Destination
Hospital Arrival Time
This table shows the median time (HH:MM:SS) from EMS scene departure to destination hospital arrival for patients with an ISS less than or equal to 15. The median total time from EMS scene departure to destination hospital arrival was 45 minutes
Table 6C3: R Group, ISS >15, Median Time from EMS Scene
Departure Time to Destination
Hospital Arrival Time
This table shows the median time (HH:MM:SS) from EMS scene departure to destination hospital arrival for patients with an ISS greater than 15. The median total time from EMS scene departure to destination hospital arrival was 41 minutes.
Table 6D1: R Group, All ISS, Median Time from EMS Notification Time to Final Destination Hospital ED
Arrival Time
The median total time from EMS notification to final destination hospital ED arrival for all ISS was 1 hour and 41 minutes (HH:MM:SS).
Table 6D2: R Group, ISS <=15, Median Time from EMS
Notification Time to Final
Destination Hospital ED Arrival Time
This chart represents the median overall time (HH:MM:SS) for ISS less than or equal to 15 from EMS Notification Time to Final Destination
Hospital ED Arrival Time. The median total time from EMS Notification Time to Final Destination
Hospital ED Arrival Time is 1 hour and 42 minutes
Table 6D3: R Group, ISS >15, Median Time from EMS
Notification Time to Final Destination Hospital ED Arrival Time
This chart represents the median overall time (HH:MM:SS) for ISS greater than 15 from EMS
Notification Time to Final Destination Hospital ED arrival time. The median total time from EMS Notification Time to Final Destination Hospital ED Arrival Time is 1 hour and 40 minutes.
Table 6E1: R Group, All ISS, Median Time from Referral Hospital Arrival
Time to Final Destination Hospital
ED Arrival Time
This chart represents the median overall time (HH:MM:SS) from Referral Hospital Arrival Time to Final Destination Hospital ED Arrival Time for all Injury Severity Scores. The median total time from Referral Hospital Arrival Time to Final Destination Hospital ED Arrival Time is 5 hours and 11 minutes.
Table 6E2: R Group, ISS <=15, Median Time from Referral Hospital Arrival Time to Final Destination
Hospital ED Arrival Time
This chart represents the median overall time (HH:MM:SS) for Injury Severity Scores less than or equal to 15 from Referral Hospital Arrival Time to Final Destination Hospital ED Arrival Time. The median total time from Referral Hospital Arrival Time to Final Destination Hospital ED Arrival Time is 5 hours and 19 minutes.
Table 6E3: R Group, ISS >15, Median Time from Referral Hospital Arrival Time to Final Destination Hospital ED Arrival Time
This chart presents the median overall time (HH:MM:SS) for patients with Injury Severity Scores greater than 15, measured from referring hospital arrival to final destination emergency department arrival. The median total time is 4 hours and 29 minutes. For patients with more severe injuries (ISS > 15), this represents a median transfer time approximately 50 minutes shorter than that observed for patients with minor or moderate injuries (ISS ≤ 15).
Table 6F1: R Group, Median Time from EMS Notification Time to Final Destination Hospital ED Arrival Time
In Q1 and Q3 2024, the median total time (ISS all) is longer than Q2 and Q4 of 2024
Table 6F2: R Group, All ISS, Median Time from EMS Notification to
This table presents the number of patients transferred from referring facilities to final destination hospitals, categorized by discharge status and corresponding median time to definitive care for each EMS region of the receiving hospital. All Injury Severity Scores are included. Among patients discharged alive, those in EMS Region 4 had the longest median time to definitive care (2 hours 35 minutes [HH:MM:SS]), representing a single case. Among patients who died, those treated in EMS Region 9 experienced the longest median time to definitive care (2 hours 10 minutes [HH:MM:SS]). No deaths were reported for destination hospitals in EMS Regions 4 and 7 during the analysis period.
Figure 6F3: R Group, All ISS, Median Time from EMS Notification to ED Admission by EMS Region and
This figure displays a scatter plot of trauma patients transferred from referring facilities to final destination hospitals, showing cumulative counts by discharge status and corresponding median total time to definitive care across EMS regions. All Injury Severity Scores are represented. Among patients discharged alive, those in EMS Region 4 had the longest median time to definitive care (2 hours 35 minutes [HH:MM:SS]), representing a single case. Among patients who died, those treated in EMS Region 9 had the longest median time to definitive care (2 hours 10 minutes [HH:MM:SS]). No deaths were reported for destination hospitals in EMS Region 4 during the analysis period.
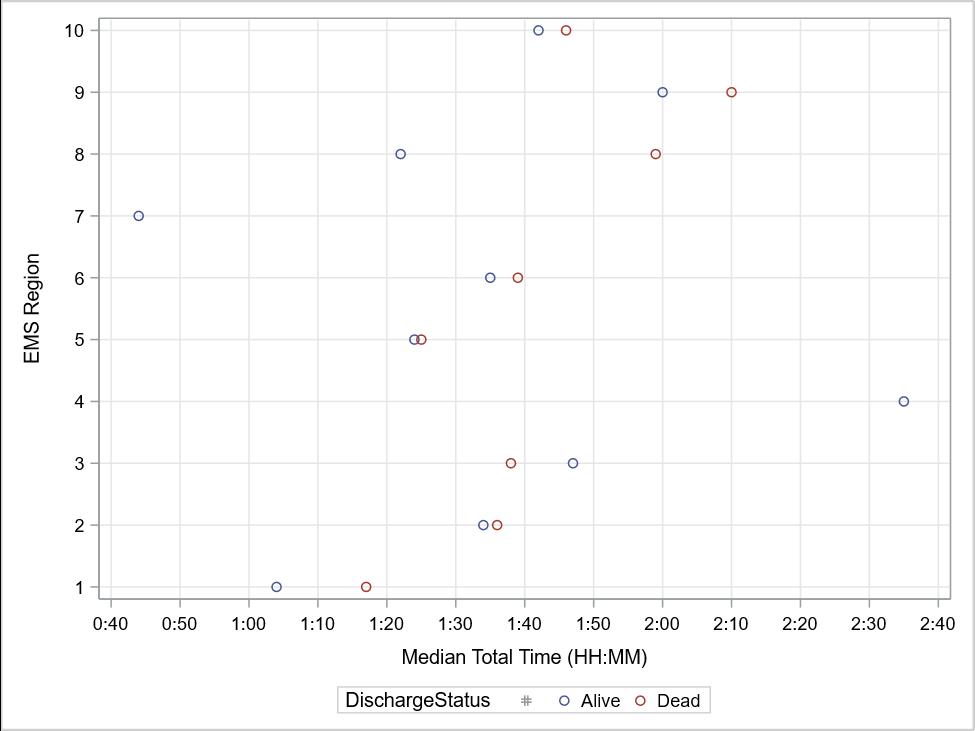
Table 6F4: R Group, ISS <=15, Median Time from EMS Notification to ED
This table presents the number of patients transferred from referring facilities to final destination hospitals, categorized by discharge status and corresponding median time to definitive care for each EMS region of the receiving hospital. Among patients with an Injury Severity Score (ISS) ≤ 15 who were discharged alive, those in EMS Region 4 had the longest median time to definitive care (2 hours 35 minutes [HH:MM:SS]), representing a single case. Among patients who died, those treated in EMS Region 9 experienced the longest median time to definitive care (2 hours 32 minutes [HH:MM:SS]). No deaths were reported for destination hospitals in EMS Regions 4, 7, and 8 with ISS ≤ 15 during the analysis period.
6F5: R Group,
This figure displays a scatter plot of trauma patients transferred from referring facilities to final destination hospitals, showing cumulative counts by discharge status and corresponding median total time to definitive care across EMS regions. Cases with an Injury Severity Score (ISS) ≤ 15 are represented. Among patients discharged alive, those treated in EMS Region 4 had the longest median time to definitive care (2 hours 35 minutes [HH:MM:SS]), representing a single case. Among patients who died, those in EMS Region 9 experienced the longest median time to definitive care (2 hours 32 minutes [HH:MM:SS]). No deaths were reported for destination hospitals in EMS Regions 4, 7, or 8 with ISS ≤ 15 during the analysis period.
6F6: R Group, ISS >15,
This table presents the number of patients transferred from referring facilities to final destination hospitals, categorized by discharge status and corresponding median time to definitive care for each EMS region of the receiving hospital. Among patients with an Injury Severity Score (ISS) > 15 who were discharged alive, those treated in EMS Region 9 had the longest median time to definitive care (1 hour 59 minutes 30 seconds [HH:MM:SS]). Among patients who died, those in EMS Region 8 experienced the longest median time to definitive care (1 hour 59 minutes [HH:MM:SS]). No records with ISS > 15 were reported for destination hospitals in EMS Region 4, and no deaths with ISS > 15 were reported for destination hospitals in EMS Region 7 during the analysis period
Figure 6F7: R Group, ISS >15, Median Time from EMS Notification to ED
This figure displays a scatter plot of trauma patients transferred from referring facilities to final destination hospitals, showing cumulative counts by discharge status and corresponding median total time to definitive care across EMS regions. Cases with an Injury Severity Score (ISS) > 15 are represented. Among patients discharged alive, those treated in EMS Region 9 had the longest median time to definitive care (1 hour 59 minutes 30 seconds [HH:MM:SS]). Among patients who died, those in EMS Region 8 experienced the longest median time to definitive care (1 hour 59 minutes [HH:MM:SS]). No records with ISS > 15 were reported for destination hospitals in EMS Region 4, and no deaths with ISS > 15 were reported for destination hospitals in EMS Region 7 during the analysis period
Demographic data help identify age groups and genders at higher risk for specific types of injuries. This information allows injury prevention programs to focus interventions on the most affected populations, targeting both causes of injury and regions of the state where prevention efforts can have the greatest impact.
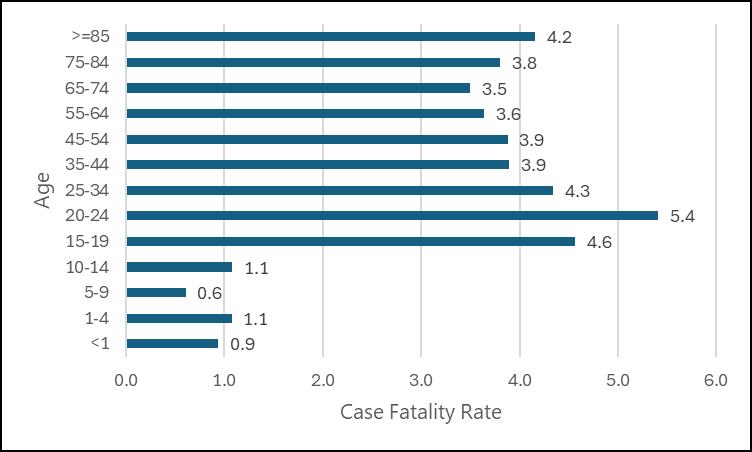
This table summarizes trauma incidents and associated fatality rates by age group. The highest fatality rate (5.4%) occurred among patients aged 20–24 years. Notably, one fatality was reported among three cases classified as Not Known/Not Recorded (NK/NR), yielding a fatality rate of 33.3% in that category. NK/NR refers to records in which the patient’s age was unknown, undetermined, or not documented.
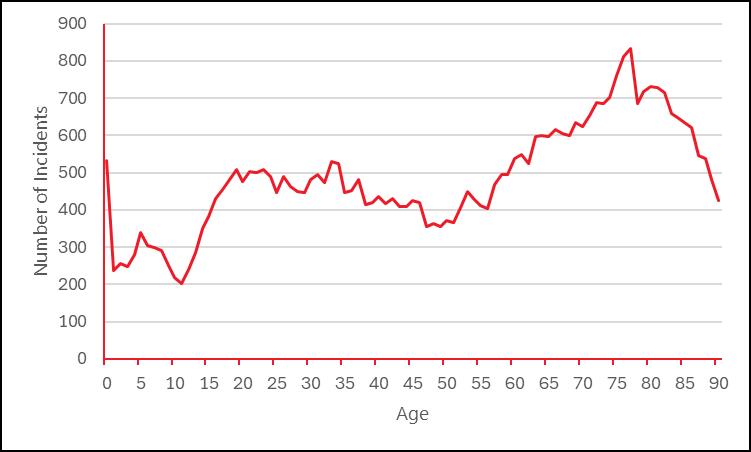
This figure illustrates trauma incident rates by age group. Each point on the line represents the number of incidents within a specific age range, with cumulative values corresponding to the counts presented in Table 7
This figure illustrates the case fatality rate by age group. Each point on the line represents the fatality rate within a specific age range, with cumulative values corresponding to the counts presented in Table 7
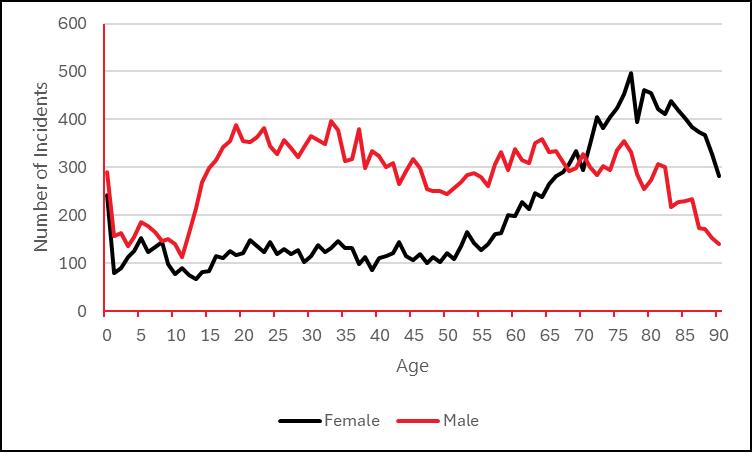
This table presents the distribution of trauma incidents and corresponding case fatality rates by age group and gender. The number of incidents among males (26,196) was considerably higher than among females (19,487). The overall male case fatality rate (4.7%) exceeded the female rate (2.4%). Within the female population, the highest case fatality rate (3.4%) occurred in the 20–24 age group, while among males, the highest rate (6.9%) occurred in patients aged 85 years and older. One fatality was reported among three male cases classified as Not Known/Not Recorded (NK/NR), yielding a 33.3% fatality rate in that category. NK/NR designations reflect records in which the patient’s age was unknown, undetermined, or not documented.
This figure illustrates trauma incidents by age group and gender. Each point on the line represents the number of incidents within a specific age range, with cumulative values corresponding to the counts presented in Table 8
This figure illustrates the case fatality rate by age group and gender. Each point on the line represents the fatality rate within a specific age range, with cumulative values corresponding to the counts presented in Table 8.
5-9 10-14 15-19 20-24 25-34 35-44 45-54 55-64 65-74 75-84 >=85 Case Fatality Rate (%)
This table presents trauma incidents categorized by documented alcohol screening results. A total of 11,418 cases (25.1%) involved patients who were screened for alcohol use.
missing=337
This table presents trauma incidents involving patients with a positive alcohol use indicator, categorized by age group. The highest proportion of cases with a blood alcohol concentration greater than 0.08% occurred among patients aged 35–44 years (20.1%).
Frequency missing=112
This table summarizes trauma incidents categorized by documented drug use results. A total of 2,712 cases (5.9%) involved patients with confirmed positive drug test results.
This table presents trauma incidents involving patients with a positive drug use indicator, categorized by age group. The highest proportion of confirmed drug use occurred among patients aged 25–34 years (20.8%).
This table presents trauma incidents categorized by the patient’s primary payment source. The most frequent primary payor was Medicare, accounting for 34.8% of all cases.
The mechanism or cause of injury is recorded and monitored through the trauma registry to identify trends and risk factors across populations. Certain age groups may be at greater risk for specific injury types, such as motor vehicle crashes or falls. These insights inform the development of targeted injury prevention programs. In some cases, registry data have supported improvements in roadway design, pedestrian walkways, and traffic safety laws aimed at reducing injury incidence and severity
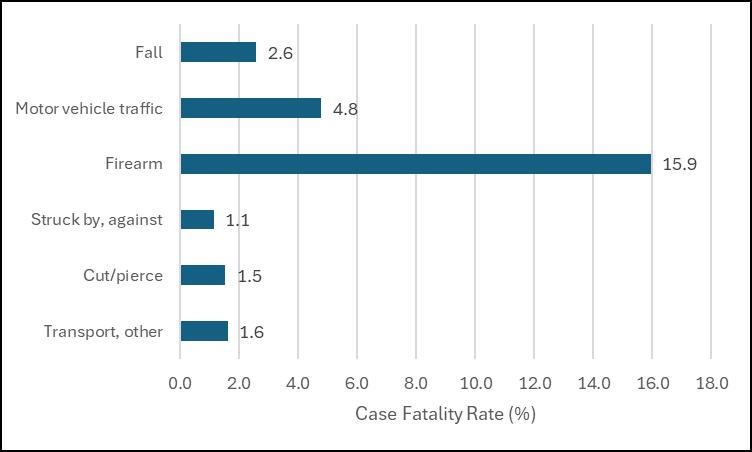
This table summarizes trauma incidents categorized by mechanism of injury. Falls were the most frequent cause of injury, followed by motor vehicle traffic injuries and firearm injuries. Among these top three mechanisms, firearm injuries had the highest fatality rate (15.9%). A total of 771 records were excluded from this analysis due to incomplete or missing data on the mechanism of injury
This figure illustrates the case fatality rate by selected mechanisms of injury. Among the categories shown, firearm injuries accounted for the highest fatality rate (15.9%).
The table represents the incidents by selected mechanisms of injury and age groups. For people age at groups: 15-19, 20-24, 25-24, and 35-44 years, the number of motor vehicle traffic injuries is higher than fall injuries
13A:
This figure illustrates trauma incidents by selected mechanisms of injury across age groups. Mechanisms represented include falls, motor vehicle traffic, and firearm injuries. Among individuals younger than 15 years and those older than 50 years, fall-related injuries occurred more frequently than motor vehicle injuries. Points on the line added together in the age ranges represent the counts presented in Table 13.
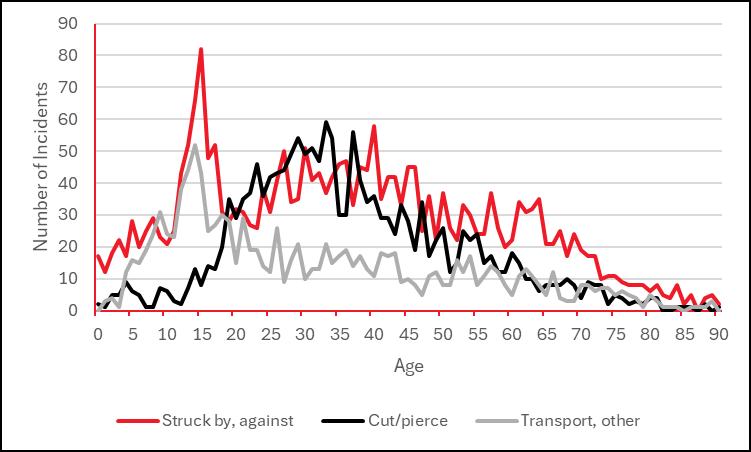
This figure illustrates trauma incidents by selected mechanisms of injury across age groups. Mechanisms represented include struck by/against, cut/pierce, transport, and other. Across all age groups, each injury type accounted for 82 incidents or fewer. Points on the line added together in the age ranges represent the counts seen in Table 13.
This table presents the case fatality rate by selected mechanisms of injury across age groups. Among the mechanisms represented, firearm injuries had the highest overall case fatality rate at 15.9%
13A:
This figure illustrates trauma incidents by selected mechanisms of injury across age groups. Mechanisms represented include falls, motor vehicle traffic, and firearm injuries. Among individuals younger than 15 years and those older than 50 years, fall-related injuries occurred more frequently than motor vehicle injuries. Points on the line added together in the age ranges represent the counts presented in Table 13.
This figure illustrates trauma incidents by selected mechanisms of injury across age groups. Mechanisms represented include struck by/against, cut/pierce, transport, and other. Across all age groups, each injury type accounted for 82 incidents or fewer. Points on the line added together in the age ranges represent the counts seen in Table 13.
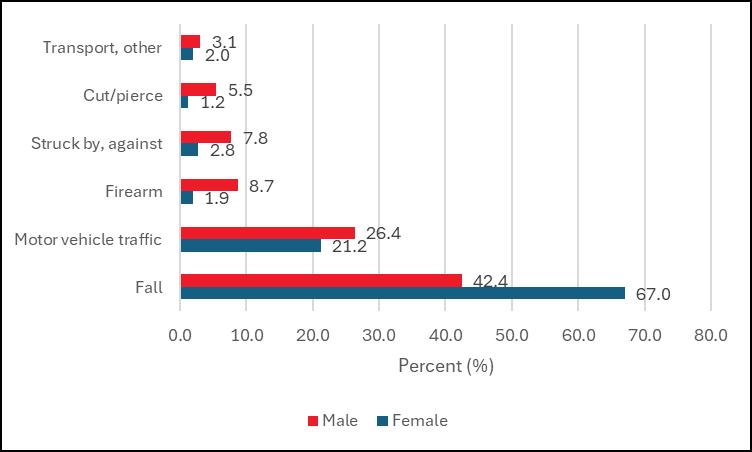
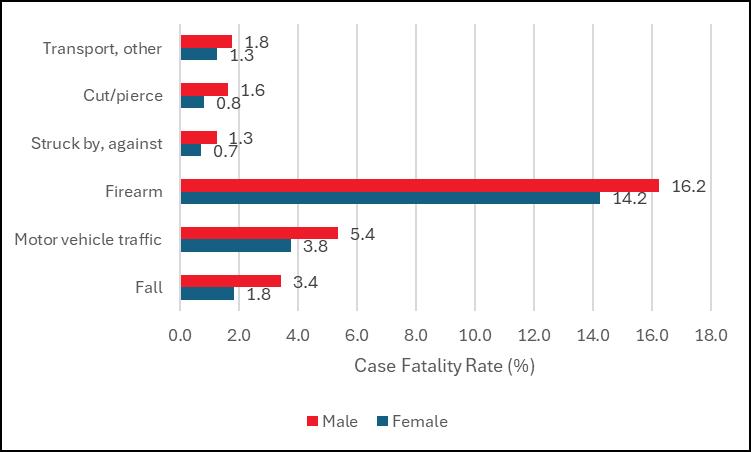
This table presents trauma incidents and corresponding case fatality rates by mechanism of injury and gender. Fall-related injuries accounted for a substantially higher proportion among females (67.0%) than males (42.4%), while firearm injuries were far more common among males (8.7%) than females (1.9%). The overall case fatality rate among males (4.7%) was also notably higher than that among females (2.4%)
This figure illustrates the percentage distribution of trauma incidents by selected mechanisms of injury and gender. Each bar represents the proportion of incidents for a specific mechanism within male and female populations.
This figure illustrates the case fatality rate by selected mechanisms of injury and gender. Each bar represents the percentage of deaths within male and female populations for each mechanism of injury
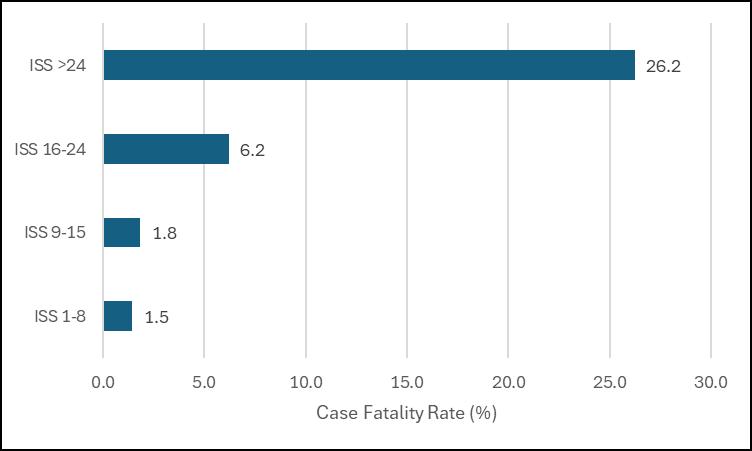
This table presents trauma incidents and corresponding case fatality rates categorized by Injury Severity Score (ISS). Minor (43.3%) and moderate (40.5%) injuries together accounted for 83.8% of all reported cases. Patients with very severe injuries (ISS > 24) experienced the highest fatality rate (26.2%). A total of 54 records with missing ISS data were excluded from the overall count.
This figure illustrates the case fatality rate by Injury Severity Score (ISS). Patients with very severe injuries (ISS > 24) had the highest case fatality rate at 26.2%.
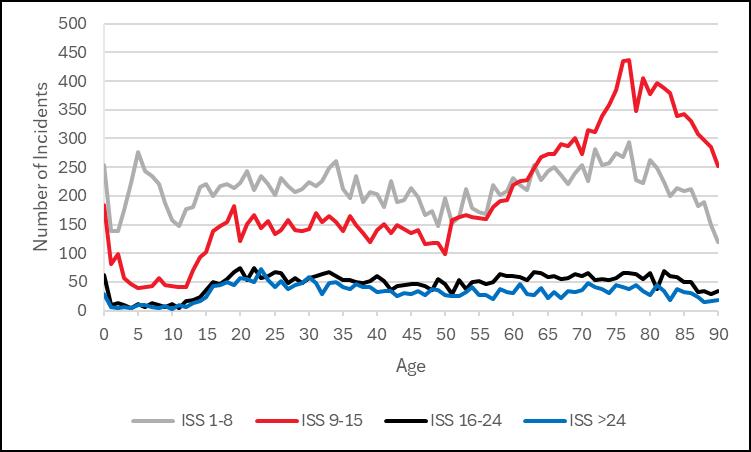
This table presents trauma incidents categorized by Injury Severity Score (ISS) and age group. The greatest number of very severe injuries (ISS > 24) occurred among patients aged 25–34 years (457 cases). A total of 54 records with missing ISS data were excluded from the analysis
This figure illustrates trauma incidents by ISS and age group. Points on the line added together in the age ranges represent the counts seen in Table 17
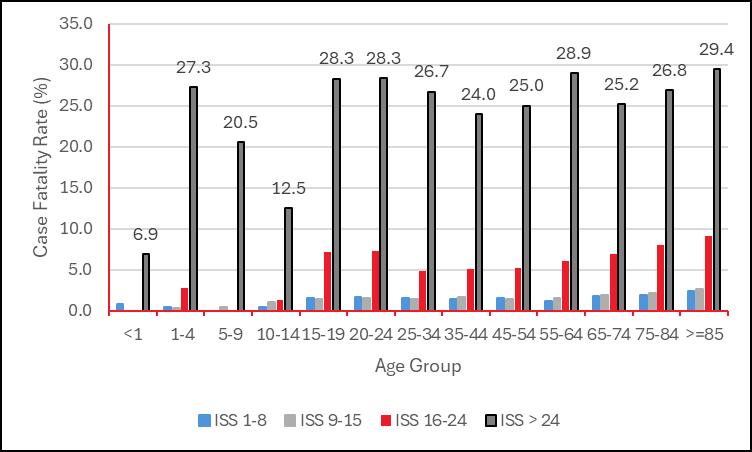
This table presents the case fatality rate by Injury Severity Score (ISS) and age group. The highest overall fatality rate (5.4%) occurred among patients aged 20–24 years.
This figure illustrates the case fatality rate by Injury Severity Score (ISS) and age group. Each point on the line represents the fatality rate within a specific age range, with cumulative values corresponding to the counts presented in Table 18. Among patients with very severe injuries (ISS > 24), the highest case fatality rate (29.4%) occurred in those aged 85 years and older.
This table presents trauma incidents and corresponding case fatality rates for work-related injuries. In 2024, a total of 1,218 confirmed work-related injuries were reported, representing 2.7% of all trauma incidents. The case fatality rate for confirmed work-related injuries was 2.1%
This figure illustrates the case fatality rate of work-related injuries compared with the overall trauma fatality rate. The case fatality rate for confirmed work-related injuries was 2.1%, lower than the total case fatality rate of 3.7%.
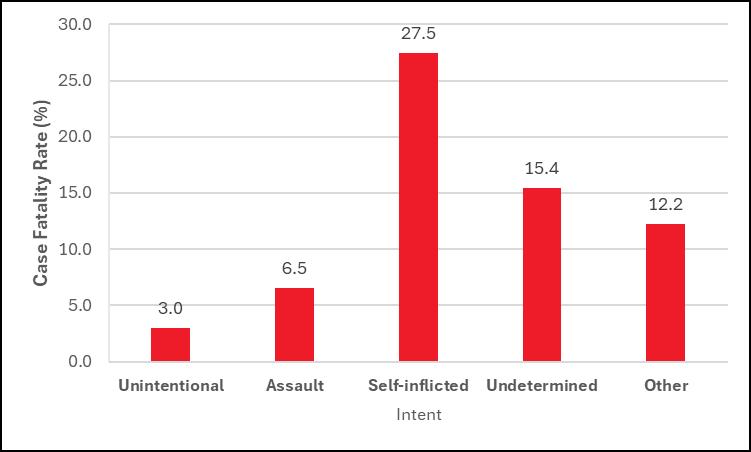
The table represents the frequency and case fatality rate of injuries by the intent of the injury. Most of the injuries are unintentional injuries (88.8%). Assault injuries account for 9.2% of all the injuries. The case fatality rate of self-inflicted is the highest (27.5%). The number of records missing data is 548. These records are not counted in the total number.
This figure illustrates the case fatality rate of injuries by intent. Self-inflicted injuries accounted for the highest case fatality rate at 27.5%
This table presents the frequency and case fatality rate of injuries by location of occurrence. The most frequently documented injury location was unspecified. The highest number of deaths (250) occurred from injuries sustained on local residential or business streets. The unspecified category is used by trauma registrars when documentation of the injury location is incomplete or unavailable.
CONTINUED - Table 21: Incidents and Case Fatality Rate by the
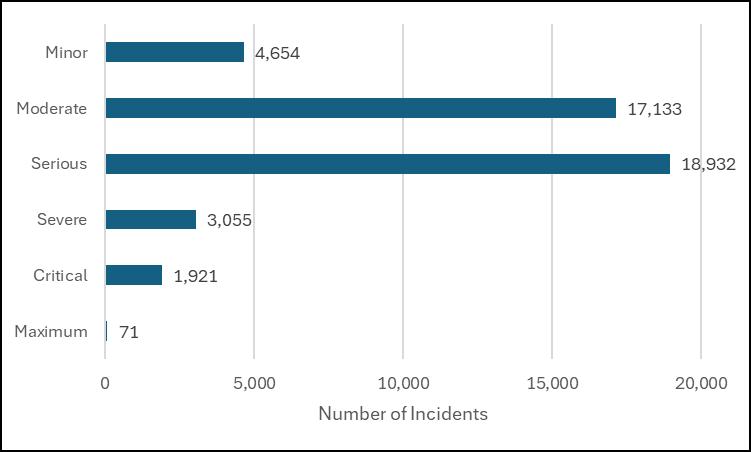
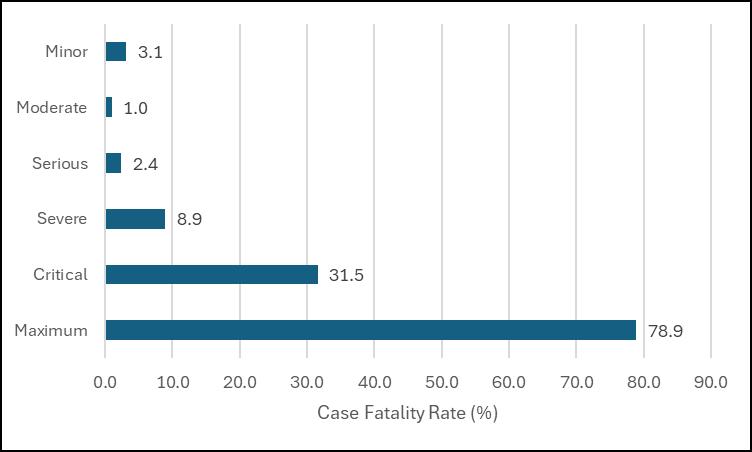
This table presents the frequency of injuries by Abbreviated Injury Scale (AIS) severity level and corresponding case fatality rate. Patients with maximum AIS severity experienced the highest case fatality rate at 78.9%. A total of 54 records with missing AIS severity data were excluded from the analysis
This figure illustrates the frequency of injuries by Abbreviated Injury Scale (AIS) severity level. Most reported injuries were classified as serious
This figure illustrates the case fatality rate associated with trauma injuries by Abbreviated Injury Scale (AIS) severity level. Patients with maximum AIS severity experienced the highest case fatality rate at 78.9%.
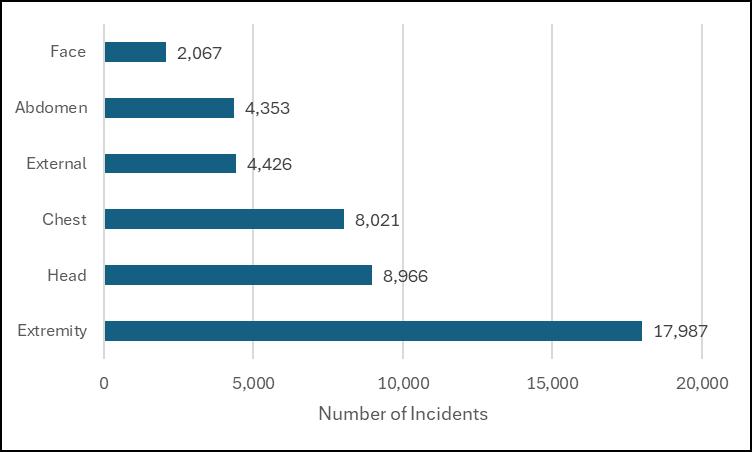
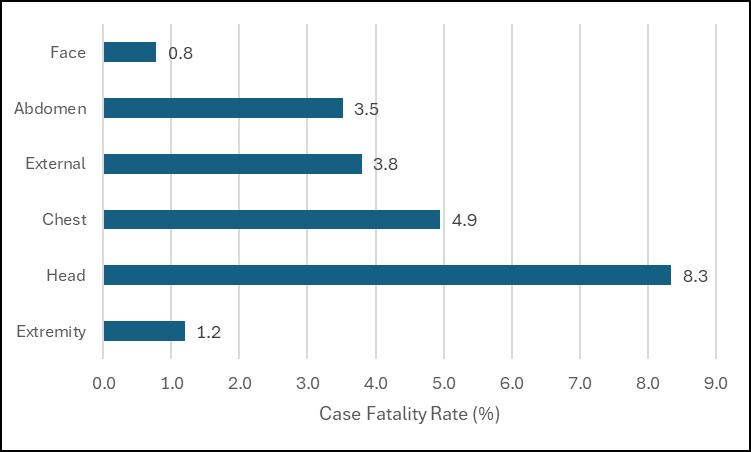
This table presents the frequency of injuries by Injury Severity Score (ISS) body region, along with the corresponding case fatality rate for each region. For patients with multiple injured body regions, only the region with the highest Abbreviated Injury Scale (AIS) severity is counted. Patients whose most severe injury occurred in the head or neck region had the highest case fatality rate at 8.3%.
This figure illustrates the frequency of injuries by Injury Severity Score (ISS) body region. Most injuries occurred in the extremities or pelvic girdle region, corresponding to the most frequent mechanisms of injury falls and motor vehicle crashes (MVCs)
This figure illustrates the case fatality rate by Injury Severity Score (ISS) body region. Most fatalities involved injuries to the head or neck region, which may result from firearm incidents, motor vehicle crashes (MVCs), or falls. Refer to Figure 15B for additional detail on fatal mechanisms of injury (MOI)
This table presents the frequency of protective device use among injured patients. Helmets were reported as being used in only 4.2% of cases.
Outcome measurements describe the results of injury intervention and management. Positive patient outcomes result from an effective and efficient system of care.
This table presents the frequency of injury mechanisms and the corresponding median length of hospital stay in days for each. Patients with injuries from hot objects/substances had the highest median LOS at 11 days. Only mechanisms of injury with more than one recorded case are displayed.
Figure 25: Median Length of Stay (LOS) in Days by Selected Mechanisms of Injury
This figure displays the top eight most frequent mechanisms of injury and their corresponding median length of hospital stay in days. Additional mechanisms with similar LOS values are listed in Table 25
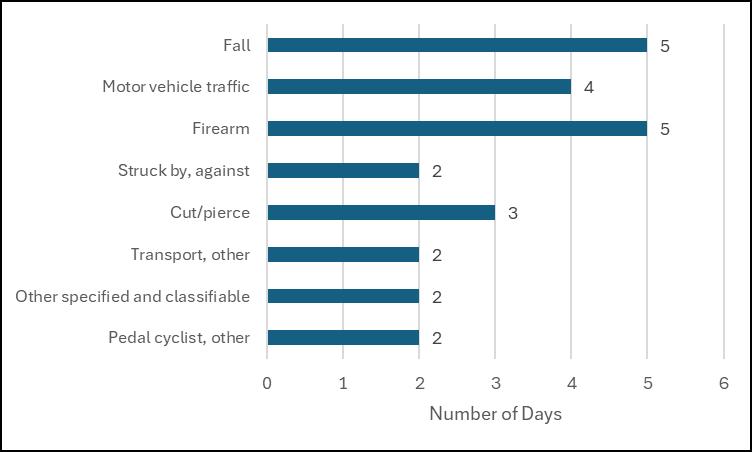
Table 26: Median Length of Stay (LOS) in Days by Injury Severity Score
This table presents the median hospital length of stay (LOS) by Injury Severity Score (ISS) category. Median LOS increases progressively with greater injury severity. Records with missing ISS data were excluded from analysis
Figure 26: Median Length of Stay (LOS) in Days by Injury Severity Score
This figure displays the median hospital length of stay in days by Injury Severity Score (ISS) group.
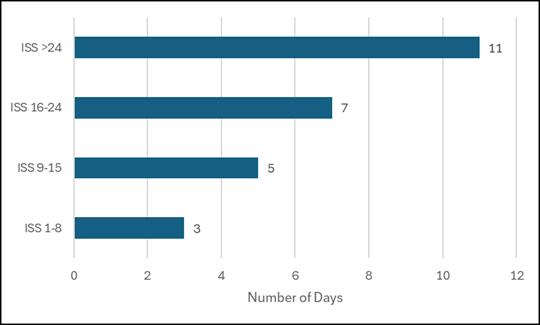
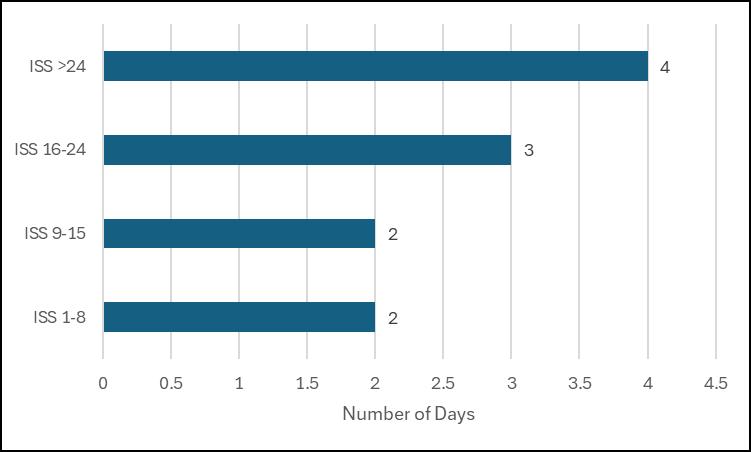
Table 27: Median Ventilator Days by Mechanism of Injury
This table presents data on admitted trauma patients who required ventilator support for at least one day. Patients with fire/flame injuries had the highest median number of ventilator days. Only mechanisms of injury with more than one recorded case are included
Figure 27: Median Ventilator Days by Selected Mechanism of Injury
This figure displays the median number of ventilator days among the top eight mechanisms of injury (MOI).
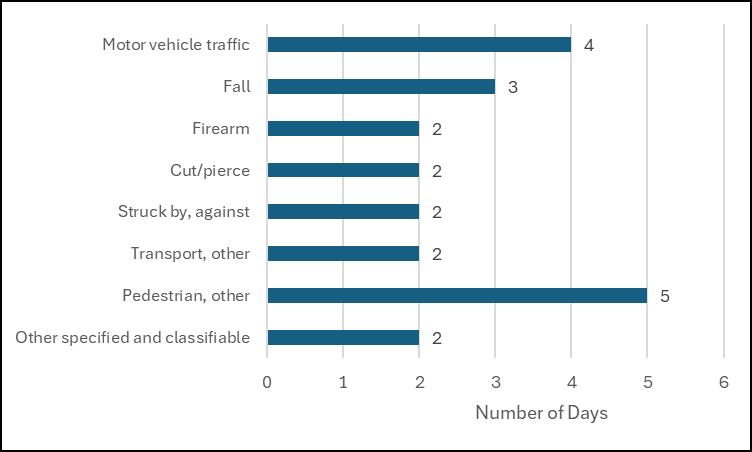
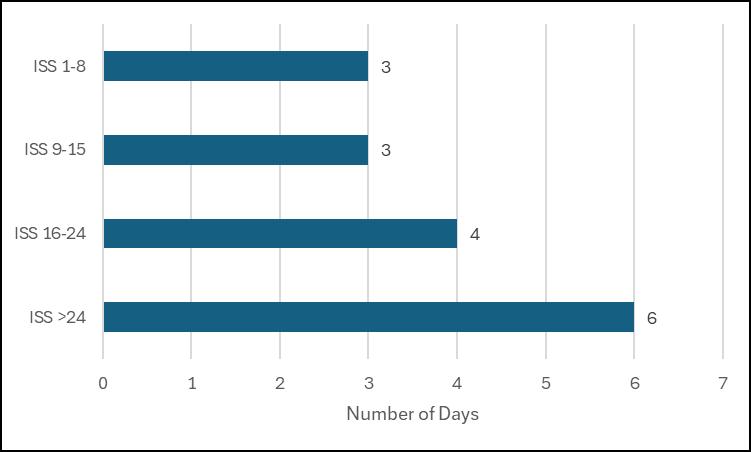
Table 28: Median Ventilator Days by Injury Severity Score (ISS)
This table presents the frequency of patients within each Injury Severity Score (ISS) group and the corresponding median number of ventilator days. Patients with an ISS greater than 24 required ventilator support for the highest median number of days
Figure 28: Median Ventilator Days by Injury Severity Score (ISS)
This figure displays the median number of ventilator days by Injury Severity Score (ISS). Patients with higher ISS values required ventilator support for longer durations
This table presents data for inpatients who required Intensive Care Unit (ICU) admission for more than zero days. Patients with fire/flame injuries had the highest median ICU stay of 12 days. Only mechanisms of injury (MOI) with a frequency greater than one are displayed
Figure 29: Median ICU Days by Selected Mechanism of Injury
This figure displays the eight most frequent mechanisms of injury (MOI) and their corresponding median number of Intensive Care Unit (ICU) days.
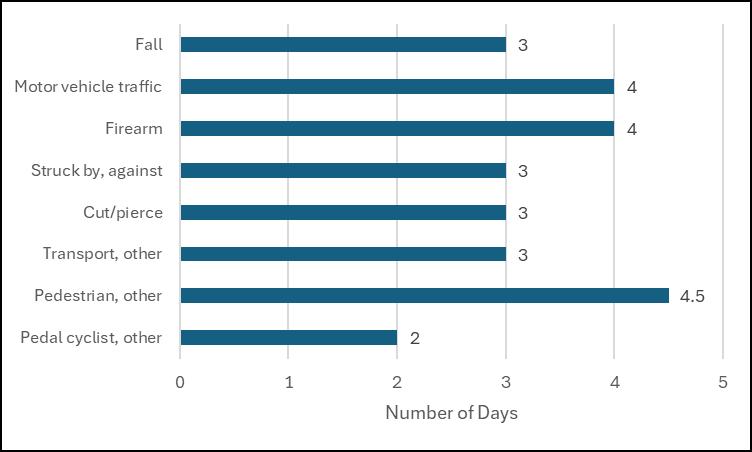
Table 30: Median ICU Days by Injury Severity Score (ISS)
This table presents the median number of Intensive Care Unit (ICU) days by Injury Severity Score (ISS) group. The median ICU stay increases as the severity of injury rises.
Figure 30: Median ICU days by Injury Severity Score
This figure displays the median number of Intensive Care Unit (ICU) days for all trauma registry patients. As expected, patients with higher Injury Severity Scores (ISS) experienced longer ICU stays.
This table presents the frequency of Emergency Department (ED) discharge dispositions. Fewer than half (47.2%) of patients were admitted to a floor bed. Among the 45,820 trauma registry cases, the ED disposition mortality rate was 1.4%, representing 628 deaths
This table presents the frequency of patients arriving at designated trauma centers with or without signs of life. The majority of patients (98.5%) arrived with signs of life
This table presents the hospital discharge disposition for 45,820 trauma registry cases. The overall hospital mortality rate was 2.3%, representing 1,069 deaths.
Patients are included in the Georgia Trauma Registry if they present with a traumatic injury occurring within 14 days of the initial hospital visit and have an ICD-10-CM diagnosis code from the list below:
• S00–S99 with 7th-character modifiers A, B, or C only (injuries to specific body parts – initial encounter; see exclusions below)
• T07 (Unspecified multiple injuries)
• T14 (Injury of unspecified body region)
• T20–T28 with 7th-character A only or T30–T32 with a non-burn trauma diagnosis (*)
• T79.A1–T79.A9 with 7th-character A only (Traumatic Compartment Syndrome – initial encounter)
EXCLUDING patients with isolated injuries:
• Diagnosis codes of ICD-10-CM superficial injuries: S00, S10, S20, S30, S40, S50, S60, S70, S80, S90
• Late effect codes w/ the 7th character modifier of D through S
• Patients w/ isolated burn injuries T20-T28 w/7th modifier A or T30-T32 *
• Patients w/ injuries older than 14 days from the first ED arrival date
• Patients admitted w/ a minor trauma injury for medical or social service *
• Patients admitted for elective and/or planned surgical intervention.
• Patients w/ an In-House trauma injury sustained after the initial ED/Hospital arrival and before ED/Hospital discharge. This exclusion involves all data related to the In-House injury.
AND must include one of the following in addition to a valid trauma diagnosis code from the listed above
• Admitted to the hospital after discharge from the ED, regardless of length of stay
• Transferred to or from another acute care facility**
• Died, regardless of length of stay
• DOA (dead on arrival): patient that died from a traumatic injury before hospital arrival
Additional criteria/notes:
• UUID field entry should be Not Known/Not Recorded if the UUID is not on the EMS report; select Not Applicable if EMS did not transport the patient.
• The Georgia data collection standard for blood utilization includes data for any blood products administered within the first 4 hours from the patient arrival time.
• Unplanned readmissions must be associated with the initial trauma injury, have a trauma diagnosis, ISS total, and be readmitted within 72 hours of discharge from the first visit.
* Indicates a difference between the Georgia Criteria and the NTDS Criteria.
** Per the Centers for Medicare and Medicaid Services (CMS), an Acute Care Hospital is defined as a hospital capable of providing inpatient medical care with services for surgery, acute medical conditions, or injuries.
Source: CMS Data Navigator Glossary of Terms, https://www.cms.gov/Research-Statistics-Data-andsystems/Research/ResearchGenInfo/Downloads/DataNav_Glossary_Alpha.pdf (accessed January 15, 2019).