BOOM
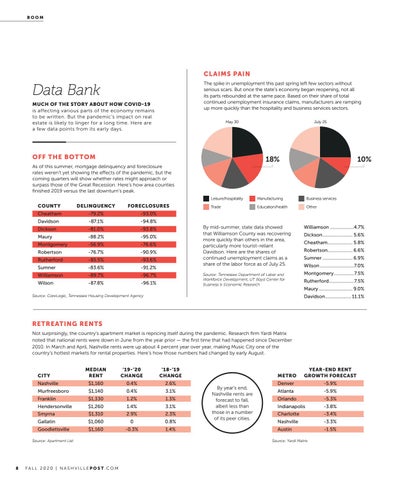
CL AIMS PAIN The spike in unemployment this past spring left few sectors without serious scars. But once the state’s economy began reopening, not all its parts rebounded at the same pace. Based on their share of total continued unemployment insurance claims, manufacturers are ramping up more quickly than the hospitality and business services sectors.
Data Bank MUCH OF THE STORY ABOUT HOW COVID-19 is affecting various parts of the economy remains to be written. But the pandemic’s impact on real estate is likely to linger for a long time. Here are a few data points from its early days.
May 30
OFF THE BOT TOM
July 25
18%
10%
As of this summer, mortgage delinquency and foreclosure rates weren’t yet showing the effects of the pandemic, but the coming quarters will show whether rates might approach or surpass those of the Great Recession. Here’s how area counties finished 2019 versus the last downturn’s peak. COUNTY
DELINQUENCY
FORECLOSURES
Cheatham
-79.2%
-93.0%
Davidson
-87.1%
-94.8%
Dickson
-81.0%
-93.8%
Maury
-88.2%
-95.0%
Montgomery
-56.9%
-76.6%
Robertson
-76.7%
-90.9%
Rutherford
-85.5%
-93.6%
Sumner
-83.6%
-91.2%
Williamson
-89.7%
-96.7%
Wilson
-87.8%
-96.1%
Leisure/hospitality
Manufacturing
Business services
Trade
Education/health
Other
By mid-summer, state data showed that Williamson County was recovering more quickly than others in the area, particularly more tourist-reliant Davidson. Here are the shares of continued unemployment claims as a share of the labor force as of July 25.
Williamson ...................4.7%
Source: Tennessee Department of Labor and Workforce Development, UT Boyd Center for Business & Economic Research
Montgomery ................7.5%
Source: CoreLogic, Tennessee Housing Development Agency
Dickson ........................ 5.6% Cheatham.................... 5.8% Robertson.................... 6.6% Sumner ........................ 6.9% Wilson ...........................7.0% Rutherford....................7.5% Maury ........................... 9.0% Davidson..................... 11.1%
RETREATING RENTS Not surprisingly, the country’s apartment market is repricing itself during the pandemic. Research firm Yardi Matrix noted that national rents were down in June from the year prior — the first time that had happened since December 2010. In March and April, Nashville rents were up about 4 percent year over year, making Music City one of the country’s hottest markets for rental properties. Here’s how those numbers had changed by early August.
CITY
MEDIAN RENT
’19-’20 CHANGE
’18-’19 CHANGE
Nashville
$1,160
0.4%
2.6%
Murfreesboro
$1,140
0.4%
3.1%
Franklin
$1,330
1.2%
1.3%
Hendersonville
$1,260
1.4%
3.1%
Smyrna
$1,310
2.9%
2.3%
Gallatin
$1,060
0
0.8%
Goodlettsville
$1,160
-0.3%
1.4%
Source: Apartment List
8
FALL 2020 | NASHVILLEPOST.COM
By year’s end, Nashville rents are forecast to fall, albeit less than those in a number of its peer cities.
METRO
YEAR-END RENT GROWTH FORECAST
Denver
-5.9%
Atlanta
-5.9%
Orlando
-5.3%
Indianapolis
-3.8%
Charlotte
-3.4%
Nashville
-3.3%
Austin
-1.5%
Source: Yardi Matrix