Welcome to the Oct. 19th, 2022 issue of

Radio World Engineering Extra


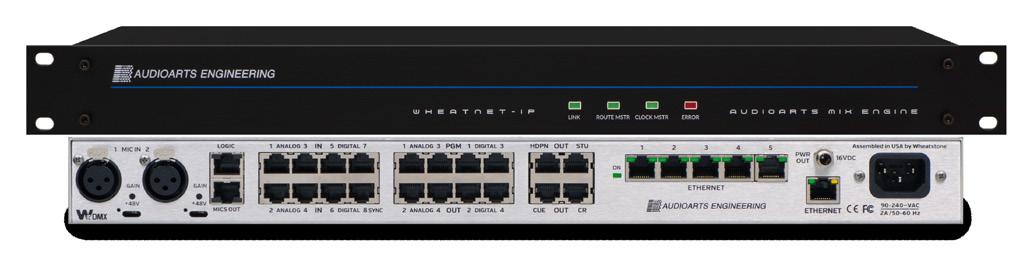
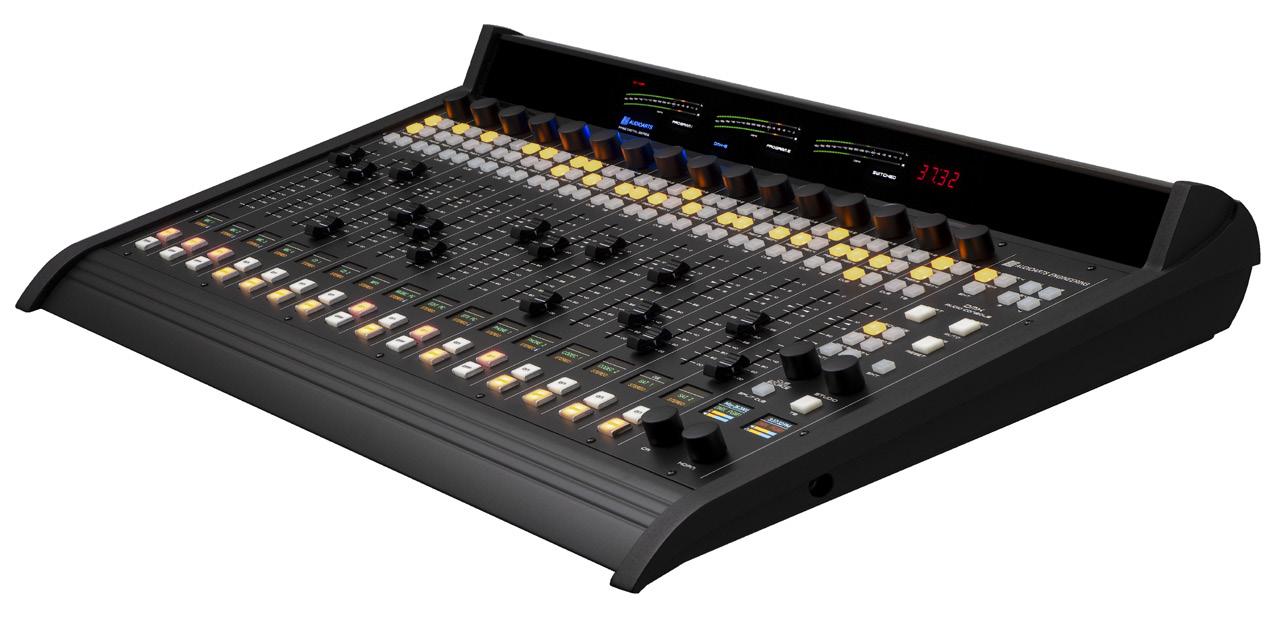

THE INTELLIGENT NETWORK100% WHEATNET-IP COMPATIBLE PRECISION ENGINEERED Made here in New Bern NC THE ENGINE YOUR ENTIRE STUDIO I/O THE FUTURE Expanded I/O or More Networked Studios It couldn’t be easier... DMX W heatnet - ip n et W orked d igital C onsole
Are you ready for Tower Lighting as a


Service? Offloading a complex task may save time and money radioworld.com | October 19 2022 | $5.00In-depth technology for radio engineers

Vol.
|
www.radioworld.com
FOLLOW US www.twitter.com/radioworld_news www.facebook.com/RadioWorldMagazine
CONTENT
Managing Director, Content & Editor in Chief Paul J. McLane, paul.mclane@futurenet.com, 845-414-6105
Content Producer & SmartBrief Editor Elle Kehres, elle.kehres@futurenet.com
Technical Advisors Thomas R. McGinley, Doug Irwin
Technical Editor, RW Engineering Extra W.C. “Cris” Alexander
Contributors: Susan Ashworth, David Bialik, John Bisset, Edwin Bukont, James Careless, Ken Deutsch, Mark Durenberger, Charles Fitch, Donna Halper, Alan Jurison, Paul Kaminski, John Kean, Gary Kline, Larry Langford, Mark Lapidus, Michael LeClair, Frank McCoy, Jim Peck, Mark Persons, Stephen M. Poole, James O’Neal, John Schneider, Dan Slentz, Dennis Sloatman, Randy Stine, Tom Vernon, Jennifer Waits, Steve Walker, Chris Wygal
Production Manager Nicole Schilling
Managing Design Director Nicole Cobban
Senior Design Directors Lisa McIntosh and Will Shum
ADVERTISING SALES

Senior Business Director & Publisher, Radio World John Casey, john.casey@futurenet.com, 845-678-3839

Publisher, Radio World International Raffaella Calabrese, raffaella.calabrese@futurenet.com, +39-320-891-1938
SUBSCRIBER CUSTOMER SERVICE
To subscribe, change your address, or check on your current account status, go to www.radioworld.com and click on Subscribe, email futureplc@computerfulfillment.com, call 888-266-5828, or write P.O. Box 1051, Lowell, MA 01853.
Licensing/Reprints/Permissions
Radio World is available for licensing. Contact the Licensing team to discuss partnership opportunities. Head of Print Licensing Rachel Shaw licensing@futurenet.com
MANAGEMENT
Senior Vice President Group Elizabeth Deeming Vice President, Sales & Publishing, B2B Aaron Kern Vice President, B2B Tech Group Carmel King Vice President, Sales, B2B Tech Group Adam Goldstein Head of Production US & UK Mark Constance Head of Design Rodney Dive
FUTURE US, INC.
130 West 42nd Street, 7th Floor, New York, NY 10036
All contents ©Future US, Inc. or published under licence. All rights reserved. No part of this magazine may be used, stored, transmitted or reproduced in any way without the prior written permission of the publisher. Future Publishing Limited (company number 02008885) is registered in England and Wales. Registered office: Quay House, The Ambury, Bath BA1 1UA. All information contained in this publication is for information only and is, as far as we are aware, correct at the time of going to press. Future cannot accept any responsibility for errors or inaccuracies in such information. You are advised to contact manufacturers and retailers directly with regard to the price of products/services referred to in this publication. Apps and websites mentioned in this publication are not under our control. We are not responsible for their contents or any other changes or updates to them. This magazine is fully independent and not affiliated in any way with the companies mentioned herein.
If you submit material to us, you warrant that you own the material and/or have the necessary rights/ permissions to supply the material and you automatically grant Future and its licensees a licence to publish your submission in whole or in part in any/all issues and/or editions of publications, in any format published worldwide and on associated websites, social media channels and associated products. Any material you submit is sent at your own risk and, although every care is taken, neither Future nor its employees, agents, subcontractors or licensees shall be liable for loss or damage. We assume all unsolicited material is for publication unless otherwise stated, and reserve the right to edit, amend, adapt all submissions.
Tower lights ain’t what they used to be
We’ve come a long way from pulsing red lights and mechanical flashers
There is something about tower lights …
Cris Alexander CPBE, AMD, DRB Technical Editor
As a youngster, traveling with my family through the Texas countryside, often at night, I would stare out the car window at those distant, glowing red orbs, flashing on and off, on and off, the waning glow persisting until the next on cycle. I often wondered what they were and how they could be seen from so great a distance.
Years later, working the 4 p.m.to-midnight air shift at the local FM station, the studio for which was collocated with the transmitter site, I would often step outside and look up that 800-foot angle-iron monstrosity and watch those pulsing lights, the underside of the crow’s nest at the top appearing and fading into blackness with each cycle.
On the wall in the back room there was a mysterious box with the name “Hughey & Phillips” cast into the cover, and that box made a strange, rhythmic, growling noise. Of course I couldn’t resist opening the latch for a look-see. Inside was a motor, a gearbox and some black bulbs with wires coming from them. I put two and two together and figured out that this was the mechanism that made the tower lights flash.
Then one day, something ugly happened up on the tower. The antenna and 700 feet of rigid transmission line burned up. In the course of figuring it out, a local tower crew went up the tower for a look, and of course I had to go with them.
That was a climb, let me tell you, but I was young and relatively fit, so I made it to the center of the antenna without issue.
On the way, I passed several platforms supporting beacons, and man, were those things huge! I’d had no idea that they were three feet tall and contained two huge light bulbs! How did anyone even get those things up there?
With the mystery of tower lights not so much a mystery anymore, as I moved from on-air to technical duties in
Tower lights ain’t what they used to be
A composite modulator for troubleshooting and discrete audio
Let’s explore microwave theory for STLs
Are you ready for Tower Lighting as a Service?
Please recycle. We
which
chlorine-free manufacture. The paper
from responsibly managed, certified forestry
this magazine was sourced and produced from sustainable managed
conforming to
environmental and
THIS ISSUE NEWS x xxx xxx FEATURES x xxx xxx BUYERS GUIDE x xxx xxx OPINION x xxx xxx
are committed to only using magazine paper
is derived
and
in
forests,
strict
socioeconomic standards.
46 No. 26
October 19 2022
Radio World (ISSN: 0274-8541) is published bi-weekly with additional issues in February, April, June, August, October and December by Future US, Inc., 130 West 42nd Street, 7th Floor, New York, NY 10036. Phone: (978) 667-0352. Periodicals postage rates are paid at New York, NY and additional mailing offices. POSTMASTER: Send address changes to Radio World, PO Box 1051, Lowell, MA 01853. THIS ISSUE 3
6
14
20
3
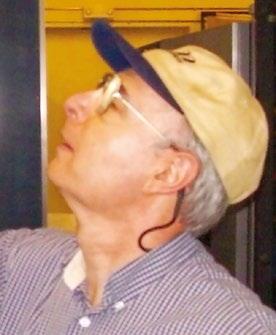
Below
The author wires a dual white/red LED tower light system on one of the 450foot towers at KLZ in Denver.
the subsequent years, I didn’t give a whole lot of thought to tower lights until something went wrong. Then it was a matter of notifying the FAA and calling in a tower crew to deal with the issue. Occasionally I would have to deal with flasher issues, replacing a motor or mercury switch, maybe replacing a fuse, but that’s about it.
As the decades passed and technology advanced, those mercury switches became a thing of the past, replaced with solid-state flasher modules. I swapped out the innards of many a tower light controller box for solid-state SSAC flashers. Those devices were generally reliable, but they were not immune from lightning as the old mercury switches tended to be.
By the 1980s we began to see different kinds of lighting. The flashing red lights would go on/off instantly rather than waxing and waning as they always had before. Incandescent lamps were being replaced with lamps containing gas that would illuminate when excited by an electric current.
Then white strobes came along, often high-intensity day and medium-intensity at night, eliminating the need to paint towers altogether. In our company, we had just one strobed tower, 1,330 feet high, and it was a real pain and
expense to keep it lit. Despite completely replacing the strobe system at one point, that tower was under a NOTAM more often than not.
Dual red/white night/day systems began appearing on some towers, particularly those in urban areas where flashing white lights in one’s bedroom window would be objectionable. We had one such tower in Chicago, and it, too, was a PITA to keep running.
And then along came LED technology. The combination of high-output LEDs and focusing mirrors made LED beacons a viable thing. Manufacturers began offering them as retrofit kits for incandescent-lit towers, using the 120 VAC coming up the tower light wiring to power retrofit LED beacons and marker lights.
We got on that bandwagon early and did not regret it. We figured out in a short time how much of our site electric bills went for tower lighting. AM sites with five or six towers, each with two 1,240-watt beacons plus four 110-watt markers, eat up a lot of power, more than the transmitter in a lot of cases. It was a very pleasant surprise to find our utility bills significantly lower.
Those early LED retrofits were not without their issues, though. Top beacons in particular would get eaten by lightning, and unlike the old incandescent lamps that would either ride through a strike without damage or require nothing more than a bulb replacement, the LED retrofits would require removal from the tower and often outright replacement (with internal power supply and LEDs damaged beyond economic repair). That often ate into the electric cost savings and made the cost/benefit equation harder to objectively solve.
In recent years, the FAA has made it easier to convert to dual red/white lighting for different heights of towers. Combine this with current LED technology, which is amazingly reliable, and the cost/benefit equation is an easy solve. At Crawford Broadcasting we have made the move to this model on a lot of towers. In most cases we’re in the black after the first paint job we didn’t have to do.
For a lot of broadcasters and other entities that use antenna structures, “rolling your own” by purchasing and installing an LED tower lighting system of any configuration is not an option. This is particularly the case for smaller broadcasters that may not have full-time technical personnel.
Those entities now have another option: tower lighting as a service. Yes, you heard it right. In this issue of RWEE, Tom Vernon will tell us all about it. It may be just what the doctor ordered for a lot of broadcasters.
Also, Buc Fitch provides us with another of his uber-practical DIY project articles, this time a composite demod that will come in handy for troubleshooting and even in the air chain.
Finally, Dennis Sloatman will enlighten us with another of his great educational pieces, this time on the math and science behind microwave path budgets.
So sit back with your favorite beverage and read on. Let us know what you think. I’m at rweetech@gmail.com
4 radioworld.com | October 19 2022 From the Tech Editor
 Writer
Charles S. Fitch P.E.
Writer
Charles S. Fitch P.E.
The author is a longtime contributor whose articles about engineering and radio history are a popular recurring feature.
6
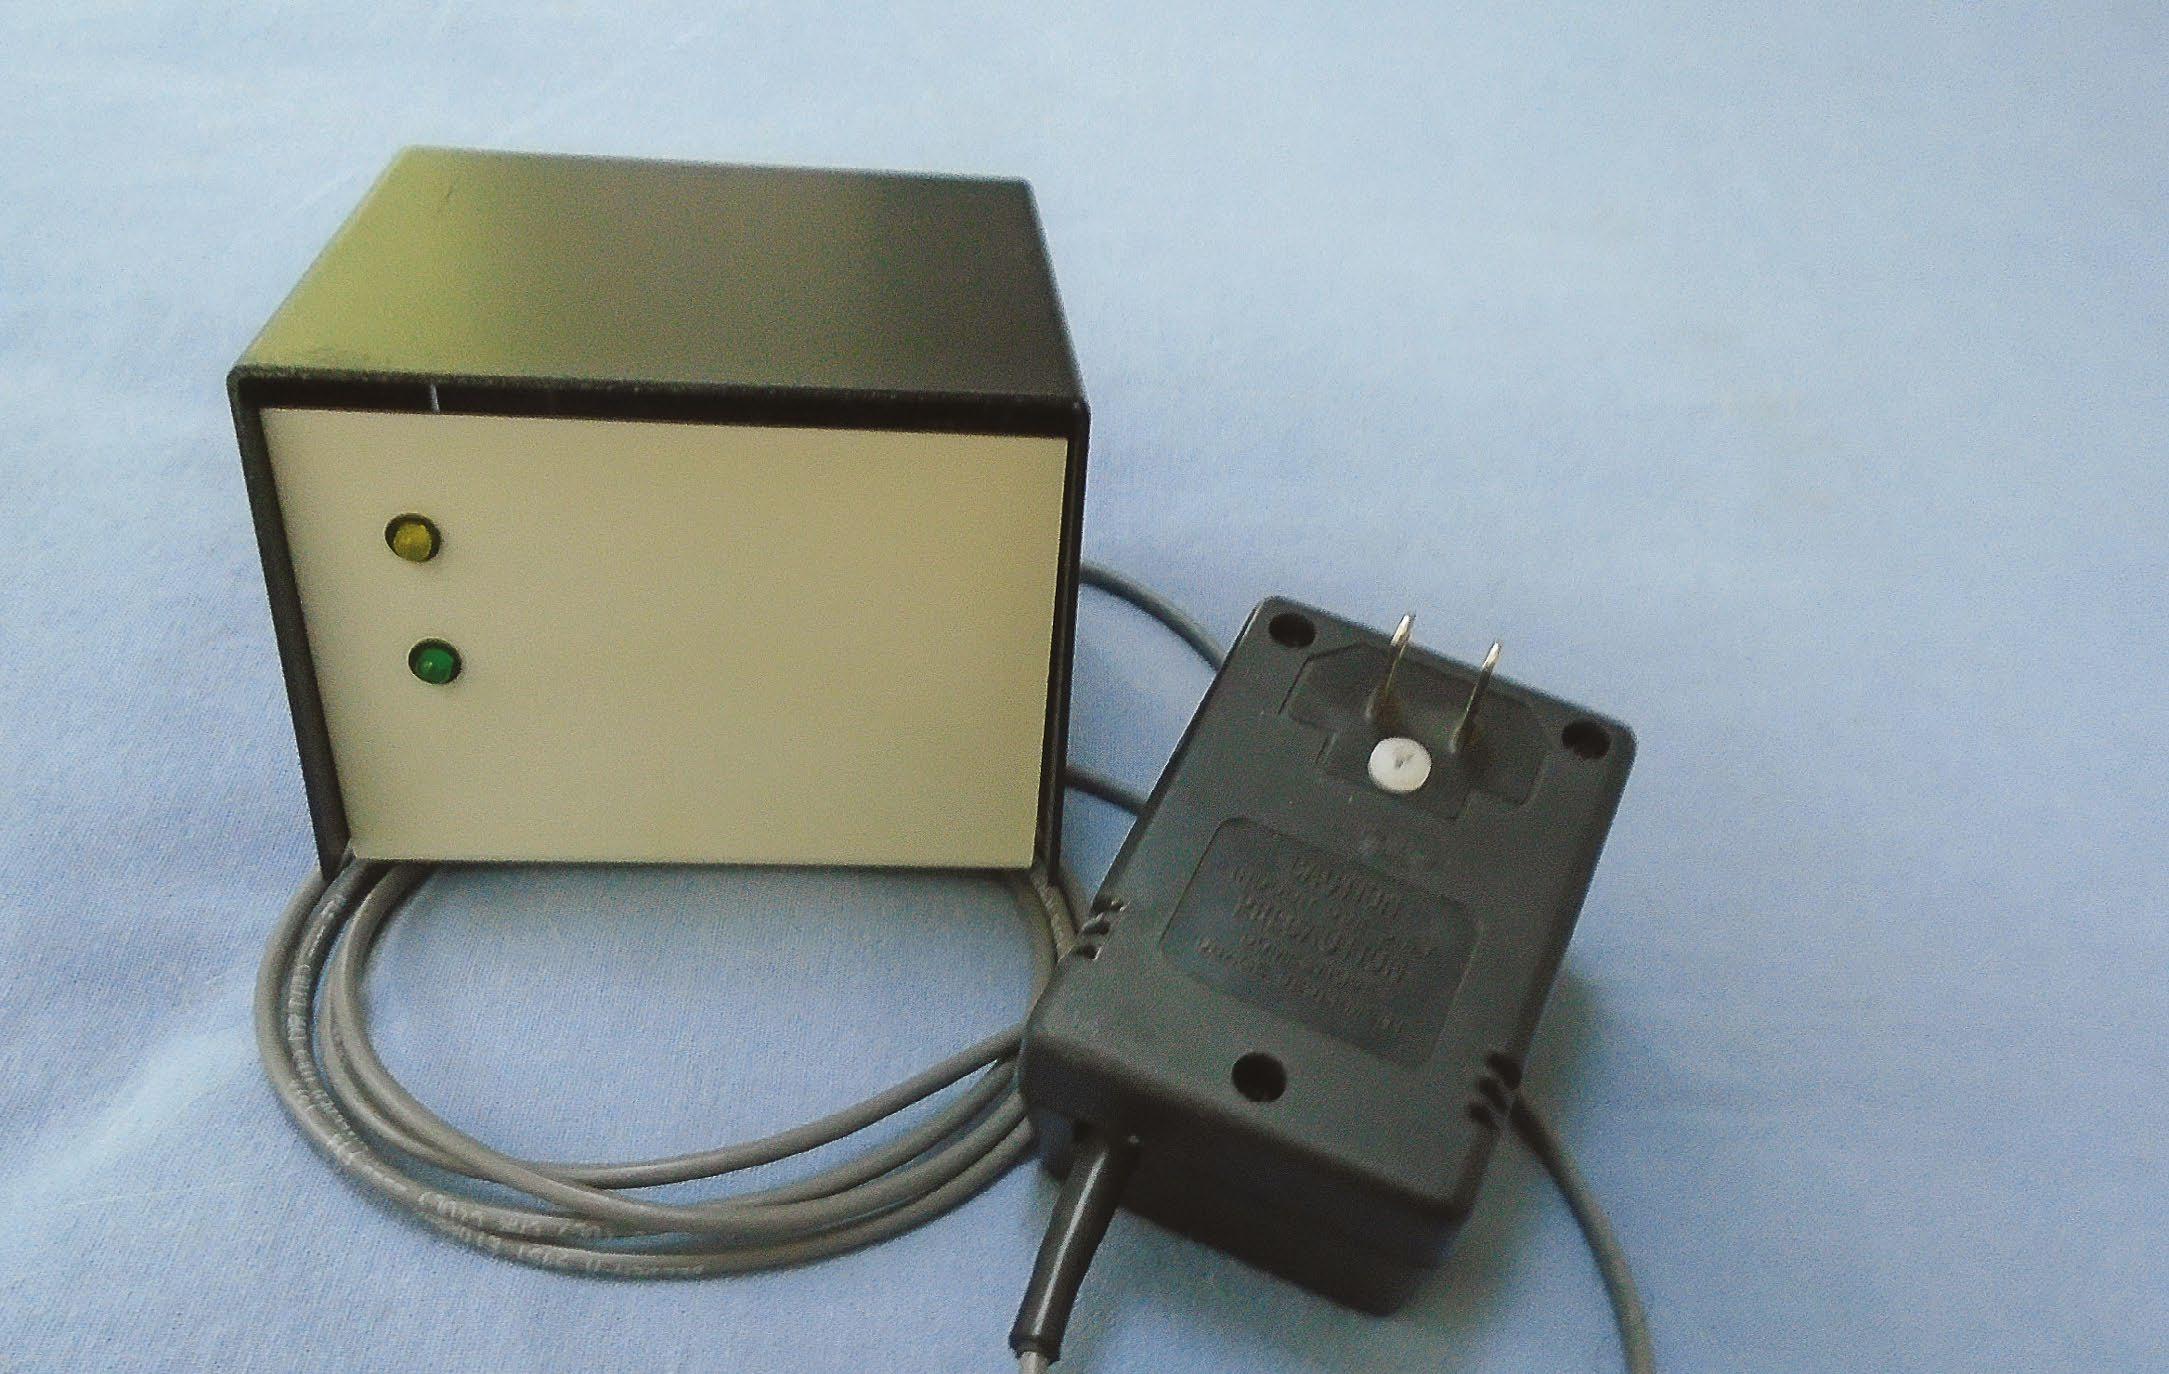
Above The completed composite demodulator with wall wart.
A composite demodulator for troubleshooting and discrete audio
This home-brew device turns composite baseband into discrete left & right
At the end of the pipe in every FM station operating in stereo — which probably is 99.5% of the over 7,000 FM outlets operating here in the United States — the delivery package to be transmitted is of a composite construction. Our standardized stereo transmitted format, originally approved in April 1961, has been very durable and, in more recent times, digital HD Radio capability has been integrated successfully into this stereo system to ride along on a compatible basis. The information elements ordinarily contained in the classic composite package are:
• A monophonic baseband, an equal blend of the original left and right
• A 19 kHz “pilot” sine wave that is utilized in the stereo demodulation process
• An amplitude-modulated envelope centered on 38 kHz that contains the “difference” information used in the demodulation process
• Various additional FM modulated subcarriers with an abundance of uses such as secondary general broadcast (think “data”) and for station purposes (e.g. remote control telemetry and audio backhaul). We should also include in this grouping the more recent addition of the digital data stream at 57 kHz (three times the pilot frequency of 19 kHz), a.k.a. “RDS.”
HD Radio, because of its digital and bisymmetrical offset RF carrier construction, is normally integrated into the signal package at the transmitter.
The package
Many if not most of the non-HD stations deliver their composite stereo “package” from the studio via an STL in a signal-ready form for direct plug-in into the FM exciter. Not only is the composite demodulation described in this article useful as a confidence check and troubleshooting aid, but in the age of FM translators for struggling AMs, the convenience of having discrete left and right at the
radioworld.com | October 19 2022 Project Journal
transmitter site facilitates separate processing for the mono AM and stereo FM translator.
Covered here is the “Honduran economy model” composite demodulator, which only provides discrete left and right adjustable to near +10 dBm when terminated into 600 ohms and a confidence LED showing the presence of the 19 kHz pilot, which also indicates that the unit is demodulating stereo.
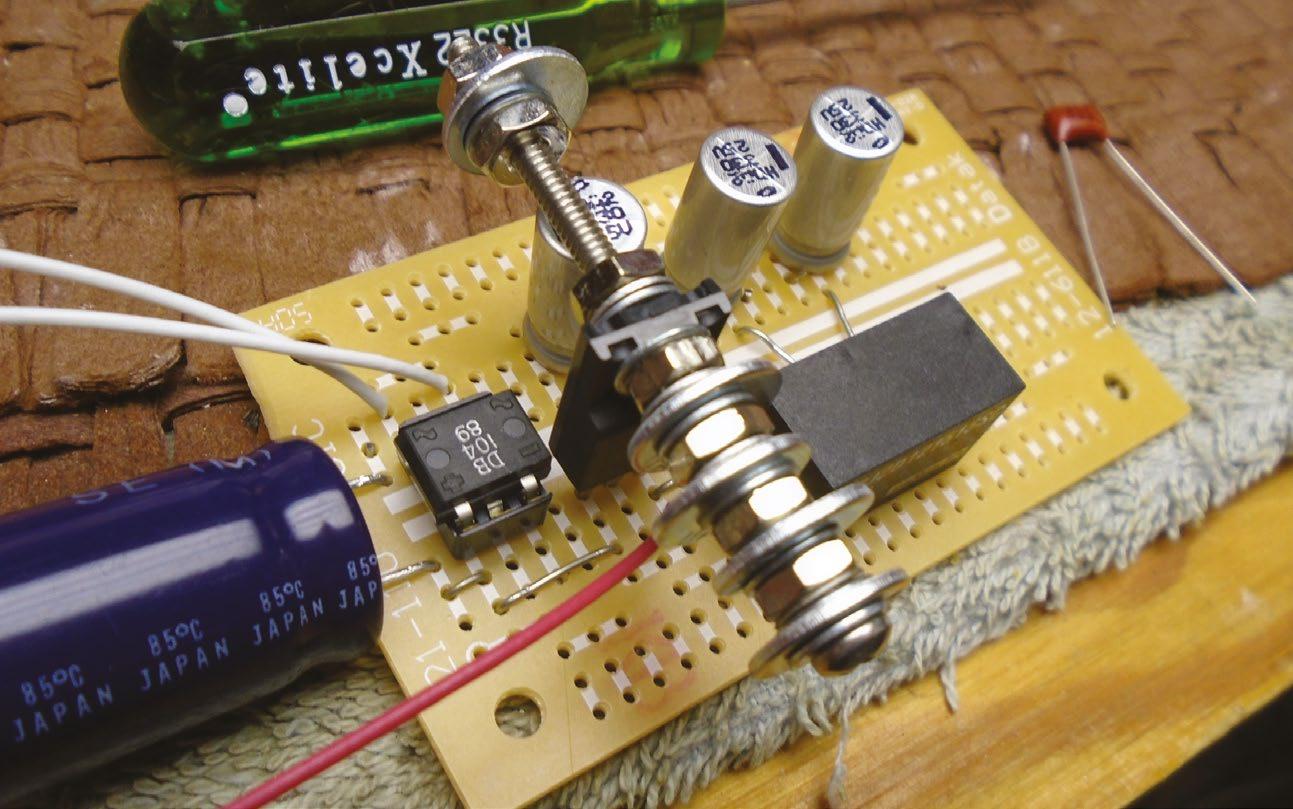
We built the pictured unit in discrete form, hand-wired on three PCB protoboards not only as an alpha model to prove our concept but also to demonstrate that with patience, you can make and customize your very own version. See the schematic diagrams.
This design is suitable for a finished printed circuit board. Features that can be added include a fully adjustable separate mono output with selectable 8 kHz roll-off to assist in NRSC compliance, a separate stereo headset amp with jack to help in high-noise environments, a 12-segment LED “VU” meter and an RDS confidence light that illuminates when the 57 kHz signal is present at approximately 2% of the modulated envelope.
Details, details
Our motivation for using the classic LM-1800 is its unfussy, non-critical, no unique coil or transformer concept. With typical >40 dB left and right separation and workable rejection of any SCAs present, the LM-1800 is more than adequate for the task.
On a practical note there are only four adjustments, and since these four are fundamentally needed one time only, we put them inside. For easy “reach-ability,” the composite input level and pilot capture potentiometers (located on the middle PCB) are right-angle types and face an open side of the base shell of our mini-cabinet. The left and right level adjust pots controlling the audio level adjusts face up since they’re on the top.
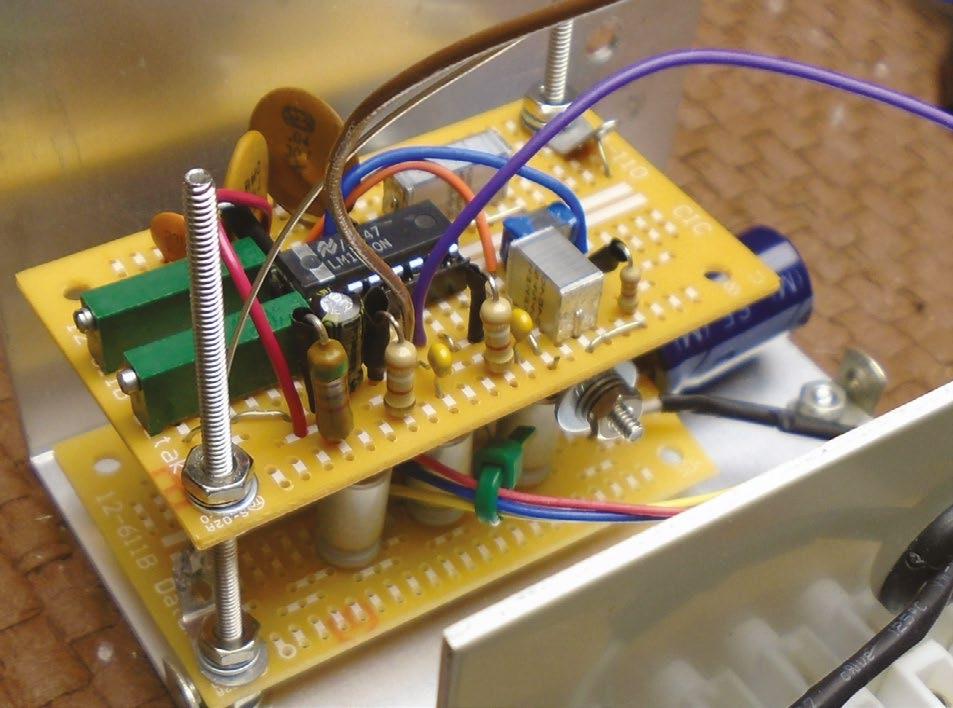
We’ve segregated the functions of power supply, demodulator and output onto separate PCBs. As mentioned, this allowed us to assemble, test and modify each independent section as we went.
Regular Radio World readers will readily recognize both the power supply concept and the output section as a
variation of the circuits that were used in our unbalancedto-balanced adapter project in 2020.
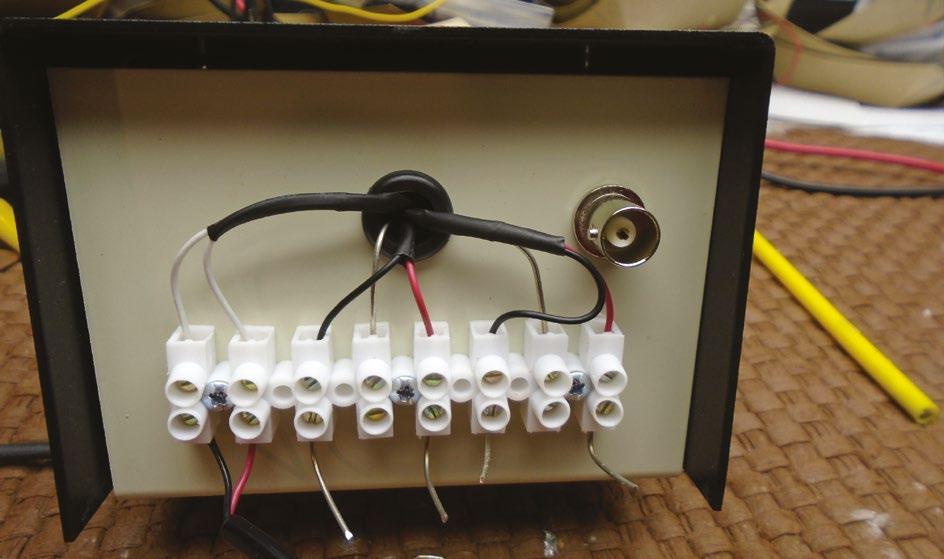
The European-style terminal strip for the wall wart AC power in and left/right out was per the request of the user in Juticalpa, Honduras. The composite BNC input matched the output(s) on the STL receiver.
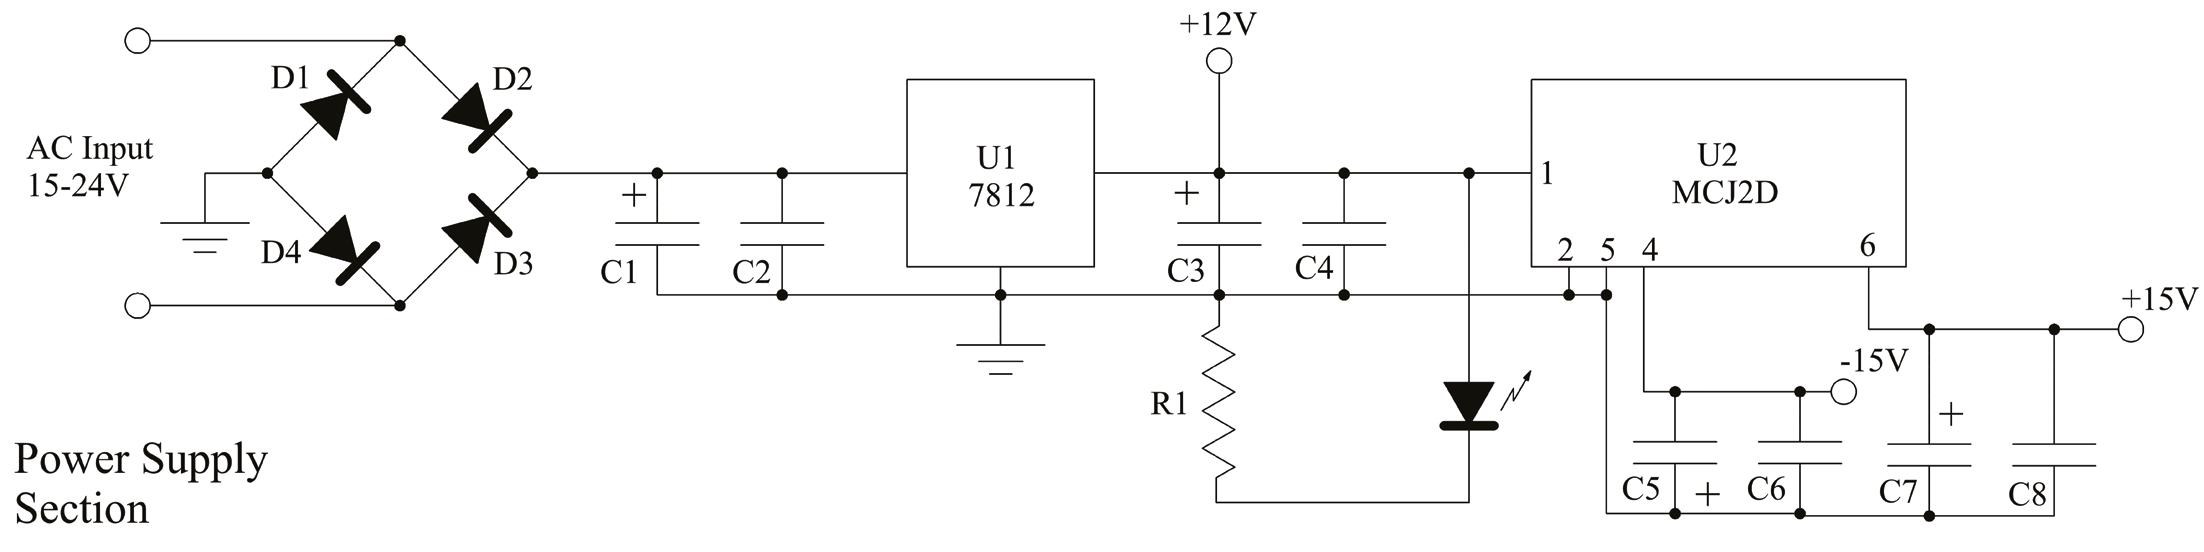
Power Supply Parts
List Circuit Symbol Qty. Description U1 1 7812 TO-220 format three-pin 12-volt regulator - 1 Heat sink to match above U2 1 Murata model MCJ2D 121515SC 2-watt 12-volt DC input to ±15VDC output C1 1 ~300 uF 25 volt minimum electrolytic – exact value not critical C3 1 ~300 uF 15 volt minimum electrolytic – exact value not critical C5 & C7 2 ~300 uF 25 volt minimum electrolytic – exact value not critical C2,C4,C6,C8 4 0.01 uF mylar or ceramic capacitors used to decouple the DC busses R1 1 510Ω ½ watt resistor LED 1 20 ma type to match the value of R3 D1-D4 1 50-volt 1 amp DIP type bridge rectifier or (4) 1N4001 Below The completed power supply section. Note the low-profile hardware heatsink for the 7812 +12V regulator. Power Supply Section 8 radioworld.com | October 19 2022 Project Journal
Demodulator Section
Tuning it up
Adjustment? Nothing fancy or tricky here. Refer to the demodulator section of the schematics.
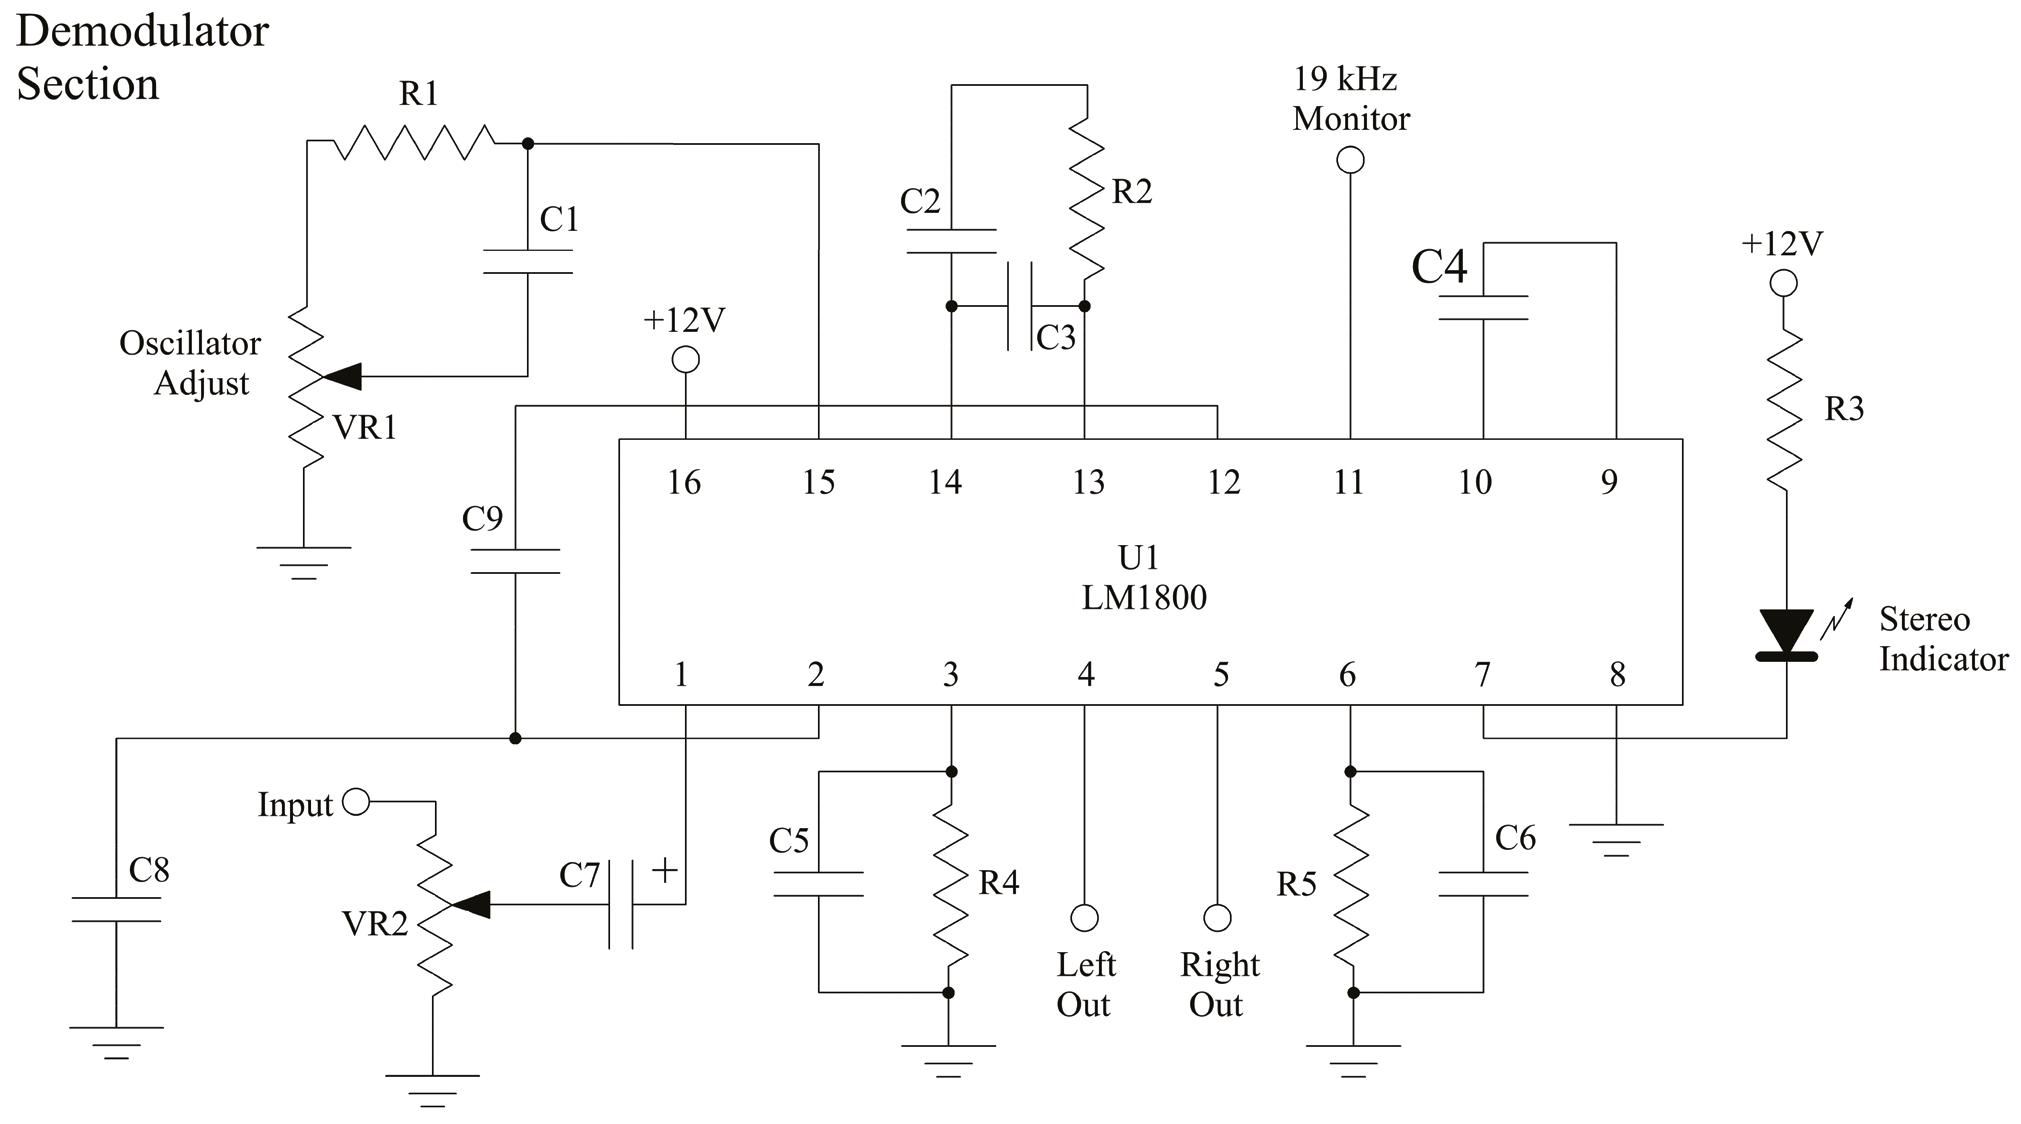
Input 19 kHz at 0.35 volts or so peak-to-peak on the composite input connector and then adjusting VR2 to set level at pin 1 on the LM1800 to about 80 mV p-p.
[An aside: This adjustment procedure assumes that the input will be the industry standard 3.5 volts peak-
Below Right
The demodulator circuit board is stacked on top of the power supply in the box to save space.
to-peak composite envelope. The LM-1800 flysheet indicates that their testing was optimized at an 800 mV PtoP level at pin 1 and with the author’s procedure, this should set the input to this ideal level point. The manufacturer’s flysheet (see parts list) on this LM-1800 chip is full of additional interesting details. Well worth the read. The 1977 National Semiconductor Audio Handbook is another great source of related concepts and ideas. See section 3 page 23.]
Proceeding on, then adjust VR1 to land the oscillator in the center of its 19 kHz capture range while looking at Pin 11 on a scope. The pilot present indicator should come on during this adjustment process.
We put a little connection loop on the PCB attached to this Pin 11. This made the scope connection for this test point easy and convenient.
Demodulator Section Parts List Circuit Symbol Qty. Description U1 1 LM-1800 stereo demodulator IC * R1 1 20k ½ or ¼ watt resistor R2 1 3.3 kΩ ½ or ¼ watt resistor R3 1 470Ω ½ watt resistor R4 & R5 2 3.9 kΩ ½ or ¼ watt resistor VR1 & VR2 2 10 k preferably 20 turn top or side adjusted as needed C1 1 390 pf C2 1 0.47 uf C3 1 0,22 uf C4 1 0.33 uf C5 & C6 2 0.022 uf C7 1 2 uf electrolytic 15 volts or greater ** C8 1 0.0025 uf C9 1 0.033 uf LED 1 20 ma type to match the value of R3 1 appropriate PCB proto-board 1 DIP socket PCB type 16-pin * jameco.com, P/N 2288767 ** Value can be increased to 10 uF to enhance low-end separation. However 2 uF reduces phase shift.
9 radioworld.com | October 19 2022 Project Journal
On my bench, I’m lucky enough to have a classic Orban 8000, and sending through separate left and right at identical levels allowed me to adjust the demodulator outputs to match. A null test confirmed that my balance was very nearly right on.
At this point, using either a stereo headset or studiograde monitor, you should assess the audio quality. Your golden ears will indicate whether you need a little more level to lower the noise and to achieve better separation by
Below Right AC input and signal output connections were brought out to a terminal strip for easy interface to the outside world. A BNC jack was used for composite input.
turning up VR2 slightly. An actual THD measurement with a crude roll-off filter was very low, coming in under 2%. Keep in mind that most of that 2% is just noise above 15 kHz and in the audible spectrum probably is closer to the 0.8% that the manufacturer touts.
The 20-turn pots used on the left/right level adjusts (VR in the output section) have considerable range and vernierity. If you love to tweak, you’ll love playing with this unit.
By the way, we couldn’t find an AC 15 volt or higher wall wart in our redundant and harvested wall wart box, so we made one using the case of an old wall wart recharger for a long-gone cordless screwdriver. We took out the insufficient low-voltage transformer and replaced that with a new, compact 5-watt 24 volt AC control transformer originally provided for a furnace humidifier but not needed.
Now your turn has come to make your very own composite demodulator to suit your unique needs and station demands.
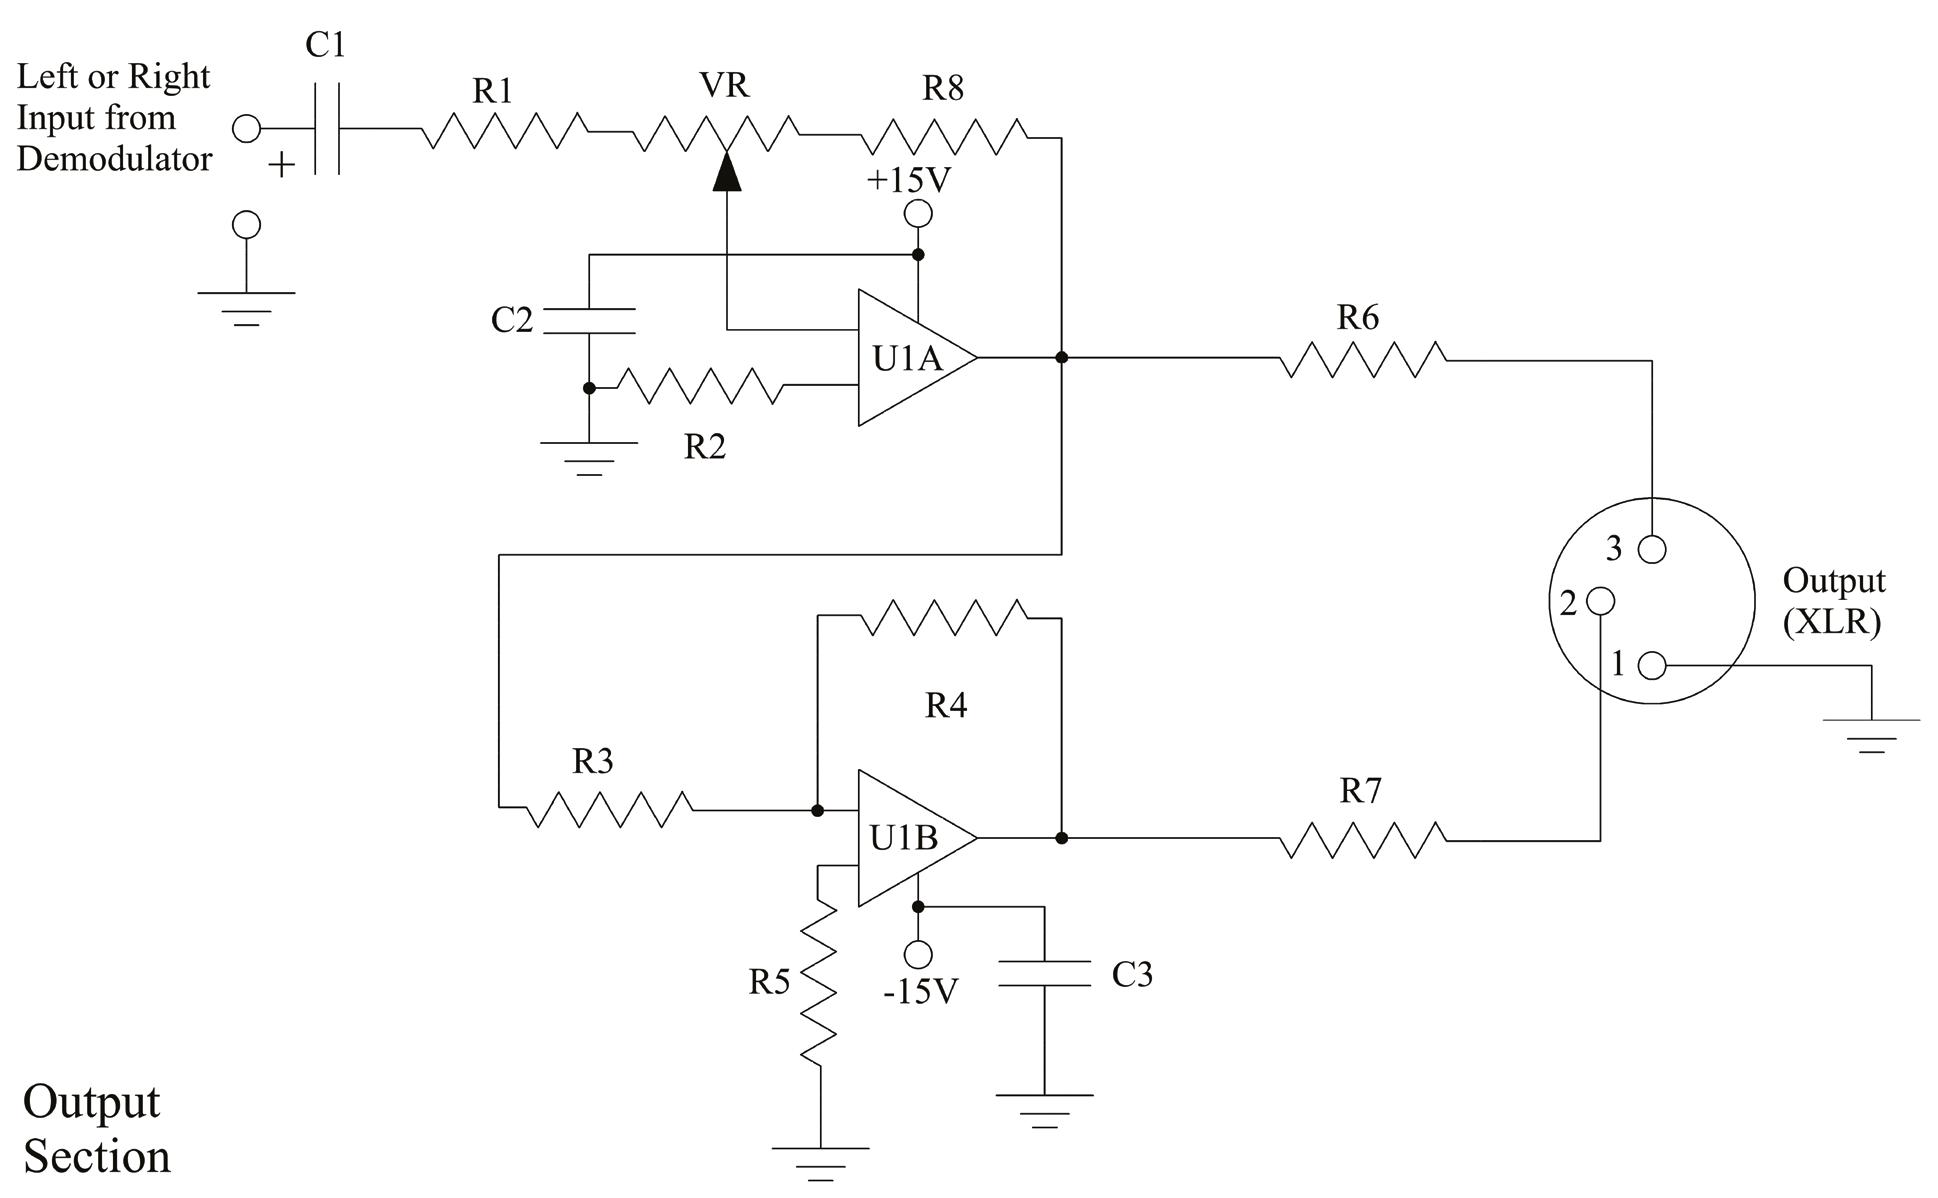
Output Section Parts List (Quantities for two sections: stereo left and right out) Circuit Symbol Qty. Description U1 2 5532 two-section self-compensated operational amplifier R1 thru R5 10 3.3 kΩ ½ or ¼ watt resistor preferably 1% or matched values R6 & R7 4 300 Ω ½ or ¼ watt resistor preferably 1% or matched values R8 2 10k ½ or ¼ watt resistor VR 2 10k preferably 20-turn top- or side-adjusted as needed C1 2 ~220 uF 10-volt minimum, exact capacitance value not critical C2 & C3 2 0.01 uF 50-volt mylar or ceramic capacitors to decouple the DC ±15V busses - 2 8-pin DIP sockets - 1 appropriate PCB proto-board - 2 XLR skirt-mounted female connector (or make connection as desired) Output Section 10 radioworld.com | October 19 2022 Project Journal


Let’s explore microwave theory for STLs
Dennis L. Sloatman CSRE, AMD, CBNT, BSEET
Many of the “veteran guys” in the business will recognize the formula for free-space attenuation, or FSA:
36.6 + 20log (F) + 20 log (D)
where F is frequency in MHz and D is distance in miles.
When I was in engineering school, an instructor once told me that it should concern you when a given equation has a “mysterious constant.” That constant is the key to understanding, and in knowing how it was derived, you have keen insight.
losses, which in turn provide you the predicted received signal strength at the receiver.
Now, there are other considerations for path analysis, such as path clearance analysis and frequency coordination (to say nothing of FCC licensing), but I’ll leave these for another time.
So, we consider:
Signal Received = sum of gains – sum of losses.
In equation form:
Below An isotropic radiator illuminating a perfect sphere.
Before I derive this equation, let’s summarize microwave paths for the younger guys who may never have had to design a path for a Part 74 or Part 101 STL system.
Essentially, it’s sort of like financial statements: the sum of assets and liabilities, but in the context of microwave path analysis, it’s more specifically the sum of gains and
∑ gains – ∑ losses = RSSI (Received Signal Strength)
Profits and Losses
Gains are transmitter power and antenna gains, and losses are transmission line losses, connectors, filters, isocouplers and most importantly, free-space attenuation or FSA. FSA is the largest loss in microwave calculations and is a result of the loss as a signal diverges in space (but directly as a result of distance, as we shall see).
So, take your time and follow along carefully as we see that the formula FSA = 36.6 +20log (F) + 20 log (D) is indeed based upon some science.
We begin with the isotropic radiator, which is a purely hypothetical antenna that radiates equally well in all directions in free space. The term free space simplified refers to space devoid of all obstructions of any sort, or any means of attenuation.
So, assume we have such an isotropic radiator powered by a 1-watt RF source (transmitter).
Examine the accompanying picture of a perfect sphere. We imagine that the isotropic radiator “illuminates” the interior of the perfect sphere equally well, distributing its 1 watt of EIRP (Effective Isotropic Radiated Power) equally over the interior of the sphere (I suggest it’s useful to imagine a spherical light source inside a basketball). Now to the science.
The surface area of a sphere is given by 4πr2 (where “r” is the sphere radius). For our purposes, let D = r, or distance from the isotropic radiator. So, this becomes 4πD2, where D is the distance from the radiator in miles.
Now, the total ERP is “captured” by EIRP/(4πD2) (the total energy is distributed over the inner sphere
Writer
Receive levels are the sum of the path gains and losses, but how do we calculate them? isotropic antenna sample area λ2 14 radioworld.com | October 19 2022 Helpful Fundamentals
surface). Since we are normalizing to 1 watt, we get 1/(4πD2) which means the 1 watt of RF power is evenly distributed over the interior surface of the sphere.
Now the signal sampled at the “sample area” (see the figure) is based upon the wavelength (λ) of the signal and a square sample area: λ2/4π, the sample area size which is the wavelength squared divided by 4π. (Note: I suggest you accept this expression as true for now; its derivation isn’t trivial, but the derivation is beyond the scope of this writing.)
Recall that λ is c/F, meaning Velocity/Frequency, which the speed of light, c (the velocity) divided by the F, or the frequency in Hertz. So, λ = c/F and λ2 = (c/F)2, where c is 186,000 miles per second in Imperial measurement.
At any given spot on this sphere, the amount of signal available for an antenna will be the amount of signal per unit area times the area of the aperture of the antenna. Note that we’re referring once again an isotropic antenna for the measurement “in the field.”
Therefore, the signal available at the sample area is given by:
(1/4πD2) x (c/4πF2) which leads to:
[c/(4πDF)]2
Now we want this in decibel or “dB” form so: dB = 10log (c/4πDF)2. But if we leave this in this form, the formula will yield a path gain, since the result will be negative (minus a minus equals a plus, correct?). Also, keep in mind this is normalized to 1 since we used 1 watt of power; so the ratio is simplified (because you only divided by one). So, we invert the formula:
dB = 10log [(4πDF)2/c2]
Now, to convert to MHz, we need to multiply F by 106, so we get:
dB = 10log [(4πDF x 106)/c]2 (noting that both numerator and denominator are squared terms).
So, using a property of logarithms such that 10logX2 = 20logX, we obtain:
dB = 20log [(4πDF x 106)/c]
Using the property of logs that log (AB) = log(A) + log(B), we can separate and combine terms:
dB = 20log (4π106)/c) + 20log (DF)
which yields:
dB = 36.6 + 20log(DF) or alternatively:
36.6 +20log(F) + 20log(D)
And there you are! To change to kilometers and GHz, change to 300,000 km/S and 109
Note that there is no attenuation directly because of distance, just a smaller sample!
Attenuation increases with frequency but not as a direct result of distance (except for atmospheric aberrations to be covered later).
Formula Variations
Here is an example of GHz and km constant derivation:
For metric calculations and using GHz, we change c to 300,000 km/s and use the 109 multiplier to convert F to GHz as follows:
dB = 20log (4π109)/300,000) +20log (DF)
which yields:
dB = 92.44 + 20log (DF)
In a similar manner for MHz and km:
dB = 32.44 +20log (DF)
So, we derived (and proved) the formula for free-space attenuation, or “FSA,” as 36.6 + 20log (F) + 20 log (D), where F is frequency in MHz and D is distance in miles. Now we discuss other gains and losses.
First, the gains. A 950 MHz STL transmitter will (typically) have some output power ranging from 1 to 7 watts (yes, there are exceptions!). A convenient formula for transmitter power conversion to dBm is:
+30 dBm + 10 times the log of the transmitter power in watts or
Xmtr dBm = 30 dBm + 10log(TPOWATTS)
So, a Moseley 6010 with 7 watts power output would have an output power (in dBm) of +38.45 dBm. Let’s not plan to use any sort of amplifier in our calculations. Now, both the transmit and receive antennas have a passive “gain” that increases in aperture size (diameter). Hopefully you can visualize how an increase in receive antenna sample size (vs. the isotropic sample size) “captures” more of the radiated signal. In a like manner,
15 radioworld.com | October 19 2022 Helpful Fundamentals

Converting from dBm to uV
What is a “dBm,” how is it defined? Zero dBm literally means 1 milliwatt into a 50-ohm impedance (50 ohms for RF purposes).
So, from Ohm’s law, E (voltage) = PxR , where P is the power in watts and R is the resistance in ohms.
For 1 milliwatt into 50 ohms we find: 0.001W x 50Ω 0.05 0.2236 volts= =E = (remember this value).
So now we know that at 0 dBm, we have 1 mW of power at 50 Ω for a voltage of 0.2236 volts. Now to the decibel formula:
dB = 10log (P1/P2)
This is for power level ratios expressed as dB. For voltage (and current, for that matter):
dBm = 20log (E1/E2) [Eq. 1]
Why does this last formula have “20log” rather than “10log” as used for power? The answer lies with Ohm’s law and with the properties of logarithms.
Power = the voltage squared divided by the resistance or, P = E2/R
Now, inserting this into the decibel formula for power we obtain:
dB = 10log [(E12/R)/(E22/R)]
where E1 and E2 are the voltages under consideration with a constant R.
Simplifying this we get: dB =10log (E1/E2)2 [Eq. 2]
(The “R’s” cancel, the old “invert and multiply” rule you learned in grade school.)
Now, using the property of logarithms in which Alog(x)n = nAlog(x), we see that Eq. 2 becomes Eq. 1 in that the constant 10 is multiplied by the exponent of 2, or 20.
Now, we can convert µV to dBm and in reverse.
Let’s try an example using Eq 1: Our received signal as indicated by a spectrum analyzer or the STL meter tells us we have a signal or “RSSI” of 476 µV, or 0.000476V. What is that signal given as dBm?
dBm = 20log (0.000476/0.2236) = –53.44 dBm
Another example: What is 398 µV in dBm?
dBm = 20log (0.000398/0.2236) = –54.99 dBm
More often, 950 MHz STLs meters display RSSI in dBm. How do we determine the RSSI in µV? We rearrange terms to determine E1:
10X(dBm/20) * 0.2236
(10X is the antilog), so we could write:
RSSI (in µV) = (0.2236) *
10 (dBm/20) (Eq. 3)
Example: What is an RSSI of –48 dBm in terms of µv?
RSSI = (0.2236) *10 (-48/20) = 0.000890v or 890 µV
Of course, there are many online calculators available such as www. translatorscafe.com/unit-converter/enUS/dbm/3-1/. But now you know how the conversion is derived!
the transmit antenna focuses more of the signal in the direction of interest (consider a focused flashlight beam vs. the spherical light source used to visualize the isotropic antenna).
So, we achieve passive “gain” by virtue of focused energy and a larger capture surface. How much gain? Well, of course, we have a formula for that.
First, gain (G) is the ratio of AANTENNA/AISOTROPIC. And AISOTROPIC aperture is given by (λ2/4π). This simplifies to:
G= (πd/λ)2e a Where: d is the diameter λ is the wavelength (diameter and wavelength are in the same units) e a is the previously discussed antenna efficiency between 0.55 and 0.70
(Recall that for wavelength in feet, the formula is 984/fMHz and for meters, 300/fMHz.)
So, the gain (G) of a parabolic antenna is given by the following:
For a 10-foot parabolic reflector used at 950 MHz, for λ we obtain λ = 984/950MHz = 1.036.
G= [π10’/ (1.036)] 2e a = (31.42/1.036) 2e a
Here, being cynics, we assume ea = 0.55, so:
G= 505.76
We now convert G to dB: 10log (505.76) = 27.04 dB
As a quick cross-check, a 10-foot Mark 950 MHz antenna, the mid-band gain taken from their website is 27.0 dBi. (Remember, this gain is as compared to an isotropic radiator hence dBi.)
Now for simplicity, we plan your microwave system using 10-foot parabolic antennas for transmit and receive. So thus far, we have these gains:
Transmitter: +38.5 dBm (rounded)
Transmit Antenna: +27 dB
Receive Antenna: +27 dB
Total gains = 92.5 dBm
(One of the reasons we use logarithms and decibels is that logarithms transform problems into simple addition and subtraction.)
18 radioworld.com | October 19 2022 Helpful Fundamentals
Now, let’s consider the losses. For a 20-mile path, loss at 950 MHz (from the formula derived above), we find:
FSA – 36.6 + 20log (950) + 20log (20) = –122.17 dB loss as a result of distance
We assume 800 feet of 7/8-inch transmission line at 950 MHz (the loss taken from the manufacturer’s published specifications): –9.82 dB (loss).
Now, we decide to install a bandpass filter (for interference protection) at the receive end with a loss of –1.5 dB at our frequency.
Finally, every “mating pair” of connectors results in a loss of about 0.125 dB. If we allow for eight pairs of connectors, we have 8 x –0.125 dB = –1.0 dB.
Therefore, sum of gains = 92.5, sum of losses = (122.17 + 9.82 + 1.5 + 1.0) dB = 134.49 dB (loss).
Finally, we add the gains and losses:
+92.5 – 134.49 = –41.99 dBm signal or “RSSI” at the receiver.
We convert to µV and obtain: 1,778 µV (which is a LOT of signal). See the sidebar for this conversion.


In a different example, for a 20-mile path and eight-foot antennas (all else being equal), we have:
Gains: (38.5 + 25.1 +25.1) – (122.17 + 9.82 + 1.5 +1.0) = 88.7 – 134.49 = –45.79 which equates to 1,148 µV. (Still a lot of signal!)

Note here why using dB makes calculations simple arithmetic! (Remember: RSSI = sum of gains minus sum of losses.) As a rule of thumb, we like at least 10 dB of “fade margin” in our STL path in order to have some allowance for atmospheric fades; more on this in a later installment of this series.
Digital STLs (such as the Gates Air HD Link) require about –82 dBm of signal to reproduce a usable path (from the manufacturer’s data sheet). So, we desire at minimum, a calculated RSSI of –72 dBm for our path (more if it’s a “grazing path” or a path longer than 10 miles). More fade margin is better of course, and we’ll discuss this more as well as what I mean by “grazing path” later.
To be clear, a 10 dB fade margin is to be considered an absolute minimum when designing a system. A 10 dB margin can “evaporate” rapidly in inclement weather or during temperature inversions.
I hope you can see that these calculations can be made on your iPhone as well as several online sites, but it’s far better for you to understand the science involved.
Comment
Got an idea for this series or a question for the author?
Drop us an email at radioworld@ futurenet.com


19 Helpful Fundamentals
Writer Tom Vernon
A Radio World contributor since 1983, the author divides his time between consulting, old house restoration and flying airplanes.

Are you ready for Tower Lighting as a Service?
Offloading a complex task may save time and money
As with most things related to technology, the broadcast engineering ecosphere has become an increasingly complex workspace. New technologies appear and need to be integrated with legacy systems, existing technology is always in a state of flux, while regulations and compliance can also be a moving target.
Despite all this, there are still just 24 hours in a day. The best strategy for the overworked engineer may be to delegate some of that workload whenever possible.
Managing tower lighting systems might be one such task. At least LumenServe thinks so.
The eight-year-old company, based in Austin, Texas, provides services to tower owners. The people behind the company include an original investor in Crown Castle and the co-founder of American Tower.
Its flagship offering is “Tower Lighting as a Service,” or TLaaS (both of which are registered trademarks).
It describes TLaaS as “a unique approach where we will buy a new LED system for your tower, install it, maintain it, protect it against catastrophic events and do the compliance and monitoring.”
Radio World talked with Bear Poth, president and CEO of LumenServe, about how rules and technology for tower lighting have changed, how those changes can work to your benefit and how TLaaS works.
Recent trends
Poth begins by noting that the FAA rules for tower lighting with incandescent lamps and painted towers remained virtually
unchanged for decades, but that the advent of xenon strobe, and later LED technology, changed that.
The most recent revision, Circular M, is largely concerned with the deployment of infrared (IR) LEDs. This change was largely brought about by the use of night-vision goggles by pilots. Incandescent tower lights are visible with these goggles, due to their heat signature, while conventional LEDs are not, because they emit very little heat. This presents a hazard to aviation.
Towers meeting existing standards are grandfathered in and need not be upgraded to IR standards. However, new lighting installations are required to meet the IR spec.
An exception exists if the mid-point LED beacon should fail on a tower; if that happens, both the mid-point and top beacons need to be replaced with IR spec devices.
“Otherwise,” he says, “a pilot with night-vision goggles might see the IR mid-point beacon but not the top beacon, and think the mid-point is the top of the tower.”
The previous standards, contained in Circular L, were released in 2016. One section includes the Avian Standard. A 2012 study showed that steady red lights attract birds, increasing fatalities. Updated standards require any sidelights to be flashing, although many configurations no longer require sidelights.
“Updating is a win-win where you can reduce your tower loading and energy consumption and become more environmentally friendly at the same time,” Poth said.
These new standards can be a lot to absorb. LumenServe has reduced this mass of text-based information into a visual format, and made it available as a complimentary poster, which is available upon request.
Lighting advances
Tower lighting technology comes in three types. According to Poth, the majority of towers still use traditional incandescent bulbs, well-proven but high in power consumption. Downsides also include short life, RFI/EMI interference and light pollution.
Second are Xenon gas-filled tubes that emit a blue glow when excited by an electrical discharge. These also use considerable power.
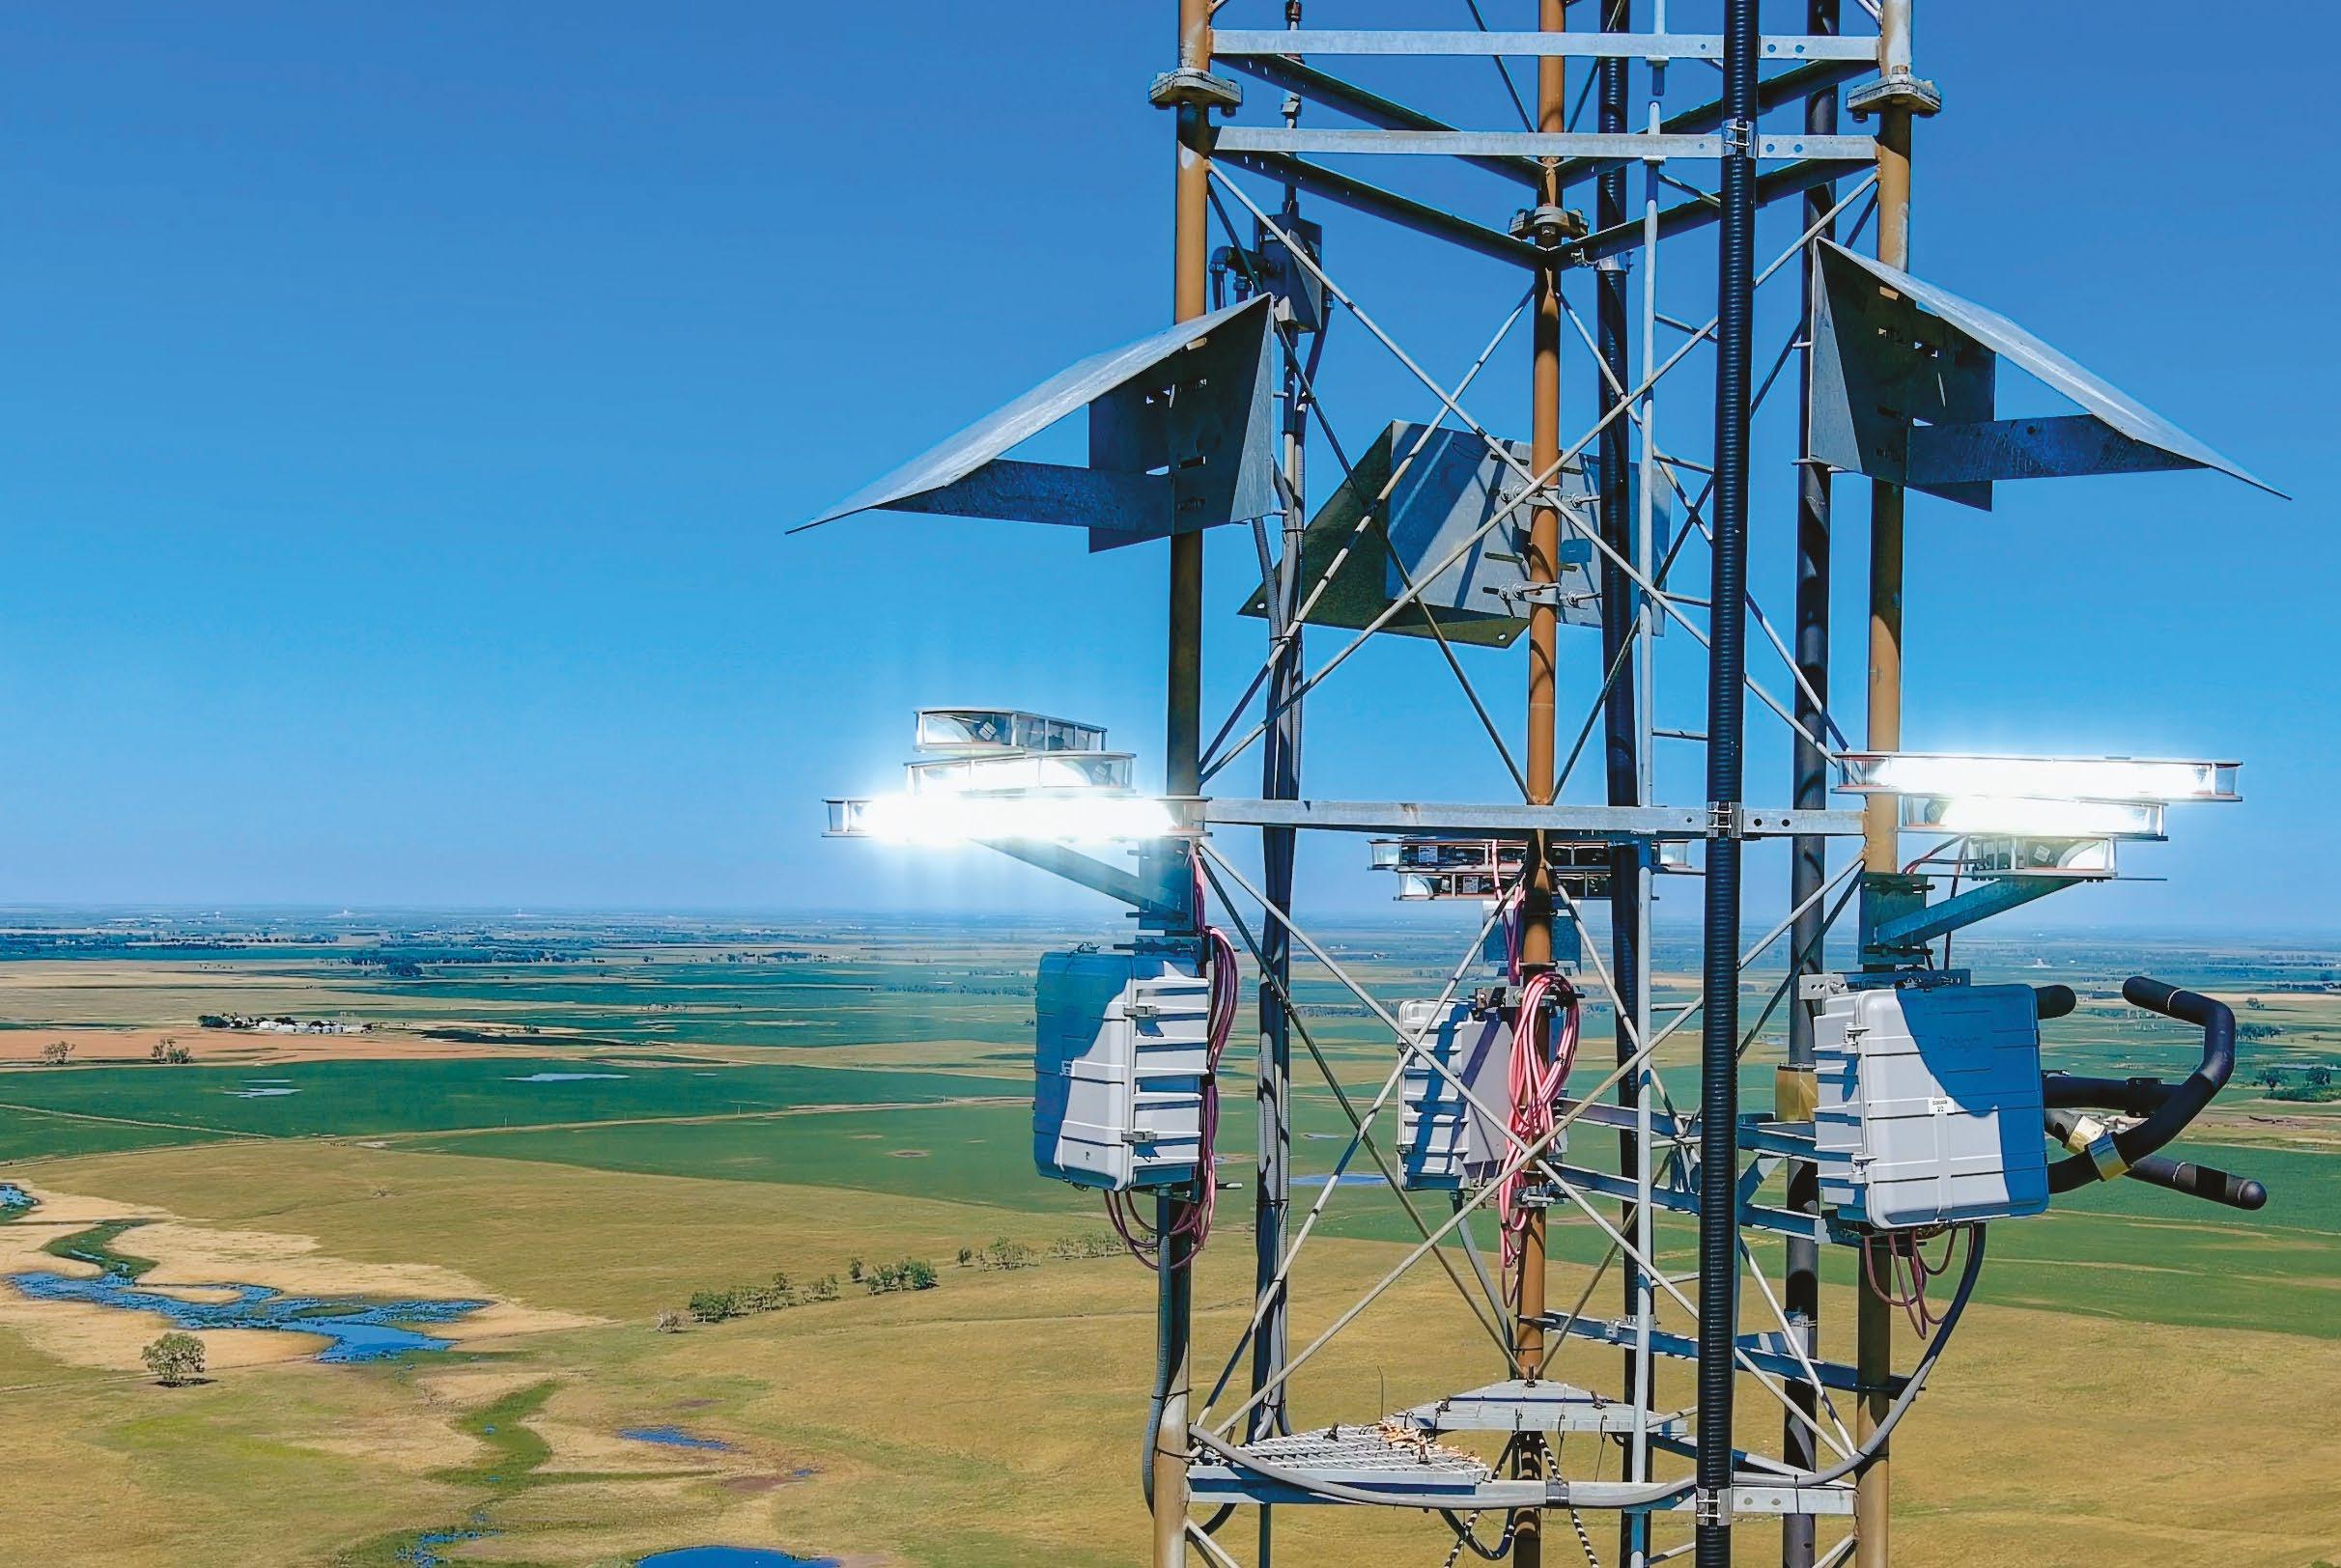
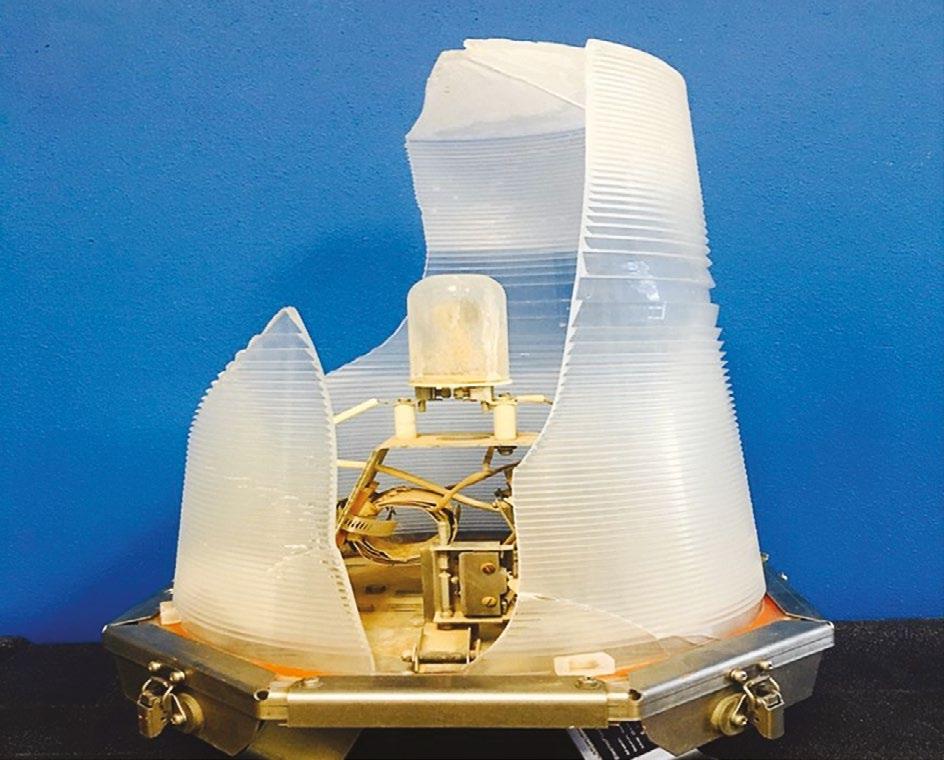
Right
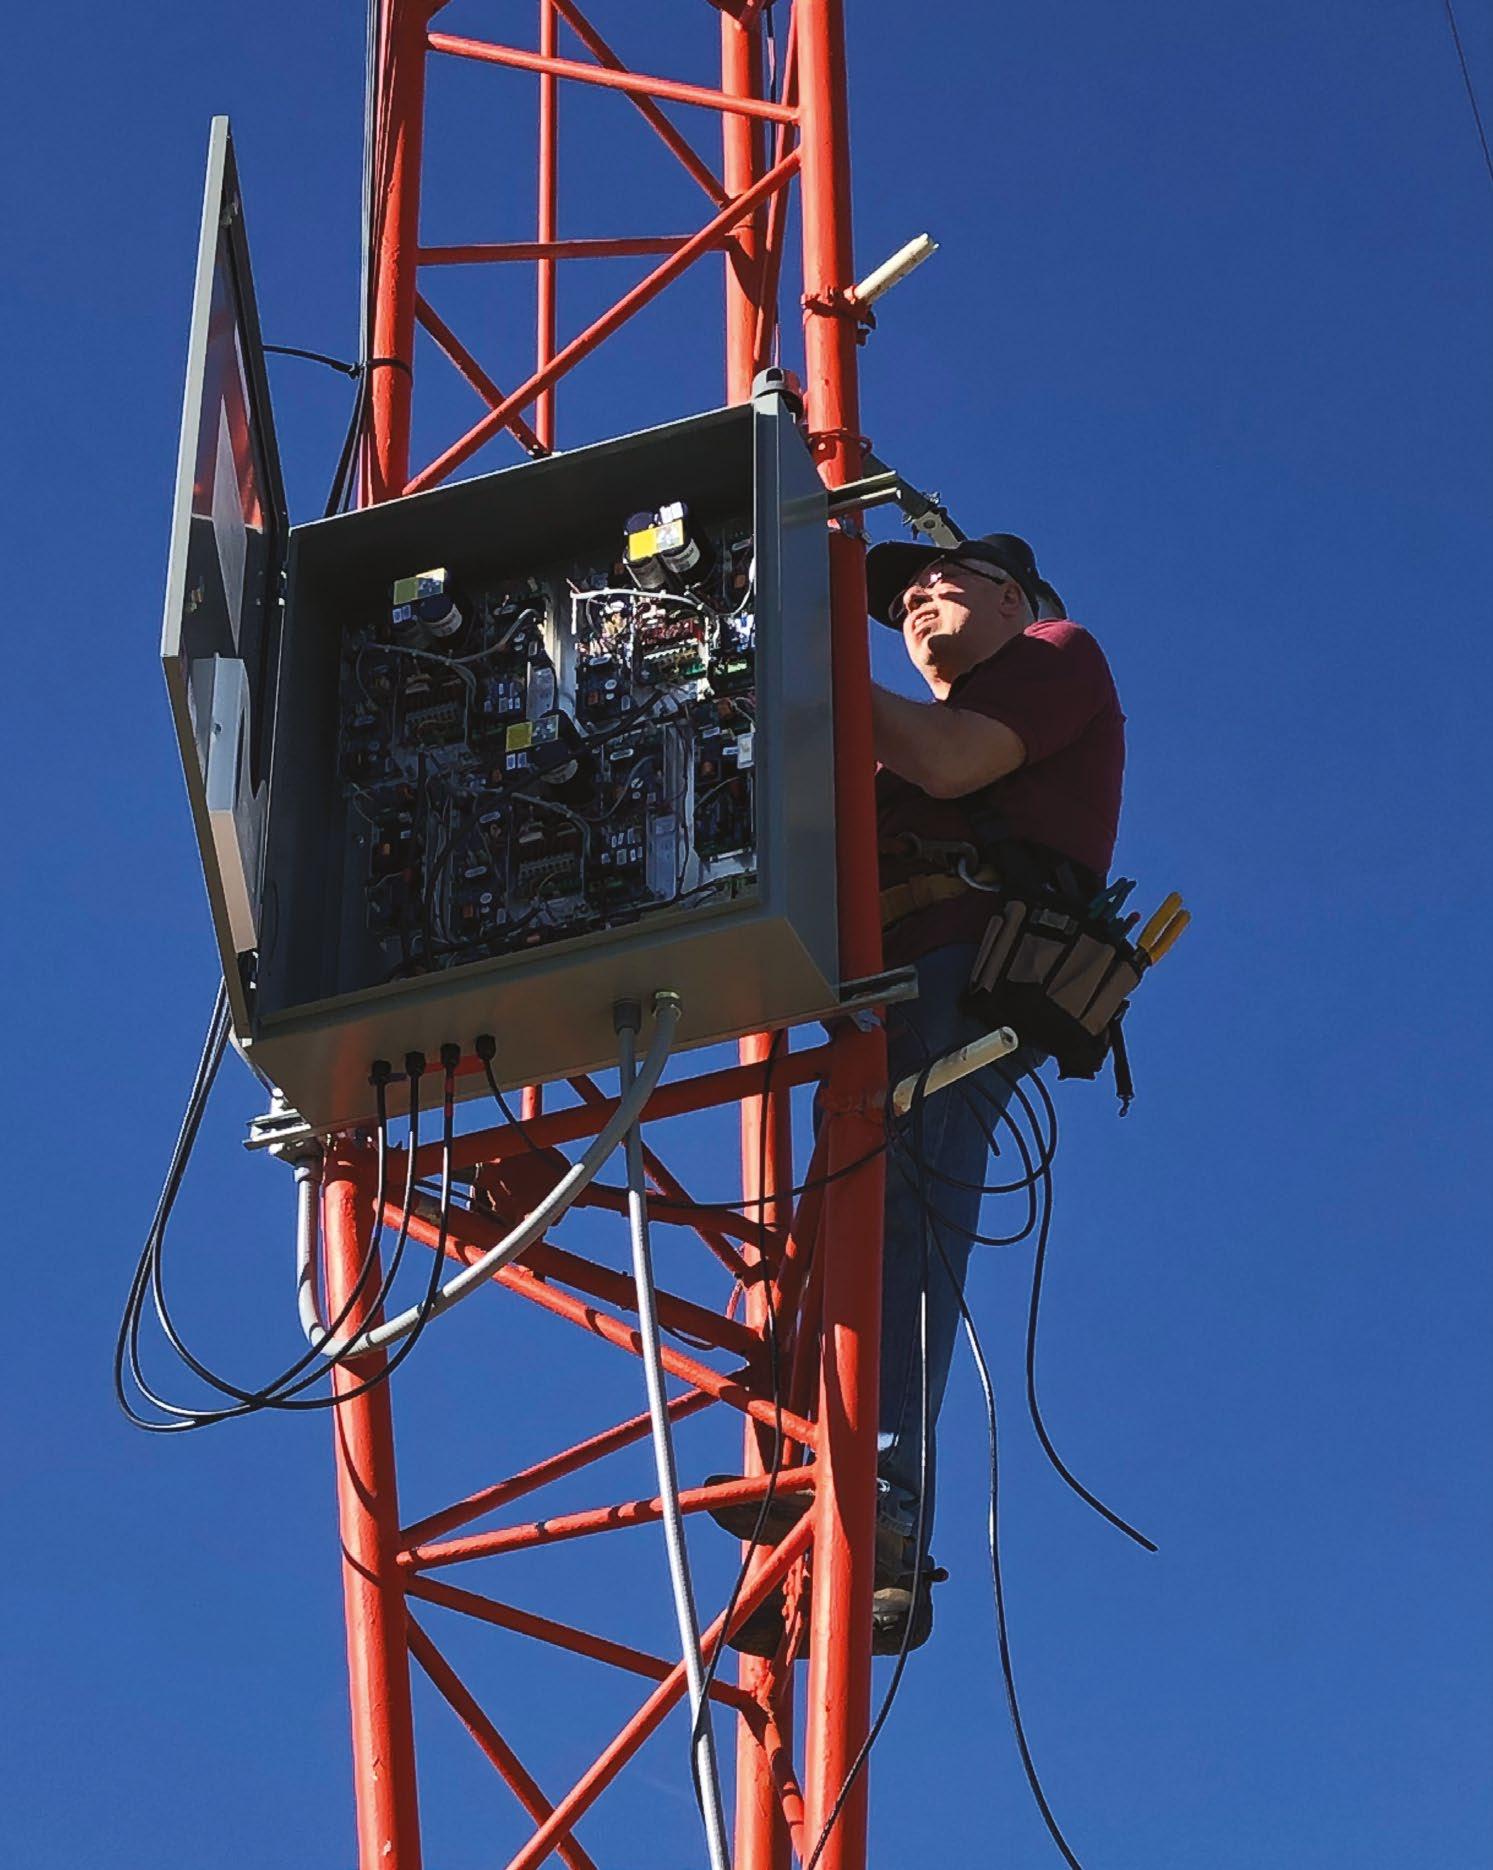
A biennial lens inspection via drone revealed this badly cracked lens. The beacon was still flashing, but for how long?
The third option is LED technology, which is the smallest light source available. LEDs have the advantages of no fragile parts, no corrodible contacts, RoHS compliance, shock and vibration resistance and long life. Most important, LEDs are about 90 percent more efficient than incandescent bulbs, Poth said.
20 radioworld.com | October 19 2022 Facility Management
Today’s medium-intensity LED flash heads can contain both red and white LEDs and are designed for low light pollution. This means the optics project most of the light horizontally, and very little is visible at ground level.
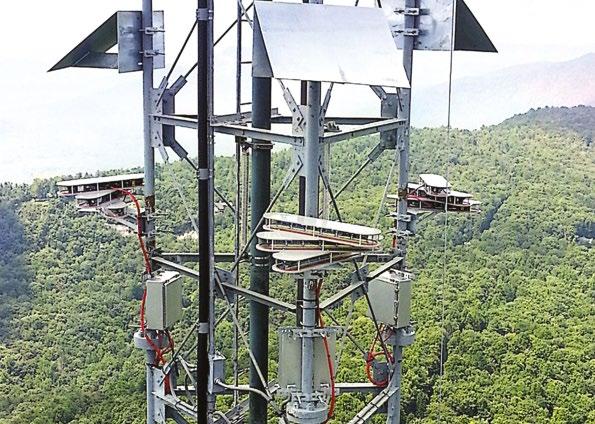
High-intensity LEDs are required for non-painted towers over 700 feet, and are configured as three separate arrays on the tower. Each array covers 120 degrees. Each array in turn has three elements. Each of these elements covers 40 degrees.


Poth said that the new FAA regulations can work to a tower owner’s advantage.

One such instance is painted towers. The average time between paintings is seven years, even less in harsh environments. The cost to paint a tower can be $30 per foot or more, not counting down time and coordination. Painted towers require paint inspections, another costly expense. Finally, sidelights on painted towers attract migratory birds, leading to birdkill. Another expense, the cost for tower climbers, has increased significantly in recent years, a trend that’s likely to continue.

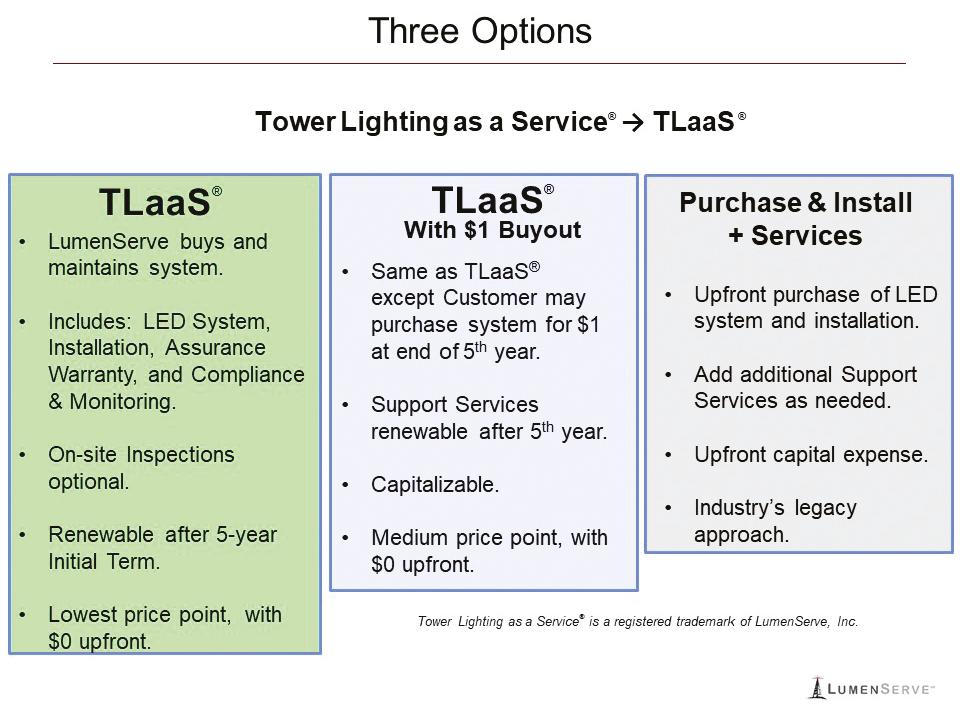
Above LumenServe offers three options in the services it provides to customers.


All of these can be eliminated by transitioning from an FAA “A-style” painted tower to a “dual-mode” tower.


An A-style tower is marked with alternating aviation orange and white paint bands for day marking and red lighting for night marking, while a dual-mode tower is marked with white lights during the day and red lighting at night and does not need to be painted for obstruction marking purposes.

Poth said LumenServe will assist with the required FAA paperwork to update the obstruction marking and lighting determination for a customer site, and if the tower has sidelights, those will often be eliminated, so there will be fewer lights and LEDs, and the tower will no longer need to be painted for obstruction marking purposes. This updated filing also aids the FAA in bringing each site to the most current circular, he said.
LumenServe uses the customer’s site internet connection to provide monitoring service of the lighting system
21 Facility Management
and for remote diagnostics. But what happens when there is no internet service?
“We use our proprietary machine-to-machine technology to interface with tower lighting equipment,” he said.
“The backhaul is via a mobile connection, and our gear works with AT&T, Verizon and T-Mobile. Our service is provided to the customer for $10 per month.” He adds that this same M2M system is also used to get telemetry signals across hot ungrounded AM towers.
Currently, LumenServe services about 800 towers in the United States. Poth said its customer base breaks down into three groups. The first includes radio/TV broadcasters and communications companies. The second consists of companies that lease tower real estate. Finally, there is the public space, including emergency management services, police departments, and local and county governments.
Types of service
There are three options for which LumenServe quotes services. The first is full-on TLaaS, where LumenServe buys, owns, maintains and monitors the tower lighting system. The customer pays a flat service fee each month for a five-year term. At the end of five years, the customer has the option to renew annually with a modest predetermined rate increase.
Right High-intensity LEDs for nonpainted towers are configured in arrays to provide 360-degree coverage.
Second is a TLaaS option, where the asset reverts back to the tower owner after five years.
Finally, LumenServe offers the traditional business model where the tower owner makes an upfront purchase of the tower lights and installation, and may elect to add additional support services.
It would seem that LumenServe’s success hinges not only on being able to take the burden of tower lighting management off the engineer’s shoulders, but on doing so at a competitive price. How does that happen?
“Tower lighting is all we do, so we’re very focused,” says Poth. “We’re able to get through the compliance and installation hurdles in a lot less time than most station engineers. We buy all our equipment in bulk at discounted prices.
“What a lot of people don’t realize is that the greatest cost of a tower lighting system is not the purchase price or installation, but maintenance and compliance, and that’s another area where we leverage technology.”
Since LumenServe polls the customer’s lighting system every five minutes, the average time to detect an outage is two and a half minutes. The average time to post a Notice to Airmen (NOTAM) is 11 minutes. Repairs are completed in an average of four days. There are two Network Operation Centers, one virtual and one in Austin.
Ice Shield
Power Supply HighIntensity LED Array
Engineering Databases and Software Tools to Fit any Budget! • AM Allocations • FM Allocations • Contour Protection • PCN Coordination Tools • Coverage • Population Studies • DA Design • Phasor/ATU Design • DA Proof Tools • Diplexer Design Au Contraire Software, Ltd. www.aucont.com (303) 489-3454 22 radioworld.com | October 19 2022 Facility Management


23 radioworld.com | October 19 2022

9000
