CLIMATE RESILIENCE IN RAIL ELECTRIFICATION

AUTHORS
Noel Dolphin FPWI
25 years in construction and rail operations and performance management, 16 years in electrification construction and design.
Rob Daffern CEng, MEng
Over 20 years of experience in electrification from maintenance, construction and design.
Stefan Leuenberger MPWI
19 years experience in CAD and design development
Mariusz Sledz MSc
Innovation Engineer and led climate change adaption in the UK for Furrer+Frey.
Jonathan Harris MEng
10 years’ experience in electrification and rail, project engineering assurance, design and construction
Urs Wili
53 years in rail, including as Head of Electrification for the Bern region in Switzerland and board member of Furrer+Frey since 2000.
Glenn Wiles
43 years’ experience in rail electrification maintenance, design and construction, Previously Principal Engineer for Network Rail.
2
FOREWORD
As we stand at the crossroads of human history, faced with the daunting task of averting an impending climate crisis, the need for climate resilience can no longer be underestimated. Electrified railways have long been recognised as one of the most efficient and sustainable forms of transport, delivering unparalleled reliability, capacity, and cost-effectiveness for both passengers and freight.


The UK's Climate Change Committee has made it clear that the key to decarbonising transport lies in a decisive modal shift towards public and active transport modes. The Sparks Effect is a term historically used to refer to the boost in passenger numbers associated with electrifying railways. The power of the Sparks Effect can no longer be underestimated. Electric railways emerge as an exceptional solution to achieve this transition, offering a proven, mature technology that can lead us towards a cleaner, greener future. However, as the railway industry becomes an increasingly vital component of our climate change mitigation strategies, it must also confront the challenges posed by the very crisis it seeks to alleviate.
To secure the promise of electric railways and ensure the continued growth of the Sparks Effect, we must prioritise climate change resilience. Our infrastructure must be robust and adaptable, capable of withstanding the impacts of an evolving global environment. Only by addressing these challenges head-on can we guarantee reliable journeys for passengers and freight and maintain the trust of our existing customers.
100 years ago, Furrer+Frey were established to electrify railways. As we hold our 100th anniversary, we look to the next 100 years. This report serves not only as a reminder of the tremendous progress we have made in the past 100 years but also as a clarion call to action for the next century. As Furrer+Frey embarks on its second century of innovation and leadership in railway electrification, we invite you to join us in shaping a future where electric railways form the backbone of a sustainable, decarbonised transport system. Together, let us ignite the Sparks Effect and propel humanity towards a brighter, more resilient future.
3
EXECUTIVE SUMMARY
The only way to limit the use of fossil fuels and reduce emissions is through efficient electrification. Transport is the UK’s largest GHGemitting sector, producing 24% of total emissions in 2020 (406 Mt CO2e)2. Studies have shown that an electrification programme of around 10% of that recommended by Network Rail’s Traction Decarbonisation Network Strategy would enable about 70% of rail freight to be electrically hauled. A 4% transfer of road passenger and freight, as well as 20% of air transport, to rail would save 2.4 Mt of CO2 equivalent gases3
Anthropogenic climate change is increasing global surface temperatures, and its effects are already visible in every region of the world, meaning that today’s observed ‘extreme’ weather could become the ‘normal’ weather of tomorrow. Even a fully electrified transport sector is still exposed to many kinds of weather- and climate-related risks that may have a substantial impact on railway assets. The duration, magnitude, scale and frequency of the risks are projected to increase and worsen.
By 2070, it is expected that the winter season will be between 1° and 4.5°C warmer and up to 30% wetter, and summer will be between 1° and 6°C warmer and up to 60% drier. Heavy rainfall is also more likely. Since 1998, the UK has seen six of the ten wettest years on record. Winter storms will be at least 40% more likely because of climate change. Even if we reduce GHG emissions, sea levels will continue to rise after 2100, putting the low-lying parts of the UK at risk of flooding. Railways must be resilient and recover quickly to continue operating in future conditions.
While Network Rail has greatly improved its climate change adaptation plans and introduced a wide range of efficient electrification programmes, there is a scarcity of research investigating climate threats within the rail sector, and even less focus on rail electrification itself. In addition, there is insufficient literature considering climate threats to infrastructure in general. The focus is mainly on climate change mitigation, with countries only
recently starting to build capacity for adaptation. This paper aims to identify the impact of the future climate on overhead electrification assets and to evaluate current practices and provide recommendations for existing and future electrification projects. The goal is to make the railway more reliable and resilient in the future for both passengers and freight.
The report has found that while only 7% of the cumulative weather cost related to Network Rail’s Schedule 8 (payments for disruption) can be attributed to heat, it has the most damaging effect on rail electrification. As ambient temperatures and the frequency of hot spells are expected to increase, it is important to ensure that existing and new electrification projects are heat resilient and resistant to the other impacts of climate change. The report makes the following recommendations.
4
In 2021, the United Kingdom (UK) obtained 19.4% of its primary energy from low-carbon sources, meaning that the remaining 80.6% was produced using crude oil, petroleum products and natural gas1. The use of fossil fuels is incredibly inefficient, due to energy transfer losses. In addition, they release greenhouse gases (GHGs) as by-products into the atmosphere. These gases are the primary source of climate change and global warming, as well as contributing to millions of premature deaths worldwide.
RECOMMENDATIONS
Base temperatures are too low, and the existing systems' temperature ranges need review
Several legacy electrification systems have been identified as having too low a set-up temperature to mitigate the effect of future climate change. Furrer+Frey recommends either an immediate assessment and, based on its outcome, adjustments to set-up temperatures where required or complete renewal. It is recommended that new electrification projects also have region-based climate change adaptation plans. National standards for sustainable infrastructure must be defined and revised according to the most up-todate climate change predictions.
Implementation of nature-based solutions for climate change resilience
Nature-based solutions (NbS) are an important part of climate change resilience, providing a range of benefits including improved air and water quality, lower GHGs and enhanced disaster preparedness. Furrer+Frey recommends reviewing the current vegetation management practices, developing long-term vegetation plans, and implementing NbS where possible.
Remote asset monitoring
Automated remote asset monitoring can significantly improve the quality of maintenance tasks and seasonal preparedness. In addition to the existing monitoring system for pantographs, Furrer+Frey recommends implementing trainborne asset-monitoring systems, which would allow Network Rail to move towards risk-based maintenance practices. However, the development of a digital and centralised platform is necessary for accurate risk monitoring and riskassessment methods. Data lifecycle policies need first to be put in place to ensure the system and collected data remain manageable in the future.
Immediate assessment and renewal of vulnerable legacy assets
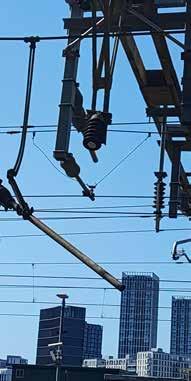
Assets identified in this report as particularly vulnerable to climate change are fixed termination (FT) equipment, porcelain insulators and headspans. Furrer+Frey recommends reassessment of the remaining FT equipment in the UK. A campaign change is particularly advised of age-degraded porcelain insulators which are at risk of high radial loads in extreme events. Legacy systems also often lack mechanical independence of electrification which is a key part of resilience, ensuring that, where a failure occurs, its impact is isolated.
Further investigation into climate change impact on OLE systems
Further research is needed to investigate the effects of diurnal temperature variations on electrification systems as a whole. The UK has the potential to become a hub for climate change resilience in electrification, sharing knowledge and improving infrastructure resilience worldwide.

5
6
Authors 2 Foreword 3 Executive Summary 4 1 Introduction 10 1.1 Benefits of Electrification 12 1.2 Problem Statement 14 1.3 Scope 15 1.4 What is Climate Change Resilience? 16 1.5 Case Studies 17 1.5.1 July 2019 Heatwave 18 1.5.2 February 2022 Storms Dudley, Eunice and Franklin 19 1.5.3 July 2022 Heatwave 21 2 Climate Change Predictions and Their Impact on Electrification 22 2.1 Global Predictions 24 2.2 UK Climate Change Predictions 25 2.3 Temperature 26 2.3.1 Maximum Ambient Temperature 27 2.3.2 Increased Number of Hot Spells 29 2.3.3 Diurnal Air Temperature Variation 31 2.4 Insolation (solar radiation) 33 2.5 Precipitation 34 2.5.1 Warm Wet Winters 35 2.5.2 Dry Stormy Summers 36 2.5.3 Sea-Level Rise 36 2.6 Extreme Winds and Storms 37 2.7 Ice/Snow 37 2.8 Summary of Climate Change Impact on Electrification 38
TABLE OF CONTENTS
7 3 Current Practices for OLE Climate Change Resilience 40 3.1 UK Electrification Climate Change Resilience 42 3.2 Nature-Based Solutions for Electrification Climate Change Resilience 44 3.2.1 Green Corridors and Vegetation Shading 44 3.2.2 High Sea Levels and Storm Surges 44 3.2.3 Precipitation 45 4 Climate Change Resilience Recommendations 46 4.1 Review of Appropriate Standards and Practices 48 4.1.1 Existing OLE Systems 48 4.1.2 New Systems 49 4.2 Review and Renewal of Vulnerable Assets 50 4.2.1 Fixed Termination (FT) Equipment 50 4.2.2 Manchester to Hadfield/Glossop Route Case Study 51 4.2.3 Ceramic Insulator 52 4.3 Implementation of Green Solutions for Climate Change Resilience 52 and Improved Vegetation Management 4.4 Continuous Remote Condition Monitoring 53 4.5 Further Investigation into Climate Change Impact on Electrification Systems 53 5 Conclusion 54 6 References 58
FIGURES & TABLES
8 Figure 1 Railway system resilience 16 Figure 2 Cumulative Schedule 8 category cost distribution for the years 2006-2021 17 Figure 3 Schedule 8 weather-related cost per year from 2006 to 2021 17 Figure 4 Sagging conductors at Auston (top), stretched jumper hanging foul of gauge at the 18 overlap (left) and entangled pantograph head at Patrick Viaduct (right) Figure 5 OLE damage at St Albans during the storms 19 Figure 6 Tree catching fire at Beattock 19 Figure 7 Tree falling onto railway due to lineside fire at Euston, and dewirement at 21 Stratford caused by extreme heat Figure 8 IPCC maximum temperature change predictions under high-emissions scenario relative 24 to a pre-industrial baseline. Obtained from ICPP Interactive Atlas Figure 9 UK annual temperature difference in very optimistic and worst-case scenarios. 25 Obtained from Met Office UK climate projections Figure 10 UKCP18 projections of summer (June-July-August) maximum air temperature anomaly in 27 the 2080s, relative to a 1981-2010 baseline, under the RCP 2.6, 4.5 and 8.5 emissions scenarios Figure 11 Elevation of a typical electrification system. 28 Figure 12 Wave propagation in OCS caused by pantograph movement. 28 Figure 13 UK hot spell occurrence count for years 1948–2021 29 Figure 14 24-hr seasonal UK maximum daily air temperature variations in 5-year moving average 31 for years 1948-2021 at Heathrow. Figure 15 UKCP18 projections of summer (June-July-August) net surface short-wave flux change in 33 the 2080s, relative to a 1981-2010 baseline, under the RCP 2.6, 4.5 and 8.5 emissions scenarios. Figure 16 Average precipitation rate change for December/January/February in 2080 for a return 35 period of rp100, using baseline 1981-2000 and scenario RCP 2.6, 4.6 and 8.5, respectively. Figure 17 Collapse of embankment on the Union Canal in Scotland 36 Figure 18 Damaged overhead lines and equipment during heavy icing in 2014, Slovenia 37 Figure 19 Summary of climate change hazards on the electrification project 38 Figure 20 Total reported train delay/cancellations for MAN-HDF route for years 2015-2021 51 Figure 21 Most commonly reported reasons for climate change-related train cancellations on 51 MAN-HDF route vs maximum monthly air temperature Table 1 Sea-level rise in metres around the year 2100 relative to the 1981-2000 baseline 36 Table 2 Temperature ranges for existing UK systems 48 Table 3 Remaining fixed termination equipment in the UK 50
ABBREVIATIONS & ACRONYMS
AC alternating current
ADAPT European Climate Adaptation Platform Climate
ARDL autoregressive distribution lag
ARISCC adaptation of railway infrastructure to climate change
AT auto tension
BBC British Broadcasting Corporation For OLE equipment: MK BBC –Mark Brown Boveri
BS EN European Standard superseding British Standard
CEDA Centre for Environmental Data Analysis
CO2e CO2 equivalent
DC direct current
FT fixed termination
FTTW fixed termination tramways
GB Great Britain
GE Great Eastern
GEFF Great Eastern Furrer+Frey
GHG greenhouse gas
GIS Geographic Information system
ICUAS International Conference on Unmanned Aircraft Systems
IEEE Institute of Electrical and Electronics Engineers
IET Institution of Engineering and Technology
IPCC Intergovernmental Panel on Climate Change
ISDR International Strategy for Disaster Reduction
ISO International Organization for Standardization
IUCN International Union for Conservation of Nature
LNE&EM London North-East and East Midlands
LTS London Tilbury and Southend Railway
Met Office Meteorological Office
MIDAS Met Office Integrated Data Archive Systems
MK mark
MSJ Manchester South Junction
MSW Manchester–Sheffield–Wath electric railway
Mt megaton (million tonnes)
NbS nature-based solutions
NO2 nitrogen oxide
NR Network Rail
OCS overhead catenary system
OEA overhead electrification assets
OLE overhead line equipment
ORR Office of Rail and Road
RAIB Rail Accident Investigation Branch
RCP Representative Concentration Pathways
RSSB Rail Safety and Standards Board
SCADA supervisory control and data acquisition
SCS Shenfield‒Chelmsford‒Southend
SICAT Siemens Catenary
TAC Transportation Association of Canada
UKCP United Kingdom Climate Projections
UKMS United Kingdom Master Series
UV ultraviolet
WCML West Coast Main Line
9
INTRODUCTION
Mankind uses energy to heat homes, manufacture goods, transport freight and people and deliver almost any service. As of 2019, fossil fuels are the primary energy source for the planet, contributing 84.3% of total energy, while renewables contributed only 11.4% and nuclear (low-carbon renewable) 4.3%4. In 2021, the UK obtained 19.4% of its primary energy from low-carbon sources, meaning that the remaining 80.4% of energy was produced using crude oil, petroleum products and natural gas1 .
The use of fossil fuels is incredibly inefficient due to energy transfer losses, and they release GHGs into the atmosphere, such as methane, sulphur dioxide, carbon monoxide, nitrogen dioxide and particulate matter as by-products. These gases are the primary source of climate change and global warming.
Breathing in these gases disrupts lung function and has been linked to several severe cardiovascular and respiratory diseases such as asthma, emphysema, bronchitis and heart attack. Moreover, a mixture of small particulate pollution and water creates toxic droplets that can easily penetrate the lungs, significantly increasing the risk of lung cancer, heart disease and stroke. The WHO estimated that in 2016 air pollution caused 4.2 million premature deaths worldwide5
The only way that the railway can limit the use of fossil fuels and reduce emissions is through efficient electrification, where the fuel source can be controlled at the power plant. Transport is the largest GHG-emitting sector, producing 24% of the UK’s total emissions in 2020 (406 Mt CO2e)2. Studies have shown that an electrification programme of around 10% of that recommended by Network Rail’s Traction Decarbonisation Network Strategy would enable about 70% of rail freight to be electrically hauled. A 4% transfer of road passenger and freight, as well as 20% from air transport to rail would save 2.4 million tonnes of CO2 equivalent gases3. Thus, rail electrification is part of the solution to climate change, but it must also be resilient to that change.
TRANSPORT IS THE LARGEST GHG-EMITTING SECTOR

10

1.1 BENEFITS OF ELECTRIFICATION
Over the past hundred years, rail electrification has evolved into an interconnected ecosystem and is now the number one solution for the green, sustainable future of transport. Electric trains have the ability to attract modal shifts from less carbon-friendly modes of transport. The UK’s Climate Change Committee concludes car mileage should be reduced by 10% by shifting to active travel modes (walking, cycling, etc.) and public transport 6 . Reliable infrastructure is critical to allow modal shift. Here are ten facts about rail electrification.
1 More Affordable Electric trains are cheaper to purchase (≈19%), maintain (≈30%) and power (≈45%) as compared to diesel trains7, and in relation to battery and hydrogen the comparison is even wider. Lighter axle loads of electric-only trains mean less track maintenance work is needed, resulting in better track reliability. Track maintenance costs are approximately 10% cheaper on an electric route than on a diesel/bimode route. Over a 30-year vehicle life, these savings total £2-3 million per vehicle3
2 More Energy Efficient Electric trains draw energy directly from the grid to power an electric motor. As a result, they are almost three times more energy efficient than diesel or hydrogen, and 1.2 times more energy efficient than battery electricity8. Simply put, a hydrogen train needs almost three times more electricity to produce hydrogen than is required to run an electric train. Moreover, electric trains can recover energy from braking (regenerative braking) and feed it back into the grid or directly to nearby trains, providing typically 20% of the train's energy consumption9. Bi-mode trains cannot currently do this when running in diesel mode. Wasting this potential energy decreases the efficiency of bi-mode trains when operating in diesel mode. The extra power of electric traction offers significantly higher performance and results in improved passenger services at a lower energy cost.
3 More Reliable
Electric trains are 40% more reliable on long-distance routes and can be 300% more reliable for suburban routes than diesel trains2. Moreover, electric trains are also faster than diesel/bi-mode trains and have superior braking and acceleration, allowing reduced journey times and increased route capacity10
4 More Environmentally Friendly Electric traction provides a longterm solution to air-quality issues. Diesel trains generate soot and particulates, often not visible. For example, Birmingham New Street platforms 10/11 exceeded recommended levels of NO2 on 1,079 occasions during the 3-month test period run by the University of Birmingham11. Along with other air pollutants, NO2 harms our lungs and is especially damaging for people who work or live near stations or in areas where trains accelerate5 . Electric trains are emissions free at the point of use. Moreover, many diesel trains only use friction brakes (like a car/lorry) to slow the train. This form of braking wears the discs and pads, releasing many tonnes of particulate dust into the atmosphere. Electric trains predominantly use their motors in regeneration mode to slow the train, producing zero particulates.
5 Lower Embedded Carbon
Embedded carbon is generated from the construction of electrification infrastructure, 340 Mt CO2e for the materials required to electrify one mile of a single-track railway. However, electric trains running under that infrastructure have 76% lower carbon emissions than diesel4. Even when using the existing generation mix, the estimated carbon payback period of electrification is 4 years4. The payback period will be considerably shortened when renewables generate more electricity in the UK. Pure electric trains also remove the environmental issues around battery production and recycling.
6 Less Noise Pollution
Diesel trains generate noise from the engine, transmission vibration, fans, brakes, cooling system and exhaust. Electric trains are significantly quieter than diesel trains, especially at stations. For example, the standstill noise of a typical electric multiple units is 68 decibels, the equivalent of an everyday conversation. A typical diesel multiple units is 73 decibels, the equivalent of an alarm clock12 Noise reduction helps surrounding communities and improves the atmosphere in stations, making them more pleasant. Passengers also enjoy a quieter experience during their journey10
12
7 Greater capacity
A vehicle’s power and range are limited by the amount of energy it stores and the capacity of its power plant. The available space on the train limits the size of this plant. Thus, electric trains can have more seats than diesel/bi-mode/hydrogen/ battery trains of the same length, as they do not require additional on-board fuel storage. For example, after the Great Western electrification, the electric multiple units have 27% more seats than the diesel units they replaced. For intercity trains on the route, there were 47% more seats without the need for lengthening platforms13 Due to the high-power requirement of freight locomotives, there is insufficient space to fit traction batteries or store hydrogen within locomotives.
8 No Fuel Logistics
Electrification, once installed, is a fixed asset, requiring minimal maintenance. Diesel/bi-mode/ hydrogen trains require fuel stores in depots and a network of regular lorry deliveries to sustain them. As a result, electrification reduces heavy road traffic and additional emissions.

9 Known and Tested Technology
Overhead electrification has been installed in the UK for more than 100 years and has achieved technological maturity14. Its performance, safety and reliability are well understood and continue to improve. The laws of nature make electrification a futureproofed technology that is a good investment, offering many passenger, freight and operational benefits.
10 Future proof
Electric trains are more independent of global socio-economic (i.e., fuel shortages) and geopolitical situations as electricity can be sourced from a diversified grid. Electricity can be entirely sourced from renewables, further reducing emissions.
ELECTRIC TRACTION PROVIDES A LONG-TERM SOLUTION TO AIR-QUALITY ISSUES
13
1.2 PROBLEM STATEMENT
Even a fully electrified transport sector is still exposed to many kinds of weather – and climaterelated risks that may have a substantial impact on railway assets. Anthropogenic climate change is increasing global surface temperatures. Some effects are already visible in all regions of the globe, meaning that today's observed ‘extreme’ weather could become tomorrow's ‘normal’ weather. With the current IPCC predictions, we expect hotter, drier summers, warm wet winters, more extreme storms and heavier snowfalls that will impact existing and future railway systems15 .
The duration, magnitude, scale and frequency of the risks are projected to increase and worsen. When designing systems expected to last more than 80 years, we should consider how we can make rail electrification more resilient to climate change. Railways must be resilient and recover quickly to continue operating under future conditions.
The rail infrastructure – from the overhead electrification to the tracks, distribution equipment and even plant – is at high risk of being affected by climate change and associated extreme weather. Options for ensuring that rail infrastructure continues to operate safely and reliably in extremely hot weather, particularly overhead line equipment and track, need to be investigated.
Climate-induced extreme weather, ranging from warm to cold, calm to windy, and wet to dry poses significant challenges12. An asset failure can result in casualties, high replacement costs (civil engineering infrastructure items such as bridges and tunnels are often too expensive to replace, resulting in long-term closures), extended service interruptions and reputational damage. For example, on 12 August 2020 at Carmont near Stonehaven, a passenger train derailed, killing three people, due to heavy rainfall that had washed debris onto the track16 .
A study by Wang et al.17, 18 found that climate-related studies on transport infrastructure tend to focus on short-term climate threats. In transport sectors such as ports and roads, but not yet in the rail sector, previous studies have made similar observations19
According to a rail stakeholders' climate risk-assessment survey, fewer than half of UK rail stakeholders who have no developed climate-adaptation plan acknowledge that they will need to consider developing one in the future17. The railway industry in Great Britain has already introduced some measures to mitigate climate change. For example, Network Rail has published climate change adaptation plans for all routes. This paper aims to identify the impact of climate change on OEAs, to evaluate current practices, and to provide a number of recommendations for existing and future electrification projects.
14
1.3 SCOPE
The scope of this study is to identify climate change-related hazards to electrification equipment and investigate immediate preventative measures to make rail overhead electrification more resilient to climate change in the future. While climate change resilience of other rail assets plays a crucial role, the detailed assessment of it is outside the scope of this paper, which focuses on UK-specific climate change recommendations. However, some of the measures can be applied internationally.

1.4 WHAT IS CLIMATE CHANGE RESILIENCE?
In a railway system, resilience can be defined as the ability of the system to provide adequate service in normal conditions and during disruption. In a comprehensive system, resilience encompasses the following characteristics: vulnerability, survivability, response and recovery (Figure 1).
Railway system robustness is the ability to mitigate the effects of daily disruptions in railway operations. Robustness in the context of railway electrification refers to the asset's resistance to disruption. The main goal of resistance is ‘to prevent damage or disruption by providing the strength or protection to resist the hazard or its primary impact’. For example, this can include the installation of lightning protection, appropriate maintenance practices and seasonal preparedness.
Disruptions occur when railway traffic is disrupted from a steady state, and it can last anywhere from a few hours to several days, depending on its nature. When the disruption event occurs, the vulnerability determines how the disruption affects the system's performance. Vulnerability can be defined as ‘system susceptibility to the disruption that can result in a considerable reduction in network serviceability’21. Although this definition has been used in terms of a road network, it still applies to railway electrification. It is possible to consider robustness as a counterpart to vulnerability in general transport systems. While electric railways are more reliable than other transport systems, developing system robustness supports a resilient railway. Developing system robustness through appropriate maintenance practices can reduce vulnerability. However, the increase is unavoidable with increased asset age.
Survivability refers to the ability of the system to transit from its planned/normal state to its disrupted or degraded state. When a disruption occurs, the system may degrade in different ways, such as failing entirely at once or gradually reducing performance until eventually reaching its disrupted steady state. For example, all trains will stop with a total power outage, and performance will equal 0%. When a single link in the network fails, it may take substantial time before the system reaches the disrupted steady state.
The set of immediate actions taken after the disruption has occurred is defined as a response. Depending on the severity of the disruption, those actions can vary from ensuring public safety and notifying emergency services to providing alternative travel options to reach destinations or the best level of service. The nature of the disruption, network preparedness and efficacy of contingency plans determine the duration of the response. To mitigate disruptions, infrastructure can be enhanced with new links and nodes, particularly the most vulnerable items.
However, if mitigations are considered impractical when disruption effects are expected, and mitigation is too costly, preparedness is considered instead. Preparedness strategies and response actions are planned in advance, as already happens on the UK railway. However, future, longterm preparedness needs to take cognisance of climate change.
A system's ability to recover from a disrupted state is known as its recovery. After a disruption, recovery can take anywhere from a couple of hours (e.g., due to a train malfunction) to multiple weeks (e.g., due to extensive wind damage, landslide, or severe flooding). Some states of resilience may be overlooked during specific disruptions or disasters. For example, railway traffic can be disrupted entirely after a large earthquake, leaving no chance of recovery. It is also possible for a system to begin recovering immediately after a smaller disruption, such as a power outage. It is also conceivable to consider survivability as part of the response, while in other cases it is part of the recovery phase.
16
Disruption Event Survivability Response Recovery Robustness Vulnerability 100% Time System Performance £120 £140 Figure 1 Railway system resilience20
1.5 CASE STUDIES
There is already clear evidence of climate change's destructive impact on the UK’s rail infrastructure. The weather-related incidents and the costs, including missed targets, repairs and socio-economic costs, add up to an average of £200-300 million per year22. The total cost of weatherrelated impact over the last 15 years has been estimated to be more than £3 billion. Figure 2 illustrates the cumulative cost distribution of the weather, based on weather hazards from 2006 to 2021.
Wind and flooding incidents had the most significant impact, contributing approximately 49% of the total weather-related cost over the last 15 years. Cold- and snowrelated disruptions contributed approximately 19%, while adhesion contributed 10% of the cumulative cost. Subsidence, heat-related incidents and lightning strikes contributed 10%, 7% and 5%, respectively. Finally, fog-related incidents had the lowest impact, less than 1% of the total contribution. Figure 3 illustrates a more detailed breakdown of Schedule 8 weatherrelated disruption cost per year from 2006 to 2021.
Due to the increase in ambient temperature, as well as an increased number of hot spells over the recent couple of years, heat- and subsidence-related costs have dramatically risen. While the cold and snow-related costs decreased, due to the warm wet winters, the number of flooding incidents and their cost escalated. The larger impact of extreme storms can also be observed. The following case studies illustrate the emerging effects of climate change on UK OLE performance.
17
Disruption Event Survivability Response Recovery Robustness Vulnerability 100% Time System Performance £0 £20 £40 £60 £80 £100 £120 £140 2006-2007 2007-2008 2008-2009 2009-2010 2010-2011 2011-2012 2012-2013 2013-2014 2014-2015 2015-2016 2016-2017 2017-2018 2018-2019 2019-2020 2020-2021 Millions Adhesion Adhesion 11% 5% 26% Cold Flood Fog Heat Lightning Snow Subsidence Wind Total Survivability Response Recovery Time £0 £20 £40 £60 £80 £100 £120 £140 2006-2007 2007-2008 2008-2009 2009-2010 2010-2011 2011-2012 2012-2013 2013-2014 2014-2015 2015-2016 2016-2017 2017-2018 2018-2019 2019-2020 Millions Adhesion Adhesion 11% 5% 23% 7% 5% 14% 10% 26% >1% Cold Cold Flood Flood Fog Fog Heat Heat Lightning Lightning Snow Snow Subsidence Subsidence Wind Wind Figure 2 Cumulative Schedule 8 category cost distribution for the years 2006-2021 Figure
8
cost per year from 2006 to 202122
3 Schedule
weather-related
1.5.1 JULY 2019 HEATWAVE

On 25 July 2019, we recorded one of the hottest days up until that time in the UK, with a temperature of 38.7 °C23. The temperature was above the upper operating temperature limit for many legacy electrification systems (-18°C to +38 °C) and, combined with solar gain, resulted in 34 failures and incidents related to the OLE.

On 25 July, the track temperatures reached critical values. To minimize the risk of buckling, Network Rail began painting railway tracks white, imposing speed restrictions and cancelling certain services24 . After the extreme heat and storms caused severe disruption to the rail network and airports, Greater Anglia, Southeastern and East Midlands train operators advised against all but essential travel25, 26, 27. Due to electrification equipment failures, a passenger train became stranded near Peterborough for three hours, exposing passengers and staff to heat-related hazards as a result of being contained in unventilated carriages for long periods of time.
On the following day, due to overhead wire damage caused by the previous day’s heat, East Midlands train services were disrupted between London St Pancras, Derby, Sheffield and Nottingham.

A PASSENGER TRAIN BECAME STRANDED NEAR PETERBOROUGH FOR THREE HOURS

According to the Office of Rail and Road (ORR), the primary cause of electrification equipment failures was heat-induced sagging of FT conductors, balance weight defects, and excessive differential along track movement of conductors. Hotweather vulnerability was attributed to asset age and inadequate maintenance. In particular, FT equipment is a legacy asset that is no longer installed on main lines in the UK. With some FT equipment operating continuously for more than 50 years without adequate maintenance or renewal, the assets were more susceptible to harsh environmental effects, such as hot weather28. Some FT equipment, such as ex-DC equipment, requires speed restrictions from as low as 26°C.

18
Figure 4 Sagging conductors at Auston (left), stretched jumper hanging foul of gauge at the overlap (centre) and entangled pantograph head at Patrick Viaduct (right)
1.5.2 FEBRUARY 2022 STORMS DUDLEY, EUNICE AND FRANKLIN
In February 2022, a cluster of three storms occurred in the UK, which caused significant damage to railway assets over five days. As a result of these major storms, Dudley, Eunice and Franklin, there were red warnings, gales, rains and snow, and England's highest-ever gust of 122mph was recorded at the exposed Needles lighthouse. All services in or out of major London stations were suspended29

Dudley and Eunice severely damaged several overhead lines, causing trees and other debris to fall on them. After a large tree tore down the overhead wires at St Albans in Hertfordshire on Wednesday, 16 February, the line was closed for two days. After 11pm on Wednesday, a tree was removed, but engineers could not complete the work until calmer conditions prevailed29
The high-speed winds caused extensive damage to electrification equipment in Beattock in Dumfries and Galloway. Due to the strong wind, trees were uprooted onto the electrification equipment, one of which caught fire from an electrical discharge (Figure 6).


High wind speeds also affected stations and buildings. During a windstorm in Banbury, Oxfordshire, the depot's roof was ripped off, falling onto the nearby track, causing services to be suspended.
DUE TO THE STRONG WIND, TREES WERE UPROOTED ONTO THE

ELECTRIFICATION EQUIPMENT
19
Figure 5 OLE damage at St Albans during the storms 29
Figure 6 Tree catching fire at Beattock 29

1.5.3 JULY 2022 HEATWAVE
Although the probabilistic predictions of climate change in the UK Climate Projections 2009 (UKCP09) suggested the possibility of an increase in maximum ambient temperature to 40°C, until recently this was not expected to occur in the first half of the twenty-first century. With the temperature in the heatwave rising to its peak, transport was one of the leading public services affected by the extreme heat. Speed restrictions across the country had been implemented due to the Met Office’s first-ever red weather warning for hot weather30 .
Railway and other public transport services were reduced, with the trains running slower due to fears that the tracks could buckle under the extreme heat. It is worth noting that the newer electrified lines (i.e., HS1, Great Western or the newer sections of Midland Mainline) did not suffer any notable reliability issues, as their design temperatures were higher, and the state of design compliance overall was better than other historical electrification systems.
As temperatures across the UK reached a record high of 40°C, railway lines across the country were closed because of fears of track instability31. Similar to the 2019 heatwave, several major disruptions occurred:
È Due to the red weather warning, the East Coast Main Line was forced to close for all locations between London King's Cross and York and Leeds on Tuesday afternoon.
È The Gatwick Express was not running.
È The situation was exacerbated when trains between London, Euston and Milton Keynes were suspended due to a line fire, while a power failure stopped all trains at Birmingham New Street Station.
È Fire on the land next to Hatch End station meant trees took down the overhead line. All London Euston to Milton Keynes services were suspended32 .

È National grid lines fell on railways in Hampden Park.

È Manchester to Hadfield/Glossop was closed because of excessive sag of FT equipment. The route uses ex-DC equipment, such as had been used on the old GE Route but which has since been replaced with GEFF.
È The single-wire runs failed between London and Chelmsford on GE that had yet to be renewed, causing significant disruption.
Since those events, Network Rail has announced it has launched a new task force31, led by independent experts, to investigate and make recommendations on developing its resilience approach during hot weather. The Resilience Task Force will examine four key areas, each led by an independent expert from the field. These areas are: the likelihood of more frequent extreme heat events; railway infrastructure reliability; operational standards; and the way in which Network Rail communicates with passengers during such events33
21
Figure 7 Tree falling onto railway due to lineside fire at Euston, and dewirement at Stratford caused by extreme heat
NATIONAL GRID LINES FELL ON RAILWAYS IN HAMPDEN PARK
CLIMATE CHANGE PREDICTIONS AND THEIR IMPACT ON ELECTRIFICATION


2.1 GLOBAL PREDICTIONS
The Intergovernmental Panel on Climate Change (IPCC) is a joint effort by scientists globally to predict climate change scenarios, based on scientific evidence and climate models developed over recent decades. The IPCC Sixth Assessment Report 34 provides the currently most accurate, up-to-date climate predictions, showcasing future warming trends and the impact on diverse physical components in the earth system, highlighting the urgent need for adaptation and mitigation to combat climate change.
Projections of global temperature increase are based on the shared socio-economic pathways (SSPs). Each of the pathways represents a different GHG emissions scenario, reflecting the different policy measures being taken and technological developments formulated.


Key findings of the report include, in the highest-emissions scenario, a close to 5°C temperature increase by the end of the century compared to pre-industrial levels. The global temperature increase will lead to more frequent extreme events, such as wildfires and droughts (high confidence), which will be particularly relevant in currently dry regions.
Figure 8 IPCC maximum temperature change predictions under high-emissions scenario relative to a pre-industrial baseline. Obtained from ICPP Interactive Atlas35


On the other hand, tropical regions will likely experience less frequent yet heavier precipitation. In relation to this, monsoons and tropical cyclones are projected to be more intense and disastrous. Small island states and coastal regions are experiencing and will increasingly suffer under sea-level rise (high confidence).
The report also draws on the fact that climate change will exacerbate heat-related human health risks, as well as pushing beyond the ability to adapt of an increasing number of species.
All these findings call for urgent action for mitigation and adaptation to prevent largescale biodiversity loss, habitat displacement and further economic losses due to natural disasters.
The short-term global predictions include a rise of about 1.5°C in the average winter temperature and 2.5°C in the average summer temperature, an increase of around 15% in the amount of winter rainfall, a decrease of about 25% in the amount of summer rainfall, and a return period of about 20 years. There will be an increase in daily rainfall of 10-15% in the winter and a decrease of about the same amount in the summer. There will be a 5% increase in 20-year average wind speeds in the winter and a 5% decrease in wind speeds in the summer36
24
Mean temperature ° C 1950 1965 1980 1995 2010 2026 2041 2056 2071 2086 2100 Year -5 0 5 10 15
Dotted line: Model Solid line: P50 (Median) Gray shading: Selected period Light / dark area: Spread P10-P90 / P25-75
Figure 8 IPCC maximum temperature change predictions under high-emissions scenario relative to a pre-industrial baseline. Obtained from ICPP Interactive Atlas 35
2.2 UK CLIMATE CHANGE PREDICTIONS
Climate change observations and forecasts specific to the UK are provided by the UKCP18 project, which uses state-of-the-art climate science. By extending UKCP09, the project provides an assessment of how the UK climate may change in the twenty-first century.
A 60km-scale global climate projection is provided in the UKCP18, while a 12km-scale UKCP18 provides a spatially coherent climate prediction for the UK. This model can generate high-resolution 12km-scale climate projections for the UK. Further downscaling of the 12km climate model has enabled realistic simulations of events with high impacts, such as localised heavy rainfall during the summer. Updates have also been made to the marine projections of sealevel rise and storm surges.
The figures in this section were created using the UKCP18 User Interface37. The results are displayed at three percentiles of probabilistic levels (see Figure 9):
È 10th – very unlikely to be less than
È 50th – central estimate
È 90th – very unlikely to be greater than.
Figure 9 UK annual temperature difference in very optimistic and worst-case scenarios. Obtained from Met Office UK climate projections38 .
The results were plotted for two socio-economic scenarios (representative concentration pathways) based on a different amount of radiative forcing (W/m²):
È RCP 2.6 – very optimistic scenario (1.5 - 2.5°C increase in global temperature). According to the IPCC, this scenario requires the CO2 emissions to have started declining by 2020 and be eliminated by the 2100s. It should be noted that the UN Environment Programme has stated there is no longer a credible pathway to achieve this39
È RCP 4.5 – intermediate scenario (2.5 - 3.5°C increase in global temperature) where the emissions achieve a peak around 2040 and decrease to 0 by the 2100s.
È RCP 8.5 – usually considered the worst-case scenario (>5°C increase in global temperature), yet still plausible.
25
Temperature change ˚ C Year Annual, RCP2.6 -1 0 1 2 3 4 5 6 7 1975 2000 2025 2050 95th Obsevations 90th 75th 50th 25th 10th 5th 2075 2100 Temperature change ˚ C Year Annual, RCP8.5 -1 0 1 2 3 4 5 6 7 1975 2000 2025 2050 2075 2100 Mean temperature ° C 1950 1965 1980 1995 2010 2026 2041 2056 2071 2086 2100 Year -5 0 5 10 15 Dotted
Temperature change ˚ C Year Annual, RCP2.6 -1 0 1 2 3 4 5 6 7 1975 2000 2025 2050 95th Obsevations 90th 75th 50th 25th 10th 5th 2075 2100 Temperature change ˚ C Year Annual, RCP8.5 -1 0 1 2 3 4 5 6 7 1975 2000 2025 2050 2075 2100 Mean temperature ° C 1950 1965 1980 1995 2010 2026 2041 2056 2071 2086 2100 Year -5 0 5 10 15 Dotted
line: Model Solid line: P50 (Median) Gray shading: Selected period Light / dark area: Spread P10-P90 / P25-75
line: Model Solid line: P50 (Median) Gray shading: Selected period Light / dark area: Spread P10-P90 / P25-75
Figure 9 UK annual temperature difference in very optimistic and worst-case scenarios. Obtained from Met Office UK climate projections. 38
2.3 TEMPERATURE

26
2.3.1 MAXIMUM AMBIENT TEMPERATURE
By the end of the twenty-first century, all areas of the UK are projected to have an increase in maximum temperature 40 .
According to UKCP18, the most probable (50th percentile) seasonal average maximum air temperature at 1.5m will increase by 2-3°C under a low-emissions scenario (RCP 2.5) and even up to 6°C under a heavy-emissions scenario (RCP 8.5) compared to the 1981-2010 baseline. Apart from the general increase in the failure rate of rail assets in high temperatures 41,19 and rail buckling 42, extreme heat can be exceptionally damaging to electrification assets.
27
Maximum air temperature
1.5m (°C) -1 0 1 2 3 4 5 6 7 8 10th Percentile RCP 2.6 50th Percentile 90th Percentile 10th Percentile RCP 4.5 50th Percentile 90th Percentile 10th Percentile RCP 8.5 50th Percentile 90th Percentile
Figure 10 UKCP18 projections of summer (June-July-August) maximum air temperature anomaly in the 2080s, relative to a 1981-2010 baseline, under the RCP 2.6, 4.5 and 8.5 emissions scenarios (lower maps). Results are shown at three percentiles: 10th (left), 50th (middle) and 90th (right). Obtained from UKCP User Interface 37
anomaly at
2.3.1.1 ELECTRIFICATION FAILURE MODES
Failure of electrification assets during extreme temperature events is attributed to high ambient temperatures, solar gain, low wind speed, humidity, train dynamic effects and traction current heating28. Increased power demand in peak temperature can be observed due to the higher hotel loads associated with passenger comfort, such as air conditioning. Those characteristics cause electrification equipment to expand and sometimes sag43, resulting in multiple risks and failure modes. According to Palin et al.44, in southeast England the projected increase in the number of daily occurrences associated with the overhead line sag is in the magnitude of 200600% by the 2040s, compared to the 1980s.
Tension in the wires keeps the equipment at a fixed level above the tracks, minimising sag. In extreme heat, sag can become so excessive that it creates a risk of flashover to the train's roof. Those events are more likely with legacy FT equipment, as a lack of self-tensioning capabilities causes a significant drop in wire tension. However, it is still theoretically possible for auto tensioned (AT) equipment (either balance weight or Tensorex) to lose tension when combined with other failure modes in extreme weather events.
To maintain constant contact with the overhead line and provide uninterrupted current flow to the locomotive, the train’s pantograph acts with a pre-set force (typically at 90N). Extreme heat can cause poor dynamic performance and poor current collection at the pantograph. Considering the dynamic system as a whole, the sagged line introduces uneven stiffness distribution between droppers (supporting wires between primary conductors) and uneven mass distribution due to the droppers themselves46. The forces are unbalanced and cause excessive contact wire uplift on sagged FT lines, which generates a variation of the contact force and oscillations in the system. This in turn results in poor dynamic performance of the pantograph, poor current collection, sparking and, in extreme cases, failure. Excessive uplift increases the risk of pantograph hook-over on the sagged adjacent FT lines, such as midpoint anchor wires.
Moreover, when the pantograph travels along the contact wire or enters a new section, it generates travelling waves. These waves travel faster than trains in both directions and are reflected at the wire ends to meet or to catch up with the pantograph47. Excessive line sag results in lower frequency vibrations and, combined with pre-existing contact wire irregularities, causes much more significant contact force amplitude variations48
The results are a higher wear rate of the pantograph, more stress on the droppers, registration arms and insulators, and even loosening of the fasteners. Furthermore, the high amplitude vibrations intensify any pre-existing fault in the system, which can result in catastrophic failures. Hence, in extreme heat events, services are suspended or running at limited capacity, with significant speed restrictions on FT lines and even on AT systems when they reach their limits. High ambient temperature has also been identified as the leading cause of high-voltage insulator failure49. The mechanical stresses caused by low-frequency vibration are the primary source of micro-crack growth.
Finally, the existing infrastructure is already close to the electrification equipment at some locations. While safety precaution measures are taken, and the electrification equipment is designed to have minimum electrical and mechanical clearances from these structures, unprecedented weather conditions may reduce those clearances. For example, sagging national grid and power distribution lines and their failure (due to insulator failure, electrical overload or lightning discharge) are more likely to breach electrical clearances of the rail electrification equipment and lead to a catastrophic failure of both systems.
28
Figure 11 Elevation of a typical electrification system. Obtained from Network Rail, ‘A Guide to Overhead Electrification’, produced by Alan Baxter 45
Temperature change C Year Catenary Droppers Pantograph Approx 1.3m Typically ~50m Catenary Wave Excitation Wave Diffracted Wave Reflected Wave Catenary Wire Droppers Contact Wire OLE Supports Contact Wire (25,000V) Annual, RCP2.6 -1 0 1 2 3 4 5 6 7 1975 2000 2025 2050 95th Obsevations 90th 75th 50th 25th 10th 5th 2075 2100 Temperature change C Year Annual, RCP8.5 -1 0 1 2 3 4 5 6 7 1975 2000 2025 2050 2075 2100 Mean temperature ° C 1950 1965 1980 1995 2010 2026 2041 2056 2071 2086 2100 Year -5 0 5 10 15 Dotted line: Model Solid line: P50 (Median) Gray shading: Selected period Light / dark area: Spread P10-P90 / P25-75 Pantograph Temperature change C Year Catenary Droppers Pantograph Approx 1.3m Typically ~50m Catenary Wave Excitation Wave Diffracted Wave Reflected Wave Catenary Wire Droppers Contact Wire OLE Supports Contact Wire (25,000V) Annual, RCP2.6 -1 0 1 2 3 4 5 6 7 1975 2000 2025 2050 95th Obsevations 90th 75th 50th 25th 10th 5th 2075 2100 Temperature change C Year Annual, RCP8.5 -1 0 1 2 3 4 5 6 7 1975 2000 2025 2050 2075 2100 Mean temperature ° C 1950 1965 1980 1995 2010 2026 2041 2056 2071 2086 2100 Year -5 0 5 10 15 Dotted line: Model Solid line: P50 (Median) Gray shading: Selected period Light / dark area: Spread P10-P90 / P25-75 Pantograph
Figure 12 Wave propagation in OCS caused by pantograph movement. Adapted from Song et al.50
2.3.2 INCREASED NUMBER OF HOT SPELLS
Hot spells can be defined as two or more consecutive days where the maximum daytime temperature exceeds 30°C. Until recently, they have been confined to the southeast regions of the UK. According to UKCP Global (60km), Regional (12km), and Local (2.2km), soil moisture during summers will decrease in the future, consistent with reduced rainfall during summer. The number of hot


spell occurrences has significantly increased over the last 70 years (Figure 13). It is expected to rise to an average of 4.1 occurrences per year by 2070, according to UKCP Local (2.2km)40,51. The severity of hot spells could be exacerbated locally, but large-scale warming and circulation changes are primarily responsible for increased hot spell occurrence.

29
Figure 13 UK hot spell occurrence count for years 1948–2021 Source:
CEDA Archive52
0 1 2 3 4 5 6 1948 1951 1954 1957 1960 1963 1966 1969 1972 1975 1978 1981 1984 1987 1990 1993 1996 1999 2002 2005 2008 2011 2014 2017 2020 Hot Spell Occurrence Count Year Winter 5-year Moving Average 24H Temperature Variation (°C) for years 1948-2021 Hot Spell Count Moving average over 6 years Spring 5-year Moving Average 24H Temperature Variation (°C) for years 1948-2021
2.3.2.1 ELECTRIFICATION FAILURE MODES
Electrification assets are particularly vulnerable, as prolonged thermal loading causes additional stress to the tensioning equipment. Limited self-cleaning of the insulation can lead to the build-up of particles, resulting in arcing and damage to electrification equipment. Some investigations showed that insulator failure caused by particle build-up is much more significant during dry pollution periods than wet53. As a result, leakage current is more likely to occur with the first appearance of rain or fog after periods of drought. Moreover, the increased ambient temperature leads to increased hotel load (lights, air conditioning, toilets, etc.) on the train, which results in higher current draw and current heating of the wires.
Climate change could also lead to more frequent lineside railway fires, significantly damaging electrification, signalling, telecommunications and other railway assets. In particular, grassy areas with dead or dry vegetation and areas covered with dry, easily flammable litter are vulnerable54
Failure of electrification assets can leave trains stranded for hours. Without power, it is impossible to control carriage temperatures, exposing passengers and staff to heat-related risks. Moreover, the response and recovery of the system are highly affected, as it poses a significant risk of heat exhaustion and heat stroke to the maintenance and operational staff. Many heat-related fatality incidents have been identified in the United States55. As the UK experiences higher temperatures in the future, more heat-related fatalities can be expected.
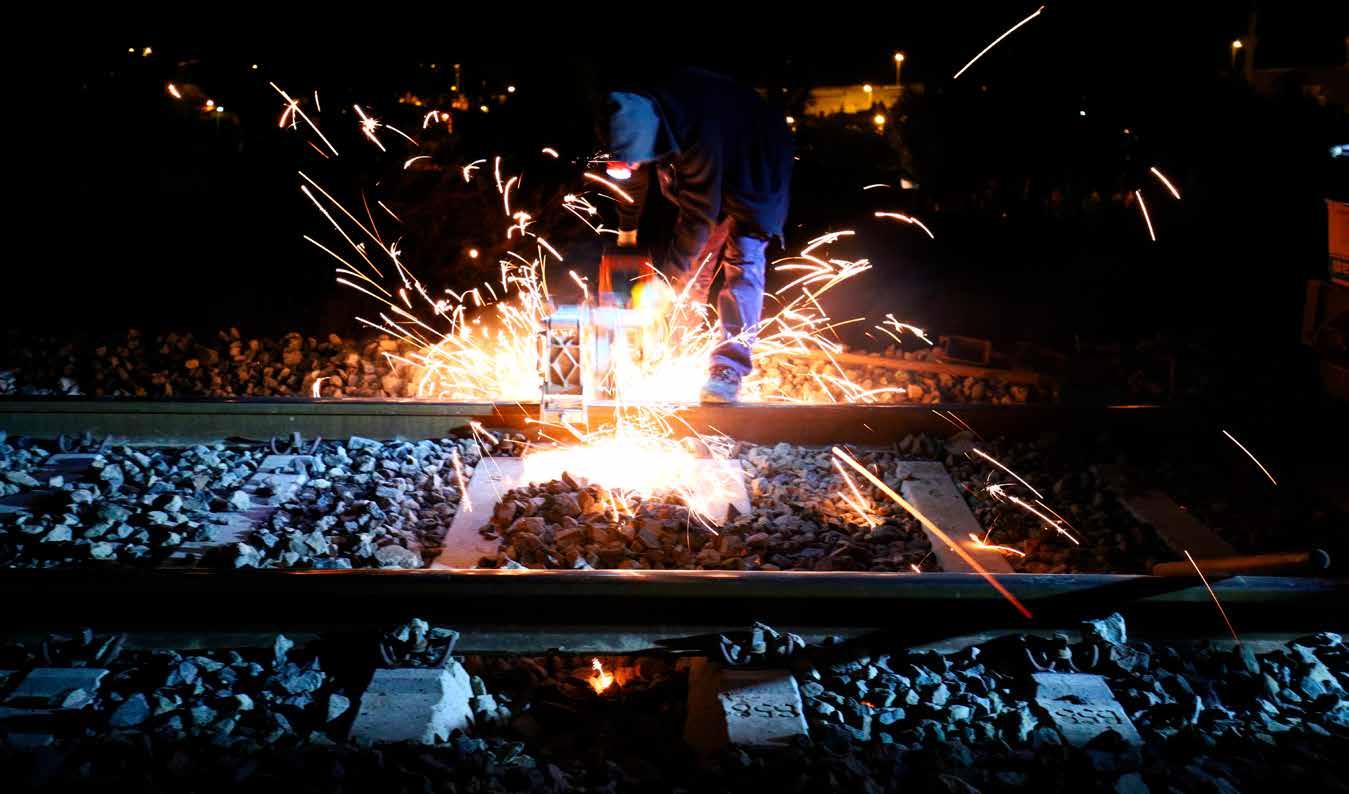
The electrification equipment may become too hot to touch, forcing maintenance and recovery operations to be conducted at night. Maintenance and operational staff heat exhaustion may lead to increased human error and inadequate quality of the tasks56
An extensive period of drought may also lead to earthworks failure due to desiccation and ground swell43,19,54, which can lead to unstable foundations, excessive mast leans and excessive overhead line stagger and sag. To ensure safe operation, more structures will need to be replaced.
Finally, periods of drought also result in increased earth resistance which can lead to higher touch potentials of voltage levels. Network Rail does not actively monitor voltage levels or earth-rod resistances, so there are currently no records of how widespread this problem is.
30
2.3.3 DIURNAL AIR TEMPERATURE VARIATION
Figure 14 illustrates the 5-year moving average of the maximum recorded diurnal temperature variation for a specific month for the years 19482021. A clear seasonal pattern in temperature variations can be observed. Spring and summer (Figure 14b, Figure 14c) have a much higher temperature variation than autumn and winter (Figure 14a, Figure 14d). Moreover, in the last couple of years, there was a significant increase in diurnal temperature variation from April to September.
A CLEAR SEASONAL PATTERN IN TEMPERATURE VARIATIONS CAN BE OBSERVED
31
0 8 10 12 14 16 18 1 2 3 4 5 6 1948 1951 1954 1957 1960 1963 1966 1969 1972 1975 1978 1981 1984 1987 1953 1958 1963 1968 1973 1978 1983 1988 1993 1998 2003 2008 2013 2018 1990 1993 1996 1999 2002 2005 2008 2011 2014 2017 2020 Hot Spell Occurrence Count Year Winter 5-year Moving Average 24H Temperature Variation (°C) for years 1948-2021 Hot Spell Count Moving average over 6 years Jan Feb Dec 8 10 12 14 16 18 1953 1958 1963 1968 1973 1978 1983 1988 1993 1998 2003 2008 2013 2018 Summer 5-year Moving Average 24H Temperature Variation (°C) for years 1948-2021 Jun Jul Aug 8 10 12 14 16 18 1953 1958 1963 1968 1973 1978 1983 1988 1993 1998 2003 2008 2013 2018 Autumn 5-year Moving Average 24H Temperature Variation (°C) for years 1948-2021 Sep Oct Nov 8 10 12 14 16 18 1953 1958 1963 1968 1973 1978 1983 1988 1993 1998 2003 2008 2013 2018 Spring 5-year Moving Average 24H Temperature Variation (°C) for years 1948-2021 Mar Apr May 0 8 10 12 14 16 18 1 2 3 4 5 6 1948 1951 1954 1957 1960 1963 1966 1969 1972 1975 1978 1981 1984 1987 1953 1958 1963 1968 1973 1978 1983 1988 1993 1998 2003 2008 2013 2018 1990 1993 1996 1999 2002 2005 2008 2011 2014 2017 2020 Hot Spell Occurrence Count Year Winter 5-year Moving Average 24H Temperature Variation (°C) for years 1948-2021 Hot Spell Count Moving average over 6 years Jan Feb Dec 8 10 12 14 16 18 1953 1958 1963 1968 1973 1978 1983 1988 1993 1998 2003 2008 2013 2018 Summer 5-year Moving Average 24H Temperature Variation (°C) for years 1948-2021 Jun Jul Aug 8 10 12 14 16 18 1953 1958 1963 1968 1973 1978 1983 1988 1993 1998 2003 2008 2013 2018 Autumn 5-year Moving Average 24H Temperature Variation (°C) for years 1948-2021 Sep Oct Nov 8 10 12 14 16 18 1953 1958 1963 1968 1973 1978 1983 1988 1993 1998 2003 2008 2013 2018 Spring 5-year Moving Average 24H Temperature Variation (°C) for years 1948-2021 Mar Apr May 0 8 10 12 14 16 18 1 2 3 4 5 6 1948 1951 1954 1957 1960 1963 1966 1969 1972 1975 1978 1981 1984 1987 1953 1958 1963 1968 1973 1978 1983 1988 1993 1998 2003 2008 2013 2018 1990 1993 1996 1999 2002 2005 2008 2011 2014 2017 2020 Hot Spell Occurrence Count Year Winter 5-year Moving Average 24H Temperature Variation (°C) for years 1948-2021 Hot Spell Count Moving average over 6 years Jan Feb Dec 8 10 12 14 16 18 1953 1958 1963 1968 1973 1978 1983 1988 1993 1998 2003 2008 2013 2018 Summer 5-year Moving Average 24H Temperature Variation (°C) for years 1948-2021 Jun Jul Aug 8 10 12 14 16 18 1953 1958 1963 1968 1973 1978 1983 1988 1993 1998 2003 2008 2013 2018 Autumn 5-year Moving Average 24H Temperature Variation (°C) for years 1948-2021 Sep Oct Nov 8 10 12 14 16 18 1953 1958 1963 1968 1973 1978 1983 1988 1993 1998 2003 2008 2013 2018 Spring 5-year Moving Average 24H Temperature Variation (°C) for years 1948-2021 Mar Apr May 0 8 10 12 14 16 18 1 2 3 4 5 6 1948 1951 1954 1957 1960 1963 1966 1969 1972 1975 1978 1981 1984 1987 1953 1958 1963 1968 1973 1978 1983 1988 1993 1998 2003 2008 2013 2018 1990 1993 1996 1999 2002 2005 2008 2011 2014 2017 2020 Hot Spell Occurrence Count Year Winter 5-year Moving Average 24H Temperature Variation (°C) for years 1948-2021 Hot Spell Count Moving average over 6 years Jan Feb Dec 8 10 12 14 16 18 1953 1958 1963 1968 1973 1978 1983 1988 1993 1998 2003 2008 2013 2018 Summer 5-year Moving Average 24H Temperature Variation (°C) for years 1948-2021 Jun Jul Aug 8 10 12 14 16 18 1953 1958 1963 1968 1973 1978 1983 1988 1993 1998 2003 2008 2013 2018 Autumn 5-year Moving Average 24H Temperature Variation (°C) for years 1948-2021 Sep Oct Nov 8 10 12 14 16 18 1953 1958 1963 1968 1973 1978 1983 1988 1993 1998 2003 2008 2013 2018 Spring 5-year Moving Average 24H Temperature Variation (°C) for years 1948-2021 Mar Apr May Figure 14 24-hr seasonal UK maximum daily air temperature variations in 5-year moving average for years 1948-2021 at
A C B D
Heathrow. Source: CEDA Datasets52
2.3.3.1 ELECTRIFICATION FAILURE MODES
While the temperature variation has little to no effect on a steel support structure’s fatigue life57 , the difference above 1.5°C tends to result in relatively large along-track movements of the electrification equipment, which leads to excessive radial loads building up on parts of the system due to friction/drag in the system. Along-track movement is caused by wires above the track expanding and contracting in hot and cool temperatures.
Extreme along-track movement can also result in catastrophic failures of porcelain insulators in supporting wires, particularly those that are age-degraded and unable to withstand the increased radial loads applied to them.

For example, in 2018, during the early hot days (April–June), Network Rail recorded an 80% increase in asset failure58. More research is needed to identify the causality and understand the failure mechanics of the assets.
IN 2018, DURING THE EARLY HOT DAYS
NETWORK RAIL RECORDED AN 80% INCREASE IN ASSET FAILURE
32
2.4 INSOLATION (SOLAR RADIATION)
By the end of the century, under all emissions scenarios, solar radiation will likely increase by up to 10W/m² in England and Wales compared to the 19812000 baseline40. Short-wave radiation is a combination of visible light, UV and a limited portion of infrared energy.
2.4.1 ELECTRIFICATION FAILURE MODES
During extreme weather, a combination of high ambient temperatures and solar radiation can cause extremely high system temperatures, making maintenance impossible and resulting in increased conductor creep. Moreover, increased solar radiation results in a higher risk of skin cancer for maintenance staff and UV degradation of plastic products, e.g., insulators and cables. Even when the ambient temperature is below design limits, the solar gain could cause the system to exceed its allowable system temperature range. While it is already factored into the new electrification designs, increases in solar radiation (solar gain) have not been taken into account on many legacy systems.
33
10th Percentile RCP 2.6 50th Percentile 90th Percentile 10th Percentile RCP 4.5 50th Percentile 90th Percentile 10th Percentile RCP 8.5 50th Percentile 90th Percentile Net Surface short wave flux anomaly (W m-2) -30 -20 -10 0 10 20 30 40 50 60
Figure 15 UKCP18 projections of summer (June-July-August) net surface short-wave flux change in the 2080s, relative to a 1981-2010 baseline, under the RCP 2.6, 4.5 and 8.5 emissions scenarios. Results are shown at three percentiles: 10th (left), 50th (middle) and 90th (right). Obtained from UKCP User Interface37
2.5 PRECIPITATION

34
2.5.1 WARM WET WINTERS
The global (60km), regional (12km) and local (2.2km) projections provide a plausible prognosis for UK summer and winter precipitation. While the rainfall patterns in the UK vary across regions, an increased precipitation rate is expected during the winter season. This, combined with higher ambient temperatures, will lead to warm, wet winters that significantly increase the risk of flooding, earthwork deterioration and vegetation growth rate in the spring.
2.5.1.1 OLE FAILURE MODES
The intensification of heavy precipitation under future climate change will likely increase the costs to the UK transport network associated with flooding. Flooding can occur on railways when heavy rain overwhelms the drainage systems known as culverts, which can lead to damage to the earthworks. Moreover, heavy continuous rains damage the insulation equipment due to wet pollution53 and can cause power outages.
The prolonged precipitation, combined with high ambient temperature, leads to early-spring and high vegetation growth rates that increase bird and rodent activity levels, causing short circuits, particularly at limited clearance over bridges. The former is a particular problem in trough routes as it can cause damage to signalling, telecommunications, distribution and plant or SCADA cables. Moreover, the increased fauna activity limits the window between bird breeding seasons used for vegetation management.
10th Percentile RCP 2.6 50th Percentile 90th Percentile 10th Percentile RCP 4.5 50th Percentile 90th Percentile 10th Percentile RCP 8.5 50th Percentile 90th Percentile Precipitation rate anomaly (%) -80 -70 -60 -50 -40 -30 -20 -10 0 10 20 30 40 50 60
35
Figure 16 Average precipitation rate change for December/January/February in 2080 for a return period of rp100, using baseline 1981-2000 and scenario RCP 2.6, 4.6 and 8.5, respectively. Obtained from UKCP User Interface37
2.5.2 DRY STORMY SUMMERS
Although summer drought trends are expected to continue, UKCP Local (2.2km) data suggest heavy summer rainfall events will intensify in the future37. The increased cracking due to desiccation leads to increased water penetration and inflation during heavy rainfalls, resulting in a much higher risk of embankment collapse59,60,61
Slow-moving thunderstorms, combined with dry ground, result in increased severity of summer surface water flooding. For example, the Union Canal overtopped its embankment due to heavy rainfall east of Polmont, resulting in a breach 30m wide. As a result of the breach, floodwaters damaged Scotland's busiest railway line, the main line from Glasgow to Edinburgh via Falkirk High. The severe flooding washed out the entire pile foundations (Figure 17).
2.5.2.1 ELECTRIFICATION FAILURE MODES
Extensive drought periods combined with heavy rainfall can cause clay embankment shrinkage/swelling, leading to excessive mast lean, in turn resulting in excessive stagger, poor pantograph performance and potential dewirement.

SEVERE
2.5.3 SEA-LEVEL RISE
Under all emissions scenarios, the risk of coastal flooding is expected to increase over the twenty-first century and beyond. The frequency of extreme water levels, as well as their magnitude, is expected to increase around the UK coastline40 .
Coastal erosion and flooding, already major risks to rail infrastructure, will only increase in the future. With the sea-level increase in the 2100s, new areas will become at risk, hence careful consideration should be taken in planning railway lines in coastal regions. The highest projections are for London and Cardiff, though lower for Edinburgh and Belfast.
2.5.3.1 ELECTRIFICATION FAILURE MODES
The increased corrosion rates can be observed on all electrification components in coastal areas, leading to the asset’s indirect failure. Moreover, the salt residue build-up on insulators increases the risk of flashover, decreasing the insulator service life62


36
Figure 17 Collapse of embankment on the Union Canal in Scotland22
RCP 2.6 RCP 4.5 RCP 8.5 London 0.29-0.70 0.37-0.83 0.53-1.15 Cardiff 0.27-0.69 0.35-0.81 0.51-1.13 Edinburgh 0.08-0.49 0.15-0.61 0.30-0.90 Belfast 0.11-0.52 0.18-0.64 0.33-0.94
Table 1 Sea-level rise in metres around the year 2100 relative to the 1981-2000 baseline38
FLOODING WASHED OUT THE ENTIRE PILE FOUNDATIONS
2.6 EXTREME WINDS AND STORMS
As it is challenging to model future wind speeds, no figures can be cited, but the expected trends are increased gust speed and frequency of extreme storms18. Due to severe weather, such as heavy rain, thunder, lightning and strong winds, power lines are knocked down and damaged, objects are blown into overhead lines, and equipment and insulation are flooded28,29. Lightning strikes can also cause a power surge, disabling the network and leaving trains stranded30. Moreover, lineside trees struck by lightning often fall onto the electrification equipment, causing significant disruption.
Excessive wind loading on structures, such as masts and portals, poses significant risks, especially to legacy electrification assets, FT equipment and headspans. Higher wind speeds increase the loading of AT equipment, and extreme winds (especially crosswinds) can cause the contact wire to exceed allowable blow-off, leading to dewirement. Because of that, speed restrictions need to be imposed on all electric traction trains.

Finally, the UK has recorded on average 30 tornadoes a year63. Currently, most of them are short-lived in the UK, but their frequency and intensity could increase in the future. They are hard to predict, almost impossible to mitigate against and can cause significant localised damage to infrastructure.
2.7 ICE/SNOW
Freezing rain can lead to rapid ice build-up on wires and supporting structures64. This significant extra load can form, during high winds, into aerodynamic shapes that cause excessive movement of cables, leading to the failure of cables or junctions (Figure 18). However, the amount of lying snow across most of the UK will decrease by almost 100% by the end of the twenty-first century, with only a slight decrease in mountainous regions in the north and west40
A much more significant risk is the ice and snow build-up under structures and tunnels, bridging them and providing a conducting path, causing a flashover fault. Moreover, water penetrates the micro-cracks of porcelain insulators where it can freeze, causing the insulator to part66. Water will also seep into the crimped end fittings of registration arms/tubes where freezing can cause the tube to burst.

37
Figure 18 Damaged overhead lines and equipment during heavy icing in 2014, Slovenia65
EXCESSIVE WIND LOADING ON STRUCTURES, SUCH AS MASTS AND PORTALS, POSES SIGNIFICANT RISKS
2.8 SUMMARY OF CLIMATE CHANGE IMPACT ON ELECTRIFICATION
Increased ambient temperature
Overall, electrification asset failures are highly complex, and assigning them to one factor is difficult. Usually, it is a combination of outdated initial design parameters, asset age, maintenance frequency, and the quality and severity of weather events.
While heat contributes only 7% of the cumulative weather-related costs to Network Rail, it has the highest impact on the OLE. Figure 19 below summarises the impact of climate change on OLE assets.
È FT conductor sag
È Balance weight anchors, Tensorex and other tensioning equipment reaching its limit
È Increased air pollution causing increased corrosion and wear
È Temperature exceeding the range of systems
È Power lines sag, breaching electrification clearance
Increased number of hot spells
È Structures moving due to groundswell
È Limited self-cleaning of insulators
È Increased heat exhaustion of maintenance and operations staff
È Fires are more likely
È Increased hotel load on the train, causing extra traction current resulting in wire heating
Increase in diurnal temperature variations
Increased heavy precipitation
È Increased thermal loading on electrification components
È Increased ceramic insulator failure rate
È Weakened ground conditions
È Increased risk of earthwork failures and landslides
È Increased vegetation growth/management
È Increased corrosion rates
È Raised sea levels
Ice/snow
È Moving parts seize
È Increased structure load
È Conductors stretch with increased load-tensioning device reaching limits
È Icicles under bridges and in tunnels breaching electrical clearance
È Night shift extreme cold for staff
Insolation (solar radiation)
Storms/lightning strikes
È Too hot to touch electrification equipment, making maintenance impossible
È Increased conductor creep
È UV degradation of products made from synthetic materials, e.g., insulators, and cables
È Foundations wash-out
È Lightning protection conductors and surge arrestors needed
È Fire is more likely to cause a lot of damage
È DC stray-currents corrosion in hot, humid weather
È Changing wind speeds - and the wind returns impact on structure design
Extreme winds
È Trees and other objects falling on electrification equipment
È Increased wind loading
È Reduced electrical clearances from FT conductors (i.e., earth wires)
È Increased number of blow-off incidents when trains continue to run in spite of excessive wind speed
38
Figure 19 Summary of climate change hazards on the electrification project

39
CURRENT PRACTICES FOR OLE CLIMATE CHANGE RESILIENCE

‘BS EN ISO 14090: 2019 Adaptation to Climate Change – Principles, Requirements and Guidelines’ is the UK adaptation of ISO 14090.
This standard describes climate change adaptation methods, principles and requirements that can be adjusted within, as well as across, the organisation. The standards can be used to identify and understand climate change's impacts and uncertainties and inform decisions. It also provides a guideline for reporting and maintaining any adaptation actions implemented. Any organisation whose activities, products and services might be at risk of, or in some cases able to take advantage of, climate change can use this standard.
41
3.1 UK ELECTRIFICATION CLIMATE CHANGE RESILIENCE
Most rail adaptation efforts to address climate change have involved hard-engineering solutions – so-called ‘grey’ infrastructure –such as elevating stations, installing sea walls and pumps, and stabilising hillsides near rail lines. A study from Glasgow University was the first to examine industry efforts so far to harness NbS to avoid climate change-related disruption67. Rail infrastructure will deteriorate, safety risks will increase and operating costs will spiral if climate threats are not addressed, according to transport planning and civil engineering experts.
3.1.1 HOT WEATHER RESILIENCE
A 2013 study by Patin predicted that the sagging of overhead
lines would increase in a warmer climate68. Following this, Network Rail introduced a new policy requiring the use of AT fixings for new electrification equipment, which will significantly reduce the occurrence of line sag in future. However, this does not tackle the issue on legacy systems.
Network Rail’s Weather Resilience and Climate Change Adaptation Programme was established in early 2014, following the severe weather impacts of winter 2013/2014 (including the collapse of the Dawlish Sea Wall)69
In the 2020 LNE&EM Region Weather Resilience and Climate Change Adaptation Plan70, Network Rail outlined the key actions and

strategies to make the London North-eastern and East Midlands routes weather and climate change resilient. Considering the electrification assets, the main goal was to replace the headspans with mechanically independent structures, replace balance weights with Tensorex C+, and convert all FT equipment to AT.
Network Rail plans on creating a high-risk desiccation embankment register and carrying out surveys to monitor slopes known to be vulnerable. The train and freight operating companies also take action on this issue to equip trains better. A cyclic updating strategy with ring-fenced shifts is set to begin twice a year.
42
The railway industry in Great Britain has already introduced a wide range of measures to mitigate climate change's impact on railway systems.
3.1.2 VEGETATION MANAGEMENT
In response to failures, vegetation management schemes have been planned or implemented on all routes. However, those measures tend to focus on the system's survivability and shortterm mitigation, rather than on developing system robustness.
The current vegetation management practices consist of undertaking a complete hazardous-tree survey, removing all category 4-7 trees (high risk), and re-inspecting all categories 1-3 in the future. To increase resilience and passenger safety, Wessex has route-wide vegetation plans and tree surveys. By 2024, Wales aims to remove 100% of high-risk vegetation. On the Western route, LiDAR is used to survey vegetation on their assets and neighbours' lands to better manage the risk of falling vegetation.
Finally, in the Third Adaptation Report22, published in December 2021, Network Rail acknowledged the need for a more detailed assessment of the lineside tree species and vegetation plans to mitigate wind impacts.
3.1.3 HEAVY RAINFALL AND FLOODING RESILIENCE
In the Third Adaptation Report, Network Rail noted that improving rail resilience would be a substantial cost, taking many years to implement. The Wessex route has a drainage renewal and refurbishment programme on track to be delivered by 2024. It also has a £20 million programme to reduce track flooding and landslips at the highest-risk drainage locations. Re-engineering slope stabilisation on the Wales route has been done route-wide to improve drainage within tunnels and cuttings.
Furthermore, Julia Slingo has been appointed to run another weather action task force focused on ensuring that Network Rail has better visibility for rainfall risks72 The task force has explored and provided recommendations for how the railway could build its resilience in warm weather.

3.1.4 EXTREME STORMS
Lightning mitigation has been incorporated into signalling improvement schemes in London–North-east and the East Midlands. With the introduction of polymeric insulators in more modern electrification systems, there is no natural discharge point in the electrification system following a lightning strike. However, old systems still use porcelain insulators which are replaced with polymer only in the event of failure.
RAIL INFRASTRUCTURE WILL DETERIORATE, SAFETY
RISKS WILL INCREASE AND OPERATING COSTS WILL SPIRAL IF CLIMATE THREATS ARE NOT ADDRESSED
Moreover, train-mounted camera systems – Digitalised Lineside Inspection and Tree Risk Manager – are being developed to detect potential or actual vegetation encroachment to improve prevention and response capabilities. Developing a highwind alert process for buildings is also underway71. The south-east route has a rolling programme of inspections to identify and remove dying/diseased trees before they can damage assets. The current vegetation practice in north-west and central regions is to remove high-risk vegetation on high-risk routes. However, they aim to identify opportunities to increase biodiversity at the same time.
43
3.2 NATURE-BASED SOLUTIONS FOR ELECTRIFICATION CLIMATE CHANGE RESILIENCE
Along with hard engineering and the ‘grey’ solution to climate change resilience of electrification assets, several ‘green’ naturebased solutions can be applied67, 73, 74. Nature-based solutions (NbS) are actions that work with, or mimic, nature to address societal challenges. NbS are an important part of the climate change resilience toolbox, as they provide a range of benefits including improved air and water quality, lower greenhouse emissions and enhanced disaster preparedness. However, very few studies have investigated their importance in the live rail environment67 .
The European Commission suggests NbS as one of the sustainable, innovative solutions to contemporary societal challenges such as climate change.
Many ‘grey’ engineering solutions tend to alter the natural adaptive capacity of flood-prone areas, making the railway system more susceptible to flood damage73, 75, 76. However, NbS are naturally adaptable to changes in the environment.

3.2.1 GREEN CORRIDORS AND VEGETATION SHADING
The European Climate-ADAPT (a partnership between the European Commission and the European Environment Agency) has suggested that only a few measures will significantly impact climate change. Still, introducing nitrogen-based substances could help railways reach sustainable land-use goals77 . Narrow strips of vegetation could provide aesthetic benefits, noise reduction, embankment stability and better air quality.
The construction of green corridors around the embankments creates a buffer zone for noise and pollution from rail78. Moreover, it naturally provides vegetation shading for OLE and signalling equipment, improving hot-weather resilience79 In the UK, HS2 investigated the possibility of implementing green corridors, and it became one of the key objectives of the HS2 Environmental Policy80
3.2.2 HIGH SEA LEVELS AND STORM SURGES
Coastal structures like sea walls are increasingly challenged by global warming, sea-level rise, land subsidence and sediment supply. Conventional engineering solutions like sea walls protect today's populated and vulnerable coasts, such as delta works in the Netherlands or the Thames
44
barrier in London, but they are costly and can have unwanted ecological side effects. However, flood protection by ecosystem creation and restoration can provide a sustainable, costeffective and ecologically sound alternative to conventional engineering.
Different ecosystem-based approaches depend on the type of coastal area and the city's location risk. As demonstrated in San Francisco, ocean ecosystems could be a viable alternative or addition to conventional coastal defences. If there are extensive marshes between the city and the sea, cities located near tidal rivers, oceans or deltas are better protected from storm surges. Marsh restoration also helps to preserve natural habitats.
Building sluices through dykes and landward displacement of historical dams have been used to accomplish this in the Belgian Scheldt estuary. The marshes were created by the historical dykes' landward displacement. The first marsh was created in 2006, and the entire project is expected to be completed by 2030 at a cost of around €600 million. On the other hand, if this flood defence project is not implemented, the annual risk of flooding damage will be €1 billion by 210081, 82. Similar initiatives are underway in the United Kingdom, the United States and the Mississippi delta.
3.2.3 PRECIPITATION
Viable alternative hard-engineering solutions to reduce the risk of earthwork failure and landslides in wet weather include planting

protection forests75, 83 and installing gabion walls and soil nails71 Other options for reducing flood risk involve installing emergency culverts and aboiteaux19, and using containment channels and dykes. Infrastructure may be protected by installing revetments, geogrids, micro-piles and anchors71
The increased risk of earthworks failures due to desiccation and other issues is often a result of rampant vegetation in the vicinity of the tracks. De-vegetation programmes are currently the primary practice for reducing these risks. However, strengthening existing equipment and resilience through the design of new equipment is an alternative solution, as is installing guide vanes, selecting specific species and building tree-free zones in rail corridors.
45
CLIMATE CHANGE RESILIENCE RECOMMENDATIONS


4.1 REVIEW OF APPROPRIATE STANDARDS AND PRACTICES
4.1.1 EXISTING OLE SYSTEMS
Because many OLE systems were designed to a different standard, a distinction had to be made between the set-up temperature, ambient temperature and maximum temperature ranges. The set-up temperature is the temperature at which the system should be tensioned, and it determines the overall temperature range as well as the ambient temperature. The newer electrification projects calculate the maximum temperature range as a combination of ambient temperature, solar gain, current heating and wind. The table below summarises the current temperature ranges for different electrification systems.
Based on current climate change predictions, in the 2050s we can expect the ambient temperatures to reach as high as 45°C in some regions. Some of these systems need an immediate assessment. Many legacy systems do not have recorded temperatures, or they are unverified. The critical systems have been colour-coded red, those needing review as amber, and those requiring no action as green. The adjustment to set up the temperature or carry out complete renewal should be made based on assessment outcomes.
For example, the design parameters associated with MK3 OLE are such that the effects of increased ambient temperatures could be mitigated by readjustment of set-up temperatures for 'double cantilever arrangements' only in ½-tension lengths above 800m. Shorter tension lengths are unlikely to result in the untenable failure mode of mechanical design clearances being compromised between cantilever supports in the overlaps. Network Rail has already undertaken to raise existing systems to 38°C ambient by 202422. However, this may not be enough and does not allow for increased solar gain.
48
System Design/Set-up Temperature (°C) Ambient Temperature Range (°C) Max Temperature Range (°C) – including solar gain, current heating and wind Source Document Reference HS1 -20 to 60 HS2 (planned) -10 to 70 MK1 15.55 -5 to 50 BF 1468-061/001 [84] NR/L2/ELP/21088/02 MK2* 15.55 -15 to 50 BF 1468-061/002 [85] MK3 10 -18 to 38 BF 1468-061/003 [86] MK3A 10 -18 to 38 BF 1468-061/004 [87] MK3B 10 -18 to 38 BF 1468-061/005 [88] MK3C 10 -18 to 38 BF 1468-061/006 [89] MK3D 10 -18 to 38 NR/L2/ELP/21088/08 MK5 10 -18 to 38 BF 1468-061/007 [90] MK BBC 15.55 -5 to 50 BF 1468-061/008 [91] MK GE/MSW 15.55 -5 to 50 BF 1468-061/009 [92] MK SCS 15.55 -5 to 50 BF 1468-061/010 [93] NEXUS (light rail) 10 -12 to 35 NR/L2/ELP/21088/14 SICAT 15 -20 to 50 NR/L2/ELP/21088/13** Series 1 20 -18 to 40 -18 to 56 NR/L2/ELP/21088/16 Series 2 20 -18 to 40 -18 to 56 NR/L2/ELP/21088/17 UKMS 100 20 -18 to 40 -18 to 56 461667-MAN-EOH-000001 UKMS 125 20 -18 to 40 -18 to 56 461667-MAN-EOH-000001 UKMS R1 20 -18 to 40 -18 to 56 461667-MAN-EOH-000001 GEFF 20 -18 to 40 -18 to 56 440.1.0493_MAN_001 [94] GE (FT equip) 15.55 -5 to 50 NR/L2/ELP/21088/11
Table 2 Temperature ranges for existing UK systems
*The vast majority of MK2 has been replaced now. **The system has a wider range than shown in the NR standard.
The best way to ensure climate change resilience is to design systems that can withstand the future climate. Incorporating climate change predictions should become a common practice when designing new electrification equipment.
The current weather-resilience standards and design-temperature ranges are either UK-wide or route based. While the climate change predictions show the general trends of temperature rise nationwide, the differences will vary from region to region.
According to the ORR report28 , most hot weather-related incidents in 2019/2020 were in the eastern regions of the UK, especially in the East Midlands. Hence, a more pragmatic approach would be to develop region-based temperature ranges.
IN THE 2050s WE CAN EXPECT THE AMBIENT TEMPERATURES TO REACH AS HIGH AS 45°C


Furthermore, it is important to periodically reassess existing electrification equipment in light of updated UKCP predictions, as these predictions can change over time. This proactive approach to maintenance and adaptation can help to ensure that the electrification infrastructure remains reliable and effective in the face of changing climate conditions.

49
4.1.2 NEW SYSTEMS
4.2 REVIEW AND RENEWAL OF VULNERABLE ASSETS
4.2.1 FIXED TERMINATION (FT) EQUIPMENT
As previously stated, the FT equipment is one of the most vulnerable assets in hot weather. Lack of selftensioning capabilities leads to the poor thermal performance of overhead conductors, increasing the risk of failure and of a pantograph becoming entangled in wires. The table below provides the remaining tension equipment that should be reassessed and renewed, based on the risk.
Designation Equipment Type
GE FT Compound
SCS FT Simple
Routes
London Liverpool Street to Shenfield (majority already renewed, but pockets remain)
Shenfield Chelmsford Southend FT simple – again, most has now been removed.
MK1 FT Manchester to Hadfield and Glossop
MK1 Simple, FT Contact Wire, AT Catenary WCML slow-speed main lines, stations and sidings, Glasgow Suburban (stage 1 1960 North and South Clyde), MSJ&A (Manchester South Junction and Altrincham) conversion to 25kV (Piccadilly–Oxford Road circa 1960), London–Tilbury–Southend (LTS)
MK1 FT Tramway
MK2 FT Simple
MK2 FT Tramway
MK3 FT Simple
Various depots, e.g., Longsight
Glasgow South-West Suburban (Paisley to Gourock and Wemyss Bay) (as Mk1 but galvanised steel cantilevers)
Glasgow South-West Suburban
1971 conversion of Manchester Oxford Road–Altrincham from 1,500V DC to 25kV AC, largely using MSJ&A steelwork (see MSJ&A above). Since the Metrolink reequipping of the Altrincham with Brecknell Willis AT catenary tramway equipment in 2011, the only surviving section of MK3 FT is from Oxford Road to the former Cornbrook Junction.
MK3a FT Twin Contact Wire
MK3a FTTW
MK3b FTTW (‘Tramway’)
MK3c FT Simple
MK3d FT Simple
Glasgow North Clyde Suburban Argyle Line
Technical sheet tensions are for -18°C with ice but no wind; for sidings, depots and slow-speed areas (e.g., Cornbrook Junction-Trafford Park, Manchester)
For sidings, depots and slow-speed areas, e.g., terminal stations
For sidings, depots and slow-speed areas, e.g., terminal stations

50
Table 3 Remaining fixed termination equipment in the UK
4.2.2 MANCHESTER TO HADFIELD/GLOSSOP ROUTE CASE STUDY
The Manchester to Hadfield and Glossop is the last FT full line in the UK. The delay data have been obtained from the Open Rail Historical Service Performance database95 for the years 2015–2021. Figure 20 shows the total monthly train cancellation numbers.
It can be seen that there is a significant increase in the total number of cancellations over the last couple of years.
However, not all delays are caused by climate change; other causes include trespassers, staff shortages, theft, vandalism, disruptive passengers or a short-notice change to a timetable. Moreover, some delays are caused by climate change but not attributed to it, such as congestion due to speed restrictions in hot weather, staff not being able to get to their workplace, engineering works being delayed by weather, etc. The data for the most common weather-related delays/cancellations were cross-referenced with daily maximum temperature records
collected by the Met Office52. Figure 21 shows a correlation between peak temperatures and delayed trains, especially in 2019 during the heatwaves. In December 2019, the Met Office recorded the UK’s highest December-record temperature. Moreover, the increase in train cancellations in early 2020 can be attributed to storms Ciara, Dennis and Jorge96
This shows the route's poor climate change resilience, and F+F highly recommends that this should be further investigated by Network Rail.
51
Figure 20 Total reported train delay/cancellations for MAN-HDF route for years 2015-2021
Figure 21 Most commonly reported reasons for climate change-related train cancellations on MAN-HDF route vs maximum monthly air temperature
0 20 40 60 80 100 120 0 20 40 60 80 100 120 10 15 20 25 30 35 40 140 160 180 No of Trains Delayed/Cancelled Air Temperatrure ( ° C) 31/01/201530/04/201531/07/201531/10/201531/01/201630/04/201631/07/201631/10/201631/01/201730/04/201731/07/201731/10/201731/01/201830/04/201831/07/201831/10/201831/01/201930/04/201931/07/201931/10/201931/01/202030/04/202031/07/202031/10/202031/01/202130/04/202131/07/202131/10/2021 31/01/201530/04/201531/07/201531/10/201531/01/201630/04/201631/07/201631/10/201631/01/201730/04/201731/07/201731/10/201731/01/201830/04/201831/07/201831/10/201831/01/201930/04/201931/07/201931/10/201931/01/202030/04/202031/07/202031/10/202031/01/202130/04/202131/07/202131/10/2021 Monthly Train Delayed/Cancelled Total Linear (Monthly Train Delayed/Cancelled Total) Congestion A fault with the signalling system A fault on this train A late running train being in front of this one A points failure Failure of the electricity supply A fault with the signalling system earlier today Signalling problems A broken down train Damage to the overhead electric wires More trains than usual needing repairs at the same time Monthly Max Air Temp 0 20 40 60 80 100 120 0 20 40 60 80 100 120 15 20 25 30 35 40 140 160 180 No of Trains Delayed/Cancelled Air Temperatrure ( ° C) 31/01/201530/04/201531/07/201531/10/201531/01/201630/04/201631/07/201631/10/201631/01/201730/04/201731/07/201731/10/201731/01/201830/04/201831/07/201831/10/201831/01/201930/04/201931/07/201931/10/201931/01/202030/04/202031/07/202031/10/202031/01/202130/04/202131/07/202131/10/2021 31/01/201530/04/201531/07/201531/10/201531/01/201630/04/201631/07/201631/10/201631/01/201730/04/201731/07/201731/10/201731/01/201830/04/201831/07/201831/10/201831/01/201930/04/201931/07/201931/10/201931/01/202030/04/202031/07/202031/10/202031/01/202130/04/202131/07/202131/10/2021 Monthly Train Delayed/Cancelled Total Linear (Monthly Train Delayed/Cancelled Total) Congestion A fault with the signalling system A fault on this train A late running train being in front of this one A points failure Failure of the electricity supply A fault with the signalling system earlier today Signalling problems A broken down train Damage to the overhead electric wires More trains than usual needing repairs at the same time Monthly Max Air Temp
4.2.3 CERAMIC INSULATOR
Ceramic insulators are known for poor performance and failure during extreme weather. However, they are still in use in some systems (e.g., MK3) and are only replaced by composite insulators on a failure basis. This approach should be changed, and it is recommended to carry out a campaign change of degraded porcelain insulators at risk of high radial and tensile loads, including mechanically independent registration arrangements, live vertical dropper arrangements and Spanwire insulators.

4.3 IMPLEMENTATION OF GREEN SOLUTIONS FOR CLIMATE CHANGE
RESILIENCE
AND
IMPROVED VEGETATION MANAGEMENT
A workshop held by the Institution of Civil Engineers97 highlighted the gap in research on the impact of tree removal on embankment stability. It suggested planting new trees is as important as tree removal, and more work is needed to fully understand the impact of vegetation removal on stability, in terms of soil type, permeability and type of vegetation. Current Network Rail vegetation management practices (relatively passive) must be reviewed and improved. A comprehensive database and a better understanding of tree species and their growth rate are needed to control vegetation growth and enhancements. While the HS2 plans to implement green corridors, an active vegetation management plan is needed network wide.
Chapman et al.98 showed that shading is the primary cause of temperature variations along the track. Apart from hardengineering solutions, vegetation shading can be used to provide solar gain protection. Unmanaged vegetation can lead to signalling obstruction, infrastructure damage and fire hazards. Moreover, pest and diseases can spread, causing damage to the lineside trees and increasing the risk of trees falling onto the railway during high winds and storms. Therefore, bioengineering work and vegetation maintenance regimes are required to ensure this solution is sustainable.
For lineside equipment, the Rail Safety and Standards Board already recommends using vegetation and green corridors as shade sources to reduce ambient temperature along the track59 . Planting vegetation around track areas at risk of overheating could be a viable solution to reduce air and surface temperatures, which may also be beneficial for local drainage issues43,99,100. Moreover, the risk of lineside fire can be reduced by careful vegetation selection (e.g., broadleaf forests are less fire-prone) and fuel-accumulation management101,78
BIOENGINEERING WORK AND VEGETATION
MAINTENANCE REGIMES ARE REQUIRED TO ENSURE
THIS SOLUTION IS SUSTAINABLE
52
4.4 CONTINUOUS REMOTE CONDITION MONITORING
As highlighted in the 2019 ORR report59, the failure of OLE legacy assets was mainly due to the age of the assets and inadequate maintenance practices. Network Rail already utilises GIS-based alert systems. However, damage caused by extreme weather may go unreported until the next maintenance rotation or when a major failure occurs. Moreover, several studies have shown that extreme weather increases the probability of human error in maintenance or inspection tasks. While various measures can be implemented to improve season preparedness, as already highlighted in the ‘OLE Hot Weather Patrolling Guide’28 , the reliability of human senses and the subjectivity of live-line maintenance crews in a noisy and physically demanding environment raises serious safety and quality considerations102. Automated remote condition monitoring can significantly improve the quality of maintenance tasks, and seasonal preparedness can allow Network Rail to move towards a risk-based maintenance regime.
Numerous solutions can be implemented, such as smart sensing, unmanned aerial thermal imaging systems103, train-mounted visual monitoring devices combined with automated detection systems or infrastructure-mounted remote condition monitoring systems. For example, the HS2 infrastructure will be fitted with real-time monitoring sensors that can be used to monitor asset conditions, plan preventative maintenance and significantly increase the asset lifespan104,105
Examples include automating the monitoring of balance weights and structure lean in high-risk areas. Commercially available for remote condition monitoring106,107, these innovative systems feature smart alarming capabilities, allowing predetermined thresholds to have been met or exceeded. The device will send an alarm to notify the end user, indicating that further safety measures should be put in place and/or that maintenance is required. Early warning systems allow for better seasonal preparedness and could reduce the number of weather-related failures.
While remote monitoring allows for more frequent data collection and asset condition updates, these data need to be correctly collated, maintained and communicated in order to make an impact. The current weather monitoring and incident and asset condition databases need to be digitalised into one platform containing all relevant information. Moreover, clear data lifecycle policies need to be in place before system development to ensure the system is manageable in the future. Automated data feed and processing from those remote monitoring systems would help assess the network’s vulnerabilities and model the impact of future extreme weather events. RSSB has made similar recommendations in ‘Tomorrow's Railway and Climate Change Adaptation: Executive Report59
4.5 FURTHER INVESTIGATION INTO CLIMATE CHANGE IMPACT ON ELECTRIFICATION SYSTEMS
Clearly, more research is needed to understand the impact of extreme weather on electrification systems. For example, in recent years, most heat-related failures occurred in early summer (early – midJuly) as opposed to late summer, despite similar temperatures and precipitation. Some studies suggest it is due to poor seasonal preparedness28. However, a detailed investigation is needed to identify
the root cause. Further research into the dynamic performance of OLE is needed to identify the impact of diurnal temperature variations on early hightemperature days. More work is also needed on vegetation impact on embankment stability, clay embankment shrinkage and failure modes of the assets in extreme conditions, among other things.
Finally, more research into materials to reduce sag due to overheating is needed to ensure electrification heat resilience in the future. Hightemperature low-sag conductors can be manufactured from special alloys and composites108,109,110 with tailored thermal and mechanical properties. These could be more suitable for the future climate.
53
CONCLUSION
The UK is warming as a result of climate change. Since 2002, the UK has had its ten warmest years on record. Due to climate change, heatwaves are now thirty times more likely to occur. UK winters are projected to become warmer and wetter on average, although cold or dry winters will still occur sometimes. Summers are projected to become hotter and are more likely to be drier, although wetter summers are also possible. By 2050, heatwaves like those seen in 2019 and 2023 are expected to happen every other year.
By 2070, it is expected that the winter will be between 1°C and 4.5°C warmer and up to 30% wetter, and summer will be between 1°C and 6°C warmer and up to 60% drier. Heavy rainfall is also more likely. Since 1998, the UK has seen six of the ten wettest years on record. The winter storms will be at least 40% more likely because of climate change. Even if we reduce greenhouse gas emissions, sea levels will continue to rise after 2100, putting the low-lying parts of the United Kingdom at risk of flooding.


Due to the long-term nature of climate change, it may not be easy to justify the business case for investments, as the benefits may not be seen for years to come. However, numerous studies and recent events have shown that the cost of doing nothing is greater than implanting the solutions highlighted in this document. While moving more passengers/ freight to rail can reduce the impact of climate change, as rail emits up to nine times less CO2e and particulate matter, it is essential to ensure that the infrastructure is prepared to cope with the new conditions. Network Rail is looking at other efficient electrification programmes that can reduce climate change's impact. However, climate resilience should be considered when assessing changes.
The report has found that while only 7% of Network Rail’s Schedule 8 total weather-related costs (payments for disruption) can be attributed to heat, it has the most damaging effect on rail electrification. As ambient temperatures and the frequency of hot spells are expected to increase, it is important to ensure that existing and new electrification projects are heat resilient and resilient to the other impacts of climate change.

THE REPORT MAKES THE FOLLOWING RECOMMENDATIONS
Base temperatures are too low, and the existing systems' temperature ranges need review
Several legacy electrification systems have been identified to have too low set-up temperatures to mitigate the effect of future climate. The set-up temperature can be considered to be the nominal middle of the system's designed temperature range. The result of using too low a set-up temperature is the poor adaptation to higher temperatures. Furrer+Frey recommends an immediate assessment and, based on its outcome, either adjustment to set up the temperature where required or complete renewal. A 15°C set-up temperature is advised, resulting in a new ambient temperature range capability of -13°C to +43°C.
Moreover, as the climate change impact will vary regionally (e.g., the ambient temperatures in the north of England and Scotland are approximately 4°C lower than in London), a one-size-fits-all solution will not create a resilient system. In the north of England and Scotland, other issues, such as rain and wind, may have greater impact. It is recommended that new electrification projects also have region-based climate change adaptation plans. However,
Immediate assessment of vulnerable legacy assets and renewal
Several key legacy assets have been identified as particularly vulnerable to climate change, due to poor resilience. Vulnerable assets identified in this report are fixed termination equipment, porcelain insulators and headspans.
Modern electrification systems use tensioning equipment to maintain system performance in changing temperatures. Some legacy equipment is described as fixed termination when it does not use tensioning equipment. Thus, performance fluctuates depending on temperature. Furrer+Frey recommends reassessment with regard to whether the remaining fixed termination equipment in the UK should be replaced. For instance, immediate reassessment is advised of the Manchester to Hadfield and Glossop route as one of the last remaining routes with legacy FT equipment.
A campaign change of age-degraded porcelain insulators at risk of high radial loads is recommended. Modern electrification equipment uses silicone polymeric insulators, but older equipment uses porcelain insulators. These porcelain insulators can be at higher risk in extreme events.
Finally, a risk assessment of areas with headspans is also strongly advised. Headspans are a system of wires spanning masts either side of the tracks to support electrification equipment. Mechanical independence of electrification is a key part of resilience, ensuring that where a failure occurs, it only impacts a single line and does not shut down an entire railway. Legacy systems often lack mechanical independence.
56
Implementation of nature-based solutions for climate change resilience
Nature-based solutions (NbS) are actions that work with, or mimic, nature to address societal challenges. NbS are an important part of the climate change resilience toolbox, as they provide a range of benefits including improved air and water quality, lower greenhouse emissions and enhanced disaster preparedness. Furrer+Frey recommends reviewing the current vegetation management practices, developing long-term vegetation plans and implementing NbS for vegetation shading, embankment stability and coastal infrastructure protection where possible.
Understanding that de-vegetation plans are as important as revegetation is key to a sustainable railway. However, care needs to be taken not to increase the risk of vegetation encroachment on live electrification and/or trees being blown over in very windy conditions with this solution, as vegetation issues are currently one of the highest causes of electrification failure in the UK.

Remote asset monitoring
Automated remote asset monitoring can significantly improve the quality of maintenance tasks and seasonal preparedness. While Network Rail already uses a train-borne monitoring system for pantographs, Furrer+Frey recommends implementing train-borne asset monitoring systems for height and stagger measurements (deviation of contact wires from track centre line), vegetation condition, remote tension and mast lean.
Remote asset monitoring would allow Network Rail to move towards risk-based maintenance practices. However, while remote monitoring allows for more frequent data collection and asset condition updates, these data need to be analysed, maintained and communicated in order to make an impact. The development of a digital and centralised platform is needed for accurate risk monitoring and risk-assessment methods. Furthermore, clear data lifecycle policies need to be in place before system development to ensure the system and collected data are still manageable in the future.
Further investigation into climate change impact on OLE systems
To reduce sag due to overheating and to ensure that electrification is heat resistant in the future, further research is needed to investigate the effects of diurnal temperature variations on electrification systems and materials. Hightemperature, low-sag conductors can be manufactured from special alloys and composites. Due to the scarcity of research, the UK has the potential to become a hub for climate change resilience in electrification, able to share knowledge and improve infrastructure resilience worldwide.
57
THE COST OF DOING NOTHING IS GREATER THAN IMPLANTING THE SOLUTIONS HIGHLIGHTED IN THIS DOCUMENT
REFERENCES
[1] Department for Business, Energy & Industrial Strategies, “UK Energy in Brief,” National Statistics, 2022.
[2] Department for Transport, “Transport and environment statistics,” Official Statistics, 20 10 2022. [Online]. Available: https://www.gov.uk/government/statistics/ transport-and-environment-statistics-2022/transportand-environment-statistics-2022#:~:text=transport%20 is%20the%20largest%20emitting,each%20local%20 authority%20in%202020. [Accessed 06 11 2022].
[3] D. Shirres, G. Keenor, N. Dolphin and P. Hooper, “WHY RAIL ELECTRIFICATION?,” RIA (Railway Industry Association), 2021.
[4] H. Ritchie, M. Roser and P. Rosado, “"Energy". Published online at OurWorldInData.org,” 2022. [Online]. Available: https://ourworldindata.org/energy. [Accessed 06 11 2022].
[5] World Health Organization, “Ambient (outdoor) air pollution,” World Health Organization, 22 09 2021. [Online]. Available: https://www.who.int/news-room/factsheets/detail/ambient-(outdoor)-air-quality-and-health. [Accessed 24 09 2022].
[6] C. C. Committee, “Net Zero - The UK's contribution to stopping global warming,” https://www.theccc.org.uk/ publication/net-zero-the-uks-contribution-to-stoppingglobal-warming/, 2021.
[7] Department for Transport, “Britains Transport Infrastructure - Rail Electrification,” Department for Transport, 2009.
[8] RSSB, “T1145 - Options for Traction Energy Decarbonisation in Rail,” RSSB, 2019.
[9] UN Climate Technology Centre & Network, “Regenerative braking in trains,” CTCN, 2023.
[10] Network Rail, “Network RUS Electrification,” Network Rail, 2009.
[11] A. Hickman, C. Baker, X. Cai, J. Thornes and J. M. Delgado Saborit, “Evaluation of air quality at the Birmingham New Street Railway Station,” Proceedings of the Institution of Mechanical Engineers, Part F: Journal of Rail and Rapid Transit, vol. 232, no. 6, pp. 1864-1878, 2018.
[12] Y. Xia, J. N. V. Ommeren, P. Rietveld and W. Verhagen, “Railway infrastructure disturbances and train operator performance: The role of weather,” Transportation Research Part D: Transport and Environment, vol. 18, pp. 97-102, 2013.
[13] Network Rail, “Great Western Route Modernisation –Interim project completion report,” Network Rail, 2020.
[14] REO, “THE HISTORY OF RAIL ELECTRIFICATION,” REO, 2022. [Online]. Available: https://www.reo.co.uk/files/ infographic_on_the_history_of_rail_electrification.pdf. [Accessed 02 11 2022].
[15] G. Madge, “2021 continues warm global temperature series,” 19 01 2022. [Online]. Available: https://www. metoffice.gov.uk/about-us/press-office/news/weather-andclimate/2022/2021-hadcrut5-wmo-temperature-statement. [Accessed 16 08 2022].
[16] Rail Accident Investigation Branch, “Derailment of a passenger train at Carmont, Aberdeenshire,” RAIB, 2022.
[17] T. Wang, Z. Qu, Z. Yang, T. Nichol, D. Dimitriu, G. Clarke, D. Bowden and P. T. Lee, “Impact analysis of climate change on rail systems for adaptation planning: A UK case,” Transportation Research Part D: Transport and Environment, vol. 83, no. 102324, pp. ISSN 1361-9209, 2020.
[18] T. Wang, Z. Qu, Z. Yang, T. Nichol, G. Clarke and Y. Ge, “Climate change research on transportation systems–Climate risks, adaptation and planning,” Transportation Research Part D: Transport and Environment, vol. 88, no. 102553, 2022.
[19] K. Palko and D. S. Lemmen, “Climate Risks and Adaptation Practices for the Canadian Transportation Sector 2016,” Transportation Association of Canada (TAC), Northern Territories, Ottawa, ON, 2016.
[20] N. Bešinović, “Resilience in railway transport systems: a literature review and research agenda,” Transport Reviews, vol. 40, no. 4, pp. 457-478, 2020.
[21] K. Berdica, “An introduction to road vulnerability: What has been done, is done and should be done,” Transport Policy, no. 9, pp. 117-127, 2002.
[22] Network Rail, “Network Rail Third Adaptation Report,” Network Rail, 2021.
[23] Met Office, “Record breaking heat-wave July 2019,” 31 07 2019. [Online]. Available: https://www.metoffice.gov. uk/binaries/content/assets/metofficegovuk/pdf/weather/ learn-about/uk-past-events/interesting/2019/2019_007_ july_heatwave.pdf. [Accessed 30 06 2022].
[24] Network Rail, “We work hard to keep you moving in hot weather,” Network Rail, 16 06 2022. [Online]. Available: https://www.networkrail.co.uk/campaigns/hot-weatherand-the-railway/. [Accessed 16 08 2022].
[25] Telegraph Reporters, “UK heatwave: Holidaymakers face flights chaos, as Met Office says temperature record may have been broken,” Telegraph, 26 07 2019. [Online]. Available: https://www.telegraph.co.uk/news/2019/07/26/ uk-heatwave-commuters-face-fresh-chaos-railwaystemperatures/. [Accessed 21 07 2022].
[26] R. Hartley-Parkinson, “Major disruption across UK rail network after heatwave causes chaos,” METRO, 26 07 2019. [Online]. Available: https://metro.co.uk/2019/07/26/ major-disruption-across-uk-rail-network-heatwave-causeschaos-10463687/. [Accessed 21 07 2022].
[27] Gwyn Topham and agencies, “UK weather: rail and air travel disrupted as heatwave recedes,” BBC, 26 07 2019. [Online]. Available: https://www.theguardian.com/uknews/2019/jul/26/uk-weather-rail-travel-disrupted-afterextreme-heat-causes-chaos-great-northern-thameslinkeast-midlands. [Accessed 21 07 2022].
[28] Office of Rail and Road, “OLE Hot Weather ResilienceTargeted Assurance Review,” Office of Rail and Road, 2021.
[29] Network Rail, “Nine things that happened during the storms,” Network Rail, 22 02 2022. [Online]. Available: https://www.networkrail.co.uk/stories/nine-things-thathappened-during-the-storms/. [Accessed 21 07 2022].
[30] Met Press Office, “UK prepares for historic hot spell,” Met Office, 15 07 2022. [Online]. Available: https://www. metoffice.gov.uk/about-us/press-office/news/weather-andclimate/2022/red-extreme-heat-warning. [Accessed 2022 07 21].
[31] E&T editorial staff, “Network Rail launches resilience taskforce following heatwave,” 20 07 2022. [Online]. Available: https://eandt.theiet.org/content/ articles/2022/07/network-rail-launches-resiliencetaskforce-in-wake-of-record-breaking-heatwave/. [Accessed 21 07 2022].
[32] Network Rail Media Centre, “Line side fire suspends all services to and from London Euston,” Network Rail, 19 07 2022. [Online]. Available: https://www. networkrailmediacentre.co.uk/news/line-side-fire-closesrailway-between-euston-and-milton-keynes. [Accessed 21 07 2022].
[33] M. Moran, “Network Rail launches resilience taskforce in wake of record-breaking heatwave,” TransportXtra, 20 07 2022. [Online]. Available: https://www.transportxtra. com/publications/transit/news/71678/network-raillaunches-resilience-taskforce-in-wake-of-record-breakingheatwave/#:~:text=Network%20Rail%20has%20 launched%20a,following%20this%20week's%20 unprecedented%20heatwave.. [Accessed 23 07 2022].
[34] H.-O. Pörtner, D. Roberts, M. Tignor, E. Poloczanska, K. Mintenbeck, A. Alegría, M. Craig, S. Langsdorf, S. Löschke, V. Möller, A. Okem and B. Rama, Climate Change 2022: Impacts, Adaptation, and Vulnerability. Contribution of Working Group II to the Sixth Assessment Report of the Intergovernmental Panel on Climate Change, Cambridge, UK and New York, NY, USA: Cambridge University Press, 2022.
[35] Gutiérrez, J.M., R.G. Jones, G.T. Narisma, L.M. Alves, M. Amjad, I.V. Gorodetskaya, M. Grose, N.A.B. Klutse, S. Krakovska, J. Li, D. Martínez-Castro, L.O. Mearns, S.H. Mernild, T. Ngo-Duc, B. v. d. Hurk and J.-H. Yoon, “Interactive Atlas,” Cambridge University Press, [Online]. Available: http://interactive-atlas.ipcc.ch/.
[36] C. Baker, L. Chapman, A. Quinn and K. Dobney, “Climate change and the railway industry: A review.,” Proceedings of the Institution of Mechanical Engineers, Part C: Journal of Mechanical Engineering Science., vol. 224, no. 3, pp. 519-528, 2010.
[37] UKCP18, “Maps: Probabilistic projections of climate extremes (25km) over UK, 1961-2100,” UKCP User Interface, 2022.
[38] MET Office, “UKCP18 Science Overview Report,” Met Office, 2018.
[39] U. E. Programme, “Emissions Gap Report 2022,” United Nations Environment Programme, 2022.
[40] Met Office, “UK Climate Projections: Headline Findings,” Met Office, 2021.
[41] “ Adaptation of Railway Infrastructure to Climate Change (ARISCC),” ARISCC, 28 02 2021. [Online]. Available: http:// www.ariscc.org/index4411.html?id=37. [Accessed 27 07 2022].
[42] J. Armstrong, J. Preston and I. Hood, “Adapting railways to provide resilience and sustainability,” Proceedings of the Institution of Civil Engineers–Engineering Sustainability, vol. 170, pp. 225-234, 2017.
[43] O. Marteaux, “Tomorrow's railway and climate change adaptation–Executive report,” Rail Safety and Standards Board, 2016.
[44]
E. J. Palin, H. E. Thornton, C. T. Mathison, R. E. McCarthy, R. T. Clark and J. Dora, “Future projections of temperaturerelated climate change impacts on the railway network of Great Britain,” Climatic Change, vol. 120, p. 71–93, 2013.
[45] A. Baxter, A Guide to Overhead Electrification, Network Rail, 2015.
[46]
[47]
[48]
J. Zhan, W. Liu, K. Qiao, M. Yu, T. Wang and Z. Yang, “Influence of catenary tension on static elasticity and dynamic contact force between pantograph and catenary,” IET Electrical Systems in Transportation, vol. 7, no. 3, pp. 201-206, 2017.
T. Dahlberg, “Catenary, pantograph, and their interaction,” Vehicle System Dynamics, vol. 44, no. 8, pp. 591-593, 2007.
D. Song, Y. Jiang and W. Zhang, “Dynamic performance of a pantograph–catenary system with consideration of the contact surface,” Proceedings of the Institution of Mechanical Engineers, Part F: Journal of Rail and Rapid Transit, vol. 232, no. 1, pp. 262-274, 2018.
[49] T. Guia and M. Teguar, “Relationship between high voltage insulators incidents and climatic factors in AC Algerian electrical networks using ARDL approach,” IET Generation, Transmission & Distribution, vol. 12, no. 11, pp. 2510-2519, 2018.
[50] Y. Song, Z. Liu, F. Duan, Z. Xu and X. Lu, “Wave propagation analysis in high-speed railway catenary system subjected to a moving pantograph,” Applied Mathematical Modelling, vol. 59, pp. 20-28, 2018.
[51] C. Brimicombe, J. J. Porter, C. D. Napoli, F. Pappenberger, R. Cornforth, C. Petty and H. L. Cloke, “Heatwaves: An invisible risk in UK policy and research,” Environmental Science & Policy, vol. 116, pp. 1-7, 2021.
[52] CEDA Archive, “Met Office MIDAS Open: UK Land Surface Stations Data,” CEDA Archive, 09 07 2022. [Online]. Available: https://data.ceda.ac.uk/badc/ukmo-midas-open/ data/uk-hourly-weather-obs/dataset-version-202207/ greater-london/00708_heathrow/qc-version-1. [Accessed 24 09 2022].
[53] R. C. Sierra, O. Oviedo-Trespalacios, J. E. Candelo and J. D. Soto, “Assessment of the risk of failure of high voltage substations due to environmental conditions and pollution on insulators,” Environ. Sci. Pollut. Res., vol. 22, no. 13, p. 9749–9758, 2015.
[54] E. Hooper and L. Chapman, “CHAPTER 5: THE IMPACTS OF CLIMATE CHANGE ON NATIONAL ROAD AND RAIL NETWORKS,” in Transport and Climate Change, vol. 2, Emerald Group Publishing Limited, 2012, p. 105–136.
[55] National Transportation Safety Board, “Special Investigation Report on Railroad and Rail Transit Roadway Worker Protection,” National Transportation Safety Board, Washington, D.C., 2014.
[56] L. Ramphal, “Heat Stress in the Workplace,” Baylor University Medical Center Proceedings , vol. 13, no. 4, pp. 349-350, 2000.
[57] S. Arabi, B. Shafei and B. M. Phares, “Investigation of fatigue in steel sign-support structures under diurnal temperature changes,” Journal of Constructional Steel Research, vol. 153, pp. 286-297, 2019.
[58] Network Rail, “Network Rail Asset Management WCCRAP,” Network Rail, 2021.
[59] Rail Safety and Standards Board Ltd, “Tomorrow’s Railway and Climate Change Adaptation–Final Report,” Rail Safety and Standards Board Ltd, 2016.
[60] S. Khandelwal, “Effect of Desiccation Cracks on Earth Embankments,” A&M University, 2011.
58
[61] R. Stirling, S. Glendinning, C. Davie, R. Hen-Jones and P. Hughes, “The Behaviour and Influence of Desiccation Cracking on a Full-Scale, Vegetated Infrastructure Embankment,” in The 7th International Conference on Unsaturated Soils, Hong Kong, 2018.
[62] Network Rail, “Identification of Component Failures in 25 KV Overhead Line Equipment (formerly RT/E/C/27003),” in Data Sheet 8 - PORCELAIN SOLID CORE - FLASHOVER/ THERMAL DAMAGE, Network Rail.
[63] MET Office, “Tornado,” MET Office, [Online]. Available: https://www.metoffice.gov.uk/weather/learn-about/ weather/types-of-weather/tornadoes. [Accessed 13 10 2022].
[64] S. K. Degelia, J. I. Christian, J. B. Basara, T. J. Mitchell, D. F. Gardner, S. E. Jackson, J. C. Ragland and H. R. Mahan, “An overview of ice storms and their impact in the United States,” International Journal of Climatology, vol. 36, p. 2811–2822, 2016.
[65] K. G. Gavin, “Report on common problems faced by rail infrastructure managers,” Destination Rail EU, 2016.
[66] Network Rail, “Data Sheet 5 PORCELAIN SOLID CORE “DUNTED” LONGITUDINAL CRACK,” in Identification of Component Failures in 25 KV Overhead Line Equipment (formerly RT/E/C/27003) , Network Rail, 1998.
[67] L. Blackwood, F. G. Renaud and S. Gillespie, “Nature-based solutions as climate change adaptation measures for rail infrastructure,” Nature-Based Solutions, vol. II, no. 100013, pp. ISSN 2772-4115, 2022.
[68] E. J. Palin, H. E. Thornton, C. T. Mathison, R. E. McCarthy, R. T. Clark and J. Dora, “Future projections of temperaturerelated climate change impacts on the railway network of Great Britain,” Climate Change, vol. 120, p. 71–93, 2013.
[69] Network Rail, “Weather Resilience and Climate Change Adaptation Strategy 2017-2019,” Network Rail, 2017.
[70] Network Rail, “LNE&EM Region Weather Resilience and Climate Change Adaptation Plan,” Network Rail, 2020.
[71] Network Rail, “Anglia 2019 –2024 Route Weather Resilience and Climate Change Adaptation Plan,” Network Rail, 2020.
[72] J. Slingo, P. Davies and H. Fowler, “Weather Advisory Task Force Final Report,” Network Rail, 2021.
[73] E. Cohen-Shacham, G. Walters, C. Janzen and S. Maginnis, Nature-based solutions to address global societal challenges, IUCN International Union for Conservation of Nature, 2016.
[74] N. Seddon, E. Daniels, R. Davis, A. Chausson, R. Harris, X. Hou-Jones, S. Huq, V. Kapos, G. M. Mace, A. R. Rizvi, H. Reid, D. Roe, B. Turner and S. Wicander, “Global recognition of the importance of nature-based solutions to the impacts of climate change,” vol. 3, Cambridge University Press, 2020, p. e15.
[75] K. Bhattacharjee and B. Behera, “Does forest cover help prevent flood damage? Empirical evidence from India,” Global Environmental Change, vol. 53, pp. 78-89, 2018.
[76] S. Temmerman, P. Meire, T. J. Bouma, P. M. J. Herman, T. Ysebaert and H. J. D. Vriend, “Ecosystem-based coastal defence in the face of global change,” Nature, vol. 504, pp. 79-83, 2013.
[77] Partnership for Environment and Disaster Risk Reduction, “Demonstrating the Role of Ecosystems-based Management for Disaster Risk Reduction,” ISDR, 2010.
[78] J. Lindgren, “Climate adaptation of railways: Lessons from Sweden,” vol. 9, Delft , Technische Universiteit Delft, 2009, pp. 164-181.
[79] L. Ruangpan, Z. Vojinovic, S. D. Sabatino, L. S. Leo, V. Capobianco, A. M. P. Oen, M. E. Mcclain and E. LopezGunn, “Nature-based solutions for hydro-meteorological risk reduction: a state-of-the-art review of the research area,” vol. 20, 2020, pp. 243-270.
[80] HS2, “Phase 2b Western Leg Information Paper E28: The Green Corridor,” HS2, 2022.
[81] S. Broekx, S. Smets, I. Liekens, D. Bulckaen and L. D. Nocker, “Designing a long-term flood risk management plan for the Scheldt estuary using a risk-based approach,” Natural Hazards, vol. 57, pp. 245-266, 2010.
[82] S. Temmerman, G. Govers, S. Wartel and P. Meire, “Modelling estuarine variations in tidal marsh sedimentation: response to changing sea level and suspended sediment concentrations,” Marine Geology, vol. 212, 2004.
[83] C. Doll, C. Trinks, N. Sedlacek, V. Pelikan, T. Comes and F. Schultmann, Adapting rail and road networks to weather extremes: case studies for southern Germany and Austria, Natural Hazards, Springer , 2013.
[84] . J. Fiddes, . D. M. Hibbert, . B. Moulton and . M. Tarton, “Mk 1 Equipment Designation BF 1468-061/001,” 1998.
[85] . J. Fiddes, . D. M. Hibbert, . B. Moulton and . M. Tarton, “Mk 2 Equipment Designation BF 1468-061/002,” 1998.
[86] . J. Fiddes, . D. M. Hibbert, . B. Moulton and . M. Tarton, “Mk 3 Equipment Designation BF 1468-061/003,” 1998.
[87] . J. Fiddes, . D. M. Hibbert, . B. Moulton and . M. Tarton, “Mk 3A Equipment Designation BF 1468-061/004,” 1998.
[88] . J. Fiddes, . D. M. Hibbert, . B. Moulton and . M. Tarton, “Mk 3B Equipment Designation BF 1468-061/005,” 1998.
[89] . J. Fiddes, . D. M. Hibbert, . B. Moulton and . M. Tarton, “Mk 3C Equipment Designation BF 1468-061/006,” 1998.
[90] . J. Fiddes, . D. M. Hibbert, . B. Moulton and . M. Tarton, “Mk 5 Equipment Designation BF 1468-061/007,” 1998.
[91] . J. Fiddes, . D. M. Hibbert, . B. Moulton and . M. Tarton, “Mk BBC Equipment Designation BF 1468-061/008,” 1998.
[92] . J. Fiddes, . D. M. Hibbert, . B. Moulton and . M. Tarton, “Mk GE/MSW Equipment Designation BF 1468-061/009,” 1998.
[93] . J. Fiddes, . D. M. Hibbert, . B. Moulton and . M. Tarton, “Mk SCS Equipment Designation BF 1468-061/010,” 1998.
[94] J. Bull, S. Leuenberger and R. Daffern, “GEFF OLE SYSTEMSYSTEM DESCRIPTION MANUAL,” Furrer Frey AG, 2021.
[95] Rail Delivery Group, “Historical Service Performance,” National Rail Data Portal, 2022.
[96] MET Office, “Past weather events,” MET Office, 2022. [Online]. Available: https://www.metoffice.gov.uk/weather/ learn-about/past-uk-weather-events#y2015. [Accessed 14 11 2022].
[97] “THE EFFECTS OF CLAY SHRINKAGE ON EMBANKMENT MOVEMENT: Implications for earthworks asset management,” New Civil Engineering, 04 08 2008. [Online]. Available: https://www.newcivilengineer.com/ archive/the-effects-of-clay-shrinkage-on-embankmentmovement-implications-for-earthworks-assetmanagement-04-08-2008/. [Accessed 12 09 2022].
[98] L. Chapman, J. E. Thornes and S. P. White, “Thermal imaging of railways to identify track sections prone to buckling,” Proceedings of the Institution of Mechanical Engineers, Part F: Journal of Rail and Rapid Transit, vol. 220, no. 3, pp. 317-327, 2006.
[99] UNaLab, Nature Based Solutions - Technical Handbook Part II, 2019.
[100] Klimatek Project, Nature-based solutions for local climate adaptation in the Basque Country, Bilbao, 2019.
[101] M. Calviño-Cancela, M. L. Chas-Amil, E. García-Martínez and J. Touza, “Wildfire risk associated with different vegetation types within and outside wildland-urban interfaces.,” in Forest Ecology and Management, White Rose Research Online, 2016, pp. 1-9.
[102] R. K. Aggarwal, A. T. Johns, J. A. S. B. Jayasinghe and W. Su, “An overview of the condition monitoring of overhead lines,” Electric Power Systems Research, vol. 53, no. 1, pp. 15-22, 2000.
[103] F. Andert, N. Kornfeld, F. Nikodem, H. Li, S. Kluckner, L. Gruber and C. Kaiser, “Automatic Condition Monitoring of Railway Overhead Lines from Close-Range Aerial Images and Video Data,” in 2020 International Conference on Unmanned Aircraft Systems (ICUAS), Athens, 2020.
[104] HS2 Media Centre, “Virtual Reality will help make HS2 one of the most reliable railways in the world,” HS2, 17 01 2022. [Online]. Available: https://mediacentre.hs2.org.uk/ news/virtual-reality-will-help-make-hs2-one-of-the-mostreliable-railways-in-the-world. [Accessed 14 10 2022].
[105] R. HAKIMIAN, “How HS2 plans to use virtual reality to increase reliability of assets and railway,” New Civil Engineer, 18 01 2022. [Online]. Available: https://www. newcivilengineer.com/latest/how-hs2-plans-to-usevirtual-reality-to-increase-reliability-of-assets-andrailway-18-01-2022/. [Accessed 14 10 2022].
[106] Yeltech, “NEW: Tension Monitoring with OLE Balance Weight Monitoring System,” Railway-News Magazine, no. 3, pp. 109-111, 2021.
[107] “BALANCE WEIGHT MONITORING SYSTEM,” HASTECRail, [Online]. Available: https://hastecrail.com/wp-content/ themes/crush-theme/assets/downloads/hastec_balance_ technical.pdf. [Accessed 2022 09 28].
[108] R. Adapa, M. Shirmohamadi and R. Gray, “SLiM (sagging line mitigator) - mitigating excess sag in overhead transmission lines,” in 2005 IEEE Power Engineering Society Inaugural Conference and Exposition in Africa, 2005.
[109] S. Sakabe, N. Mori, K. Sato, Y. Miyake and A. Tanaka, “Development of Extremely-Low-Sag Invar Reinforced ACSR (XTACIR),” IEEE Transactions on Power Apparatus and Systems, Vols. PAS-100, no. 4, pp. 1505-1511, 1981.
[110] K. Qiao, A. Zhu, B. Wang, C. Di, J. Yu and B. Zhu, “Characteristics of Heat Resistant Aluminum Alloy Composite Core Conductor Used in overhead Power Transmission Lines,” Materials, vol. 17, no. 7, p. 1592, 2020.
[111] A. R. Rizvi and D. Gonzales, “Regional Assessment on Ecosystem-based Disaster Risk Reduction and Biodiversity in East”.
[112] M. Panteli and P. Mancarella, “Influence of Extreme Weather and Climate Change on the Resilience of Power Systems: Impact and Possible Mitigation Strategies,” Electric Power Systems Research, vol. 127, pp. 259-270, 2015.
[113] U. G. Knight, Power Systems in Emergencies: From Contingency Planning to Crisis Management, Chichester: John Wiley and Sons Ltd, 2001.
[114] Q. Hu, L. Bian and M. Tan, “A data perception model for the safe operation of high-speed rail in rainstorms,” Transportation Research Part D: Transport and Environment, vol. 83, no. 102326, 2020.
[115] Met Office, “UK Climate Projections User Interface,” Met Office, 2022.
[116] Network Rail, “Our Electric Future,” Network Rail, 2021.
[117] E. Murphy and E. A. King, “Chapter 5 - Transportation Noise,” in Environmental Noise Pollution: Noise Mapping, Public Health and Policy, Elsevier, 2014, pp. 123-171.
59
Furrer+Frey GB Ltd

39 Evelyn Street
Beeston
NG9 2EU
gb@furrerfrey.co.uk
www.furrerfrey.ch
We retain all rights to this document and the objects illustrated in it. Its contents may not be used without our written consent.
© 2023 Furrer+Frey GB Ltd
