Ryan P. Cambridge, PLA FRMWRK Planning + Design - Principal-in-Charge
Mark P. Beer, PLA FRMWRK Planning + Design
David M. Armbruster FRMWRK Planning + Design
Austin L. Hochstetler, CPREZec Eight Insights
Jason Andoscia, AIA, NCARBTSK Architects
Bill Dennis, AIA
Ryan Murray
TSK Architects
ETC Institute
PART 0NE
A RESILIENCE CENTERED PLAN
This master plan is organized around the broad goal of increasing comprehensive resilience across Henderson’s parks and recreation system and the Department that delivers it. Resilience is treated as an integrated strategy—environmental, social, and fiscal—supported by four mutually reinforcing dimensions: physical resiliency of assets; operational resiliency of staffing, service levels, and emergency readiness; environmental resiliency focused on heat and water performance (including compliance with AB356); and fiscal resiliency built on stable, diversified funding and lifecycle-based reinvestment.
The master plan is structured in five parts that build linearly from baseline conditions to implementation:
1. PART ONE establishes the context, purpose, and approach;
2. PART TWO documents existing conditions and baseline performance;
3. PART THREE translates engagement and analysis into needs and priorities;
4. PART FOUR defines a cohesive long range Vision; and
5. PART FIVE converts the Vision into a sequenced Action Plan.
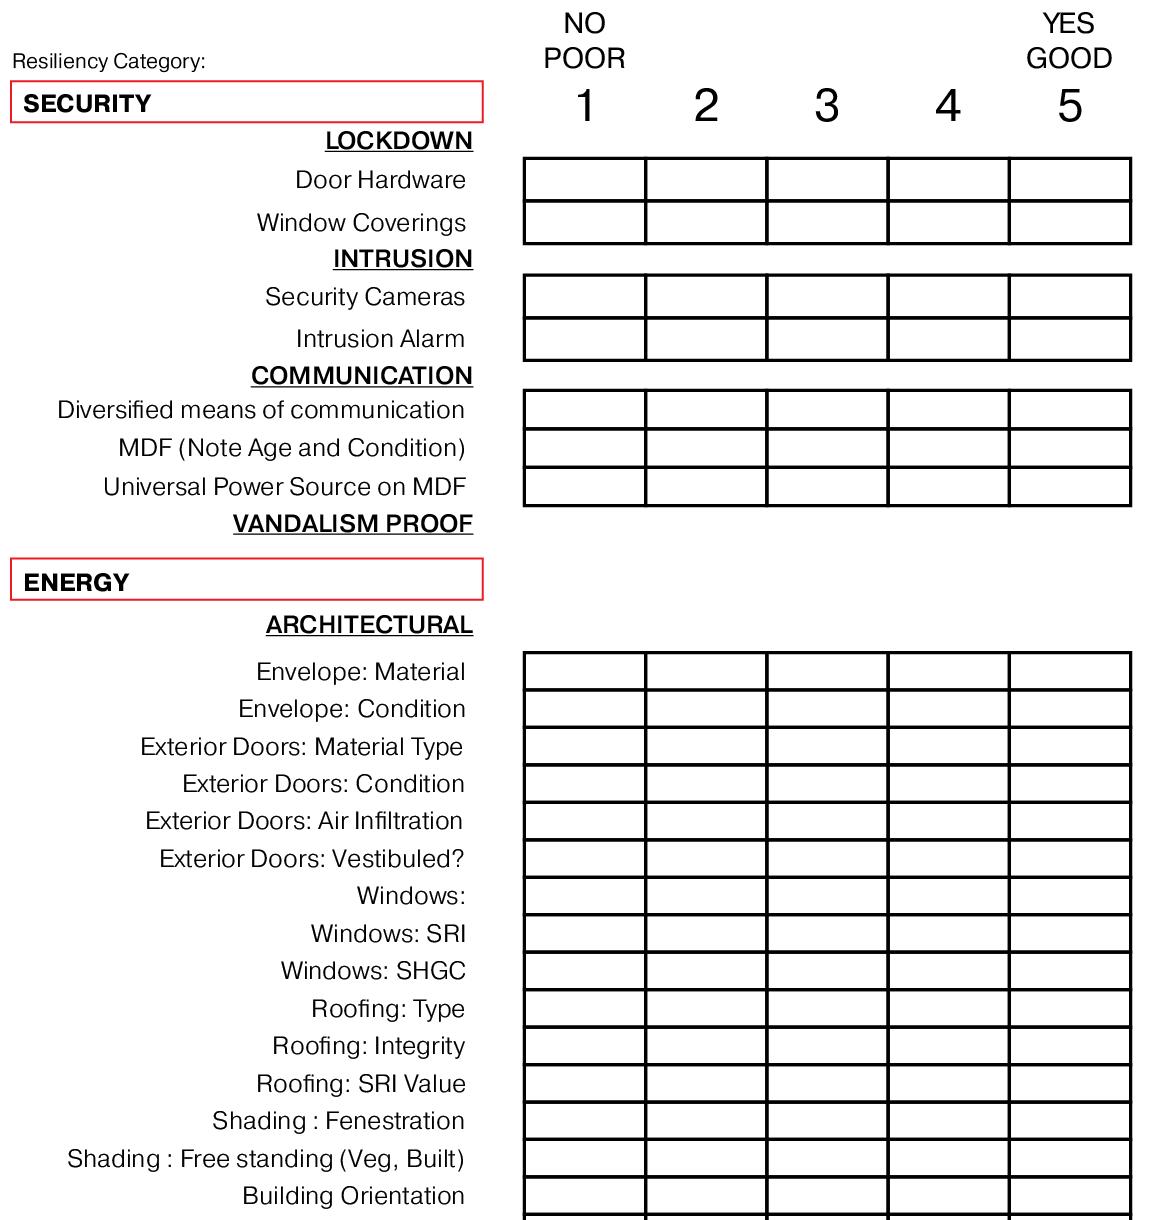
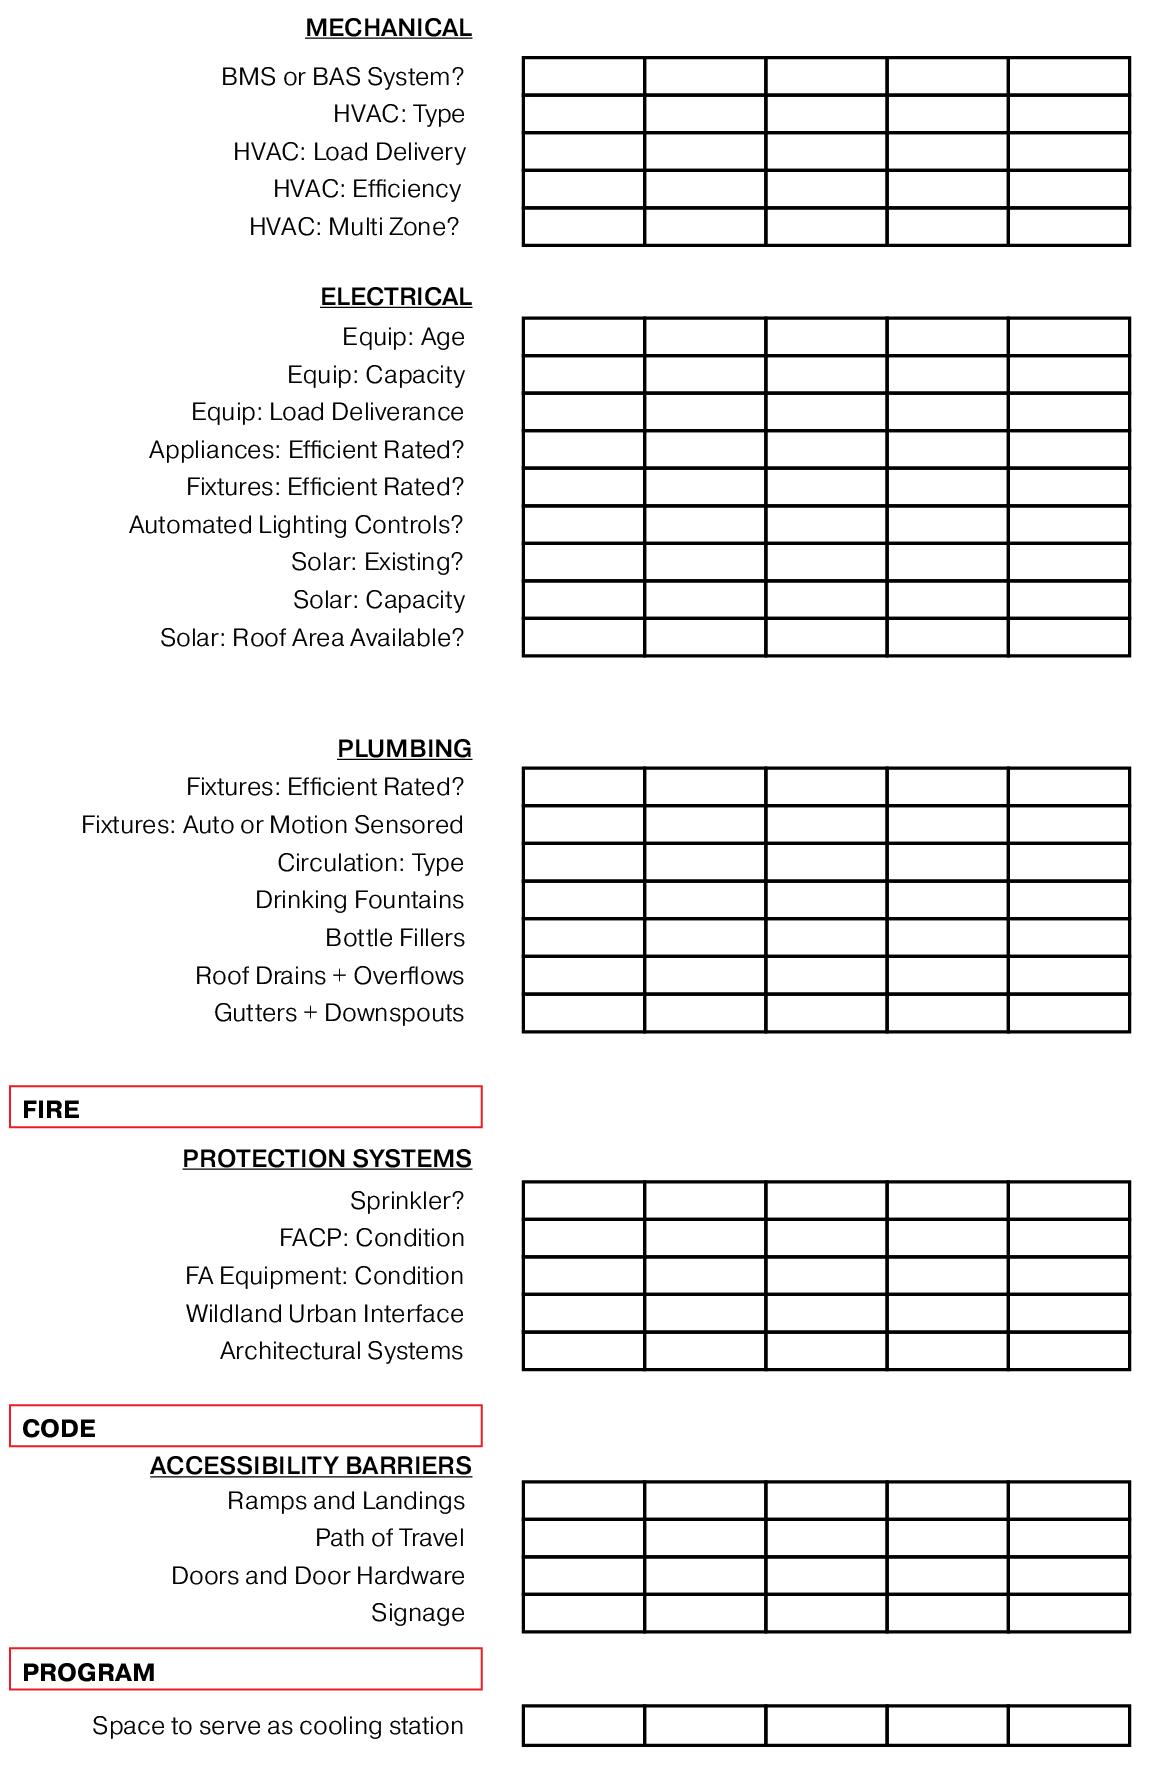
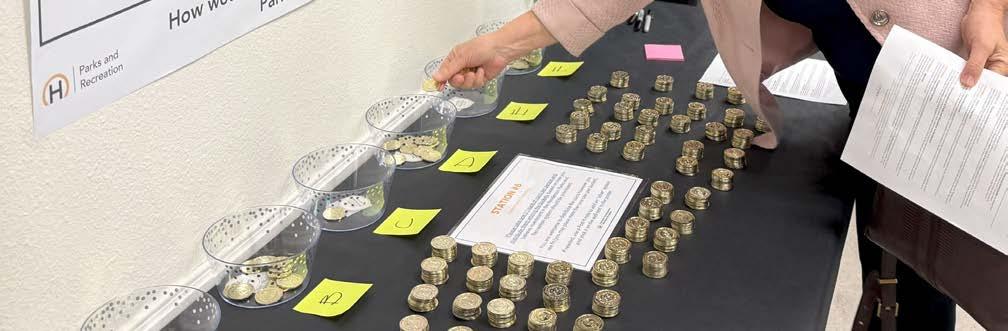
The planning process paired robust engagement with detailed technical analysis. Input included dozens of stakeholder interviews and focus groups, internal work sessions, 11 public workshops, and a statistically valid public opinion survey. Quantitative work included benchmarking, program and facility utilization analysis, and level of service (LOS) evaluation. A defining feature of this update is its resiliency audit program, including standardized evaluations of 35 park sites through a heat and drought resilience lens and architectural resiliency analysis of key recreation and aquatic facilities.
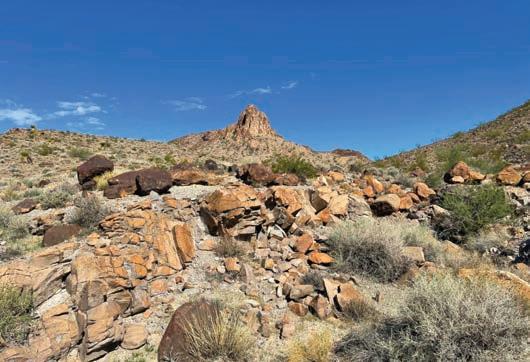
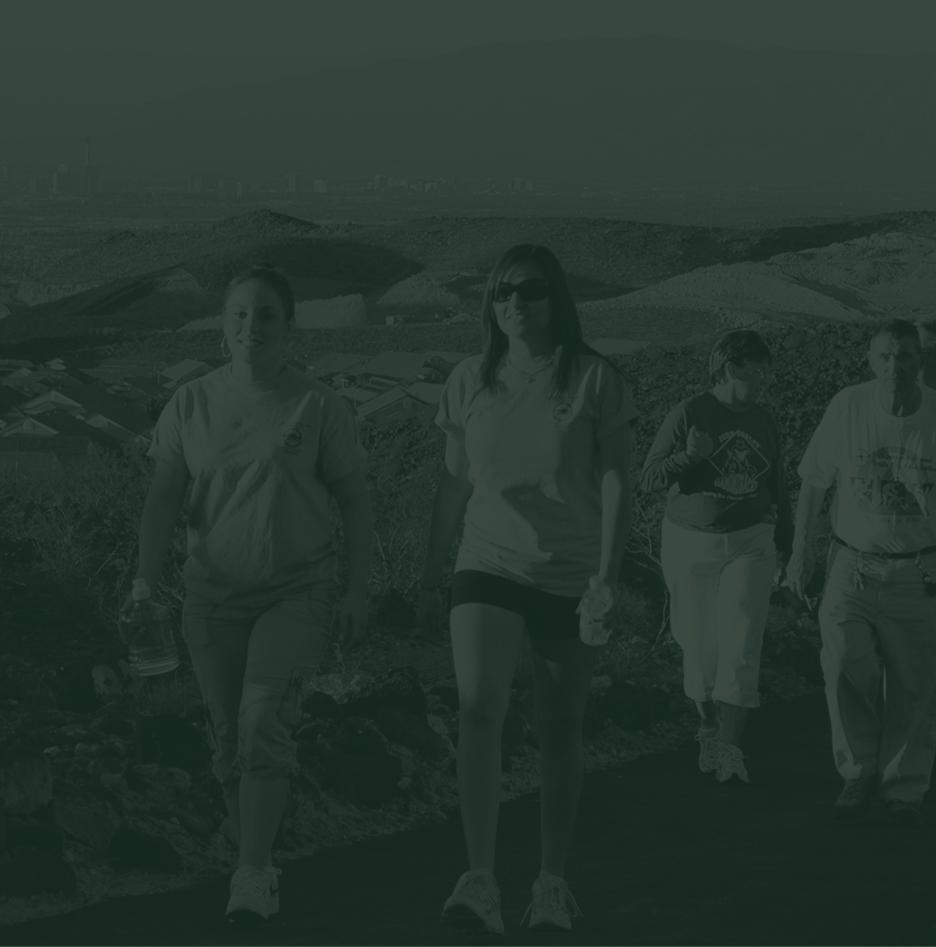
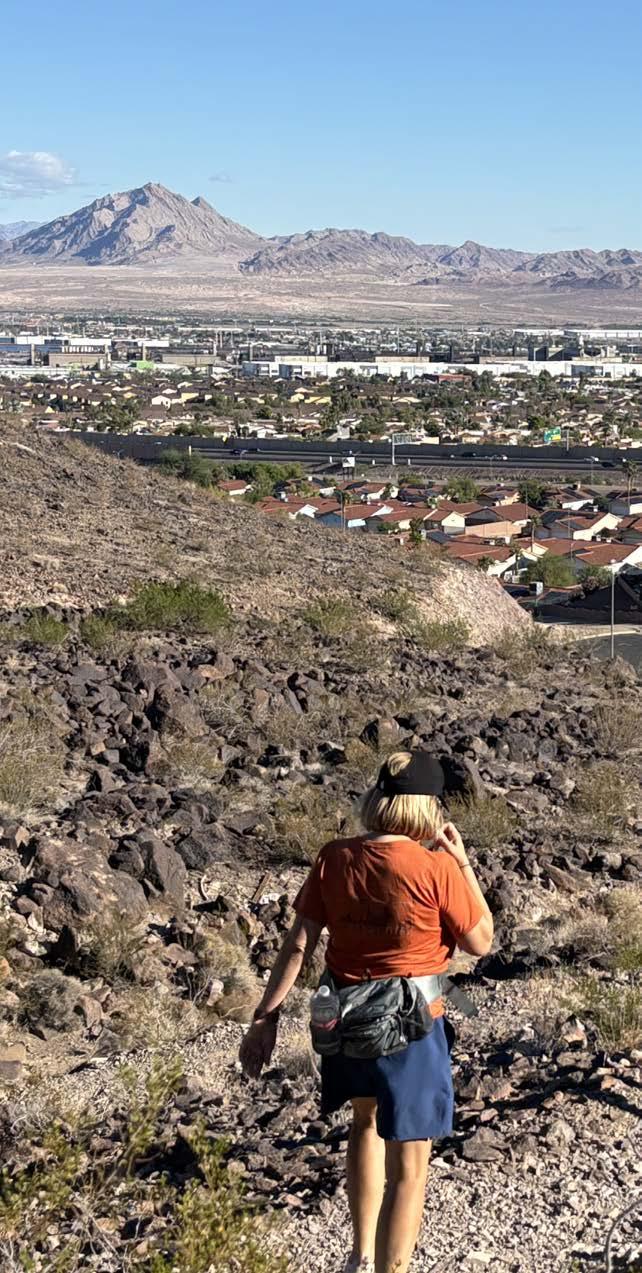
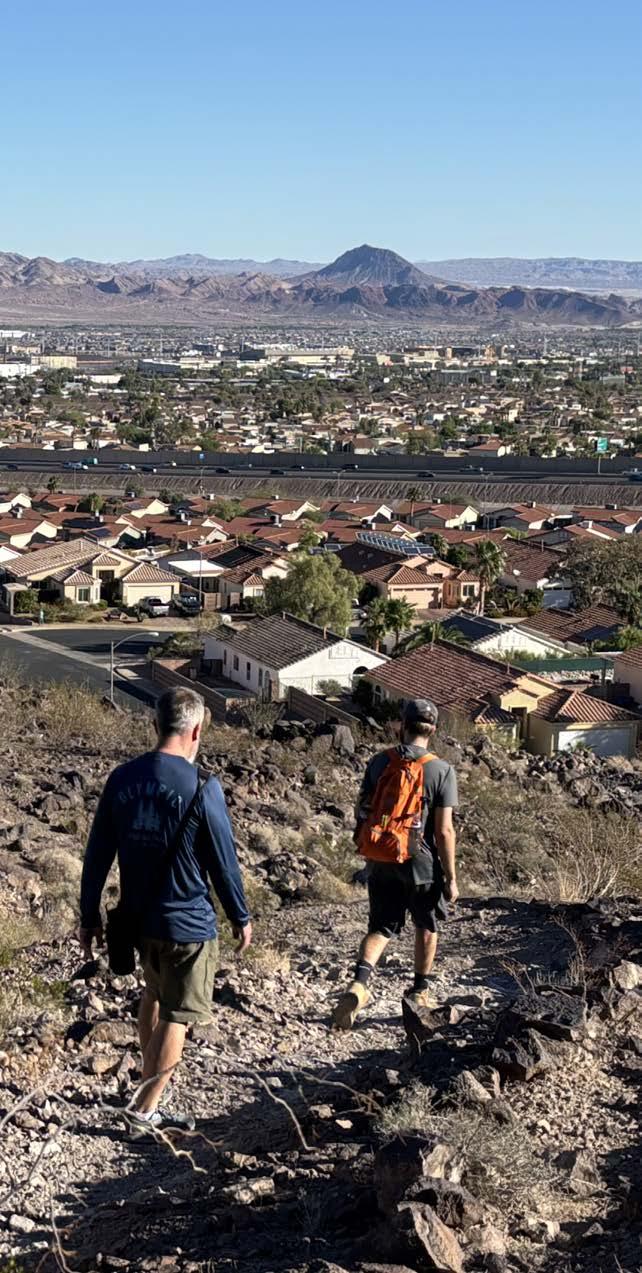
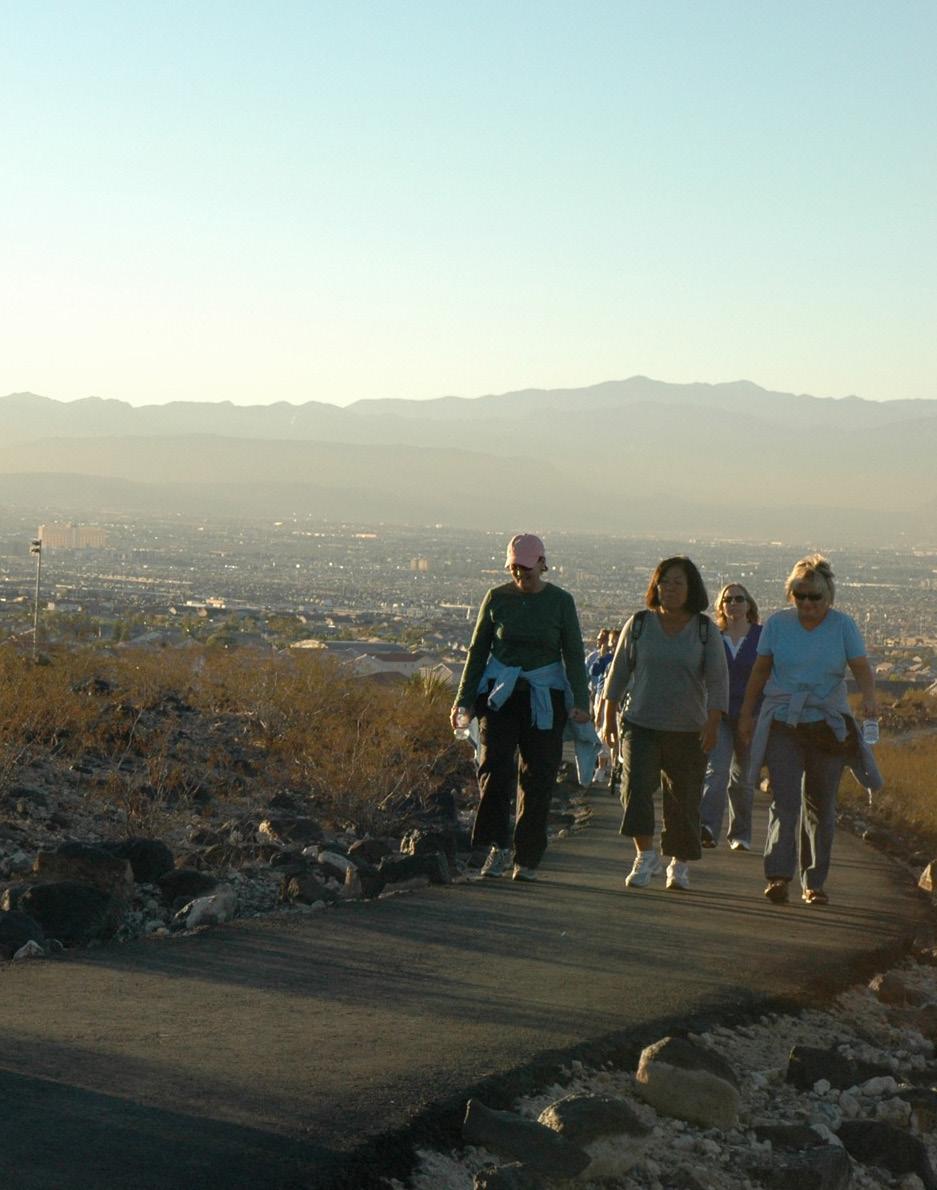
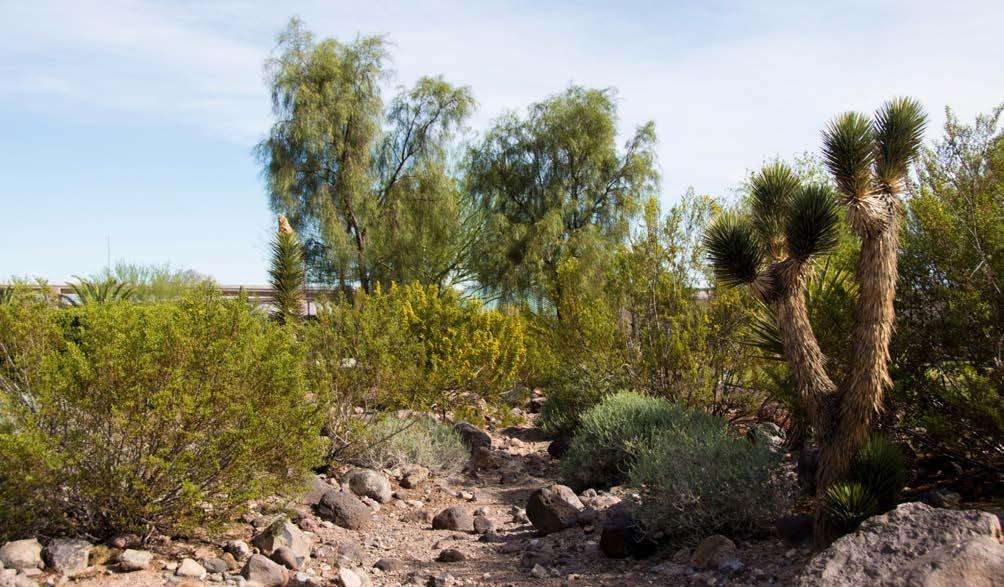
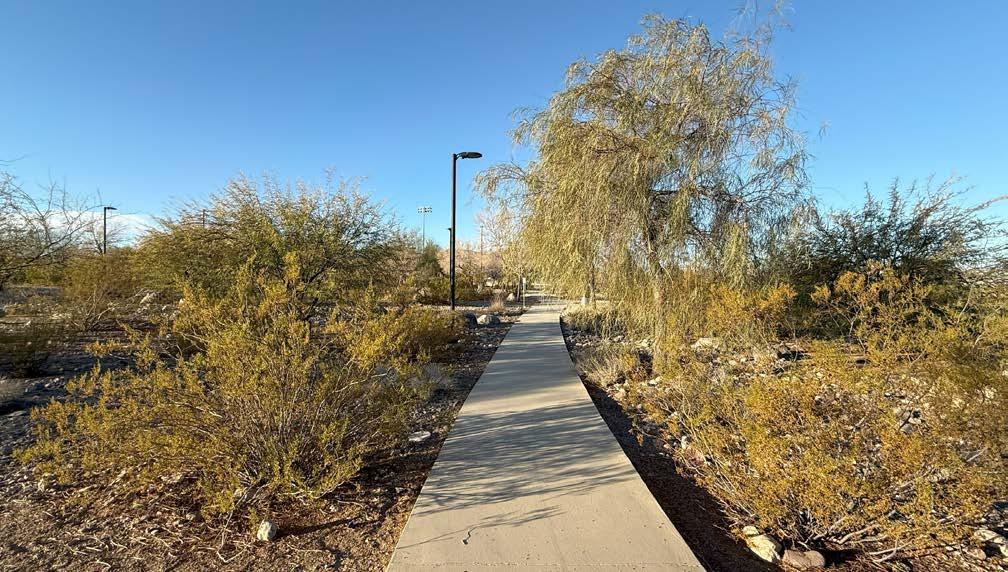
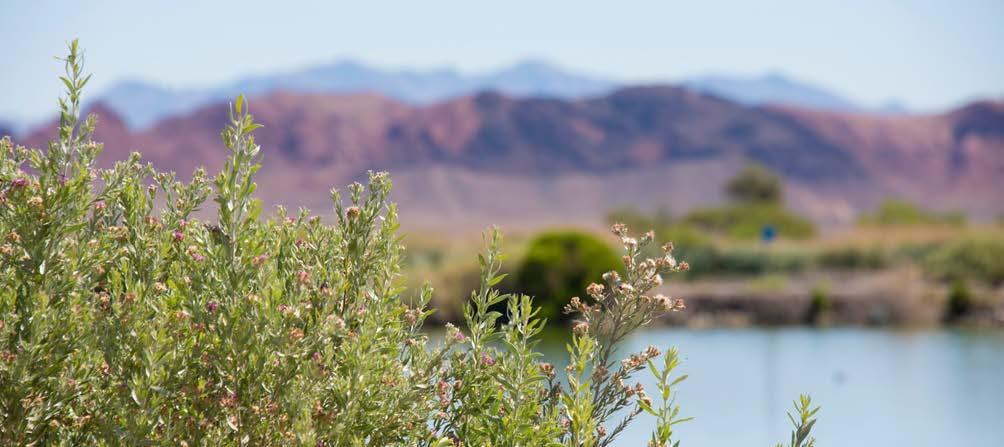
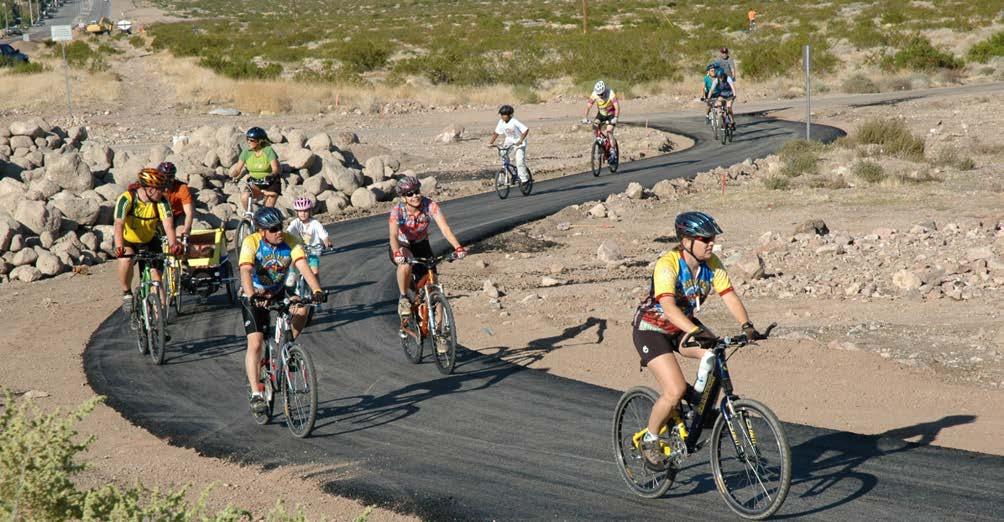
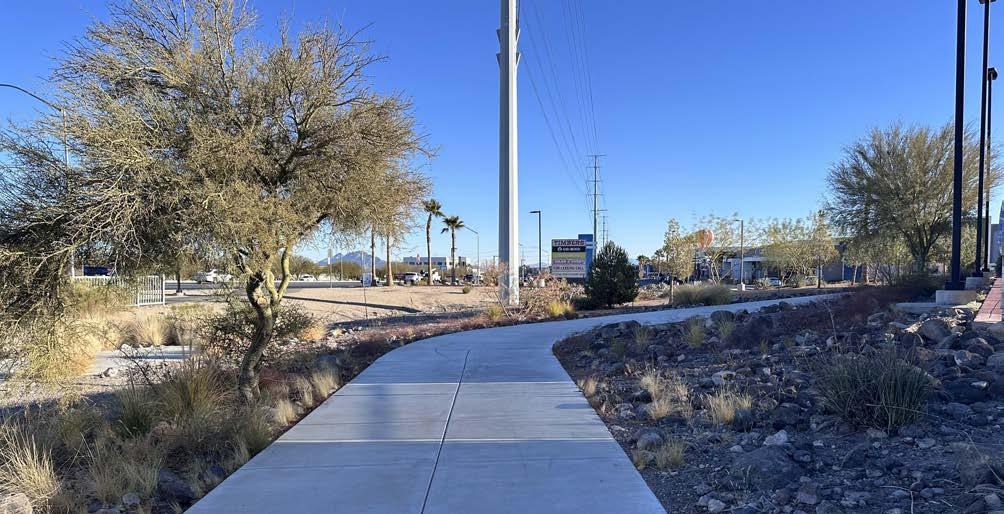
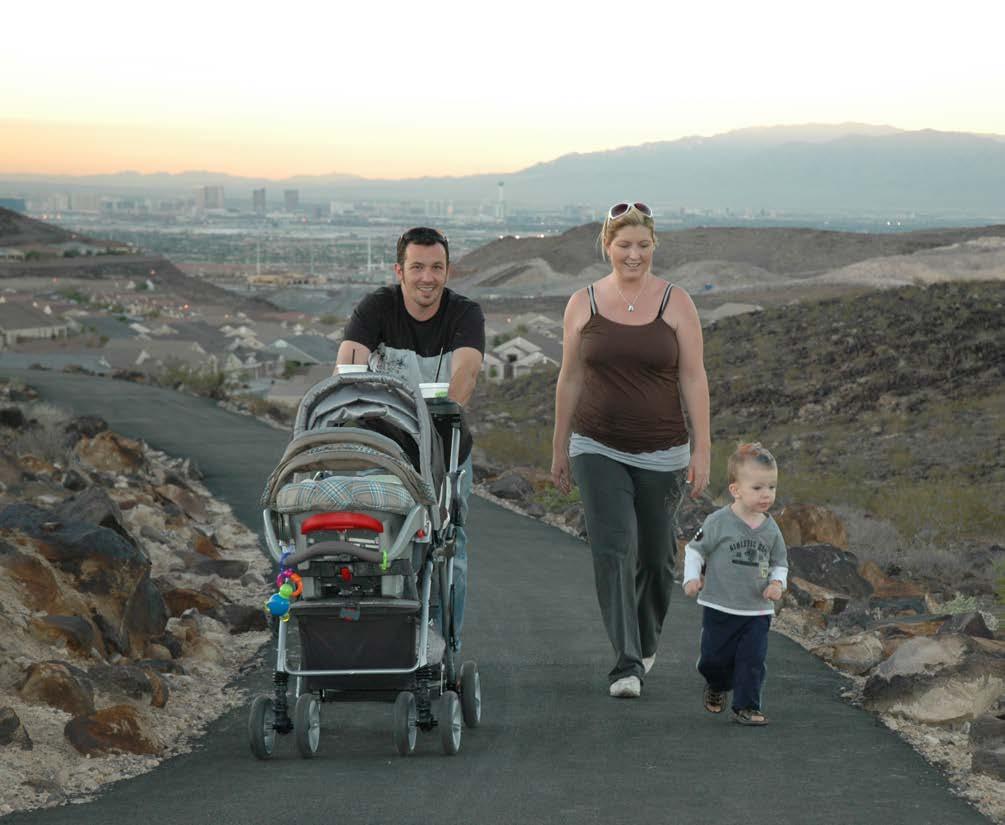
Figure iii.2 - Hikers enjoying a Henderson Trail (COH, n.d.)
EXECUTIVE SUMMARY
PART ONE: PURPOSE & APPROACH
Part One frames Henderson’s Parks and Recreation story as one of purposeful investment and public value, while clarifying the current and historic pressures that are shaping the next phase. The Henderson Parks and Recreation Department’s commitment to parks as essential civic infrastructure is reflected in their national recognition and a strong performance culture, delivering upon their newly adopted Purpose Statement:
“We connect our community through exceptional experiences.”
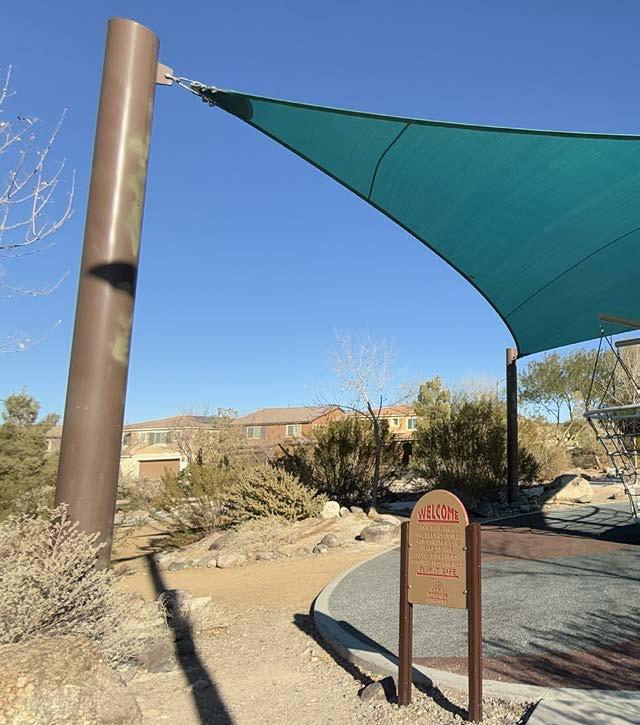
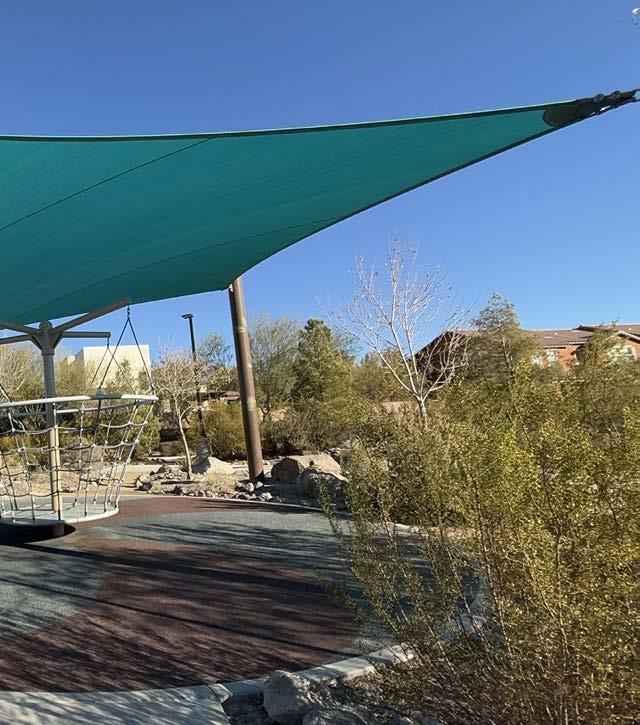
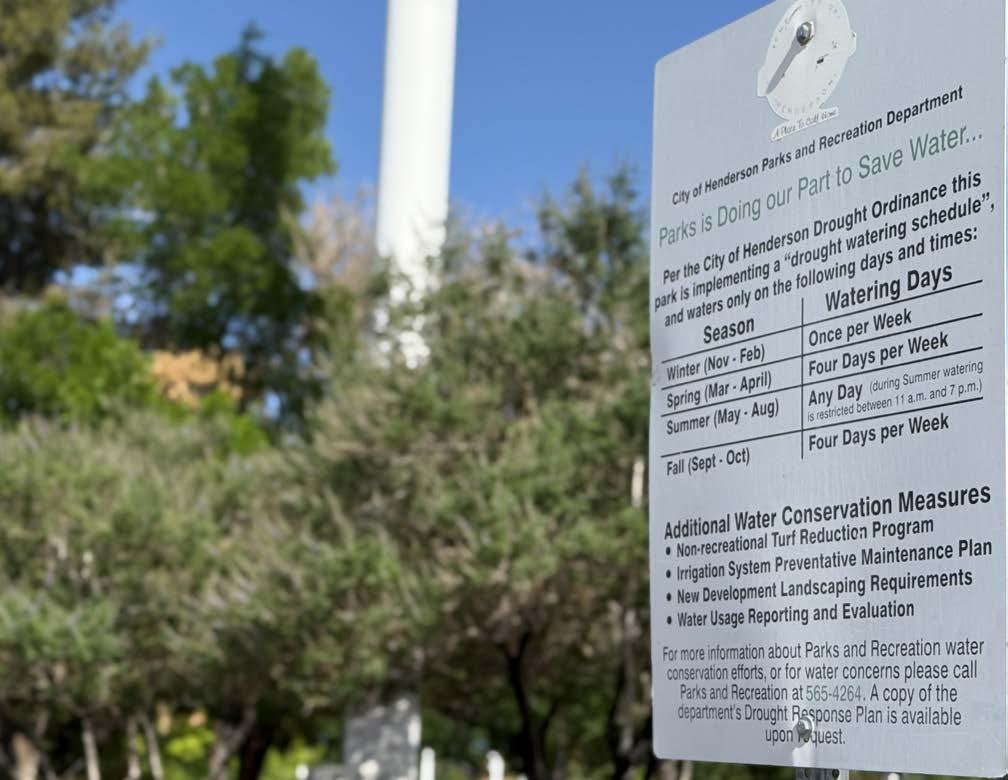
Part One also establishes Henderson’s environmental context and the urgency of increased resiliency and adaptability. Henderson sits within a hot, arid environment averaging just over four inches of precipitation annually, and extreme heat events are intensifying across the region. As Nevada is reliant on the Colorado River for nearly 90% of its water supply, water conservation is central; through various strategic efforts, the City conserved 162 million gallons in 2023 alone, well on their way to a target reduction of 150 million gallons per year by 2027. This context is reshaping both how parks are designed (shade, microclimates, water smart landscapes, durable surfaces) and how services are delivered (cooling amenities, programming schedules, and indoor space demand during summer months).
Finally, Part One clarifies how this update both complements the 2019 master plan and supersedes it to adapt to changing conditions. It maintains continuity with the 2019 framework, while updating priorities to reflect post-COVID shifts in how residents use parks and programs, the rising importance of resilience, and the realities of a maturing system that increasingly requires reinvestment to maintain quality, not just new growth.
PART TWO: EXISTING CONDITIONS
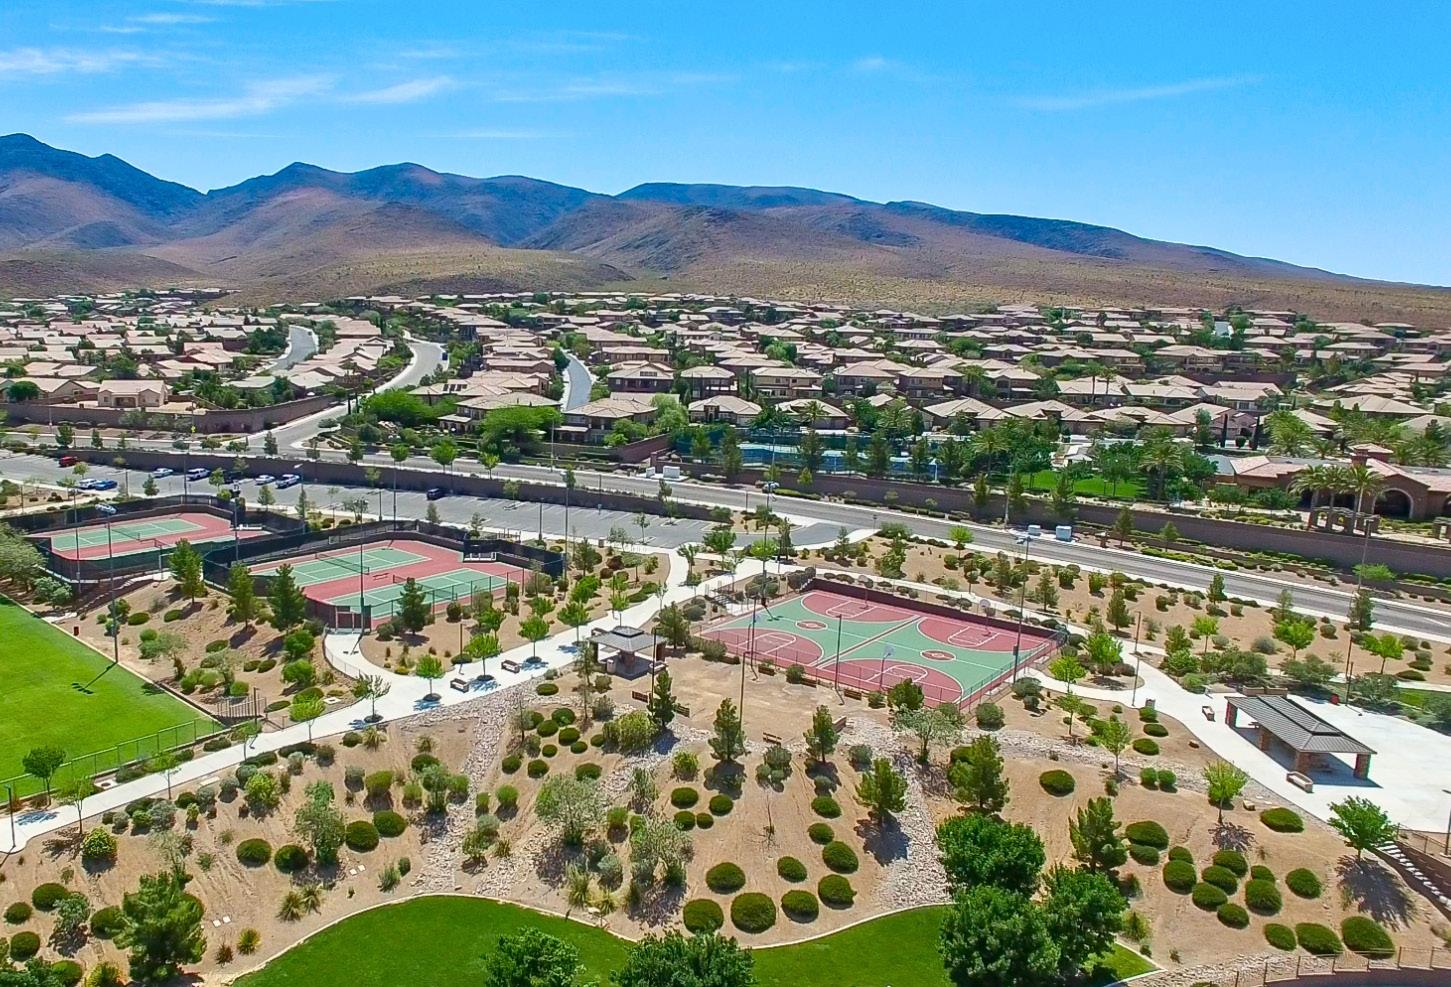
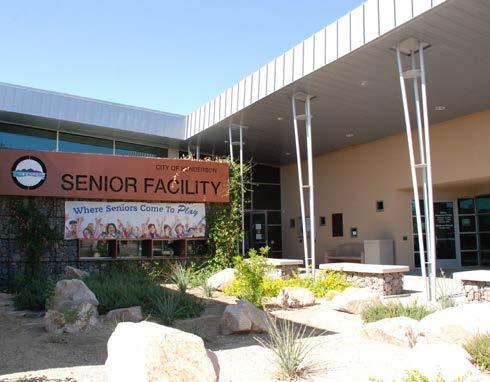
Part Two documents Henderson’s system today and establishes baseline performance metrics for future planning. As of March 2026, Henderson maintains a large and diversified portfolio that includes 77 park sites (representing about 1,360 acres of developed public park land), more than 300 miles of trails, eight recreation centers (including two dedicated 50+ centers), six aquatic facilities, and approximately 105 athletic fields—alongside signature destinations such as the Henderson Bird Viewing Preserve and Water Street Plaza.
The existing conditions analysis confirms that Henderson performs strongly on park access but faces challenges in developed park acreage and long-term reinvestment amidst population growth. Trust for Public Land’s ParkServe® analysis indicates that about 85% of residents currently live within a 10-minute walk of a public park or greenspace, yet targeted gaps remain, most notably in rapidly developing southern and western parts of Henderson and planned communities like Cadence.
On the acreage side, the LOS analysis documents that although the City has added over $100M of turnkey (developer-delivered and funded) public parks to keep up with rapid growth, a deficit relative to P&R’s long-standing and aspirational LOS target (5.5 acres/1,000 residents), reinforcing the continued need for new park delivery and strategic acquisition as Henderson continues growing.
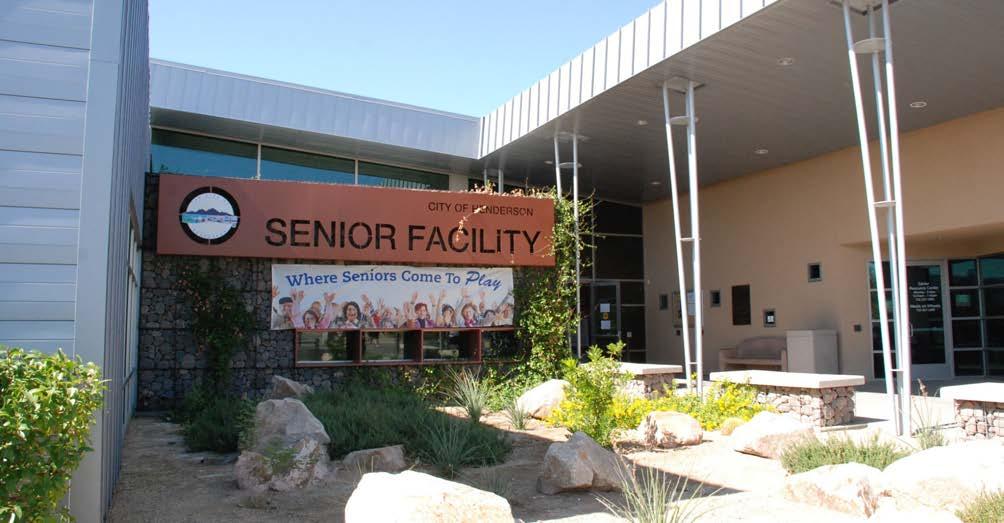
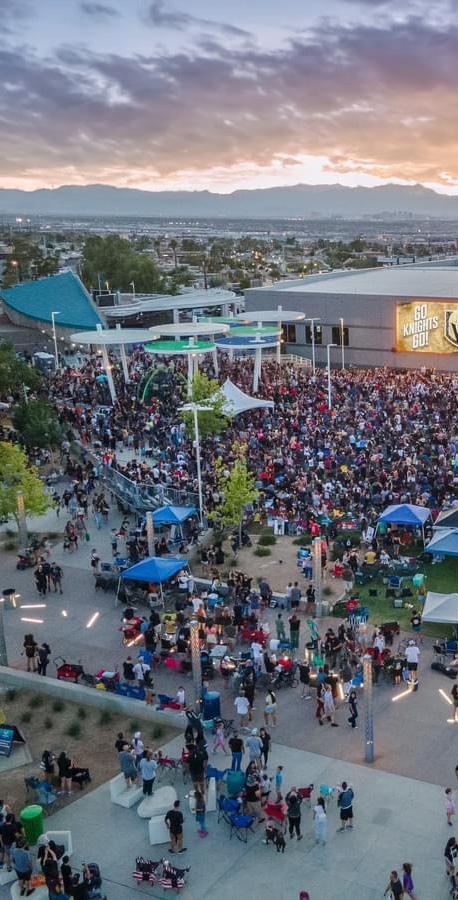
Part Two also highlights P&R’s expanding role as a cross cutting civic platform. In addition to parks, trails, and facilities, P&R delivers a broad portfolio of programs and services, including before and after school care (Safekey and Teen Scene) and senior nutrition and meals delivery, and contributes directly to community resilience through heat response operations and public space coordination. P&R also generates significant economic impact through events: in the last two years, Henderson hosted 4,944 sports tournament teams with an estimated economic impact of $108 million.
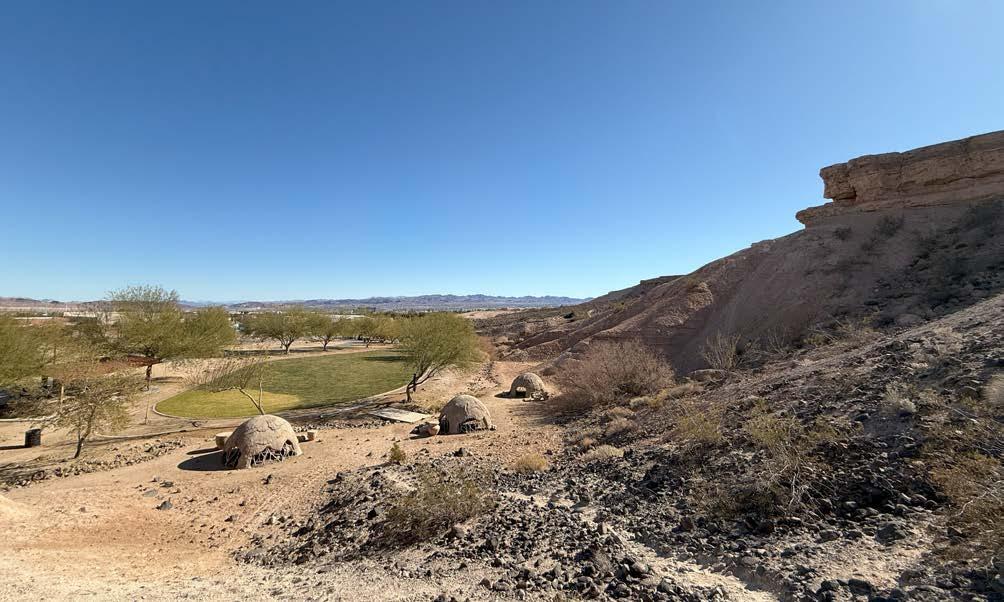
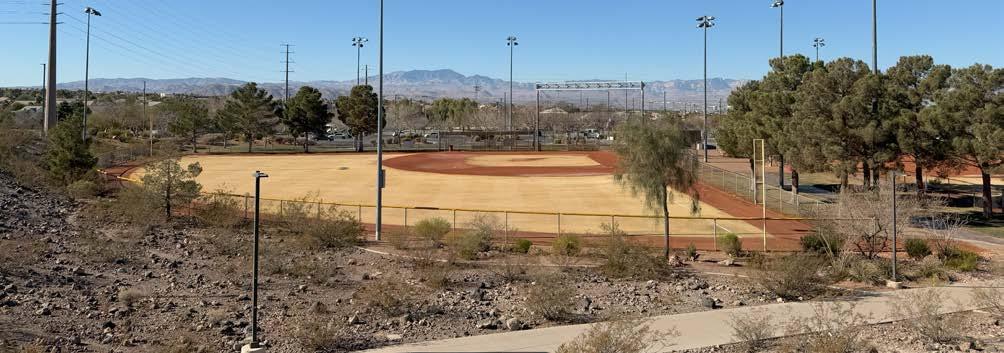
A defining technical contribution of Part Two is the resiliency audit for existing parks and facilities. Using a standardized evaluation framework, the Project Team evaluated 35 park sites (over 880 acres) and four indoor facilities to establish a comparable baseline of heat- and drought resilience performance. Most evaluated sites meet the minimum, baseline expectations, however, the audits also identified recurring system-wide opportunities for improvement that will, over the long-term, make Henderson’s parks and facilities safer and easier to access, activate, and maintain.
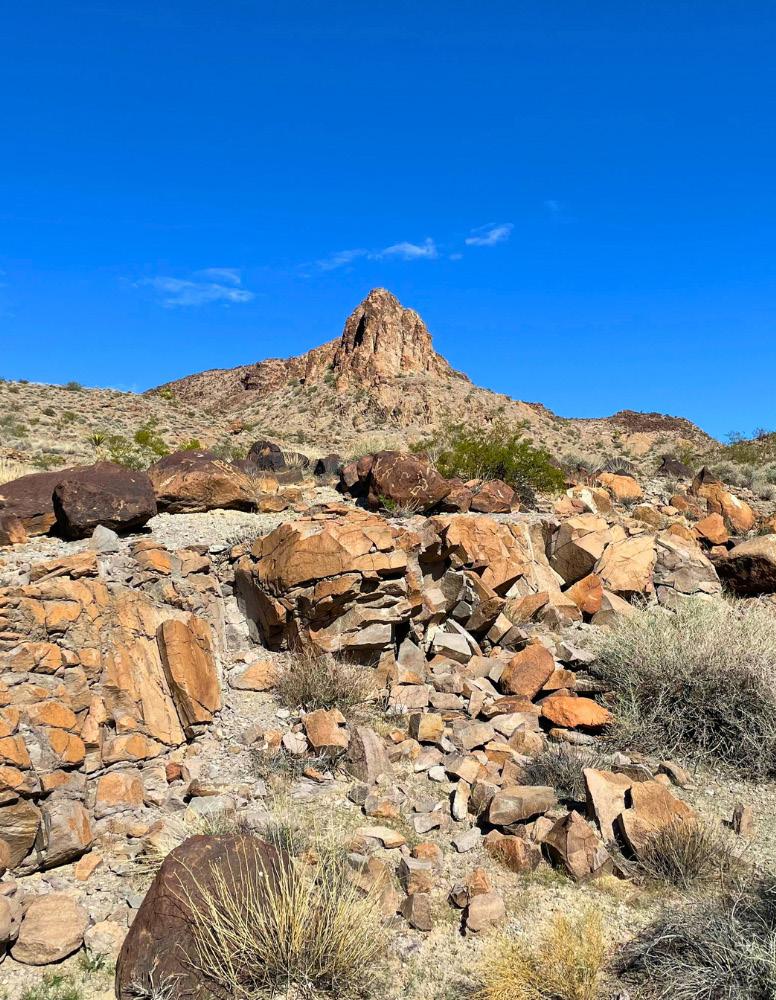
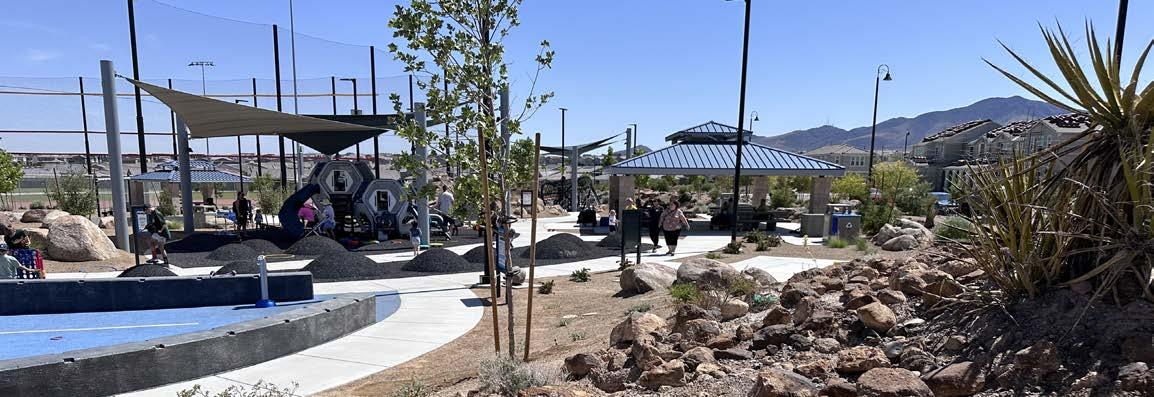
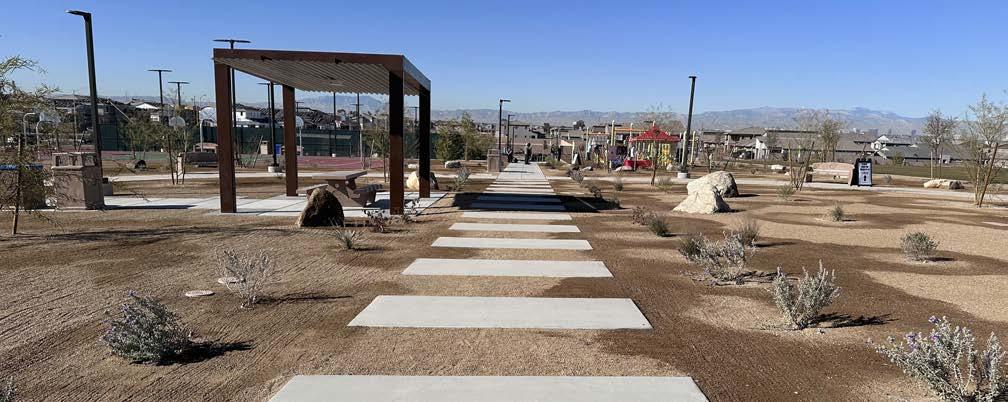
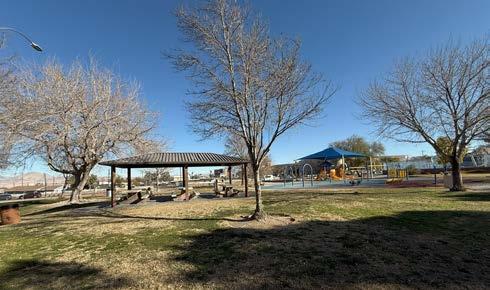
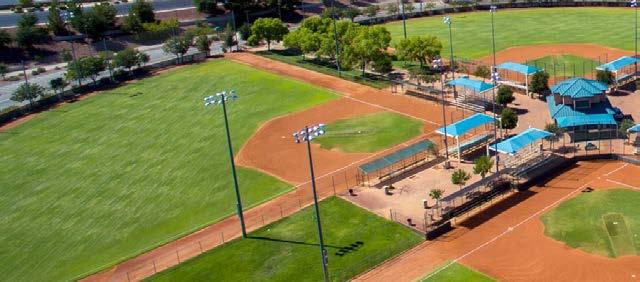
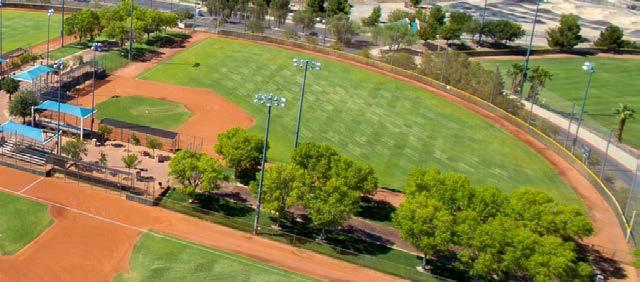
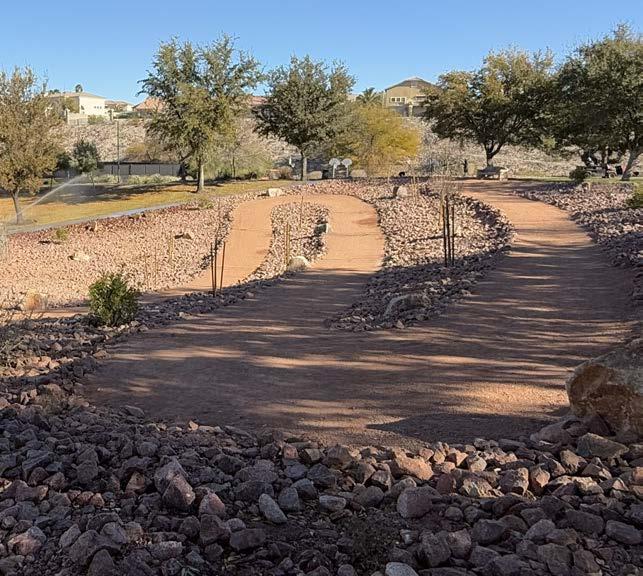
Figure iii.3 - Montagna Park (2025).
EXECUTIVE
PART THREE: NEEDS & PRIORITIES
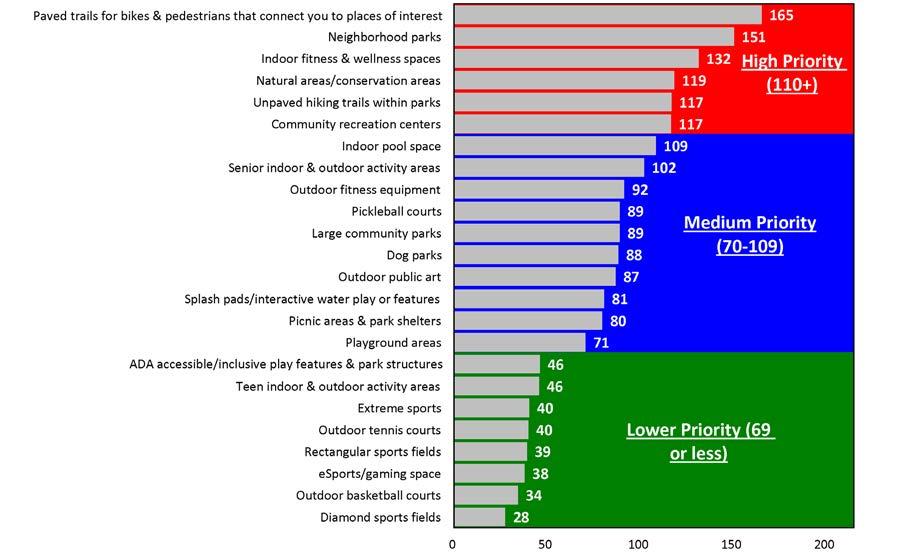
Part Three translates engagement and analysis into an agreed set of needs and priorities that serve as the framework of the plan’s recommendations. The needs assessment leveraged a “triangulated” approach that combined anecdotal inputs, qualitative engagement, and quantitative analysis, then “ranked” findings across 12 methods. The highest priority needs are those confirmed across multiple sources, often six or more techniques. This approach ensures that priorities reflect broad and repeated community agreement rather than a single workshop or survey result.
The most consistently confirmed needs include: additional parks and facilities in southern and western parts of Henderson; renewal of the dedicated parks and recreation tax override that has underpinned long term operations and maintenance of the entire system since 1997; expanded youth programs and youth serving services (including before and after school programming); additional indoor
recreation centers and expanded indoor aquatics to support year round use and relieve peak time capacity constraints; reinvestment in aging parks and facilities; more shaded amenities and comfort upgrades; and the need for additional funding and staffing capacity for maintenance and operations so that new investments can be successfully sustained.
A key insight from the needs assessment is that Henderson’s summer heat has become the single greatest barrier to park and program use, far surpassing cost, parking, or safety concerns. This reality is changing how and when residents recreate, increasing reliance on indoor spaces and shifting outdoor use toward mornings and evenings. The plan responds by embedding heat and drought resilience into design, construction, programming, and operations system wide and by prioritizing investments that make parks comfortable and usable across more of the year.
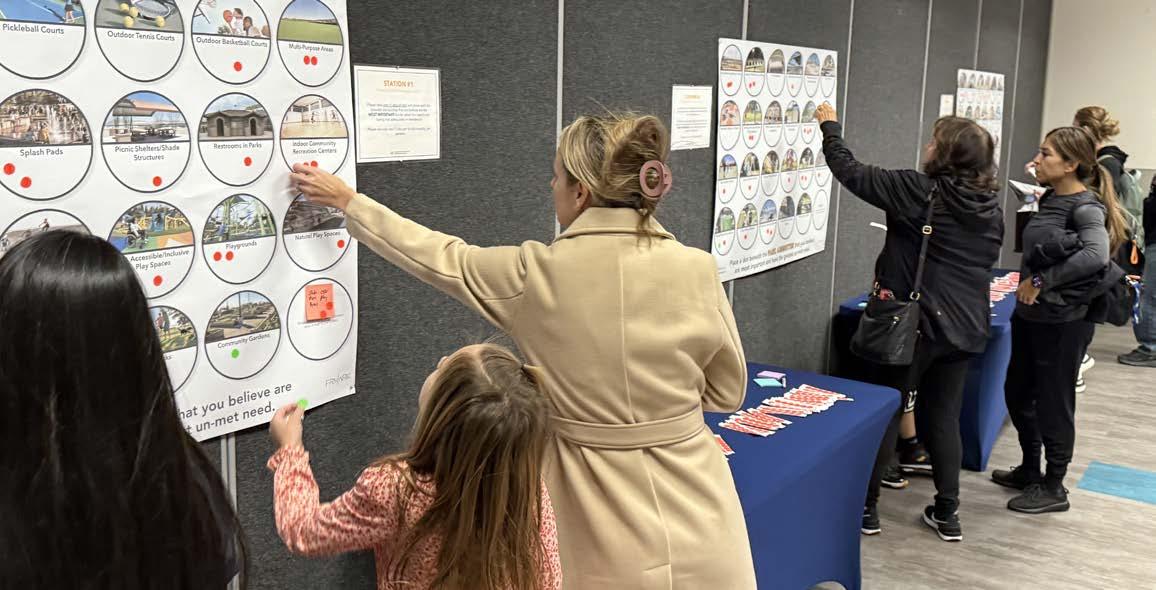
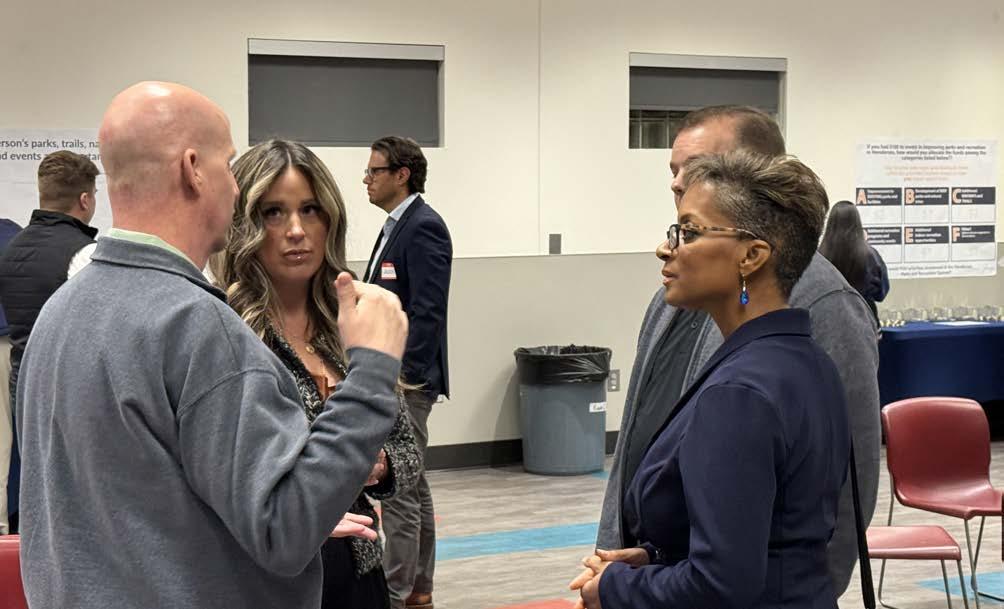
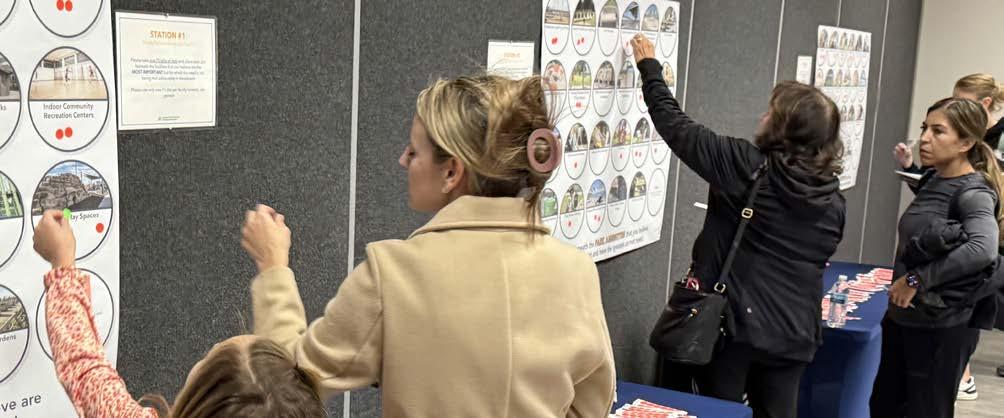
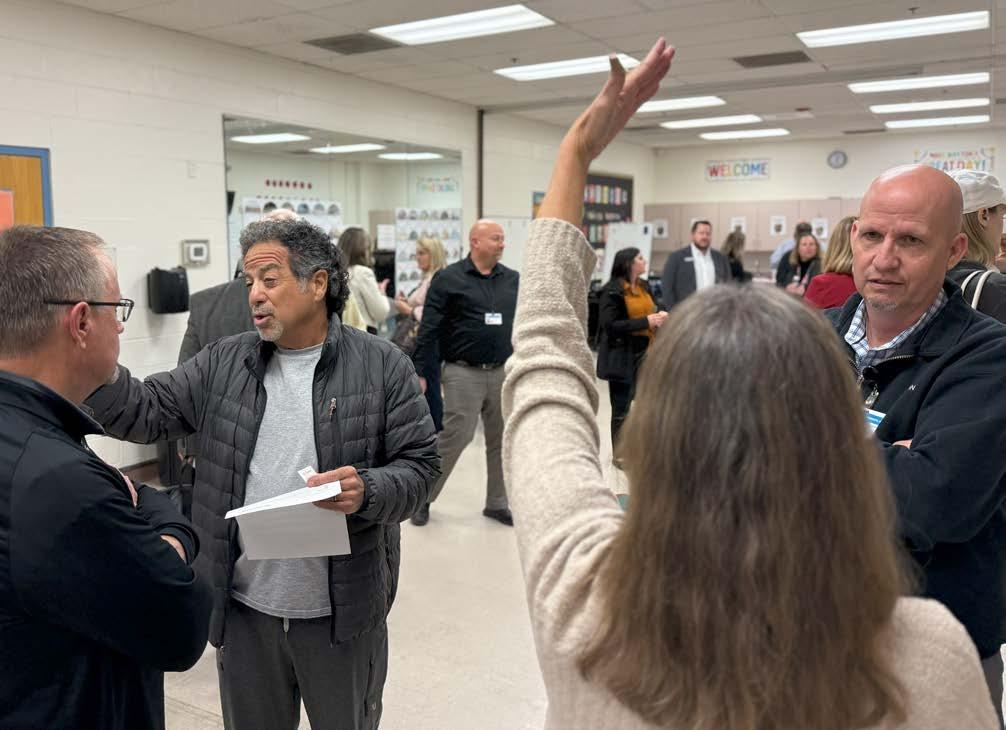
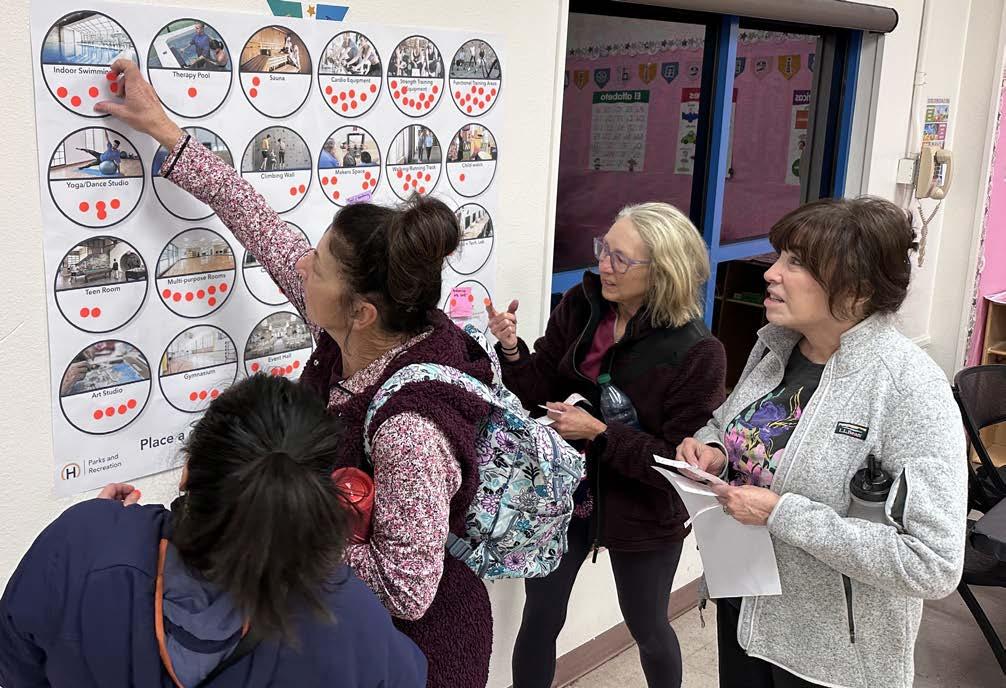
Figure iii.4 - Henderson residents participating in the master plan community needs and priorities workshop (2025).
PART 0NE
PART FIVE: ACTION
Part Five converts the Vision into a practical Action Plan that sequences projects and policies into near term “quick wins,” mid term priorities, and long range initiatives. Implementation is framed around both capital delivery and lifecycle operations: order of magnitude capital and operations and maintenance (O&M) implications were anticipated for major initiatives; staffing and maintenance impacts were identified; and funding and financing tools were evaluated and prioritized.
The Action Plan is organized around ten (10) guiding objectives, with early objectives focused on protecting the financial foundation of the system and strengthening public understanding of what HPRD
ACTION PLAN GUIDING OBJECTIVES:
provides. Objective 1 focuses on providing stable, long-term funding for operations and maintenance to meet both current requirements AND future increases as the system grows, reinforcing the needs assessment finding that stable O&M funding is the backbone of long term system resilience.
Actions are organized by priority and then assigned to one of four dedicated P&R tracks for responsibility and assigned a project type (such as “policies” or “capital”). In addition, the action plan identifies key master plan sections that are the most pertinent to each action, as well as other action plan tasks which may be prerequisites.
1. Provide stable, long-term funding for operations and maintenance to meet both current requirements AND future increases as the system grows.
2. Raise public and stakeholder awareness of the comprehensive “value” of the Henderson Parks & Recreation Department and system.
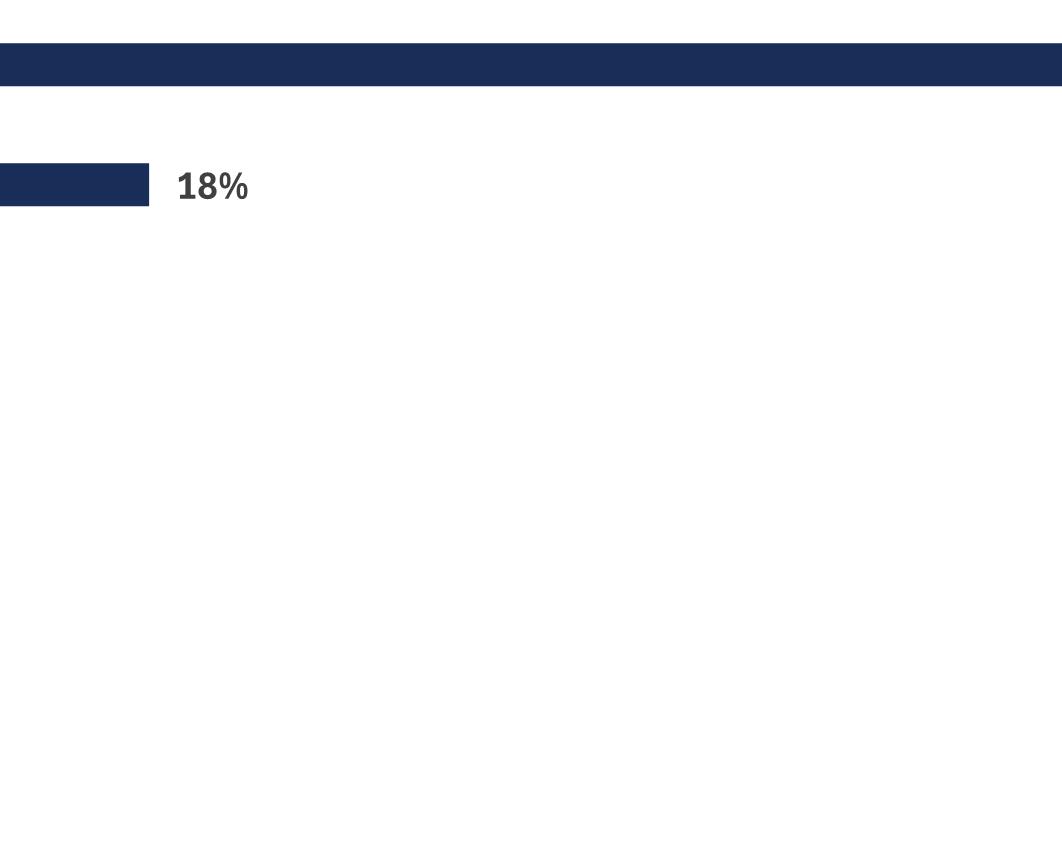
3. Leverage earned revenues to incrementally increase the overall cost recovery rate of Parks and Recreation from 17% in 2025 to align with the national median of 25%, while ensuring equitable access to all facilities and programs is maintained.
4. Update the “Public Works and Parks and Recreation Department Standardized Design Guidelines” document to reflect changes in contemporary recreational trends and an increased focus on heat and drought resilience.
5. Make strategic, incremental improvements to existing parks to increase activation, resilience, and safety.
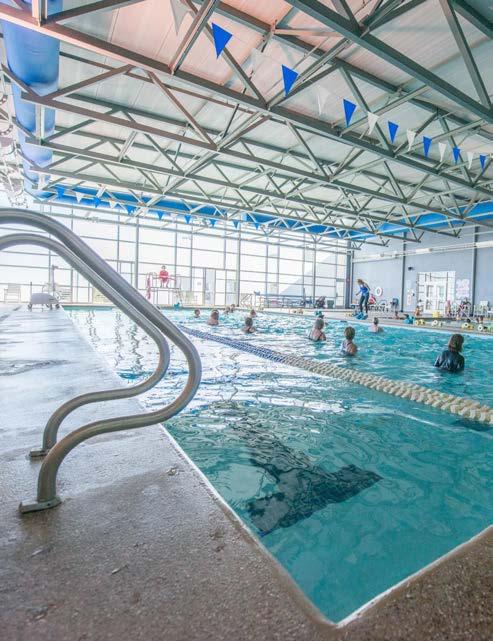
6. Expand access to indoor recreation and aquatics facilities, programs, and events.
7. Increase program and event participation by eliminating equity and access barriers.
8. Continue to pursue P&R’s longstanding aspirational goal of providing 5.5 acres of parkland per 1,000 population by building new parks in growing and underserved areas.
9. Increase efficiency and reduce long-term costs by better leveraging available technologies and systems to streamline maintenance and operations processes.
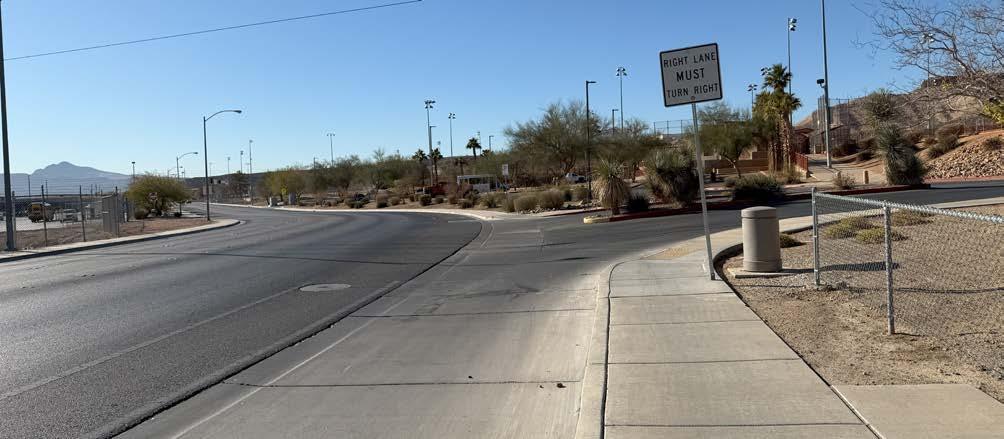
10. Increase the utilization and activation of parks and facilities by improving community-wide walkability and connectivity.
The action plan documents that the existing dedicated tax levy in place since 1997 currently provides about 40% of all O&M funding and is scheduled to sunset in 2027 unless renewed. It is essential to recognize that the revenues generated from this existing mechanism exclusively funds the ongoing operations and maintenance of the City’s existing (2026) parks and recreation facilities and programs. It does not cover costs associated with developing new programs or the maintenance or construction of new/future facilities, nor does it enable P&R to incur new debt.
As such, even if voters elect to renew the existing dedicated tax levy at its current rate (set in 1997), the Plan recommends that P&R petition City Council to amend the existing general fund millage rate to provide sufficient, sustainable funding for the renovation of aging legacy parks and the maintenance, operation, and activation of future parks, trails, and facilities that will be necessary in order to maintain the current level of service provided to residents as the city continues to grow.
Part Five also documents the City’s existing capital delivery tools and identifies strategies for diversification and alignment. Henderson has historically delivered new parks and trails through a combination of developer delivered “turnkey”
EXECUTIVE SUMMARY
parks, residential construction tax where eligible, and grants—especially Southern Nevada Public Land Management Act (SNPLMA) Parks, Trails, and Natural Areas funding. SNPLMA is particularly foundational: as of 2025, Henderson has been awarded $235+ million for 30+ parks and trails projects through the program. This Plan recognizes the strength of this model for capital delivery and outlines the complementary strategies needed to strengthen fiscal resilience over time: reinvestment planning for aging assets, diversified revenues to support operations, and alignment between new capital delivery and long term maintenance capacity.
MORE THAN A PROJECT LIST
Implementation, in other words, is not simply a project list—it is a disciplined decision framework for making investments over time for both existing and future assets. By pairing clear priorities with actionable strategies, funding guidance, and a sequenced timeline, the master plan update positions Henderson to remain an award winning parks and recreation leader while becoming more relevant, more equitable, and more financially resilient so that, in the years ahead, P&R can continue to “make it possible” for every Henderson resident.
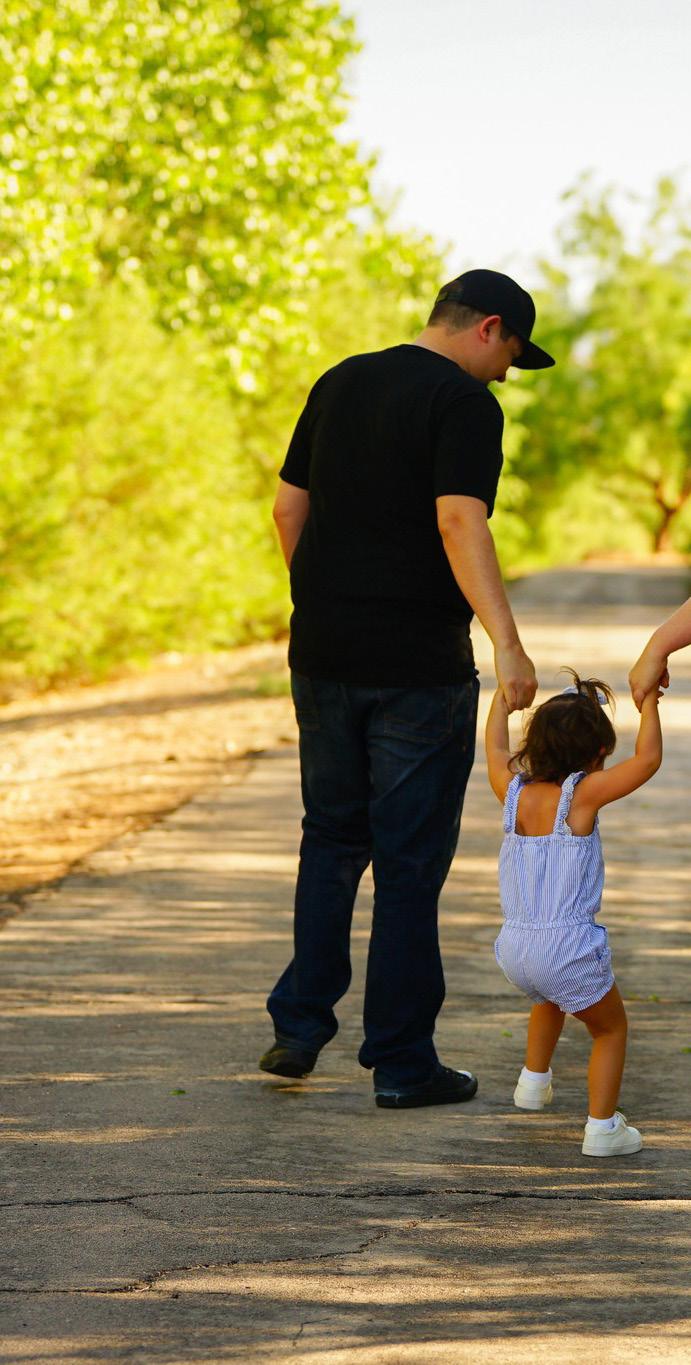
Figure iii.6 - Children participating in a program at the Henderson Bird Viewing Preserve (COH, 2026).
PART 0NE
B. HENDERSON’S NEW “NORMAL”
Henderson sits within the Mojave Desert’s Basin and Range ecoregion, a hot, arid environment characterized by very low annual precipitation and intense summer heat. In recent decades, extreme heat events have become more frequent, longer, and more intense across the United States; locally, the Las Vegas Valley set an all-time daily high of 120°F on July 7, 2024.
Heat is a public health and safety issue, particularly during the summer and for people experiencing homelessness—so the City is continually embedding heat resilience into parks and recreation operations. Recreation centers are activated as daytime cooling stations under the National Weather Service warnings, programs have shifted to include more indoor and evening offerings during peak heat, and park designs increasingly emphasize shade, hydration, and shelter. These actions position parks and facilities as core assets in the City’s emergency response network while maintaining access to recreation throughout the hottest periods.
With a desert climate averaging just over four inches of precipitation annually, Henderson— like all Southern Nevada communities—depends on the Colorado River for nearly 90 percent of its water supply. Nevada’s basic apportionment from the river is 300,000 acre -feet per year, and ongoing drought and shortage conditions have required Lower Basin reductions in recent years. To remedy this, Henderson is pursuing an aggressive resilience agenda in its parks and public landscapes: eliminating nonfunctional turf in alignment with state law, minimizing irrigation, converting high-water turf to water-smart grasses or native plant palettes, and modernizing irrigation controls. These measures have delivered measurable results. In 2023 alone, city parks conserved more than 162 million gallons of water, part of a citywide reduction of over one billion gallons compared with the prior year. Ongoing projects—such as turf conversion at Anthem Hills Park and other sites—are projected to save additional millions of gallons annually while expanding the tree canopy and thermal comfort.
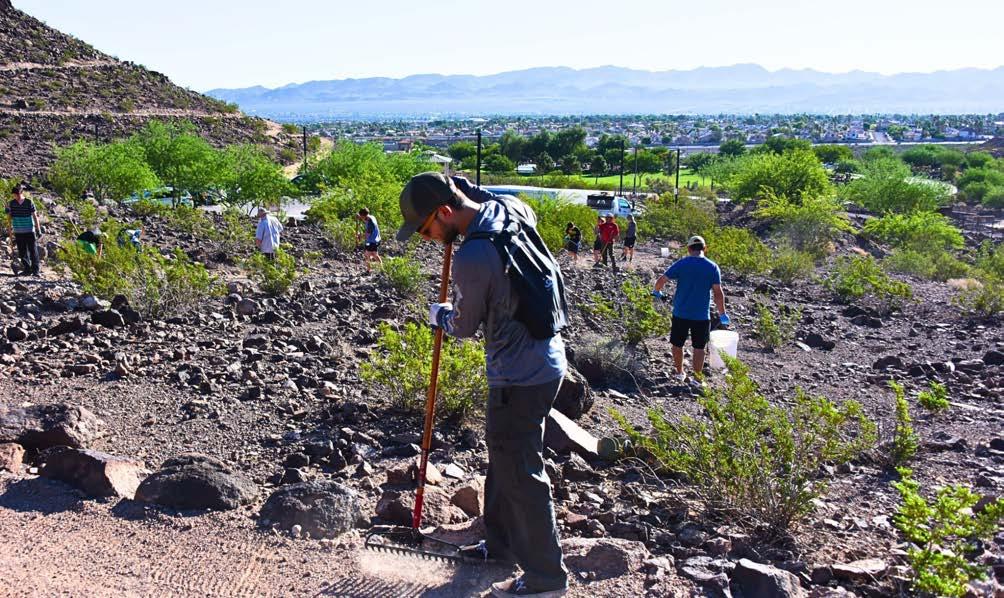
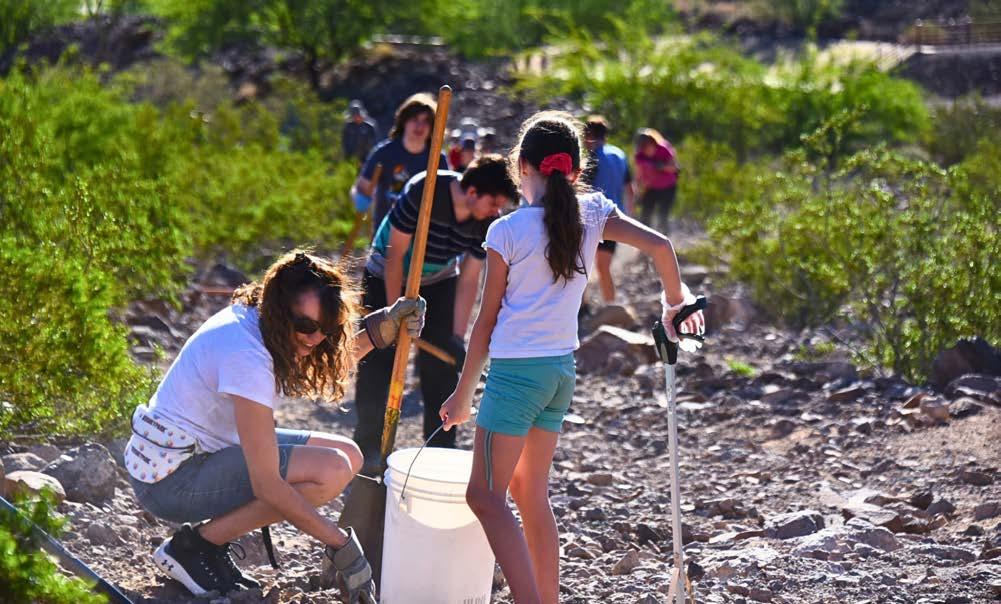
Figure 1.2 - Volunteers participating in a park clean-up day in Henderson (COH, n.d.)
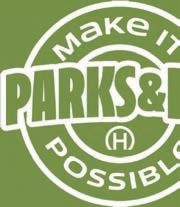
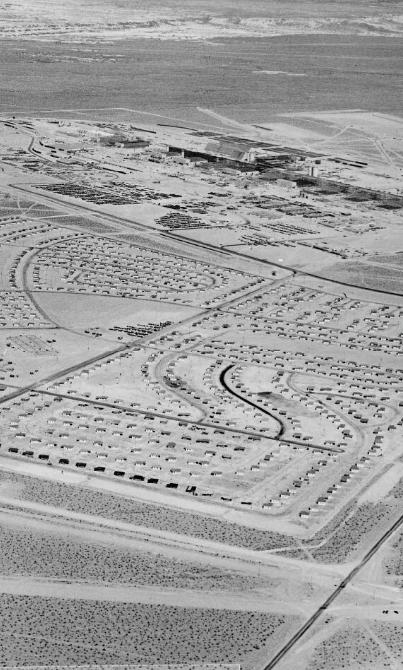
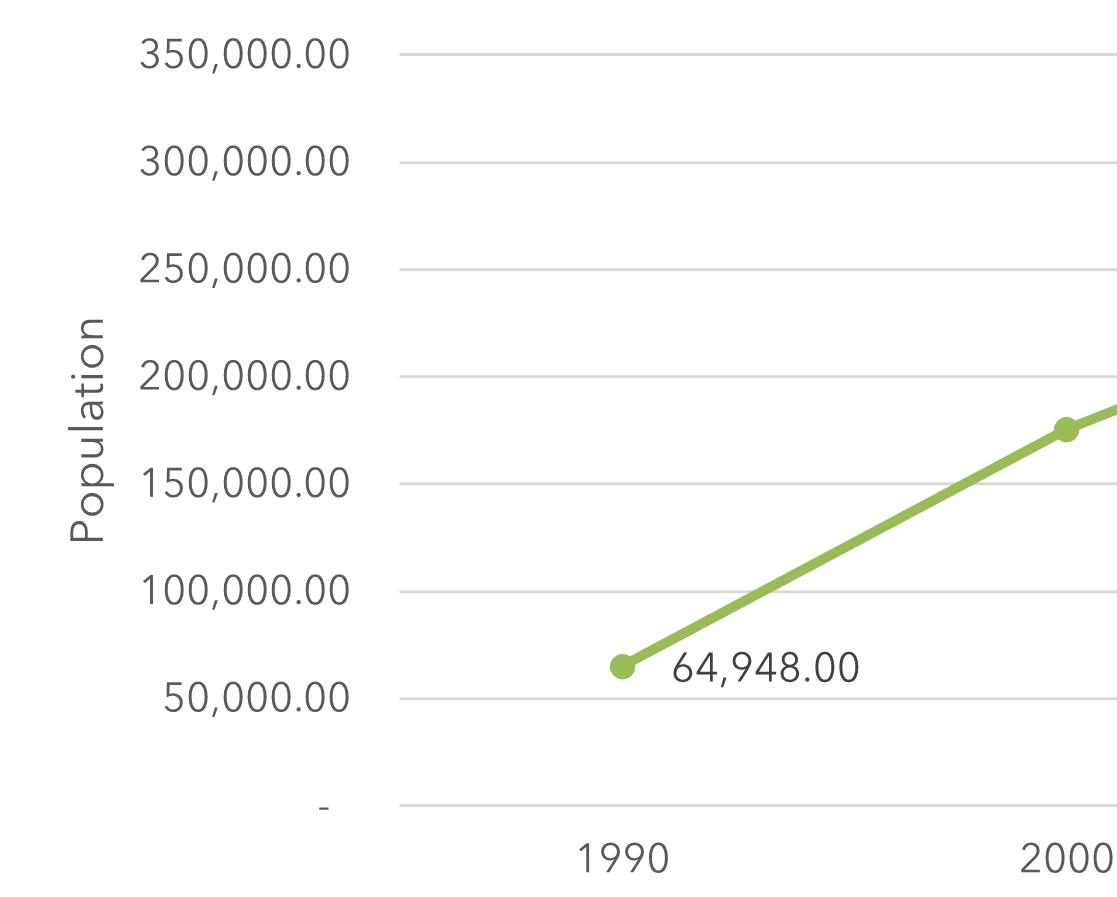
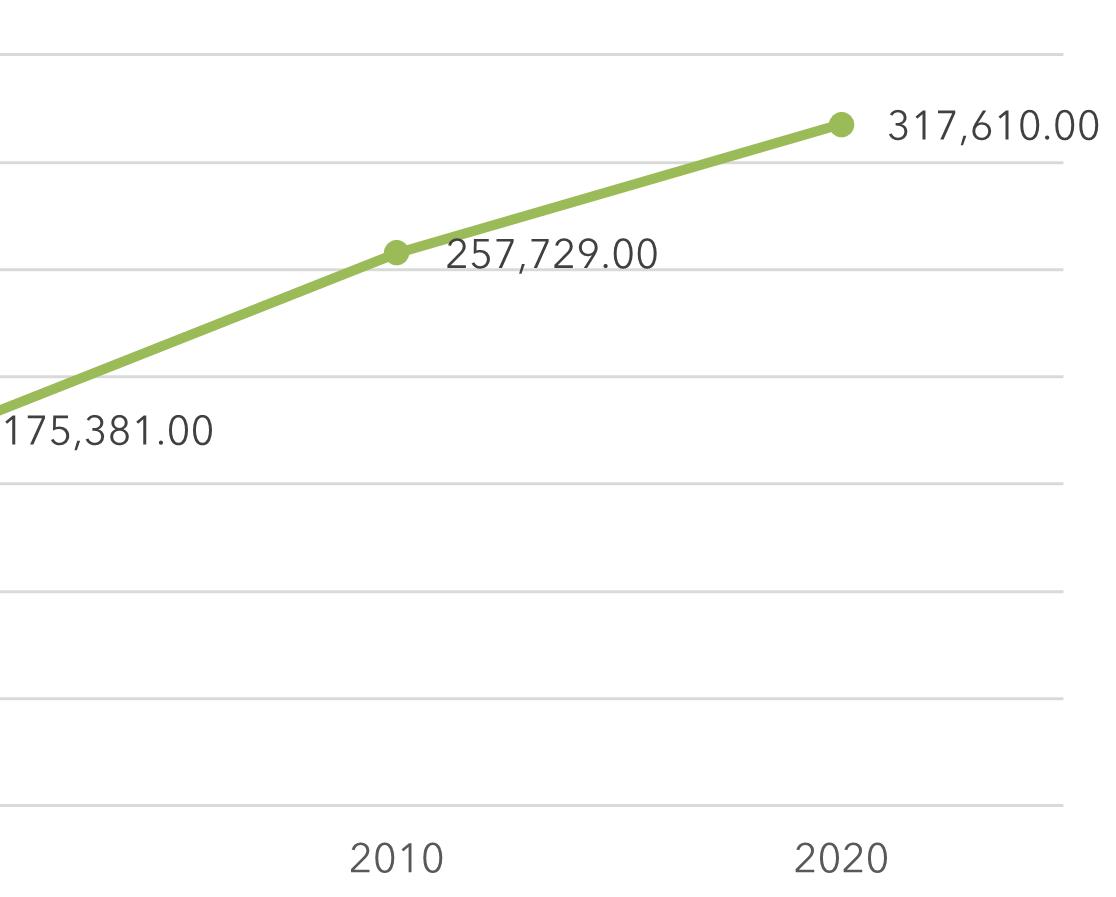
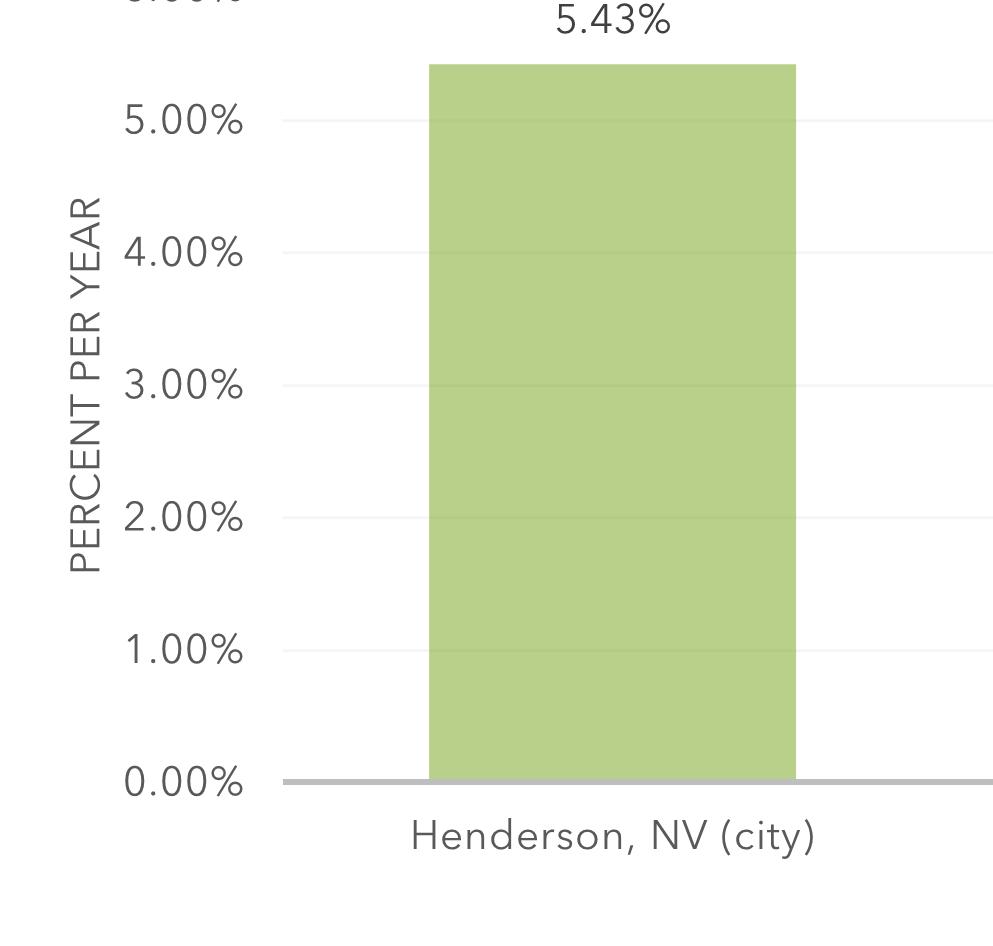
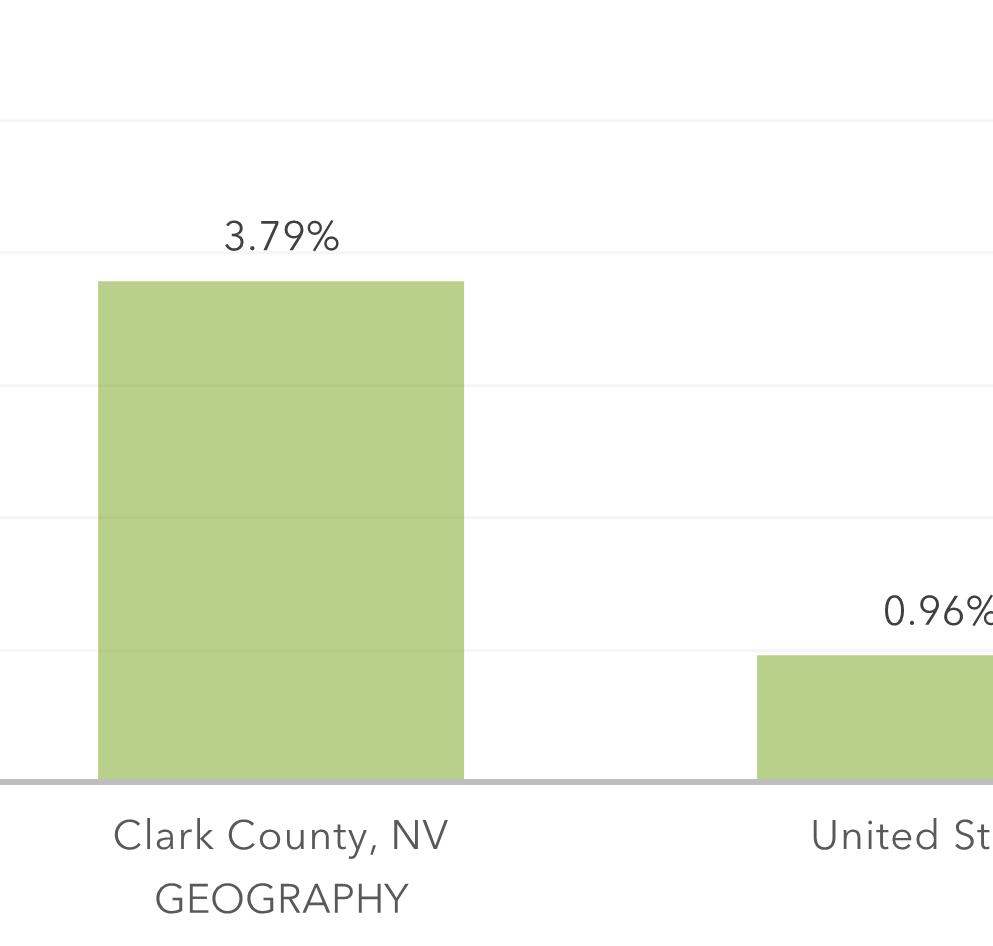
C. EMBRACING GROWTH
Henderson is projected to keep growing, and with that growth comes the need for additional parks, facilities, and trails to preserve the quality of life that makes the city attractive. Over the last 30 years the City has successfully partnered with the development community to deliver over $100M of new parks at low capital cost to taxpayers. The long-term operations and maintenance (O&M) obligations, however, remain with the City. As the system matures, more assets require renewal or full renovation, increasing lifecycle costs.
This challenge is not unique to Henderson; nationally, local park systems face substantial deferred maintenance backlogs, and most agencies’ operating budgets are dominated by personnel and core operating costs.
In Henderson, parks and recreation has also grown into a broader community-wellbeing role— providing before - and after-school care (Safekey and Teen Scene), senior nutrition and home - delivered meals, and contributing to the City’s coordinated response to homelessness. These essential services strengthen the community but place additional, ongoing demands on O&M capacity and funding.
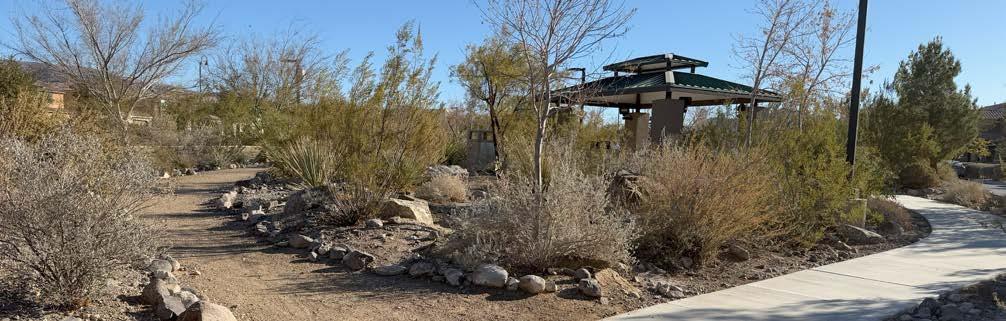
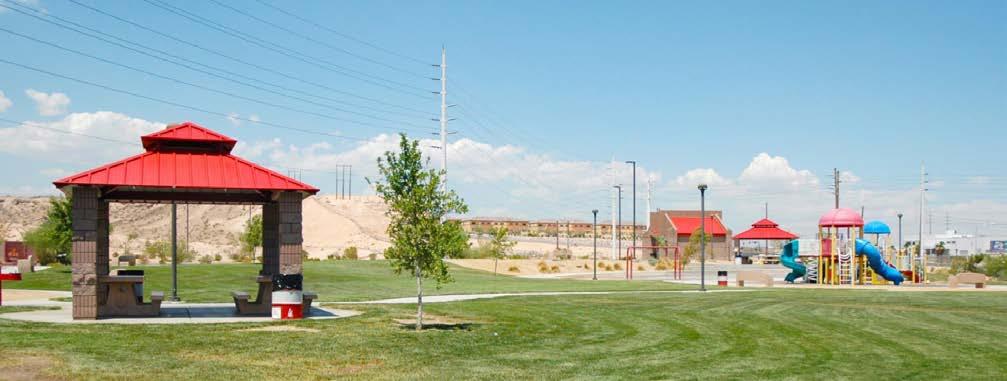
Figure 1.3 - Madeira Canyon Park (COH, n.d.)
PART 0NE
1. QUALITY OF LIFE
Community satisfaction with Parks and Recreation and water/wastewater demonstrate sustained levels of performance between 95% and 98%. (Baldridge National Quality Award for Henderson, NV, 2024)
2. ECONOMIC VITALITY
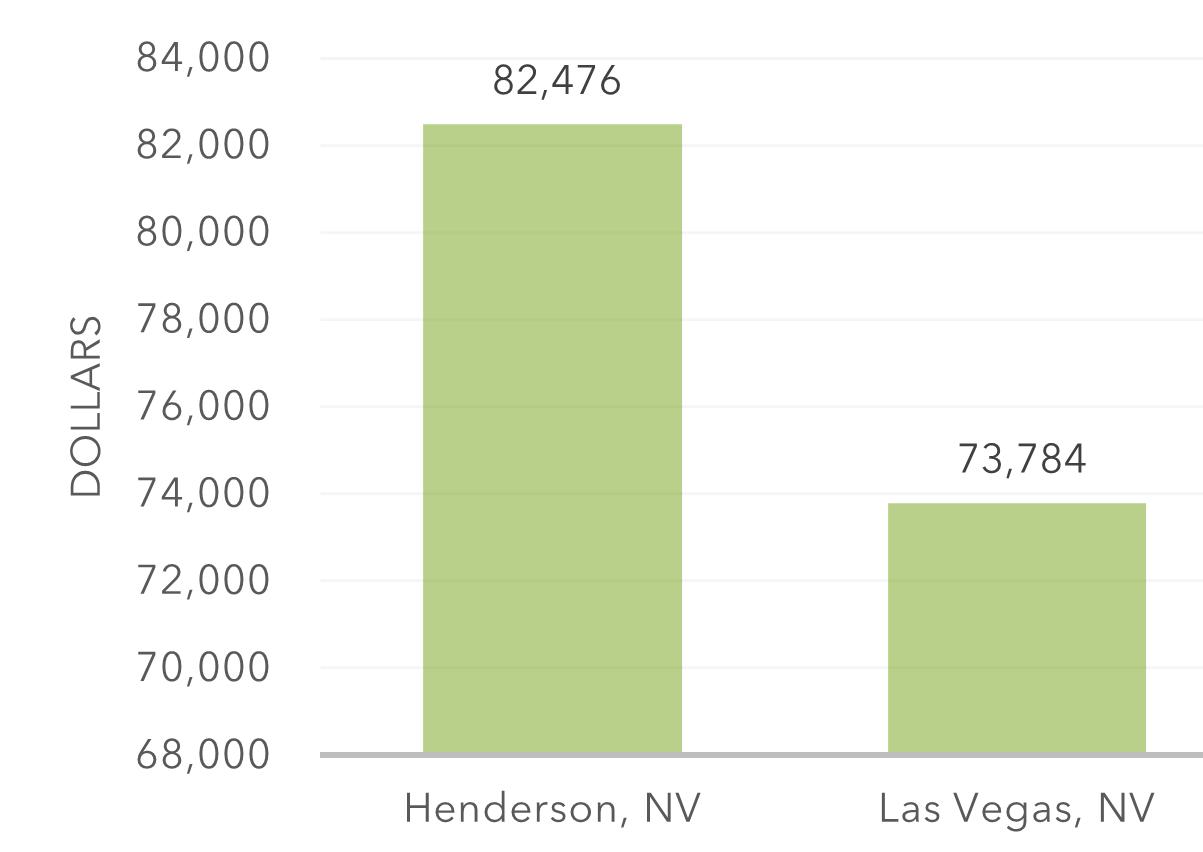
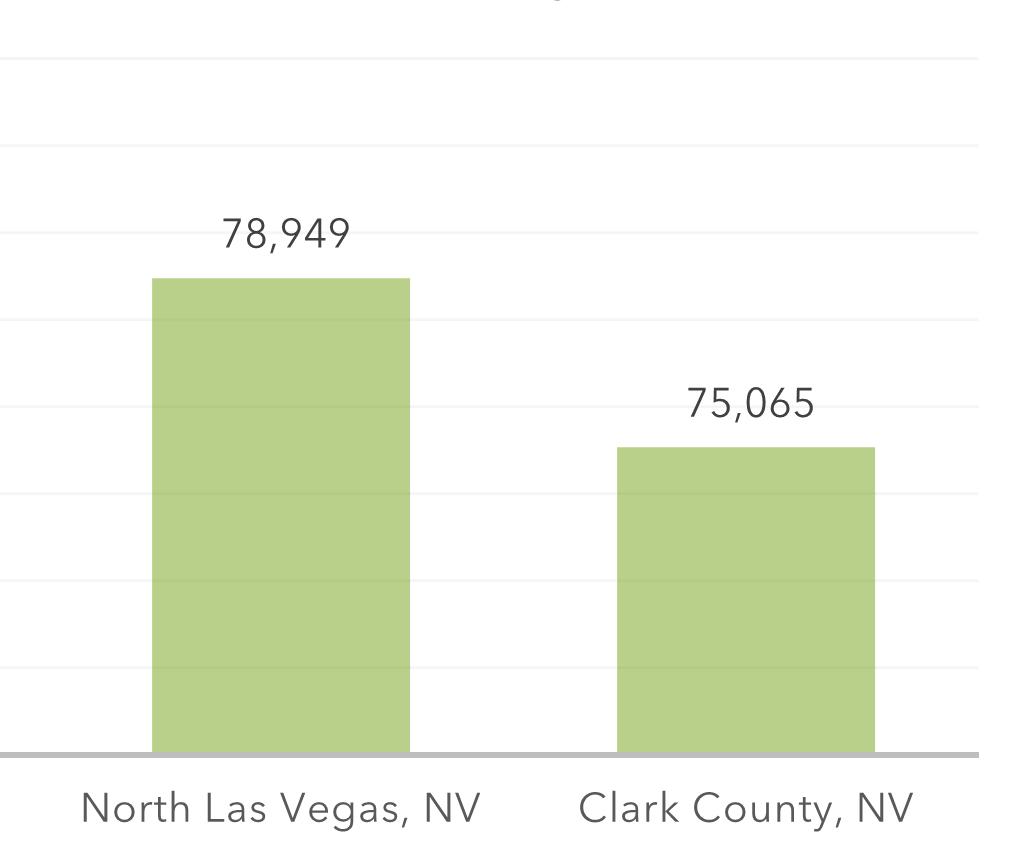
Residential property values have outpaced nearby cities and Clark County, increasing 40% from 2019 to 2023. Commercial property values have risen 29%. (Baldridge National Quality Award for Henderson, NV, 2024)
3. COMMUNITY SAFETY
Henderson was named the second safest large city in America by AdvisorSmith research group in 2021.
4. HEALTHY COMMUNITIES
Healthy Henderson is a fitness, health, and wellness program that encourages people to get fit and stay healthy through nutrition, exercise, outdoor recreation, and preventative health.
5. SUSTAINABILITY/RESILIENCE
Parks and Recreation identified 50 turf projects to remove around two million square feet of turf. This will save about 110 million gallons of water annually. (Henderson Sustainability Report Card, 2024)
6. EQUITY
Henderson shows above average ratings for percent of low-income households (84%) and people of color (85%) within a 10-minute walk of a park (Trust for Public Land (TPL) ParkScore Index, 2025).
7. PLAY
Henderson received the highest score (100) for basketball hoops, splashpads, and dog parks, with more than double the national median for each measure. (TPL ParkScore Index, 2025).
C. WHY PLAN?
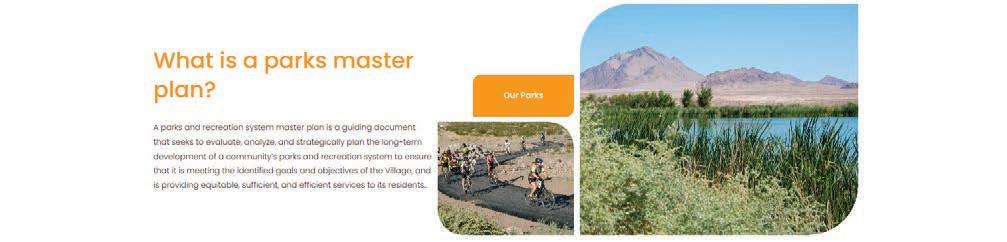
Developing a parks and recreation master plan is one of the most important and impactful planning efforts a city can undertake because the benefits extend well beyond the system’s physical assets and operations and have a tangible effect on residents’ daily lives.
Henderson’s parks must be thought of as more than just “fields and facilities”; they are far too important to be placed in such a small box.
A city’s parks system often serves as the gatekeeper for community image and overall quality of life— an essential factor as people increasingly choose where to live based on lifestyle and amenities rather than on specific jobs or industries. John Crompton, Distinguished Professor of Recreation, Park and Tourism Sciences at Texas A&M, notes that wellplanned and well-designed parks and recreation systems can increase a community’s economic, environmental, and social sustainability, outcomes that few traditional planning processes achieve.
To put further pressure on the system, parks and recreation departments nationwide are now tasked with improving community health (mental and physical), generating quantifiable economic impacts, and addressing societal challenges such as homelessness and food insecurity. What was once the management of “fields and facilities” now also encompasses access and inclusion, multi-faceted sustainability, and community-wide economic development.
Henderson’s parks and recreation master plan is therefore both a defining community asset and a front-line instrument for climate resilience, public health, and community development. To serve a growing and aging city in an era of extreme heat and water scarcity, Henderson must embrace comprehensive physical, operational, and fiscal resilience, with a willingness to be innovative and adaptable.
This master plan provides a roadmap that will help ensure that every Henderson resident, current and future, has reliable access to high quality parks, facilities, trails, and programs, even in the face of significant existential threats.
D. BEYOND RECREATION
It is important to note that while this is a “parks and recreation” master plan, it considers the many systems – both physical and operational – which form the framework of the city’s “public realm.” The use of the term “public realm” refers to the interstitial network of public and quasi-public spaces which link together the various neighborhoods and districts of the city. Examples include parks and public spaces, natural lands, transportation systems, bikeways/ trails, and civic and cultural destinations.
The thoughtful planning and design of the public realm is of significant importance because of its direct and quantifiable influence on overall quality of life. Every resident and visitor to the City of Henderson will interact with the public realm multiple times on any given day; it will be the first thing people experience upon arrival, and the last impression on departure.
A well-designed public realm system complete with networks of streetscapes, parks, trails, public places, and natural areas serves as the framework for the various types of development and land use found in Henderson, helping to ensure a similar experience and quality of life across the entire city. Although the City may not have full control over how each and every parcel is developed, they do have control over the public realm, making it one of its most important assets.
E. RELATIONSHIP TO OTHER PLANNING DOCUMENTS
This master plan update is one of several citywide planning efforts that shape Henderson’s growth and investment. In addition to the City’s strategic plan, it is the City’s most comprehensive source for policies, standards, and data specific to parks, recreation, and open space.
In addition to the analyses and recommendations, the plan reviews, synthesizes, and incorporates relevant direction from existing plans and policy documents produced by the City and/or other regional entities to ensure alignment, close gaps, and avoid duplication.
1. 2019 HENDERSON PARKS AND RECREATION MASTER PLAN
Henderson has historically refreshed its parks and recreation master plan on a roughly 10 year cycle. The current effort is a comprehensive update to the 2019 Parks and Recreation Master Plan, maintaining continuity with that framework while focusing on two imperatives: (1) calibrating the system to post COVID-19 shifts in community priorities, needs, and recreation trends; and (2) building comprehensive resiliency, physical, operational, environmental, and fiscal, across the entire system. This update functions as an addendum that complements and, where appropriate, supersedes elements of the 2019 plan through the next full plan update in 2040.
Accounting for post COVID-19 shifts in demand and behavior.
During the pandemic, residents relied on outdoor spaces for daily activity, stress relief, and safe social connection, and that shift has had durable effects. National trail counters show 2022 trail use remained 45% above 2019 baseline levels (after the 2020 surge), indicating a persistently higher demand for walking and biking access even after lockdowns ended. Broader participation in outdoor recreation continues to set records, expanding the share of Americans engaging in hiking, running, biking, camping, and fishing.
Local agencies also report strong interest in community-building programming, such as festivals, markets, and place-based events, complementing traditional sports. Together, these trends validate Henderson’s emphasis on connected trails and bikeways, everyday neighborhood access to parks, diversified programs and events, and flexible indoor–outdoor offerings.
Increased focus on comprehensive resiliency.
Physical resiliency (Assets) - The update inventories and evaluates the condition of parks, centers, trails, and amenities; prioritizes lifecycle reinvestment; and addresses aging infrastructure and deferred maintenance. National data show local park systems face sizable maintenance backlogs, underscoring the importance of systematic renewal alongside growth.
PART 0NE
Operational resiliency - People, programs, and readiness: The plan aligns staffing, maintenance levels, and program delivery with current use patterns and climate realities (e.g., shade/indoor alternatives and activation of recreation centers as cooling sites during excessive heat warnings). It also supports special events and partnerships that strengthen community cohesion.
Environmental resiliency - Heat and water: Extreme heat is intensifying in Southern Nevada. Las Vegas set its all-time record at 120°F on July 7, 2024 while Henderson’s water supply is ~90% dependent on the Colorado River, where shortage conditions and Nevada’s fixed legal apportionment increase vulnerability. The update advances strategies that expand shade and canopy, extend cool programming hours, and accelerate water conservation, including compliance with State of Nevada Assembly Bill 356 to remove nonfunctional turf by January 1, 2027.
Fiscal resiliency - Funding the system we have and the system we need: The plan evaluates current funding structure and identifies diversified revenue tools to keep pace with system growth and long-term O&M.
Continuity with the 2019 plan: Key technical elements of the 2019 plan remain valid for decision-making over the next five years, particularly the level- of-service (LOS) framework (including GRASP-based analysis), the facilities inventory/evaluation, and bicycle/trail connectivity priorities (see Appendix 6.5 for select excerpts from the 2019 plan).
This update carries those forward, refreshes assumptions with current data and engagement, and adds the resiliency strategies above. As such, it should be read as a complementary addendum that guides near-term capital investment, operations, and partnerships and supersedes 2019 recommendations where this document explicitly updates them.
2. ADDITIONAL RELEVANT EXTERNAL (NONP&R) DOCUMENTS, PLANS AND ACTS
The following are key documents, plans, and acts—developed by entities other than P&R—with findings or recommendations relevant to this master planning effort:
A. City of Henderson:
+ 2024-2027 Henderson Strategic Plan (2024)
+ All-In Henderson Sustainability & Climate Action Plan (2025 Draft)
+ H2ONE Water Conservation Initiative (ongoing)
+ City of Henderson, Nevada Capital Improvement Plan - Fiscal Year 2023-2028 (2023)
+ City of Henderson Community Survey Findings Report (2023)
+ City of Henderson Open Space and Trails Plan (2024)
+ Henderson Transportation & Mobility Plan (2025)
+ Henderson Brand Book (2022)
+ Henderson Strong – Comprehensive Plan (2017)
+ Henderson Development Code (2022)
+ Parks and Recreation Department Cost of Service Analysis (2025)
+ University Area Livable Centers Study (2024)
+ West Henderson Land Use Plan (2014)
+ West Henderson PFNA (Public Facilities Needs Assessment) – Area Plan (2023)
+ Henderson Age-Friendly Action Plan (2024)
+ East Henderson Desert Edge Study (2025)
+ Joint Land Use Study - Clark County and City of Henderson (2024)
+ Turf Removal and Urban Heat Study – Desert Research Institute (2024)
B. Acts and Regional Plans:
+ All In Clark County – Sustainability & Climate Action Plan: County Operations (2020)
+ All In Clark County – Community Sustainability & Climate Action Plan (2023)
+ Clark County Transform Clark County Master Plan (2021)
+ Multi-Jurisdictional Hazard Mitigation Plan (MJHMP) (2024)
+ Nevada Division of State Parks Nevada Statewide Comprehensive Outdoor Recreation Plan (2023)
+ Regional Flood Control District (RFCD) Las Vegas Valley Flood Control Master Plan Update (2018)
+ Regional Transportation Commission (RTC) of Southern Nevada – Regional Bicycle and Pedestrian Plan for Southern Nevada (2017)
+ RTC of Southern Nevada – On Board Mobility Plan (2021)
+ RTC of Southern Nevada - Southern Nevada Heat Mapping Study (2023)
+ Southern Nevada Public Land Management Act (SNPLMA) of 1998
+ Southern Nevada Joint Water Conservation Plan (2024–2029)
+ Southern Nevada Strong (SNS) – Regional Plan
+ Southern Nevada Water Authority (SNWA) – 2025 Water Resource Plan (2025)
Examples of how key plans/acts intersect with Henderson’s Parks & Recreation Master Plan:
C. Water scarcity and drought:
The Southern Nevada Water Authority (SNWA) Water Resource Plan (2025) and the 2024–2029 Joint Water Conservation Plan set the region’s conservation targets (e.g., per- capita use, nonfunctional turf phase - out) and will directly affect irrigation design, turf conversions, and reclaimed water strategies in park facilities. Henderson’s City Council formally adopted the joint plan in October 2024.
D. Extreme heat and health: The Regional Transportation Commission (RTC) / Southern Nevada Strong (SNS) Heat Vulnerability Analysis (spatial) and Southern Nevada Health District (SNHD) heat morbidity/mortality reports (epidemiological) together identify heat-risk geographies and populations, crucial inputs for shade targets, tree canopy, cooling amenities, and operating protocols in parks.
E. Trails and connectivity:
Henderson’s Open Space & Trails Plan (2024), Transportation and Mobility Plan (TMP) (2025), Parks & Rec Master Plan (2019), and the regional SNS Plan (2015) provide the policy and network framework for multi-use trails, first/last-mile transit connections, and integration with flood control corridors.
F. Land use and long -range growth:
The City’s Development Code (Title 19) and county’s Transform Clark County Master Plan & Title 30 align land use, urban form, and complete streets policy— key context for siting future parks, service areas, and access.
G. Natural lands & conservation:
The Multiple Species Habitat Conservation Plan (MSHCP) (2000) and Clark County Regional Flood Control District (CCRFCD) master planning influence where and how open space and habitat corridors are protected, and how detention basins and channels can be co -programmed for recreation and trails.
H. Funding and land acquisition:
The Southern Nevada Public Land Management Act (SNPLMA) allows the Bureau of Land Management (BLM) to sell certain federal lands in the Las Vegas Valley and directs the revenues—5% to Nevada’s education fund, 10% to the Southern Nevada Water Authority, and the remainder to a federal “Special Account.” That Special Account funds several categories, including Parks, Trails, and Natural Areas (PTNA)—the primary grant source Henderson uses to build and upgrade parks and trails.
SNPLMA also reserves opportunities for local governments to acquire federal parcels for local public purposes (e.g., parks) under the Recreation and Public Purposes Act. As of 2025, Henderson has been awarded $235+ million for 30+ parks and trails projects through SNPLMA—making the program foundational to the City’s capital delivery.
PART 0NE
D. NEEDS + PRIORITIES
The needs assessment triangulated quantitative and qualitative analysis and engagement techniques to determine what matters most to residents today.
Community engagement combined stakeholder interviews and focus groups, 11 public workshops hosted throughout the city, multiple resident surveys (including a statistically valid citywide survey), and a project website (HendersonPRMasterPlan.org) that shared materials and captured feedback in real time. Results were mapped against service areas, equity indicators, and facility conditions to produce a prioritized list of needs that directs investment toward the highest community benefit.
E. VISION
With needs and priorities defined, the team co created a Citywide Vision during an on site, participatory workshop in May 2025. Working sessions translated priorities into strategies for existing parks and programs, potential new parks and amenities, natural lands and open space, the trail and active transportation network, and comprehensive
resilience (heat, water, and emergency readiness). Each initiative was paired with high level concepts, design and service guidelines, siting logic, and/or policy/partnership actions (as appropriate) —so the vision is both aspirational and implementable.
F. ACTION
A master plan is only as strong as its implementation strategy. After confirming the Vision, the Project Team developed a practical action plan that sequences projects and policies into near term “quick wins,” mid term priorities, and long range initiatives. Order of magnitude capital and lifecycle O&M costs were anticipated for major projects; staffing and maintenance implications were identified; and funding/financing tools were evaluated and prioritized (e.g., developer partnerships, grants, dedicated revenues, philanthropy, fees, sponsorships).
The thorough approach to the implementation phase ensures the City can make steady, fiscallyresponsible progress toward the long-range vision, even when total needs exceed currently available resources.
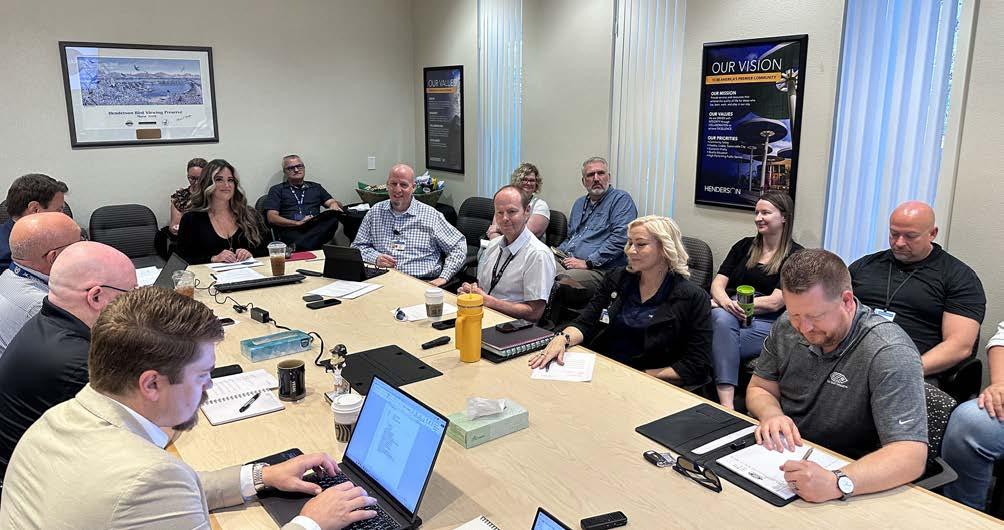
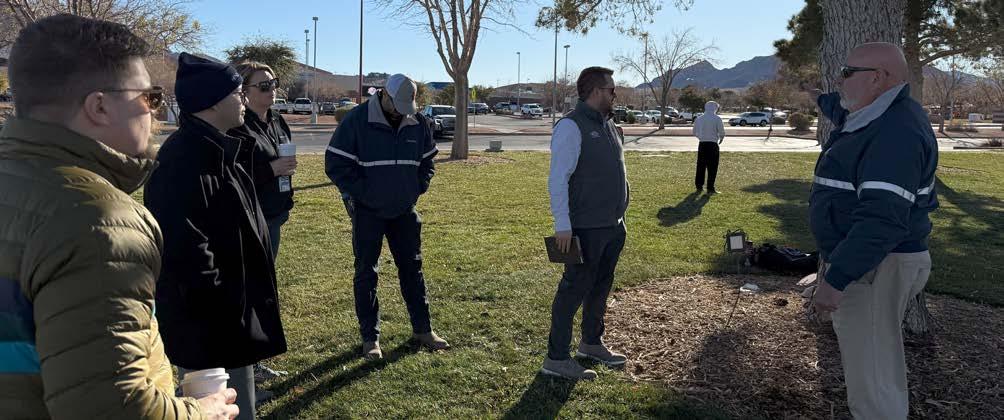
Figure 1.5 - Project Team master plan work session (2025).
PART TWO
3. AGE
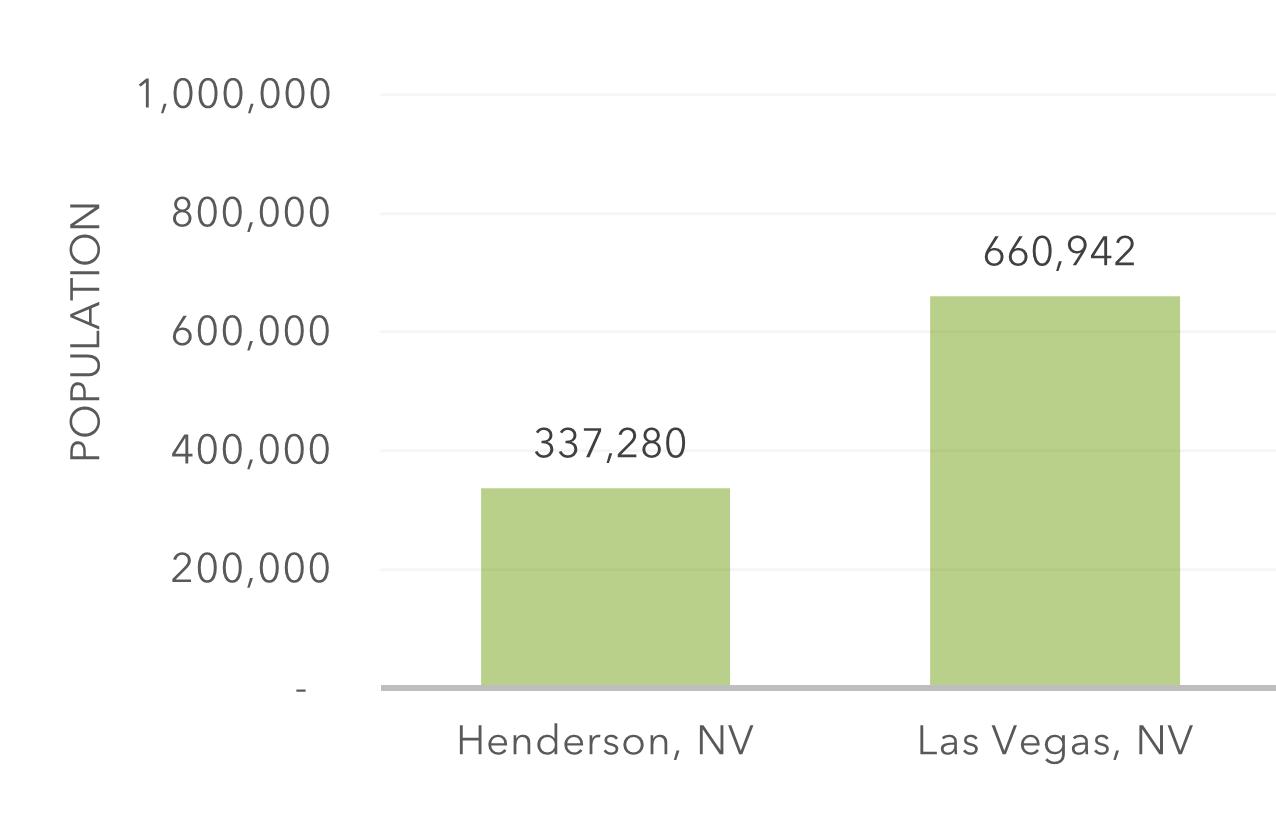
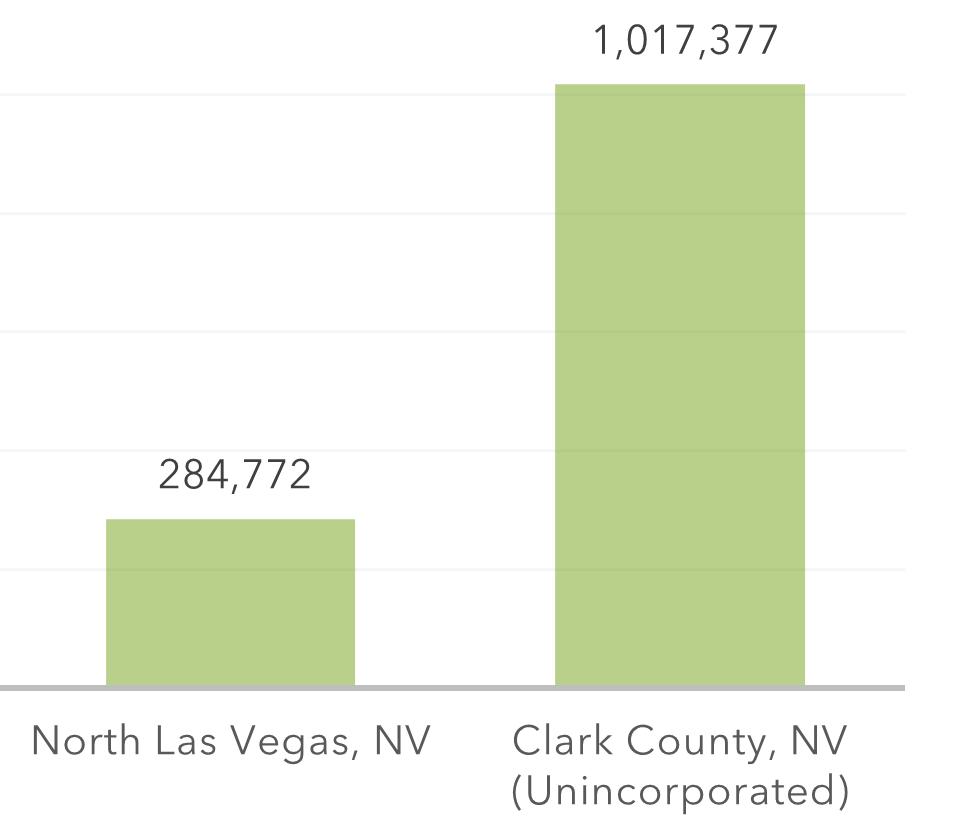
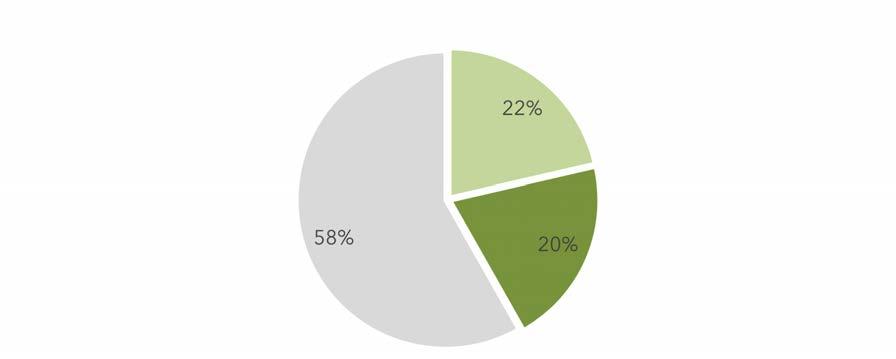
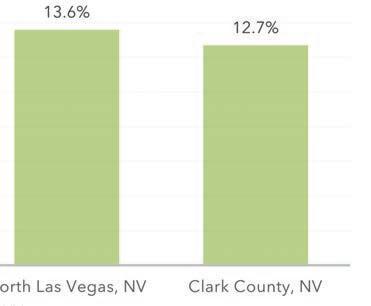
Henderson’s median age is ~42.2, notably older than the county (~38.9) and Las Vegas (~39.2), reflecting substantial empty nester and retiree in migration alongside family households. City five year estimates show ~20.4% of residents are 65+, while ~21.4% are under 18—a broad, bimodal distribution that spans active older adults and school age youth. North Las Vegas skews younger than Henderson, consistent with larger average household sizes and more children per household. These differences are material for recreation demand profiles.
Over the last decade, Henderson’s median age has continued to edge upward (now ~42), and its 65+ share has increased (now ~20% per 5-year ACS), while still maintaining a sizable under 18 cohort (about ~21%). This evolution—simultaneous growth in active older adults and families—creates overlapping but distinct recreation demands: daytime, lower impact options and accessible facilities for older adults, alongside youth sports and family oriented amenities.
HENDERSON POPULATION: UNDER 18 VS 65+ (% OF POPULATION)
Figure 2.6 - Henderson’s 2025 population under the age of 18 and 65 years and older.
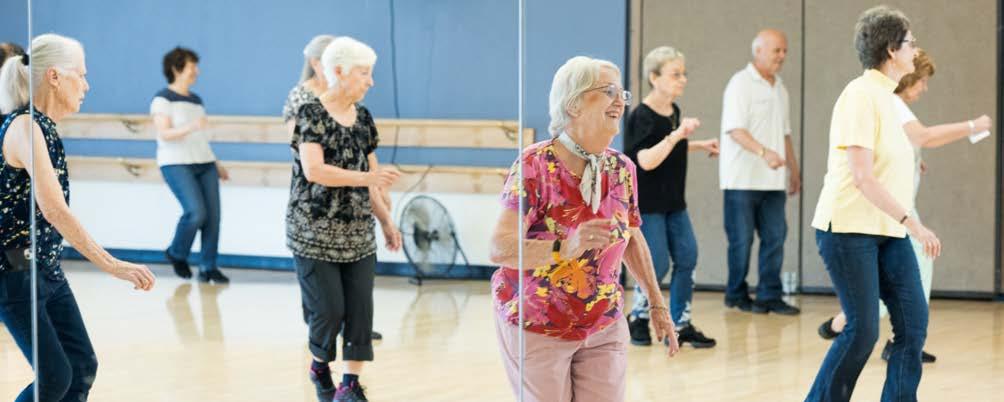
Figure 2.7 - Henderson seniors participating in a fitness program (COH, 2025)..
EXISTING CONDITIONS
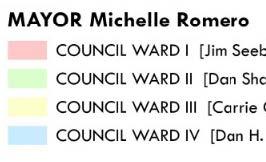
Council Ward I (Jim Seebock)
Council Ward II (Dr. Monica Larson)
Council Ward III (Carrie Cox)
Council Ward IV (Dan H. Stewart)
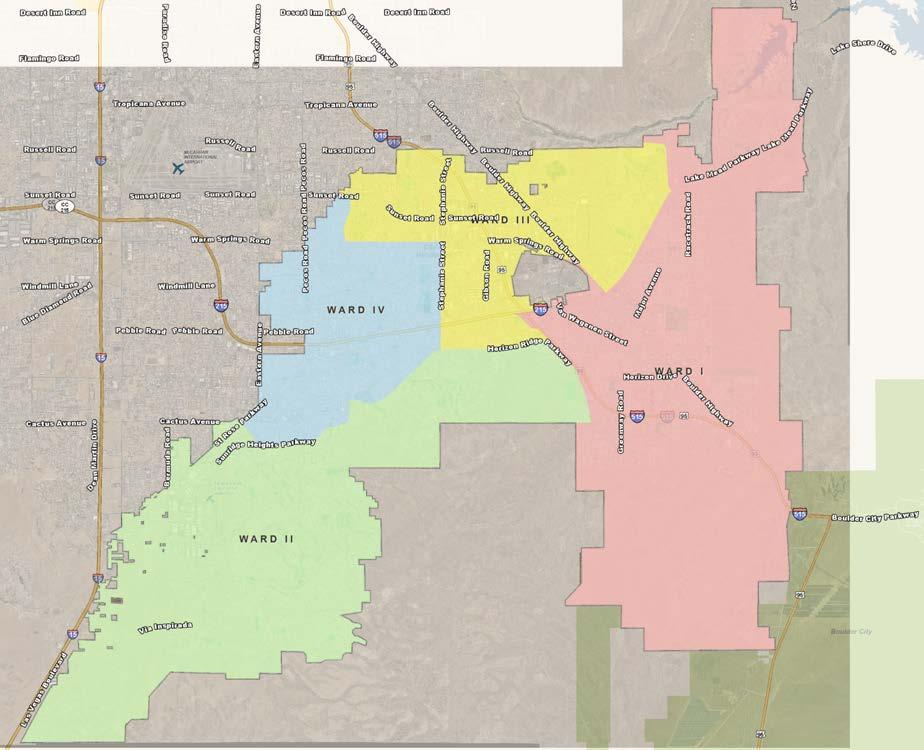
C. OVERVIEW BY WARD
WARD I
DOWNTOWN / WATER STREET, BOULDER HIGHWAY CORRIDOR, LAKE LAS VEGAS & CALICO RIDGE, MISSION HILLS, PARADISE HILLS, RIVER MOUNTAIN.
Recent redistricting moved Lake Las Vegas and Calico Ridge into Ward I, while the ward continues to include the historic Water Street district and the City’s portion of the Boulder Highway corridor. This produces a mixed socio demographic profile: (1) established, older housing stock and pockets of lower income households and renters along/near Boulder Highway and legacy neighborhoods near Water Street (a focus of City reinvestment), and (2) higher income, often older empty nest households
in Lake Las Vegas and view oriented neighborhoods. For the parks system, that mix suggests continued equity minded investments (shade, transit served parks, low/no cost programming) near the corridor and downtown, alongside trail and passive recreation demand from Lake Las Vegas residents and visitors.
+ Lake Las Vegas/Calico Ridge: scenic trail loops, sunrise/sunset walking, small group fitness/arts, water adjacent passive spaces.
Figure 2.11 - The geographic boundaries of Henderson’s four (4) council wards (2025).
WARD I
WARD II
WARD III
WARD IV
PART TWO
WARD II
SOUTH & WEST HENDERSON: ANTHEM, SEVEN HILLS, INSPIRADA, WEST HENDERSON GROWTH AREAS
Ward II encompasses a large share of the city’s newer master planned communities (e.g., Inspirada, Seven Hills) and the age restricted Sun City Anthem. It encompasses southern and western parts of Henderson, where the City’s Public Facilities Needs Assessment (PFNA) and land use plan point to continued household growth and facility demand through 2050.
Expect a “barbell” age pattern: many active older adults (55+) linked to Sun City Anthem and many families with children in new neighborhoods— correlating with higher homeownership and incomes than city averages.
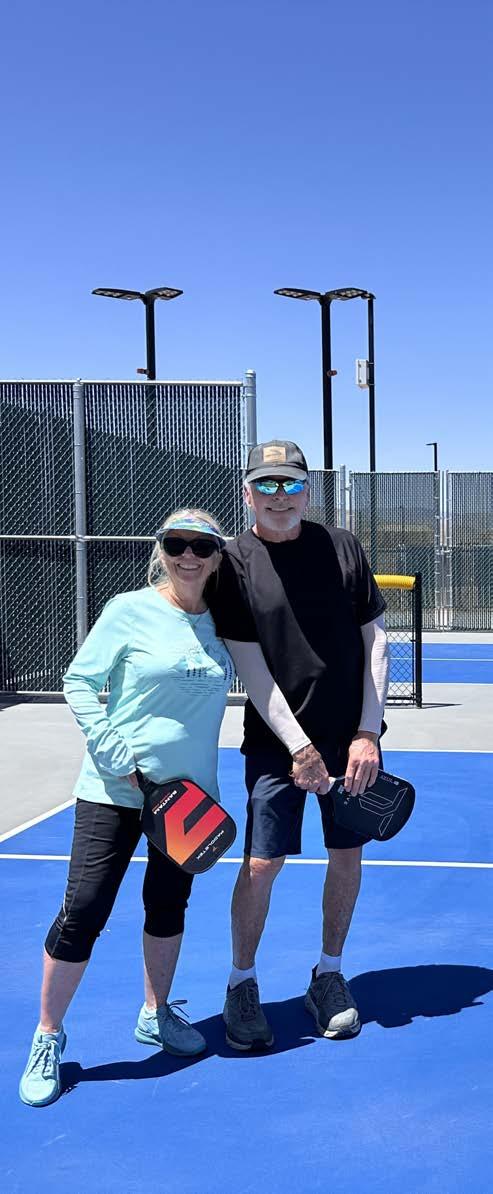
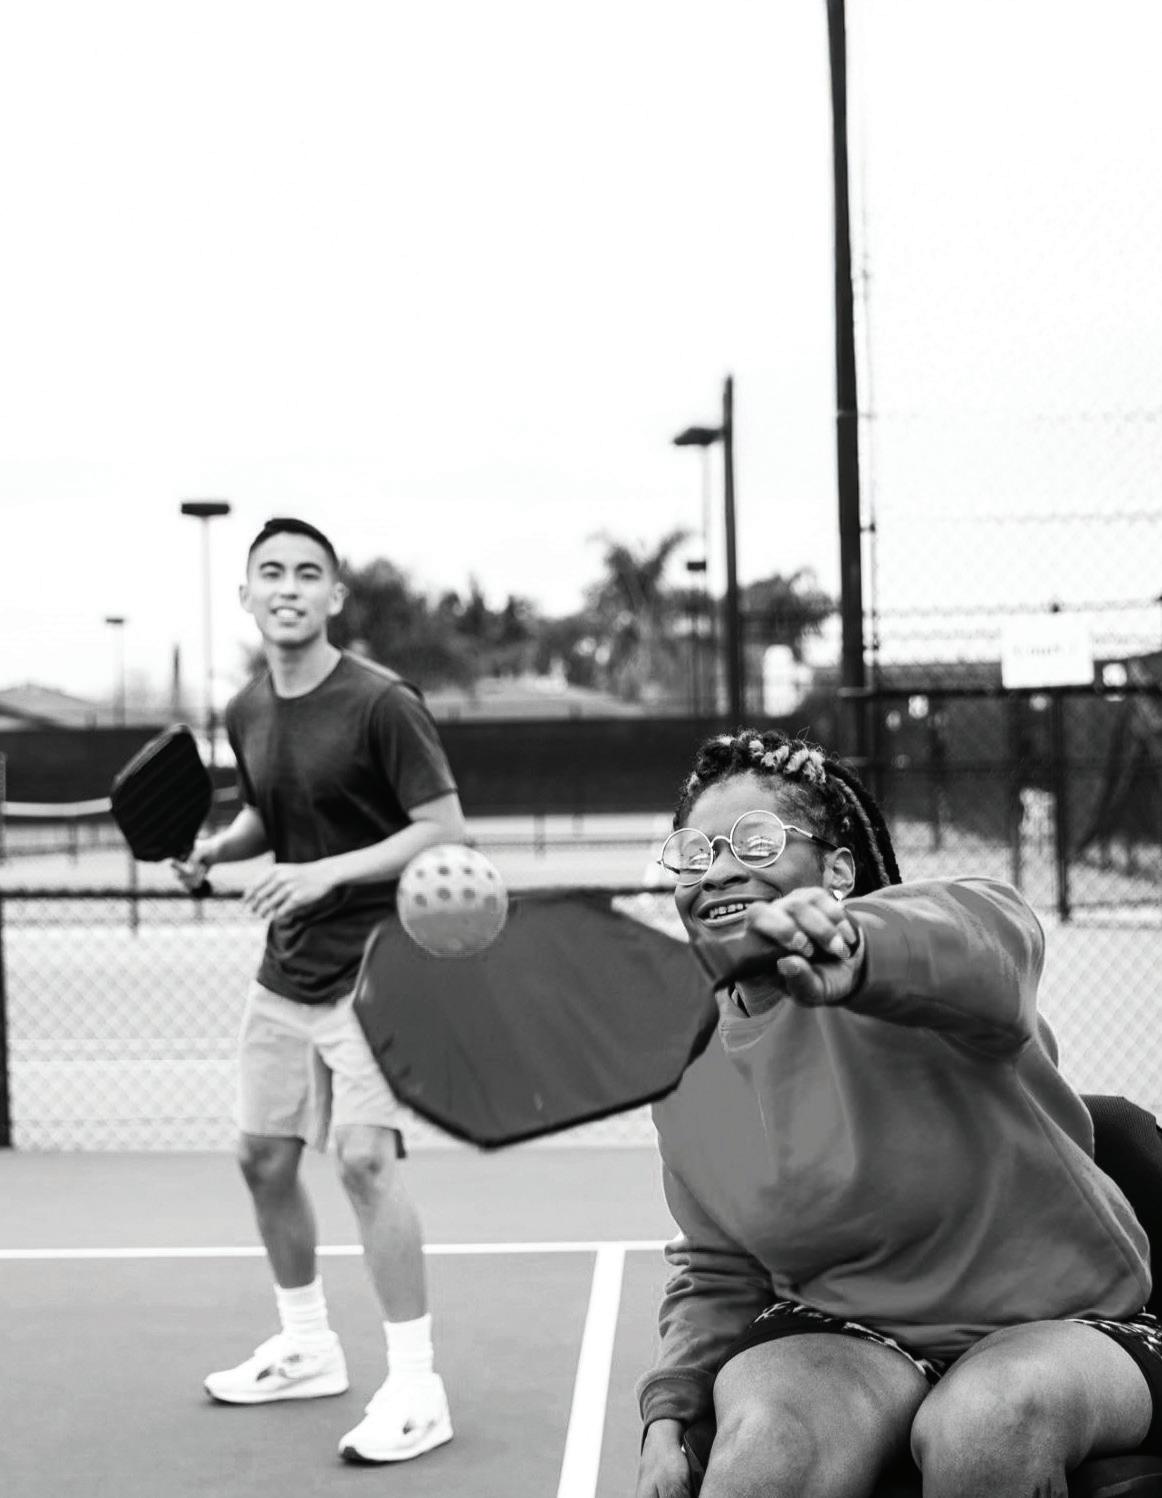
Parks needs skew toward pickleball and court sports, lap/low impact aquatics, daytime senior programming, and rectangular field capacity for youth sports—plus long distance and neighborhood connector trails that keep pace with growth.
Ward II Considerations:
+ Expand active adult offerings (pickleball, walking clubs, fitness classes) and youth leagues/camps.
+ Build out shade, restrooms, and continuous multi use paths as subdivisions come online in southern and western parts of Henderson.
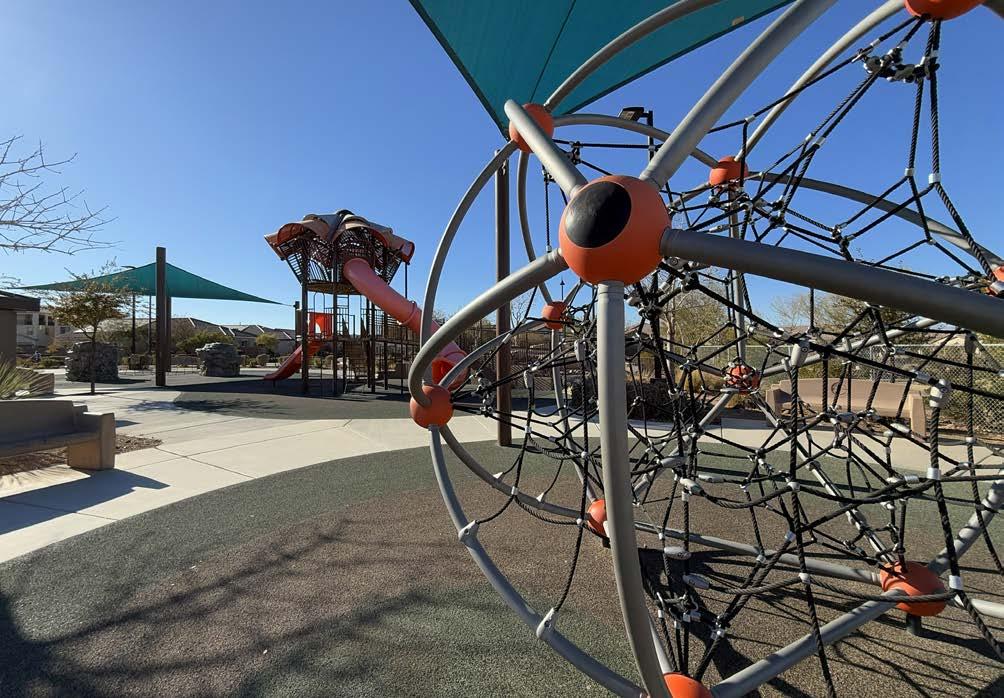
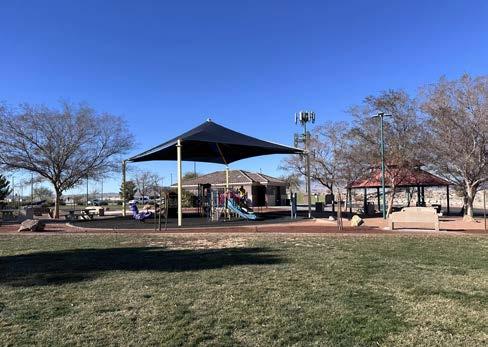
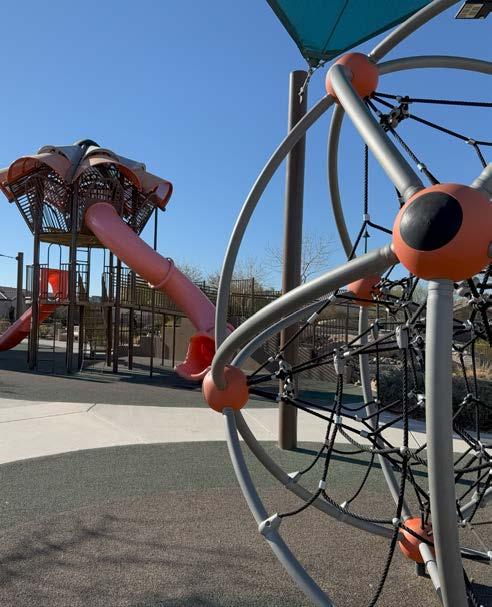
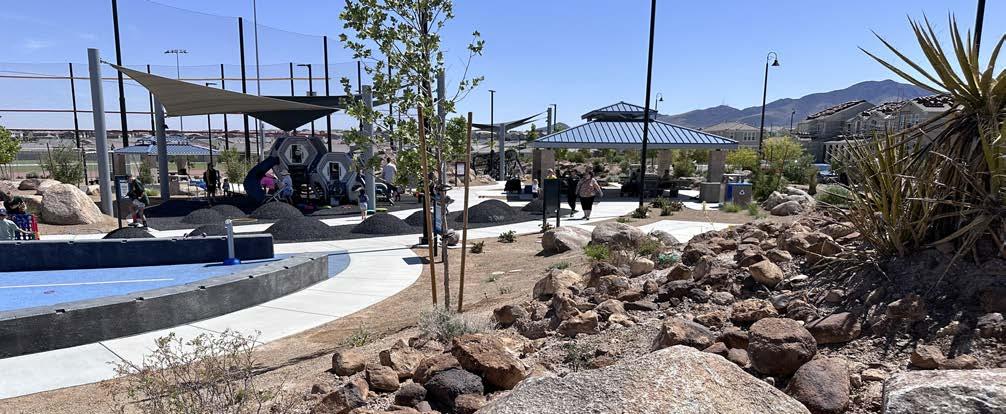
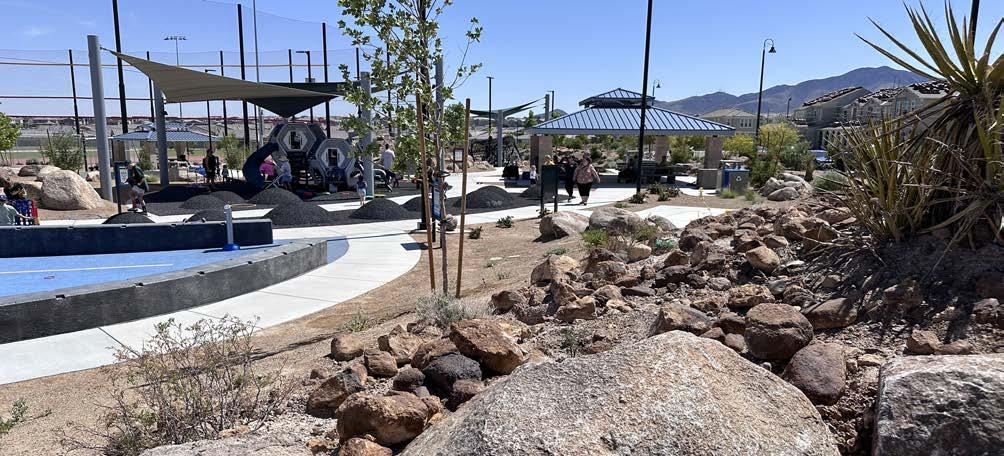
Figure 2.12 - Destination playground in Ward II’s Aventura Park (2025).
WARD III
CENTRAL / EAST CENTRAL NEIGHBORHOODS
NORTH OF I-215
Following earlier boundary adjustments (and with Ward I absorbing Lake Las Vegas in 2023), Ward III today spans central/east central neighborhoods primarily north of I 215, with a mix of established subdivisions and ongoing infill.
Relative to Ward II’s master planned tracts and Ward I’s Boulder Highway corridor, Ward III presents middle age housing stock, stable ownership pockets, and moderate incomes—with diversity in household types and ethnicity reflective of the city’s overall diversification.
For parks & recreation, the emphasis is on modernizing neighborhood parks, shared use field upgrades, and gap closing trail connections that stitch schools, shopping, and employment areas— plus after school and weekend family programming. (Exact neighborhood composition should be confirmed using the City’s ward map when compiling block group roll ups.)
Ward III Considerations:
+ Neighborhood park reinvestment (shade, courts, lighting where context allows), after school activation, and short connector trails to reduce drive to park demand.
EXISTING CONDITIONS
WARD IV
GREEN
VALLEY / GREEN VALLEY RANCH AND ADJACENT ESTABLISHED NEIGHBORHOODS
Ward IV covers much of Green Valley and Green Valley Ranch—mature master planned neighborhoods with established family households, high park use, and steady demand for multi purpose fields, gym courts, and community event programming. The age profile is typically middle aged adults with school age children, with an increasing cohort of long time owners aging in place.
Park planning should stress asset renewal, evening use (lighting/shade), and league scheduling efficiency; trails work should complete neighborhood connectors to retail, schools, and regional paths.
Ward IV Considerations:
+ Field/court renewal and efficient scheduling, family focused events, and cooling/shade retrofits to maintain comfort and capacity during hot months.
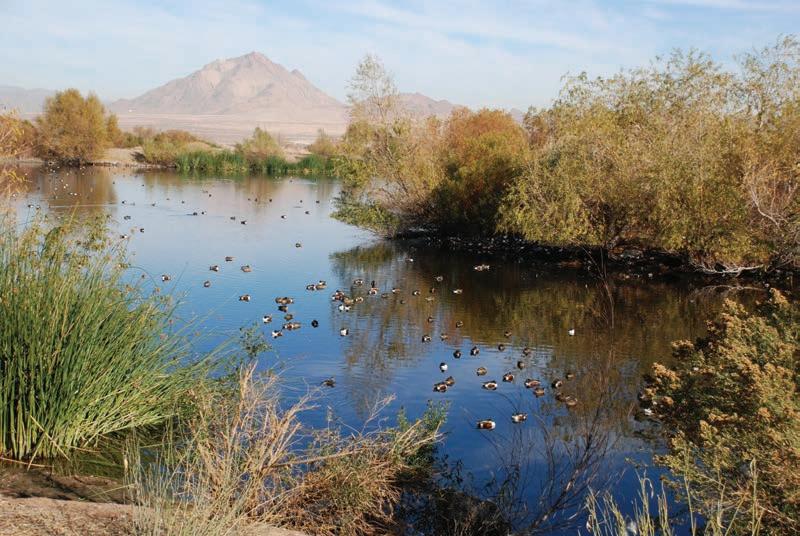
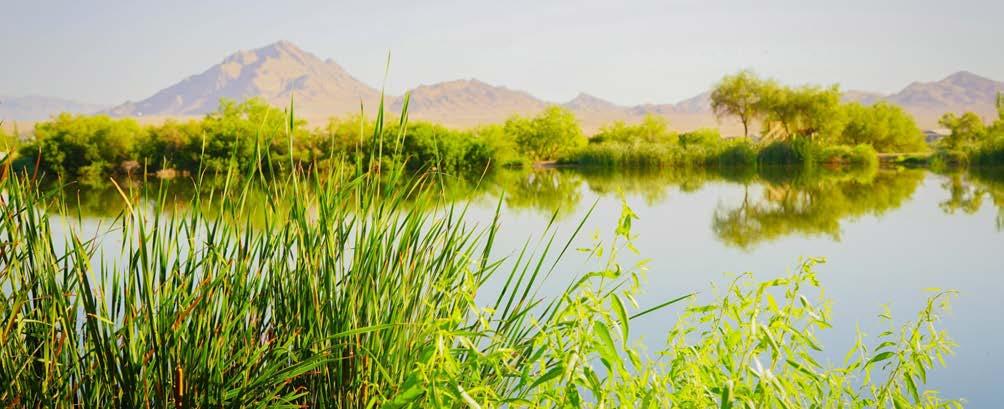
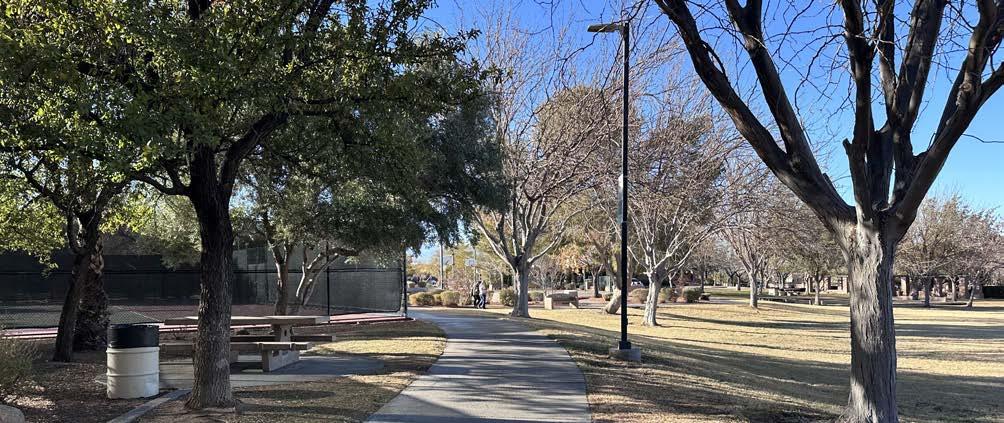
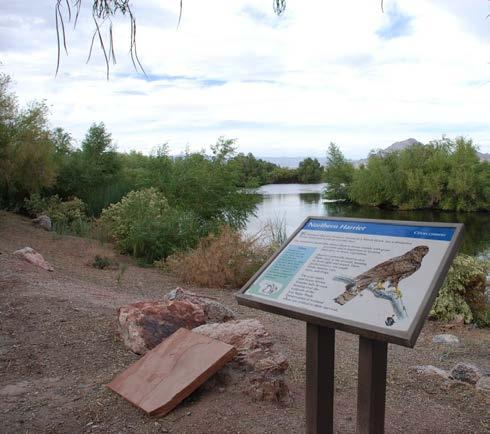
Figure 2.13 - Henderson Bird Viewing Preserve in Ward III (COH, n.d.).
PART TWO
D. LIFESTYLE ANALYSIS
ESRI TAPESTRY SEGMENTATION
This system integrates the latest demographic, socioeconomic, market preference, and consumer behavior information to present in-depth profiles for each segment. Neighborhoods with the most similar characteristics are grouped together, while neighborhoods with divergent characteristics are separated.
The Tapestry segmentation model is designed to differentiate segments along multiple dimensions, including population characteristics, household economics, housing type, and location attributes. The model is suitable for a variety of applications including but not limited to consumer marketing, site selection, audience targeting, and analytical efficiency.
Tapestry combines traditional statistical techniques of cluster analysis with data mining methods to segment U.S. neighborhoods. Data sources include Esri Updated Demographics, the 2020 decennial census, the American Community Survey, and national consumer surveys from MRI-Simmons. These surveys include responses to over 4,000 products, services, and behaviors across more than 40 categories, including consumer products, finance, media, internet usage, psychographics, restaurants, and more.
Selection of the variables used to identify segments begins with data that include household and housing characteristics such as family type, income, relationships (married, multigenerational), tenure, home value or rent, and type of housing (singlefamily, apartment, townhouse, or mobile home) as well as population traits such as age, sex, education, employment, and marital status.
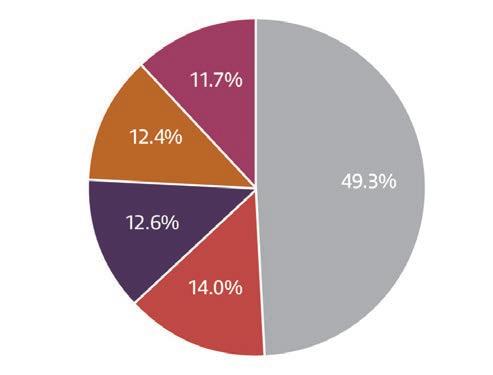
Understanding the top Market Segments represented in Henderson helps prioritize services tailored to the preferences and behaviors of the majority of residents. This section examines the top four Tapestry Segments represented in Henderson, accounting for approximately half of the total City population.
HENDERSON, NEVADA TAPESTRY SEGMENTATION
UNITED STATES TAPESTRY SEGMENTATION COMPARISON
#1 Dreambelt
#3 Modern Minds
#2 Savvy Suburbanites
#4 Boomburbs
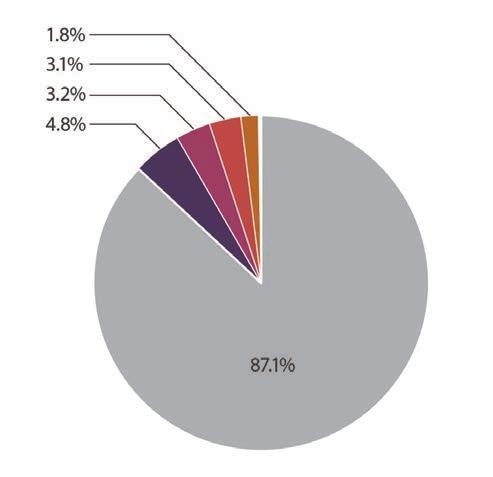
Figure 2.15 - Henderson’s top 4 tapestry segments for 2025 as a percent of the total U.S. population.
Figure 2.14 - Henderson’s top 4 tapestry segments for 2025 as a percent of the total Henderson population.
EXISTING CONDITIONS
#1 DREAMBELT
About half of the population is between 35 and 74, and most households consist of married or cohabiting couples. Most households earn middle-tier incomes, and labor force participation is high. This segment has a high concentration of employment in public administration, construction, health care, and retail trade sectors. Neighborhoods consist mainly of single-family homes built between 1950 and 1990, offering ample parking space, often for three or more vehicles. A significant portion of the population commutes alone by car.
#2 SAVVY SUBURBANITES
Some couples have children who have grown up and left the house, and around a quarter still have kids at home. Residents work in professional fields such as management and finance. The combined wages of both spouses position these families solidly in the middle to upper income tiers. Investments, retirement income, and valuable properties also contribute to the high net worth of households commonly found in these neighborhoods. Residents in this segment
gravitate toward both newly developed and wellestablished suburban communities.
Residents are mostly in the 25 to 44 age range, and nearly half of individuals aged 25 and older hold a bachelor’s degree. The segment has grown due to recent immigration, adding to the notable population of individuals born outside the U.S. already living here. Key employment sectors include health care, technology, retail, education, and manufacturing, and incomes often fall in the upper tier. The segment is a mix of homeowners and renters, residing in both
#4 BOOMBURBS
Most members of the segment are between 25 and 54, with an overall population that is young; nearly a third are under the age of 18. Married couples with or without children are prevalent in this segment. Household incomes are predominantly upper tier, and workers are frequently employed full time in fields including government, management, sales, business, and finance. They reside in newer singlefamily homes, typically constructed in 2000 or later.
single-family and multifamily units. Households typically own multiple vehicles and commute by car.
Nearly a third of households own three or more vehicles.
PART TWO
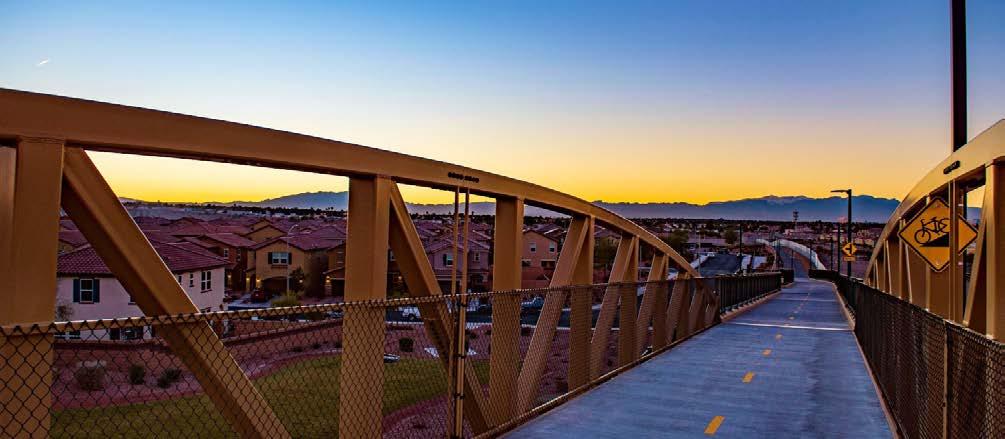
Figure 2.16 - Henderson residents utilizing one of the City’s many multi-purpose trails (COH, n.d.).
EXISTING CONDITIONS
E. OVERALL IMPLICATIONS
Findings from the demographic analysis suggest that Henderson’s system must simultaneously scale for continued growth in Wards II and III, and recalibrate for an older, but active, increasingly diverse population—delivering shaded, accessible, connected parks and trails while maintaining robust youth sports and family programs. Following are other, specific potential implications based on this analysis:
1. Keep Up With Growth—Especially In West/South Henderson.
The City’s own projections and ZIP level tracking show sustained housing delivery in West/South Henderson. To maintain level of service as population approaches ~540k by 2050, the system will need additional neighborhood and community parks, multi field sports complexes, and trail links that stitch new subdivisions to the regional network. Capital planning should continue to co locate parks with schools and leverage utility/transportation corridors for off street paths to accelerate cost effective mileage.
2. Plan For An Older, But Active, City.
With ~20% of residents already 65+ (five year ACS) and median age >42, the system should emphasize age friendly design: shade, seating every 200–300 feet on key paths, low slope ADA compliant routes, fully accessible restrooms, and lighting for shoulder hour use. Programmatically, demand will remain strong for pickleball and paddle sports, lap and low impact aquatics, walking clubs, arts/learning, and daytime programs. Integrating “looped walking circuits” (0.25–1.0 mi with distance markers) within community parks reliably serves older adults, rehab users, and families alike.
3. Sustain Robust Youth And Family Offerings. With ~21% under age 18 and persistent family in migration, Henderson will continue to need rectangular field capacity (soccer/flag), diamond fields, child/youth aquatics, summer camps, and multi court gyms. Scheduling pressures will heighten as participation normalizes and rooftops fill in; synthetic turf at select complexes, field lighting where context allows, and shared use with Clark County School District (CCSD) can squeeze more playable hours from limited acreage.
4. Reflect Rising Cultural Diversity.
Programming should expand multilingual outreach, culturally relevant events (e.g., Asian and Hispanic heritage festivals), and low barrier entry sports/ fitness with equipment provided. Communications should be available in Spanish and, where demand indicates, Asian languages common in Henderson neighborhoods. Regional figures (county and Las Vegas) confirm a high share of foreign born and multilingual households in the valley, reinforcing the value of bilingual signage along popular facilities and trails.
5. Equity And Affordability.
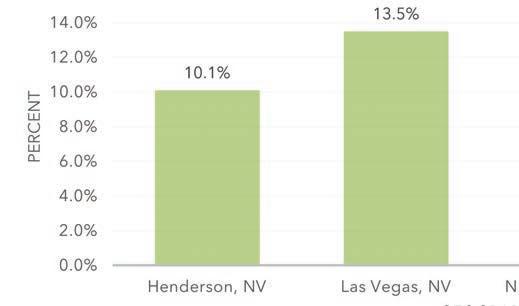
Although Henderson’s median household income exceeds regional figures, ~8–9% of residents live below poverty. To avoid price exclusion, keep a scholarship/fee reduction structure, ensure transit served sites host a share of high demand activities, and locate new pocket parks/micro recs in infill areas with multi family housing.
6. Design For Heat And Water Reality.
Shade (trees + structures), cool surfaces, water efficient turf standards for high use sports only, and drought tolerant landscapes with misting/cooling at select hubs are essential as utilization grows. Shorter average commutes and daytime retiree use suggest shoulder hour programming (early morning, evening) and lighted loop trails will be well used.
7. Trails: Finish The Big Connections.
Continue closing gaps to the River Mountains Loop, Union Pacific Railroad Trail spurs, and east west connectors to schools and commercial nodes. As Clark County approaches 3 million residents, regionally integrated trails will carry increasing transportation and recreation demand; partnerships with RTC and neighboring cities should be leveraged to deliver off street, family safe corridors ahead of growth.
PART TWO
D. LAND BASED + PARK DISTRIBUTION
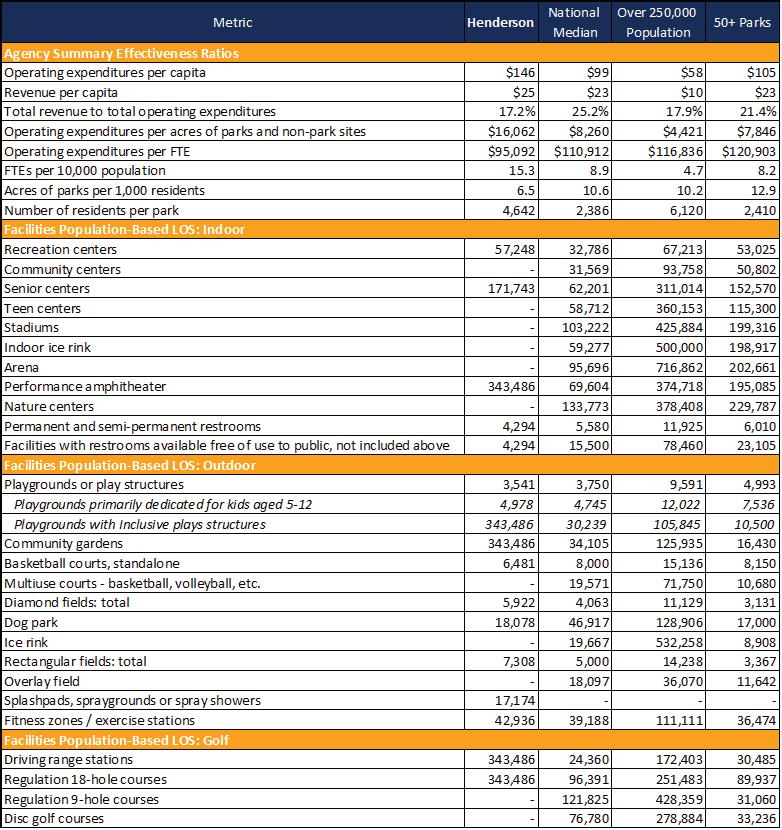
Henderson lags national statistics in terms of park acreage. The system provides 6.5 park acres per 1,000 residents, approximately 60% of the national median (10.6 acres) and half the coverage offered by 50+ park peers. Although the number of residents served by each individual park (~4,600) is better than the average of other large jurisdictions, it is nearly double the density seen in the typical U.S. system. High population growth corridors (particularly West Henderson and Cadence) can/will magnify this shortfall unless the City accelerates land acquisition or forges additional joint use agreements.
E. AMENITY BALANCE
Amenity provision is mixed. Henderson excels in specialty and hard surface facilities but falls behind on broad use courts. Residents share 28,600 people per multi use court, almost four times the load carried by park systems of similar size. That imbalance reinforces resident survey feedback calling for more flexible athletic space and shaded outdoor gathering areas.
F. SUMMARY OF IMPLICATIONS
Secure additional parkland. An estimated 800-900 acres over the next decade will be required to keep pace with projected population growth and align with NRPA acreage benchmarks.
Elevate cost recovery. Over the next five years, work towards the 25% national median by pairing a cost of service study with market responsive pricing, corporate sponsorships, and dynamic tournament fees may be required.
Prioritize high demand, multi use courts and indoor recreation capacity. Upcoming capital programs must ensure equitable distribution across neighborhoods.
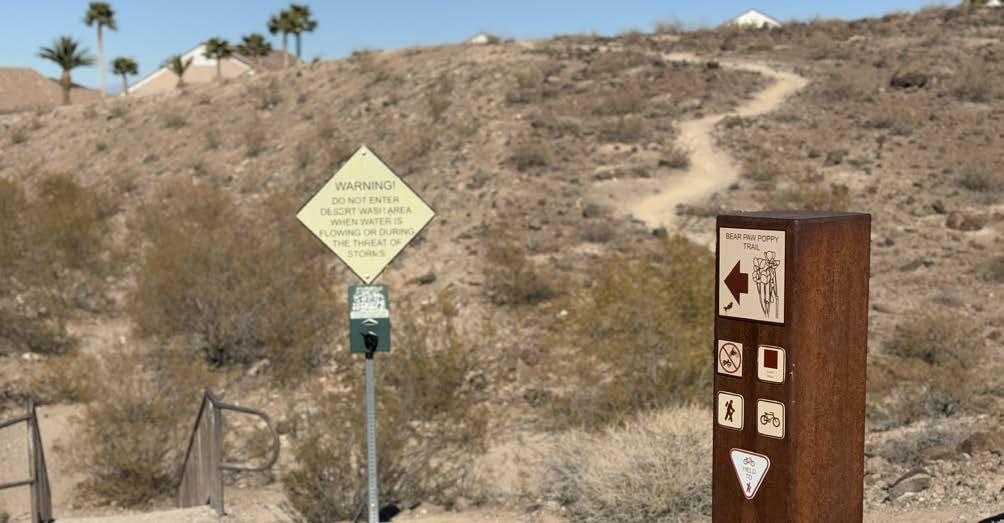
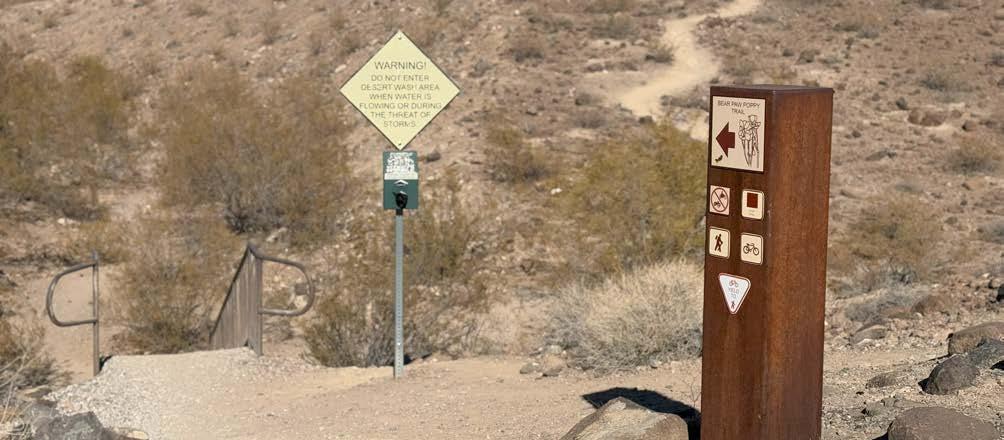
Figure 2.17 - Trail marker in Anthem Hills Park (2025).
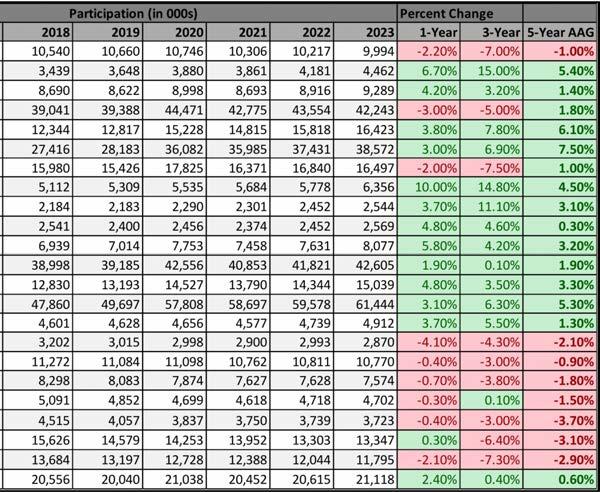
The 2024 Sports, Fitness, and Leisure Activities Topline Participation Report is produced each year by the Sports & Fitness Industry Association (SFIA). The report is derived from a nationwide study conducted each year by Sports Marketing Surveys USA (SMS). SMS conducts research under the direction of SFIA and seven other industry associations. The 2023 participation survey includes a sample size of 18,000 people representing the US population aged six and older. The results have a confidence interval of +/3.2% at the 95% confidence level.
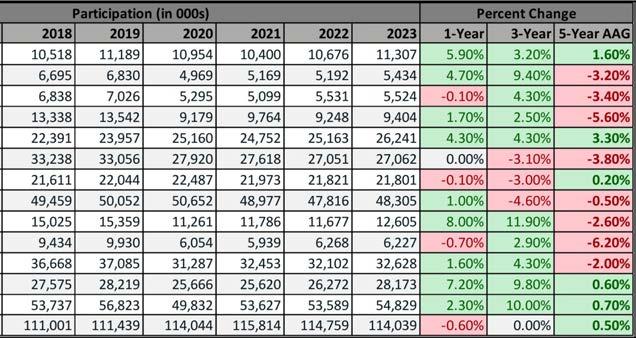
The following sections are separated by topic and include a six-year trend of activity participation (shown in 000s) along with 1-, 3-, and 5-year averages. Positively trending activities are highlighted in green whereas negatively trending activities are highlighted in red. If a number is not recorded for a given year, the box will be blank. This can be attributed to an activity being included in the data tracking process or vice versa – being removed.
In terms of usability, P&R should examine the national trends for applicability to trends experienced at the local level. In many instances, activities that are tracked nationally are not tracked in the same manner locally. For these activities, it is recommended to look at national categorical trends more holistically to better inform if any one specific activity(s) may be a good opportunity to implement or avoid locally.
Additionally, there may be times when a particular activity does not have national data available yet. A recent prime example of this idea is related to pickleball. National statistics were unavailable for this activity for many years, but local communities reported an interest in the activity. This is a case in which local decisions were made before national statistics were made available, but for good reasons.
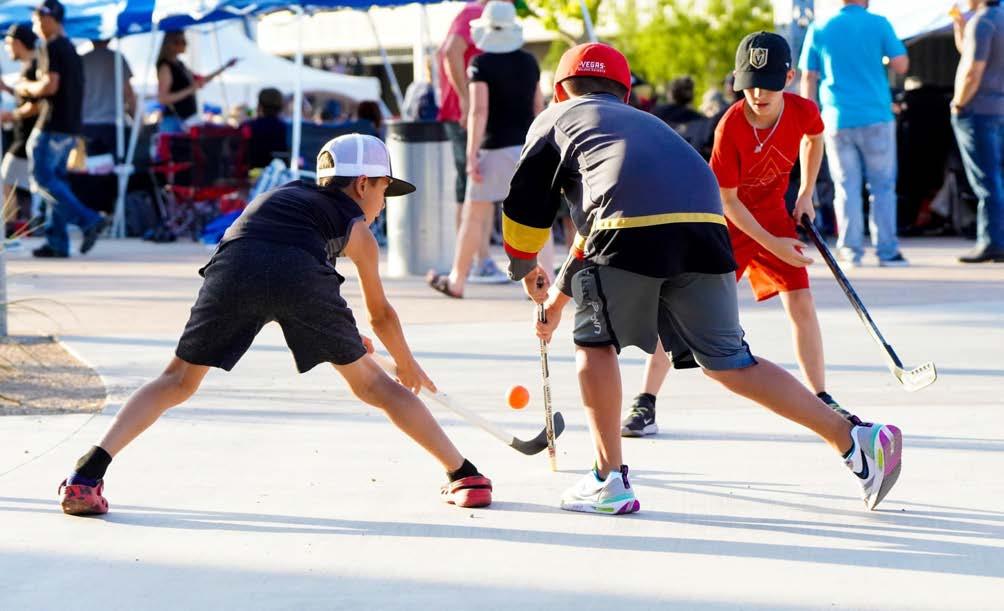
Figure 2.32 - Young boys play an impromptu game of field hockey in Henderson (COH, n.d.).
EXISTING CONDITIONS
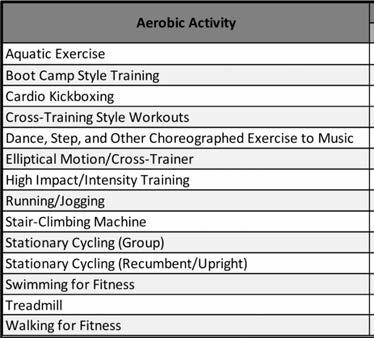
1. AEROBIC ACTIVITY
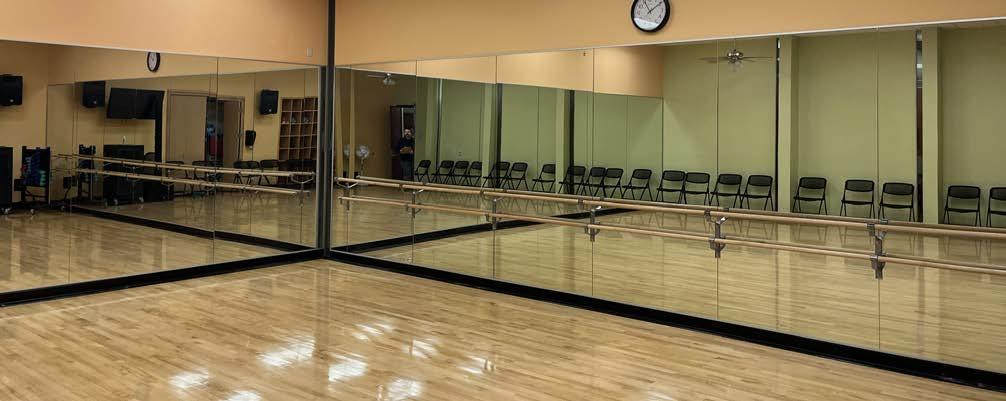
Of the 14 recorded and tracked aerobic activities, over half are experiencing negative participation trends over the previous five-year period (Figure 2.33). Dance, step, and other choreographed exercise to music are experiencing the most positive five-year participation trend whereas utilizing stair-climbing machines and treadmills, swimming for fitness, and boot camp style training are all experiences growth in the past three years.
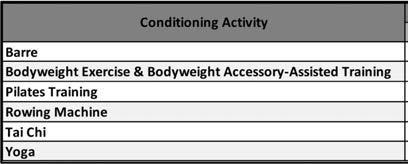
2. CONDITIONING ACTIVITIES
Bodyweight exercise and bodyweight accessory-assisted training is the only conditioning activity experiencing negative participation trends over the last 3- and 5-year periods (Figure 2.34). Barre, Pilates, and Tai Chi are all experiencing double-digit growth over the last three years.
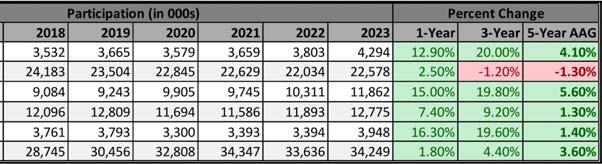
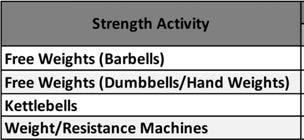
3. STRENGTH ACTIVITIES
Using weight/resistance machines is the only strength activity experiencing negative participation trends of the last 3- and 5-year periods (Figure 2.35). However, this activity has the second-most total number of participants in the strength activity category.
Figure 2.33 - National participation trends for aerobic activities (2016-2023).
Figure 2.34 - National participation trends for conditioning activities (2016-2023).
Figure 2.35 - National participation trends for strength activities (2016-2023).
PART TWO
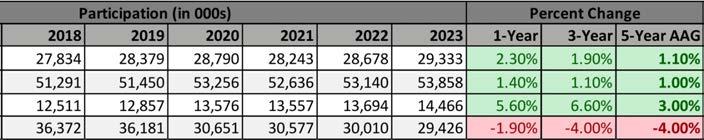
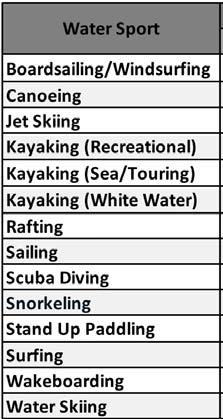
4. WATER SPORTS
Snorkeling is the only water activity experiencing a downward participation trend over the last three years (Figure 2.36). The fastest growing activities over the last five years are surfing, recreational kayaking, rafting, stand up paddling, and white-water kayaking.
Figure 2.36 - National participation trends for water sport activities (2016-2023).
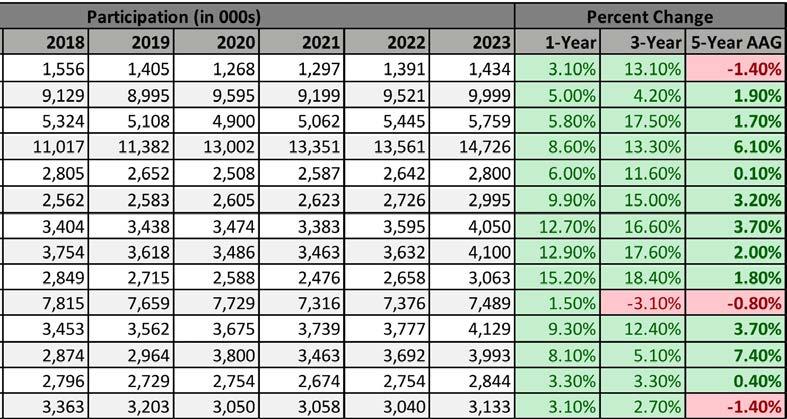
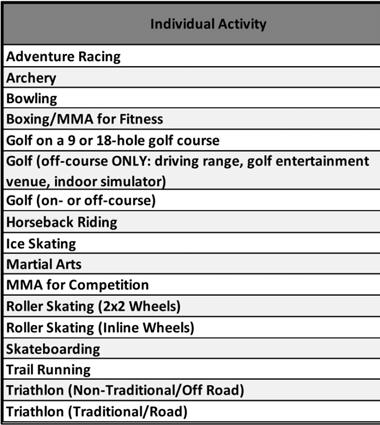
5. INDIVIDUAL ACTIVITIES
The top positive trending individual activities include off-course golf (driving range, entertainment venue, or simulator), horseback riding, trail running, MMA for competition, and boxing/MMA for fitness over the last three years (Figure 2.37). Triathlons (both traditional and non-traditional) and adventure racing are declining in participation over the last five years.
Figure 2.37 - National participation trends for individual activities (2016-2023).
EXISTING CONDITIONS
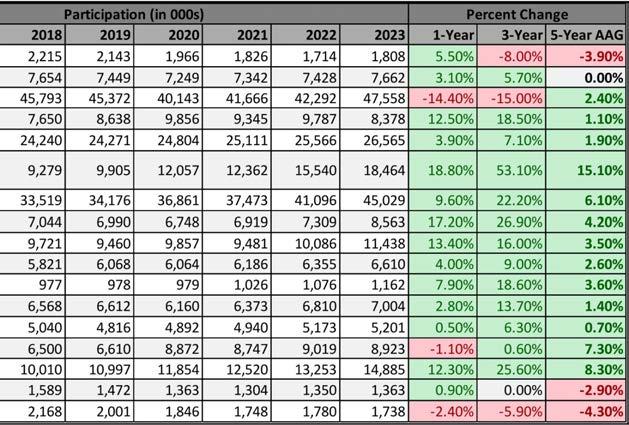
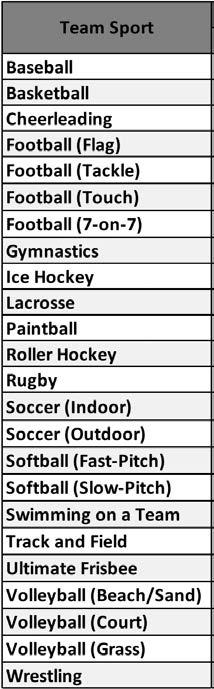
6. TEAM SPORTS
Most team sports are experiencing positive growth trends (Figure 2.38), but there are several experiencing a decline over the last five years such as roller hockey, rugby, ultimate frisbee, beach/sand volleyball, paintball, and slow-pitch softball.
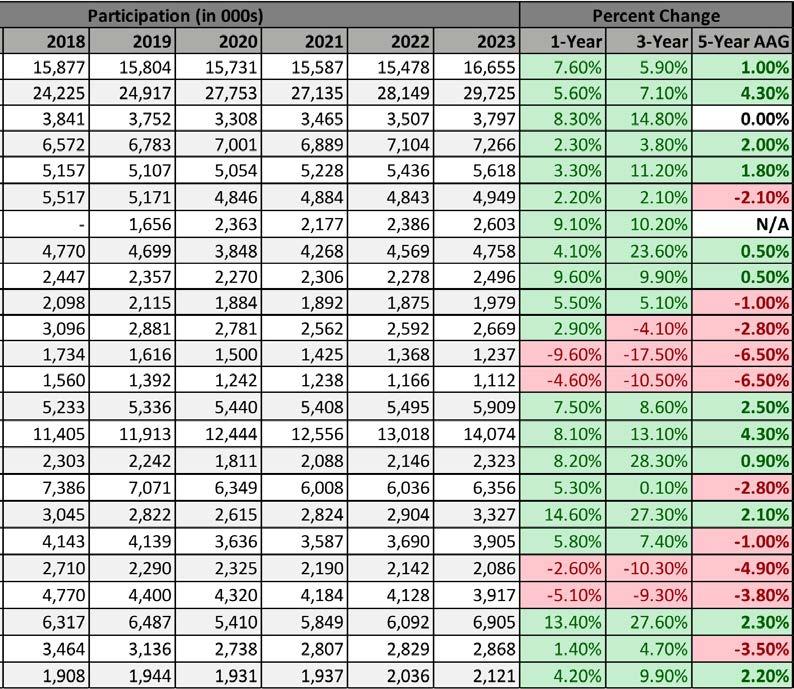
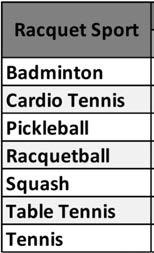
7. RACQUET SPORTS
Pickleball continues to be the fastest-growing racquet sport, approaching the same level of overall participation as table tennis, which has been declining (Figure 2.39).
Figure 2.38 - National participation trends for Team Sports (2016-2023).
Figure 2.39 - National participation trends for team racquet sport activities (2016-2023).
PART TWO
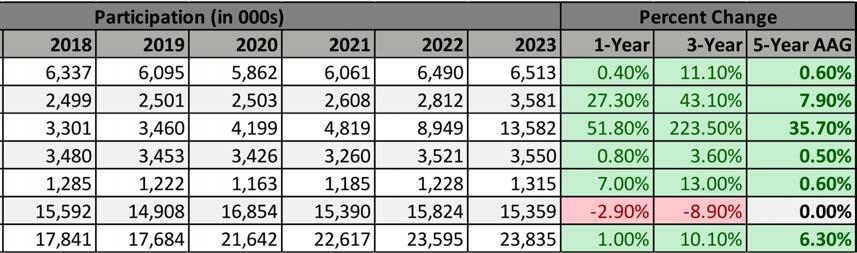
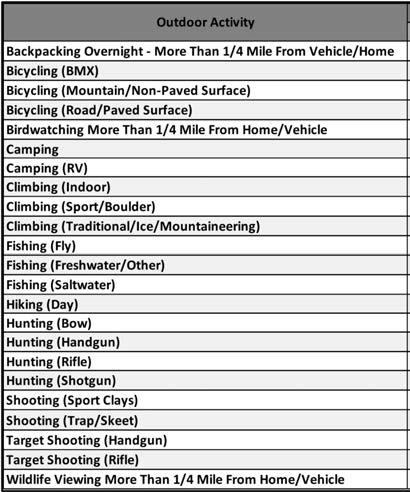
8. OUTDOOR ACTIVITIES
Over two-thirds of recorded and tracked outdoor activities have experienced positive participation trends over the last five years (Figure 2.40). BMX biking, indoor climbing, and bouldering are the fastest growing in the past three years. Activities experiencing the most participation decline are all generally related to shooting sports.
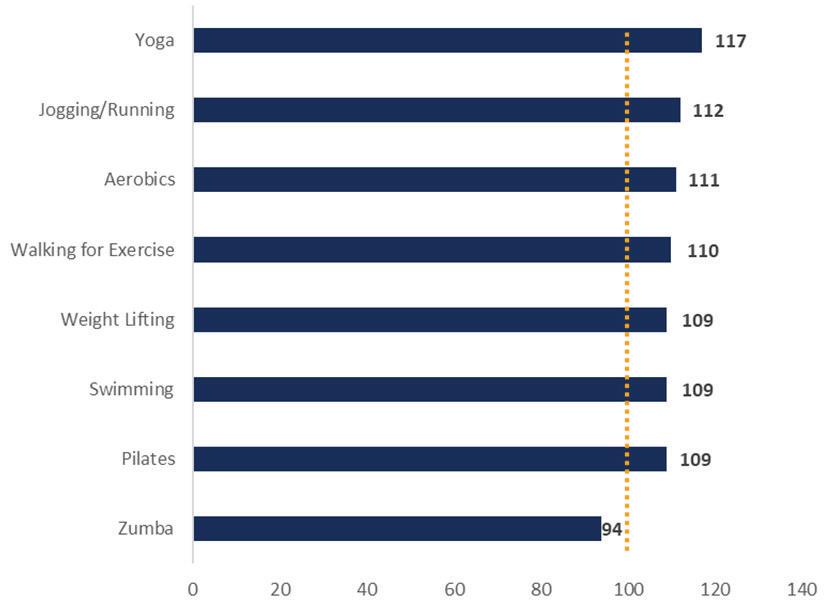
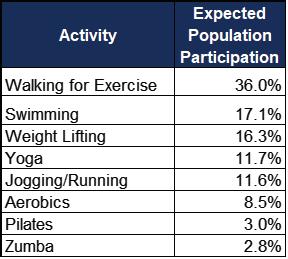
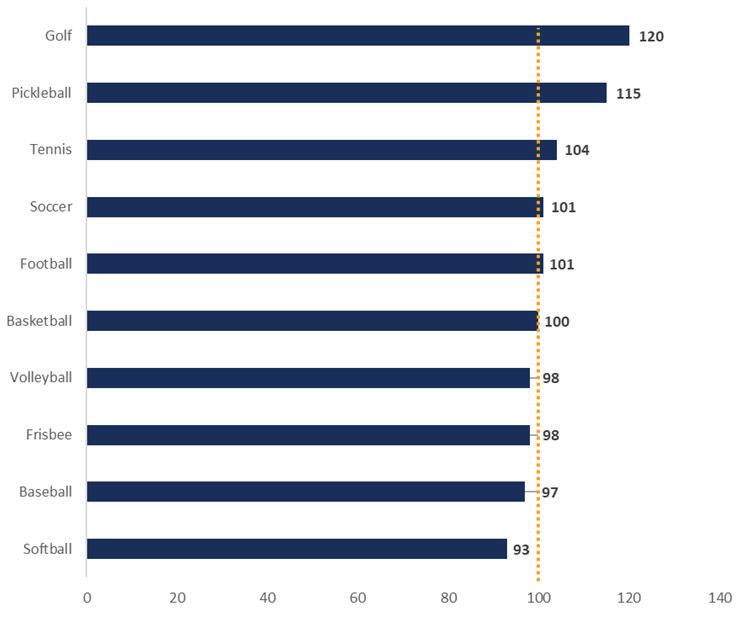
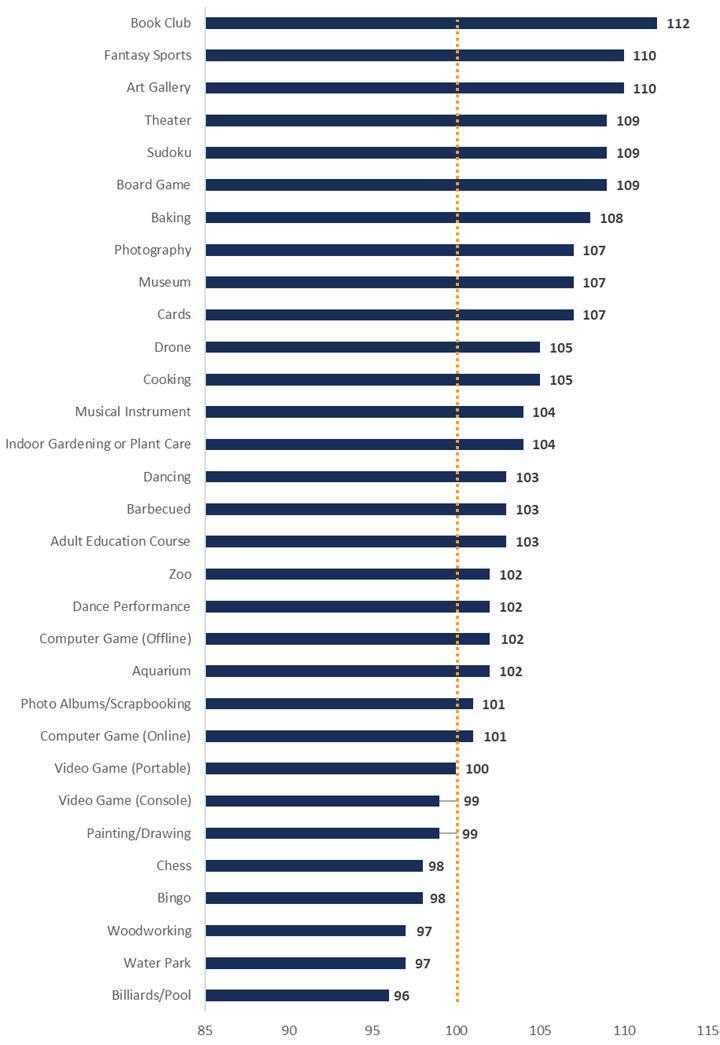
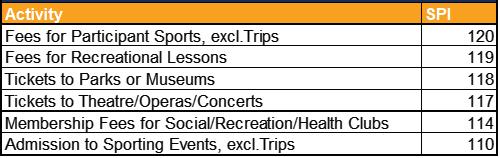
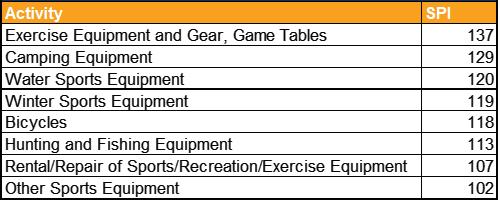
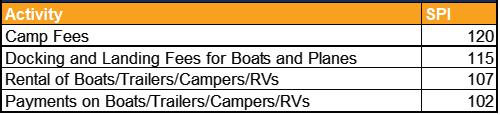
D. SUMMARY OF FINDINGS
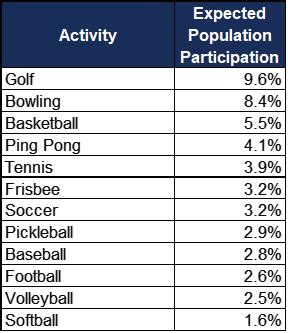
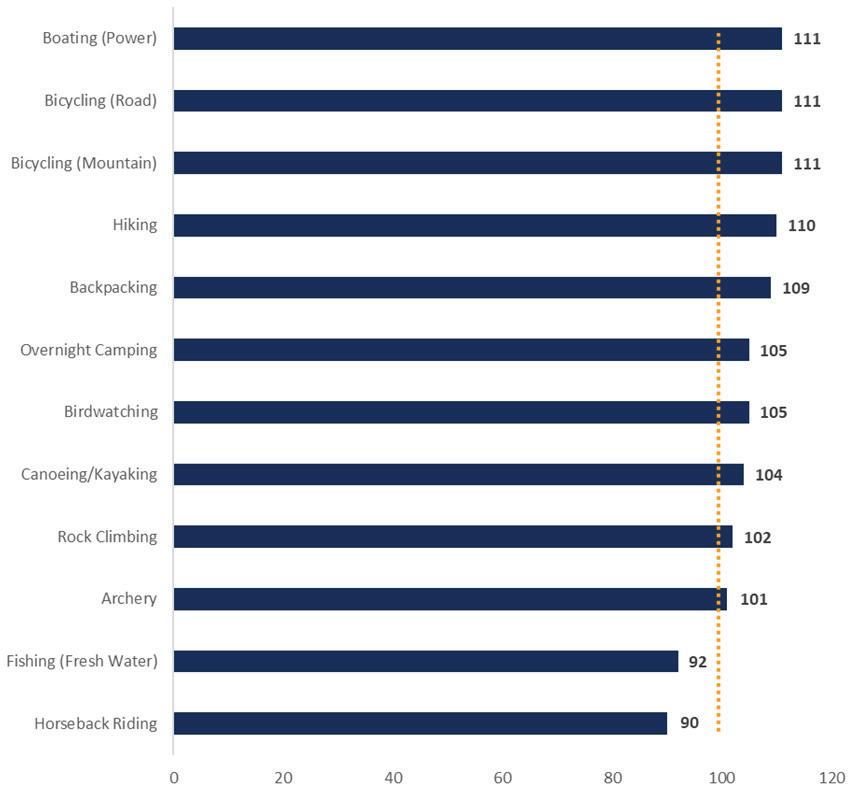
MPI findings demonstrate that Henderson residents have an above average appetite for nearly every type of recreation that was measured – from basic personal health activities such as walking to more specialized pursuits like yoga and swimming. Similarly, MPIs for sport and outdoor activities exceed the national baseline, even though the percentage of residents who participate in each sport is single digit. In practical terms, this means latent demand is high: residents may want to play basketball, softball, or pickleball far more than current enrollment numbers suggest, but they could be constrained by limited time, skill, awareness, or disposable income (among other things).
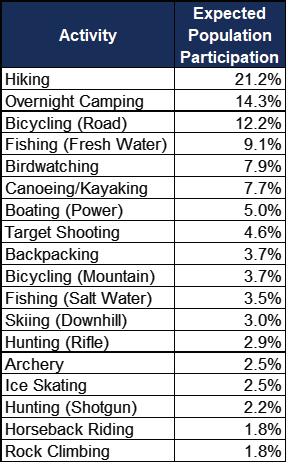
SFIA trendlines indicate “access centric” activities that require minimal equipment or cost (e.g., trail
running, recreational kayaking, hiking) are rising, while traditional fee intensive activities (e.g., weight machines, triathlon, off road team sports) are flat or declining over the last five years. This aligns with the local outdoor MPI interest for hiking (21% expected participation) and camping (14%). The takeaway is that low barrier, nature oriented experiences are growing fast both nationally and locally.
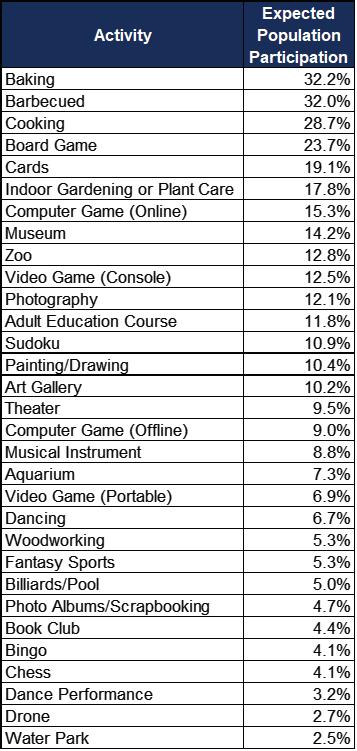
Finally, the enrichment activity MPIs indicate strong relative demand for arts, culture, horticulture, culinary experiences, and technology classes. These classes may sit outside P&R’s core programming, but the presence of high MPI values suggests that residents view parks and recreation as a portal to lifelong learning as well as fitness, sports, aquatics, and the like.
Figure 2.40 - National participation trends for team outdoor activities (2016-2023).
Expand and connect multi-use trails, trailheads, shade structures, and wayfinding - especially for hiking and cycling corridors that link neighborhoods to regional assets such as the River Mountains Loop Trail. Integrate “lite” amenities (bike fix-it stations, hydration, lighting) rather than large capital builds when possible.
2. Balance Cost Recovery With Equity. A tiered pricing model (resident discounts, income qualified subsidies, corporate sponsorships) will be essential to keep programs accessible while meeting cost recovery targets.
3. Shift Programming To Meet Latent Demand. Expand drop -in and league options for emerging sports (e.g., pickleball, futsal) where MPI scores are high but participation is modest, signaling unmet desire. Ramp up enrichment classes (such as arts, culinary, coding) through partnerships with the library, workforce - development agencies, and local chefs/artists.
4. Invest In Flexible, Multi- Use Spaces Instead Of Single -Purpose Facilities
Gymnasiums designed with convertible courts and movable walls, and outdoor plazas wired for events, allow staff to pivot quickly as trends evolve without major reinvestment. Leverage national participation trends for marketing and grants. The upward trajectory of “nature -based” fitness and non-traditional activities strengthens the City’s position when applying for SNPLMA or Regional Trails Program (RTP) grants that fund trails, paddle sport launches, and urban forestry.
5. Measure Success Beyond Raw Enrollment. Track per- capita participation, facility activation rates, and equitable access metrics to ensure that high MPI categories translate into broad, inclusive community benefit – beyond simple higher enrollment statistics in already well-served segments.
Figure 2.41 - Example of a well -designed and constructed native revegetation area (COH, n.d.).
PART TWO
2. EXPENDITURES & BUDGET PRESSURES
Rising Operating Costs
Year-to-date FY24 expenditures for P&R were tracking about 10% over the prior year, reflecting increased salary/benefit costs (particularly in publicfacing positions and seasonal/part-time labor) plus higher utility and maintenance costs. (Source: FY24 Monthly Reports Analysis April 2024 pg. 1). P&R projects approximately a 4-10% annual growth in total operating expenditures, driven by a mix of wage adjustments, benefits, and contract service escalations. (Source: 2024-2025 CABR pg. 243-246).
Capital Projects and Asset Management
Significant capital outlays are documented in the various CIP reports, including new or renovated community centers, aquatic facility improvements, playground replacements, and multipurpose field expansions. As new park assets come online, ongoing operations and maintenance activities place added stress on the operations budget. (Source: FY24 CIP V3-Final pg. 155-159 and FY25 COH Capital Improvement Plan pg. 9). Certain large capital projects (like the planned West Henderson Recreation Center) reflect the City’s commitment to expand community facilities, but also carry higher operating costs once opened. (Source: FY25 COH Capital Improvement Plan pg. 9 and Consultant Observation).
Cost Recovery vs. Community Access
P&R balances revenue-generation strategies (e.g., user fees) against the broader communityaccess mission. Recent performance suggests the department is maintaining moderate cost recovery while preserving affordability for Henderson residents. (Source: FY24 PR Monthly Financial Report April 2024 and Consultant Observation). As capital and operations and maintenance costs grow, the City may face pressure either to raise fees (including nonresident) or to rely more on dedicated tax support to keep program costs reasonable for residents. (Fee Schedule 2023 and Consultant Observation).
3. EMERGING THEMES & OBSERVATIONS
Consistent
Demand for Programs & Facilities
Resident interest remains strong for recreational programs, special events, aquatics, and senior activities. Department rentals (including sports fields) have also seen robust demand, boosting revenues in certain divisions (which positively impacts the City’s general fund). (Source: 2025 City of Henderson Community Needs Assessment Survey pg. 6 and FY24 Monthly Reports April 2024 pg. 1-3).
Continued Growth & Development
Both the Cadence and West Henderson areas continue to drive new park and recreation facility expansions. Developer contributions (infrastructure and “turnkey” parks), along with partial userfee funding, support these expansions. A key takeaway to this growth is ongoing operations and maintenance for expanded parks and facilities will rise proportionally; additionally, turnkey parks are transitioned to the City without O&M funding added. (Source: West Henderson Public Facilities Needs Assessment pg. 7-9 and Facility Tours/Consultant Observation).
Healthy Livable Sustainable City Goals
The City of Henderson’s strategic focus on healthy living, active lifestyles, and community well-being is reflected in CIP priorities such as new recreation facilities, walking/biking trails, and inclusive playgrounds. Aligning these expansions with stable, recurring funding streams is a long-term objective. (Source: City of Henderson Strategic Plan pg. 17 and 24; 2024-2025 CABR pg. 243-246).
Cost Pressures For Salaries & Benefits
P&R experiences rising staffing costs (merit, COLA, benefits). As observed from public recreation agency trends, many positions are seasonal and parttime, which can somewhat moderate overhead, but also introduces recruitment and retention challenges as wage pressures based on location remain competitive. (Source: 2024-2025 CABR pg. 240; FY24 Monthly Reports Analysis April 2024 pg. 1; Ward 4 PowerPoint Feb 7; and Consultant Observation). Maintenance costs have also trended upward, influencing the budget for indoor aquatics, multigenerational centers, and large park sites. (Source: 2024-2025 CABR pg. 243 and Facility Tours/ Consultant Observation).
EXISTING CONDITIONS
4. IMPLICATIONS FOR THE 2026 TAX LEVY RENEWAL
The following themes are generated based on the three previous sections combined with consultant observation and narrative as a precursor to the subsequent recommendations section.
Critical Role of Levy-Backed Funding
The levy funds 40% of ongoing parks maintenance and operations. Should the 2026 levy renewal fail, P&R’s general fund support would either need to increase or the City would have to reduce services and/or facilities to close the gap.
Population Growth + Capital Expansion = Ongoing Needs
P&R has 125 capital improvement projects complete or underway, totalling $150 million in investment, and the “footprint” of parks and facilities will continue expanding in coming years. Post-2026, P&R will need additional stable, recurring funding to operate and maintain these additional assets effectively as P&R is already currently experiencing stress on maintaining and operating the existing system.
Financial Sustainability & Rate Structures
To complement (and not over-rely on) tax-based funding, the City will need to continue reviewing user fees, membership rates, and nonresident surcharges. However, significant fee hikes could reduce community participation, especially in lowerincome demographics.
Community Outreach & Public Engagement
As 2026 approaches, clearly communicating P&R’s achievements, economic impacts, and community benefits is critical to building support for the levy. Data such as usage metrics, cost recovery improvements, and success stories (e.g., youth sports, senior wellness) can be shared with residents to demonstrate return on investment.
5. RECOMMENDATIONS
A. Maintain & Strengthen Fiscal Transparency
Continue publishing recurring performance dashboards (covering revenue, cost recovery, expenditures, participation metrics) to reinforce stewardship of public funds. Demonstrate how property tax and fee revenue directly support programs the community values.
B. Refine Targeted User-Fee Strategies
Consider modest, inflation-based adjustments in membership, rental, and non-resident rates to keep pace with rising operations and maintenance costs. Consider differentiating fees where possible to preserve affordability for key resident groups.
C. Expand Partnerships and Grants
Maintain active pursuit of SNPLMA grants, philanthropic contributions, and corporate sponsorships to offset larger capital outlays. Strengthen relationships with youth leagues and sports tourism events to increase facility usage and associated rental revenue.
D. Implement Proactive Asset Management Principles
Build robust asset management practices into the CIP process to control lifecycle costs. For example, scheduling playground replacements and pool refurbishments in a manner that avoids large deferred maintenance spikes.
E. Communicate the Value of Parks & Recreation
Ahead of the 2026 levy renewal, highlight P&R’s role in public health, property values, and community cohesion. Publish success stories about inclusive park design, environmental stewardship, or local economic impacts (e.g., tourism from sports tournaments).
F. Sustain Service Innovations
Continue refining service models, such as online program registration and dynamic scheduling. Evaluate cost-effectiveness of pop-up programming and rentals in underserved areas, mobile recreation, or shared facility use to maximize reach without fully building new sites.
PART TWO
B. NON-RENEWAL
STRATEGIES 2026 TAX OVERRIDE
Based on all documentation collected, reviewed, and analyzed, the following strategies are provided for P&R’s consideration. These recommended actions relate more to the scenario of the levy renewal failing, but there are strategies that remain relevant regardless of the levy renewal outcome.
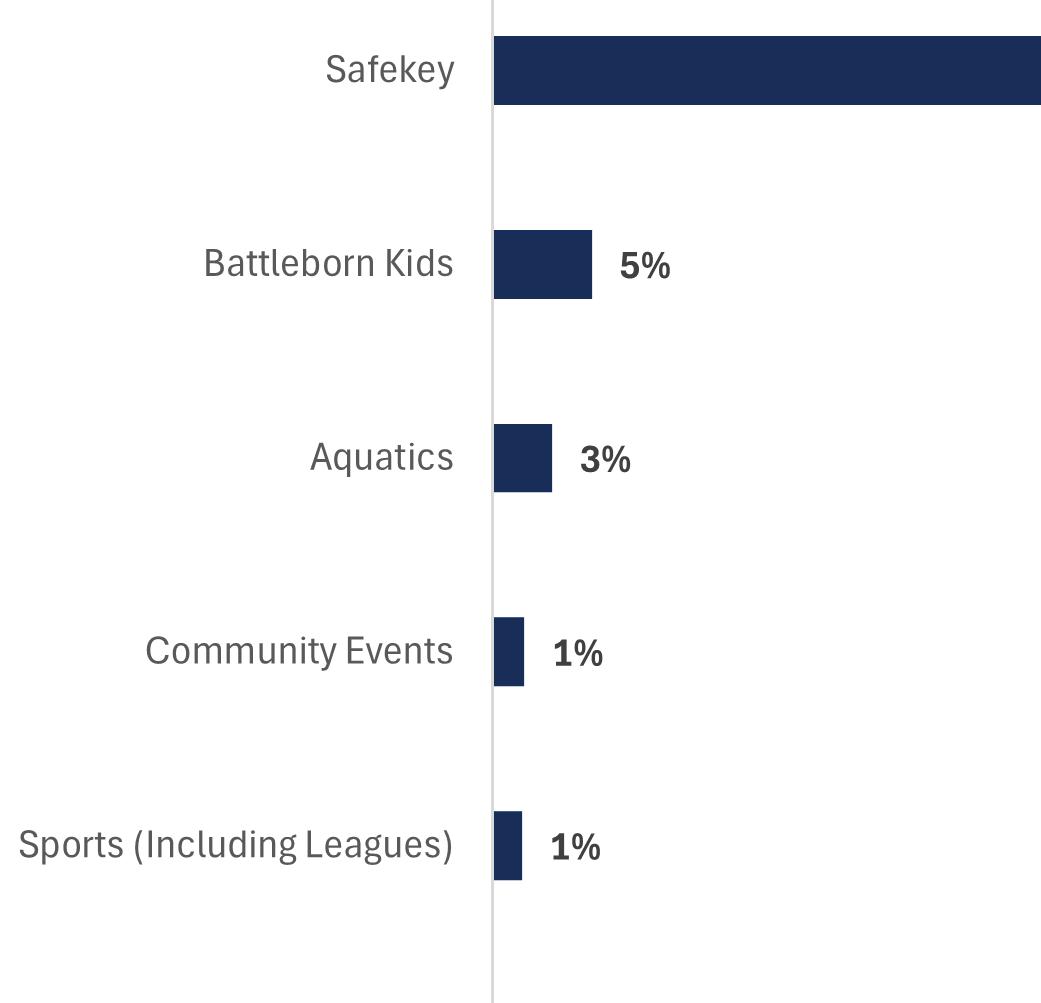
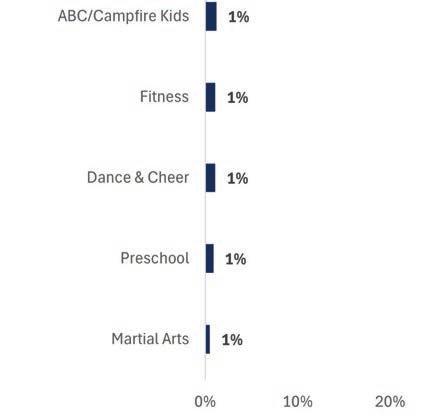
1. NON-RENEWAL PROGRAMMING STRATEGIES
Focus on Core Revenue Drivers & Community Essentials. Prioritize large-impact programs (e.g., Safekey, Battleborn Kids, Aquatics, Sports Leagues) that yield both high enrollment and strong cost recovery. Minimally reduce these, given their importance to families and robust revenue streams. Provide essential, low- or no-cost youth/senior services that fulfill broader equity or public safety roles if they cannot be replaced by outside partners.
Capture “Missed” Revenue
Add program sections where waitlists recur and shift a portion of peak classes into shoulder windows.
Consolidate or Sunset Lower-Performing Classes. High cancellation programs or those consistently operating at low capacity should be paused or merged. Reallocate staff or facility hours from duplicative or lightly attended offerings to the more impactful ones.
Implement More Stringent Cost-Recovery Measures
Seek sponsorship or grants for specialized or “niche” classes. Explore volunteer-led or nonprofit-run programs to limit staff overhead.
Expand Partnerships
Collaborate with nonprofits (e.g., local youth organizations, specialized community health groups, or philanthropic sponsors) to offset staff or supply costs. If certain recreation centers have capacity at certain times, consider sub-leasing to third-party instructors or clubs who pay usage fees.
2. NON-RENEWAL CIP ADJUSTMENT STRATEGIES
Defer or Sequence Non-Essential Projects
Review the CIP’s schedule for park renovations, new facility builds, or major equipment replacements. Defer lower-priority items (e.g., large aesthetic upgrades, expansions in areas with slower growth) until revenues stabilize. Stagger or phase construction to spread capital outlays over multiple years. For example, if a playground renovation and pool expansion are both slated for the same year, push one out 2-3 years to reduce short-term cash strain.
Repurpose Under-Used Facilities
If the CIP identifies expansions in a location that already sees under-utilized capacity, consider repurposing existing space rather than adding brandnew square footage. Example: convert a seldomused meeting room into a specialized fitness studio, thereby generating new revenue without the cost of new construction.
Sell or Lease Surplus Land
If the CIP and monthly usage reports show certain properties have extremely low usage or are in areas with duplicative resources, evaluate the possibility of selling or leasing that land to generate a one-time infusion or ongoing lease revenue. Proceeds can be re-directed into urgent capital needs at higherdemand sites or used to offset operating cuts.
Implement “Right-Sizing” for Renovations
Instead of large-scale, high-cost facility overhauls, do targeted “critical repairs only.” For instance, if the CIP calls for a multi-million-dollar recreation center remodel, focus on structural, safety, and ADA compliance improvements first, then do aesthetic or capacity expansions only when funding recovers.
3. NON-RENEWAL STRATEGIES FOR SOUTHERN AND WESTERN HENDERSON (AS FUNDING ALLOWS)
Leverage Public Facilities Needs Assessment (PFNA) Contributions to Offset Recreation Capital
The PFNA outlines how developer contributions can be used for parks and recreation. Ensure that any expansions or new park construction in West Henderson are fully cost-shared with these PFNA contributions so that new growth pays its proportionate share. This can limit the financial burden on P&R’s general fund for development in southern and western Henderson.
Coordinate with Developers on Joint-Use Facilities
Consider agreements where large master-planned communities help maintain, not just develop, recreation amenities.
Revisit PFNA Rates
If the dedicated levy fails, it may be beneficial to review (and possibly increase) the PFNA or other developer impact fees, within legal constraints, to ensure that new growth continues to cover the cost of new facilities. This can partially protect citywide operating funds from being spread too thin.
4. NON-RENEWAL ALTERNATIVE FEE & FUNDING MECHANISMS
Tiered/Variable Pricing
Beyond typical user fees, explore more nuanced structures such as “peak vs. off-peak” facility rentals, premium memberships for prime hours, “family bundle” discounts, or corporate membership packages.
Utilize Fee Schedule “Add-Ons”
Use the existing Fee Schedule as a baseline but add surcharges for optional services (e.g., private event reservations, specialized equipment usage, premium sports league features). If inflationary pressures persist, adopt small annual escalators or CPI-based adjustments to keep up with rising costs.
Naming Rights & Sponsorships
Invite local businesses or philanthropic organizations to sponsor entire sports fields, aquatic features, or major events.
EXISTING CONDITIONS
5. NON-RENEWAL OPERATIONS & ADMINISTRATION
Energy & Utility Cost Controls
CIP and monthly financial reports often highlight large utility costs for aquatics and large recreation centers. Implement energy-saving retrofits where feasible. Even if these require capital up front, they can reduce monthly utility expenses significantly.
Technology & Data-Driven Operations
Expand use of analytics from monthly or daily attendance data to staff your facilities at minimal levels during predictable low-traffic times, preventing overtime or excess part-time hours.
6. NON-RENEWAL POLICY & ORDINANCE OPPORTUNITIES
Adjust the City Code or Development Code
Revisit local policies about “turnkey” parks built by developers; ensure design standards are reviewed continually to include materials that reduce city lifecycle costs while achieving preferred functionality and usability.
Leverage Grants and/or Special District Financing
Explore forming special assessment districts for major park expansions or large-scale facility refurbishments in growing areas. Residents or businesses that benefit most pay an incremental property assessment. The Bryant Park Business Improvement District (BID), which manages and operates Bryant Park in New York City, represents a proven best practice example for this type of operational model. In addition, P&R should continue to seek matching grants or state/federal funding for active transportation, new trails, or sports field conversions (e.g., from natural grass to synthetic turf, saving water and maintenance). Of note, all field conversions should be evaluated beforehand for expected operations and maintenance considerations.
PART TWO
7. CONCLUSION
The Henderson Parks and Recreation Department has demonstrated solid revenue performance and moderate cost recovery amid continued community demand and planned facility expansions. Key trends include rising operations and maintenance costs, an expanding facility network in growth areas like southern and western Henderson and additions of planned communities such as Cadence, and a strong mandate to provide accessible, healthy-lifestyle programs for residents.
Looking ahead, the 2026 tax levy renewal will be pivotal. Renewal would ensure P&R’s major revenue stream remains intact, allowing support for current service levels and some support for capital plans. If the levy were not renewed, significant service reductions and/or substantial shifts to user fees will be required. Proactive financial planning and clear public outreach will thus be essential to sustain broad support for Henderson’s parks and recreation programs in the decade ahead.
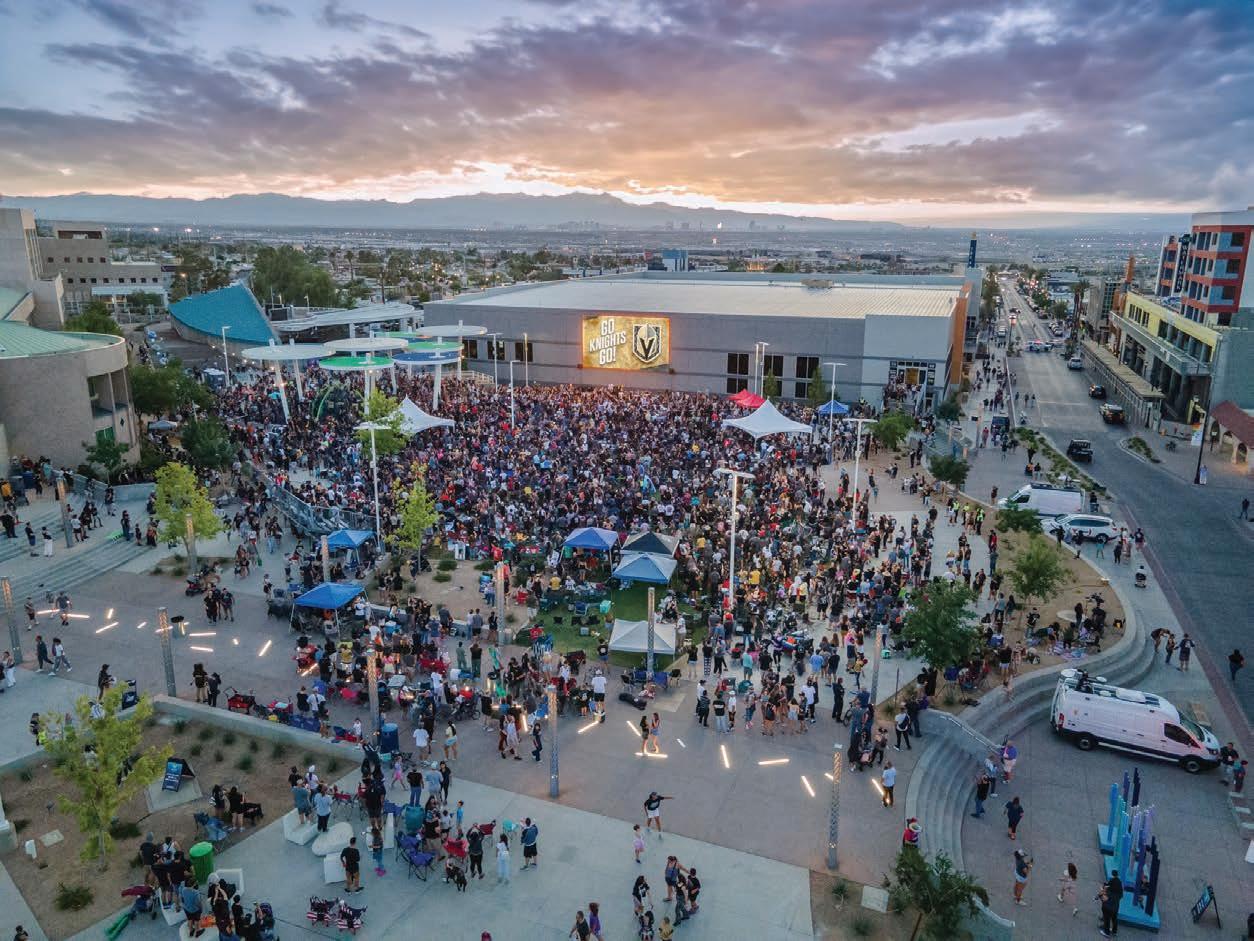
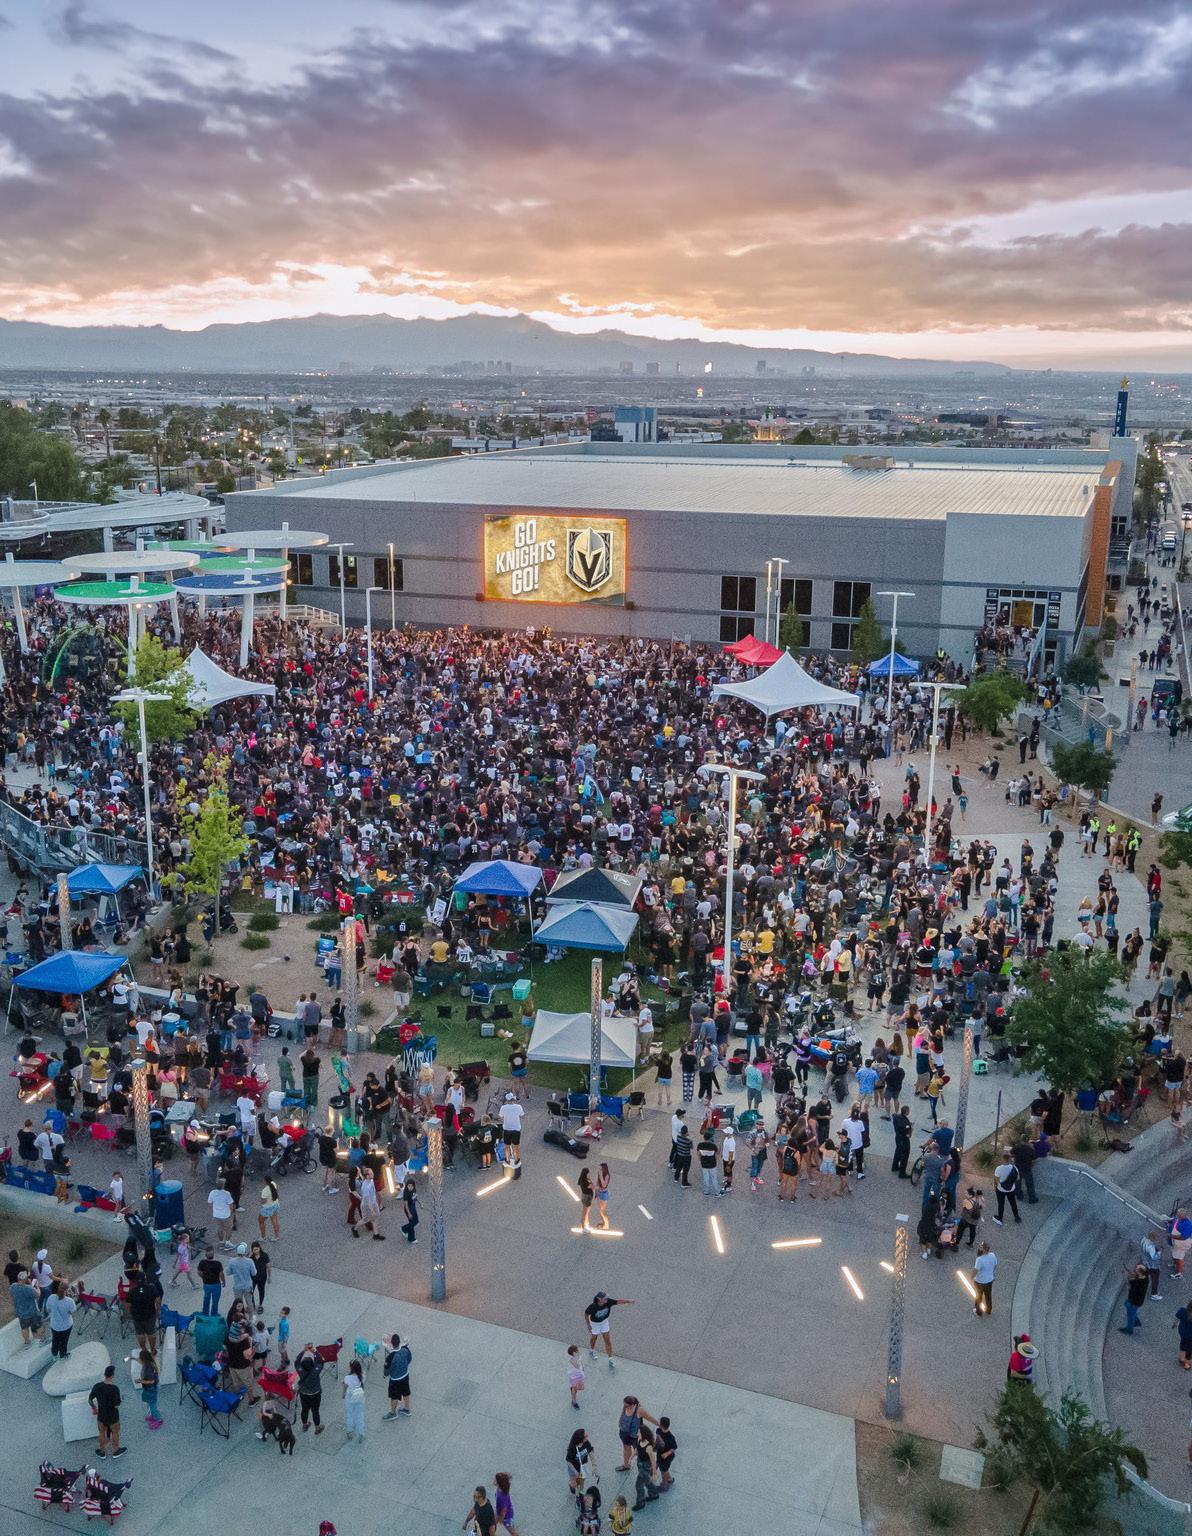
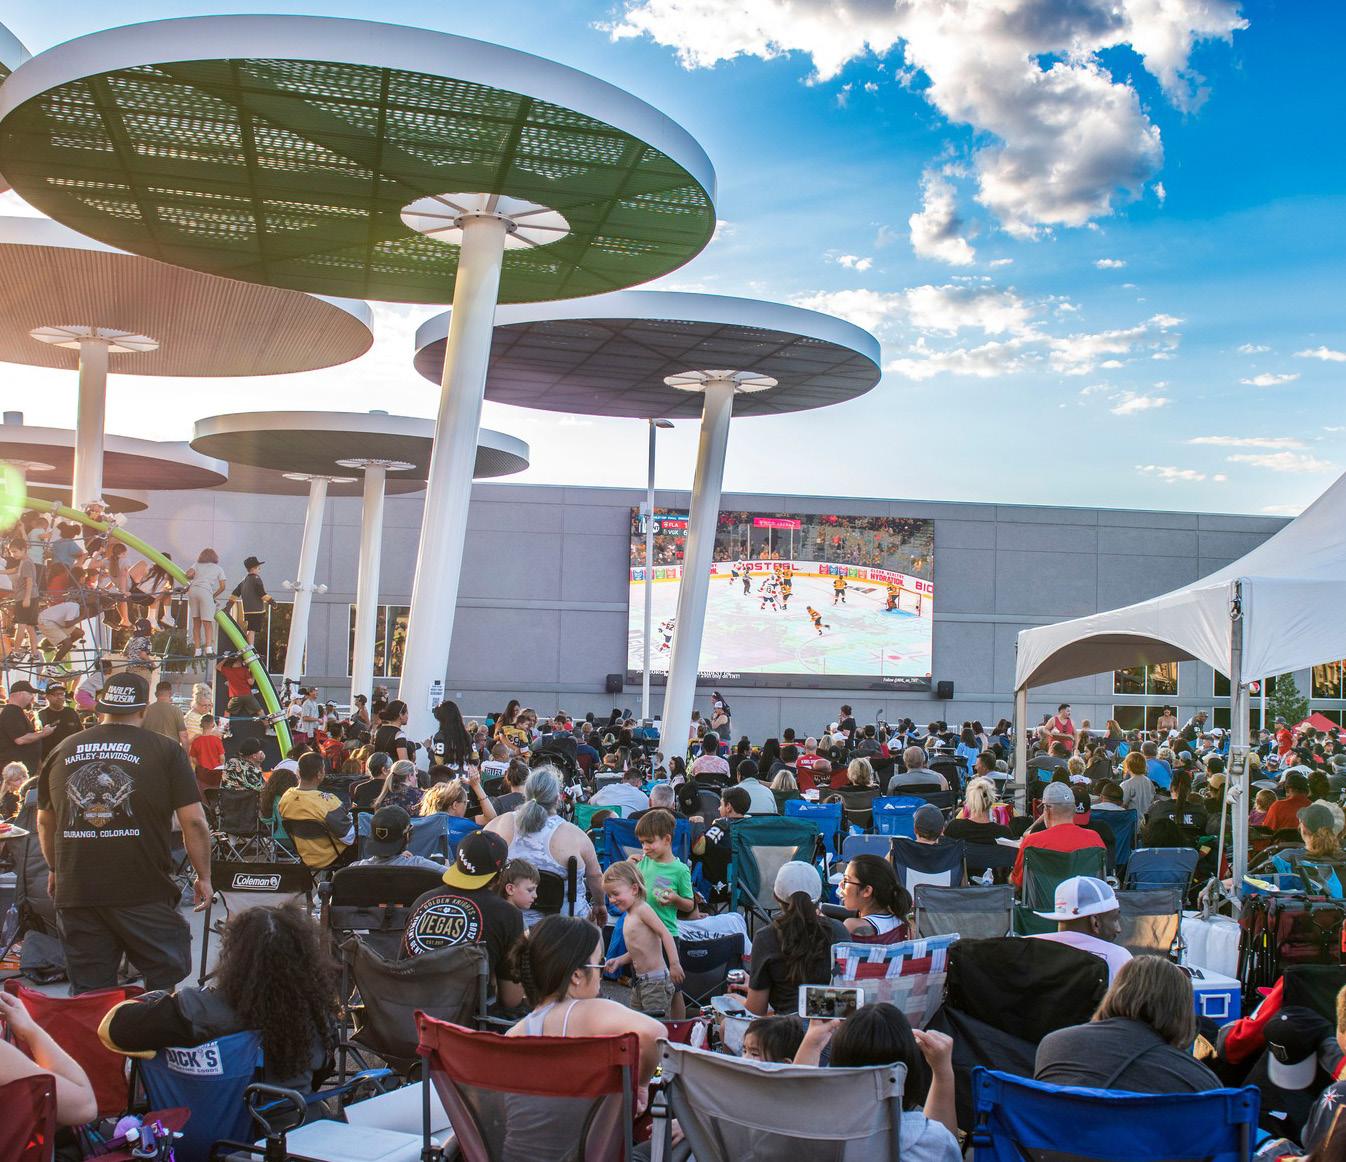
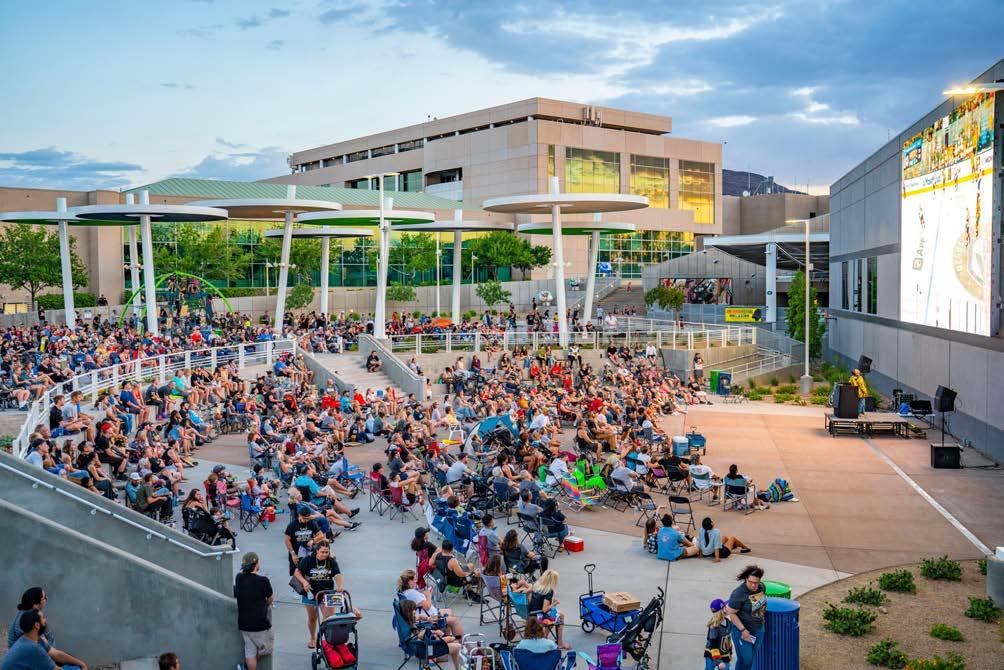
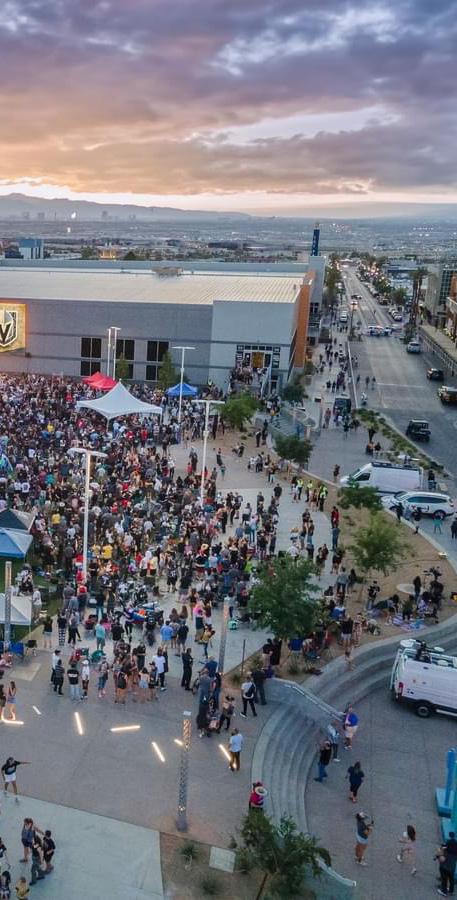
Figure 2.42 - Community “watch party” at Water Street Plaza (COH, n.d.).
EXISTING CONDITIONS
C. OPERATIONS
1. COMCATE ANALYSIS
Data was collected and analyzed from July 2021-July 2024 from the Comcate work order management system. This system allows both public and staff to submit maintenance requests. The following sections outline the most common and reoccurring issues/submittals from the 1,281 submitted items.
A. Irrigation + Sprinklers
+ Broken or misaligned sprinkler heads in parks, medians, and along trails.
+ Over-spray, pooling, and runoff onto sidewalks/ streets.
+ Sprinkler heads that continue to run after landscaping changes (e.g., “watering dirt” when no plant/vegetation exists anymore).
B. Landscaping + Trees
+ Reports of bushes, palm trees, and shrubs obstructing sidewalks, signals, or driver line-ofsight.
+ Palms often need trimming to remove hazardous fronds.
+ Overgrown vegetation near sidewalks sometimes forces pedestrians into the street.
+ Overgrown vegetation along medians.
+ Residents frequently call in for maintenance behind their property lines, especially in easements or city-maintained buffer zones.
C. Vandalism and Graffiti
+ Recurrent graffiti in park restrooms, playground equipment, along trails, on benches, and on walls.
+ Offensive or explicit language and imagery.
+ Tagging often reappears in the same spots (tunnels, restroom walls, and near skateparks).
D. Trash, Debris, and Dog Waste
+ Overflowing trash cans on trails and within dog parks.
+ Uncollected litter and debris after events, such as tournaments or special gatherings.
+ Construction debris or large items (such as old tires and furniture) dumped along trails or in park parking lots.
+ Animal waste accumulation in dog parks or near trails where bag dispensers are empty.
E. Playground and Park Facilities Upkeep
+ Broken or worn-out playground equipment (such as slides, swings, cross-beams).
+ Issues with lack of playground shading, tattered shade canopies, or damaged benches.
+ Gymnasium floors or sports courts needing cleaning, patching, or new surfacing.
+ Public restrooms with missing stall doors, broken locks, or water fountain issues.
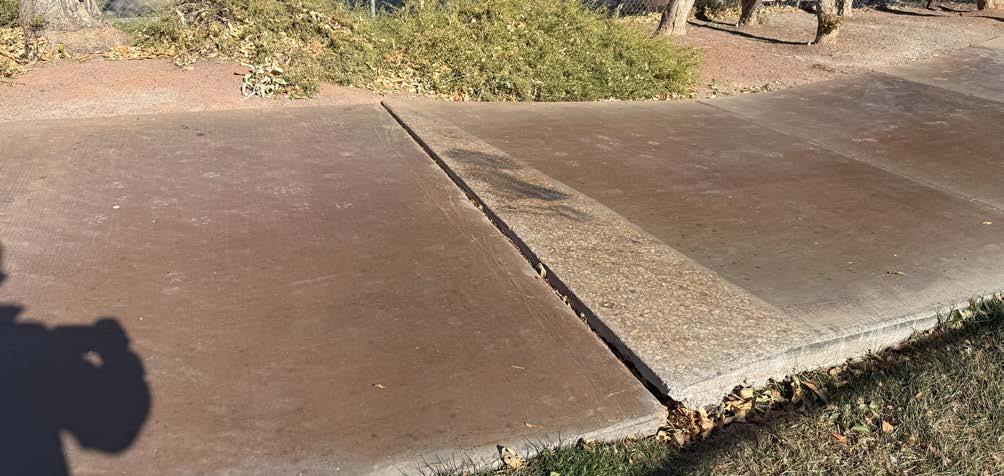
F. Trails Maintenance
+ Cracks, raised concrete edges, or ruts in highuse trails.
+ Lights out along some trail corridors or in tunnels.
+ Debris or gravel that accumulates on the trail after storms.
+ Requests for improved lighting or signage in areas with heavy foot/bike traffic.
G. Pests and Wildlife
+ Reports of wasps/hornets near playground equipment or dog parks.
+ Overpopulated geese or pigeons at some parks leaving droppings around tables and paths.
+ Fire ants or other biting insects near turf and playgrounds.
PART TWO
D. DOCUMENT REVIEW
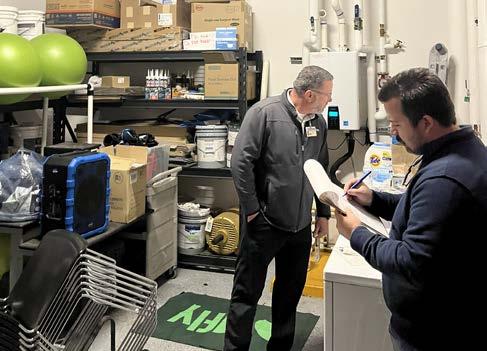
The consultant reviewed P&R’s organizational structure, Parks Operations Manual, and an example park-specific maintenance standard operating procedure (SOP). The following sections outline observations and takeaways.
1. OBSERVATIONS
Organizational Structure
P&R has a clear hierarchy with dedicated superintendents and managers for both Recreation and Parks. Park operations staffing includes Parks & Facilities Maintenance Coordinators, Irrigation System Technicians, a Municipal Forester, and various levels of maintenance workers. This structure helps ensure tasks are divided according to specialization (e.g., forestry, irrigation, playgrounds, facilities).
Maintenance Modes and Service Levels
The Operations Manual outlines five (5) different park maintenance modes. Each park, trail, or landscape area is categorized by how frequently it needs mowing, edging, litter removal, irrigation checks, and repairs.
Standardized Operating Procedures
A significant portion of the Park Operations Manual covers SOPs for everything from irrigation shutdowns, fencing projects, playground inspections, equipment repairs, and hazardous materials handling to closing detention basins or trail under-crossings during flood events, helping to ensure staff follow consistent steps city-wide.
Safety and Inspections
P&R emphasizes playground inspections and safety checks on a set schedule. Playgrounds typically receive weekly visual inspections and a more detailed monthly review by a Certified Playground Safety Inspector, with repairs often prioritized within 24 hours. Irrigation is another major focus. Parks in Modes I-III generally require daily checks so that leak repairs or controller adjustments can be made quickly.
Maintenance Management Plan
Using the same format for each park will ensure P&R can verify compliance with the desired mode and can maintain consistent standards system-wide.
Integrated Pest Management (IPM) and Environmental Stewardship
The Park Operations Manual encourages IPM by applying chemical, mechanical, or cultural methods only when necessary to address pests, weeds, or diseases. Staff also watch for stress or damage to trees and turf, focusing on proactive or preventative treatment.
Accreditation and Updates
The Park Operations Manual references P&R’s goal to maintain CAPRA accreditation. As a result, the manual is revised periodically. Additionally, staff record fertilizer and pesticide applications, inspection results, and hours worked on each activity so the data can be used for budgeting, contract management, and to meet accreditation requirements.
2. RECOMMENDATIONS
A. Link park-specific maintenance management plans to work-order software or mobile apps.
B. Regularly analyze the completed checklists and digital records to spot patterns or budget needs.
EXISTING CONDITIONS
E. PROGRAMMING
All available program registration data was collected for 2018-2024, omitting fiscal years 2019-2020 and 2020-2021 to avoid Covid-era data influences. The data was compiled and organized in a manner that allowed for use statistics related to core program areas and specific facilities. Metrics analyzed include activities offered, cancellation rates, enrollments, average enrollments per activity, residency ratios, revenue, average revenue per enrollment, average program capacity (for those that ran), waitlist statistics, and “missed” revenue due to waitlists. The following section provides the key takeaways.
1. KEY TAKEAWAYS
Demand and Revenue Drivers
Enrollment and revenue are concentrated in a small set of program families such as Safekey, Battleborn Kids, and aquatics. These areas also have steady resident participation and reliable per-enrollment revenue generation. Aquatics also accounts for most of the “missed” revenue tied to persistent waitlists in peak seasons and at high-demand sites.
Capacity Pinch Points
Henderson Multigenerational Center shows the largest cumulative “missed” revenue among facilities, perhaps an indicator of scheduling and space constraints more than lack of interest.
Throughput Vs Reliability
Cancellation rates vary by category: high-volume areas (e.g., aquatics, Battleborn Kids, Safekey) cancel far less than niche offerings, which often carry 40-70% cancellation rates. This trend points to protecting/expanding proven core programs and/or right-sizing, bundling, or sunsetting variable classes.
Residency Mix And Price Sensitivity
Most areas maintain a strong resident share, but several core program areas show growing non-resident participation. This trend supports the idea of modest, targeted non-resident differentials and peak/off-peak pricing (as long as resident affordability is preserved).
Facility Concentration
A disproportionate share of activities, enrollments, and revenue occurs at Henderson Multigenerational Center and the “big four” recreation centers (Valley View, Black Mountain, Whitney Ranch, Silver Springs). Valley View, Black Mountain, Whitney Ranch, and Silver Springs may need to be examined for incremental capacity (schedule density, shared spaces, added sections) opportunities.
Revenue Trends
Average revenue per enrollment has declined in many categories since 2018, suggesting the need to recalibrate price points, minimums, and/or class sizes. Special consideration should be made for smaller/niche offerings that struggle to cover direct costs.
Program Lifecycles
Several niche categories show small volumes, high variance, and low-cost recovery. These types of programs may be candidates for pilot programs, facilitative or cooperative programming delivery models, or sunsetting altogether.
2. FINDINGS
Facilities
Over one-third (36%) of registered program activities that operated between 2018-2024 took place at Henderson Multigenerational Center. This facility also accounts for approximately one-third of total enrollments (33%) and revenue generated (34%) over the same period. In terms of recreation centers, Downtown Recreation Center is the smallest in terms of activities operated, enrollments, and revenue (Figures 2.43-2.46).
EXISTING CONDITIONS
3. RECOMMENDATIONS
A. Capture Waitlist Demand
Add sections (and micro/mini-sessions) in aquatics and youth programs at Henderson Multigenerational Center, Whitney Ranch, Valley View, and Black Mountain. Program expansion should align with true demand periods (e.g., after work hours, weekend mornings, etc.). Extend shoulder/peak hours selectively, re-balance room blocks to reduce unused time, and/or shorten changeover between classes. Build an instructor pool/bench by examining the potential for recruitment/retention stipends.
B. Adjust Pricing and Policies
Introduce peak/off-peak pricing for premium slots and non-resident surcharges where non-resident demand is rising; preserve resident affordability via scholarships/bundles. Set clear minimum enrollment thresholds and auto-cancellation rules; consolidate low capacity sections early to increase average fill rate and instructor utilization.
C. Right-Size Program Portfolio
Place niche/variable programs on “pilot” status and establish metrics for either expansion or sunset. Shift select offerings to partner/contractor delivery (revenue share) to reduce staff overhead and risk.
D. Focus on Space Utilization
Focus on scheduling prime time first at Henderson Multigenerational Center and top centers; prioritize strong program areas and high-waitlist classes for premium rooms/hours. Use flexible spaces (such as studios, meeting rooms) for shorter, high-changeover classes to boost throughput.
E. Strengthen Program Funnel
Cross-promote from large events/strong programs for smaller programs; add introductory formats that convert interest to enrollments.
F. Manage for Transparency
Track per-class contribution margin (price, attendance, instructor cost, room hours) and publish a quarterly program scorecard to guide decisions. Align program KPIs to adopted cost recovery tiers and resident access goals.
Figure 2.50 - Heritage Park Senior Facility main entrance (COH, n.d.).
PART TWO
species selection of any natural turf; and the solar reflectance of pavements and the heat retention of site furnishings. Together, these 27 criteria create a comprehensive yet practical tool to evaluate how well each site supports thermal comfort, water stewardship, operational resilience, and equitable access under Henderson’s desert conditions.
2. SCORING & RANKING
Each park site was evaluated against the same set of 27 criteria to ensure consistency and comparability within Henderson’s existing system. Every criterion received a score between 1 (lowest) and 5 (highest).
Based on the 27 unique criteria, the minimum total score possible is 27 and the maximum is 135. Each site’s total score was calculated as the sum of its 27 criterion scores and then used to classify overall performance:
Not Currently Meeting Expectations:
Parks scoring 27–80 are “not currently meeting expectations,” indicating significant opportunity for improvement across most criteria.
Meeting Baseline Expectations:
Parks scoring 81–108 are “meeting baseline expectations,” reflecting evident consideration of resilience in the site’s design, program, and/or maintenance with room to grow.
Exceeding Expectations:
Parks scoring 109–135 are “exceeding expectations,” demonstrating the application of a broad range of resilience and green infrastructure best practices and generally functioning as intended.
After individual site scores were tabulated, the Project Team computed the average score for each criterion across the full cross section and ranked those averages. This step highlights system wide strengths and gaps—pinpointing, for example, whether shade, irrigation efficiency, or universal accessibility consistently outperform or underperform relative to other criteria. The resulting pattern recognition informs both site specific project recommendations and system level strategies and policies.
Note:
It is important to note that a low score does not, by itself, indicate poor maintenance or overall park condition. Rather, it signals that the site’s current design, program, and/or maintenance requirements leave it especially vulnerable to the negative effects of extreme heat and extreme drought. Interpreted in this way, the scoring framework serves as a decision support tool—helping the City prioritize targeted, high impact investments that improve thermal comfort, reduce water use, lower operational burden, and enhance health, safety, and accessibility for all park users.
Figure 2.51 - Members of the Project Team during a site resiliency audit at Mission Hills Park (2025).
EXISTING CONDITIONS
B. PARK SITE RESILIENCY EVALUATION CRITERIA
1. LANDSCAPE
A. Landscape Plantings
1 = There is a predominance of high-maintenance, non-native, irrigation intensive and/or drought sensitive plantings.
5 = Most or all plantings are drought-tolerant, native, and/or native-friendly species that together provide ecological/habitat value.
B. Trees
1 = Few to no trees present and/or most trees present provide limited shade value and/or require heavy irrigation.
5 = Trees are appropriately distributed throughout the site, are drought tolerant, and/or provide meaningful shade value.
C. Natural Turf – Recreational Value
1 = The existing natural turf spaces are primarily aesthetic and provide little to no meaningful recreational or programmatic value due to their size, location, and/or configuration.
5 = There are no natural turf spaces present or the existing turf spaces demonstrate meaningful recreational value.
D. Natural Turf – Drought Resistance
1 = There are underutilized cool-season grass turf spaces present that require heavy irrigation.
5 = There are no natural turf spaces present or the existing turf spaces are a drought resistant, warmseason turfgrass species (such as hybrid Bermuda).
E. Irrigation
1 = There is evidence of broad/indiscriminate rotary irrigation from a system which lacks water/moisture sensors, has observable leaks, and/or has limited programmability.
5 = No irrigation present, or irrigation is limited and targeted, primarily through driplines/soakers, and is automated by a smart controller.
2. MATERIALS & SURFACES
A. Pavements and Hardscapes
1 = All existing pavements/hardscapes have a low Solar Reflectance Index (SRI) value and/or high heat retention.
5 = Most pavements present have a high SRI value and/or low heat retention.
B. Site Furnishings
1 = All site furnishings present have finishes with a low SRI value and/or are constructed of materials with high heat retention.
5 = All site furnishings present have a high SRI value and are constructed of materials with low heat retention.
3. LIGHTING & UTILITIES
A. Stormwater Runoff
1 = There is limited to no stormwater infrastructure on-site to collect/divert run-off from large impervious surfaces (sheet-flow/infiltration).
5 = Stormwater from large impervious surfaces can be captured and redirected via drainage structures/ systems back to the reservoir.
B. Lighting
1 = Lighting is missing from appropriate amenities in the park.
5 = The park provides automated high-efficiency (or solar) lighting that facilitates nighttime use of appropriate amenities.
C. Renewable Energy
1= The park is entirely dependent on the traditional electrical grid and/or does not incorporate any solar power generation.
5 = Available opportunities to incorporate solar power generation are leveraged and/or solar-powered fixtures are used.
PART TWO
D. Appropriate Integration of Technology
1 = The park does not incorporate the use of modern technology (such as smart timers, WiFi, QR codes etc.).
5 = The park utilizes a variety of relevant, modern technologies to assist in automation, communication, and/or activation of the site.
4. COMFORT & ACTIVATION
A. Shaded Seating Areas
1 = None of the existing seating areas are shaded.
5 = There are multiple seating areas throughout the park that together provide shaded places to sit throughout the day.
B. Shaded Amenities
1 = All existing core amenities are fully exposed.
5 = All key existing amenities receive shade for the hottest parts of the day, allowing for comfortable use.
C. Cooling Amenities
1 = The park does not provide any features/amenities which allow visitors to quickly lower their body temperature (such as splash pads, pools, etc.).
5 = The park provides cooling features/amenities in appropriate quantities and locations for the size/ configuration of the park.
D. Programming Flexibility and Activation
1 = The design and configuration of the park space limits its programming flexibility and/or can only be activated by specific types of users d by limited a type(s) of users.
5 = The program and configuration of the park appeals to a wide array of different users and can accommodate a variety of different programs/ events.
5. ACCESSIBILITY
A. Ease of Walking TO the Park
1 = Walking to the park from nearby homes/ properties is difficult due to the condition and/or lack of sidewalks or crosswalks, the speed and size of adjacent roads, and lack of shade (via shade trees).
5 = The presence of well-maintained, ADA accessible, and appropriately sized/located pedestrian walkways that lead to multiple access points throughout the park make walking to the park safe, easy, and convenient for most users who live nearby.
B. Ease of Walking WITHIN the Park
1 = Walking within the park is unnecessarily difficult due to a lack of efficient, accessible, well-maintained, and comfortable pedestrian pathways between major park areas.
5 = An interconnected network of accessible, wellmaintained, and conveniently located pedestrian pathways makes walking between all major areas of the park safe, convenient, and comfortable for most users.
C. Multi-modal Capacity
1 = The park is only accessible via car, with no accommodations for pedestrians, bicycles, or public transit users despite feasible opportunities for such accommodations.
5 = The park is easily accessible by multiple modes of transportation, such as public transit (within a half-mile), bike lanes/paths, and safe sidewalks connecting to neighborhoods and attractions, and adequate vehicle parking.
D. Low-Emission Vehicles
1 = The park lacks the appropriate amenities/ infrastructure necessary to facilitate and/or encourage the use of low-emissions vehicles (such as LEVs or e-bikes).
5 = The park provides infrastructure, such as charging stations for both LEVs and e-bikes (as appropriate/ feasible), that encourages users to access the park site via low-emissions vehicles.
E. Universal Design & ADA Accessibility
1 = The park presents many barriers to ADA accessibility due to a lack of appropriate ramps, equitable distribution of facilities, level paving, etc. and does not appear to be easily/equitably usable by someone with special needs.
5 = The majority of the park shows evidence that its intent is to be accessible and would allow equitable use of people with a wide range of needs/abilities.
Clarity of Wayfinding
1 = The park provides minimal wayfinding signage (gateway and regulatory only).
5 = There is a comprehensive wayfinding system with clear, accessible, and well-maintained signs for entrances, maps, directions, and educational/ interpretative content.
6. HEALTH & SAFETY
A. Perception of Safety
1 = The physical environment may feel unsafe to many users due to the obstruction of natural surveillance (eyes on the park), extreme access control (high fences, single access point), incompatible adjacent land-uses, lack of or inappropriate lighting, lack of a sense of ownership/activation, and/or limited to no protection from the elements.
5 = The park evokes a feeling of safety and security resulting from consistent and distributed activity throughout the site, good visibility into and within the park, and consistent “eyes on the park” from adjacent properties, park employees, and other park users.
B. Physical Condition
1 = The physical condition of the park site and its amenities gives users the impression that it is uninviting, unsafe, outdated/irrelevant, abandoned, dilapidated, and/or poorly maintained.
5 = The park is perceived to be inviting, safe, exceptionally well maintained, and provides appropriate/relevant site features that contribute to the overall positive aesthetic of the park.
EXISTING CONDITIONS
C. Intensity of Maintenance
1 = The park contains an abundance of elements or features which require a high level of consistent maintenance/care by park staff, such as highly ornamental landscapes, complicated equipment/ systems, and/or large park sites with a large quantity of amenities and furnishings.
5 = The park includes native plantings, durable equipment/finishes/furnishings, and/or a limited number of site amenities that reduce the amount of regular maintenance required by park staff to keep operational.
D. Healthy Lifestyles
1 = The design/program of the park does not provide convenient and accessible opportunities for visitors of a variety of ages and abilities to engage in activities and/or programs which can improve their physical and mental health.
2 = The park includes multiple different opportunities/ amenities for visitors to improve their overall health and wellbeing, such as looping walking paths, outdoor fitness equipment, multi-use sports courts, healthy snack/food options, educational signage/ material, and/or regular fitness/wellness programs.
E. Access to Drinking Water
1 = The park does not provide visitors with access to potable drinking water.
5 = The park provides multiple opportunities for drinking water access via ADA accessible water fountains, water bottle fillers, and dog water bowls located adjacent to key program areas across the site.
F. Access to Emergency Information
1 = The park does not provide any emergency information or resources to visitors.
5 = The park provides multiple different types of emergency information resources to visitors that advise them on the risks, symptoms, and treatment/ response resources to common/relevant life-safety emergencies such as heat exposure, dehydration, substance-use/overdose, domestic violence and mental health crisis.
PART TWO
C. SUMMARY OF FINDINGS
Most parks evaluated by the Project Team meet minimum baseline expectations for heat and drought resilience, with especially strong performance in site furnishings, drinking water access, internal walkability and ADA, perception of safety, and program flexibility. These strengths indicate that user comfort, basic health & safety, and inclusive access are already integral to much of the system.
Across the 35 evaluated sites, total scores ranged from 115 to 47 (out of a possible 135), with a mean of 92.7 (≈69% of the maximum) and median of 96.0 (≈71%). Using the project’s classification thresholds, 1 park (≈3%) exceeds expectations, 29 parks (≈83%) are meeting baseline expectations, and 5 parks (≈14%) are not currently meeting expectations. In short, baseline resiliency features are present system-wide, but few sites yet achieve the highest tier—and several show clear, targeted opportunities to improve drought and heat resilience.
Viewed by category (1–5 scale), performance ranks as follows: Materials & Surfaces (3.93); Comfort & Activation (3.72); Landscape (3.50); Health & Safety (3.43); Accessibility (3.33); Lighting & Utilities (3.03). Categories most strongly associated with higher overall site scores are Health & Safety, Lighting & Utilities, and Accessibility—investments in these areas tend to move the total score the most. Conversely, Materials & Surfaces, while the highest-scoring category, contributes fewer points overall and shows less influence on total scores.
The clearest, consistent opportunities system wide are (a) renewable energy deployment (very low across the system), (b) shade and cool-surface expansion at key amenities, (c) irrigation modernization and continued conversion to drought-tolerant planting/ turf, (d) emergency information standardization across parks, and (e) low- emission vehicle support where feasible. Because Health & Safety, Lighting & Utilities, and Accessibility are most correlated with the overall site score, prioritizing improvements in these categories will typically yield the greatest return on system resiliency and user outcomes.
Following are summaries of the findings from each evaluation category.
1. LANDSCAPE
Landscape performance is slightly above baseline overall, with notable strengths in turf’s recreational value (4.06/5) and tree canopy presence/distribution (3.89/5). Plant palette scores are positive (3.66/5), and turf drought tolerance is moderate to strong (3.74/5), indicating conversion to warm season turf is common but not yet universal.
The most consistent opportunities are irrigation efficiency and control (2.91/5) and heat retaining conditions (2.71/5)—i.e., locations where limited shade and/or darker surface treatments elevate radiant heat around landscape areas. This category also shows the greatest variability across parks, reflecting differences in planting strategy, age of improvements, and irrigation system modernization.
2. MATERIALS & SURFACES
This is the highest-performing category system-wide. Site furnishings (4.74/5) are widely specified in finishes/materials that reduce heat retention, and pavements & hardscapes (3.11/5) are trending toward cooler surfaces but remain inconsistent.
The implication is clear: while many parks already leverage high-SRI furnishings, expanding cool-pavement strategies and pairing them with shade would further reduce surface temperatures at the pedestrian scale.
3. LIGHTING & UTILITIES
Lighting & Utilities is the lowest-scoring category. Site lighting (3.89/5) and stormwater runoff management (3.71/5) are generally solid, but renewable energy adoption (1.11/5) is rare and integration of relevant technology (3.40/5) is mixed. This suggests high-impact opportunities in solar shade canopies, solar or high- efficiency lighting retrofits, and broader use of smart systems (controllers, sensors, communications) to reduce energy/water use and improve heat-season operations.
EXISTING CONDITIONS
4. COMFORT & ACTIVATION
Parks perform above baseline for comfort and program flexibility. Programming flexibility & activation (3.94/5) is a system strength; however shaded seating (3.69/5) and shade at core amenities (3.54/5) are moderate rather than strong.
As extreme -heat days increase, expanding shade (natural and built) at seating, play, courts, and gathering spaces remains one of the most direct ways to improve daytime usability and reduce heat stress risk.
5. ACCESSIBILITY
The system performs well on internal circulation (4.20/5) and universal design/ADA (4.20/5), and walking to parks is generally feasible (3.80/5). The most significant shortfall is support for low- emission vehicles (1.00/5)—e.g., EV/e -bike charging and related amenities—followed by wayfinding & signage (3.26/5) and multimodal capacity (3.54/5).
The data point to incremental, system-wide upgrades: unified wayfinding, stronger first/last-mile connections, and strategic EV/e -bike infrastructure at appropriate sites.
6. HEALTH & SAFETY
User perception of safety (4.51/5) and access to drinking water (4.17/5) are strengths, and overall physical condition (3.94/5) is good. Two notable gaps emerge: intensity of maintenance (2.77/5)— i.e., features that drive high, heat-season labor demand—and access to emergency information/ resources (1.31/5) (e.g., guidance on heat illness, hydration, overdose response, mental-health crisis).
Transitioning toward more durable/low-maintenance materials and native plantings and standardizing emergency information would reduce operational burden and improve heat-season safety.
Following are individual park site evaluation summaries organized by typology and total score.
D. POCKET PARKS
5 sites – 18.4 acres
The five pocket parks average 89.8 points (range 79–103 out of 135), landing just below the system wide mean (~92.7). Their best performers rival mid to high scoring neighborhood parks, but the typology’s small footprints and simpler utility infrastructure typically limit opportunities to pick up points in areas like renewable energy, shade at multiple amenities, and technology—factors that help larger parks separate.
In short, pockets cluster with community parks (avg. 89.5) and generally sit a notch below neighborhood (93.9) and regional (95.9) parks on average under the same 27 criterion framework.
1. Pumpkin Park
Address: 405 Drake St. Park Type: Pocket Park
Completed: 2023
Score: 103
Size: 2.0 acres
Strengths:
+ The community garden is notably attractive and is situated next to a vacant lot that is designated for future park expansion to be constructed by the end of 2027.
+ The park features a high level of finish and wellchosen furnishings.
+ It includes a teaching and demonstration kitchen with amphitheater-style seating terraces which are all accessible for individuals with disabilities.
Figure 2.52 - Pumpkin Park (2025).
PART TWO
Figure 2.53 - Park site resiliency assessment scoring matrix.
Figure 2.54 - Park site resiliency assessment scoring matrix cont’d.
PART TWO
+ The area is exceptionally clean and wellmaintained, and it is enclosed by ornamental fencing.
+ LED lighting has been installed throughout the park, and drip-line irrigation is used for watering.
+ There is ADA-compliant parking with a curbless lot, and the lot drains to the street via a dedicated channel that diverts water into the storm sewer system.
+ Ar tistic custom bike racks are available for cyclists.
+ Some signage in the park utilizes QR codes, and there are interpretative and educational signs as well.
+ The park also features public art components and is located adjacent to a Boys and Girls Club center.
Challenges:
+ The site’s special-use (community garden) limits its flexibility.
+ The garden areas are highly exposed, which is typical for their intended use.
+ The seating area outside the teaching kitchen lacks shade and consists of a unit block concrete wall, offering no protection from the sun.
+ There are few shaded seating or rest areas within the garden spaces.
+ Additionally, it is difficult to distinguish between walking surfaces and landscape bed areas because both use similar sizes and colors of decomposed granite with only slim edging. Some crosswalks are either missing or not clearly marked.
2. SOLISTA PARK
Address: 1890 Via Firenze Rd.
Park Type: Pocket Park
Completed: 2008
Score: 96
Size: 3.6 acres
Strengths:
+ The park features a high level of finish, creating a distinct feeling of quality throughout the area.
+ Shaded seating areas are distributed across the site, offering comfortable spots for relaxation.
+ There is a food and beverage vendor conveniently located on-site, while security cameras help ensure visitor safety.
+ Numerous bike racks are available to accommodate cyclists.
+ A farmers market is regularly hosted on the premises, bringing the community together.
+ The park contains many trees, although a significant portion are still relatively small.
+ The playground area is both shaded and ADA accessible, enhancing its inclusivity.
+ Bocce courts are also provided, complete with shade for users’ comfort.
+ Additionally, the site showcases multiple different types of hardscapes, adding to its visual and functional diversity.
Challenges:
+ The site requires intensive maintenance and irrigation.
+ Fescue turf is present in the multi-purpose lawn areas.
+ The hardscapes have lower SRI values.
Figure 2.55 - Pumpkin Park outdoor demonstration kitchen (2025).
EXISTING CONDITIONS
3. SIENA HEIGHTS TRAILHEAD
Address: 2570 Siena Heights Dr.
Park Type: Pocket Park
Completed: 2011
Score: 89
Size: 4.7 acres
Strengths:
+ The park is connected to the regional trail network. It provides users with important safety information.
+ There is good connectivity to adjacent residential and commercial areas.
+ The park features effective LED lighting and shaded seating areas throughout.
+ ADA access is excellent, including an accessible playground.
+ Signage and wayfinding are clear and helpful, with monument signage and a trail map kiosk available.
+ The turf areas are heavily used for recreational play and practice space.
Challenges:
+ Crosswalks are missing at the park entrances.
+ Most of the turf areas are currently fescue, but they are scheduled to be replaced with droughtresistant hybrid Bermuda grass.
+ A portion of the trail dead-ends at the edge of the highway shoulder; this area should be removed if it does not serve a specific purpose.
+ The western portions of the park feel isolated, and there is limited visibility into these areas.
4. TRAIL CANYON PARK
Address: 1065 Trail Canyon Rd.
Park Type: Pocket Park
Completed: 2000
Score: 82
Size: 3.9 acres
Strengths:
+ The park is located adjacent to an elementary school, but it is separated from the school by a wall and fence.
+ There are nice, mature shade trees throughout the area.
+ Lawn games, such as corn hole, are available in some of the turf replacement sections.
+ The site features a large, flexible central turf panel, which was part of a recent turf replacement project.
+ Decomposed granite areas are clearly defined by curbs, and a bounce-house pad is provided for parties and rentals.
Challenges:
+ The dark rubber mulch used as playground surfacing tends to retain heat.
+ The xeric areas primarily consist of decomposed granite and lack larger boulders or cobbles.
+ The playground equipment and furnishings appear somewhat outdated, and water access is restricted to the center of the site near the restroom building.
+ Additionally, turf is encroaching into some of the newer decomposed granite areas.
Figure 2.56 - Trail Canyon Park (2025).
PART TWO
5. PUCCINI PARK
Address: 1899 Seven Hills Dr.
Park Type: Pocket Park
Completed: 1998
Score: 79
Size: 4.2 acres
Strengths:
+ The park offers good overall ADA accessibility, with strong connectivity and visibility from adjacent properties.
+ It features many large shade trees throughout the site, and the tennis courts are equipped with lighting and shaded seating areas for visitors.
Challenges:
+ Some landscape beds and naturalized areas receive excessive drip irrigation, while certain sections contain fescue turf that serves little functional purpose.
+ There are no crosswalks at the park entry, and all drainage flows directly into an unlined wash.
+ Litter was observed in some areas, and signage and wayfinding are minimal throughout the park.
+ Lighting is limited, and there is no shade structure over the playground area, though some passive shade is provided by shade trees.
+ Additionally, rotor irrigation is used for lawn areas that offer minimal recreational or programmatic value.
E. Neighborhood Parks
15 sites – 102.2 acres
With the largest sample (15 sites), neighborhood parks average 93.9 points (range 70–107), placing them above the system mean (~92.7) and second only to regional parks on average. They also span the full performance spectrum—from several top -tier scores over 100 to a few sites in the “not currently meeting expectations” band—reflecting how differences in shade coverage, irrigation efficiency, and multi-modal access drive spread within this typology. Relative to pockets and community parks, neighborhoods more consistently accumulate points in accessibility, activation, and comfort; relative to regional parks, they score slightly lower on system-level utilities and safety/amenity breadth that large parks can provide.
1. DUNDEE JONES PARK
Address: 10550 Jeffreys St
Park Type: Neighborhood Park
Completed: 2023
Score: 107
Size: 6.0 acres
Strengths:
+ The restroom building features a public art mural, serving as a strong example for similar enhancements in other parks.
+ Stormwater is effectively collected and diverted into a dedicated storm drainage system.
+ Shaded seating areas are available within the offleash dog zones, providing comfort for visitors and their pets.
+ The park is well-designed and constructed, with thoughtful storytelling elements integrated into both its overall design and specific details, particularly highlighting its identity as a memorial park with a water and fishing theme.
+ There is excellent connectivity and visibility between the park and its surrounding areas, including nearby residential neighborhoods.
+ Accessibility is prioritized throughout the park, offering good ADA-compliant pathways and features. Interpretative and cultural elements are thoughtfully incorporated into the park’s layout.
+ The off-leash dog area stands out for its inclusion of naturalized spaces with varied landforms.
+ A new ADA-accessible playground features adaptive and sensory play elements, ensuring inclusivity for children of all abilities.
+ Water access is conveniently provided throughout the site, and outdoor fitness equipment is available for park users.
+ Additionally, a splash pad offers opportunities for play and cooling off during warmer weather.
Challenges:
+ Some crosswalks, including those at the park entrance, are missing.
+ The outdoor fitness elements lack shading.
+ Additionally, the adjacent roadways experience high speeds and heavy traffic volumes.
2. UNION VILLAGE PARK
Address: 1060 Wellness Place
Park Type: Neighborhood Park
Completed: 2022
Score: 106
Size: 5.9 acres
Strengths:
+ On-street parking is available, providing convenient access for visitors.
+ While there are some connections to adjacent residential areas, others are missing, highlighting opportunities for improved pedestrian connectivity.
+ The park features large turf spaces with drought-tolerant Bermuda grass, supporting sustainability goals.
+ Its proximity to multi-family residential developments results in a high density of users and creates potential for impactful programs, health initiatives, and community engagement.
+ Naturalized areas within the park incorporate diverse landforms, topography, and various sizes of cobbles and boulders, enhancing visual interest and ecological value.
+ Most pavements have a high SRI value, contributing to reduced heat absorption.
+ Crosswalks are present at most park access points and at trail, path, or sidewalk crossings, supporting safe and accessible movement throughout the site.
+ Good ADA access is provided across the park, ensuring inclusivity for all visitors.
+ Stormwater runoff is managed through a drainage system that collects and redirects water efficiently.
EXISTING CONDITIONS
+ The potential to partner with the adjacent hospital to incorporate health and fitness programs, amenities, and information within the park should be explored. Additional opportunities include the installation of shaded outdoor fitness elements, the inclusion of public art, and the development of sponsored programming to further enhance the park’s offerings and community impact.
Challenges:
+ While multiple pedestrian connections to adjacent residential developments exist, several logical links are currently missing.
+ The park contains large turf areas that require irrigation to maintain their condition and the sloping grade of the multi-purpose turf panel restricts its programmability and overall usability to amphitheater-style activities.
+ The central activity area is mostly exposed and lacks adequate shade; although shade trees have been planted, they are still too young and small to provide meaningful relief at this time.
+ Shade is very limited in the off-leash dog areas, as both sections share half of a single, small shade structure.
+ There is only one bike rack provided for visitors.
+ The east side of the park has no water access, but this area experiences the least activity.
+ Park entry signs are missing at the edges, corners, and pedestrian entrances, which may impact way-finding.
+ Lastly, there is no designated parking for city maintenance vehicles, and the site provides insufficient maintenance storage space.
Figure 2.57 - Union Village Park (2025).
PART TWO
3. BLOOMING CACTUS PARK
Address: 410 Grand Cadence Drive
Park Type: Neighborhood Park
Completed: 2025
Score: 105
Size: 7.0 acres
Strengths:
+ The park is brand new and in excellent condition.
+ There is a good mix of high-SRI pavements and hardscapes throughout the site.
+ The “Ninja Warrior” adventure course is designed to appeal to a wide audience, including teenagers.
+ Stormwater from the parking lot is efficiently captured and diverted to the stormwater system via the street gutters.
+ The park also provides excellent ADA accessibility.
Challenges:
+ The central turf panel feels somewhat exposed because there are no mature shade trees or adjacent structures.
+ The xeric areas consist primarily of flat planes of decomposed granite; incorporating additional topographic elements, boulders, or plant material in these areas would enhance the aesthetic appeal.
+ It is difficult to contain the decomposed granite along the edges of the concrete walkways, as there is a lack of edging cobbles.
+ The presence of immature trees currently limits the amount of natural shade
4. WHITNEY MESA NEIGHBORHOOD PARK
Address: 1550 W Galleria Dr.
Park Type: Neighborhood Park
Completed: 2013
Score: 101
Size: 9.5 acres (approx.)
Strengths:
+ The park features a historic and cultural theme centered on the Spanish Trail, with on-site markers and interpretive elements, as well as a themed playground.
+ Overall, the park offers good ADA accessibility, and turf replacement has been completed to enhance the landscape.
+ The park is adjacent to Whitney Channel, a drainage channel where stormwater can be diverted and captured for return to the reservoir.
+ There is effective pedestrian LED lighting and shaded seating areas throughout the park.
+ Additionally, the park is located next to residential land uses and provides clear signage and wayfinding for visitors.
Challenges:
+ Pedestrian access to the surrounding neighborhoods could be improved, as current connections may not be sufficient for easy movement between the park and nearby areas.
+ Most on-site drainage relies solely on infiltration, which means only large rainfall events are likely to result in runoff reaching the basin or reservoir.
Figure 2.58 - Blooming Cactus Park (2025).
EXISTING CONDITIONS
5. PARADISE POINTE PARK
Address: 15 Archer Glen Ave.
Park Type: Neighborhood Park
Completed: 2015
Score: 100
Size: 5.7 acres
Strengths:
+ The park demonstrates effective use of xeriscaping and features a variety of amenities that support a range of uses.
+ The topography and elevation changes create appealing views throughout the park.
+ While turf areas are limited, the existing spaces offer recreational value and are planted with Bermuda grass.
+ The park serves as a venue for interpretive art and display, including a prominent mural.
+ Visitors benefit from a mix of walking path types and materials, and key amenities are both shaded and accessible.
+ Surrounded by residential properties, the park also provides a popular skate spot and teen hangout area with basketball and skating components.
Challenges:
+ Some of the trail areas may present accessibility challenges for users who are not able-bodied.
+ Planes of decomposed granite have been used extensively in the areas surrounding the playground and restroom building, rather than incorporating a variety of aggregate sizes.
+ Additionally, the upper flexible lawn is somewhat disconnected from the lower half of the park due to differences in topography and elevation.
6. POTENZA PARK
Address: 2355 Via Firenze
Park Type: Neighborhood Park
Completed: 2014
Score: 100
Size: 5.0 acres
Strengths:
+ The park features beautifully naturalized xeriscape areas, which serve as an excellent example of the desired standard for both aesthetics and design in native revegetation and xeric landscaping.
+ The playground areas provide shade, are ADA accessible, and incorporate multi-sensory play elements for inclusive enjoyment.
+ Security cameras are installed throughout the site to enhance safety, and LED pedestrian lighting is strategically placed in key areas to ensure visibility during evening hours.
+ Multiple shaded seating areas are distributed throughout the park, offering comfortable places to rest, while several water access points are conveniently located across the site.
+ Additionally, shaded seating and rest areas are available at the skate park, ensuring comfort for visitors in all activity zones.
Challenges:
+ There is a lack of dog water bowls at the water fountains.
+ There are some fescue and/or non-functional turf areas.
+ Shade is limited near the sports courts.
Figure 2.59 - Potenza Park (2025).
PART TWO
7. ATTESA PARK
Address: 2445 Via Centro
Park Type: Neighborhood Park
Completed: 2021
Score: 99
Size: 5.3 acres
Strengths:
+ The park is newly constructed and remains in excellent condition.
+ Off-leash dog areas are well-equipped, featuring both shade structures and water access.
+ Dedicated recycling bins are available throughout the site, supporting sustainable practices.
+ Along the perimeter, decomposed granite areas incorporate a variety of aggregate sizes, including cobbles and boulders, which enhances the landscape’s visual appeal.
+ The park also showcases a native-friendly landscape with many newly planted trees. LED lighting has been installed to improve visibility and energy efficiency.
+ The park is situated adjacent to a large wash and offers good sidewalk connectivity to nearby neighborhoods.
Challenges:
+ The playground surfacing has a low SRI, which may lead to increased heat absorption.
+ Since all trees are newly planted, there is currently limited shade available from tree cover.
+ The internal decomposed granite areas lack significant variation in aggregate size.
+ The basketball courts feature a dark blue surface that, while visually appealing, tends to retain heat and may become uncomfortable during warmer weather.
+ The turf across the park is not in optimal condition and appears to be in the process of establishing itself.
+ Supplemental waste bins consist of 55-gallon steel drums, which may not be as aesthetically pleasing or functional as standard bins.
+ Most park benches are situated in locations without shade, and there is no shade structure provided near the basketball courts.
8. CACTUS WREN PARK
Address: 2900 Ivanpah Dr.
Park Type: Neighborhood Park
Completed: 2006
Score: 96
Size: 7.0 acres
Strengths:
+ The park features good LED lighting and wellmaintained sidewalks, contributing to a safe and accessible environment.
+ Numerous shaded areas and amenities are available, enhancing comfort for visitors.
+ The park offers excellent overall ADA accessibility, ensuring that individuals with disabilities can easily navigate the space.
+ The park’s location adjacent to residential areas provides convenient access for local residents, and there is strong trail connectivity, including a large pedestrian bridge across the highway that links to another park, commercial area, and a regional trail.
+ Connectivity into neighboring residential areas is also well established.
+ The turf fields have been converted to Bermuda grass, and there is good access to drinking water throughout the site.
Challenges:
+ While some areas of turf are non-functional, the majority remain usable.
+ The off-leash dog areas lack shaded seating, and most of the park furnishings appear outdated.
+ Drainage throughout the site relies solely on infiltration.
+ Signage and wayfinding are minimal, with no trail signage, maps, or kiosks present.
+ Spectator seating areas are also not shaded, potentially reducing comfort for visitors.
+ The park feels somewhat secluded due to its proximity to the highway, the high walls of the pedestrian bridge, and the walled residential lots nearby. Additionally, the trail between the park and the pedestrian bridge feels very confined because of an existing, unnecessary fence; removing this fence and expanding the park space up to the trail could help alleviate this issue.
+ The security fence surrounding the skate park is visually aggressive and may detract from the park’s welcoming atmosphere. Consider incorporating a mural into the skate park.
+ Additional on-street parking could be provided.
+ Consider removing the “love” padlocks from pedestrian bridge fencing before it becomes a trend that could result in structural damage to the fence and/or bridge.
9. PASEO VISTA PARK
Address: 2505 Paseo Verde Pkwy. Park Type: Neighborhood Park
Completed: 2007
Score: 94
Size: 7.7 acres
Strengths:
+ Paseo Vista Park is very highly used and wellactivated, offering a large splash pad that provides both play and cooling value.
+ Storm drain inlets are present throughout the park, and several large shade structures have been installed to enhance comfort for visitors.
+ The main turf areas have been converted to Bermuda grass, while the play area features good ADA access and includes adaptive play elements for inclusivity.
+ The park is equipped with good LED lighting and offers fitness equipment.
+ Overall connectivity within the park is strong, and the dog park is lighted and provides access to water for pets.
Challenges:
+ The park is bordered by high-speed and high-volume roadways, which may impact accessibility and safety.
+ Many empty landscape beds throughout the park currently lack purpose or function.
+ Additionally, the fitness equipment is not shaded, which limits its use and value during the summer months.
+ There is also insufficient shade around the splash pad area, and the park offers limited bicycle facilities.
EXISTING CONDITIONS
10. VIVALDI PARK
Address: 1249 Seven Hills Dr. Park Type: Neighborhood Park Completed: 1999
Score: 93
Size: 6.9 acres
Strengths:
+ There are many options for shade throughout the park; however, neither ball field players nor spectators have access to shaded areas.
+ The park is adjacent to residential neighborhoods, and most of the large turf areas have been converted to Bermuda grass.
+ This location offers good regional connectivity through a multi-purpose trail network, and major amenity areas are well illuminated with LED lighting.
Challenges:
+ The park features numerous irrigated ornamental shrubs, and although most turf areas have been converted, some fescue turf remains.
+ The trail tunnel is uncomfortably dark, even during the daytime; while lights are installed, they were not turned on during the visit.
+ Situated at a lower elevation than the road and surrounding properties, the park offers limited wayfinding, as there is no trail map or kiosk available.
+ Additionally, the park monument sign currently gives the impression that the park is part of the surrounding homeowners association and should be clearly branded as a public Henderson Parks and Recreation Department facility.
Figure 2.60 - Vivaldi Park (2025).
PART TWO
11. PASEO VERDE PARK
Address: 1851 Paseo Verde Parkway
Park Type: Neighborhood Park
Completed: 1997
Score: 89
Size: 8.0 acres
Strengths:
+ The park features multi-sensory and adaptive play areas, along with shaded spaces for both play and spectator seating.
+ Multiple water fountains are available throughout the park, while good connectivity exists with neighboring properties.
+ Although parking drains to the street, stormwater is effectively managed by street storm drains, and on-demand LED lighting enhances park safety and visibility.
Challenges:
+ There is a significant amount of non-functional turf throughout the park, including along its edges, and some areas are unnecessarily irrigated despite the absence of plant material.
+ Most existing shrubs appear to require frequent irrigation.
+ Several crosswalks are missing, and wayfinding signage is limited.
+ There are limited bicycle facilities – such as bicycle racks - present.
12. DISCOVERY PARK
Address: 2011 Paseo Verde Pkwy.
Park Type: Neighborhood Park
Completed: 1996
Score: 85
Size: 7.8 acres
Strengths:
+ The playground benefits from large shade trees, while good sidewalk and path connectivity make it easy to move throughout the park’s interior.
+ Most areas are illuminated, supporting evening use, and the expansive multi-use lawn provides flexibility for a variety of activities.
Challenges:
+ Several crosswalks leading into the park are missing, making pedestrian accessibility more challenging.
+ The park contains high-maintenance plant material, with most understory plantings being irrigated and many consisting of ornamental, non-native species.
+ Much of the park’s furnishings and equipment are older, including the lighting, which is assumed to be non-LED. Non-functional turf is present along the park edges, and shade is limited beyond the existing trees.
+ There are few ADA seating areas and limited accessible routes to the playground. Additionally, a park visitor reported that the volleyball sand is of non-playable quality.
Figure 2.61 - Discovery Park (2025).
13. PASEO VERDE TRAILHEAD
Address: 804 Paseo Verde Pkwy.
Park Type: Neighborhood Park
Completed: 2011
Score: 83
Size: 5.5 acres
Strengths:
+ Visitors can access the site by vehicle, through bike lanes, and via the multi-use trail, which offers good overall connectivity to adjacent neighborhoods and is conveniently located near public transit.
+ While a trail map kiosk is provided, it is not positioned near the parking area.
+ The site features turf spaces that have been converted to drought-tolerant Bermuda grass, and the play area offers both shade and shaded seating options for comfort.
+ The site’s drainage flows into a nearby channel where water can be captured and diverted.
+ Additionally, effective LED lighting is installed throughout the area
Challenges:
+ There are limited activities available at the trailhead, with options mostly restricted to playing bocce ball, using the playground, or enjoying the sloping open lawn areas.
+ The site is bordered by adjacent roadways that experience high-speed and high-volume traffic, and the playground itself is situated close to one of these roads, although it is presumably out of the utility easement.
+ Despite serving as a trailhead, the site offers few bicycle amenities for visitors.
+ Much of the trailhead lies beneath overhead power lines, which prevents the installation of shade structures or large trees, leaving some turf areas non-functional.
+ Additionally, crosswalks connecting different sections of the site are missing, and the site is divided by several streets without any midblock crosswalks to facilitate safer pedestrian movement.
EXISTING CONDITIONS
14. DOS ESCUELAS PARK
Address: 1 Golden View Dr.
Park Type: Neighborhood Park
Completed: 2001
Score: 80
Size: 9.1 acres
Strengths:
+ The park is located immediately adjacent to two elementary schools, enhancing accessibility for students and families in the area.
+ The turf fields utilize drought-tolerant Bermuda grass, contributing to water conservation efforts.
+ Additionally, stormwater from the park drains to a channel situated to the north, where it can be collected and redirected for efficient water management.
Challenges:
+ There is no ADA-accessible parking available on the east side of the park. Additionally, there is no accessible route for individuals with disabilities from the east to west sides of the park, largely due to the condition of the existing sidewalk.
+ Overall playground accessibility is somewhat poor for individuals with disabilities due to outdated equipment.
+ Connectivity into the site is limited to primarily the eastern and western edges because the park is bordered by a highway to the north and secured school sites to the south; however, there is a pedestrian access point from the school sites into the park, and a new pedestrian bridge that allows entry from the trail along highway 215.
+ Some areas of turf are non-functional.
+ ADA seating is insufficient throughout the park, including around the ball diamonds. The park is difficult to find as it is hidden behind a school site, lacks signage on the main road, and offers limited visibility from both the north and south.
PART TWO
15. DOWNTOWN PARK
Address: 105 W. Basic Rd.
Park Type: Neighborhood Park
Completed: 1975
Score: 70
Size: 5.8 acres
Strengths:
+ The park is centrally located in an older section of the city and sits directly next to the Downtown Recreation Center, which also serves as the main office for HRPD.
+ It features an outdoor aquatics area and is shaded by established trees.
+ Additionally, the park is adjacent to an existing multi-use trail and is conveniently close to both downtown Henderson and the Water Street Plaza.
+ There is also room to expand the park to the east, plans for which currently exist.
Challenges:
+ Many of the park amenities are outdated and require significant upgrades.
+ The aquatics area was closed for repairs at the time of analysis, indicating a pressing need for maintenance.
+ Shade is limited above the play area, and there are several turf spaces that are non-functional.
+ The rear of the park is secluded and feels enclosed, which creates a perception of an unsafe environment; this lack of access and visibility exacerbates issues related to unhoused individuals and other problematic behaviors.
+ Additionally, functioning bubbler irrigation was observed being used around dead or missing plant material, resulting in wasted water.
F. COMMUNITY PARKS
9 sites – 161.6 acres
The eight community parks average 89.5 points (range 75–102), tracking closely with pocket parks and below the system mean (~92.7). While many community sites show strong activation and internal walkability, scores tend to lag neighborhood and regional parks where extensive shade coverage, renewable energy, or diversified utilities/technology are less prevalent. The result is a mid-pack profile: capable of high scores (several surpass 100) but, as a group, trailing neighborhood and regional parks on the criteria that reward comprehensive resiliency retrofits.
1. AVENTURA PARK
Address: 2525 Via Firenze Park Type: Community Park Completed: 2015
Score: 102 Size: 20.9 acres
Strengths:
+ Xeric areas are well-executed and visually appealing, offering both beauty and sustainability.
+ The field turf consists of drought-tolerant Bermuda grass, reducing water consumption while maintaining playability.
+ Adjacent streets are characterized by low traffic volumes and slow speeds, with dedicated bike lanes enhancing safety and accessibility for cyclists.
+ Drinking water stations are strategically located throughout the park, providing convenient access at all key areas for visitors.
+ The dog park offers shaded spots, mature trees, sufficient lighting, and water access, ensuring comfort and safety for both pets and their owners.
+ The splash pad delivers interactive play opportunities and effective cooling, contributing to both direct relief and improved ambient temperatures for park users.
+ The restroom building features outdoor showers, which can serve as an important resource for emergency cooling in hot weather conditions.
Figure 2.62 - Downtown Park (2025).
EXISTING CONDITIONS
+ The playground is designed to be fully ADA accessible and is equipped with shade structures, promoting inclusivity and comfort for all children and caregivers.
+ The park is surrounded by residential neighborhoods, fostering a strong community connection and encouraging regular use by adjacent residents.
Challenges:
+ Crosswalks are absent at several pedestrian access points and sidewalk crossings, and there are also missing crosswalks in the parking lot, which creates gaps between walkways along the street and those leading into the park.
+ The sports field and area lighting does not appear to utilize LED technology, and there are no shaded spectator seating areas at the sports fields.
+ Despite featuring Bermuda grass, the prevalence of turf spaces requires frequent irrigation due to their high usage, resulting in a high level of maintenance intensity for the site.
+ Additionally, there is no shade structure or shelter available near the tennis courts.
2. CAPRIOLA PARK
Address: 2155 Via Firenze Park Type: Community Park
Completed: 2014
Score: 102
Size: 13.7 acres
Strengths:
+ The park features good neighborhood connectivity and provides shade structures as well as shade trees within the off-leash dog areas.
+ There is excellent visibility and access into the site from adjacent properties.
+ Stormwater drains and structures are present, enabling efficient collection and redirection of runoff.
+ All major park elements are equipped with LED pedestrian lighting.
+ Crosswalks are available both into the park and between its parcels, enhancing accessibility.
+ The splash pad offers ambient cooling and adds play value, while an outdoor shower supplies an emergency cooling option.
+ The turf fields are composed of Bermuda grass.
+ The park is near the West Henderson Police Substation and the Debra March Center of Excellence but separated by a channeled waterway.
+ There is an elementary school immediately adjacent to the park on its southwestern corner.
Challenges:
+ The park contains numerous turf fields, which require a high level of maintenance as well as substantial irrigation and water usage.
+ Additional shaded seating should be installed around the play areas to improve comfort for visitors.
+ The lighting for the sports fields does not appear to utilize LED technology.
+ The linear design of the park means that visitors must cross multiple roadways to access its entirety.
Figure 2.63 - Aventura Park (2025).
PART TWO
3. HIDDEN FALLS PARK
Address: 281 W. Horizon Dr. Park Type: Community Park
Completed: 2012
Score: 98
Size: 18.0 acres
Strengths:
+ The park features native revegetation areas that display an attractive aesthetic, achieved through effective xeriscaping and the use of variable aggregate sizes.
+ The landscaping embraces a desert-friendly planting palette, contributing to both beauty and environmental sustainability.
+ Stormwater runoff is managed by a combination of swales and culverts, which collect and divert water back to the Lake Mead, supporting responsible water management practices.
+ Serving as a trailhead for the Amargosa Trail, the site offers a variety of trail amenities and dedicated, lighted parking for visitors.
+ Established shade trees and several shelters provide comfortable shade, while a splash pad
offers opportunities for both cooling off and play.
+ Additionally, the developed section of the park includes a range of amenities, such as off-leash dog areas and basketball courts, enhancing its appeal for pet owners and families alike.
Challenges:
+ The skate park and basketball courts are separated from other developed park amenities due construction of Fire Department Station 85, creating a sense of disconnection within the recreational facilities.
+ Although approximately half of the play structures are protected by shade structures, the remaining ones are exposed and would likely be unusable during the hottest parts of summer days.
+ Furthermore, the park’s location contributes to a feeling of isolation, particularly noticeable in the trailhead area at the end of a dead-end street, where further road construction is constrained by natural landform.
Figure 2.64 - Hidden Falls Park (2025).
EXISTING CONDITIONS
4. MADEIRA CANYON PARK
Address: 2390 Democracy Dr.
Park Type: Community Park
Completed: 2009
Score: 95
Size: 19.6 acres
Strengths:
+ Stormwater is directed to the drainage system, with drain structures present in the parking lot to collect water.
+ The field turf consists of Bermuda grass.
+ Key park elements are well-lit, and there is good visibility into the park site from adjacent properties and edges.
+ Most of the hardscapes feature high SRI values.
+ The naturalized xeric areas are enhanced with larger rocks and boulders.
+ The splash pad offers both cooling and play value.
+ The playground features adaptive swings, good ADA accessibility, shade, and lighting for comfort and safety.
+ Multiple shaded seating areas are distributed throughout the site, including spectator seating areas by the ballfields, and the park is located immediately adjacent to an elementary school.
Challenges:
+ Significant changes in elevation across the site can make navigation challenging for some users, even though ADA-compliant routes and ramps are available.
+ There are multiple large sports field lighting fixtures, most of which do not appear to be LED.
+ The park features numerous turf athletic fields, most of which appear to be Bermuda grass.
+ Due to the site’s program, these areas require substantial maintenance and water.
+ Additionally, there is no pedestrian entry signage and various pedestrian entry points.
5. MORRELL PARK
Address: 500 Harris St.
Park Type: Community Park
Completed: 1975
Score: 90
Size: 23.8 acres
Strengths:
+ The park features many mature shade trees, which when combined with the existing shade structures, provide a good amount of overall shade throughout the area.
+ There is ample parking available for visitors.
+ The site offers a wide variety of amenities, including a shaded playground and seating areas.
+ An open, flexible-use lawn with drought-tolerant hybrid Bermuda grass adds recreational value.
+ The park’s flexible multi-use fields can accommodate both baseball and soccer activities.
+ Its location is convenient, as it is adjacent to an elementary school, the Valley View Recreation Center, and a church, with multi-family housing and apartments situated across the street.
+ Additionally, the park benefits from good access to transit and strong overall multi-modal connectivity.
Challenges:
+ The play structures in the park show signs of age.
+ While there is a large turf area that offers recreational opportunities, it still requires significant irrigation to maintain.
+ Connectivity within the park is hindered because there is no looping path; instead, the area is segmented and bisected by parking lots and the recreation facility.
+ Additionally, the skate park’s fencing is designed on a scale that feels imposing and resembles “prison fencing.”
PART TWO
6. MISSION HILLS PARK
Address: 551 E. Mission Dr. Park Type: Community Park
Completed: 2003
Score: 85
Size: 22.2 acres
Strengths:
+ The park is large and offers numerous program areas.
+ It features mature shade trees and is conveniently located next to an elementary school.
+ There is a spacious splash pad for cooling off, along with a large shade structure that covers the playground.
+ A shaded picnic area is situated adjacent to both the playground and the splash pad, providing comfortable gathering spaces.
+ The park also includes a sizable plaza space designed for programming, a baseball diamond, and a stormwater wash runs along one edge of the property allowing for efficient collection and redirection of stormwater runoff.
Challenges:
+ A large turf removal project has recently been completed, however, the large amount of remaining, functional turf still has significant maintenance and water use implications.
+ It currently relies heavily on irrigation and makes limited use of xeriscaping.
+ Throughout the site, there are numerous small memorials—some officially approved or sanctioned and others clearly impromptu. Many of these memorials are accompanied by additional decorations, such as flowers, stuffed animals, and trinkets, left by friends and family. While these memorials are wellintended, their sheer number and varying states of upkeep and decoration detract from the overall user experience and present a significant maintenance challenge.
+ Additionally, the playground is in need of repair, with broken slides and other components currently closed off and awaiting repairs planned in 2026.
7. SONATA PARK
Address: 1550 Seven Hills Dr.
Park Type: Community Park
Completed: 2000
Score: 84
Size: 14.6 acres
Strengths:
+ The park features attractive naturalized areas with native revegetation and xeric landscaping, particularly to the north.
+ There is good visibility into the park from adjacent residences and properties, ensuring a sense of security and community engagement.
+ The turf fields, which are heavily used primarily for soccer, have all been converted to Bermuda grass.
+ Trail and sidewalk connectivity throughout the park is strong, allowing easy access for visitors.
+ The playground offers ADA-compliant surfacing and transfer points, although it currently lacks adaptive play elements.
+ Parking is distributed within the site through two separate parking lots, enhancing accessibility.
+ Additionally, a recently completed turf conversion project has added both amenity and aesthetic value to the park, going beyond simple turf removal.
Challenges:
+ Drinking water access is currently limited to the upper (southern) portion of the park.
+ Both parking lots lack shade, presenting an opportunity to consider solar carports as a possible solution.
+ Tennis and basketball courts are not lighted, possibly due to their proximity to adjacent residences, which restricts evening use.
+ Structured shade is primarily available only in the upper portion of the park.
+ Although the park contains multiple multipurpose trails, there is a lack of trail signage, map kiosks, and limited bicycle facilities.
+ Stormwater runoff is directed to the Pittman Wash, which is not concrete lined, so most runoff will infiltrate before reaching Lake Mead except during large storm events.
+ The main park shelters do not have lighting.
+ There are no adaptive or sensory play elements in the playground.
+ The parking lot often fills up during game
and practice times, so providing on-street parking along the entry drive—potentially with permeable paving—would facilitate turf removal and allow for water collection and redirection for reuse.
+ The park is irrigation intensive due to the sports fields, which have numerous rotor heads, as well as the high-maintenance ornamental landscaping.
+ The park monument sign currently gives the impression that the park is part of the surrounding homeowners association; it should be clearly branded as a publicly accessible P&R site.
8. O’CALLAGHAN PARK
Address: 601 Skyline Rd.
Park Type: Community Park
Completed: 1979
Score: 83
Size: 16.8 acres
Strengths:
+ The park features an abundance of mature shade trees as well as multiple shade structures, creating comfortable areas throughout the grounds.
+ It is surrounded by residential neighborhoods and offers a wide variety of amenities for visitors.
+ Connectivity and walkability are strong, with an attractive looping walkway that provides easy access to the park’s diverse spaces and scenic views.
EXISTING CONDITIONS
+ A large, flexible open greenspace accommodates numerous activities, complemented by several playground areas.
+ Turf replacement and xeriscaping practices are being implemented incrementally to improve sustainability.
+ Additionally, the park is conveniently located adjacent to an elementary school and surrounded by residential land-uses.
Challenges:
+ There are extensive open turf areas in the park, with some sections still utilizing fescue turf.
+ Issues with irrigation were observed, including rotary sprinklers watering paved surfaces and broken heads sending water onto walkways or into drainage swales, failing to irrigate adjacent turf; in some cases, irrigation water drained into the parking lot and flowed down the street.
+ The park makes significant use of decomposed granite, but the lack of variation in aggregate sizes results in xeric spaces that lack visual and aesthetic appeal.
+ Playground equipment appears aged and worn, and there are currently no shade structures over the playgrounds.
+ Lighting throughout the park is inconsistent, with several older, non-LED fixtures still in use.
+ The central lawn was originally intended to be a lake, but since this vision was never realized, the area now feels underutilized and underprogrammed given its size.
+ Many park amenities, such as horseshoe pits, play areas, and shelters appear dated.
Figure 2.65 - O’Callaghan Park (2025).
PART TWO
9. STEPHANIE LYNN CRAIG PARK
Address: 1725 Galleria Dr. Park Type: Community Park
Compelted: 2002
Score: 75
Size: 12.0 acres
Strengths:
+ The park site is well maintained and offers both active recreation, such as softball fields, and neighborhood-scale amenities.
+ It is located adjacent to a large natural area to the west featuring multiple trails (White School Park), as well as the Thurman White Academy of the Performing Arts and an elementary school.
+ The site features a high-quality memorial dedicated to a former resident.
+ Shaded spectator seating is available near the ball diamonds.
+ Parking is conveniently distributed throughout the site.
+ The park provides good overall ADA accessibility.
+ Ample lighting is present throughout the park, which supports evening use.
+ The ball diamonds are equipped with droughttolerant hybrid Bermuda turf, and there is good access to drinking water across the site.
+ Shade structures are installed near both the playground and the flexible lawn area, enhancing comfort for visitors.
Challenges:
+ Notable grade changes between different areas present access challenges for some visitors.
+ Access from the eastern parking lot is more challenging due to the difference in grade.
+ The hardscape plaza spaces around the softball diamonds use darker-colored pavers that tend to retain heat
+ In addition, there is a significant presence of nonnative and irrigation-intensive plant material, such as palm trees near the ball diamonds, which further increases the already high irrigation demand of the sports fields.
+ The park’s location adjacent to high-speed and high-volume roadways, as well as a large industrial area to the east, may also have an impact on the overall environment and pedestrian accessibility.
+ Most of the lighting in the park appears to be older, non-LED fixtures, including those around the sports fields.
+ The playground offers limited adaptive play elements, and the dark-colored bonded rubber mulch surfacing absorbs a lot of heat. Furthermore, there is no shade structure over the playground equipment, contributing to increased temperatures during sunny days.
+ Litter and debris were found in some of the drainage areas, particularly adjacent to the northern parking lot.
+ While multiple benches are distributed across the site, many are in exposed, non-shaded areas, reducing comfort for users during hot weather.
+ There are limited ADA seating areas observed throughout the park.
Figure 2.66 - Stephanie Lynn Craig Park (2025).
G. REGIONAL PARKS
6 sites – 517.6 acres
The seven regional parks post the highest average (95.9) and highest median (101.0), with the widest range (47–115)—a sign that, while most large sites leverage breadth of amenities and infrastructure to score well, outliers can pull the mean down. Compared with other typologies, regionals more often capture points across multiple categories simultaneously (e.g., shade + drinking water + safety + lighting/utilities), which pushes many into or near the “exceeding expectations” band. These typology level score patterns complement the qualitative site visit notes and on the ground observations recorded during field evaluations.
1. HERITAGE PARK
Address: 350 S. Racetrack Rd.
Park Type: Regional Park
Completed: 2012
Score: 115
Size: 141.3 acres
Strengths:
+ Heritage Park serves as an excellent model for both good design and comprehensive resilience.
+ The majority of plant material is native or drought resistant. Irrigation is primarily provided to shade trees and larger plantings, while largescale rotor irrigation is reserved for athletic fields.
EXISTING CONDITIONS
+ The park features two synthetic turf fields, with the remaining fields composed of hybrid Bermuda grass.
+ Some parking bays in the lot utilize porous paving, and a carport equipped with solar panels is present; parking lots also include raised pedestrian crosswalks for safety.
+ Renewable energy is generated on-site through both solar panels and a small wind turbine.
+ A variety of hardscape materials are used throughout the park, most of which possess a medium to high solar reflective index.
+ The site includes a senior center, an aquatics center, numerous amenities such as play spaces and a dog park, and is situated among residential and school land uses.
+ Accessibility is excellent, with good ADA access to and within all major amenities and play spaces.
+ Clear signage and an effective wayfinding hierarchy are present.
Challenges:
+ Parking lots drain into dry infiltration basins or swales; however, it is unclear whether subsurface drainage structures redirect this runoff to a reservoir.
+ The park is bordered by major roadways with high traffic volumes and speeds, which can present access and safety concerns.
+ Due to the park’s large size and numerous amenities, such as an indoor center and an aquatics facility, maintenance requirements are intensive, and the athletic fields demand significant irrigation.
Figure 2.67 - Heritage Park (2025).
PART TWO
2. MONTAGNA PARK
Address: 3495 Via Altamira
Park Type: Regional Park
Completed: 2024
Score: 107
Size: 39.5 acres
Strengths:
+ The park is brand new and in excellent condition, featuring many newly planted trees that will enhance the landscape as they mature.
+ Visitors can enjoy a splash pad play area and a destination playground, both of which offer engaging recreational opportunities.
+ Most decomposed granite areas around the park’s amenities have a well-balanced mix of aggregate sizes, including large boulders, and these spaces incorporate both varied topography and native-friendly plant material, as well as soft-surface nature trails.
+ The site benefits from LED lighting, ensuring it is well lit and safe for use after dark.
+ Its design also allows for revenue generation through rentals, such as a designated bounce house pad.
+ Several large shade structures provide comfortable shelter throughout the park, and the play equipment is of high quality and includes accessible features for all users.
+ In addition to traditional waste receptacles, dedicated recycling bins are available, supporting
environmentally responsible practices.
+ Multi-use path connections seamlessly link the park to the surrounding trail network, enhancing accessibility.
+ The facility also includes a spacious off-leash dog area, making it convenient for pet owners.
+ Adjacent to a large wash, the park is capable of collecting and conveying stormwater during significant rain events.
+ Spectator seating areas are thoughtfully shaded, and the splash pad offers both play and cooling benefits, making the park an inviting destination for visitors of all ages.
Challenges:
+ The playground surfacing is a very dark color with a low SRI, which may contribute to heat buildup.
+ The off-leash dog area is both vertically and horizontally separated from the main section of the park, making access from the primary park area challenging.
+ Currently, the existing trees are newly planted and offer minimal shade, though this will improve over time.
+ There is very limited shade available in the offleash dog areas.
+ Additionally, the abundance of fencing, walls, structures, fields, and other complex elements throughout the park suggests that a high level of regular maintenance will be required, especially as the park and its amenities age.
Figure 2.68 - Montagna Park (2024).
EXISTING CONDITIONS
3. CORNERSTONE PARK
Address: 1600 Wigwam Pkwy.
Park Type: Regional Park
Completed: 2012
Score: 105
Size: 103.3 acres
Strengths:
+ The site features well-executed design and building architecture, complemented by Keith Haring public art located within a shaded outdoor fitness equipment area.
+ Adjacent to a large wetland with a pond, there is a large looping path that circles the wetland, as well as a spacious waterside event lawn with nearby shade pavilions.
+ The park offers generous community picnic shelters and an on-site food vendor for visitor convenience.
+ User feedback is efficiently gathered through “Happy or Not” feedback stations, enabling realtime problem solving.
+ Ample parking is provided, with stormwater runoff from the lot being collected and diverted appropriately.
+ Both pedestrian and parking lot areas benefit from LED lighting.
+ Serving as a crucial trail connection to the Harry Reid UPRR Trail, the park also includes a diverse range of interpretative and educational signage.
+ Additionally, xeric areas are landscaped with a few boulders and a blend of smaller cobbles and decomposed granite
Challenges:
+ The site is very large, which creates an open and exposed atmosphere.
+ Some xeric areas lack variation in aggregate sizes, making them feel sparse and empty.
+ There is no shade provided near the basketball or volleyball courts, and the large hardscape plaza spaces also have minimal shade, contributing to a sense of exposure.
+ Shaded seating areas are limited outside of the designated shade structures, and there is no drinking water access available by the basketball courts.
+ Additionally, the area lighting fixtures do not appear to be LED.
+ The presence of some 55-gallon steel barrel trash receptacles detracts from the overall aesthetic.
+ Although the site is situated along a major trail, bicycle facilities are limited to bike racks only, with no repair stations or lockers provided.
Figure 2.69 - Outdoor fitness area with Keith Haring mural at Cornerstone Park (COH, n.d.).
PART TWO
4. WHITNEY MESA RECREATION AREA
Address: 1661 Galleria Drive
Park Type: Regional Park
Completed: 2012
Score: 101
Size: 167.5 acres
Strengths:
+ The park is well-used and provides a range of activities for visitors, offering a large site that features both an indoor recreation center and an indoor/outdoor aquatics center. It also includes a competition BMX track, an archery range, and a sizable natural area.
+ The tennis and pickleball courts are designed to drain into the storm sewer, which helps direct runoff water back to the reservoir.
+ Lighting for the sport courts utilizes LED technology and operates on demand, and the tennis courts benefit from good shade throughout the day.
+ The park requires minimal irrigation for shrubs and understory plantings, and there is only
limited turf on the premises.
+ On the west side of the site, visitors can enjoy an extensive hiking trail network located in the mesa area.
+ The park offers strong interconnectivity with neighboring properties and is situated adjacent to several school sites.
+ Overall, the park is noted for its good ADA accessibility, which includes an ADA-accessible outdoor archery range.
Challenges:
+ Some areas within the mesa feel secluded, which can occasionally lead to problematic or undesirable behavior. Although there is some evidence of vandalism, it remains limited.
+ The park features a significant elevation change between the lower developed portion and the upper mesa area where the trail network is located, which may pose challenges for users with limited mobility.
+ While ornamental landscaping is minimal, overall site maintenance remains high due to the presence of recreation, aquatics, and BMX facilities.
Figure 2.70 - Whitney Mesa Recreation Area (2025).
EXISTING CONDITIONS
5. ANTHEM HILLS PARK
Address: 2256 N. Reunion Dr. Park Type: Regional Park
Completed: 2003
Score: 98
Size: 53.2 acres
Strengths:
+ The site features good pedestrian and sports court or field lighting throughout, ensuring visibility and safety for users.
+ Its location adjacent to both a school and residential areas enhance accessibility for the community. Trail signage and wayfinding are effective at the nature trails, although additional signage would be beneficial for multi-use trails that lead off-site.
+ Numerous mature shade trees, some of which appear to rely on irrigation, provide natural shade, and the baseball and softball dugouts are covered, with multiple shade structures also strategically placed at key areas.
+ The park offers a mix of different pavement and hardscape types and provides good multi-modal access via bike lanes, trails, and sidewalks.
+ Security cameras are installed in key locations to enhance safety.
+ Multiple water access points are thoughtfully distributed across all major amenities.
+ The hiking trails are particularly attractive, offering changes in elevation, and appear wellused.
+ The turf spaces use drought-tolerant Bermuda grass, which supports water conservation efforts.
Challenges:
+ There is no ADA-compliant path or route from the sidewalk along the main road leading into the park at the main vehicular entrance, and ADA access from the sidewalk is only available near the soccer fields on the western portion of the site, which is neither convenient nor clearly marked for users.
+ Only a few spectator seating areas are shaded, with the lack of shade most apparent at the upper fields where seating feels very exposed.
+ Although security cameras are present, there are portions of the park which feel secluded, notably the area behind the walls of the maintenance facility.
+ The park includes numerous pavers with low SRI values, causing these surfaces to retain heat.
+ The fence surrounding the skatepark is imposing and detracts from the overall aesthetic.
+ Due to the park’s programming, maintenance and irrigation demands are high, and the large turf areas require extensive broadcast and rotor irrigation for the diamond and rectangular fields, even though the turf species used is appropriate for the climate.
+ There are no shaded seating areas supporting the roller hockey rink or skate park.
+ ADA seating is lacking near the playground, with no adaptive play elements provided beyond basic transfer points.
+ The site features a mix of different types, styles, and quality of site furnishings, and the prevalence of 55-gallon steel drums for waste receptacles detracts from the park’s overall aesthetic.
Figure 2.71 - Anthem Hills Park (2025).
PART TWO
6. RUSSELL ROAD RECREATION COMPLEX
Address: 5901 E. Russell Rd.
Park Type: Regional Park
Completed: 2001
Score: 47
Size: 26.9 acres
Strengths:
+ Bike lanes are available on the adjacent county road, but the road experiences high speeds and heavy traffic, which may impact safety and accessibility for cyclists.
+ Some existing lights within the park have been retrofitted with LED bulbs, improving energy efficiency.
+ Non-functional turf on the north side of the park has been removed and replaced with attractive xeric landscaping and ornamental plant material is limited.
+ The developed portion of the park is situated next to both the future Home Park site and the SLAM Academy charter school, making it a busy and highly utilized area—especially on the north side where key softball programming takes place.
+ The athletic fields, including soccer and softball areas, are all composed of Bermuda turf, and the player and spectator areas around the softball diamonds benefit from shade.
+ The park’s location along prominent roadways offers good visibility into the site, and security cameras have been installed to enhance safety.
Challenges:
+ The south parcel adjacent to the church is in very poor condition and has become an attractant for undesirable behavior; this area is physically separated from the main portion of the park by
a fenced drainage channel.
+ Several crosswalks are missing which makes pedestrian movement more challenging.
+ There is a significant amount of sports turf throughout the park that requires a high level of maintenance and irrigation, and the sports field lighting does not appear to be LED.
+ The adjacent roadway is very large and experiences high-speed, high-volume traffic; the main east-west sidewalk runs immediately adjacent to this road and needs further separation for pedestrian safety.
+ Walking to and within the park is not easy or comfortable because of the width and location of walkways, as well as the speed and volume of nearby traffic.
+ The park currently demands high levels of maintenance and water usage.
+ Access to drinking water could be improved, especially given the athletic nature of the site.
+ Movement between the softball diamonds and the soccer fields to the west is difficult due to the roads and parking lots situated in between.
+ The tunnel connecting the soccer fields and the future Home Park site is dark even during the day, as the existing lights were either off or not functioning at the time of the visit.
+ The trail on the south side of the soccer fields feels very constrained since it is located between two high fences; it is recommended to consider removing the fence on the south side and controlling vehicular access to the fields via bollards. This path does not directly connect with the existing North/South trail or the tunnel trail, despite being immediately adjacent.
+ Additionally, ADA truncated domes are absent at some existing curb ramps, presenting accessibility concerns.
Figure 2.72 - Russell Road Recreation Complex (2025).
PARK SITE RESILIENCY SCORES BY PARK TYPOLOGY
PARK NAME
POCKET PARKS (5 sites - 18.4 acres)
1
5
Neighborhood Parks (15 sites - 102.2 acres)
9
12
17
18 Paseo Verde Trailhead
19 Dos Escuelas Park
Community Parks (9 sites - 161.6 acres)
24 Madeira Canyon Park
26 Mission Hills Park
27 Sonata Park
28 O'Callaghan Park
29
Regional Parks (6 sites - 517.6 acres)
30
1851 Paseo Verde Pkwy
2011 Paseo Verde Pkwy
804 Paseo Verde Pkwy
9.1 1 Golden View Dr.
281 W. Horizon Dr.
2390 Democracy Dr.
500 Harris St.
551 E. Mission Dr.
14.6 1550 Seven Hills Dr.
601 Skyline Rd.
1725 Galleria Dr.
S. Racetrack Rd. 31 Montagna Park
32 Cornerstone Park
33 Whitney Mesa Recreation Area
34 Anthem Hills Park
35 Russell Road Recreation Complex
Figure 2.73 - Park site resiliency scores organized by park typology.
3495 Via Altamira
106.1 1600 Wigwam Pkwy.
Patrick Ln.
2256 N. Reunion Dr.
5901 E. Russell Rd.
PART TWO
B. INFORMATION GATHERING
1. ASSESSMENT METHODOLOGY
TSK Architects, in collaboration with the City of Henderson and Framework, employed a methodical and data-driven approach to evaluate the resiliency of four existing community centers operated by the City’s Parks and Recreation Department. TSK worked with the team to identify five core areas of resiliency—Security, Fire Life Safety, Energy and Water Efficiency, Code Compliance, and Programmatic Flexibility— to function as the foundational categories guiding the architectural assessment.
To give action to these categories, TSK developed a detailed observation checklist, subdividing each resiliency area into specific sub-categories that could be observed and evaluated with given measurable criteria. Each criterion was evaluated on a scale from 1 to 5, accounting for both presence of a particular architectural system, for example a Building Management System, and that system’s condition. 1 being not present, or in poor condition and 5 being present, or in excellent condition.
In coordination with the City, TSK then established a weighted value for each core category, ensuring the scoring system reflected the City’s strategic priorities.
The scope of the analysis focused on five core areas:
1. Energy Consumption – TSK evaluated the building envelopes, daylighting strategies, HVAC performance, and insulation systems to determine current energy efficiency levels. The analysis identified opportunities for reduced energy usage through architectural retrofits and modernization of building systems, such as upgraded glazing, improved insulation, and passive solar strategies.
2. Security – TSK assessed site access, entry control points, visibility, and building layouts in relation to occupant safety. Recommendations included architectural interventions to improve secure circulation, controlled access zones, and the use of durable, tamper-resistant materials at vulnerable entry points.
3. Fire Resistance – The team reviewed the firerated construction elements, compartmentalization strategies, and egress routes. The analysis highlighted deficiencies in fire-resistive materials and recommended upgrades to enhance code compliance and occupant safety, including the use of non-combustible materials and improved fire separation between program areas.
4. Code Compliance – TSK identified several areas where facilities fall short of current codes, including ADA accessibility, structural integrity, fire safety, and mechanical system performance.
5. Program Diversity – TSK examined the adaptability of existing spaces to accommodate a variety of community programs and services. The analysis revealed that several facilities lacked spatial flexibility. Recommendations focused on reconfigurable interior layouts, movable partitions, and multi-use areas that could better support a diverse range of programming needs over time.
Through detailed site evaluations, documentation review, and stakeholder input, TSK developed tailored recommendations for each facility, aimed at increasing operational efficiency, occupant safety, and programmatic resilience. The final report provided a prioritized list of interventions—ranging from low-cost immediate improvements to longterm capital investments—designed to enhance the architectural resiliency of the City’s community centers for future generations.
EXISTING CONDITIONS
SILVER SPRINGS RECREATION CENTER
ARCHITECT: Welles Pugsley Architects
DATE COMPLETED: Original Clubhouse Completed in 1990
Major Addition Completed in 2002
A. FACILITY OVERVIEW
The Silver Springs Recreation Center in Henderson, Nevada, is a long-serving community pool and recreation facility that reflects a layered architectural history. The center has existed in its current form since a 2002 addition Designed by Welles Pugsley Architects, but its origins trace back to an original clubhouse built around 1990, with multiple additions and expansions over the years. The result is a building that blends a sense of civic permanence with the evolving recreational needs of the surrounding community.
DESIGN & LAYOUT
Architecturally, the center represents a fusion of styles. The original structure embodies a 1990s factory-inspired postmodernism (“Factory PoMo”), characterized by bold forms, simplified industrial references, and playful geometries. The later additions adopt a more restrained and functional post-modern contemporary municipal style, in line with civic building trends of the early 2000s.
The massing of the building has developed over time from a central, large rectangular gymnasium volume, with successive rectangular additions stepping down
in height as they extend outward. This results in a distinct roofline hierarchy: high for the gym, midlevel for classrooms and multi-use rooms, and low for administrative and support spaces. This massing strategy creates visual variety and helps define the programmatic zones of the building while preserving a cohesive form.
CONSTRUCTION
The primary construction materials reflect the building’s phased development. The newer portions of the building are constructed using concrete masonry unit (CMU) walls, exterior plaster finishes, and a combination of curtain wall glazing and standard window systems. The structural system relies on open web steel joists, metal deck diaphragms, and built-up roofing, suitable for largespan community spaces. In contrast, the original clubhouse was built with traditional wood framing and stucco cladding—elements that have aged and deteriorated, reflecting the difference in material durability over time.
EXISTING CONDITIONS
B. AUDIT SUMMARY
Overall, the Silver Springs Recreation Center does well in several of the resiliency categories. Access to the building is monitored by a staffed lobby/entry area as well as electronic key checkout, security cameras and intrusion systems. Including an alternative means of communication and modernizing the security systems for the building would enhance the center’s ability to remain a secure space. The building’s
design offers protection from the sun during most phases of the year and building systems have been designed to resist the thermal transfer from the sun to conditioned spaces.
The building’s primary structural system and envelope is comprised of non-combustible materials and its interior materials are mostly one hour rated.
Figure 2.78 - Outdoor pool at the Silver Springs Recreation Center (COH, n.d.).
PART TWO
C. SECURITY RESILIENCE
HIGHLIGHTS
+ Staffed Lobby
+ Electronic Key checkout and logging system
+ Security cameras and intrusion detection systems
RECOMMENDATIONS
+ Provide diversified means of communication
+ Maintain integrity of the site’s Main Distribution Frame
+ Modernize security camera and intrusion systems
D. ENERGY RESILIENCE
HIGHLIGHTS
+ Site orientation is ideal for protection from the sun
+ The building is shaded by trees on its south elevation
+ The building’s wall and roofing systems utilize rigid insulation to enhance the R-Value of the envelope
+ The primary entry point is on the north side of the building allowing for more glazing.
+ The primary entry point protects the interior conditioned environment with vestibuled entryways.
+ The roofing is comprised of reflective, built-up insulated materials over a metal deck and is in relatively good condition.
RECOMMENDATIONS
+ Continually maintain the integrity of the roofing system
+ Complete a commissioning report on the HVAC system to ensure it continues to serve the spaces adequately.
E. FIRE RESILIENCE
The fire resiliency of the Rec Center is considered favorable given the following:
HIGHLIGHTS
+ Type II non-combustible construction.
+ Typical 1-hr fire rating for interior combustibles
+ Interior walls finished in fire resistant Type ‘X’ gypsum board
+ Fully Sprinklered
+ Not located within a Wildland Urban Interface.
+ Functional Honey well control panel in working order.
RECOMMENDATIONS
+ Perform required maintenance of current carrying equipment
+ Continue to maintain the roofing systems integrity
+ Maintain adequate defensible space as recommended by the local fire Authority from the Pitman Wash to the south.
HENDERSON MULTIGENERATIONAL CENTER
ARCHITECT: Mason Dale Architects
DATE COMPLETED: 2001
A. FACILITY OVERVIEW
The Henderson Multi-Generational Center is a flagship public facility in Henderson, Nevada. Serving as a community recreation center, the building brings together people of all ages under one roof, offering amenities such as an indoor Olympic pool, climbing wall, fitness spaces, and a multi-use gymnasium.
DESIGN & LAYOUT
Architecturally, the building follows a post-modern contemporary municipal style, with a focus on bold volumes, structural honesty, and functional clarity. The building is composed of two main single-story rectangular wings, forming an L-shaped layout. These wings intersect at a dynamic entrance space on the southwest corner, where the otherwise rectilinear massing opens into a curved eastern façade, adding visual interest and spatial generosity to the building’s main entry.
Within this L-shaped plan, a distinctive jewel box volume—skewed from the grid—houses the indoor four-lane Olympic pool. This glass-enclosed element is both expressive and functional, creating a focal point within the complex and allowing the aquatic space to stand apart from the rest of the program.
Inside, the center features an open, flexible floor plan that supports diverse community activities. A dramatic two-story interior atrium forms the heart of the building, complete with a climbing rock wall that serves both as recreation and sculptural centerpiece. A double-height gymnasium anchors one wing, with a running track mezzanine above that allows users to move through the space vertically as well as horizontally.
CONSTRUCTION
The building is constructed using Type II-1 Hour construction for enhanced fire resistance, and includes materials such as cast-in-place concrete shear walls, architecturally exposed CMU (concrete masonry units), steel framing, and stucco cladding. These materials are both durable and expressive, showcasing the raw beauty of structure while meeting the demands of heavy community use.
The structural system consists of a combination of concrete shear walls, CMU, and open-web steel joists with a metal deck diaphragm, providing strength, flexibility, and long spans necessary for large open spaces like the gym and pool.
PART TWO
SUSTAINABILITY & CLIMATE
The building is thoughtfully sited. The long leg of the ‘L’ runs roughly northeast to southwest, allowing it to minimize direct southern exposure. Glazing on the southern side is limited and strategically placed to reduce heat gain in Nevada’s intense desert climate. The entrance, located at the southwest confluence of the two masses, is deeply recessed, providing a shaded transition from exterior to interior and buffering users from harsh afternoon sun.
SUMMARY
In all, the Henderson Multi-Generational Center is a civic anchor—bold in form, flexible in function, and carefully designed to support the health, wellness, and connection of its community. It balances monumental presence with human-scale details, making it both a local landmark and a welcoming public destination.
Figure 2.80 - Solar orientation diagram for the Henderson Multigenerational Center.
EXISTING CONDITIONS
B. AUDIT SUMMARY
Overall, the Henderson Multi-Generational Center rates highly in all resiliency categories. The building utilizes the most recommended systems that are considered the best practices of building security including monitored entrances, electronic key checkout, and intrusion detection systems; however, it lacks an alternative means of communication should internet or cellular access be interrupted. Its energy resiliency is highlighted by the utilization of a building management system in good working order. Its south facing elevations are designed to limit the influence of the southern sun on interior
conditioned spaces. In this orientation the building is used to provide shade to many of the Center’s aquatic and outdoor programs. The building has a vast roof area exposure that would be best used with the installation of a solar array to offset building energy use and to further protect this exposure from solar heat gain.
The building’s primary structural system and envelope is comprised of non-combustible materials and its interior materials are mostly one hour rated.
Figure 2.81 - Indoor pool at the Henderson Multigenerational Center (COH, n.d.).
PART TWO
C. SECURITY RESILIENCE
HIGHLIGHTS
+ Staffed Lobby
+ Electronic Key checkout and logging system
+ Security cameras and intrusion detection systems
RECOMMENDATIONS
+ Provide diversified means of communication
+ Maintain the integrity of the site’s Main Distribution Frame
+ Modernize security camera and intrusion systems
D. ENERGY RESILIENCE
HIGHLIGHTS
+ Site orientation provides shade to the spaces adjacent to exterior programs
+ The building’s southerly elevation does not have many openings where heat gain could influence inside temperatures.
+ The building’s wall and roofing systems utilize rigid insulation to enhance the R-Value of the envelope
+ The building’s jewel box was positioned in a northerly orientation so that the back is shielded from the harshest points of the sun, but benefits from the morning sunlight.
+ The primary entry point protects the interior conditioned environment with vestibuled entryways.
RECOMMENDATIONS
+ Continually maintain the integrity of the roofing system
+ Complete a commissioning report on the HVAC system to ensure it continues to serve the spaces adequately.
+ Utilize the Center’s vast roof area with an array of solar panels
+ Utilize a more reflective roofing material to discourage solar heat gain
E. FIRE RESILIENCE
The fire resiliency of the Rec Center is considered favorable given the following:
HIGHLIGHTS
+ Type II non-combustible construction.
+ Typical 1-hr fire rating for interior combustibles
+ Interior walls finished in fire resistant Type ‘X’ gypsum board
+ Fully Sprinklered
+ Not located within a Wildland Urban Interface.
+ Functional Honeywell control panel in working order
RECOMMENDATIONS
+ Perform required maintenance of current carrying equipment
+ Continue to maintain the roofing systems integrity
+ Maintain adequate defensible space as recommended by the local Fire Authority from the Pitman Wash to the south.
HERITAGE PARK
SENIOR FACILITY
ARCHITECT: Carpenter Sellers Associates
DATE COMPLETED: 2010
A. FACILITY OVERVIEW
The Heritage Park Senior Facility in Henderson, Nevada, is a purpose-built center that provides community, wellness, and recreation spaces tailored specifically for seniors.
DESIGN & LAYOUT
The building embraces a post-modern contemporary municipal style, where thoughtful form, material richness, and environmental responsiveness work together to create a welcoming civic environment.
The architectural concept is based on two rectangular volumes that converge to form a unified, deep floor plate. This merging of forms allows for a variety of program spaces—such as a full-service kitchen and cafeteria, activity rooms, and gathering areas—within a single, highly functional layout. The deep floor plan is activated by a carefully designed clerestory fenestration system, which brings natural daylight deep into the interior, reducing reliance on artificial lighting and enhancing user comfort.
One of the building’s most distinctive features is its use of interior and exterior gabion walls, modular wire mesh containers filled with stone. These gabion
elements not only serve as a textural and material counterpoint to the smoother plaster and metal panel cladding, but also express a strong connection to the desert landscape. The gabion walls lend the facility a grounded, natural quality that resonates with the surrounding environment.
The building is topped with an opposing shed roof system, where the sloped roof planes tilt in different directions, giving the form a dynamic profile while allowing for clerestory windows that admit daylight into the building’s core. The roof assembly consists of metal roofing over rigid insulation, supporting both thermal performance and durability in Henderson’s arid climate.
CONSTRUCTION
From a construction standpoint, the Heritage Park Senior Facility is built using a mix of concrete masonry unit (CMU) walls, cast-in-place concrete masonry, and wide flange steel joists, supported by a metal deck diaphragm. This hybrid system allows for the long spans required in communal spaces, while also providing the durability expected in hightraffic public facilities.
PART TWO
SUSTAINABILITY & CLIMATE
The building’s orientation and climate strategy are particularly thoughtful. While the structure does not sit perfectly on a cardinal east-west axis, its angled orientation takes advantage of the adjacent structures to help shade the southern elevation. Where exposure to sunlight is necessary, such as in the clerestory, careful detailing ensures that natural light enters without excessive heat gain. Other glazing areas are either shaded by architectural overhangs or minimized entirely on sun-intensive façades, supporting both comfort and energy efficiency.
SUMMARY
The Heritage Park Senior Facility reflects a balance of form, function, and environmental sensitivity. It combines warm, tactile materials with thoughtful daylighting and climate-conscious design, creating a community space that feels both protective and uplifting, a place where seniors can gather, connect, and thrive.
Figure 2.83 - Solar orientation diagram for the Heritage Park Senior Facility.
EXISTING CONDITIONS
B. AUDIT SUMMARY
Overall, the Heritage Park Senior Center performs well across several key resiliency categories and shares many operational strengths common to the other facilities evaluated. The building benefits from an actively staffed and monitored lobby, electronic key control logging, and onsite intrusion detection systems, contributing to strong day-today security. However, all external communications are dependent on cellular and internet connectivity, creating potential vulnerability during extended power outages or telecommunications disruptions.
From a climate resiliency standpoint, the facility’s most significant asset is the large rooftop solar array, which meaningfully offsets energy demand. The building is served by a multi-zone HVAC system, though the absence of a comprehensive Building Management System limits the ability to optimize performance, monitor loads, and respond dynamically during extreme heat events. Passive design strategies improve performance: overhung eaves on the opposing shed roof forms provide solar protection on the south and east elevations, and the raised roof element at the confluence of the shed forms introduces protected daylight into the deep floor plate, reducing reliance on artificial lighting.
The site is located within a designated Wildland Urban Interface; however, the immediate surroundings consist of sparsely vegetated chaparral and low shrubbery, reducing direct fuel load exposure relative to more densely vegetated contexts. No obvious accessibility barriers were observed at the time of assessment, though ongoing review with each code cycle is recommended to maintain compliance and operational inclusivity.
While minor maintenance issues and finish wear are present, the building remains a valuable community asset and has the spatial capacity to serve as a refuge during extreme heat or other weather events. Targeted improvements in communications redundancy, HVAC controls optimization, and system monitoring would further strengthen the facility’s ability to operate reliably during prolonged climate or emergency incidents.
Figure 2.84 - Heritage Park Senior Facility (COH, n.d.).
PART TWO
C. SECURITY RESILIENCE
HIGHLIGHTS
+ Staffed Lobby
+ Electronic Key checkout and logging system
+ Security cameras and intrusion detection systems
RECOMMENDATIONS
+ Provide diversified means of communication
+ Maintain the integrity of the site’s Main Distribution Frame
+ Modernize security camera and intrusion systems
D. ENERGY RESILIENCE
HIGHLIGHTS
+ Site orientation, major glazing facing hottest sun exposures
+ Deep floor plates
+ Architectural shading elements on openings to southern exposure
+ The primary entry point is on the north side of the building allowing for more glazing.
+ The primary entry point protects the interior conditioned environment with vestibuled entryways.
+ Large solar array on the building’s roof area
+ The roofing is comprised of reflective, built-up insulated materials over a metal deck and is in relatively good condition.
RECOMMENDATIONS
+ Continually maintain the integrity of the roofing system
+ Complete a commissioning report on the HVAC system to ensure it continues to serve the spaces adequately.
E. FIRE RESILIENCE
The fire resiliency of the Rec Center is considered favorable given the following:
HIGHLIGHTS
+ Fully Sprinklered
+ Located within a Wildland Urban Interface.
+ Functional Honeywell control panel in working order
+ Defensive Landscaping
RECOMMENDATIONS
+ Perform required maintenance of current carrying equipment
+ Standing seam metal roofing system
+ Continue to maintain the roofing systems
HERITAGE PARK AQUATICS COMPLEX
ARCHITECT: SH Architects
DATE COMPLETED: 2010
A. FACILITY OVERVIEW
The Heritage Park Aquatics Complex is a civic recreation facility located in Henderson, Nevada. The building serves as a community pool and recreation hub for residents of all ages.
DESIGN & LAYOUT
The design reflects a post-modern contemporary municipal style, with an emphasis on clean geometry, functional clarity, and civic presence.
The building is organized around a large, doubleheight rectangular volume, which runs east to west, aligning with the cardinal directions. This main mass contains the competition pool, and is flanked by two smaller rectangular volumes: one to the east, which houses administrative offices, and another on the north or west side (depending on final layout) that accommodates mechanical systems used to heat and treat the pool.
The design incorporates prominent storefront glazing systems—large glass walls that bring natural light into the interior. On the south and west elevations, these windows are clerestory and partially recessed from the main wall surface, helping reduce direct sunlight while still allowing daylight in. The east elevation features a deeply inset glass entrance, creating a welcoming and shaded entry point for visitors.
CONSTRUCTION
The structure is built using Type II-B construction, with concrete masonry unit (CMU) walls as the primary load-bearing system. The roof is supported by openweb steel joists and a metal deck diaphragm, which together create a strong yet cost-effective framework. Exterior finishes include a mix of 2-inch EIFS (Exterior Insulation Finishing System), stone veneer, tile cladding, and a standing seam metal roof, all of which are durable and well-suited to the desert climate.
PART TWO
SUSTAINABILITY & CLIMATE
The building’s east-west orientation exposes its southern face—and thus much of the pool hall—to significant sun exposure. While clerestory glazing is partially recessed, the amount of southern glass still results in substantial solar heat gain, a challenge in the hot Nevada climate. However, the use of thermal mass (CMU walls) and the careful placement of glass help manage indoor temperature while ensuring natural light reaches deep into the facility.
SUMMARY
Overall, the Heritage Park Aquatics Complex balances civic identity, function, and community accessibility, using straightforward materials and massing to deliver a space that feels both open and grounded, bright yet protected—serving as a centerpiece for public health and recreation in Henderson.
Figure 2.86 - Solar orientation diagram for the Heritage Park Aquatics Complex.
EXISTING CONDITIONS
B. AUDIT SUMMARY
Overall, the Heritage Aquatics Complex does well in several of the resiliency categories. Typical of the other buildings in this assessment the aquatics center utilizes many of the same strategies seen elsewhere. The lobby is staffed and monitored, keys are checked out a logged electronically, and intrusion detection systems are active onsite; however, the building relies on cellular and internet access for all outside communication.
The highlight of the center’s energy profile is a large array of solar panels on the building’s roof area. The heating and cooling system is multi-zone; however, s Building Management System would allow for more precise use of the HVAC system. Unlike its neighbor, the senior center utilizes overhung eaves on the low ends of opposing shed roofing system to protect
openings from over exposure to the sun on its south and east elevations. At the confluence of the shed roofing the eastern wing of the building extrudes upward to allow for a protected skylight to bring light into the center of a deep floor plate. Though the center is located within a Wildland Urban Interface, as defined by the United States Department of the Interior, the center is on a site of sparsely vegetated chapparal and shrubbery.
At the time of assessment there were no readily visible accessibility barriers, but it is important for spaces to be reviewed at each new code cycle to ensure continuous conformance with code requirements. Maintenance and other minor issues to finish surfaces persists; however, the building offers a range of programs for its seniors as a place of refuge from extreme weather events.
Figure 2.87 - Heritage Park Aquatics Complex. (COH, n.d.).
PART TWO
C. SECURITY RESILIENCE
HIGHLIGHTS
+ Staffed Lobby
+ Electronic Key checkout and logging system
+ Security cameras and intrusion detection systems
RECOMMENDATIONS
+ Provide diversified means of communication
+ Maintain the integrity of the site’s Main Distribution Frame
+ Modernize security camera and intrusion systems
D. ENERGY RESILIENCE
HIGHLIGHTS
+ Site orientation, major glazing facing hottest sun exposures
+ Architectural shading elements on openings to southern exposure
+ The primary entry point is on the north side of the building allowing for more glazing.
+ The primary entry point protects the interior conditioned environment with vestibuled entryways.
+ Large solar array on the building’s roof area
+ The roofing is comprised of reflective, built-up insulated materials over a metal deck and is in relatively good condition.
RECOMMENDATIONS
+ Provide shading or Low-E coatings on glazing on the west elevation
+ Continually maintain the integrity of the roofing system
+ Complete a commissioning report on the HVAC system to ensure it continues to serve the spaces adequately.
E. FIRE RESILIENCE
HIGHLIGHTS
+ Type II non-combustible construction.
+ Typical 1-hr fire rating for interior combustibles
+ Interior walls finished in fire resistant Type ‘X’ gypsum board
+ Fully Sprinklered
+ Not located within a Wildland Urban Interface.
+ Functional Honeywell control panel in working order
+ Defensive Landscaping
RECOMMENDATIONS
+ Perform required maintenance of current carrying equipment
+ Continue to maintain the roofing systems integrity
+ Maintain adequate defensible space as recommended by the local Fire Authority from the Pitman Wash to the south.
EXISTING CONDITIONS
E. OBSERVATIONS
Following the completion of the resiliency analysis of the four existing Parks and Recreation facilities, several thematic observations emerged:
1. CONSISTENT SCORING ACROSS FACILITIES
Each of the buildings evaluated scored similarly across most categories, indicating that while no single facility stood out as significantly underperforming, all share common strengths and limitations. This consistency suggests a system-wide opportunity for improvement through targeted interventions.
2. EMERGENCY COMMUNICATION GAPS
A recurring deficiency across all buildings was the lack of a diverse and redundant means of communication in the event of an emergency. This represents a vulnerability in the Security and Emergency Preparedness categories and should be addressed with solutions such as public address systems, visual alarms, and updated signage.
3. ADA ACCESS UPGRADES NEEDED
While generally functional, each facility was identified as requiring relatively minor accessibility upgrades to meet current ADA standards. These upgrades would enhance overall Code Compliance and help ensure inclusivity for all community members.
4. INEFFICIENT SOLAR ORIENTATION AND SHADING
Several buildings were observed to have their long axis oriented toward the south, with extensive window areas (fenestration) receiving direct sunlight. In many cases, these windows lacked adequate shading, negatively impacting Energy performance and occupant comfort. Passive solar control improvements such as shading devices or upgraded glazing systems could meaningfully boost energy efficiency.
5. LIMITED USE OF SOLAR ENERGY
Despite multiple facilities having available roof space suitable for solar infrastructure, only one building currently utilizes solar panels. This represents an untapped opportunity to expand renewable energy use and improve long-term energy resiliency across the parks system.
6. STRONG FIRE RESILIENCY – NON-COMBUSTIBLE CONSTRUCTION
A positive finding across all facilities is that each building is constructed primarily of non-combustible materials, contributing positively to their fire resiliency ratings. This construction type enhances life safety and reduces overall fire risk, particularly in a community-focused setting.
7. SILVER SPRINGS SITE-SPECIFIC CONCERN
Among the facilities reviewed, Silver Springs presented a unique challenge, as the original clubhouse structure may be approaching the end of its serviceable life. The possibility of full replacement should be considered in long-term planning efforts, especially if modernization proves impractical or cost-ineffective.
PART TWO
F. RECOMMENDATIONS
Based on the resiliency analysis findings, TSK Architects recommends the following targeted strategies to improve the long-term performance, safety, and self-sufficiency of the evaluated facilities:
1. ENHANCE EMERGENCY COMMUNICATION RESILIENCY
Each site should be equipped with at least one alternative method of emergency communication that does not rely solely on traditional infrastructure such as LAN, VoIP, or radio systems. A practical solution may include the installation of satellite phones or dedicated emergency cellular devices that maintain connectivity during outages or system failures. This upgrade would significantly bolster each facility’s ability to respond to and coordinate during emergency situations.
2. EXPAND ON-SITE SOLAR POWER GENERATION
For buildings with sufficient roof or open site area, the City should consider installing solar panel arrays to increase energy independence and reduce dependency on external utility providers. Given the region’s high solar exposure, this investment supports both sustainability and resilience goals while lowering long-term operating costs.
3. INCORPORATE BATTERY ENERGY STORAGE SYSTEMS (BESS)
Where space allows, facilities should consider Battery Energy Storage Systems to store surplus solar energy and extend power availability during outages. These systems would be particularly useful for powering critical building systems (e.g., lighting, HVAC, security, refrigeration, and communication) in the event of a grid failure.
4. INTEGRATE ARCHITECTURAL SHADING SOLUTIONS
Facilities such as Heritage Park Aquatics, which currently suffer from excessive solar heat gain due to exposed fenestration and orientation, would benefit from additional architectural shading. Strategies may include canopies, sunshades, vertical fins, or even landscape-based solutions. These measures should be incorporated into a broader passive cooling strategy to improve interior comfort, reduce energy loads, and contribute to the building’s overall resilience.
5. MAINTAIN AND MODERNIZE MECHANICAL AND ELECTRICAL SYSTEMS
The City should continually provide adequate maintenance to each facility’s heating, cooling, and power distribution systems to ensure efficient and reliable operation. Equipment should be monitored for performance and replaced at the end of its typical usable lifespan to avoid failures, inefficiencies, or service disruptions—especially during high-demand or emergency conditions.
By implementing these recommendations, the City of Henderson can proactively strengthen the resiliency of its Parks and Recreation facilities—enhancing both day-to-day performance and emergency readiness in the face of future challenges.
EXISTING CONDITIONS
Figure 2.90 - Youth basketball game being held at the Black Mountain Recreation Center (COH, 2025),
PART THREE
2. QUALITATIVE TECHNIQUES
Qualitative techniques rely heavily on public and stakeholder engagement, ranging from one-on-one interviews to large-format public workshops. For this planning process, the Project Team also conducted a series of interviews and focus groups with key project stakeholders and stakeholder groups selected by the City, an online public opinion survey, and conducted 11 community open public input meetings were also conducted throughout the city.
For this project, the following qualitative techniques were used:
1. Stakeholder interviews
2. Topic-specific focus groups
3. Public input workshops
4. Internal (staff) workshops
3. QUANTITATIVE TECHNIQUES
Quantitative techniques are the most scientific in nature, and are often the most labor and data in-tensive. The data yielded can serve as a “benchmark” that allows for comparison against similar communities, populations, and/or across a period of time, such as a future update to this plan.
Examples of quantitative techniques utilized in this planning process include:
1. Statistically-valid public opinion survey
2. Online community survey
3. Benchmarking Analysis
4. Recreation trends analysis
5. Financial assessment
6. Operational assessment
7. Programs and events assessment
8. Demographic assessment
Figure 3.1 - Members of the Project Team conducting a site visit at Morrell Park (2024).
Figure 3.2 - Sign advertising master planning workshops at the Black Mountain Recreation Center (2025).
Figure 3.3 - Public needs and priorities workshop at the Black Mountain Recreation Center (2025).
PART THREE
2. CURRENT CITY-WIDE CHALLENGES
Interviewees described broader city-wide challenges linked primarily to rapid population growth. They stated that growth often outpaces the expansion of infrastructure and public services, resulting in uneven distribution of parks and amenities, particularly affecting areas like West Henderson and Cadence.
Economic uncertainty was also mentioned, particularly surrounding the potential expiration or non-renewal of a dedicated parks sales tax. Participants suggested this could impact fiscal stability and the long-term sustainability of parks and recreation services.
Public safety and social issues emerged as another key concern. Participants cited increased presence of unhoused residents, particularly seniors, creating challenges in public spaces and leading to a need for expanded social services and specialized staff training. Additionally, interviewees noted difficulties in effectively communicating city financial needs, which reportedly resulted in community resistance to new funding initiatives.
allocations, and equipment shortages. Additionally, concerns were raised about vandalism—particularly affecting restrooms—coupled with insufficient security and delayed maintenance responses due to limited staffing. Rapid city growth, according to respondents, places further demands on expanding parks facilities without equivalent increases in budgets or staff.
Participants also expressed concerns regarding outdated infrastructure. They described many park facilities as aging or insufficient to meet current community expectations, particularly highlighting playground equipment and the scarcity of indoor recreational facilities.
Climate-related issues identified by stakeholders included challenges associated with extreme heat conditions, with participants noting insufficient shade and cooling infrastructure for both users and park staff. Interviewees also discussed significant water-conservation pressures due to ongoing drought conditions, noting that mandated turf removals sometimes negatively impact community perceptions and satisfaction.
Unsurprisingly, extreme climate conditions, particularly heat and drought, were identified as significant concerns.
Stakeholders noted increased demand for cityoperated cooling centers and highlighted constraints posed by limited cooling infrastructure. Severe drought conditions were also noted as requiring drastic reductions in municipal water usage, significantly affecting park maintenance practices and landscape design, and emphasizing the importance of sustainability as a priority for future planning.
Figure 3.4 - Damaged slide at Mission Hills Park (2025).
NEEDS & PRIORITIES
C. ROLE OF P&R IN CITY-WIDE RESILIENCE & COMMUNITY DEVELOPMENT
Participants viewed the Parks and Recreation Department as central to enhancing environmental resilience through sustainable practices. They recommended measures such as reducing turf areas, adopting water-efficient landscaping, and increasing shade structures. Respondents also suggested that parks could serve as important educational resources on climate adaptation and water conservation.
Social resilience was frequently highlighted by participants, emphasizing parks as important for mental health, community engagement, and as emergency response locations during extreme events. Interviewees recommended inclusive design practices to better serve vulnerable populations, including seniors and unhoused residents.
Interviewees identified parks as potential economic assets, particularly through sports tourism and enhanced property values. Participants advocated diversifying funding sources beyond traditional, growth-based methods. Specific strategies recommended included integrating renewable energy solutions, enhancing security infrastructure, and designing parks as hubs for community resilience during emergencies.
D. CITY OF HENDERSON PARKS AND RECREATION BRANDING
Stakeholders generally agreed on the importance of establishing a distinct, complementary branding strategy for the Parks and Recreation Department separate from the City’s broader brand identity. Participants believed this approach would help clearly communicate the specific community value of parks and recreation services.
Participants also noted the potential benefit of dedicated branding to address misconceptions, particularly related to financial management and public-private partnerships. They suggested that clearer departmental branding could enhance public understanding and support for funding initiatives.
Recommended branding elements included creating a unique logo and complementary color scheme distinct from, yet harmonious with, the overall City brand. Stakeholders also recommended comprehensive marketing campaigns aimed at educating the public on P&R’s contributions and clearly conveying information about funding needs and impacts.
Figure 3.5 - Cover image of the “Parks & Rec Make IT Possible Brand Guidelines” document (2025).
PART THREE
E. COMMON THEMES
1. FACILITIES & AMENITIES
Interviewees emphasized a significant need for additional investment in parks and recreation facilities in West Henderson, driven by population growth. They highlighted strong community interest in developing inclusive, multi-generational, and actively programmed parks featuring popular amenities such as pickleball, basketball, soccer, volleyball, and swimming facilities.
Participants also expressed interest in additional indoor recreation facilities, specifically mentioning a dedicated performing arts or cultural center. Enhancing trail connectivity, improving shade availability, and addressing ongoing safety concerns, particularly in restroom facilities, were consistently identified as priorities.
2. PROGRAMS & EVENTS
Participants identified family-oriented programming as particularly important, highlighting demand for childcare, after-school programs, and early learning activities. Inclusive and adaptive recreation opportunities were frequently emphasized, as was programming specifically tailored to seniors.
Community interest in cultural and performing arts events was noted, along with a perceived need for flexible spaces capable of hosting larger gatherings and celebrations. Interviewees emphasized parks’ roles in supporting mental health, wellness, and social connection, particularly highlighting their importance during community emergencies or crises.
3. FUNDING THE PARKS & RECREATION SYSTEM
Interviewees strongly emphasized the importance of renewing or potentially increasing the existing dedicated parks sales tax. Clear and early communication about how parks are funded and the benefits provided to the community was identified as essential for gaining public support.
Stakeholders recommended diversifying funding approaches through grants, sponsorships, impact fees, user fees, public-private partnerships, and bond measures. They also suggested creating a dedicated nonprofit foundation to support parks financially. Participants stressed the importance of timely planning, demographic-specific communication, and coordinated branding campaigns to effectively convey parks’ broader community benefits.
Figure 3.6 - Ribbon cutting celebration at Montagna Park in West Henderson (2025).
F. SUMMARY OF IMPLICATIONS
Based on stakeholder input and identified challenges, the highest priority actions to be addressed in the master plan, providing maximum impact for the greatest number of residents, include:
1. EXTENSION AND/OR INCREASE OF THE EXISTING SALES TAX OVERRIDE IS ESSENTIAL.
The current funding mechanism has significantly benefited both the parks and recreation system and the broader community over the past 28 years. It goes without saying that stakeholders overwhelmingly believe it is imperative to extend and/or increase this funding mechanism to ensure that P&R continues to grow with the community, offer essential programs and services that residents desire and expect, and maintain and operate the existing parks, trails, and facilities adequately.
2. ADDITIONAL INVESTMENT IN WEST HENDERSON IS NEEDED.
Development of a new indoor recreation center and additional parks amenities, addressing significant equity and accessibility gaps.
3. ADDITIONAL INVESTMENT IN INDOOR RECREATION IS NEEDED.
Given the challenges and potential health/safety risks associated with the extreme heat that the city experiences during the summer months, it would benefit from increasing the amount of indoor facilities, programs and events, and pop up facilities available to residents across the city.
4. INCREASE CLIMATE RESILIENCE
Implementing robust water conservation practices, expanding shade structures, and creating resilience hubs to effectively respond to extreme heat and drought.
NEEDS & PRIORITIES
5. INCREASE STAFFING AND RESOURCES
Immediate investment in adequate staffing levels and maintenance resources to ensure sustainable park operations.
6. ADDRESS VANDALISM AND SAFETY ISSUES
Upgrading restroom facilities and security measures across parks to enhance public safety and facility durability.
7. DEVELOP DISTINCT BRANDING AND COMMUNICATION CAMPAIGN SPECIFIC TO P&R:
Establishing a unique Parks and Recreation brand supported by comprehensive educational campaigns to ensure public support and clear communication about funding mechanisms, particularly around the importance of the existing $0.12 sales tax dedicated to parks.
These actions collectively address the most pressing challenges and opportunities identified by stakeholders, ensuring that the Henderson Parks and Recreation system continues to significantly enhance quality of life, resilience, and community well-being for all Henderson residents and guests.
Figure 3.7 - Heritage Park Aquatics Complex (COH, n.d.).
PART THREE
2. RANKING AND PRIORITIZATION METHODOLOGY
For each exercise, participant selections (“votes”) were tallied and ranked by frequency. To identify clear priorities, the analysis applied a cumulative threshold: the smallest group of top ranked response choices whose combined total equaled 50% or more of all responses for that exercise were designated as the “priorities” for that exercise. This method highlights the ideas with the strongest collective support while remaining transparent and replicable across workshop locations.
The following pages present the cumulative findings from each workshop exercise.
B. PRIORITY FACILITIES (THINGS YOU “VISIT”)
EXERCISE #1 PROMPT:
“Please take one (1) strip of dots and place each dot beneath the FACILITIES that you believe are the MOST IMPORTANT but for which the need is not being met adequately in Henderson. Please use only one (1) dot per facility, per person.”
EXERCISE #1 RESULTS:
Figure 3.9 shows that the top ten facility types together account for just over half of all 1,280 “dot” votes. The strongest preferences were for natural/ conservation areas (82) and indoor community centers (77), followed by community gardens (74) and outdoor pools/aquatics (72).
Rounding out the priority set were restrooms in parks (71), neighborhood parks (69), playgrounds (66), splash pads (65), paved trails/paths for bikes (65), and outdoor performance venues (64).
Interest also surfaced for natural play spaces, dog parks, paved/unpaved trails, and a balance of rectangular and diamond athletic fields, while pickleball registered as a second tier facility priority relative to the items above. Lower totals for tennis and other niche write ins indicate narrower constituencies.
Figure 3.8 - Participants at the Black Mountain workshop (2025).
PART THREE
C. PRIORITY AMENITIES (THINGS YOU “USE/EXPERIENCE”)
EXERCISE #2 PROMPT:
“Please take one (1) strip of dots and place each dot beneath the AMENITIES that you believe are the MOST IMPORTANT but for which the need is not being met adequately in Henderson. Please use only one (1) dot per amenity, per person”
EXERCISE #2 RESULTS:
Amenities voting underscored Henderson’s climate reality. As summarized in Figure 3.11, the eight amenities that meet the 50% threshold emphasize thermal comfort, hydration, and safety: misting/cooling stations (96), shaded seating areas (91), drinking fountains/bottle fillers (89), pedestrian lighting in parks (74), outdoor fitness equipment (73), shaded spectator seating (73), food and beverage options (71), and dog waste stations (64).
The next tier, teen activity areas, WiFi zones in parks, and public art, speaks to placemaking and age-specific needs. Together these results point to parks that are comfortable, sociable, and usable across seasons and times of day.
Figure 3.10 - Participants at the Silver Springs community needs and priorities workshop (2025).
PART THREE
D. PRIORITY PROGRAMS & EVENTS
EXERCISE #3 PROMPT:
“Please take one (1) strip of dots and place each dot beneath the PROGRAMS/EVENTS that you believe are the MOST IMPORTANT but for which the need is not being met adequately in Henderson. Please use only one (1) dot per program/event, per person.”
EXERCISE #3 RESULTS:
As shown in Figure 3.13, the community’s top programming requests balance citywide experiences with life stage support. Special events/concerts led all options (81). A strong youth emphasis is present—youth athletic leagues (69), science/technology programs (66), nature/environmental education (63), youth camps (51), and programs for teens (46). Health and wellness for adults is also a strong recurring theme with programs for seniors (63), water fitness programs (57), and adult fitness/wellness programs (56).
These choices point to a desire for both destination style community gatherings and dependable, affordable programs that support families on a weekly basis.
Figure 3.12 - Watch party held at Water Street Plaza (COH, n.d.)
PART THREE
E. INDOOR RECREATION
EXERCISE #4 PROMPT:
“Please take one (1) strip of dots and place each dot beneath the INDOOR RECREATION facilities/amenities that you believe are the MOST IMPORTANT but for which the need is not being met adequately in Henderson. Please use only one (1) dot per facility/amenity, per person.”
EXERCISE #4 RESULTS:
Figure 3.15 shows that residents assigned very high priority to an indoor swimming pool (85), a walking/ running track (84), and a gymnasium (76), signaling demand for heat-proof recreation. The rest of the priority set highlights social “third places”: café/snack bar (79), esports/gaming space (60), coffee shop (60), art studio (59), teen room (56), and senior room/area (56). Near priority interests include active recreation and recovery, such as strength training equipment, climbing wall, sauna, and yoga/dance studio.
Taken together, these results describe multi generational indoor hubs that can host drop-in activity, fitness, arts, and community events throughout the year.
Figure 3.14 - Henderson Senior Facility (2025).
Indoor Recreation
PART THREE
F. INDOOR RECREATION
EXERCISE #5 PROMPT:
“We want to know why you believe Henderson’s parks, trails, natural areas, programs, and events are important to you and your family? Please write your answers on the Post-It notes provided and stick them to the sheet. Please use as many as you need to; there are no “wrong” answers.”
EXERCISE #5 RESULTS:
Open ended responses were coded into macro themes (see Figures 3.16-3.17) The dominant messages were that Henderson’s parks and recreation build community (16 mentions), benefit children (14), facilitate family time (10), and help residents be healthier (9). Participants also tied parks to quality of life (6), happiness and joy, connection to nature, and opportunities to learn new things and practice the arts. Several comments explicitly referenced heat relief, pets, and safety, echoing amenity and barrier results. This narrative context explains why residents place such value on everyday comfort, family friendly programming, and places to gather. Enlargements of the write-in responses to Exercise #5 can be found in Section 6.4 of the Appendix.
5 Importance
5 Importance
"Henderson's parks, trails, natural areas, programs, and events are important to me because ___________________________!"
"Henderson's parks, trails, natural areas, programs, and events are important to me because ___________________________!"
Participant Write-In Comment
They bring the community together.
They bring the community together.
They are where my neighborhood meets and builds community.
They are where my neighborhood meets and builds community.
Meet your neighbors at classes and events.
Meet your neighbors at classes and events.
Because I can play with my friends at the park.
Because I can play with my friends at the park.
They promote dialogue between community members and provide opportunities to bond with one another.
They promote dialogue between community members and provide opportunities to bond with one another.
Build a sense of community.
Build a sense of community.
Meet your neighbors at classes and events.
Meet your neighbors at classes and events.
The spaces contribute to my physical and mental well-being while also fostering a sense of community and belonging. They offer a chance to
The spaces contribute to my physical and mental well-being while also fostering a sense of community and belonging. They offer a chance to
It brings the community together where new friends, connections, and even business or program opportunities come.
It brings the community together where new friends, connections, and even business or program opportunities come.
Have fun with friends
Have fun with friends
It brings the community together in a low-cost, healthy way.
It brings the community together in a low-cost, healthy way.
A place to hang out.
A place to hang out.
I am proud of Henderson.
I am proud of Henderson.
There is always a sense of community in the park.
There is always a sense of community in the park.
Because they make our parks.
Because they make our parks.
It's important because I like going to the gym and my friends are here.
It's important because I like going to the gym and my friends are here.
I have children who love the outdoors.
I have children who love the outdoors.
As an older person living here in Henderson, I feel so fortunate to have available to me so many programs to take part in. I brag about our parks and rec to just about everyone. Thank you.
As an older person living here in Henderson, I feel so fortunate to have available to me so many programs to take part in. I brag about our parks and rec to just about everyone. Thank you.
Affordable places for kids/adult activities, areas for local sports teams to use the facilities, safe after school, school break, child care that is affordable.
Affordable places for kids/adult activities, areas for local sports teams to use the facilities, safe after school, school break, child care that is affordable.
Safety of the kids.
Safety of the kids.
Our children need safe spaces to learn and grow and experience the great outdoors. Community, Family, Activity.
Our children need safe spaces to learn and grow and experience the great outdoors. Community, Family, Activity.
They provide an opportunity for my children to try many different activities and experiences and explore new interests.
They provide an opportunity for my children to try many different activities and experiences and explore new interests.
My kids need a safe place to be outside.
My kids need a safe place to be outside.
Get kids outdoors to exercise and appreciate nature.
Get kids outdoors to exercise and appreciate nature.
I am raising my kids here.
I am raising my kids here.
They are a great resource to keep myself and my children active.
They are a great resource to keep myself and my children active.
Parks are a place for kids and families to meet up.
Parks are a place for kids and families to meet up.
Kids classes are affordable.
Kids classes are affordable.
Because I can go down the slide.
Because I can go down the slide.
It provides our youth a safe and fun place to enjoy the outdoors.
It provides our youth a safe and fun place to enjoy the outdoors.
Spend quality family time outdoors no matter the weather.
Spend quality family time outdoors no matter the weather.
Provides opportunities to play, learn, and just relax or engage with your family.
Provides opportunities to play, learn, and just relax or engage with your family.
It gives more activities for families to do.
It gives more activities for families to do.
My family is important but I also want activities to do with my friends during the summertime.
My family is important but I also want activities to do with my friends during the summertime.
They provide a space away fromhome that my family can enjoy common interests and activities, such as rollerhockey, basketball,
They provide a space away fromhome that my family can enjoy common interests and activities, such as rollerhockey, basketball,
It gives my family a place to do activities together.
It gives my family a place to do activities together.
It helps foster family time and gives children a place to learn, play, and grow.
It foster family time and gives children a place to learn, play, and grow.
Spend time outside with family.
Spend time outside with family.
They are the safe place for me and my family to get outdoors or use amenitities.
They are the safe place for me and my family to get outdoors or use amenitities.
Birthday party & family gatherings perfect for all ages.
Birthday party & family gatherings perfect for all ages.
Convenient trail for walking.
Convenient trail for walking.
I like running in them.
I like running in them.
Exercise classes.
Exercise classes.
The spaces contribute to my physical and mental well-being while also fostering a sense of community and belonging. They offer a chance to
The spaces contribute to my physical and mental well-being while also fostering a sense of community and belonging. They offer a chance to
They get me some really good exercise and play. It also lets me do sports.
They get me some good exercise and play. It also lets me do sports.
They provide safe places for all people to exercise and have fun.
They provide safe places for all people to exercise and have fun.
They build community
They provide benefits for children
They facilitate family time together
They help me be healthier
Figure 3.16 - Results for Community Workshop Exercise #5.
Because I can play with my friends at the park.
They promote dialogue between community members and provide opportunities to bond with one another.
Build a sense of community.
Meet your neighbors at classes and events.
The spaces contribute to my physical and mental well-being while also fostering a sense of community and belonging. They offer a chance to It brings the community together where new friends, connections, and even business or program opportunities come.
Have fun with friends
It brings the community together in a low-cost, healthy way.
A place to hang out.
I am proud of Henderson.
There is always a sense of community in the park.
Because they make our parks.
It's important because I like going to the gym and my friends are here.
I have children who love the outdoors.
They build community
NEEDS & PRIORITIES
As an older person living here in Henderson, I feel so fortunate to have available to me so many programs to take part in. I brag about our parks and rec to just about everyone. Thank you.
Affordable places for kids/adult activities, areas for local sports teams to use the facilities, safe after school, school break, child care that is affordable.
Safety of the kids.
Our children need safe spaces to learn and grow and experience the great outdoors. Community, Family, Activity.
They provide an opportunity for my children to try many different activities and experiences and explore new interests.
My kids need a safe place to be outside.
Get kids outdoors to exercise and appreciate nature.
I am raising my kids here.
They are a great resource to keep myself and my children active.
Parks are a place for kids and families to meet up.
Kids classes are affordable.
Because I can go down the slide.
It provides our youth a safe and fun place to enjoy the outdoors.
Spend quality family time outdoors no matter the weather.
Provides opportunities to play, learn, and just relax or engage with your family.
It gives more activities for families to do.
My family is important but I also want activities to do with my friends during the summertime.
They provide a space away fromhome that my family can enjoy common interests and activities, such as rollerhockey, basketball, It gives my family a place to do activities together.
It helps foster family time and gives children a place to learn, play, and grow.
Spend time outside with family.
They are the safe place for me and my family to get outdoors or use amenitities.
Birthday party & family gatherings perfect for all ages.
Convenient trail for walking.
I like running in them.
Exercise classes.
The spaces contribute to my physical and mental well-being while also fostering a sense of community and belonging. They offer a chance to
They get me some really good exercise and play. It also lets me do sports.
They provide safe places for all people to exercise and have fun.
Key part of staying fit.
A great place for me to run.
It's vital for my well-being.
I'm a Henderson resident, I'm also a luxury home building. I'd like to see my community updated to match the value of the homes I am building.
The parks make me feel as though this is a nice place to live.
This is my home.
Henderson is home and they reflect the quality and care of our community.
They improve our lives.
Improves quality of life.
I have fun
Well maintained and good facilities throughout the city.
It helps to get people out the house and it's something to do that's productive.
Getting to spend qualit ytime outside and enjoy the facilities.
Nature; bring joy to the body and the mind.
They provide a place to experience the natural beauty of our community.
They provide opportunities for outdoor recreation, relaxation, and connecting with nature.
It allows me to feel in touch with nature and most importantly my community.
I get to play, have fun, and exercise.
I like fresh air and being able to run outside.
It's important to me because I love parkour (I love climbing).
Kid friendly parks, dog parks, and walking trails as well as classes at the rec centers.
Learn something new.
They provide opportunities to learn new things - to experience new things. It gives an affordable option to gain different perspectives and a new sense of appreciation.
Encourages growth and prioritizes great education.
I love our dance classes.
I love all the line dance classes and the adult art classes.
Museums that are supposed to be a place of amazement and historical sections.
The basketball and other youth sports allow anyone who wants to play have the opportunity.
Youth basektball programs.
Roller hockey outdoor hockey rinks is great to get kids involved.
Indoor options during the summer.
Thousands of trees, tunnel/shadow paths.
A great place to walk my dog and be outdoors.
…dog parks.
I want to feel safe on the trails.
The security of our remote trails and thet ability for EMS to reach those in need.
For the swimming lessons.
Whitney recreation area can be improved.
I use parks and trails to get around Henderson.
Figure 3.17 - Results for Community Workshop Exercise #5 (cont’d.)
They provide benefits for children
They facilitate family time together
They help me be healthier
They protect our quality of life
They make me happy
They connect me to nature
They get me active
They teach me new things
They embrace the arts
They let me compete
PART THREE
G. INVESTMENT PRIORITIES
EXERCISE #6 PROMPT:
“Please take one (1) stack of coins per person and distribute them among the buckets based on how you believe investment in the Henderson Parks and Recreation system should be prioritized. You are welcome to distribute the coins however you see fit (you may place more than one coin per bucket). If needed, use a Post-It note to add an “other” option and stick it on the wall next to the poster.”
EXERCISE #6 RESULTS:
When given “coins” to allocate among spending categories, participants overwhelmingly directed investment to improvements to existing parks and facilities (712 coins). The next preference was additional indoor recreation opportunities (455), followed by development of new parks and natural areas (390), additional programs and community events (318), and additional bikeways and trails (297). “Other” ideas totaled 144.
Figure 3.18 shows a clear “fix and upgrade first” message, paired with a sizable appetite for indoor, climate controlled spaces that can be used year-round. BlackMountain(01/13/25)SilverSprings(01/14/25)CenterofExcellence(01/15/25)BlackMountain(02/13/25)HendersonMulti-GenCenter(02/15/25)HeritageParkSeniorFacility(02/20/25) SilverSprings(02/26/25) TOTAL
6 Investment Priorities
1
6 Other (write in answer) 114013202911 0 124 Workshop Total: 23731310026242744099
-
Figure 3.19 - Workshop attendee participating in Exercise Station #6.
Figure 3.18
Results for Community Workshop Exercise #6.
H. BARRIERS TO USAGE / PARTICIPATION
EXERCISE #7 PROMPT:
“What prevents you from visiting or using Henderson’s parks and recreation facilities and programs/events more often? Please place a dot or sticker next to each relevant barrier. If your barrier isn’t listed, please write it in on a Post-It note and stick it to the poster. You may use as many dots as needed, but please place only one (1) dot per barrier per person.”
EXERCISE #7 RESULTS:
Workshop participants identified extreme heat as the dominant barrier to participation/usage, with 71 selections (see Figure 3.20). A notable share of participants reported no barrier (35), but the next most cited obstacles were desired events/programs not offered (30), limited hours of operation (25), not enough parking nearby (24), and parks/facilities are not well maintained (24). Secondary barriers included not knowing what is offered (22), lack of desired amenities/facilities (19), and an online system for reservations that is not user friendly (16). Additional, but smaller, signals included high costs, overcrowding, and a lack of perceived safety. These findings align directly with what residents prioritized for amenities and investments.
7
Barriers to Usage/Participation
3.20 - Results for Community Workshop Exercise #7.
Figure
PART THREE
I. SUMMARY OF FINDINGS
The workshop series produced a clear and consistent message from residents. Across locations and exercises, participants prioritized making existing parks work better for everyday use, adding indoor capacity to stay active through extreme heat, protecting and connecting people to nature, and treating parks as social infrastructure through dependable programming and events. Using the workshop ranking method and identifying the smallest set of top responses that cumulatively reach at least 50%, these themes surfaced repeatedly across facility, amenity, program, indoor recreation, barriers, and budget exercises. Read together, they form a practical roadmap for the Master Plan.
First, residents want retrofits that deliver comfort, safety, and convenience in the places they already frequent, notably the city’s older existing park sites. Shade, cooling opportunities, hydration, clean and accessible restrooms, lighting, seating, and clear wayfinding are viewed not as “nice to have,” but as prerequisites for daily use, especially for families with young children, older adults, and those sensitive to heat. The Master Plan should therefore adopt “fix it first” standards and sequence early capital dollars toward comfort upgrades at high use parks and gaps in underserved areas. Corresponding maintenance commitments are essential so improvements remain reliable over time.
Second, participants emphasized that indoor, multi generational capacity is central to year round access. When outdoor conditions are prohibitive, residents still want affordable options for fitness, aquatics, court sports, drop in recreation, and social connection. The City should evaluate expansion and modernization of recreation centers and gymnasiums, design flexible spaces that can shift between age groups and activities, and pursue joint use partnerships to add square footage where it is most needed. Operating strategies, such as earlier mornings, later evenings, and weekends, are as vital as bricks and mortar to match how people actually use the system in summer.
Third, the community affirmed the importance of nature as part of Henderson’s identity and everyday wellbeing. People value close to home access to conservation areas, connected trail networks, and
nature based play and learning. The City should protect priority open spaces, close trail gaps and crossings, add shade and rest nodes at intervals, improve trailhead wayfinding, and integrate nature play where appropriate. Stewardship programming can translate this access into long term care for local landscapes.
Fourth, residents want parks to host community life with predictable programming and events. A reliable calendar of concerts, movies, markets, cultural celebrations, and leagues, alongside program “ladders” for youth, teens, adults, and seniors, turns parks into everyday third places. Interest was especially strong in STEM/nature education, aquatics, and fitness. The City should develop an activation framework that balances free/low cost offerings with cost recovery programs, rotates events across neighborhoods, and designates a handful of signature citywide gatherings.
Finally, the barriers exercises point to a set of cross cutting enablers that will unlock the full value of the system if addressed systematically:
Communication: Create a clear “front door” for discovery and registration, improve multilingual outreach and on site information, and deliver timely, channel agnostic updates.
Hours: Align schedules with resident availability (early mornings, evenings, and weekends) especially during summer heat.
Affordability: Use transparent pricing, resident discounts, and scholarships to keep access equitable while clarifying cost recovery expectations.
Access and parking: Pair peak time parking management and shared parking strategies with safer walk/bike connections and secure bicycle parking.
Maintenance: Establish visible service standards and rapid response for restrooms, hydration points, shade structures, playgrounds, and turf.
Safety: Apply good design (sightlines, lighting, activity adjacency) and coordinated staffing approaches to address known hotspots without over hardening park environments.
NEEDS & PRIORITIES
J. IMPLICATIONS
1. Codify comfort and heat resilience standards system-wide and fund near term retrofits;
2. Add and operate flexible indoor capacity where gaps are greatest;
3. Protect key natural assets while completing trail connections and nature play opportunities;
4. Implement a citywide programming and events framework focused on stem/nature, aquatics, and fitness; and
5. Remove recurring barriers through better communication, hours, affordability tools, access management, maintenance, and safety design.
These directions should be delivered through an equity lens, with clear phasing: quick wins that residents will feel immediately (shade, hydration, restroom and lighting upgrades, schedule adjustments) followed by major capital (indoor expansions, trail links, conservation initiatives) and backed by measurable targets for accountability.
In short, the workshops ask Henderson and P&R to modernize what exists, add resilient capacity, deepen daily access to nature, and reliably animate parks as social infrastructure—while removing the predictable friction points that keep people from participating.
Figure 3.21 - Workshop attendees participating in Exercise Station #4 (2025).
PART THREE
2. FACILITIES ACCESS
Respondents selected how long it would take for them to walk to the nearest park from their home and fifty percent (50%) selected 10 minutes or less, sixteen percent (16%) selected 11-15 minutes, fifteen percent (15%) selected 16-20 minutes, six percent (6%) selected 21-25 minutes, and thirteen percent (13%) selected 26+ minutes. Sixty-one percent (61%) indicated that they have a park that is within a 10-minute walk of your home. Seventy-five percent (75%) indicated that they have a pedestrian route (trails, sidewalks) to safely access the closest park from your home.
3. PROGRAMS USE & QUALITY:
Respondents selected how many programs they have participated in over the past year. Eighty-one percent (81%) selected 1 to 3 programs, fourteen percent (14%) selected 4 to 6 programs, two percent (2%) selected 7 to 9 programs, and three percent (3%) selected 10+ programs. They rated the quality of the programs they participated in. Thirty-nine (39%) rated excellent, fifty-four (54%) rated good, six percent (6%) rated fair, and one percent (1%) rated poor.
4. BARRIERS TO PARTICIPATION
Respondents selected the reason they have not used any park, facility, or program either at all or often. Fifteen percent (15%) selected what I want to do is not offered, eleven percent (11%) selected too far from my home, nine percent (9%) selected costs/fees are too high, twenty-seven percent (27%) selected program times/facilities are not convenient, and thirty-seven percent (37%) selected don’t know what is offered or available.
5. IMPORTANT FACTORS TO USING PARKS AND RECREATION SERVICES
Based on the sum of top 5 choices, respondents selected the most important factors to them when using parks and recreation services. The most selected items were: maintenance of parks & trails (66%), security in City parks & trails (57%), and park location (43%).
6. USER SATISFACTION
Respondents selected how satisfied they were with the value they receive from the City’s parks and recreation offerings. Twenty-nine percent (29%) were very satisfied, forty-five percent (45%) were satisfied, twenty percent (20%) were neutral, four percent (4%) were dissatisfied, and two percent (2%) were very dissatisfied.
7. 2026 PROPERTY TAX REFERENDUM
Respondents were asked if the City were to renew the property tax levy in 2026, if they would vote on it. Sixty-seven percent (67%) would vote in favor, one percent (1%) would vote against, and twenty-two percent (22%) were not sure. For those who would vote against or unsure, they selected reasons why. The top reasons were: property taxes are already too high (59%), I need more information before I can respond (49%), and I am skeptical of how the money would be spent (49%).
Figure 3.22 - Results of survey question 2a.
Figure 3.23 - Results of survey question 6a.
PART THREE
Figure 3.24 - Results of survey question 12.
Figure 3.25 - Results of survey question 12a.
NEEDS & PRIORITIES
C. Priority Investment Rating (PIR) Methodology
The Priority Investment Rating (PIR) was developed by ETC Institute to provide governments with an objective tool for evaluating the priority that should be placed on parks and recreation investments. The rating equally weighs (1) the importance that residents place on facilities and (2) how many residents have unmet needs for the facilities.
The Priority Investment Rating reflects the importance residents place on items (sum of top 4 choices) and the unmet needs (doesn’t meet my needs) for each facility/program relative to the facility/program that rated the highest overall. Since decisions related to future investments should consider both the level of unmet need and the importance of facilities/programs, the PIR weights each of these components equally.
The PIR reflects the sum of the Unmet Needs Rating and the Importance Rating as shown in the equation below:
PIR = UNR + IR
For example, suppose the Unmet Needs Rating for playgrounds is 26.5 (out of 100) and the Importance Rating for playgrounds is 52 (out of 100), the Priority Investment Rating for playgrounds would be 78.5 (out of 200).
1. HOW TO ANALYZE THE CHARTS
High Priority Areas are those with a PIR of at least 110. A rating of 110 or above generally indicates there is a relatively high level of unmet need and residents generally think it is important to fund improvements in these areas. Improvements in this area are likely to have a positive impact on the greatest number of households.
Medium Priority Areas are those with a PIR of 70-109. A rating in this range generally indicates there is a medium to high level of unmet need or a significant percentage of residents generally think it is important to fund improvements in these areas.
Low Priority Areas are those with a PIR below 49. A rating in this range generally indicates there is a relatively low level of unmet need and residents do not think it is important to fund improvements in these areas. Improvements may be warranted if the needs of very specialized populations are being targeted.
D. RECREATION FACILITIES/ AMENITIES NEEDS & PRIORITIES
1. FACILITIES NEEDS
Respondents were asked to identify if their household had a need for 24 recreation facilities and to rate how well their needs for each were currently being met. Based on this analysis, ETC Institute was able to estimate the number of households in the community that had the greatest “unmet” need for various facilities.
The three facilities with the highest percentage of households that have an unmet need:
1. Neighborhood parks
2. Paved trails for bikes & pedestrians that connect you to places of interest
3. Natural areas/conservation areas
2. FACILITY IMPORTANCE
In addition to assessing the needs for each facility, ETC Institute also assessed the importance that residents placed on each item. Based on the sum of respondents’ top four choices, these were the four facilities that ranked most important to residents:
1. Neighborhood parks
2. Paved trails for bikes & pedestrians that connect you to places of interest
3. Natural areas/conservation areas
4. Large community parks
PART THREE
3. PRIORITIES FOR FACILITY INVESTMENTS
Based on the Priority Investment Rating (PIR), the following facilities were rated as high priorities for investment:
1. Paved trails for bikes & pedestrians that connect you to places of interest (PIR=165)
2. Neighborhood parks (PIR=151)
3. Indoor fitness & wellness spaces (PIR=132)
4. Natural areas/conservation areas (PIR=119)
5. Unpaved hiking trails within parks (PIR=117)
6. Community recreation centers (PIR=117)
E. RECREATION PROGRAMS/EVENTS NEEDS & PRIORITIES
1. PROGRAMS NEEDS
Respondents were asked to identify if their household had a need for 19 recreation programs and to rate how well their needs for each were currently being met. Based on this analysis, ETC Institute was able to estimate the number of households in the community that had the greatest “unmet” need for various facilities.
The three programs with the highest percentage of households that have an unmet need:
1. Special events
2. Adult fitness/wellness programs
3. Nature programs/environmental education
2. PROGRAM IMPORTANCE
In addition to assessing the needs for each program, ETC Institute also assessed the importance that residents placed on each item. Based on the sum of respondents’ top four choices, these were the four facilities that ranked most important to residents:
1. Special events
2. Adult fitness/wellness programs
3. Programs for seniors
4. Nature programs/environmental education
3. PRIORITIES FOR PROGRAM INVESTMENTS
Based on the Priority Investment Rating (PIR), the following programs were rated as high priorities for investment:
After the Henderson Needs Assessment Survey administration was complete, ETC Institute benchmarked Henderson’s results against ETC’s extensive national database of responses to similar questions.
The benchmarking analysis includes three key comparisons:
1. Overall condition of parks and recreation facilities/amenities
2. Overall condition of programs/events
3. Overall satisfaction with value.
1. OVERALL CONDITION OF FACILITIES/ AMENITIES
Henderson’s respondents rated facilities/amenities higher than ETC’s national average: 37% “Excellent” and 50% “Good” in Henderson, compared with 35% and 47% nationally. Only 10% of Henderson respondents selected “Fair” and 2% “Poor,” versus 15% and 3% nationally. In top two terms, Henderson’s 87% “Excellent/Good” outperforms the national 82%, while bottom two (“Fair/Poor”) is lower in Henderson (12%) than nationally (18%).
Interpreted for the Master Plan, these results indicate system-wide asset quality and maintenance practices that are outperforming peers; the relatively small “Fair/Poor” tail suggests a manageable set of
NEEDS & PRIORITIES
TOP PRIORITIES FOR INVESTMENT FOR FACILITIES/AMENITIES BASED ON PRIORITY INVESTMENT RATING (PIR)
3.26 - PIR rankings for facilities/amenities.
UNMET NEEDS RATING FOR FACILITIES/AMENITIES
3.27 - Unmet needs ratings for facilities/amenities.
Figure
Figure
PART THREE
sites or components where targeted reinvestment (e.g., surface renewal, shade, restrooms, ADA path continuity) can close remaining condition gaps.
2. OVERALL CONDITION OF PROGRAMS & EVENTS
Program and event quality is a distinct strength. Henderson shows 39% “Excellent” and 54% “Good,” compared with 36% and 49% nationally. Negative ratings are minimal in Henderson (6% “Fair,” 1% “Poor”) relative to the national profile (12% and 3%). This translates to 93% “Excellent/Good” in Henderson versus 85% nationally, and a halving of bottom two responses (7% vs. 15%).
From a planning perspective, Henderson’s program delivery model (instructional quality, safety, customer service, and evaluation routines) is performing at a high level; the priority is to preserve these quality controls while addressing capacity constraints where demand routinely exceeds supply (e.g., additional sessions, expanded hours, geographic replication of top performing offerings).
Overall satisfaction with value of programs/activities Henderson also leads on perceived value: 29% “Very satisfied” and 45% “Satisfied,” compared with 25% and 37% nationally. Neutral responses are notably lower in Henderson (20%) than nationally (34%), indicating residents are more decisively positive. A small nuance is that Henderson’s combined “Dissatisfied/Very dissatisfied” (6%) is modestly higher than the national benchmark (3%).
The overall takeaway is a strong value proposition (+12 percentage points on top two satisfaction vs. national), with a small cohort experiencing friction points—often price sensitivity for specific programs, schedule/access conflicts, or registration usability— that merit targeted solutions rather than systemwide change.
For the Master Plan, this suggests stress testing the fee and equity policy (e.g., targeted discounts, low demand time pricing), improving temporal and geographic access, and refining the digital enrollment experience to convert remaining neutral or dissatisfied users.
3. BENCHMARKING CONCLUSIONS
Across all three benchmarks, Henderson outperforms ETC’s national norms, indicating a mature system delivering above average asset condition, program quality, and perceived value. The Master Plan should therefore focus on:
+ Protecting the core advantage (condition based capital reinvestment and preventive O&M)
+ Scaling what works (replicating high performing programs and adding capacity where waitlists persist)
+ Surgically addressing pockets of dissatisfaction (pricing and access refinements, site specific upgrades, and registration UX).
These benchmarks also establish baseline performance targets (e.g., ≥87% top two facility condition, ≥93% top two program condition, ≥74% top two value) for ongoing monitoring and continuous improvement.
NEEDS & PRIORITIES
TOP PRIORITIES FOR INVESTMENT FOR PROGRAMS/ACTIVITIES BASED ON PRIORITY INVESTMENT RATING (PIR)
3.28 - PIR rankings for programs/activities.
UNMET NEEDS RATING FOR PROGRAMS/ACTIVITIES
3.29 - Unmet needs ratings for programs/activities.
Figure
Figure
PART THREE
B. ADDITIONAL PARKS & FACILITIES IN WEST HENDERSON
The single highest ranking need across the entire assessment is the call for additional parks and recreation facilities in West Henderson. This priority emerged in nearly all lines of evidence: community workshops, stakeholder interviews, facility and site analyses, and demographic and financial assessments. West Henderson, centered largely in Ward II, contains many of the city’s newest master planned communities and is projected to continue absorbing a significant share of Henderson’s household and population growth through 2050.
Demographic analysis describes a “barbell” pattern in this area—large numbers of active older adults in age restricted communities alongside many families with children in new neighborhoods. This mix drives demand for diverse amenities: pickleball and court sports, youth sports fields, trails, and lap/low impact aquatics, as well as indoor spaces that support both daytime senior use and after school and evening youth activity. Stakeholders repeatedly emphasized that existing parks, while growing in number, are not yet matched with city provided facilities such as indoor recreation centers and aquatics complexes, leaving West Henderson under served compared to more established parts of the city.
Although developers have delivered numerous neighborhood and community parks as part of new master planned communities, these are primarily outdoor, neighborhood scaled sites. They do not typically include large indoor recreation centers, gymnasiums, or aquatics facilities—assets that the City must plan, fund, and operate. At the same time, growth related park expansions in West Henderson are increasing long term operations and maintenance obligations for P&R, often without corresponding O&M funding as “turnkey” parks transfer to the City. This combination of rapid growth, limited indoor capacity, and rising O&M responsibilities is why new parks and facilities in West Henderson emerged as the top system-wide need.
C. RENEWAL OF THE EXISTING DEDICATED TAX OVERRIDE
The second highest priority need is to renew—and potentially extend or adjust—the existing 12 cent dedicated property tax override that has supported Henderson’s parks and recreation system since 1997. This revenue stream has grown into the backbone of P&R’s operating budget, accounting for roughly 40% of annual operations and maintenance funding and underpinning many of the improvements and service expansions achieved over the past three decades.
Stakeholders were nearly unanimous in describing extension or enhancement of this tax override as essential to sustaining current service levels, keeping pace with growth, and avoiding significant reductions in programs, maintenance, and facility operations. Financial and operations assessments reinforce this concern: operating costs are rising 4–10% annually due to wage pressures, utilities, and maintenance costs, while new capital projects, like the planned Cadence Sports Park in West Henderson, bring additional ongoing O&M obligations once opened.
The override is scheduled to sunset in 2027 unless renewed by voters. Given the scale of Henderson’s existing system, projected population growth, and the lack of an equivalent replacement revenue source, the needs assessment concludes that renewal of the dedicated tax override is fundamental. Without it, the City would face either substantial cuts to parks and recreation or a major reallocation of general fund dollars, both of which would undermine many of the other high priority needs identified in this process.
Figure 3.30 - Arroyo Grande Sports Complex (COH, n.d.).
D. YOUTH PROGRAMS
Youth programs surfaced as a high priority need across engagement and data driven techniques alike. Residents consistently described youth programming as central to why parks and recreation matter to them—providing safe places for children to be active, learn new skills, and spend time with family and friends. Program data show that youth oriented offerings such as Battleborn Kids, aquatics, and youth sports leagues are among the largest program families in terms of activities delivered, enrollments, and revenue generation.
Despite this success, capacity has not kept pace with demand. Waitlist analysis revealed that unmet demand and “missed revenue” are heavily concentrated in aquatics and youth programs, including Battleborn Kids, Safekey, and ABC. Community workshop exercises echoed these findings: youth athletic leagues, science and technology programs, nature and environmental education, youth camps, and before/after school programs all ranked among the most requested but under met programming needs.
As Henderson’s population grows—and as more families settle in growth areas like West Henderson— the system will need both more program capacity and more locations at which youth programs are offered. Because these offerings also generate strong revenues and support broader social goals—safer after school hours, academic enrichment, and family stability—the assessment treats expanded youth programming as a keystone need that interacts with facility expansion, indoor capacity, and funding strategies.
E. INCREASED RESILIENCE TO EXTREME HEAT AND DROUGHT
Given Henderson’s desert context and rapidly intensifying climate conditions, increasing the resilience of parks and recreation assets to extreme heat and prolonged drought emerged as a core system-wide need.
The City is already advancing an aggressive resilience agenda—converting high water turf to drought tolerant grasses and native plant palettes, removing nonfunctional turf, modernizing irrigation controls, and using parks and recreation centers as part of the community’s heat and emergency response network.
Resiliency audits of 35 park sites highlighted both progress and remaining vulnerabilities: landscape performance is generally above baseline, but irrigation efficiency, heat retaining surfaces, and inconsistent shade coverage at core amenities remain recurring challenges.
Residents and workshop participants repeatedly identified extreme heat as the single greatest barrier to park and program use, far surpassing cost, parking, or safety concerns. This reality is changing how and when people recreate—shifting use toward evenings and increasing demand for indoor, climate controlled spaces. The needs assessment therefore frames heat and drought resilience not as a single project, but as an organizing principle for design, construction, programming, and operations going forward.
F. ADDITIONAL INDOOR RECREATION CENTERS
Closely linked to growth and climate conditions is the need for additional indoor recreation centers. Program and facility data show that a disproportionate share of all registered activities, enrollments, and revenue occurs at the Henderson Multigenerational Center and four major recreation centers (Valley View, Black Mountain, Whitney Ranch, and Silver Springs). These buildings already operate near or at practical capacity during peak times, and analyses recommend exploring
PART THREE
incremental capacity through denser scheduling and shared spaces—yet even with such measures, space will remain a constraint.
Community workshops and surveys underscored strong demand for new indoor amenities: gyms and multi purpose courts, walking tracks, indoor pools, flexible studios, event spaces, and art and esports rooms. Stakeholders specifically called out the need for a new indoor recreation center in West Henderson, both to address geographic equity and to serve fast growing neighborhoods that currently rely on facilities in other parts of the city.
The needs assessment highlights indoor centers as critical year round infrastructure in a warming climate—places where residents of all ages can access fitness, aquatics, court sports, drop in recreation, and social connection when outdoor conditions are unsafe or uncomfortable. It recommends adding flexible, multi generational indoor capacity in gap areas, alongside operating strategies (early mornings, later evenings, and weekends) that reflect how residents actually use these facilities during heat season.
G. IMPROVE, ACTIVATE, AND/OR UPDATE AGING EXISTING FACILITIES
While Henderson has done an impressive job building out a large and high performing park system over the past 30 years, many of the parks and facilities constructed in the late 1990s and early 2000s are now reaching an age where substantial reinvestment is needed. The introduction notes that as the system matures, more assets require renewal or full renovation, increasing lifecycle and maintenance costs.
Resiliency audits and site evaluations of older parks illustrate the types of issues that are emerging: outdated playground equipment and surfacing, limited or absent shade structures over play areas, nonfunctional or aesthetic turf that is out of step with drought mandates, inefficient irrigation (sometimes watering pavement or dead plant material), inconsistent or non LED lighting, and amenities whose design no longer matches current recreation preferences. These sites are typically
well maintained day to day, but their underlying design and materials make them less resilient to extreme heat and drought and less aligned with contemporary expectations.
The community workshops strongly reinforced a “fix it first” message: residents want comfort, safety, and convenience improvements at the parks they already use, including upgraded restrooms, drinking water access, shade, and refreshed play and gathering spaces. Without carefully planned reinvestment, older parks risk falling behind newer facilities, creating a perceived inequity between legacy neighborhoods and recently developed master planned areas. Modernizing and activating existing parks is therefore treated as a top tier need, not a secondary concern.
Figure 3.31 - Kids diving for Easter eggs (COH, n.d.).
H. EXPANDED CAPACITY FOR INDOOR AQUATICS
Aquatics emerged as both a major strength and a pressure point for the system. Program analysis shows that aquatics—along with Battleborn Kids— represents one of the largest program families in terms of activities offered, enrollments, and revenue. At the same time, waitlists and “missed” revenue are particularly concentrated in aquatics, indicating that demand exceeds available pool time and instructional capacity, especially during peak seasons.
Community engagement consistently prioritized learn to swim and water fitness programs, which ranked high among both desired programs and high priority investments in the statistically valid survey
and workshop dot exercises. In a climate where summer temperatures routinely reach dangerous levels, residents increasingly rely on aquatics not only for recreation, but also for cooling, exercise, and safety—particularly for children learning to swim.
Existing outdoor pools, while highly valued, are themselves vulnerable to extreme heat; maintaining safe water chemistry and comfortable water temperatures becomes more difficult during the hottest periods. Facility resiliency assessments point to the need for improved shading, energy performance, and mechanical systems at existing aquatics centers, and financial analysis notes that new facilities (including a planned West Henderson outdoor aquatics facility) will add significant O&M costs. Together, these findings support the conclusion that expanded indoor aquatics capacity—especially in growth areas currently lacking any aquatics facilities—will be necessary to meet demand reliably and safely across the full year.
I. EXPANDED CAPACITY FOR BEFORE AND AFTER SCHOOL PROGRAMS
Before and after school programs—such as Safekey, Teen Scene, Battleborn Kids, and ABC—are a cornerstone of Henderson’s parks and recreation role in community well being. P&R operates these programs across local school campuses, providing affordable, below market rate care for children of working parents, alongside enrichment, recreation, and social connection.
Program analytics show that these youth enrichment programs are among the system’s strongest demand and revenue drivers, yet they consistently operate at or beyond capacity, with significant waitlists that translate into unmet community needs and foregone revenue. Community workshops ranked before/after school programs as a top unmet program type, and stakeholders repeatedly highlighted childcare and early learning as priority areas.
PART THREE
Because these services sit at the intersection of recreation, education support, and economic stability for families—especially lower income households— the assessment treats additional capacity for before and after school programming as a high priority need. Addressing it will require both more physical space (in schools and centers) and sufficient staffing and operating funding to add class sections, extend hours, and expand to additional sites in growing neighborhoods.
J. ADDITIONAL SHADED AMENITIES AND PARK SPACES
Additional shade—both natural and built—was one of the most consistent themes across the needs assessment. Resiliency audits found that, while overall comfort and activation scores are above baseline, scores for shade at seats, swings, and core amenities (playgrounds, courts, gathering areas) are only moderate, not strong. Landscape and materials analyses also pointed to pockets where darker pavements, limited tree canopy, and high heat furnishings combine to create elevated radiant heat at the pedestrian scale.
Site level evaluations document both the benefits and gaps of current shading strategies. Newer parks like Aventura and Capriola demonstrate how shade structures, mature trees, splash pads, and high SRI furnishings can create comfortable microclimates, while older parks often lack shade over playgrounds and spectator areas, use darker surfacing, or rely heavily on turf that is costly to irrigate and, in some cases, only minimally functional.
Workshop participants identified extreme heat as the dominant barrier to using parks and programs more often, and stakeholder interviews emphasized shade availability as a top concern. The needs assessment therefore frames shaded amenities—such as picnic shelters, shade sails, and strategically located drought tolerant trees—as essential, not optional, infrastructure. Core amenities like playgrounds, outdoor fitness equipment, and seating areas must be designed or retrofitted so that at least a portion of the day they are safely usable even during the hottest months.
K. ADDITIONAL FUNDING FOR MAINTENANCE AND OPERATIONS COSTS
As Henderson’s system has expanded—often through partnerships with private developers who have built $100M+ of parks as part of new communities—the long term responsibility for operating and maintaining these assets rests entirely with the City.
Rising labor, utility, and material costs, coupled with more complex facilities and the additional wear associated with extreme heat, mean that maintenance and operations expenditures are projected to grow faster than inflation. At the same time, many existing parks are entering a phase where major renovations—playground replacements,
Figure 3.32 - Potenza Park playground (2025).
NEEDS & PRIORITIES
irrigation upgrades, lighting conversion, and comfort improvements—are necessary to maintain safety and relevance.
Stakeholders and staff noted that maintenance teams already manage high acre to staff ratios and that deferred renewal could quickly erode the hard won quality of the system.
With continued growth in areas like Cadence and West Henderson and new facilities such as aquatics centers coming online, the assessment concludes that a more sustainable, diversified approach to funding operations and maintenance is a high priority need. This includes not only renewal of the dedicated tax override, but also exploring complementary tools such as cost recovery policies, partnerships, and potentially new revenue mechanisms targeted to long term care of park assets.
L. ADDITIONAL OPPORTUNITIES FOR INDOOR FITNESS AND WELLNESS
Finally, the assessment identifies expanded opportunities for indoor fitness and wellness as a high priority need, especially in the context of an aging yet active population and a warming climate. Henderson’s median age (~42.2) is higher than that of the county and neighboring cities; about 20% of residents are 65 or older, while roughly 21% are under 18—creating strong simultaneous demand for both senior friendly and youth oriented recreation.
The statistically valid survey and workshop exercises ranked adult fitness/wellness and water fitness programs among the highest priority program types—both in terms of unmet need and importance for future investment—alongside special events and programs for seniors.
Stakeholders similarly emphasized the importance of health, wellness, and mental health supportive programming, particularly for older adults and caregivers, and noted the need for indoor spaces that can flex between group exercise, low impact classes, and multi generational use.
Extreme summer heat further shifts demand toward indoor fitness options, as outdoor exercise can be uncomfortable or unsafe for much of the day. The needs assessment therefore calls for expanded indoor fitness and wellness capacity—both within existing centers through better space utilization and in new or expanded facilities—to support active older adults, multi generational families, and residents seeking safe, climate controlled spaces to stay healthy year round.
The preceding needs assessment process was intentionally designed to move beyond any single data source or engagement technique and instead triangulate findings across multiple (12) techniques. Through stakeholder interviews, focus groups, a citywide series of public workshops, multiple resident surveys (including a statistically valid survey), and multiple technical analyses, the planning process established a clear and defensible understanding of what matters “most” to Henderson residents today.
This Vision chapter translates those needs and priorities into a long-range direction for the Henderson Parks and Recreation Department. It is not simply aspirational; it is intended to be a practical framework for decision-making—helping ensure that future investments, policies, partnerships, and operational changes are consistently aligned with the community’s highest priorities. In short, the Vision serves as the “north star” for the Master Plan, describing what the system must become to remain relevant, resilient, and high-performing as Henderson continues to grow and evolve.
Importantly, this Master Plan update recognizes that Henderson’s parks and recreation system is far more than “fields and facilities.” The system is a defining community asset and an essential component of community well-being, public health, climate resilience, and quality of life.
As the city faces intensifying extreme heat, chronic drought, and continued development pressure, the Vision is designed to guide investments toward outcomes that matter most—such as safe and comfortable park access, equitable service delivery, modernized aging assets, expanded indoor options during extreme weather, and long-term fiscal and operational resilience.
B. VISIONING WORKSHOP
The framework for the Master Plan Vision was established through a hands-on, collaborative workshop process in which the Project Team worked directly with P&R, representatives from City government, and key stakeholders to develop high-level strategies that respond to the priority needs identified in Parts 2 and 3 of this report. This approach ensured that the Vision did not emerge in isolation, but rather as a shared, implementable direction grounded in analysis and shaped through active participation.
The Project Team held Master Plan Visioning sessions on May 7 and 8, 2025, at the Black Mountain Recreation Center in Henderson. The workshops began with a synthesis presentation of Existing Conditions and Needs Assessment findings to confirm a shared understanding of the highest priority needs and the factors driving them. From there, the sessions transitioned into a charrette-style working format focused on translating priorities
PART FOUR
into solution sets. Consistent with the plan’s overall methodology, the Vision phase was explicitly built to convert identified needs into strategies for existing parks and programs, new parks and amenities, trail and active transportation connectivity, natural lands and open space, and comprehensive resilience.
Workshop participants included members of the Henderson Parks and Recreation Department executive management team, the Henderson Parks and Recreation Board, and representatives from Park Operations and Maintenance, Park Planning, Recreation Programs, and Facilities Management divisions. Sign-in sheets and agendas from the Visioning sessions are included in Section 6.4 of the Appendix.
C. DEPARTMENTAL PURPOSE STATEMENT
An early task of the visioning process was to revisit P&R’s existing purpose statement to ensure it accurately reflects both the Department’s role in Henderson today and the outcomes the community increasingly expects from parks and recreation. The planning process began with a discovery phase centered on shared purpose and success metrics, during which P&R’s existing purpose statement was reviewed and refined to align with Henderson’s values and with broader City frameworks.
The existing (2024) purpose statement for the Henderson Parks and Recreation Department is:
“Our purpose is to provide diverse and innovative recreation and cultural opportunities through premier parks, trails, facilities and by protecting natural resources.”
The consensus of workshop participants was that this statement, while accurate in describing what P&R manages and delivers, does not fully convey the magnitude of the Department’s contribution to overall quality of life and community outcomes. In response, the Project Team conducted a branding workshop with Department leadership and staff to update the purpose statement—intentionally
placing greater emphasis on P&R’s community-wide impacts and the benefits it delivers, not only the assets it operates.
The proposed updated purpose statement for the City of Henderson Parks and Recreation Department, subject to further internal refinement and adoption, is:
“We connect our community through exceptional experiences.”
This statement is intentionally outcome-oriented. It frames parks and recreation as a community enrichment service that supports a quality of life above baseline. It emphasizes two core pathways for impact: “Connect our community” and “exceptional experiences”.
“Connect our community” reflects both P&R’s role as an essential service provider and its role in connecting residents physically (to parks, trails, and facilities) and socially (to each other through programs, events, and shared spaces). This framing aligns with the Master Plan’s broader emphasis on communicating the value of parks and recreation in terms that resonate with community outcomes (health, equity, resilience, belonging, and economic vitality).
“Exceptional experiences” communicates that P&R’s parks, facilities, trails, programs, and services are designed and delivered to provide consistently high value to participants and the community, not simply to be “available,” but rather truly exceptional in quality, outcomes, and user experience. This is consistent with P&R’s long-established national reputation, including being a two-time National Gold Medal Award winner (1999 and 2014) and the only CAPRA-accredited agency in Nevada.
D. VISION SUBSYSTEMS
To ensure the Vision is clear, actionable, and easy to implement, it is organized into “Vision Subsystems”— groupings of aligned recommendations and initiatives that collectively represent an “appropriate response” to the highest priority needs identified through the needs assessment and existing conditions analysis. The intent is to provide P&R and City leadership with a structured framework for decision-making, budgeting, partnership development, and project sequencing.
In this Master Plan Update, the Vision is organized into the following subsystems:
1. Improving & Activating Existing Parks – Responds to the reality that many of Henderson’s parks and facilities are aging into higher lifecycle-cost phases and require reinvestment to remain safe, accessible, and aligned with contemporary expectations.
2. Resilient by Design – Establishes park and facility design strategies that directly respond to Henderson’s climate realities, recognizing that extreme heat is consistently identified as the single greatest barrier to park and program use. This subsystem focuses on increasing shade and thermal comfort, adding cooling and hydration amenities, improving materials and surfaces, and accelerating watersmart landscapes and irrigation modernization—so parks remain usable, safe, and relevant year-round.
3. New Parks – Addresses the continued need to deliver new parks and recreation assets in growth areas while ensuring that new facilities are designed with lifecycle stewardship and operational realities in mind. This subsystem prioritizes park access and distribution, high-demand amenities, connectivity to trail networks, and scalable park models that can be delivered efficiently and maintained sustainably over time.
4. Operations and Finance – Recognizes that the long-term performance of the parks system depends on the City’s ability to maintain what it has— especially as the system grows and facilities become more complex. The needs assessment underscores operations and maintenance funding as a highpriority issue, noting rising costs, increasing wear
under extreme heat, and the ongoing responsibility borne by the City even when capital delivery occurs through partnerships.
5.Programs & Events – Builds on strong community interest in both destination-quality special events and dependable, affordable programs that support families, seniors, and teens. This subsystem emphasizes equitable programming distribution, expanded offerings during heat season (including evenings and indoor-focused programming), and continued innovation in how programs are delivered to maximize participation and community benefit.
6.Connectivity – Is a core vision subsystem focused on how residents and visitors access, move between, and navigate within Henderson’s parks, trails, and recreation facilities. As the City continues to grow and diversify, the value of the parks and recreation system will increasingly depend not only on the quality of individual destinations, but on the quality, safety, comfort, and continuity of the routes that connect them.
7. Indoor Recreation – Responds to increasing demand for additional indoor, climate-controlled recreation capacity in a warming climate and a growing city. This subsystem establishes strategies for improving indoor capacity—through both better utilization of existing facilities and development of new indoor recreation opportunities in geographic gaps—so Henderson residents have reliable yearround access to fitness, aquatics, court sports, dropin recreation, and social connection.
Together, these Vision Subsystems provide an integrated framework that links community priorities to physical projects, operational strategies, and policy direction. In Part 5 of this report, these recommendations and initiatives are further organized into an Action Plan that sequences implementation into near-, mid-, and long-term initiatives and considers order-of-magnitude cost and operational implications to support fiscally responsible progress
PART FOUR
AGE BY PARK TYPOLOGY
irrigation upgrades, lighting conversion, and comfort improvements—are necessary to maintain safety and relevance.
In other words, Henderson’s “next chapter” is less about adding isolated amenities and more about adopting a proactive, programmatic reinvestment model that preserves system quality, improves comfort and usability in a warming climate, and reduces the long-term fiscal shock of deferred renewal.
A critical contextual factor is the desert environment and Henderson’s climate trajectory. Extreme heat has been consistently identified as the dominant barrier to more frequent park and program use, changing how and when residents recreate and increasing the importance of evening use and climate-adapted park design.
B. THE “NEW MODEL”
Over the last decade, Henderson’s newer parks have established a higher—and meaningfully different— standard for what residents expect as “normal” in neighborhood and community parks. These newer parks reflect contemporary expectations for universal access, heat resilience, multi-generational use, and diverse amenities. They are also informed by evolving water constraints and the need to deliver comfort – and safety - in extreme summer conditions.
Last update 12/18/2025
1. DESIGN & PROGRAMMING DIFFERENCES
https://frmwrkplanningdesign.sharepoint.com/sites/00_ADMIN/Shared Documents/02_PROJECTS/2024/24P001 - HENDERSON PARKS MP/01_PROJECT FILES/01_DESIGN DOCS/02_ANALYSIS/2.1 DEPARTMENT OVERVIEW/2025 PARK INVENTORY/
This climate reality intersects directly with legacy parks, where shade coverage, surface materials, and irrigation practices were often designed around older expectations and may now require systematic updates to remain functional and welcoming for a broader portion of the year.
The “new model” of Henderson parks is characterized by intentional comfort, layered programming, and built features that support longer daily and seasonal use windows. A representative example is Montagna Park, described in the resiliency site evaluations as “brand new and in excellent condition,” with amenities such as a splash pad, destination playground, soft-surface nature trails, LED lighting, multiple large shade structures, accessible play features, multi-use path connections, and a spacious off-leash dog area. This is a markedly different programming profile than many older neighborhood parks, which were often designed around fewer amenities and a more uniform “kit-ofparts” approach.
Figure 4.1 - Park age by typology.
Legacy parks, by contrast, often reflect earlier assumptions about recreation patterns, climate comfort, and accessibility. In many cases, they include amenities that are now underutilized (or no longer reflect current recreation preferences) and lack the types of comfort infrastructure that residents increasingly view as prerequisites for everyday use. The Needs Assessment highlights these patterns at older parks, including limited or absent shade structures over play areas, older surfacing materials, and lighting that may not support safe and comfortable evening use.
A site-level example is Puccini Park, which benefits from large shade trees and some shaded seating near courts, but also illustrates typical legacy challenges: limited lighting, minimal wayfinding, turf areas with minimal recreational value, and no shade structure over the playground (with only passive shade from trees).
The practical takeaway for the Master Plan is that Henderson’s reinvestment approach must be calibrated to close the “expectation gap” between newer and older parks—especially where legacy neighborhood parks serve established communities that should not feel left behind as investment and amenity innovation occurs in newer master planned areas.
This “fix it first” message was strongly reinforced through community engagement, which emphasized that without carefully planned reinvestment, older parks risk falling behind newer facilities and creating a perceived inequity between legacy neighborhoods and recently developed areas.
2. AESTHETIC DIFFERENCES: FROM “GREEN OASIS” TO DESERT-RESILIENT PLACE
Newer parks in Henderson increasingly embrace a desert-resilient aesthetic—more xeric landscapes, more native-appropriate palettes, and a stronger alignment with long-term water realities. This shift is not only stylistic; it reflects the growing importance of water-efficient landscapes and the need to prioritize irrigation for high-value uses. The systemwide resiliency work and supporting technical studies recognize the importance of reducing nonfunctional turf and aligning landscapes with drought mandates and best practices.
Legacy parks often reflect a different era of expectations—one where the park experience emphasized broad turf areas and ornamental landscapes to create an oasis-like contrast to the desert. While those parks can be beloved and contribute meaningful tree canopy in established neighborhoods, they can also represent a higher long-term water and maintenance burden,
Figure 4.2 -Montagna Park (2025)
PART FOUR
particularly where turf is primarily aesthetic or only marginally functional. The Needs Assessment flags nonfunctional turf and inefficient irrigation as recurring issues at older sites. As Henderson continues adapting to long-term water constraints, legacy parks will increasingly need targeted turf conversion, irrigation modernization, and strategic shade planning to retain comfort while reducing water intensity.
Henderson’s newer parks are often more maintenance-intensive—not because they are poorly designed, but because they contain more amenities, more specialized equipment, and more complex systems (lighting, splash pads, dog parks, shade structures, and advanced irrigation controls). Montagna Park’s evaluation explicitly notes that the abundance of complex site elements suggests a high level of regular maintenance will be required as the park and its amenities age.
At the system-level, this operational reality is reinforced by the Needs Assessment: the combination of rising labor, utility, and material costs, more complex facilities, and additional wear associated with extreme heat means that maintenance and operations expenditures are projected to grow faster than inflation.
This makes proactive reinvestment planning essential, because parks that fall behind on routine lifecycle replacement (playgrounds, irrigation, lighting, shade structures, surfaces) tend to become exponentially more expensive to “catch up” later— especially across the large cohort of parks now in the 21 to 30-year age segment.
For legacy parks, maintenance intensity presents differently: older parks may have simpler systems in some respects, but the cumulative impact of aging infrastructure, outdated surfacing, older lighting, irrigation inefficiencies, and higher-water landscapes creates both ongoing maintenance burden and longterm replacement liability. The Needs Assessment underscores that many older parks are “well maintained day to day,” yet their underlying design and materials can make them less resilient
C. ACTIVATION
Why Activation Matters (and What It Should Achieve)
As parks age—and as the neighborhoods around them evolve—activation becomes essential to maintaining relevance, equity, and daily value. “Activation” is not limited to programming and events (though that matters); it also includes the physical upgrades that make parks comfortable, safe, and usable across seasons and times of day, as well as the ongoing adjustments that ensure park amenities align with current user groups and recreation preferences.
The Needs Assessment provides clear direction: residents want retrofits that deliver comfort, safety, and convenience in the places they already frequent—particularly the City’s older existing park sites. Workshop participants emphasized that shade, cooling opportunities, hydration, clean and accessible restrooms, lighting, seating, and clear wayfinding are viewed not as “nice to have,” but as prerequisites for daily use—especially for families with young children, older adults, and those sensitive to heat.
This aligns with the broader finding that extreme heat is one of the dominant barriers preventing residents from using Henderson’s parks and programs more often, reshaping demand toward evening use and reinforcing the need to organize park investment around heat and drought resilience.
Activation also supports system trust and user satisfaction. Survey results show that maintenance of parks and trails and security in parks and trails rank among residents’ most important factors when using parks and recreation services. In practical terms, physical upgrades must be paired with maintenance commitments, and programming/ activation strategies must be paired with safetyby-design (lighting, sightlines, adjacency, and clear park “legibility”) so that improved amenities actually translate into higher use and higher perceived value.
Finally, activation is a key equity strategy. If newer parks continue to set the quality benchmark for comfort, amenities, and universal design, then legacy parks—especially those serving established neighborhoods—must be incrementally upgraded so residents across Henderson experience a consistent
baseline of park quality and usability. Older, legacy parks risk falling behind without carefully planned reinvestment, contributing to perceived inequities between legacy neighborhoods and newer master planned areas.
1. HIGH PRIORITY IMPROVEMENTS & AMENITIES
When legacy parks include outdated, underutilized, or mismatched amenities, P&R should treat renewal projects as opportunities to replace those elements with improvements that better align with contemporary demand, climate comfort needs, and inclusive design expectations.
The high-priority activation upgrades for legacy parks should be guided by two complementary inputs:
+ Recurring themes from the triangulated needs assessment (comfort, heat resilience, safety, and modernization), and
+ The specific amenities residents and stakeholders identified as important but currently under-served.
Based on the findings of the needs assessment theme, the following improvements should be considered high priority when undertaking replacements and upgrades in legacy parks:
A. Modernized and inclusive play:
+ Additional swings at playgrounds (including adaptive/inclusive swings).
+ Inclusive play features integrated throughout play areas (sensory, accessible, multi-generational elements).
+ Replacement of outdated playground equipment and surfacing, especially where heat-retaining surfaces create comfort and safety concerns .
B. Comfort and heat resilience as “core infrastructure:”
+ Shaded playgrounds, shaded seating, and shaded gathering areas (structures and strategically located drought-tolerant trees).
+ Added drinking water access (including bottle fillers and pet bowls).
+ Expanded or improved restrooms and wayfinding where gaps exist, consistent with workshop priorities for everyday usability.
C. Cooling and warm-season activation:
+ Splash pads as both play and cooling infrastructure.
+ Targeted cooling microclimates at high-use nodes (shade + water + seating + high-reflectance materials), especially where parks function as neighborhood “daily use” spaces.
D. Courts, fitness, and multi-generational activity:
+ Pickleball courts (especially where demographic patterns support strong demand).
+ Outdoor fitness “nodes” located under shade and paired with loop paths and hydration (to support older-but-active and multi-generational users).
+ Outdoor adventure/challenge (“ninja”) courses that appeal to youth and teens and diversify park activity beyond traditional play structures.
E. Evening usability and safety:
+ Additional site lighting to support safe evening use of key amenities (courts, fields, playgrounds, and primary walking loops).
+ Lighting conversion/modernization at parks with inconsistent or non-LED lighting systems (identified as a recurring legacy park issue).
PART FOUR
F. Trails, walking loops, and nature-based access:
+ Internal looping walking paths with distance markers and frequent seating, supporting older adults, families, and daily exercise needs.
+ Unpaved, soft-surface walking/hiking trails within parks (also elevated as a high-priority facility investment category).
G. Dog amenities and neighborhood social infrastructure:
+ Dog parks and smaller off-leash dog runs integrated into existing parks where appropriate and feasible (highly requested in workshops).
H. Identity, culture, and place-specific experience:
+ Outdoor public art and interpretive/cultural elements, especially where a refreshed identity can support activation, pride, and wayfinding consistency (and where parks can better reflect the unique character of surrounding neighborhoods).
Across all of the above, the “activation lens” should prioritize improvements that extend usable hours and seasons (shade, lighting, hydration, surfaces) and that increase the diversity of age groups served—especially in legacy parks located in areas where household composition has shifted over time.
2. PROCESS & COMMUNITY ENGAGEMENT
Improving legacy parks requires a different—and more sensitive—process than designing new parks in future-growth areas. Unlike developer-delivered turnkey parks, existing park improvements take place in lived-in neighborhoods where residents have established patterns of use, strong attachments to park identity, and understandable concerns about losing valued features (even when those features are no longer sustainable or widely used).
For this reason, a localized, community-anchored engagement approach for major renovations and redesigns of existing parks should be embraced by P&R. Engagement should occur early enough to shape program direction—not simply to validate a near-final concept. This approach aligns with the Needs Assessment’s “fix it first” direction and the broader emphasis on removing barriers to use through comfort, safety, convenience, and clear communication.
A recommended engagement and delivery process for legacy park improvements includes:
Park-specific listening and confirmation of priorities (with surrounding residents and key user groups) before design begins, to validate which amenities are underperforming and which new amenities would deliver the greatest community value.
A transparent explanation of constraints and tradeoffs, especially around water, heat, accessibility, operations, and long-term maintainability—so that changes like turf reduction or amenity replacement are understood as resilience and usability upgrades, not “losses.”
Iterative concept design with visible decision points, providing opportunities for the community to see multiple options and understand how input shaped outcomes.
A clear maintenance and operations plan accompanying capital upgrades, reflecting community priorities for maintenance and security as core drivers of park use.
Figure 4.3 - Off-leash dog area at Dos Escuelas Park (2025).
3. RECOMMENDATIONS – ACTIVATION
While this engagement-forward approach is less ešcient than a purely internal design process, it is essential for building long-term trust, minimizing controversy, and increasing the likelihood that renovated parks are embraced, used frequently, and perceived as equitable investments in established neighborhoods.
A. Adopt “fix-it-first” activation standards for legacy parks.
1. Establish activation readiness standards - Define a minimum, citywide baseline of comfort, safety, and convenience features that must be present for an existing park to be considered “activation-ready.”
2. Align standards with community-defined prerequisites - The needs assessment indicates that residents view shade, cooling opportunities, hydration, clean and accessible restrooms, lighting, seating, and clear wayfinding as prerequisites for everyday park use—especially given Henderson’s extreme heat conditions.
3. Develop and apply an “Activation Readiness Checklist” - To operationalize “fix-it-first,” P&R should create an Activation Readiness Checklist for Legacy Parks that includes, at a minimum:
A. Shade at primary destinations and core amenities (e.g., playgrounds, seating areas, courts, and gathering spaces).
B. Convenient hydration access for people and pets (e.g., bottle fillers and pet bowls).
C. Restroom condition and accessibility (where restrooms are appropriate to the park’s typology and use).
D. Pedestrian-scale lighting in key park areas and at amenities intended for nighttime/earlymorning use.
E. Shaded, comfortable seating and gathering nodes, including ADA-accessible seating options.
F. Clear park entry identification and internal wayfinding signage.
Figure 4.4 - Monument signage with a lighted and shaded playground beyond at Capriola Park (2025).
PART FOUR
B. Create park activation capital improvement plans for aging legacy parks.
1. Implement activation-focused, CIP-ready planning for older parks - Establish a repeatable, defensible process that identifies the right improvements in the right legacy parks—sequenced, scoped, and budgeted—so reinvestment is proactive, equitable, and measurable.
2. Prepare park-specific activation CIPs that:
A. Identify underutilized, outdated, and/or poorcondition amenities that should be removed, replaced, or modernized at each site.
B. Prioritize recommended improvements and develop planning-level cost estimates that can be incorporated into the City’s Capital Improvement Plan (CIP) based on urgency and impact.
C. Apply an equity lens when selecting and prioritizing sites by considering age/condition and retrofit readiness, heat and comfort gaps, access to everyday recreation and programming, and geographic distribution of investments.
D. Prioritize park sites that meet criteria aligned with life-cycle and reinvestment assessments, including:
+ parks that are at least 15 years old and have not received a major renovation within the past 10 years,
+ parks located in areas that have experienced significant demographic change since the park was developed, and/or
+ parks that have recently undergone turf removal projects that reduced perceived “community greenspace,” resulting in underutilized or functionally vacant areas.
C. Replace underutilized, single-use sports courts with multi-use courts.
1. Over time, shift neighborhood courts toward flexible, multi-use formats - As legacy parks are renovated, prioritize multi-use courts at smaller neighborhood parks, while concentrating competition/tournament-quality courts at larger community or regional parks where critical mass can support expanded programming, organized play, and more efficient maintenance.
2. Design multi-use courts to maximize shared infrastructure - Multi-use courts can support recreation-level play for multiple activities within a smaller footprint and can be designed to accommodate combinations of pickleball, tennis, volleyball, basketball, and futsal—potentially with lighting to extend use into the evening.
3. Increase utilization while reducing redundancy - This approach serves both casual users and more competitive players, while enabling shared pavement, fencing, lighting, and support amenities—reducing duplication and improving cost efficiency over time.
D. Consider adopting a centralized delivery model for underutilized neighborhood-scale amenities.
1. Replace under-utilized, low-demand amenities more relevant and flexible offerings - Many legacy parks include small quantities of stand-alone amenities (e.g., one or two bocce courts or horseshoe pits) that tend to be underutilized and offer limited programming capacity.
2. Relocate select amenities to “hub” locations as parks are improved over time - When renovating parks with under-performing single-use amenities, consider relocating those amenities to a centralized site (e.g., a larger neighborhood park or community park) where co-location can increase use, visibility, and programming potential.
3. Define service areas to maintain equitable access - Establish service areas by amenity type, informed by geography and population, to guide the placement of centralized facilities and ensure residents have reasonable access.
4. Provide critical mass and support amenities - For example, rather than offering one to two horseshoe pits in numerous parks, develop a centralized horseshoe facility with six to ten pits in a community park that also includes shade, hydration, restrooms, seating, and other support amenities.
5. Balance access trade-offs with programming gains - While centralization may reduce the number of locations where an amenity is available, it can significantly increase activation by enabling leagues, events, and instruction that are not feasible without critical mass.
6. Potential amenity types suitable for a centralized delivery model include:
+ Bocce courts
+ Horseshoe pits
+ Community gardens
+ Dedicated tennis courts
+ Dedicated pickleball courts
+ Outdoor basketball courts
+ Sand volleyball courts
+ Outdoor fitness equipment
E. Modernize older playgrounds as “family anchor zones.”
1. Treat playground reinvestment as a multigenerational activation strategy - Henderson’s two largest demographic groups are residents under age 18 (21.4%) and adults over age 65 (20.4%). When improving existing playgrounds, design them as shared destinations for children and their older family members by pairing contemporary, shaded, and accessible play structures with adjacent shaded seating and gathering areas, outdoor fitness equipment, and short looping walking circuits that support comfort, supervision, and light activity for all ages.
2. Replace outdated play areas with inclusive, shade-forward environments - Renovations should prioritize contemporary play experiences that better serve families, caregivers, and children of all abilities by incorporating:
1. Shaded play structures and shaded caregiver seating.
2. Inclusive, ADA-forward play features aligned with universal design principles.
3. Family gathering nodes that integrate shade, picnic/seating, and nearby hydration.
F. Increase evening and early-morning use through lighting improvements.
1. Support the hours when residents can realistically use parks during summer months - As extreme heat shifts recreation toward evenings and early mornings, activation projects should include lighting improvements that increase comfort and perceived safety during cooler—but darker—hours.
2. Prioritize pedestrian-scale lighting on internal routes - Add pedestrian-scale lighting along primary internal routes connecting entrances to key destinations (e.g., play areas, courts, restrooms, trail connections).
3. Use efficient technologies and controlsImplement high-efficiency and/or solar lighting where feasible, with controls/timers to manage operating costs and reduce unnecessary light spill.
4. Focus investments where activation is being expanded - Prioritize lighting upgrades in parks selected for expanded programming, events, and evening use.
Figure 4.5 - On-demand lighting at Dundee Jones Park (2025).
PART FOUR
G. Reduce communication barriers to park use and participation
1. Pair capital improvements with improved communication - Activation is not driven solely by capital investment. The needs assessment identifies communication gaps as a recurring barrier, including residents not knowing what is offered and a desire for improved outreach tools.
2. Promote renovated parks and new amenities - When legacy parks are improved, implement a consistent communications approach so residents are aware of upgrades and encouraged to revisit parks they may have previously avoided or overlooked.
3. Reintroduce targeted print communications for seniors - To better reach Henderson’s large and growing senior population, consider reintroducing a limited, hard-copy version of the “Henderson Happenings” program guide in a targeted format.
A. Consider distributing the guide to households identified through available City/public data as “55+ households.”
B. Provide an opt-in option so other residents can elect to receive the guide.
C. Issue the guide quarterly (rather than monthly) to reduce costs while maintaining predictable outreach.
D. Use QR codes and/or short URLs to direct readers to the City’s website and social media for the most current program and registration information rather than try to include everything in the print-version.
H. Improve wayfinding and park branding as part of activation projects.
1. Elevate wayfinding as an activation toolWayfinding and signage have been identified as areas for improvement; strengthening them reduces friction and helps residents discover amenities, trails, and programming they may not know exist.
2. Standardize park identity at vehicular and pedestrian entrances - All City of Henderson parks and facilities should be clearly branded with standardized, City-specific monument signage at key vehicular and pedestrian entrances, reinforcing that these are publicly funded, City-managed park sites (and not private/HOA facilities).
3. Upgrade trailhead information - All trailheads and parks with regional trail access should include trail map kiosks and clear directional wayfinding signage.
4. Improve internal wayfinding and safety-oriented information - As needed, provide internal park signage that makes key amenities easy to locate— particularly those tied to health, safety, and welfare (e.g., shade, hydration, restrooms, and primary exits).
5. Leverage QR-codes on signage - Where appropriate, integrate QR-linked content for programs, amenities, rules, and health/safety information to keep digital content current without frequent replacement of physical signage.
Figure 4.6 - Example of a monument sign for Sonata Park which does not include traditional P&R-branding (2025).
D. PARK MAINTENANCE
Improving and activating existing parks is inseparable from maintaining them. As Henderson’s parks and recreation system has expanded exponentially over the last several decades, P&R’s responsibilities have grown from “parks” in the traditional sense to a large, multi-asset network that includes parks, trails, recreation centers, aquatics facilities, and athletic complexes.
The community’s expectations for safety, cleanliness, comfort, and reliability have also risen, particularly as newer parks and facilities establish a higher baseline for shade, lighting, amenity quality, and overall user experience. During community engagement, residents consistently reinforced a “fix it first” message—prioritizing comfort, safety, and convenience improvements at the parks they already use—and emphasized that maintenance commitments must keep pace so upgrades remain reliable over time.
1. CURRENT CHALLENGES
Henderson’s current maintenance challenge is fundamentally a “maturity” issue: as the system ages, more assets require renewal or full renovation, increasing lifecycle costs and heightening the consequences of deferred maintenance. The City’s long-standing partnership approach has delivered substantial park capital investment (including more than $100M+ in parks delivered through development over the last 30 years), but the long-term operations and maintenance obligations remain with the City— creating increasing financial pressure as the system expands and ages.
At the same time, Henderson continues growing, particularly West Henderson and areas like Cadence, increasing the number of maintained acres, amenities, and facilities, often without commensurate increases in operations and maintenance funding as “turnkey” parks transfer to the City.
This creates a persistent dual pressure: (1) deliver new parks and facilities in growing areas while (2) reinvest in—and keep fully functional—the older parks and facilities that serve established neighborhoods.
Financially, maintenance and operations are also being squeezed by cost escalation. The City’s financial review indicates that year-to-date expenditures were tracking significantly higher year-over-year, reflecting wage/benefit pressures along with higher utility and maintenance costs, with total operating expenditures projected to continue growing at an estimated 4–10% annually.
This is important for park activation because many of the most desired improvements—shade structures, lighting, restrooms, splash pads, athletic field enhancements, and advanced irrigation controls—add ongoing maintenance workload and replacement liabilities even when they are highly successful amenities. The needs assessment explicitly identifies additional funding for maintenance and operations as a high-priority need, noting that deferred renewal could quickly erode the hard-won quality of the system and concluding that a more sustainable, diversified approach to funding O&M is essential as new facilities come online.
A practical indicator of these pressures is visible in P&R’s work-order experience. Analysis of Comcate maintenance requests (July 2021–July 2024) documented recurring issues across 1,281 submitted items—showing that maintenance demand is both steady and diverse.
Together, these conditions reinforce the need for a maintenance “reset”, one that positions maintenance as core infrastructure, not simply an operating afterthought.
2. MAINTENANCE CHALLENGES BY PARK TYPOLOGY AND AGE
Maintenance needs and costs vary substantially by age and park/facility typology. The City’s maintenance model must account for those differences rather than treating all parks as “equal” from an operations standpoint. P&R’s Park Operations Manual already establishes a strong framework for this by defining five maintenance modes (Mode I through Mode V) that scale service frequency based on use, visibility, and operational needs. Mode I sites (high-traffic, high-profile parks and sports complexes) require the most frequent attention, while Mode V sites focus primarily on safety and basic upkeep.
PART FOUR
A. Age-based challenges:
Newer parks, while early in their lifecycle, can be more maintenance intensive on a day-to-day basis because they are typically amenity-rich, highly used, and supported by more advanced (and more complex) systems. The Operations Manual emphasizes, for example, that irrigation is a major focus and that parks in higher maintenance modes often require frequent checks to catch leaks and controller issues quickly—an operational reality that increases staffing and technical workload even when the irrigation system is efficient.
In contrast, older parks often carry heavier renewal burdens tied to the end-of-life phase for core amenities and infrastructure. The needs assessment and site evaluations identify recurring legacy-park issues such as outdated playground equipment and surfacing, limited shade over play areas, inefficient irrigation and inconsistent or non-LED lighting—conditions that are typically less about routine maintenance and more about reinvestment, retrofits, and full replacements.
B. Typology-based challenges:
Certain facility types and amenities predictably generate high maintenance and operational load, either because they require frequent cleaning/ repair (high-touch public amenities), skilled technical support (mechanical/electrical/water systems), or intensive turf and event turnover (sports/tournament environments). Henderson’s Comcate analysis helps illustrate where these burdens show up most consistently in day-to-day practice:
Irrigation and water-management systems: recurring reports of broken/misaligned heads, overspray, pooling/runoff, and sprinklers continuing to run after landscape changes.
Landscape and tree maintenance: overgrown vegetation affecting pedestrian/driver visibility and routine needs such as palm trimming for hazardous fronds.
Vandalism and graffiti: repeated incidents in restrooms, playground areas, trails, and skateparkadjacent locations, often returning to the same “hot spots.”
Trash, debris, and dog waste: overflowing cans (including in dog parks), litter after events/ tournaments, dumping, and bag dispensers running empty.
Playground and park facility upkeep: worn/broken equipment (slides, swings, cross-beams), damaged benches, and recurring issues with shade canopies and restroom fixtures.
Trails and lighting: cracks/raised edges, ruts, lights out in corridors/tunnels, and debris accumulation after storms—issues that directly affect safety and user comfort.
These observed patterns align closely with P&R’s identification of high-effort maintenance components within neighborhood and community parks (e.g., dog parks, restrooms, splash pads, playground surfacing/equipment, trail lighting, shade structures), and within regional facilities (e.g., highuse athletic complexes and tournament operations that accelerate turf wear and require significant daily setup and turnaround).
Indoor and aquatic facilities bring additional complexity: specialized mechanical systems, more intensive preventive maintenance, and higher utility exposure. Findings from the facility assessments conducted emphasize the importance of continually maintaining and modernizing key mechanical and electrical systems—particularly to avoid failures and service disruptions during peak demand or emergency conditions.
In summary, Henderson’s ability to improve and activate existing parks at the level the community is requesting will depend on pairing targeted capital reinvestment with a maintenance model that is adequately funded, calibrated to park typology and age, and continuously improved using real operational data—so that upgraded parks stay clean, safe, comfortable, and fully functional year after year.
3. RECOMMENDATIONS - MAINTENANCE
To address these challenges while supporting park activation goals, P&R’s maintenance approach should be explicitly data-driven, lifecycle-based, and service-level specific. Key strategies include:
A. Implement a Park Asset Management and Lifecycle Renewal Program.
Establish a formal Park Asset Management Program that inventories major park assets (e.g., irrigation systems, playgrounds, sports courts/fields, shade structures, lighting, restrooms, splash pads, trail furnishings, trees) and assigns each asset a useful life, condition score, replacement cost, and replacement year. This program should be used to proactively plan renewals and reduce deferred maintenance as the system matures and a growing share of sites enter higher-cost lifecycle phases.
Implementation actions should include:
1. Develop a standardized condition assessment methodology and conduct rolling assessments (e.g., 20–25% of sites annually).
2. Create a renewal forecast (10-year and 20-year) and integrate it into the City’s CIP and annual budgeting cycles.
3. Establish replacement reserves for high-cost systems and amenities that drive service expectations and risk exposure.
B. Tie Park-Specific Maintenance Plans to Work-Order and Mobile Systems.
Build on P&R’s existing Parks Operations Manual by developing park-specific maintenance management plans that reflect the Department’s defined maintenance modes and service levels (Modes I–V) and link those plans directly to work-order software and mobile tools for use by staff in real-time in the field.
The needs assessment specifically notes the value of standardized park maintenance plans and recommends linking them to work-order software/ mobile apps and using digital records to identify patterns and budget needs
Actions that would support this recommendation include the development/adoption of:
1. Standard park plan templates (assets, mode, inspection frequency, known issues, seasonal tasks).
2. Mobile workflows for inspections, photos, and close-out documentation.
3. A routine schedule for updating plans after renovations, turf conversions, and major amenity replacements.
Figure 4.7 - Sidewalk heaving along an accessible route at Dos Escuelas Park (2025).
PART FOUR
C. Use Work-Order Analytics to Drive Preventative Maintenance and Hot-spot Response.
Institutionalize a quarterly review of work-order trends to shift resources from reactive repairs toward preventative maintenance and targeted hotspot interventions. Henderson’s work order data (July 2021–July 2024) shows recurring issues tied to irrigation/sprinklers, landscaping/trees, vandalism/ graffiti, trash/dog waste, playground/facility upkeep, trail maintenance, lighting outages, and pests/ wildlife
Priority actions supporting this recommendation include:
1. Set performance targets for response time by request type (e.g., safety hazards vs. minor repairs).
2. Create “repeat issue” flags (same location, same asset) to trigger root-cause solutions rather than repeated patching.
3. Coordinate enforcement/education and design retrofits (e.g., trash capacity at dog parks, restroom hardening, trail lighting upgrades) where work-orders show chronic repeat demand.
D. Modernize Irrigation and Landscape Maintenance to Reduce Failures and Waste.
Advance a comprehensive irrigation modernization and landscape maintenance strategy focused on efficiency, reliability, and post-project recalibration. Work order trends show recurring irrigation issues including broken/misaligned heads, overspray/runoff, and sprinklers running after landscape changes (i.e., “watering dirt”)
Recommended practices include:
1. Conduct irrigation audits after turf removals and renovation projects to ensure controllers/ zones reflect the new landscape program.
2. Standardize controller programming, seasonal adjustments, and quick-response repair protocols for high-visibility parks.
3. Expand water-smart landscape conversions where appropriate, paired with a tree-health strategy and integrated pest management practices already emphasized in departmental operations.
E. Adopt Lifecycle-Cost Design Standards for Renovations and New “Turnkey” Parks.
Update park design standards and developerdelivered park requirements to reduce longterm lifecycle costs while meeting Henderson’s contemporary expectations for comfort, activation, and quality. Although the parks system has benefited substantially from its partnerships with the development community to develop new parks, the long-term responsibility for O&M remains with the City.
2. Standardized systems where feasible (irrigation components, lighting parts, restroom fixtures) to reduce training and parts inventories.
3. Materials and layouts that reduce vandalism vulnerability and simplify cleaning and repair cycles.
F. Create High-Intensity Amenity Maintenance Standards and Replacement Reserves.
Develop formal maintenance standards, inspection frequencies, and capital replacement triggers for amenities consistently identified as maintenanceintensive (and/or frequently referenced in complaints/ work-orders). Work-order trends show persistent issues tied to restrooms, playgrounds, trail lighting, trash, graffiti, and dog waste.
High-intensity amenity standards should address, at a minimum:
1. Dog parks (surfacing management, waste systems, drainage, signage, routine cleaning).
4. Playground surfacing and equipment (scheduled surfacing top-offs, component replacement planning, and shade canopy maintenance).
5. Trail lighting and park lighting (LED conversion programs, standardized parts, and proactive nighttime outage response).
G. Align Tournament/Sports Complex Operations with True Maintenance and Staffing Costs.
For tournament and competition-level facilities, implement an operating model that aligns scheduling, staffing, and fees with the true costs of wear-and-tear, conversions, and high-frequency use.
Implementation tools include:
1. A cost-of-service framework for field rentals and tournaments, that accounts for the true cost of operating and maintaining tournament facilities, including both staff time and materials/resources.
2. An accompanying pricing policy and/or fee structure which allows P&R’s offerings to remain competitive within the marketplace, however, not outprice the smaller, local recreation leagues and partners. Consideration could be given to offering reduced rates to leagues/teams based in Henderson.
3. Field lighting and surface investments that increase playable hours only where O&M capacity and long-term replacement reserves are clearly defined.
4. Operational policies for rest periods, rotation, and renovation thresholds to prevent accelerated asset failure.
Figure 4.8 -Tournament-quality fields at Heritage Park (2025).
PART FOUR
E. RETROACTIVE RESILIENCE
As previously noted, many of Henderson’s older “legacy” parks reflect a different era of expectations—one where greater emphasis was placed on creating a lush, oasis-like contrast to the desert through broad turf panels and ornamental landscapes than on long-term performance under intensifying heat and tightening water constraints.
Today, Henderson’s “new normal” includes more frequent, longer, and more intense extreme-heat events. In this context, parks are not just recreation destinations; they are increasingly critical publichealth infrastructure that must support safe, comfortable use, including during the hottest periods of the year.
At the same time, with Southern Nevada’s ongoing water realities—including heavy reliance on the Colorado River—legacy parks must continue evolving toward water-smart landscapes and systems that can be sustained long-term.
As P&R makes strategic investments to improve and activate legacy parks, those investments should simultaneously increase heat- and drought-resilience in measurable ways. This approach is consistent with the intent of the park site resiliency audit, which was developed to establish a comparable baseline of site-level strengths and vulnerabilities and to inform both near-term improvements and long-range capital planning.
System-wide findings from that evaluation indicate that, while many parks perform well on foundational factors such as drinking water availability and overall health and safety, there remain consistent opportunities related to shade coverage, irrigation efficiency and control, renewable energy adoption, and emergency information/refuge infrastructure— each of which directly influences how safe and usable parks are during extreme heat.
Following are key recommendations for increasing the comprehensive resilience – environmental, social, and fiscal – of the city’s existing, legacy parks.
1. Increase the perceived value of turf conversion areas through beautification and activation.
Water-smart landscape conversion is already a defining component of Henderson’s resilience agenda. City documentation notes major gains tied to turf conversion and removal efforts, with annual water-use reductions already exceeding 100 million gallons and a target of 150 million gallons saved annually by 2026, aligned with Nevada’s AB356 mandate to eliminate irrigation of nonfunctional turf by January 1, 2027.
The Master Plan recommends that the next phase of turf conversion work—particularly once AB356 compliance deadlines are satisfied—shift from a “remove-and-stabilize” mindset to a “replacewith-value” mindset in select priority locations. In other words, where turf removal has reduced perceived neighborhood greenspace, P&R should pursue secondary enhancements that increase both visual interest and recreational function so that the converted areas are not merely water-efficient, but also meaningful community assets.
Figure 4.9 - A recent turf removal project at Sonata Park (2025).
This recommendation recognizes a practical challenge observed in many communities: when time (external) and budgetary pressures (internal) require non-functional turf areas to be replaced quickly, the resulting xeric areas can feel flat, sparse, and under-programmed. Over time, that can erode public support for future resilience initiatives and unintentionally reduce park comfort and usability.
Instead, P&R should treat former turf areas as flexible “opportunity zones” that can be incrementally upgraded with elements that are context-appropriate and low-water by design—such as micro-topography and a diversity of boulder/rock sizes, native-friendly plant masses, decomposed granite walking loops, informal nature play, shaded seating nooks, public art, interpretive features, and small-scale fitness or social nodes. Section 4.3 provides a menu of implementation approaches that can be layered and scaled based on park type, neighborhood context, and available funding.
Where feasible, these secondary improvements should be paired with targeted irrigation modernization and planting strategies that reduce long-term operational burden while maintaining or improving the park’s identity and perceived quality.
2. Expand shade as essential resilience infrastructure.
P&R should elevate shade—both natural and manmade—to the level of essential infrastructure in legacy-park reinvestment projects. System-wide resiliency findings show that shaded seating and shade at core amenities are moderate rather than strong, and that expanding shade coverage is among the most direct ways to improve daytime usability and reduce heat-stress risk as extreme-heat days increase.
Accordingly, every legacy-park reinvestment project should incorporate a deliberate shade plan that prioritizes (1) play environments, (2) seating and respite areas, (3) gathering spaces, and (4) highdemand active amenities such as courts, splash pads, and fitness areas.
This strategy should not rely on shade structures alone. A comprehensive approach should combine drought-tolerant shade trees, well-sited shade structures (pavilions, shelters, shade sails, and shade canopies), and the thoughtful placement of amenities to capitalize on shade cast by existing trees, buildings, walls, and landforms.
In Henderson’s climate, it is important to prioritize shade performance when it matters most— especially late-afternoon summer shade—by orienting and sizing structures and tree placements based on actual seasonal sun angles rather than annual averages.
Where P&R is investing in drought-tolerant trees that provide meaningful shade value in strategic areas, they should view those trees as “high-value assets” worthy of the irrigation, establishment care, and long-term maintenance required to keep them healthy, safe, and functional.
PART FOUR
3. Pair shade with “cool surface” retrofits at the pedestrian scale.
The system is already trending toward furnishings and materials with lower heat-retention, but expanding cool-pavement strategies—especially when paired with shade—can further reduce surface temperatures and improve comfort at paths, plazas, and seating areas in legacy parks. See Section 4.3 for additional details on various “cool-paving” strategies.
4. Facilitate safe evening and early-morning use of key amenities.
Because extreme heat is a primary barrier to outdoor recreation participation, legacy-park improvements should increasingly support safe use during the cooler hours of the day, especially during the summer months. P&R is already adapting by shifting more programming to indoor and evening offerings during peak heat.
To support resilient year-round activation, P&R should identify and prioritize locations where additional lighting is warranted around high-demand amenities (e.g., courts, looping paths, playgrounds, dog parks, and fitness areas), and where lighting will meaningfully expand safe, comfortable access without generating unnecessary glare or neighborhood impacts.
Consideration should also be given to prioritizing the lighting of recreational amenities commonly used by vulnerable populations, such as the 55+ senior community, for whom exposure to extreme heat carries increased risks. Examples of these amenities include but are not limited to looping walking paths, multi-use and/or pickleball courts, dog parks, and outdoor fitness areas.
5. Provide additional support infrastructure and site furnishings that facilitate safe and comfortable use during the summer months.
To remain usable and safe during hotter months, legacy parks should include a baseline set of “heatready” site furnishings and support infrastructure. Across evaluated parks, access to drinking water was
identified as a system strength, yet it remains an essential resilience feature that should be protected and expanded as parks are updated.
The Master Plan recommends that legacy-park reinvestment projects verify that drinking water access is conveniently distributed at key activity zones, scaled to park type and intensity of use, and designed to reduce waste while supporting both users and their pets. Where older fountains are reaching the end of their useful life, they should be replaced with modern, water-saving fixtures that include bottle fillers and pet bowls as the standard.
In addition, projects should add or upgrade shaded seating and respite areas near playgrounds, splash pads, courts, and other high-activity destinations, with an emphasis on equitable distribution of ADAaccessible shaded seating. Comfort investments should be coordinated with accessibility upgrades so that the people who most need shade and rest areas can access them without barriers. Collectively, these measures strengthen legacy parks as dependable, “all-season” neighborhood assets and reduce the risk that upgraded amenities remain underused due to heat exposure.
6. Upgrade lighting and utilities to reduce lifecycle costs and strengthen resilience.
P&R should continue transitioning all legacy-park lighting systems toward high-efficiency LED, with a particular focus on the larger, more energyintensive sports field lighting systems that often lag behind pedestrian and court lighting upgrades. The resiliency audit found that “Lighting & Utilities” was the lowest-scoring category system-wide, with renewable energy adoption being rare and strong opportunities existing for solar shade canopies, solar or high-efficiency lighting retrofits, and broader use of smart systems to reduce energy/water use and improve heat-season operations.
Field observations at multiple sites also indicate that most existing sports field lighting does not appear to utilize LED technology, reinforcing the need for a structured, multi-year conversion strategy. Given the scale of Henderson’s park and athletic facility portfolio, this conversion should be implemented through a phased program tied to field use intensity,
operational savings potential, and the opportunity to bundle lighting upgrades with other planned capital work.
It is also recommended that P&R develop standard specifications for sports field lighting and associated controls to streamline maintenance, simplify staff training, and reduce the long-term burden of managing multiple manufacturers, parts inventories, and control platforms.
7. Standardize baseline “emergency Information” resources across parks and trailheads.
Health and safety findings from the site audits identified the provision of emergency information/ resources as a consistent opportunity area, suggesting a need for clearer, more standardized onsite information and assets that support users during extreme conditions and emergency situations.
Although relevant emergency information will vary by park site based on its location and program, every park site should offer core informational resources enabling visitors to recognize symptoms of dehydration and heat-related illness, along with guidance on first-aid responses and emergency contact details. These resources should be prominently displayed in high-traffic areas, such as restrooms, drinking fountains, and shade structures. Additionally, it is advisable to include essential contacts to assist those affected by human trafficking, potential fentanyl exposure, homelessness, or food insecurity.
8. Modernize irrigation controls as a core component of every legacy-park reinvestment project.
Irrigation efficiency and control was identified as one of the most consistent landscape-related opportunities system-wide, reinforcing the importance of smart controllers, targeted irrigation, and eliminating over-spray or “watering dirt” conditions as parks are updated.
9. Integrate renewable energy and lowemission mobility support where appropriate.
Renewable energy implementation and support for low-emission vehicles received relatively low scores in the resiliency assessment, highlighting significant opportunities to introduce solar shade canopies, solar-powered facilities, and strategically located EV and e-bike charging stations at select parks and trailheads.
It is recommended that a cost-benefit analysis be conducted for each location to confirm that the infrastructure investment required for these enhancements is justified by the anticipated benefits and returns, regardless of their demonstration value.
Figure 4.10 - Wind turbine at Heritage Park (2025).
RESILIENT BY DESIGN - PARKS 4.3
A. PURPOSE & INTENT
Henderson’s parks, trails, and recreation facilities are being asked to perform in a “new reality” defined by more frequent and more intense extreme heat, alongside long-term drought and ongoing watersupply constraints.
The Resilient by Design Best Practices translate this context—and the Master Plan’s findings—into clear, actionable guidance that can be applied to both new park development and targeted retrofits of the existing system. They are informed by the project’s resiliency audits, including standardized park site evaluations of 35 park sites (approximately half of the City’s parks) using a 27-criterion resilience framework organized into six categories (Landscape; Materials and Surfaces; Lighting and Utilities; Comfort and Activation; Accessibility; Health and Safety).
1. THE PURPOSE OF THE RESILIENT BY DESIGN BEST PRACTICES IS TO:
A. Identify resiliency-specific best practices informed directly by the site and facility evaluations, with the intent that they can be considered for inclusion in a future update of P&R’s Park Design Standards.
B. Supplement, not replace or supersede, the City’s adopted Standardized Design Guidelines (City Council approved July 2016). These best practices are intended
to provide an additional lens for decision-making, focused specifically on heat and drought resilience, sustainability, and long-term performance.
C. Increase comprehensive resiliency— environmental, fiscal, and programmatic—by prioritizing programming and design decisions that:
+ Improve thermal comfort and safe usability during extreme heat (the plan notes that parks and facilities are increasingly positioned as core assets during the hottest periods),
+ Reduce water use and operational burden in a water-constrained desert environment, and
+ Strengthen long-term system performance while maintaining (and ideally improving) the visitor and participant experience.
D. Provide a user-friendly structure that mirrors the project’s resiliency evaluation framework, so that the best practices align directly with the same categories and criteria used to assess existing conditions.
In summary, the Resilient by Design Best Practices are intended to help Henderson consistently plan, design, renovate, and maintain parks and recreation assets that are comfortable, safe, water-smart, and operationally sustainable—even as extreme heat and drought increasingly shape how, when, and where residents recreate.
PART FOUR
B. LANDSCAPE
1. THE ROLE OF LANDSCAPE IN A RESILIENT PARKS AND RECREATION SYSTEM
In Henderson, landscape is not simply “green decoration”—it is a core piece of civic infrastructure that determines whether parks and trails remain comfortable, usable, and safe in an era of intensifying extreme heat and chronic water scarcity. Henderson sits within the Mojave Desert’s Basin and Range ecoregion, where very low annual rainfall and intense summer heat are defining conditions, and the region recently experienced a record high of 120°F.
In this context, landscape must be designed to perform: it must reduce heat exposure, support health and comfort, conserve water, reinforce habitat and ecological function, and strengthen the daily usefulness of parks for residents—while still creating places that feel inviting, beautiful, and restorative.
Landscape as the “backyard” Henderson residents can share - A resilient parks system functions as an equitable extension of home—especially for residents who do not have private yards, shade trees, or outdoor gathering space. Landscape is what turns a park into a true “backyard”: it shapes outdoor rooms, defines edges and safe visibility, and creates spaces where people can meet friends, watch children play, rest during a walk, or simply exist outdoors without needing to spend money. In Henderson’s climate reality, this shared “backyard” role is inseparable from heat resilience: if the landscape does not provide comfort and relief, the park’s benefits are effectively unavailable for much of the year.
Landscape as the first line of defense against extreme heat - Because extreme heat is a public health and safety issue in Southern Nevada, Henderson is already embedding heat resilience into how parks operate and how they are designed— emphasizing shade, hydration, and shelter so that recreation remains accessible during the hottest periods.
Landscape is a primary tool for that work. Trees and other shade-producing plantings are not ornamental add-ons; they are essential infrastructure that can
reduce sun exposure along paths, cool key gathering areas, and make amenities (playgrounds, seating, courts, fitness zones) usable for longer windows of the day. When distributed strategically, shaded routes and shaded “pause points” also support safe movement through the park system—particularly for children, older adults, and people who are more vulnerable to heat.
Landscape should still be authentically beautiful
- Even in a performance-driven framework, visual beauty matters because it drives use, health, and community pride. A park that feels harsh, barren, or purely utilitarian will not invite daily use, and it will not deliver the social and health outcomes that justify long-term investment.
Thoughtful landscape composition—color, seasonal interest, texture, shade patterns, and framed views— helps reduce stress, improve mood, and create pride of place. In Henderson, resilience-focused beauty is achieved through plant communities and design language that belong here—not through high-water, high-maintenance approaches imported from cooler climates.
Landscape should reconnect people with Henderson’s natural environment and teach stewardship - A resilient system uses landscape to help people understand and value the Mojave Desert as a living, intricate environment. When parks include native and native-friendly plantings that provide ecological value, they become everyday classrooms—demonstrating that desert landscapes can be lush in experience without being waterintensive.
Interpretive opportunities (signage, demonstration gardens, habitat features, water-wise examples) can turn routine visits into learning moments—building broader community support for responsible water use and climate-appropriate landscape practices.
Landscape should create habitat and support ecosystem health, not just fill space - Parks, trails, and natural areas can function as connected habitat patches and corridors that support birds, pollinators, and other wildlife adapted to desert conditions. This ecological role strengthens overall system resilience: healthier soils, more appropriate plant palettes, and habitat-supporting design typically require less intensive irrigation and fewer ongoing inputs over
time, while also making parks more interesting and rewarding to visit. In Henderson, this means landscape should be planned as a network—linking neighborhood parks to trails and natural lands through consistent, climate-appropriate planting strategies.
In a desert city, all irrigated landscape must be multi-functional - With Henderson averaging just over four inches of precipitation annually and relying on the Colorado River for nearly 90% of its water supply, every irrigated square foot comes with a real resource cost.
The City is already pursuing a clear resilience agenda: eliminating nonfunctional turf to align with state law, minimizing irrigation, converting high-water turf to water-smart grasses or native palettes, and modernizing irrigation controls.
That direction establishes the central expectation for future park planning and design:
If landscape requires irrigation, it must deliver multiple benefits beyond aesthetics - This is also consistent with the project’s own resilience evaluation lens: turf that is primarily aesthetic and provides little recreational or programmatic value is explicitly treated as a low-resilience condition, while turf that provides meaningful recreational value (or is eliminated) is treated as higher resilience.
In practice, “multi-functional landscape” in Henderson means that planted and irrigated areas should simultaneously contribute to several outcomes—such as shade/thermal comfort, usable recreation space, gathering and social function, habitat value, stormwater benefit where feasible, educational demonstration, and reduced maintenance burden—while remaining visually compelling and welcoming. This performance-based approach ensures that Henderson’s parks continue to feel like premier community amenities, but in a way that is realistic, responsible, and resilient under the region’s heat and water constraints.
2. PLANTINGS:
A. Adopt “Cool-Island Planting Typologies” for Henderson parks (apply to new parks and retrofits):
+ Shade Groves (clustered canopy + understory for seating/picnics/play)
+ Shade Corridors (continuous shade along primary loops and trail spines)
+ Heat-Refuge Nodes (highest comfort investments—see Cooling Stations) This creates consistent, repeatable design outcomes across the system, rather than oneoff planting layouts.
B. Prioritize “canopy-per-gallon” planting design: select plant communities that maximize usable shade and mean radiant temperature reduction per unit of irrigation (trees + low-water understory + mulched soil), rather than decorative expanses of inert groundcover.
C. Require soil-first landscape performance (not just planting plans):
+ Salvage/reuse topsoil where feasible
+ Compost incorporation and/or biochar trials in high-stress areas (tree groves, medians, trail edges)
+ Specify minimum soil volume and infiltration performance for planted areas (see Trees for soil volume).
D. Plan for establishment under hotter conditions: require an establishment irrigation + maintenance plan (first 24–36 months) that includes heat-wave contingencies (temporary shade, deep watering, extra mulching, tree staking checks).
E. Use “shade layering” as a standard: canopy + midstory + ground layer to reduce reflected/radiant heat from hardscape and DG planes (an issue noted in multiple park narratives where xeric areas become large flat DG fields).
F. Restrict the use of highly ornamental plantings which demand greater maintenance and irrigation to prominent locations such as park or facility
PART FOUR
entrances, areas surrounding monument signage, or as integral features of signature elements like public art installations.
G. Adopt a “right plant – right place” approach: by choosing and planting species that will naturally grow to fit the intended space, rather than selecting plants that require constant pruning to maintain a preferred size.
H. Limit ornamental/decorative pruning - Where possible, stop trimming and shaping shrubs just for appearance; instead, let grouped plants grow naturally together. This approach cuts down on maintenance and helps plants focus their energy on developing strong root systems, making them better suited to thrive in Henderson’s dry climate.
I. Plant in masses - Install smaller plant materials and shrubs in cohesive masses or groupings rather than dispersing individual specimens across a large area. Grouped plantings create expansive habitat zones and establish favorable microclimates above their root systems, thereby minimizing soil moisture evaporation and lowering surface temperatures.
3. XERISCAPE AREAS:
A. Leverage microclimates and passive irrigation to support planting areas - Utilize the strategic construction of swales in xeric landscapes to effectively capture and direct stormwater runoff toward designated planting areas. This approach facilitates the formation of artificial landforms and supports beneficial microclimates for native or drought-tolerant vegetation, enabling these plants to capitalize on natural irrigation from limited stormwater runoff, condensation, and frost accumulation within these depressions.
B. Include a variety of aggregate and boulder sizes on the ground plane - The ground plane should be a light-colored, diverse selection of aggregate sizes, from decomposed granite and small cobbles to substantial boulders, to enhance visual interest in xeric environments and generate micro-shadows that, collectively, can help reduce the surface temperature of surrounding areas.
C. Plant in distributed masses - It is recommended to arrange landscape materials in small, grouped masses rather than as isolated specimens spread over extensive areas.
D. Limit erosion with structured edges - Xeric areas should incorporate a hard edge that separates them from adjacent structured spaces to clearly define use zones and to limit/prevent erosion from the xeric areas onto adjacent surfaces, such as walkways or natural turf areas.
Examples of treatments which could serve as hard edges include:
+ Concrete curbing
+ Commercial-grade metal edging
+ Timber edging
+ Dr y-laid cobble stone borders
E. Clearly define pedestrian use zones vs. landscape zones - When there is a functional ground plane element within a larger xeriscape area—like a decomposed granite path or amenity space— it’s recommended to use two different colors of decomposed granite along with a hard edge. This approach helps clearly separate pedestrian and amenity zones from landscape or xeriscape beds. For areas used by people, such as paths or amenity spaces, it’s best to choose a lighter colored decomposed granite to help keep surface temperatures lower.
F. Embrace xeriscape areas as both infrastructure and amenities - Increase the functional and recreational value of xeric removal areas by adding new amenities or features, such as the incorporation of:
+ Shaded (either natural or structured) seating/ gathering areas.
+ Areas dedicated for lawn/table games such as table-tennis or bag-toss (cornhole).
+ Experiential landscape elements, such as the incorporation of a labyrinth.
+ Outdoor public art that embraces the beauty of the natural landscape and/or the unique history of Henderson.
+ Small, neighborhood-scale off-leash dog “runs” (see Section 4.4).
+ Interpretative elements/exhibits that educate visitors on native ecosystems, climate challenges, and/or Henderson’s unique history.
+ Implement a “landscapes to playscapes” program that integrates natural playscapes into xeric spaces that embrace the use of natural materials (such as logs, boulders, “loose parts” sand, etc.) and landforms to create self-directed play experiences for kids of a variety of ages.
+ Looping soft-surface trails/paths with seating areas.
+ Shaded outdoor fitness equipment nodes.
+ Additional bicycle/trail support amenities at sites that also serve as trailhead locations (bicycle parking, bike lockers, repair stations, map kiosks, etc.)
4. SHADE TREES:
A. Shift from “tree count” to “shade performance” targets - The shade from trees can reduce surface temperatures of built surfaces by up to ~45°F. Require design teams to document % shade coverage at peak summer conditions (e.g., 10am–4pm in July) for:
+ Primary pedestrian loops
+ Playground queues and perimeter seating
+ Sport court spectator edges
+ Dog park seating zones
B. Create a “Tree Canopy Equity Priority” overlay for capital projects: tie tree planting retrofits and “shade corridor” investments to the city’s hottest/ lowest-canopy areas (e.g., East Henderson has very low canopy and higher heat exposure).
C. Design tree groves for longevity in extreme heat:
+ Minimum soil volume per canopy tree (calculated)
+ Structural soils or suspended pavement in constrained areas such as plazas or trailheads,
+ Passive stormwater capture into tree basins (see Stormwater Runoff)
+ Protection from heat reflected off walls/paving (setbacks or shade screens).
D. Require species diversity + climate screening: use the COH Plant List performance information and metrics to set rules like:
+ No single species >10–15% of new plantings citywide (pest/disease resilience)
+ Preference for 4–5 star trees in high-exposure sites
+ Exceptions for the use of lower (2-3 star) rated trees if the shade that they are able to provide justifies the increased maintenance and irrigation requirements
+ Avoid species with chronic heat stress, breakage, or high litter/maintenance in key pedestrian areas.
E. Bridge the “young tree shade gap”: in parks with newly planted trees (a repeated condition in the park narratives), require temporary shade structures or fast-install shade sails over the highest-use areas until canopy matures.
F. Take advantage of passive secondary irrigation
- Where possible, prioritize locating new trees within or adjacent to natural turf areas or landscape beds that will already be irrigated so that they can take advantage of any overspray, runoff, and evapotranspiration as secondary sources of passive irrigation.
G. Minimize evaporative loss around key root zones - Ensure that all shade trees have a mulch ring surrounding their root collar to minimize evaporative loss of irrigation water and soil evapotranspiration.
PART FOUR
H. Drought-resilient establishment strategy: specify deep watering + targeted bubblers/drip during tree establishment periods (which will vary by species, size, location, and time of planting), then taper to long-term low-water regimes.
I. Design “cool loops” in key parks: continuously shaded (trees + structures) walking loops that support safe summer exercise and socialization. Prioritize sites near with high percentages of seniors or other populations who are at an increased risk for heat-related illness.
5. NATURAL TURF:
A. Define “Functional Turf” explicitly (policy + design): turf is only used in Henderson parks where it is:
+ Delivering critical cooling/comfort in a designated heat-refuge park.
B. Design turf as a “cooling asset,” not leftover space:
+ Place turf adjacent to shade groves and seating (so the turf is usable in summer).
+ Where possible, avoid large unshaded turf panels that become heat-exposed.
C. Create a drought “operational hierarchy” for turf: in design, classify turf areas within existing and future parks as Tier 1/2/3/4 (e.g., programmed (athletics), community events/programs, multiuse, or ornamental) so P&R can reduce irrigation strategically during shortage declarations without losing all recreation value.
D. Codify conversion away from cool-season turf where feasible: The City has identified major turf conversion projects, including converting irrigated cool season turf to warm season turf with major annual water savings. Add a best-practice design
rule: new parks should avoid cool-season turf except where there is a documented, approved functional need.
E. Plan for AB356 compliance proactively in future park design: incorporate a “Nonfunctional Turf Test” into concept design and pre-final plan review to ensure alignment with relevant state laws.
F. If synthetic turf is used over large areas, require heat-mitigation design: EPA studies have found that synthetic turf fields can be substantially hotter than natural grass (up to ~60°F hotter in some conditions). Best practice additions include:
+ Shade structures or perimeter shade trees at seating/edges.
+ Hydration stations at entrances.
+ Operational triggers (field closures/modified programming during extreme heat).
+ Real-time surface temperature monitors.
+ Irrigation systems for rapid cooling prior to games/events.
G. Use “right-size sports turf” layouts: avoid irrigating out-of-play corners and unused edges of natural turf fields; design crisp boundaries and use drought-tolerant landscape or xeriscape buffers instead, provided they meet relevant safety criteria.
6. IRRIGATION:
A. Establish park-level water budgets and track them: require every new park/major renovation to submit:
+ This goes beyond hardware specs and makes the system operable under real restrictions.
B. Integrate Advanced Metering + anomaly detection: align with the City’s broader move toward expanded water monitoring (e.g., AMI adoption targets are identified citywide). Leverage monitoring best practices such as real-time monitoring dashboards that flag continuous flow/ leaks, unusually high runtime, and broken heads by zone.
C. Require subsurface or low-evaporation irrigation strategies where appropriate: especially for turf conversions around mature trees and high-wind exposures where overhead overspray losses are common.
D. Retrofit or adjust irrigation systems to protect trees during turf conversions: where turf is removed, explicitly transition tree irrigation so trees don’t lose “incidental” watering. The current design standards discuss using Netafim in turf conversion contexts; consider elevating this into a required conversion protocol.
E. Develop a Drought Operations Playbook: define which zones shut down first, which are protected (tree establishment, safety cooling features), and how schedules change during restrictions.: require an O&M “heat response plan” that defines when and how irrigation is adjusted during extreme heat (deep watering for trees, reduced daytime watering to limit evaporative losses, etc.) while staying within water waste restrictions.
F. Prohibit the use of outdated systems and components - Prohibit the use of basic residential systems and controllers in any future park projects at new and existing sites.
G. Invest in quality – Utilize high-quality components and systems to reduce the long-term costs associated with maintaining and operating the systems.
H. Convert all flow meters from mechanical to digital (electromagnetic): Digital flow meters have a higher initial cost due to advanced tech but offer better long-term value with higher accuracy, data logging, and less maintenance, while mechanical meters are cheaper upfront but incur higher upkeep from wear and tear and add costs for features like pulse outputs, making them less cost-effective over the life of the system. The initial price differential is decreasing, as digital electromagnetic (mag) meters
are increasingly available at competitive prices and, in some cases, may be less expensive than fully equipped mechanical meters. This cost advantage is further supported by their enhanced durability and reduced need for replacement parts.
I. Integrate intelligent controls system-wide – Utilize controllers that allow for remote management at all sites, prioritizing those with the greatest irrigation demands. Choose the right controller for the right location/application:
+ iQ -type controllers are already being implemented at some smaller and/or less complicated sites. Feedback from P&R’s maintenance staff indicates that these systems, which allow for remote management, are affordable and easy to install, utilize cellular signals for remote communication, and utilize a 2-wire system that is easy to update.
+ SiteSat-type controllers are much more intricate, however, are better solutions for larger, complicated sites with high irrigation demands, complex watering schedules/needs, and large numbers of zones.
C. MATERIALS & SURFACES
The Materials and Surfaces best practices focus on reducing the “stored heat” and high-radiantload conditions created by pavements, plazas, play surfacing, and furnishings—elements that can become some of the hottest touchpoints in a park environment.
Grounded in the evaluation criteria, the intent is to increase the use of high SRI/low heat retention hardscapes and furnishings while also minimizing unnecessary paved area and prioritizing the specific places where people pause, queue, play, or exercise.
A key intent in this section is to design for wholebody thermal comfort, not just cooler surface temperatures. For example, cool pavement treatments can reduce surface temperatures, but research also shows that mean radiant temperature can be elevated at midday/afternoon over some cool pavement and concrete conditions compared to
PART FOUR
asphalt—reinforcing the need to pair cool materials with shade and glare/radiant-heat management
These best practices therefore emphasize coordinated surface + shade strategies that measurably lower heat stress risk at the pedestrian scale (where it matters most for park users).
1. PAVEMENTS & HARDSCAPES:
A. Adopt “Thermal Comfort Performance” for hardscape: require designers to show that key pedestrian routes, plazas, and key amenities – such as sports courts, playgrounds, fitness areas - meet a designated thermal/SRI target (e.g., shaded or reduced mean radiant temperature) rather than only meeting dimensional/ADA requirements.
B. Establish SRI/solar reflectance targets for highexposure pedestrian surfaces (especially around playgrounds, courts, trailheads): EPA studies note that increasing pavement solar reflectance can measurably reduce surface temperatures (rule-ofthumb: every 10% increase in reflectance can reduce surface temps by ~7°F).
C. Avoid “cool pavement without shade” as a comfort strategy: A study of the Phoenix Cool Pavement pilot projects found that reflective, high-SRI coatings did reduce pavement surface temperatures (~9–16°F), but also increased mean radiant temperature (~5.5°F), which can reduce pedestrian comfort if shade is absent from areas that embrace the use of cool paving/high-SRI paving systems. To prevent this outcome, pair reflective pavements with trees/structures and focus cool pavements applications on:
+ Parking lots.
+ Low-occupancy service zones.
+ Shaded trails (not fully exposed paths).
D. Embrace a “shade-first trail planning” approach: prioritize aligning primary trail and path loops where long segments can be shaded by trees, landforms, or structures; then select surface materials as a secondary heat tool.
E. Use permeable pavements strategically as stormwater and cooling infrastructure: in lowspeed parking bays, plazas, and trailheads where infiltration can support adjacent tree basins (reducing runoff and supporting canopy), or in larger applications, collected in subsurface structures and directed back to Lake Mead. The textured surfaces of porous concrete and asphalt systems, as well as the wider joints present in many permeable unit paving designs, create micro-shadows that contribute to a reduction in surface temperatures, making parking bays more pleasant environments for park visitors.
F. Develop a retro-fit “cool paving” toolkit - coolcoat/seal applications for existing asphalt paths/ plazas where replacement isn’t feasible (especially older parks noted to have darker surfacing).
G. Utilize lighter, more neutral colors for sports courts and playground surfacing – while still maintaining visual interest and functionality. Lightening ground surface colors draws attention to other site components, such as playgrounds and fitness equipment. Consider utilizing a small playground or fitness area renovation to test new, resilient safety surfacing systems which utilize natural materials and have a lighter color. Avoid the use of synthetic turf and dark-colored bonded rubber mulch for playground surfacing due their propensity to retain heat.
2. SITE FURNISHINGS:
A. Establish “touch temperature” and burn-risk prevention standards - for benches, handrails, playground equipment, and fitness equipment. In extreme heat, unshaded metal/plastic surfaces become safety hazards. Require that seat/table contact surfaces be designed to remain usable in summer (e.g., thermally broken surfaces, slatted/ ventilated materials, lighter high-SRI finishes).
B. Require shade coverage for all seating clusters - not just “provide benches,” but “provide benches in shade” (trees or structures). Shade structures can reduce perceived/ambient temperatures significantly (>20°F reductions are cited in regional heat adaptation studies).
C. Specify light-colored, low-heat-absorption finishes for tables, receptacles, railings, and bike racks—especially in full-sun locations.
D. Add “thermal comfort furnishings” that extend safe and comfortable park use in summer: potential examples include:
+ Drinking fountains with bottle fillers and pet bowls at select, shaded seating nodes
+ Shaded stroller and bicycle parking near play areas
+ Shaded dog water stations at dog parks.
E. Select furnishings that are durable and lowmaintenance: choose furnishings and details that reduce overspray irrigation damage, dust accumulation/abrasion, and thermal/UV degradation.
D. LIGHTING & UTILITIES
Lighting and utilities are the enabling infrastructure that make parks adaptable when extreme heat shifts how—and when—people recreate. Because Henderson is already adjusting operations to heat realities (including shifting programs toward indoor and evening use and activating recreation centers as daytime cooling stations under National Weather Service warnings), parks and facilities increasingly function as all-hours community assets and part of the City’s emergency response network.
In practical terms, this means that the reliability, efficiency, and flexibility of park utilities now directly influence equitable access to recreation and refuge during heat events. In response, this category emphasizes systems that support both drought and heat resilience: stormwater runoff management, efficient lighting that facilitates nighttime use, renewable energy deployment, and integration of modern technology to automate operations and communicate with users.
In a desert environment, stormwater is infrequent but valuable; when it does arrive, infrastructure that captures and redirects runoff from large impervious surfaces can reduce erosion and improve water stewardship.
Energy resilience is equally important: on-site solar generation and solar-powered fixtures can reduce dependence on the electrical grid while supporting lighting, communications, and critical amenities during high-demand periods.
Henderson’s existing standards already establish a baseline expectation that lighting be incorporated into parks and follow CPTED principles across key areas like parking lots, playgrounds, shade structures, restrooms, and walking paths.
The resilience opportunity is to treat lighting and utilities as a coordinated “performance system”— one that reduces energy and water use, supports safe nighttime activity, strengthens emergency readiness, and improves operational efficiency through smart controls and monitoring.
1. STORMWATER RUNOFF:
A. Treat stormwater as “supplemental irrigation” for trees and plant material: require every capital project to identify:
+ Where runoff is generated (roofs, lots, paths)
+ Where it is stored, infiltrated, or captured for redirection
+ Which tree groves/basins it benefits
This approach directly supports shade canopy without increasing potable irrigation demand.
B. Design for small-storm functionality: Because Henderson’s dry heat evaporates rainfall quickly, very little stormwater runoff from minor storms and rain events reaches Lake Mead—especially when it moves through a wash first. Smaller rainfall can be collected and redirected on-site to passively irrigate nearby trees, plants, and turf, using various stormwater capture features such as curb cuts, micro-basins, and vegetated swales.
PART FOUR
C. Build “wash-edge cooling and habitat” templates for parks and trails adjacent to un-lined washes (common in Henderson): stabilize slopes, capture sheet flow, and establish desert riparian/native shade corridors where appropriate while balancing water constraints.
D. Add shade and stormwater infrastructure at trailheads and parking lots: retrofit parking lots with a combination of shaded solar canopies, stormwater drain inlets, valley gutters, and/or permeable parking bays that are able to capture stormwater runoff and either direct it via a structured system directly to Lake Mead or utilize it on-site for passive irrigation of key planting areas.
E. Incorporate maintenance protocols: Specify that all new stormwater structures must include accessible cleanouts and straightforward sediment management solutions to ensure long-term functionality. This is particularly important in Henderson, where the arid desert soil is susceptible to erosion during significant storm events, potentially resulting in blockages within stormwater systems.
2. LIGHTING:
A. Use lighting to shift summer activity out of peak heat timeframes: prioritize high-quality, uniform pedestrian lighting to support safe, comfortable, and convenient early-morning and evening use of high-demand amenities, such as:
+ Walking loops within parks
+ Multi-use and sports courts
+ Playgrounds
+ Outdoor fitness areas
+ Splash pads
+ Group/community picnic shelters
+ Trailheads
+ Multipurpose greenspaces designated for regular programming
B. Add heat-emergency mode lighting: identify parks that serve as evening heat refuges and ensure lighting levels, wayfinding visibility, and power resilience support safe extended hours during heat events.
C. Adaptive dimming controls as standard: integrate and/or retrofit controls that enable the use of dimming schedules, motion-activated lighting boosts, and remote monitoring to reduce energy while improving safety and usability of key amenities during darker hours.
D. Integrate “dark-sky + habitat-aware” lighting in natural areas; at key nodes or access points, such as trailheads, while maintaining human safety: lower light spill and correct color temperatures improves ecological resilience and reduces unnecessary energy load.
3. RENEWABLE ENERGY:
A. Standardize photovoltaic (PV)-integrated solar shade structures in key locations, such as:
+ Large shade canopies over parking bays in community and/or regional parks that power both lighting and EV charging stations.
+ At high-use parks/trailheads
+ At key rest points along isolated stretches of multi-use trails or in larger natural areas where there is a lack of utility infrastructure
Establish a pilot program to evaluate different systems and methods for both new construction and retrofitting existing structures at a variety of scales and develop measurable cost-benefit metrics to inform return on investment (ROI) and support decision-making and budgeting processes.
B. Create “Resilient Park Power Nodes”: at select regional/community park that include an integrated system of renewable energy collection and backup battery storage banks to temporarily power critical site systems and amenities such as:
+ Security lighting and cameras,
+ Wi-Fi and other essential communication and remote management systems,
+ AED stations,
+ Mobile device charging stations
C. Pair renewables with other resiliency infrastructure: only generate power that has a purpose, such as powering low-energy fans in shaded pavilions, EV and/or e-bike charging stations, emergency equipment (such as communications systems, security lighting, and AED stations), and smart irrigation communications/controls.
D. Leverage current momentum for renewable energy - The All-In Henderson Sustainability & Action Plan (All-In Henderson) highlights PV capacity growth as a targeted objective. This recommendation can serve as support for demonstration pilot projects in parks, which may receive funding via sponsorships or grants.
4. INTEGRATION OF TECHNOLOGY:
A. Implement a microclimate monitoring program representative parks: measure ambient temperature, humidity, surface temperature, and shade mapping to continually test which combination of interventions work best in different settings and context. Update design guidelines and best practices as new data is obtained.
B. Implement real-time asset monitoring: standardize remote monitoring for irrigation alerts/ leak detection, lighting faults, and (where used) cooling amenities.
C. Install cloud-based mobile surveillance camera systems: at key locations, such as areas with highvalue assets, large crowds or frequent issues. These systems should support real-time interventions through automated alerts and two-way communication. Make sure any chosen system is accessible to the Henderson Police Department and works seamlessly with their existing infrastructure, policies, and procedures.
D. Integrate public-facing digital “heat info” tools: at key trailheads and highly used park sites that increase safety through more efficient communication infrastructure. Examples of potential tools for consideration include:
+ Signage with accompanying QR codes at key locations that link users to heat safety information/resources, shaded trail maps, and cooling station locations.
+ Real-time digital signage in flagship parks that can be updated remotely to inform visitors of heat alerts, emergency situations, and other critical information.
E. Include smart activation infrastructure –such as durable power outlets in shaded nodes, event power hookups (which can also function as emergency power sources), and Wi-Fi access points at appropriate civic hubs to support programming flexibility.
F. Increase safety tech where it improves equity: in the highest heat-vulnerability areas, prioritize security camera coverage, emergency communication infrastructure, and lighting improvements as part of “heat refuge park” upgrades.
E. COMFORT & ACTIVATION
In Henderson parks, comfort is not a luxury layer—it is the condition that determines whether parks can fulfill their core public purpose. Comfort and activation are inseparable in a heat-resilient system—comfortable spaces are more likely to be used, and well-used spaces tend to feel safer, better cared for, and more equitable.
Comfort and Activation best practices seek to translate climate realities into user experience— ensuring parks remain inviting, usable, and socially vibrant even as the number of extreme-heat days increase.
The intent is not simply to add shade “where possible,” but to place shade and cooling where they have the greatest impact, at play, courts, gathering spaces, fitness loops, and high-dwell-time
PART FOUR
destinations, so parks can function as comfortable daily-life spaces during drought and extreme heat conditions that residents identify as top concerns.
These best practices also recognize that comfort is operational: flexible hours, seasonal programming, and durable amenities help Henderson sustain park use patterns without escalating maintenance strain during the hottest periods.
1. SHADED SEATING AREAS:
A. Set minimum shaded seating distribution goals: for each park typology: for example, “provide shaded seating every “X” feet along primary loops and at every major node (playgrounds, courts, trailheads, dog parks).”
B. Orient seating for summer comfort: prioritize shade + exposure to take advantages of prevailing breezes and afternoon shade; avoid placing benches where reflected heat from walls/paving dominates.
C. Use “dual shade”: trees for long-term shade + structures for immediate shade, especially important where trees are immature.
D. Design shaded seating as social infrastructure: create larger shaded social clusters that support intergenerational use (grandparents at play areas, spectators at courts).
E. Retrofit-first strategy: prioritize shading of existing seating areas – including those with ADA seating - where feasible before adding new amenities.
2. SHADED AMENITIES:
A. Require shade for the highest-risk amenities (not just “recommended”):
+ Playgrounds (equipment + perimeter seating)
+ Splash pads (queuing/perimeter areas and caregiver seating)
+ Dog parks (seating + water fountains)
+ Sport courts (spectator seating areas)
+ Outdoor fitness nodes (activity areas and equipment)
B. Don’t rely solely on shade structures - strategies for providing shade around key amenities should always be a combination of structured shade (from buildings, roofs, shelters, sails, etc.) and natural shade from trees and existing landforms.
C. Prioritize providing shade when it is needed the most – such as during summer afternoons. Site/locate trees and shade structures so that they provide shade during the hottest parts of the day and year; test and confirm these assumptions before construction with shade studies at each key phase of the design process.
D. Use shade structures as utility platforms: integrate PV (renewables), fans (where feasible), and lighting to extend use into evenings.
E. Design “shade gradients”: partial sun for winter comfort + deep shade for summer refuge, so amenities remain usable year-round.
F. Pair shade with cool paving: hardscape areas to be shaded should also utilize cool paving systems. If retroactively shading an existing dark/ low-SRI hardscape area, consider surface-applied cool pavement coating application to reduce heat retention and maximize ROI.
G. Phased shade tree strategy: pair both instant constructed shade with gradual canopy growth from newly planted shade trees, allowing overall shade performance to increase progressively over time as the trees develop and reach maturity.
3. COOLING ENVIRONMENTS & AMENITIES:
A. Establish a tiered “Cooling Network” of parks: that defines what types of active and passive cooling amenities should be expected. Every community/ destination park should have at least one defined cooling opportunity appropriate for its scale/typology.
+ Tier A: regional parks/rec centers with indoor cooling access + backup power readiness
+ Tier B: community parks with outdoor heat refuge nodes (deep shade, hydration, device charging)
+ Tier C: neighborhood parks with basic shade, drinking water access, and clear wayfinding to Tier A/B sites.
B. Prioritize active cooling investments in high heat vulnerability areas – such as East Henderson (as identified in the RTC’s Southern Nevada Extreme Heat Vulnerability Analysis report), as well as in areas with a large percentage of senior and/or lower income residents.
C. Prioritize low-water cooling as a first line response: (shade + materials + airflow) and only then add water-based cooling amenities – such as spray grounds, splash pads, and/or on-demand showersas necessary based on the role and function of the park.
D. Water-based cooling amenities should be as resource efficient as possible – all future splash pads/ spray grounds should be operationally sustainable and minimize evaporative loss though the inclusion of on-demand timers and/or occupancy sensors.
E. Maximize the benefits of secondary coolinglocate water-based cooling amenities strategically so that any ambient cooling benefits provided are benefiting other high-priority amenities, such as playground or community shelters.
4. PROGRAMMING FLEXIBILITY & ACTIVATION:
A. Design for “night park” functionality: ensure that lighting, restrooms, and wayfinding are provided as appropriate to support evening programming and self-directed usage.
B. Build flexible, shaded multi-use “pads”: at key program/event sites for pop-up programming (fitness, markets, events) with power/water hookups under shade.
C. Incorporate drought-tolerant event lawns: smaller, shaded, highly functional turf spaces with perimeter shade (both structured and natural) that can accommodate larger-scale events while also still providing places of refuge from the heat.
D. Enable seasonal reconfiguration: movable shade sails, temporary/portable fans, and modular seating to adjust to changing heat conditions and budgets.
E. Facilitate distributed activation - place small activity nodes distributed throughout parks to increase “eyes on the park,” reduce isolated heat exposure, and improve user perceptions of safety.
F. ACCESSIBILITY
In extreme heat, accessibility is not only about whether a park is technically reachable—it is about whether the trip to the park and movement within it are safe, comfortable, and realistic for a broad range of users. The resiliency framework defines accessibility through a heat- and equity-informed lens: ease of walking to parks (including shade as a factor), ease of walking within parks, multimodal access (transit, bike connections, sidewalks), support for low-emission vehicles (EV and e-bike charging where feasible), universal design/ADA accessibility, and clear wayfinding that helps users navigate comfortably and confidently.
This category’s role in a resilient Henderson system is to reduce barriers that become magnified in heat: long, unshaded approaches; disconnected internal paths; confusing circulation; and limited options for those who cannot or do not drive. It is also central to climate adaptation and sustainability, because multimodal access and low-emission transportation options reduce the system’s overall environmental footprint while expanding who can reliably use parks during hot months.
Henderson’s design standards reinforce the importance of safe, lighted, ADA-compliant circulation within parks, and they also establish a city goal to provide a park within a 10-minute walk of every resident. A resilient accessibility approach builds on these expectations by prioritizing shade, rest opportunities, and clear navigation so that “proximity” translates into genuine, equitable access—even when temperatures are high and walking conditions are physically demanding.
PART FOUR
1. EASE OF WALKING TO THE PARK:
A. Design “Cool Corridors to Parks”: coordinate with Public Works and Community Development and Services to prioritize shade trees, shade structures, and high-albedo sidewalks on routes from:
+ Transit stops
+ Schools
+ Senior housing
+ Heat-vulnerable neighborhoods
B. Add shade at crossings and waiting areas: shade at key intersections and park entrances reduces heat exposure for pedestrians.
C. Integrate wayfinding that includes heat-related comfort and safety information at key crossings: such as the distance to the nearest cooling node, shaded route options, and nearest drinking water location.
D. Prioritize barrier reduction in high-risk areas: in places where major roads limit access, invest in safe crossings and shaded approaches:
+ Work with Public Works to improve the visibility/contrast of light-colored concrete crosswalks across park entry drives through the addition of reflective thermoplastic or other high-visibility surface treatments.
+ Add on-demand pedestrian crossing signals (such as the Traffic Hawk systems) at mid-block crossings along wide and/or high-volume/ speed roadways.
2. EASE OF WALKING WITHIN THE PARK:
A. Establish a “shaded loop minimum”: every community and regional park should include at least one loop route that is largely shaded – through a combination of both natural and structured shade - to support safe walking in summer mornings/evenings.
B. Improve thermal comfort along routes - Adopt rest + water spacing standards that establish maximum distances between shaded rest nodes and drinking water access points, especially on long loops and trail segments.
C. Plan for mobility device heat safety: specific transfer surfaces and handrails that don’t become dangerously hot and ensure the availability shaded seating sized for wheelchairs along key walking paths.
D. Sur face temperature management – where possible, embrace the use of cool pavements for key looping and connecting walks, paths, and trails within parks.
3. MULTI-MODAL CAPACITY:
A. Shade + hydration at trailheads and mobility nodes: treat trailheads as “mini cooling stations” with shade, water, and wayfinding.
B. Provide secure, shaded bike parking: covered bike parking reduces equipment overheating for e-bikes and increases ridership in summer. Consider incorporating solar-powered e-bike charging stations at key locations along the trail network.
C. Add repair + emergency tools at key nodes and trailheads: expand on bike repair concepts to include emergency contact/locator and heat-related safety information and resources.
D. Increase transit use by increasing transit comfort: where parks are within a 10-minutes walk of transit stops, advocate for the inclusion of shaded seating/waiting areas and wayfinding to/from the stop (coordinate with appropriate transit agencies).
4. LOW-EMISSIONS VEHICLES (LEVS):
E. Install LEV charging at major destination parks: (regional/community parks with large parking lots), prioritizing high-use facilities and facilities within heatvulnerable service areas. The All-In Henderson plan tracks a large increase in public EV charging stations per capita; parks are logical host sites. Evaluate the feasibility of utilizing renewable energy sources, such as solar, as supplemental power sources.
F. Add e bike charging + secure storage at trailheads to support alternative transportation during cooler hours. Explore the feasibility of using renewable energy sources to power e-bike charging stations, which should be covered to reduce equipment overheating during the summer.
G. Pair LEV infrastructure with solar shade: at larger sites, such as regional or community parks, PV carports reduce heat in parking lots and provide supplemental power to LEV charging stations (dual benefit).
H. Invest in electrified maintenance equipment and infrastructure: plan charging and storage facilities for electric maintenance vehicles and equipment use, which is anticipated to increase in the future.
5. UNIVERSAL DESIGN:
A. Define “Heat-Aware Universal Design”: not just ADA compliance—design to reduce heat stress for:
+ Older adults
+ Children
+ People with disabilities
B. Cool accessible routes: ensure accessible routes connect to both shade and water -an ADA route that is unshaded in 115°F conditions is functionally limiting. Accessible routes always connect to at least one shaded, hydrated rest node.
C. Provide shaded, accessible social spaces: tables and seating with clear wheelchair access under shade
in the main activity areas of the park.
D. Facilitate heat-resilient inclusive play: create shaded sensory zones, cool-touch materials, and caregiver seating in shade.
E. Ensure water access that works for everyone: provide bottle fillers/drinking fountains at multiple heights and include a dog bowl as standard (for both pets and service animals).
6. CLARITY OF WAYFINDING:
A. Add “thermal wayfinding” layers: at trailheads and major decision points:
+ Shaded route options
+ Distance/time to next shade and water location
+ “You are here” plus nearest cooling center/rec center.
B. Sandardize emergency location and QR integration: include a physical locator system and QR codes that open:
+ Location coordinates
+ Heat safety guidance
+ Emergency contact options.
C. Use multilingual, icon-forward heat safety messaging in high-vulnerability areas. Include QRlinked multilingual content for interpretative and safety information.
D. Ensure nighttime legibility: reflective/illuminated wayfinding that supports evening use.
PART FOUR
G. HEALTH & SAFETY
Health and Safety best practices position parks as essential public-health and community-support infrastructure during extreme heat—places that are safe, welcoming, well maintained, and equipped with the resources people need to prevent heat illness and respond to emergencies.
The criteria emphasize “eyes on the park,” appropriate lighting, site condition, and activation as contributors to perceived safety, while also addressing maintenance intensity as a resilience issue—because reducing maintenance demands can lessen staff exposure to extreme heat and reduce the carbon footprint associated with upkeep.
This section also recognizes that health and safety in Henderson’s climate is inseparable from access to basics: reliable drinking water and consistent, easy-to-understand emergency information about risks like heat exposure and dehydration. The intent is to build on (not replace) the City’s established safety framework—such as its commitment to CPTED as part of every trail and park design — while strengthening heat-specific protections and communication so that preventable heat-related harms are reduced through coordinated, designforward interventions
1. PERCEPTIONS OF SAFETY:
A. Design shaded areas for visibility: avoid creating hidden pockets under dense shade structures; maintain sightlines while providing refuge.
B. Provide Heat refuge without isolation: place cooling nodes near active areas and staffed buildings when possible.
C. Use lighting + shade together to encourage evening use safely (a key adaptation to extreme heat).
D. Prioritize activation of parks in heat-vulnerable areas with programming and comfortable spaces to increase positive use and natural surveillance.
2. PHYSICAL CONDITION:
A. Use materials and finishes rated for extreme heat exposure: specify surfacing, coatings, and jointing that withstand thermal expansion/contraction and UV degradation.
B. Provide increased slip resistance under water features and near drinking fountains, especially where park users seek water for cooling.
C. Create a “hot weather inspection checklist”: identify buckling, cracking, and heat-damaged play surfacing before peak season.
D. Address dark surfacing retrofits where high heat buildup is documented, such as dark colored bonded rubber mulch safety surfaces.
E. Lifecycle replacement planning: build standard “renewal cycles” into design choices (modular components; readily replaceable parts) to avoid rapid decline.
3. INTENSITY OF MAINTENANCE:
A. Design for “maintenance realism”: simplify overly complex landscapes that require constant edge control, DG containment, and high-detail repairs. Specify resilient details for DG and xeric areas:
+ Proper edging/cobbles where DG meets concrete
+ Stabilized DG in high-traffic zones
+ Varied aggregate/topography to reduce windblown fines and erosion.
B. Use smart operations: expand “data-driven operations” approaches to landscape and utilities maintenance informed by actual use, heat conditions, and sensor alerts.
C. Maintenance heat-risk reduction: prioritize designs that reduce midday maintenance needs. Select plant palettes that reduce long-term inputs: fewer replacements, less pruning, and better establishment survival under hotter conditions and require less routine maintenance, reducing staff exposure.
D. Standardize parts and systems to reduce repair time and emergency callouts during extreme heat.
E. Implement remote monitoring for irrigation and lighting systems to reduce “site walks” in peak heat.
4. HEALTHY LIFESTYLES:
A. Provide shaded outdoor fitness “rooms:” equipment zones under shade (with adjacent hydration) support usage even in warm seasons.
B. Design “heat-safe walking circuits” with frequent shade and water; prioritize in parks serving older adults.
C. Integrate mental health and respite spaces: quiet shaded groves, sensory gardens, and naturecontact areas.
D. Use parks as “cooling + health infrastructure”: reinforce the City’s role of parks and facilities in emergency response and continued recreation access in hottest periods.
5. ACCESS TO DRINKING WATER:
A. Set facility-specific “hydration spacing” targets: determine the maximum distance between drinking water sources on long loops and trails; include specific requirements for trailheads, dog parks, athletic facilities, and outdoor fitness areas.
B. Upgrade to bottle fillers with chilled options at high-use locations (where feasible) to increase hydration uptake during extreme heat.
C. Include pet hydration as standard: dog bowls should be included as standard on all drinking fountains.
D. Design for redundancy: include multiple drinking water access points in “heat refuge parks” so a single outage doesn’t remove critical service.
E. Provide shade at water sources: drinking fountains in full sun discourage use and create hot surfaces; strategically locate drinking fountains to take advantage of existing shade or add shade retroactively through the inclusion of new shade trees and/or structures.
6. ACCESS TO EMERGENCY INFORMATION:
A. Standardize a “Heat + Emergency Info Kit” at all major parks/trailheads:
+ Emergency locator ID.
+ Nearest cooling center/rec center locations.
+ Mental health emergency information/contact numbers.
+ Information on signs/symptoms of heat stroke and what to do if you are experiencing it.
+ QR code to live alerts and park status.
+ Multilingual, icon-based messaging.
B. Location-aware emergency response: add a simple location code system (at entrances, major nodes, along remote trail routes, etc.) so users can report where they are when calling 911.
C. Add real-time alert capability at Tier A/B cooling parks: solar-powered electronic signage or kiosks that can display heat warnings and operational changes.
D. Integrate with the City’s operational heat response: since rec centers are activated as cooling stations under National Weather Service warnings, wayfinding should explicitly guide users to these sites during extreme events.
Figure 4.11 - Health and safety signage at the Whitney Mesa Recreation Area (2025).
H. CASE STUDY: POCKET PARK
CADENCE POCKET PARK
1190 N Water St
Cadence Master Planned Community
0.87 Acres
VISION
As Henderson continues to grow and developable land becomes increasingly scarce, the City will need to embrace alternative strategies for providing park and open-space access. While there are currently few pocket parks under the purview of Parks and Recreation, this typology could play a larger role in the future park system by delivering highly walkable, neighborhood-serving recreation space in smaller footprints. As a case study, we have re-imagined what a pocket park could be within the Cadence development. Although these spaces are currently HOA-maintained, they represent a long-range opportunity for the City and demonstrate how parks at this scale can be redeveloped to provide a higher level of recreational service while also improving environmental performance.
The concept focuses on an island green space ringed by Pulse Avenue and Divertimento Street in Cadence, just east of N. Water Street. Today, the site is a prototypical underutilized pocket of open space: a simple fescue lawn panel edged by a narrow paver walk, limited seating, and planting beds of manicured shrubs and ornamental trees that create a physical separation from the adjacent street and sidewalk.
The space lacks universal (ADA) access, and there are no existing crosswalks or pedestrian connections that directly link surrounding intersections to the interior.
This pocket park is re-imagined as an intentionally programmed, high-performance neighborhood amenity that incorporates resilient landscape strategies. The vision introduces a shaded pavilion, a nature-themed play area, a flexible-use lawn, and internal looping walkways supported by improved pedestrian connectivity—including crosswalks, enhanced street interfaces, and on-street parking where appropriate. A desert-adapted planting palette and site form inspired by local mesa landscapes— where protective buffers and canyon-like forms create localized microclimates—help reduce water demand, improve comfort, and better reflect the native ecosystems of the Las Vegas Valley.
PART FOUR
1. LANDSCAPE
A. Landscape Plantings
Resilient planting should emphasize native and desertadapted species that can rely primarily on rainfall once established, with minimal long-term irrigation. Organize palettes by hydrozones—concentrating drip irrigation in high-value areas like shade tree groves and gathering spaces, then transitioning to low-water shrublands, grasses, and groundcovers reflective of Mojave Desert communities. Use temporary establishment irrigation that is reduced or removed as plants mature.
Planting should leverage landform and materials to improve performance. Mass non-irrigated shrubs near boulders and rock outcrops to create structure, shade soils, and moderate temperatures, supporting healthier root zones with less moisture loss. Cluster plants with similar water need to improve habitat, reduce exposed soil and weeds, and increase irrigation efficiency.
Support long-term durability with mulched, layered plant communities and soil improvements where needed, and pair planting with swales or microbasins to capture stormwater and incidental runoff— reducing water demand while improving heat and drought resilience.
B. Radiant Heat
To help minimize radiant heat in Henderson’s desert climate, hardscape and activity areas should be designed to reduce heat absorption, increase shade coverage, and interrupt large expanses of exposed paving. Light-colored, high-albedo concrete and unit pavers lower surface temperatures compared to darker materials and reduce heat re-radiation into adjacent seating, paths, and play zones—especially when paired with shade from trees or structures. Playgrounds, fitness stations, and seating should be located within shaded “comfort zones” (tree canopy and/or shade structures) to protect users and extend the hours of usability during warm months.
Natural stone can further support heat mitigation when thoughtfully integrated. Varied boulder and cobble groupings create textured, shaded ground planes with pockets of cooler microclimates, breaking up continuous turf or pavement and reducing overall radiant load. These rock-based
surfaces also limit evaporative water loss compared to irrigated lawn, and when combined with desertadapted planting and deep mulch, they help stabilize soil moisture while keeping ground temperatures lower than exposed bare soil. Together, highreflectance hardscape, shaded activity nodes, and strategically placed stone/planting systems create a more comfortable, resilient landscape that performs better under extreme heat.
C. Trees
Shade trees are thoughtfully located to the south and west of heavily used spaces to provide relief from the most intense sun exposure, particularly during summer afternoons. Trees are planted in clusters to shade each other’s root zones, reduce soil temperatures, and improve overall canopy performance through shared microclimate benefits and evapotranspiration. In the Las Vegas Valley, placement should also respond to heat-reflective surfaces—prioritizing shade over pavement, play areas, seating, and building edges—while maintaining clear sightlines, and safe circulation. Species selection should favor desert-adapted, drought-tolerant shade trees with proven performance in alkaline soils and high winds, and trees should be sited within larger, interconnected planting zones (rather than isolated turf rings) to allow deeper mulching, healthier soil biology, and more efficient drip irrigation. Where possible, trees should be aligned with swales and low points to capture stormwater and incidental runoff, supporting long-term establishment and reducing supplemental irrigation demands.
D. Turf
At the center of the design is a flexible-use lawn. Its circular form maximizes adaptability for play and programming while minimizing underused corners. Shaded edges create a comfortable microclimate for picnicking and everyday leisure. Where feasible, flexible-use lawns should be sized to accommodate neighborhood gatherings, family outings, and dayto-day passive recreation. Turf should consist of hybrid bermudagrass or another desert-adapted warm-season species to reduce water use while still supporting a range of recreational activities.
E. Irrigation
Irrigation should be utilized sparingly and concentrated into localized plant groupings. Focused irrigation on shade trees to sustain healthy tree canopy and thus more shade can minimize
PART FOUR
3. LIGHTING & UTILITIES
A. Stormwater
Runoff
Where feasible, incorporate dry basins and constructed washes that use varied aggregate sizes and integrated planting to slow, convey, and absorb stormwater. These channels should be graded to direct flows to a central basin or collection point, where water can be detained and redistributed through the broader site system. Permeable paving should be used strategically to move rainfall into subgrade drainage layers and conveyance channels, reducing runoff and limiting the time water spends on hot hardscape surfaces—thereby minimizing evaporative loss.
B. Lighting
At the pocket-park scale, localized solar lighting is an effective strategy to support safety and evening use. Solar pedestrian fixtures reduce the need for trenching and electrical upgrades, making them well suited for retrofits and minimizing added utility demand. Lighting should be concentrated at key amenities and gathering areas and provided consistently along walkways to ensure comfortable, well-lit circulation.
C. Renewable Energy
While renewable energy is typically easier to implement at community or regional parks, pocket parks can still incorporate photovoltaic (PV) systems when the site includes shade structures, pavilions, or other elevated canopies with adequate solar access. Integrating PV panels into these structures can offset on-site electrical loads and reduce the need for new utility service or extensive trenching. Power can be routed to weatherproof, code-compliant GFCI-protected outlets to support user needs such as device charging, small event equipment, and maintenance operations.
D. Appropriate Integration of Technology
At the pocket-park scale, integrated technology should focus on low-maintenance systems that improve performance, safety, and operational efficiency without adding unnecessary infrastructure. Priorities include smart irrigation controls—weatheror ET-based controllers paired with soil-moisture sensors, flow meters, and leak detection—to finetune runtimes, reduce overspray, and quickly identify breaks or valve failures. Solar pedestrian lighting can
be supplemented with fixture-level controls such as photocells, time clocks, dimming schedules, and motion-based “boost” settings to maintain visibility along paths and amenities while minimizing energy use and light spill. Where feasible, these systems should be configured for remote monitoring and alerts (via cellular or secure network connection), with standardized components, clear maintenance access, and durable, vandal-resistant enclosures to support long-term reliability in Henderson’s heat and sun exposure.
4. COMFORT & ACTIVATION
A. Shaded Seating Areas
Benches are placed beneath shade trees where possible. A shaded tree grove adjacent to the structured play space and lawn provides pleasant microclimates with clear sight lines for observing children at play.
B. Shaded Amenities
Benches should be located beneath shade trees or structured shade wherever feasible to maximize comfort and extend usability throughout the day, particularly during summer afternoons. In small pocket parks, a shaded tree grove can serve as the primary “comfort room” of the site—anchoring seating, passive recreation, and social gathering in a cooler microclimate. Positioning this grove adjacent to the structured play space and flexible-use lawn creates an ideal setting for caregivers and families: users can remain in shade while maintaining clear, unobstructed sight lines to supervise children and watch activity across the park.
C. Cooling Amenities
At the pocket-park scale, shade is the primary cooling amenity. Provide abundant natural shade by establishing healthy, drought-tolerant shade trees in groves and clusters, and supplement canopy cover with structured shade—such as pavilions or picnic shelters—located adjacent to key amenities and lawn areas. Include convenient water access near primary gathering and activity zones to support comfort and park use.
D. Programming Flexibility and Activation
Pocket parks should be designed to support small neighborhood gatherings—such as block parties,
family events, and informal get-togethers—while remaining highly functional for everyday use. Open space should accommodate group congregation by pairing flexible lawn areas with nearby shade and seating amenities. In addition, pocket parks should promote daily passive recreation, play, and healthy lifestyles through integrated loop walks and, where feasible, compact fitness or workout stations that encourage regular activity.
5. ACCESSIBILITY
A. Ease of Walking TO the Park
Pocket parks should be highly walkable and easy to access. Because these spaces are often embedded within neighborhoods or along urban streetscapes, they should connect directly to adjacent sidewalks and include nearby crosswalks or safe roadway crossings to support comfortable pedestrian access from all directions.
B. Ease of Walking WITHIN the Park
A porous perimeter supports convenient, universally accessible entry from all sides of the surrounding neighborhood, reducing the need for users to walk out of direction to a single gate. Multiple access points should align with adjacent sidewalks, crosswalks, and curb ramps, and connect to a clear internal loop so visitors can orient quickly and move comfortably through the park. Entry areas should provide stable, slip-resistant surfaces and adequate clear widths to accommodate strollers, wheelchairs, and mobility devices, with gentle slopes and flush transitions at the sidewalk.
Within the park, circulation should respond to how people naturally move. Where “desire lines” occur— such as between corners, seating, play, and lawn— provide defined pathways to discourage trampling and protect native planting. In native vegetation zones, informal stone paths (stepping stones, stabilized decomposed granite, or unit pavers set within gravel) can offer a durable, low-water, desertappropriate solution that reinforces the park’s character while maintaining accessibility where required. These paths should be carefully routed to preserve planting clusters, manage stormwater flow, and provide clear wayfinding, creating a walkable space that feels intuitive, comfortable, and resilient.
C. Multi-modal Capacity
At the pocket-park scale, there are meaningful opportunities to support multimodal access. In urban settings—especially where bus stops are nearby—pocket parks can strengthen transit use by incorporating enhanced shelters, shade, seating, lighting, and clear pedestrian connections that improve comfort and safety for riders and park users alike. In neighborhood and suburban contexts, prioritize safe walking and biking access by providing visible bike racks near primary entrances, connections to bike lanes or low-stress routes where available, and clear, accessible pathways that link the park to surrounding sidewalks and key destinations.
D. Low-Emission Vehicles
At the pocket-park scale, installing EV charging infrastructure is often impractical due to limited space and electrical capacity. However, where onstreet parking is available, dedicating a preferred space for low-emission vehicles near park entrances can help encourage cleaner transportation choices. This strategy can be paired with clear signage, shade where feasible, and proximity to key amenities to maximize visibility and use.
E. Universal Design & ADA Accessibility
Universal design strategies should be integrated throughout the pocket park to ensure safe, intuitive access for users of all ages and abilities. Provide marked crosswalks at key approaches and align curb ramps and detectable warning surfaces directly with crossings to support clear, predictable navigation. Incorporate companion spaces adjacent to benches and tables so wheelchair users and caregivers can sit together comfortably. Use an ADA friendly pavement for primary circulation routes to provide a stable, smooth, and low-maintenance accessible surface. The structured play area should include accessible surfacing and routes that connect entries, play elements, and seating to support inclusive play and supervision.
F. Clarity of Wayfinding
Wayfinding and signage in a pocket park should be clear and purposeful without the scale or complexity required for larger parks. A modest, highly visible sign should face primary pedestrian routes and nearby roadways to help visitors identify
I. CASE STUDY: NEIGHBORHOOD PARK
PASEO VERDE PARK
1851 Paseo Verde Parkway
8.0 Acres
VISION
As Henderson continues to grow in West Henderson and Cadence, new parks and amenities are coming online; however, many established neighborhood parks within the city core are reaching the end of their lifecycle and require reinvestment to meet today’s expectations for comfort, sustainability, and community use. These parks are deeply valued— serving as everyday gathering places and recreational outlets for surrounding residents—and they present a timely opportunity to retroactively improve both environmental and social resilience. Paseo Verde Park is a representative case: a prototypical neighborhood park designed in an earlier era, before water scarcity, stormwater performance, and extreme heat were central design drivers.
While Parks and Recreation has made meaningful progress reducing irrigation demands through turf removal, additional work is needed to ensure
these changes also deliver high-quality recreational experiences and visually compelling landscapes. A key challenge is perception: for many residents, turf has long represented a “green oasis,” and when it is removed, the replacement—often sparse desert planting with decomposed granite—can feel like a loss rather than an upgrade.
As the City revisits these parks over time, the goal should be to pair water-wise conversions with enhanced program and richer, more layered desert landscapes. At Paseo Verde Park, this means reimagining former turf areas as resilient, visually engaging spaces—using landform, boulders, native and desert-adapted revegetation, shade, and targeted amenities—to provide new recreation opportunities, reduce irrigation demand, mitigate heat island effects, and create comfortable places of respite where people, plants, and wildlife can thrive together.
PART FOUR
1. LANDSCAPE
A. Landscape Plantings
The existing planting palette at Paseo Verde Park is dominated by manicured shrub beds—typical of neighborhood parks from its era—while the mature tree canopy stands out as a major long-term asset that should be protected and expanded where feasible. As the park is refreshed, the landscape should shift toward a more resilient, desertappropriate palette that reflects Mojave Desert plant communities and performs well under increasing heat and water constraints, while still providing strong visual character and seasonal interest.
Future planting improvements should emphasize native and desert-adapted species organized into clear hydrozones. Plantings should be grouped in clusters of similar water need to improve irrigation efficiency, reduce overspray, and simplify longterm maintenance. Desert-friendly shrubs, grasses, and accent perennials should be integrated with landforms and boulder groupings to create sheltered microclimates—shading soils, reducing surface temperatures, and protecting plants from wind and reflected heat. These “rock-and-plant” assemblies can mimic local mesa and wash ecologies, establishing more naturalistic structure and habitat while maintaining a clean, intentional appearance.
Careful coordination with the existing tree canopy is essential. Irrigation should be prioritized for preserving and strengthening shade trees—using targeted drip or deep-root watering to sustain canopy health—since tree shade is one of the most effective tools for reducing radiant heat and improving comfort. Desert-adapted understory planting should rely on temporary establishment irrigation that is reduced or eliminated as plants mature, with planting areas shaped to capture rainfall and incidental runoff through microbasins, swales, and depressed beds. Together, these strategies build a layered, climate-responsive landscape that improves park comfort, reduces water demand, and enhances the ecological and experiential quality of Paseo Verde over time.
B. Radiant Heat
Surface materials and solar reflectance play a significant role in mitigating extreme heat in Henderson. At Paseo Verde Park, existing hardscape
is primarily concrete, asphalt, and decomposed granite. As these surfaces reach the end of their service life or are replaced through renovations, specify high–Solar Reflectance Index (SRI) materials to reduce heat absorption and lower radiant reemission—particularly along primary walks, plazas, play areas, and seating zones.
Light-colored concrete and textured paving finishes reduce solar gain and improve pedestrian comfort, while also providing slip resistance and glare control. Heat mitigation can be further strengthened by introducing micro-shadowing and thermal breaks through textured pavements, subtle berming, and varied boulder/aggregate placement that breaks up large, exposed surfaces and creates localized shade at the ground plane. Shaded play and fitness amenities should be prioritized to limit direct sun exposure, and strategically placed boulders and rock-ledges can help cool adjacent surfaces, protect soil moisture, and reduce evaporative losses when integrated with desert-adapted planting and targeted irrigation.
C. Trees
Paseo Verde Park’s mature tree canopy is one of its greatest assets, providing critical shade, comfort, and character. Future improvements should prioritize preserving and extending the life of existing trees through appropriate irrigation, soil protection, and maintenance practices. Where new or replacement trees are introduced, they should be strategically placed to maximize cooling benefits—especially on the south and west sides of high-use areas to block intense afternoon sun. Tree planting should also respond to heat-reflective surfaces by prioritizing shade over pavements, play areas, seating, and building edges, while maintaining clear sightlines and safe, intuitive circulation.
To improve long-term performance, trees should be planted in groves or clusters that overlap canopy coverage, shade root zones, and reduce soil temperatures through shared microclimate benefits and evapotranspiration. Species selection should emphasize desert-adapted, drought-tolerant shade trees with proven success in the Las Vegas Valley’s alkaline soils, wind exposure, and extreme heat. Trees should be located within larger, connected planting zones—rather than isolated turf rings—to support deeper mulching, healthier soil biology, and
PART FOUR
concentrate flows in roadways, contribute to localized ponding or nuisance flooding, and place runoff on hot pavement surfaces where evaporative losses increase. As parks are reinvested in, a more integrated, site-based stormwater strategy is recommended—one that manages water where it falls and uses it to support landscape performance.
Where feasible, incorporate dry basins and constructed washes that combine varied aggregate sizes with native and desert-adapted planting to slow, convey, and infiltrate stormwater. These systems should be graded to direct flows toward a central basin or collection point that can detain stormwater and distribute it through a connected network of swales, microbasins, and subgrade conveyance. Permeable paving should be used strategically in walkways and parking areas to move rainfall into subsurface storage and drainage layers, reducing runoff volumes and limiting the time water spends on exposed hardscape—improving overall stormwater function while minimizing evaporative loss.
B. Lighting
Much of Paseo Verde Park’s lighting has already been upgraded to high-efficiency LED luminaires, and select sport courts utilize on-demand controls— both strong foundations for long-term performance. Future improvements should continue to prioritize LED fixtures paired with resilient controls (photocells, time schedules, and motion- or demand-based activation where appropriate) to reduce energy use while maintaining safety and usability. A consistent, park-wide color temperature is recommended— preferably warm white in the 2700K–3000K range— to improve visual comfort, reduce glare, and support a cohesive nighttime character.
Lighting should be concentrated where it provides the greatest benefit: along primary circulation routes and at core amenities such as playgrounds, seating nodes, restrooms, and sport facilities. This targeted approach supports effective illumination and clear wayfinding while minimizing unnecessary light spill, improving maintenance efficiency, and reducing impacts to adjacent neighborhoods.
C. Renewable Energy
There are currently no renewable energy facilities at Paseo Verde Park. While renewable energy is often more straightforward to implement at larger parks, neighborhood parks can still incorporate photovoltaic (PV) systems when shade structures, pavilions, or other canopies have adequate solar access. Integrating PV panels into these elements can offset on-site electrical loads and, in some cases, reduce the need for expanded utility service or extensive trenching. Power can be routed to weatherproof, code-compliant GFCI-protected outlets to support everyday needs such as device charging, small event power, and maintenance operations.
D. Appropriate Integration of Technology
Technology at Paseo Verde Park is currently focused primarily on irrigation and lighting controls, with on-demand lighting providing a clear operational and user benefit. As the park is updated, technology integration at the neighborhood scale should remain practical and maintenance-oriented—prioritizing systems that improve performance, safety, and efficiency without adding unnecessary complexity.
Key recommendations include smart irrigation controls such as weather- or ET-based controllers paired with soil-moisture sensors, flow meters, and leak detection to fine-tune runtimes, reduce overspray, and quickly identify breaks, stuck valves, or abnormal consumption. Where feasible, these systems should support remote monitoring and alerts through a secure connection (cellular or approved network), allowing staff to respond proactively and reduce water waste. All technology components should be standardized where possible, designed with clear maintenance access, and housed in durable, vandal-resistant enclosures suited to Henderson’s heat, sun exposure, and long-term operational demands.
4. COMFORT & ACTIVATION
A. Shaded Seating Areas
Paseo Verde Park benefits from strong access to shaded seating, leveraging both its mature tree canopy and existing structured shade elements such as pavilions. The renovation vision builds on this asset by expanding and better distributing seating throughout the park—placing new seating beneath
shade trees, within proposed shelter areas, and along shaded pathways and connector walks. Seating locations should be oriented to overlook lawn spaces and core amenities, supporting comfort, casual gathering, and clear sightlines for everyday park use.
B. Shaded Amenities
The park’s core amenities are well shaded by a combination of existing structures and the established tree canopy. Future improvements should protect and maintain this shade infrastructure through routine canopy care and timely replacement of shade structures and fabric elements as they reach the end of their service life. New amenities and facilities should be sited to leverage existing shaded areas whenever possible, and additional structured shade should be added where coverage is insufficient to support comfort and year-round usability.
C. Cooling Amenities
At the neighborhood-park scale, the most effective cooling amenities are reliable shade—provided by both mature tree canopy and structured shade elements—supported by convenient access to drinking water. Drinking fountains should be located near core amenities and high-use areas and remain easy to find along primary circulation routes. Where fountains are installed or replaced, combination units with a bottle filler, standard drinking fountain, and integrated dog bowl are recommended to serve a wide range of users.
D. Programming Flexibility and Activation
Paseo Verde Park is inherently flexible, offering a mix of amenities and open passive recreation areas that support a wide range of users. As the park is retroactively updated, key lawn spaces should be preserved to maintain flexibility while supporting adjacent athletic components (including baseball) and community recreation groups (cricket players, at this park). Renovated landscape zones also present an opportunity to increase activation by adding small gathering nodes—seating, shaded overlooks, and social spaces—strategically located near core amenities and play areas to encourage longer stays, informal events, and everyday neighborhood use.
5. ACCESSIBILITY
A. Ease of Walking TO the Park
Paseo Verde Park is embedded within an established neighborhood and benefits from strong walkable access via surrounding streets and sidewalks. To improve safety and legibility, additional marked crosswalks would be beneficial at key desire lines and park entrances, providing clear, predictable crossing points for pedestrians and strengthening overall access from adjacent blocks.
Figure 4.17 - High-quality xeric area in Potenza Park (2025).
PART FOUR
B. Ease of Walking WITHIN the Park
Internal circulation within the park is strong, but the site lacks a continuous internal loop path. Today, completing a walking loop requires using the street edge in certain areas, which reduces comfort and perceived safety. Adding a dedicated internal loop trail would strengthen connectivity, support walking and fitness use, and keep pedestrians within the park environment. This loop could tie into—and leverage—the existing HOA-maintained walk that runs parallel to the trail along Paseo Verde Parkway, creating a more complete and intuitive circulation network.
C.
Multi-modal Capacity
The Paseo Verde site audit identified limited bicyclesupport facilities. Adding bike parking, clear signage/ wayfinding, and improved pedestrian crossings would strengthen the park’s multimodal access and better connect it to surrounding routes. Given the adjacent trail along Paseo Verde Parkway, dedicated bike racks should be provided within the park and located immediately at primary access points to support trail users and neighborhood riders. As a neighborhood park standard, multiple bike parking locations should be distributed at strategic destinations across the site—near core amenities, entries, and gathering areas—and coordinated with other nearby transit options, such as bus stops where available.
D. Low-Emission
Vehicles
At the neighborhood-park scale, installing EV charging infrastructure may be constrained by site space, electrical capacity, and retrofit costs. Where on-street or on-site parking is available, dedicating a preferred space for low-emission vehicles near primary entrances can still encourage cleaner transportation choices. This approach should be supported with clear signage, shade where feasible, and placement near key amenities to maximize visibility, convenience, and use.
E. Universal Design & ADA Accessibility
Universal design should be integrated throughout neighborhood parks in Henderson to provide safe, intuitive access for users of all ages and abilities. Marked crosswalks should be added at key approaches, with curb ramps and detectable warning surfaces aligned directly with crossings to create clear, predictable pedestrian routes. Within the park, provide companion spaces adjacent to benches and
tables so wheelchair users, caregivers, and families can sit together comfortably. Primary circulation routes should use an ADA-compliant, stable, slipresistant surface—such as cast-in-place concrete or other accessible paving—with smooth transitions and appropriate slopes. Play areas should include accessible surfacing and continuous accessible routes that connect entrances, play elements, and nearby shaded seating to support inclusive play and comfortable supervision.
F. Clarity of Wayfinding
Wayfinding and signage at Paseo Verde Park are currently limited. As part of future improvements, the park should incorporate a more cohesive wayfinding system that helps visitors quickly understand the park layout and locate key destinations. A simple kiosk map at primary entrances can identify core amenities, walking loops, and access points, supported by smaller directional signs placed at key decision points throughout the site. Directional signage should clearly point to major facilities and highlight health and safety resources—such as drinking fountains/water stations and emergency information locations—to improve usability, comfort, and overall park legibility.
6. HEALTH & SAFETY
A. Perception of Safety
Neighborhood parks like Paseo Verde are woven into the surrounding residential fabric and benefit from nearby homes that provide natural “eyes on the park.” To reinforce both safety and comfort, the park should maintain clear sightlines and strong visibility from street edges, sidewalks, and primary entries. Avoid hidden corners and enclosed nooks, and place taller shrub masses selectively so they do not block views into or across the site. Play areas should be easily observable from seating and access points, with planting kept low and paired with rock buffers or other protective edge treatments where play zones interface with roadways. Overall, the park should feel open, legible, and continuously observable— supporting passive surveillance without relying on dense vegetative screens or visual barriers.
B. Physical Condition
Paseo Verde Park—like much of Henderson’s park system—is well maintained, and while it shows signs of age, its overall physical condition remains strong and compares favorably to many parks of similar vintage. When lifecycle renewals and upgrades are undertaken, improvements should prioritize durable, desert-appropriate materials and fixtures, limit high-maintenance landscape areas, and incorporate native or desert-adapted planting and ground treatments that reduce water demand while preserving a consistently cared-for, highquality appearance.
C. Intensity of Maintenance
Large expanses of turf and manicured shrub beds increase maintenance intensity at Paseo Verde, driving higher demands for irrigation, mowing, edging, fertilization, and frequent pruning. As lifecycle renewals occur, turf should be strategically reduced and confined to areas with clear recreational value—sports fields, active program zones, and select flexible-use lawns—while eliminating or converting non-functional turf to reduce both water consumption and routine mowing requirements. Remaining turf areas should be clearly defined with durable mow edges and irrigated as distinct hydrozones to improve efficiency and simplify operations.
Landscape planting should transition from highly manicured beds to more naturalized, desert-adapted communities designed for long-term performance. A layered palette of native and desert-friendly shrubs, grasses, and accent perennials—organized by similar water needs—can provide year-round structure and seasonal interest while reducing trimming cycles. Integrating planting with varied aggregate sizes, boulder groupings, and landform creates visually rich “desert rooms” that suppress weeds, reduce exposed soil, and limit the need for intensive shearing. These planting areas should be supported by lowvolume drip irrigation during establishment, deeper mulching and appropriate soil preparation where needed, and simplified plant spacing and access that facilitate efficient maintenance over time.
D. Healthy Lifestyles
Adding outdoor fitness equipment and dedicated exercise zones—paired with a continuous internal loop trail—would strengthen Paseo Verde’s role as a daily “healthy lifestyle” park for surrounding neighborhoods. Fitness elements should be located along the loop to create an intuitive circuit, with a mix of strength, balance, and mobility stations spaced to reduce crowding and support all ages. The loop itself should be designed for comfortable, yearround use: a continuous, ADA-compliant surface; clear wayfinding and distance markers (optional) to support walking goals; and shaded rest nodes with seating and water access at key intervals. Where feasible, align the loop with existing paths and entrances to improve connectivity, minimize conflicts with sports and play areas, and provide safe, welllit circulation that encourages early morning and evening use.
E. Access to Drinking Water
Drinking water should remain readily available at core amenities. Provide a drinking fountain near the park’s primary amenity hub, located on an accessible route and easy to find from key gathering, play, and seating areas. Where feasible, use a combination unit with a bottle filler and integrated dog bowl to serve both visitors and pets.
F. Access to Emergency Information
Neighborhood parks may have fewer on-site emergency resources than larger facilities, but clear information can still be provided with minimal visual impact. Include a small, durable panel at entry signage or shade structures with emergency contacts, the park address/location reference, and heat-illness and hydration guidance. Where appropriate, incorporate space for temporary neighborhood banners to support community messaging and event coordination.
1. LANDSCAPE
A. New plantings are native and desert-adapted species, organized by hydrozones, integrated with landform and boulders that create shaded soils with optimal microclimate and habitat.
B. Shade trees located to the southwest of highuse areas block intense afternoon sun. Trees are clustered to shade root zones, reduce soil temperature and limit evapotranspiration.
C. 40,000 SF warm season lawn, shaped to maximize program. Shaded edges provide a comfortable microclimate for everyday leisure.
D. Irrigation - Lawn positioned northeast of shade trees has lower water needs. Shade trees and shaded lawn are prioritized for preservation.
A. Light colored pavement and furnishings with high SRI values, pervious where possible. Include micro-shadowing textured pavements.
5. ACCESSIBILITY
A. Add crosswalks along preferred routes. Visual and tactile distinction alerts and slows vehicles.
B. Add paths to complete a dedicated internal loop trail that strengthens connectivity and fitness without relying on street edge sidewalks.
C. Bike parking at primary access points and key amenities.
D. Benches beside primary circulation pathways have companion spaces beside them.
E. Accessible slopes and surfaces on primary circulation routes.
F. Dedicated parking for low emissions vehicles.
6. HEALTH + SAFETY
A. Perception of Safety - clear visibility to and from public right of way and private residences.
B. Play areas are easily observed from adjacent seating and buffered from vehicles by rocks and vegetation.
A. Incorporate dry basins and constructed washes with boulders to slow, convey, and infiltrate stormwater, supporting native ecology.
B. Permeable paving strategically used in parking areas to limit evaporative loss on asphalt.
C. Park pavilion may incorporate solar panels.
A. Seating is shaded and well-distributed along primary pathways or next to core amenities.
B. Core amenities are shaded by mature trees, sails, or shade structures.
C. Locate drinking fountains near high-use areas.
D. Small gathering nodes adjacent to core amenities added to renovated landscape zones.
E. Open lawn compliments adjacent athletic uses.
C. Intensity of Maintenance - Underused lawn space converted to naturalized, desert-adapted communities.
D. Healthy Lifestyles - Fitness equipment located intermittently along continuous walking loop.
E. Digital park kiosks display resources for emergency preparedness as well as community programming like environmental cleanups, recycling events, local markets, etc.
F. Emergency vehicle access to active use areas.
J. CASE STUDY: COMMUNITY PARK
O’CALLAGHAN PARK
601 Skyline Road
20.56 Acres
VISION
O’Callaghan Park is a well-established and cherished Community-Scale park that serves as a gathering place for multiple neighborhoods in southeast Henderson. The park is uniquely positioned adjacent to Galloway Elementary School and down the street from Black Mountain Recreation Center, reinforcing its role as an important civic and recreational hub.
As a legacy park, O’Callaghan Park reflects the design priorities of an earlier generation. While its layout, facilities, and amenities remain functional and well organized, the park was developed at a time when water conservation, stormwater management, and heat mitigation were not central design drivers. Today, the park is characterized by expansive irrigated turf areas, limited stormwater conveyance, and predominantly manicured landscapes rather than naturalized vegetation.
As the park enters a new era of service, there is a clear opportunity—and responsibility—to reshape O’Callaghan Park to respond to Henderson’s evolving climate conditions. The vision for the park is to reposition this valued community asset as a living demonstration of natural systems, native landscapes, and climate-responsive design.
The original concept for the park envisioned a central lake with a pedestrian bridge. While this feature was never realized, the idea provides inspiration for reimagining the park’s core as a network of naturalized washes and dry creek beds. By leveraging existing grade changes and variable elevations, these meandering landscape features would introduce native revegetation zones that move organically through the park.
These dry washes would incorporate a range of natural materials—from large boulders and cobbles to smaller gravels and crushed stone— creating visually dynamic spaces that echo the desert landscapes of the Las Vegas Valley. Beyond their aesthetic value, these naturalized systems would significantly reduce irrigation demand, lower radiant heat, and support native plant communities, fostering habitat for pollinators and desert wildlife while enhancing the experience for park users.
The design approach embraces the park’s established tree canopy while expanding the use of native landscape typologies that are well adapted to local conditions. By working with the park’s topography, the design introduces microclimates that maximize shade, reduce evaporation, and strategically capture and retain rainfall and supplemental irrigation. These microclimate conditions—like those found along desert mesas and canyon bottoms—allow more resilient and abundant plant life to flourish.
Additional enhancements include the future replacement of playground equipment, paired with integrated shade structures to improve comfort and usability. The park would also benefit from the introduction of renewable energy infrastructure, such as parking lot shade canopies with integrated EV charging, further positioning O’Callaghan Park as a forward-looking, sustainable community resource. Together, these strategies re-imagine O’Callaghan as a resilient, climate-responsive park that honors its legacy and prepares to serve future generations.
PART FOUR
1. LANDSCAPE
A. Landscape Plantings
The existing landscape is primarily composed of turf grass, manicured shrubs, and mature shade trees. While the established tree canopy provides valuable shade, there is significant opportunity to reimagine the park’s turf areas and highly maintained planting zones. As community-scale parks evolve to meet changing needs, their landscapes should also respond ecologically and environmentally. A predominantly native and native-adapted plant palette is recommended, drawing inspiration from the surrounding desert valley and prioritizing species with minimal to no irrigation requirements. Nonirrigated, shrubby plantings are strategically placed near large boulders to enhance visual structure while improving soil conditions and moisture retention. Vegetation is clustered to strengthen habitat value, grouping species with similar water needs and taking advantage of microclimates created by boulders, landforms, slopes, and existing shade trees. This approach supports long-term sustainability while creating a more resilient and regionally authentic landscape.
B. Radiant Heat
Surface materials and solar reflectance play a critical role in mitigating rising temperatures in Henderson. Existing hardscape within O’Callaghan Park is primarily composed of concrete, asphalt, and decomposed granite. As these materials reach the end of their service life or are replaced as part of renovations, the use of high Solar Reflectance Index (SRI) materials is recommended to reduce heat absorption.
Light-colored concrete and textured paving surfaces absorb less solar radiation and emit less heat back into the environment. In addition, incorporating micro-shadowing through textured paving, landscape berms, and varied boulder placement and aggregate sizes helps further reduce radiant heat and surface temperatures creating shadows and protection from the sun as well as channels for airflow and water circulation. Providing shaded play and fitness amenities enhances user comfort and safety by limiting direct sun exposure, while strategically placed boulders create cooler ground conditions and reduce evaporative water loss.
C. Trees
O’Callaghan Park benefits from a healthy, established tree canopy that should be preserved and leveraged to enhance user comfort, safety, and visual quality. As trees are replaced or new shade trees are introduced, strategic placement can extend tree lifespan while reducing reliance on potable irrigation. Where feasible, trees should be located within lower landscape areas or swales where stormwater and irrigation naturally collect. Supplemental shading from landforms, ledges, or boulders can further reduce soil moisture loss and support tree health. Shade trees are strategically positioned along the south and west edges of heavily used areas to mitigate the most intense sun exposure. Trees are planted in clusters to shade surrounding soils and benefit from mutual cooling through evapotranspiration.
D. Turf
As with many legacy parks in Henderson, O’Callaghan Park contains an extensive amount of open lawn, including turf beneath mature shade trees. While recent city initiatives have reduced turf with limited recreational value, there remains an opportunity to further strategically reduce and reposition turf areas to lower irrigation demand while increasing functional use.
The future vision for turf at O’Callaghan Park consolidates lawn areas into smaller recreational nodes located near key amenities such as the ballfield, dog park, shade structures, and tree canopies. A single larger open lawn is retained to accommodate community gatherings and flexible recreation. Turf grass should be converted into warm season Bermuda hybrid grass where the application permits. Fescue species of turf grass should be used sparingly or not at all.
Currently, O’Callaghan Park contains approximately 320,900 square feet (7.4 acres) of turf, excluding the baseball diamond and dog parks. The proposed concept reduces functional turf to approximately 190,000 square feet, or roughly sixty percent of the current area. This reduction, combined with expanded naturalized landscapes and native plantings, maintains recreational value while significantly decreasing overall irrigation water consumption. As older community-scale parks are revitalized, a holistic reduction in turf grass is recommended. Turf should be limited to areas
PART FOUR
Integrating solar photovoltaic (PV) panels atop parking lot shade structures presents an opportunity to provide EV charging facilities without drawing power from the grid. PV systems on shade structures and park buildings may also support irrigation controls, on-demand lighting, and other park operations where feasible, reinforcing the park’s long-term sustainability and resilience.
D. Appropriate Integration of Technology
O’Callaghan Park currently utilizes a limited range of integrated technologies, primarily focused on automated lighting and irrigation controls. As the park is renovated or repositioned, there is an opportunity to incorporate additional and more advanced technology systems to enhance safety, efficiency, and user experience.
Potential upgrades include expanded park security systems, pedestrian panic buttons, user feedback kiosks, and next-generation irrigation and lighting controllers. Additional technologies may include thermal monitoring systems to track play surface temperatures and alert users to unsafe conditions, as well as user alert and information systems that provide real-time safety and emergency communications throughout the park.
4. COMFORT & ACTIVATION
A. Shaded Seating
Areas
O’Callaghan Park benefits from a robust, established tree canopy, and existing seating generally takes advantage of this natural shade. The mature canopy should be preserved, with replacement trees provided as needed to maintain long-term coverage. New seating areas should be strategically located to ensure continued access to natural shade or placed beneath integrated shade structures to enhance comfort and usability.
B. Shaded Amenities
Many of the park’s core amenities, particularly the play areas, currently lack adequate structured or natural shade. As O’Callaghan Park is reimagined, providing shade over these high-use amenities is essential to ensuring user comfort and safety. Picnic tables should be located beneath pavilions or positioned to take advantage of mature shade trees.
All play elements should be covered with integrated shade structures or shade sails to minimize heat gain and create comfortable, usable spaces throughout the day.
C. Cooling Amenities
While O’Callaghan Park benefits from a robust tree canopy that provides natural shade, additional cooling amenities can be integrated to further enhance user comfort. A splash pad or water play feature located near the playground could serve as a neighborhood cooling amenity and complement the outdoor pool at the Black Mountain Recreation Center nearby.
Additional shade structures and picnic pavilions may be incorporated along looping pathways and pedestrian routes, while conditioned spaces within renovated restroom facilities could provide essential areas of refuge during periods of extreme heat.
D. Programming Flexibility and Activation
O’Callaghan Park’s current configuration offers inherent flexibility, with expansive lawns and open spaces capable of supporting a wide range of recreational activities and community gatherings. The future vision seeks to preserve this flexibility while enhancing the park with complementary amenities and diverse recreation opportunities.
Proposed program elements may include outdoor fitness areas, looping walking and running paths, play spaces, flexible lawn areas, dedicated sports amenities, and gathering nodes. As a communityscale park, O’Callaghan Park should continue to provide a broad range of amenities and experiences that accommodate diverse users, activities, and levels of engagement.
5. ACCESSIBILITY
A.
Ease of Walking TO the Park
O’Callaghan Park currently provides reasonable access, with marked crosswalks at major intersections along the west edge and a dedicated neighborhood access point at the southeast corner. However, additional access points could improve overall connectivity and permeability into the park.
A mid-block pedestrian crossing with traffic control at Skyline Road would enhance access from the
west by reducing travel distance to a designated crossing. Improved access from the east would require coordination with adjacent property owners, potentially through a dedicated access easement.
B. Ease of Walking WITHIN the Park
The existing configuration of walkways within O’Callaghan Park provides strong internal access and walkability. This connectivity is preserved and enhanced as part of the future vision for the park. Additional connections and looping pathway configurations further link walking and running loops to adjacent circulation routes throughout the site. As community parks are redeveloped or repositioned, incorporating continuous looping walking and running paths is recommended to promote connectivity, accessibility, and active use across the entire park.
C. Multi-modal Capacity
The park currently includes a dedicated bus stop at the northwestern corner. This multimodal access is preserved in the future vision and enhanced through the addition of a dedicated transit shelter to provide shade and improved comfort for transit users.
D. Low-Emission Vehicles
While O’Callaghan Park does not currently provide EV charging facilities, the integration of overhead parking shade structures with photovoltaic (PV) systems presents an opportunity to support EV charging and low-emission vehicles. Community parks should incorporate infrastructure that enables EV charging and other solar-supported amenities as part of future-oriented, resilient design strategies.
E. Universal Design & ADA Accessibility
Accessible crossings, curb ramps, walkways, surfaces, and amenities are currently in place and appear to meet ADA and universal access standards. Expanding the availability of ADA-accessible seating and picnic amenities throughout the park would further enhance inclusivity. All existing and future play equipment and amenities should continue to incorporate universal design principles, including accessible routes and ADA-compliant transition platforms, to ensure equitable access for all users.
Figure 4.21 - Native landscape alongside a trail, Heritage Park
PART FOUR
F. Clarity of Wayfinding
At approximately 20 acres, O’Callaghan Park would benefit from enhanced, integrated wayfinding and signage. Additional kiosks or pavilion-mounted signs with directional information and park maps would help users easily locate amenities throughout the park. Wayfinding should clearly identify key facilities, sports fields, amenities, and transit access points, improving overall orientation, accessibility, and user experience.
6. HEALTH & SAFETY
A. Perception of Safety
The current configuration of O’Callaghan Park provides open sightlines and minimizes overly secluded or hidden areas, contributing to a strong baseline perception of safety. The park’s adjacency to surrounding neighborhoods and residential uses further enhances natural surveillance and reinforces a sense of security.
The future vision seeks to strengthen both actual and perceived safety by maintaining clear visibility throughout the park while organizing amenities into active gathering nodes. High-use features such as play areas are intentionally located near public-facing edges, primary circulation routes, and supporting amenities to encourage continuous activity and passive oversight. Landscape treatments, lighting, and circulation are designed to support safe space principles, fostering a park environment that feels welcoming, active, and secure for users of all ages.
B. Physical Condition
As an older park within the system O’Callaghan’s core amenities and facilities do show signs of aging. During the site evaluation amenities such as playgrounds, shelters, and horseshoes were noted to be showing signs of wear and ending life cycles. The vision for a more resilient O’Callaghan park maintains adjacencies of some of these core amenities and proposes new revitalized components being implemented.
Figure 4.22 - Use of varied aggregate sizes and cobble stone edge to define pathways, Potenza Park
C. Intensity of Maintenance
The existing park contains extensive areas of open turf and manicured landscape beds. A central strategy of the proposed vision is the integration of naturalized planting ecologies to reduce water consumption, mitigate heat, and lower long-term maintenance demands.
Naturalized landscapes require significantly less intensive upkeep than formal shrub plantings, decomposed granite areas prone to washout, and highly manicured beds. Reducing turf areas supports lower mowing and irrigation requirements while maintaining a high level of recreational functionality and user value.
D. Healthy Lifestyles
O’Callaghan Park is well positioned to support healthy lifestyles for surrounding neighborhoods, with strong pedestrian access, internal walkability, and looping pathways that provide convenient circulation to all core amenities. The park also benefits from direct access to multimodal transit at its northern edge.
The future vision builds on these strengths by enhancing opportunities for active recreation and wellness through the integration of outdoor fitness elements, additional recreational amenities such as a splash pad, and diverse landscape environments that incorporate natural systems into the built setting.
E. Access to Drinking Water
There is currently direct access to water at all the core amenities and gathering areas. Access to drinking water for people and pets should be integrated into all core amenity areas and along looping pathways where applicable.
F. Access to Emergency Information
To strengthen social resilience, clear informational and emergency signage should be integrated throughout the park to provide users with timely and accessible guidance during critical situations. This information should be located near primary gathering areas and high-use amenities to ensure visibility and ease of access.
Signage should include emergency contact information, guidance on recognizing heat-related illness symptoms, locations of shaded or conditioned shelter, and the availability of drinking water within the park.
Figure 4.23 - Dry wash/swale with central drainage, Capriola Park.
1. LANDSCAPE
A. New plantings are native and desert-adapted species, organized by hydrozones, integrated with landform and boulders that create shaded soils with optimal microclimate and habitat.
B. Shade trees located to the southwest of highuse areas block intense afternoon sun. Trees are clustered to shade root zones, reduce soil temperature and limit evapotranspiration.
C. 190,000 SF warm season lawn at varied scales for diverse programming. Rounded forms eliminate unused corners, and shaded edges provide pleasant microclimate for daily leisure.
D. Irrigation - Lawn positioned northeast of shade trees has lower water needs. Shade trees and shaded lawn are prioritized for preservation.
E. Turf grass should be converted into warm season Bermuda hybrid grass where the application permits
MATERIALS + SURFACES
A. Light colored pavement and furnishings with high SRI values, pervious where possible. Include micro-shadowing textured pavements.
A. Seating is shaded and well-distributed along primary pathways or next to core amenities.
B. Core amenities are shaded by mature trees, sails, or shade structures.
C. Locate drinking fountains near high-use areas.
D. Small gathering nodes adjacent to core amenities added to renovated landscape zones.
E. Open lawn compliments adjacent athletic uses.
F. Large central lawn can support events in excess of 2,000 people.
A. Incorporate dry basins and constructed washes with boulders to slow, convey, and infiltrate stormwater, supporting native ecology.
B. Lighting with resilient controls like photocells, time schedules, and motion or demand-based activation for all sports program.
C. Permeable paving strategically used in parking areas to limit evaporative loss on asphalt.
D. Parking shade structures incorporate solar panels that offset on-site electrical loads or reduce the need for expanded utility service.
A. Add crosswalks along preferred routes. Visual and tactile distinction alerts and slows vehicles.
B. Multiple looping pathways provide recreational choice and link to adjacent circulation routes.
C. Bike parking at primary access points and key amenities.
D. Transit shelter at existing bus stop.
E. Incorporate EV parking below solar structures.
HEALTH + SAFETY
A. Perception of Safety - clear visibility to and from public right of way and private residences. Play areas are located near public-facing edges.
B. Revitalize aging amenities and shelters.
C. Intensity of Maintenance - Underused lawn space converted to naturalized, desert-adapted communities.
D. Healthy Lifestyles - Fitness equipment located intermittently along continuous walking loop.
E. Shaded splash pad
F. Digital park kiosks display resources for emergency preparedness as well as community programming like environmental cleanups, recycling events, local markets, etc.
G. Emergency vehicle access to active use areas.
K. CASE STUDY: REGIONAL PARK
WEST HENDERSON RECREATION CAMPUS (WHRC)
E Larson Lane and Via Centro
60+ Acre
VISION
The West Henderson Recreation Campus (WHRC) is envisioned as a new regional destination in west Henderson, serving one of the fastest-growing areas of the city. This regional-scale facility will address critical gaps in recreational, athletic, and community amenities currently lacking in west Henderson, while supporting long-term growth, health, and economic development.
At the core of the park’s vision is a multi-generational recreation complex, designed to serve residents of all ages and abilities. Key indoor amenities include a community recreation center, an indoor aquatics facility, and a large multi-use fieldhouse capable of accommodating indoor soccer, basketball, volleyball, and tournament-level programming. These facilities position The WHRC as a hub for daily community use as well as regional events and sports tourism.
Outdoor amenities are envisioned to include competition-grade and recreational sports fields, an event plaza, water features, playgrounds, a skate park, pickleball courts, flexible-use green spaces, and an integrated network of walking and multi-use trails. Together, these elements create a balanced program that supports organized athletics, informal recreation, and community gatherings.
Resilient and climate-responsive design principles are woven throughout the park’s planning framework. The design leverages natural desert systems and microclimates, integrating landforms inspired by regional washes, mesas, valleys, and canyons. These strategies reduce water demand, moderate heat, and create comfortable outdoor spaces while supporting native flora and fauna.
The landscape framework prioritizes native and desert-adapted plant communities, minimizing irrigation requirements at ground level and concentrating supplemental water use on shade trees, a critical asset for user comfort and heat mitigation. Low Impact Development (LID) strategies—including permeable paving, integrated stormwater conveyance, and naturalized drainage corridors—are employed to manage runoff, enhance infiltration, and reduce long-term maintenance demands on the Parks and Recreation Department.
The WHRC is planned as a phased development, allowing the park to evolve strategically in response to funding availability and community needs. Initial phases may focus on the delivery of key athletic fields to support travel leagues and sports tourism, along with a formal park zone that provides a playground, water amenities, gathering spaces, and essential amenities and green space for surrounding commercial and residential development. Subsequent phases would introduce the multi-generational recreation center and indoor aquatics facility, followed by the indoor multi-use fieldhouse. A future parking structure would support major events, daily use, and long-term operational efficiency.
Through thoughtful planning, resilient design, and strategic phasing, the WHRC is positioned to become a landmark regional asset, supporting recreation, community health, economic vitality, and environmental stewardship for west Henderson and the broader region.
PART FOUR
1. LANDSCAPE
A. Landscape Plantings
The landscape vision for the WHRC should be grounded in the plant communities and landforms of the Mojave Desert—using species that are proven performers in Southern Nevada’s heat, wind, alkaline soils, and prolonged drought. Plant selection should align with the City of Henderson Plant List established in 2026.
A resilient planting framework can be organized as a desert “matrix” with creosote bush (Larrea tridentata) planted in clustered masses as the primary structural shrub layer, supplemented by Mojave-native and desert-adapted companions such as brittlebush (Encelia farinosa), Mormon tea (Ephedra nevadensis), and pollinator-supporting accent shrubs like chuparosa (Justicia californica)— all included on the regional list provided by the Southern Nevada Water Authority. Ground plane diversity and seasonal color can be added through drought-tolerant perennials and grasses in targeted bands and pockets—such as desert marigold (Baileya multiradiata) and deer grass (Muhlenbergia rigens)—to improve habitat function, reduce baresoil exposure, and create a more legible, cared-for desert aesthetic.
Landform should be used as performance infrastructure. Grade the site to form mesa-like bluffs, ledges, and shallow “micro-canyons” that create shaded soil pockets, reduce wind desiccation, and concentrate runoff into microbasins and swales that passively support planting. Boulders and varied aggregate fields (cobbles to gravels) should be integrated with planting—not as decorative rock blankets, but as targeted thermal and hydrologic modifiers that shade root zones, slow surface flow, and protect soil structure in high-exposure areas. This approach reduces evaporative loss and improves establishment success by placing plants where moisture naturally lingers.
Shade trees should be treated as the park’s longterm cooling infrastructure and prioritized at highuse amenities and passive lawn edges, planted in groves rather than isolated specimens to build overlapping shade and shared microclimate benefits. Species should favor desert-adapted canopy trees on the regional list—such as desert willow (Chilopsis
linearis) and select palo verde (Parkinsonia spp.) and mesquite (Prosopis spp.) types—sited to shade hardscape, seating, and play, while maintaining clear visibility and safe circulation. Where feasible, place trees at the toe of slopes, within swales, or at low points to capture stormwater and incidental runoff, and design larger, connected soil/planting zones (not small “turf rings”) to support deeper mulching, healthier soil biology, and efficient drip irrigation during establishment.
B. Radiant Heat
Surface materials and solar reflectance are key drivers of thermal comfort in Henderson parks. Hardscape should prioritize high–Solar Reflectance Index (SRI) pavements to reduce heat absorption and lower radiant re-emission—particularly in plazas, walks, play zones, and adjacent to seating. Specify lightcolored concrete and textured finishes (e.g., light broom, sand-matrix, or exposed-aggregate where appropriate) to improve slip resistance, reduce glare, and introduce fine-scale surface variation that helps pavements shed heat.
Heat mitigation should be reinforced through microshadowing and thermal breaks: use textured paving, subtle berming, and varied boulder/aggregate placement to break up large exposed surfaces, create localized shade at the ground plane, and reduce the “heat sink” effect of continuous paving. Pair these strategies with shaded play and fitness amenities (tree canopy and/or structures) to limit direct sun exposure and improve safety during warm months. Strategically placed boulders and rockledges can further cool the experience by shading soils and adjacent paving, moderating near-surface temperatures, and reducing evaporative losses when used alongside desert-adapted planting and targeted irrigation.
C. Trees
Shade trees in Henderson should be treated as core park infrastructure—the most effective longterm tool for reducing thermal stress, improving comfort, and extending daily and seasonal usability. Prioritize canopy where it matters most: over play areas, seating nodes, primary walking routes, and the edges of flexible-use lawns, with an emphasis on shading adjacent hardscape to reduce radiant heat and “heat sink” effects. Plant trees in groves and clustered allées rather than isolated specimens
PART FOUR
Passive recreation lawns should be paired with strategically placed shade trees and supported by efficient irrigation zoning to reduce evaporative loss and improve user comfort. Locating turf adjacent to canopy shade also helps lower surface temperatures, extends usability in warm months, and allows overall turf acreage—and associated water and mowing demands—to remain as compact and intentional as possible.
E. Irrigation
Irrigation at the WHRC should be strategically limited, hydrozoned, and targeted—serving grouped planting areas and tree groves rather than dispersed, single-plant irrigation. Rotary/spray irrigation should be reserved for functional turf only (athletic fields and designated flexible-use lawns) and designed with matched precipitation rates, head-to-head coverage, and clearly defined turf edges to prevent overspray into desert planting and hardscape. For trees and landscape areas, low-volume delivery is preferred: dripline, inline drip, bubblers/deep-root watering, and soaker systems to minimize wind drift and evaporation and to place water directly in the root zone.
Irrigation layout should work with grading and microclimates to improve performance and reduce demand. Use landforms, microbasins, and swales to capture rainfall and incidental runoff, then place emitters to support this hydrology—such as along the upper edges of swales, at the heads of depressions, and on berm shoulders—so applied water infiltrates and migrates downslope into clustered planting pockets. This reinforces “water-harvesting” planting patterns, increases soil wetting efficiency, and reduces runoff and hot-surface exposure where evaporation is highest. Temporary establishment irrigation should be planned from the outset (including valving and zoning) so runtimes can be reduced over time as desert-adapted plants mature, while tree zones remain prioritized to sustain longterm canopy health and cooling benefits.
2. MATERIALS & SURFACES
A. Pavements and Hardscapes
Paving in the WHRC should be selected and detailed to reduce urban heat island impacts and improve thermal comfort. Hardscape materials should prioritize high Solar Reflectance Index (SRI) surfaces and textured finishes that lower heat absorption
Figure 4.26 - Replicating local landscapes and landforms to create microclimates like those seen at Whitney Mesa Recreation Area (2025)
and reduce radiant re-emission, while remaining slip resistant and ADA compliant (stable, firm, and accessible transitions at joints and edges).
For cast-in-place concrete, specify a light-colored mix with a sand-matrix, medium broom, or comparable textured finish to introduce micro-shadowing, improve traction, and reduce glare. In pedestrian zones and parking bays, light-colored unit pavers with an exposed-aggregate or textured surface are recommended to limit heat gain and provide visual/functional differentiation. Where feasible, incorporate permeable paving systems (permeable interlocking concrete pavers or other engineered permeable surfaces) in parking stalls and select walkways to support infiltration, subgrade storage, and controlled conveyance, reducing runoff and keeping stormwater off hot pavement surfaces.
Roofs and overhead elements should also contribute to heat reduction. Pavilions, shade structures, and adjacent buildings should use light-colored roofing (e.g., white or light tan) or other high-reflectance roof systems to reduce solar heat gain and improve comfort below. Materials intended for direct user contact—play components, seat surfaces, handrails, and fitness equipment—should be light in color, located within shade, and/or specified with heatmitigating finishes to reduce surface temperatures and burn risk.
Play and gathering areas require special attention. All playgrounds should include integrated shade (tree canopy and/or structures) and be oriented and sited to maximize shade coverage during peak-use hours, especially in summer afternoons. Seating and social nodes should be placed to leverage existing mature trees wherever possible, with additional shade introduced where canopy coverage is insufficient to support safe, comfortable use.
B. Site Furnishings
The WHRC provides an opportunity to deploy Henderson’s standard system of benches, tables, and receptacles at a regional-park scale to support consistency, durability, and efficient maintenance. Standard precast/factory-finished furnishings are well suited to Southern Nevada conditions—robust, vandal-resistant, and low-maintenance—and should be specified with desert-appropriate finishes and detailing that limit heat gain and withstand UV exposure.
Where large quantities of seating are anticipated, consider an updated bench option with improved ergonomics (seat depth, back support, and armrests where appropriate) while maintaining the same standardized construction and maintainability valued by Parks and Recreation. Site furnishings should be positioned and located adjacent core amenities and underneath structured or natural shade for thermal comfort. Consider site lines and vistas when locating furnishings, positioning benches and tables to orient toward interesting views or core amenities.
3. LIGHTING & UTILITIES
A. Stormwater Runoff
The regional park should implement an integrated stormwater strategy that manages runoff as landscape infrastructure, using naturalized conveyance systems to slow, infiltrate, and route flows while minimizing time spent on exposed, heated hardscape. The primary objectives are to (1) reduce nuisance sheet flow across walks, plazas, and parking areas, (2) improve public safety and accessibility during storm events, and (3) move captured runoff through the site efficiently toward the municipal system while supporting on-site vegetation and habitat.
Organize the site around a connected network of vegetated swales, microbasins, and dry washes that receive runoff from pavements and turf edges. These systems should be graded with gentle longitudinal slopes, stabilized with varied aggregates and boulder check features where needed, and planted with desert wash–appropriate species to provide erosion resistance and habitat value. Use distributed detention (multiple smaller basins) tied to a central collection basin to attenuate peak flows, improve infiltration, and provide controlled overflow to the downstream storm drain connection.
Reduce surface drainage across paving by directing runoff quickly into adjacent swales or inlets through curb cuts, trench drains at pinch points, and crossslope grading that keeps pedestrian routes passable. Where appropriate, incorporate permeable paving (parking stalls, overflow parking, select walkways and plazas) to move water into a subgrade reservoir layer and then into engineered conveyance. In locations requiring positive drainage or where native soils limit infiltration, permeable systems should
PART FOUR
Landscape and feature lighting should be used selectively to reinforce identity and improve nighttime legibility without creating unnecessary skyglow. Favor low-level, shielded accent lighting for signage, gateways, public art, and landmark trees, and avoid uplighting where it may contribute to glare or light trespass. Where uplighting is used for signature features, specify tight beam control, shielding, and curfews.
Sports lighting (fields and courts) should be designed as a distinct system with high-output LED sports luminaires engineered for uniformity, glare control, and spill containment. Use sport-specific optics, shielding/visors, and pole placement to keep light on the playing surface and out of adjacent homes and trail corridors. Integrate on-demand controls (scheduling, user activation, and automatic shutoff) to reduce run time and operating cost while preserving appropriate light levels during play.
Across all lighting types, specify dimmable drivers and a controls strategy that includes photocell activation, time-based schedules, and (where appropriate) occupancy/motion-based “boost” modes for trails and secondary areas. Fixture
selection should consider dark-sky–friendly performance (cutoff optics, low uplight, controlled glare), vandal resistance, and thermal management for extreme heat. The result is a cohesive, energyefficient lighting framework that supports safety and programming across the entire regional park without over-lighting the landscape.
C. Renewable Energy
The WHRC should pursue renewable energy at a scale appropriate for a regional destination park, using photovoltaic (PV) systems as core infrastructure to reduce operating costs and improve long-term resilience. The park’s planned buildings and large facilities provide substantial roof area that can function as PV “platforms,” particularly where roofs have favorable orientation, minimal shading from mechanical equipment, and adequate structural capacity. Early in design, PV feasibility should be integrated into architectural and civil coordination—confirming roof loading allowances, attachment/waterproofing approach, maintenance access, inverter/electrical room locations, and interconnection pathways.
Figure 4.28 - Use of native plant material (Creosote Bush) at Heritage Park (2025).
In addition to buildings, PV-integrated parking lot shade structures should be considered a primary opportunity. These canopies deliver dual benefits— thermal comfort and reduced pavement heat gain for users, while producing meaningful on-site generation. Parking PV can also support site electrical loads such as parking and pathway lighting, park operations, and (where capacity allows) Level 2 EV charging in preferred parking bays. EV infrastructure should be planned with scalable electrical distribution (conduit pathways, spare capacity, and panel space) so charging can expand over time as demand and utility coordination allow. Where off-grid operation is desired for specific functions (e.g., security lighting or critical outlets), PV should be paired with battery storage and controls sized for the intended runtime and load profile.
PV systems should be designed as part of an integrated energy strategy for the park. Identify major loads (sports lighting, building HVAC, irrigation pumping/controls, restroom and concession power, event infrastructure) and evaluate which are best served by on-site generation versus utility service. Where feasible, PV should be configured to support operational reliability through robust monitoring, secure equipment locations, and maintenancefriendly layouts. Integrating PV atop buildings and shade structures—coordinated with efficient lighting, on-demand controls, and targeted loads—positions the WHRC as a forward-looking regional facility that reduces grid dependence while improving user comfort and sustainability.
D. Appropriate Integration of Technology
The WHRC should be positioned as Henderson’s leading integrated-technology regional park, where physical infrastructure and smart systems work together to improve comfort, reduce operating costs, and support resilient day-to-day operations. Technology deployment should be purposedriven, interoperable, and maintainable—favoring standardized components, centralized monitoring, and clear cybersecurity/IT ownership.
Deploy distributed solar PV on major building roofs and PV-integrated parking shade canopies to offset park loads and reduce peak demand. Where critical functions exist (restrooms, communications, select lighting, security, irrigation controls), integrate battery storage and an energy management system
(EMS) to provide backup power and load shifting. Plan electrical distribution for future expansion (spare conduits, panel capacity, and switchgear space) to accommodate EV charging, events, and new facilities without costly retrofits.
Implement a smart irrigation platform with ET/ weather-based scheduling, soil-moisture sensing (by hydrozone), and flow monitoring (master meter + zone-level flow where feasible) to detect leaks, stuck valves, and abnormal consumption. Use AI-assisted irrigation optimization to automatically tune runtimes based on weather forecasts, soil moisture trends, and plant establishment stages, with staff approval workflows for overrides. Integrate nonpotable opportunities where available (captured stormwater for passive landscape support, irrigation “harvesting” swales/microbasins), and tie water-use dashboards into park operations reporting.
Standardize on high-efficiency LED fixtures with networked controls: photocells + schedules + dimming profiles, with occupancy-based boosting in lower-use areas (trails/secondary paths). Continue on-demand sports lighting (app/code or staff-enabled controls) with automatic shutoff and reservation integration to reduce run time and nuisance spill. Add emergency call capability at key nodes where appropriate, and ensure lighting supports clear sightlines and safe circulation.
Build a GIS-linked asset registry (lights, irrigation valves/controllers, benches, playground components, courts, PV equipment) connected to a CMMS for work orders, lifecycle tracking, and replacement planning. Use condition and performance monitoring (PV production, inverter faults, irrigation flow anomalies, lighting outages) to enable predictive maintenance and faster response.
Disperse resident feedback kiosks (e.g., “Happy or Not” style) at primary hubs—community center, play areas, courts, trailheads—to capture real-time satisfaction and maintenance flags.
Provide digital wayfinding/event signage at key entries and hubs (kept simple and durable), with the ability to push heat advisories, closures, and event updates. Consider park-wide Wi-Fi at hubs (not necessarily blanket coverage) to support events, kiosks, and operations devices.
PART FOUR
Install microclimate sensors (air temperature, surface temperature, humidity) at representative sun/shade locations to evaluate heat-mitigation performance and guide future shade/tree investments. Use automated alerts for extreme heat conditions tied to operational responses (misting/off limits if used, hydration messaging, adjusted lighting schedules, event guidance).
Require open protocols and integration readiness (so systems “talk” to each other), with clear data ownership, privacy controls, and cybersecurity standards.
Design for maintainability: accessible enclosures, standardized spare parts, and vendor support requirements aligned with Parks & Recreation staffing and workflows.
Together, these systems make the WHRC a highperforming “smart park” campus—optimizing water and energy use, improving safety and comfort, and giving staff actionable data to operate the park efficiently and resiliently.
4. COMFORT & ACTIVATION
A. Shaded Seating Areas
Shaded seating should be treated as essential infrastructure in Henderson parks, where thermal comfort drives whether spaces are usable for much of the year. Seating should be sited within reliable shade zones—under mature canopy, beneath structured shade, or within building shadow patterns—rather than placed in fully exposed areas. Where temporary exposure is unavoidable, design should include a defined plan to add canopy or structure as part of phased improvements.
Benches should be located intentionally beneath shade trees (or within future canopy extents) and coordinated with circulation, sightlines, and program: adjacent to play areas for supervision, at trail nodes and decision points for rest, and near gathering spaces to support longer stays. Shade structures— picnic shelters and pavilions—should be placed at core amenities and along looping pathways to create a network of comfortable “respite nodes,” ideally paired with drinking water and accessible routes.
For athletic areas, provide dedicated shade over spectator seating. Specify shade sails, canopy structures, or roofed bleachers/grandstands designed for desert conditions (UV exposure, wind loads, durable fabrics/materials, and maintainable attachment systems). Shade coverage should prioritize afternoon sun angles and include clearances that maintain visibility and safe circulation, ensuring spectator areas remain comfortable and functional during peak-use seasons.
B. Shaded Amenities
All core amenities in the WHRC should be designed with reliable shade as a baseline requirement, provided through a combination of mature tree canopy and durable structured shade. Shade should be integrated at the amenity level (covering or immediately adjacent) so users can engage in activities without prolonged exposure to direct sun and reflected heat.
Playgrounds and water features require the highest shade priority. Provide shade sails, pavilion roofs, or other overhead systems sized and positioned to cast meaningful shadow onto play decks, splash pads, queuing areas, and adjacent seating during peak heat periods—especially summer afternoons. Shade design should consider seasonal sun angles, prioritize south and west exposures, and extend coverage beyond the activity footprint to include caregiver seating, stroller parking, and accessible routes.
Across the park, site and orient amenities to leverage existing buildings, walls, and landforms as shade generators, and use trees, berms, and boulder/planting assemblies to create sheltered microclimates that reduce wind desiccation and surface temperatures. Connect these shaded nodes with comfortable circulation—shaded walk segments, rest areas, and water access—so visitors can move between destinations with regular opportunities for relief from UV exposure and heat. Structured shade elements should be specified for desert durability (UV-resistant materials, wind-rated systems, maintainable hardware) and coordinated with lighting and utilities to support safe, extendedhours use.
C. Cooling Amenities
Cooling amenities in a regional park in Henderson should be planned as an integrated “thermal comfort network” that combines water play, shade, and access to conditioned refuge.
A splash pad or water play feature should be colocated with the primary playground to provide a high-value cooling destination during warm months. It should be paired with substantial adjacent shade (tree canopy and/or shade structures) over seating, queuing, and perimeter areas, and located near drinking water and restrooms to support longer stays. Materials and detailing around water play should prioritize low-glare, slip-resistant surfaces and avoid large expanses of dark paving that can reradiate heat.
Throughout the park, provide shade pavilions, picnic shelters, and grove-based seating nodes at regular intervals along loop paths and major pedestrian routes so visitors can cool down and rest between destinations. These respite nodes are most effective when they include seating, clear sightlines, and (where feasible) proximity to water stations. Connect amenities with shaded circulation segments to reduce exposure during travel across the site.
Finally, regional parks should include conditioned indoor refuge as part of restroom or support facilities—small, accessible cooling areas that can serve as emergency respite during extreme heat events. These spaces should be clearly signed, easy to access from primary activity hubs, and designed to remain operational during peak-use periods, reinforcing public safety and year-round usability.
D. Programming Flexibility and Activation
The WHRC should be planned as a flexible, “futureready” regional park—capable of supporting diverse user groups today while accommodating changing recreation trends, programming needs, and facility investments over time. Flexibility should be built into the framework through adaptable site planning, scalable infrastructure, and multi-use landscapes that can be reprogrammed without major reconstruction.
The park program should balance dedicated destination amenities—such as playgrounds, water play features, skate elements, and sports fields— with a network of passive and flexible-use spaces
that support daily recreation and community events. Plaza zones and civic gathering areas should be designed with utility-ready infrastructure (power, data conduit, water, and drainage), durable paving, and shade to support markets, performances, and seasonal programming. Open turf areas should be strategically sized and located to function as everyday flexible lawns and overflow event space, while remaining clearly separated from non-functional turf to manage irrigation and maintenance efficiently.
To improve long-term resilience, the plan should establish clear “zones” for future expansion— reserved pads or edges for additional facilities— supported by right-sized circulation, parking, and utility corridors that can grow in phases. Designing with modular elements (expandable courts, relocatable furnishings, adaptable shade structures, and convertible event lawns) will allow Parks and Recreation to adjust programming, add amenities, and respond to community demand while maintaining cohesive operations and a consistent visitor experience.
5. ACCESSIBILITY
A. Ease of Walking TO the Park
Pedestrian connectivity should be a primary planning driver for the WHRC, particularly because the site and much of the surrounding area are currently undeveloped and future access patterns will be established over time. With major thoroughfares along the park’s northern and eastern edges, the design should anticipate safe, comfortable crossings and continuous pedestrian routes that will ultimately connect adjacent neighborhoods, schools, and commercial areas to park entrances.
Key recommendations include planning for marked and signalized pedestrian crossings at logical desire lines aligned with primary park gateways, with curb ramps and detectable warning surfaces oriented directly to crossings. Where roadway widths and speeds warrant, crossings should incorporate median refuges, high-visibility striping, pedestrianscale lighting, and appropriate traffic control (e.g., signalized crossings or other approved pedestrian treatments) to improve safety and comfort. In parallel, provide street-adjacent shared-use trails/ sidepaths along the park frontage that tie into
PART FOUR
future trail networks and internal park loops, ensuring continuous, ADA-compliant pedestrian and micromobility access. Entry points should be spaced to support a porous perimeter while concentrating the highest-quality connections at key nodes, including transit stops and parking areas, to create a legible, multimodal approach to the park.
B. Ease of Walking WITHIN the Park
The internal walkability of the WHRC should be treated as core infrastructure and organized as a clear pathway hierarchy that connects park entries, major destinations, and loop experiences safely and intuitively. A legible network will support everyday use, large events, and accessible circulation across a regional-scale site.
Primary circulation (spines and promenades). Establish wide, fully ADA-compliant primary routes that provide the most direct connections from parking, transit stops, and major crossings to core amenities (playgrounds, water features, sports complexes, restrooms, event plazas, and concessions). These “spines” should be designed for high pedestrian volumes and shared micromobility where appropriate, with consistent wayfinding, lighting, shade nodes, and durable paving. Key intersections should be minimized and simplified to reduce conflict points, and primary routes should maintain gentle grades, clear widths, and predictable alignment for universal access.
Perimeter trail system. Along the park edges, provide dedicated trail segments that enable continuous perimeter circulation and connect to future regional trail networks. Perimeter routes should include frequent, well-marked access points into the park and tie into primary promenades at “trailheads” with signage, water, and bike parking to support walkers, runners, and cyclists.
Secondary loops (programmed walking circuits). Create secondary pathways that form multiple loop options of varying lengths, linking neighborhoodscale activity nodes and providing fitness-friendly circuits. These routes should connect back to primary spines at regular intervals, include shaded rest areas and seating, and be designed to disperse users around the park rather than funneling traffic into a single corridor.
Tertiary soft-surface paths. Integrate soft-surface trails within naturalized landscape zones to provide a quieter, immersive experience in desert planting and wash environments. These paths should be stabilized and erosion-resistant, routed to avoid concentrated drainage flows, and designed with clear transitions to hardscape routes so users can choose between accessible paved circulation and nature-based trail experiences.
Across all path types, align routes with clear sightlines, safe crossings, and consistent lighting, and coordinate paving, drainage, and shade to reduce heat exposure and improve year-round usability. This layered network will make the park easy to navigate, supportive of healthy lifestyles, and resilient as programming evolves.
C. Multi-modal Capacity
The internal walkability of the WHRC should be treated as core infrastructure and organized as a clear pathway hierarchy that connects park entries, major destinations, and loop experiences safely and intuitively. A legible network will support everyday use, large events, and accessible circulation across a regional-scale site.
Primary circulation (spines and promenades). Establish wide, fully ADA-compliant primary routes that provide the most direct connections from parking, transit stops, and major crossings to core amenities (playgrounds, water features, sports complexes, restrooms, event plazas, and concessions). These “spines” should be designed for high pedestrian volumes and shared micromobility where appropriate, with consistent wayfinding, lighting, shade nodes, and durable paving. Key intersections should be minimized and simplified to reduce conflict points, and primary routes should maintain gentle grades, clear widths, and predictable alignment for universal access.
Perimeter trail system. Along the park edges, provide dedicated trail segments that enable continuous perimeter circulation and connect to future regional trail networks. Perimeter routes should include frequent, well-marked access points into the park and tie into primary promenades at “trailheads” with signage, water, and bike parking to support walkers, runners, and cyclists.
Secondary loops (programmed walking circuits). Create secondary pathways that form multiple loop options of varying lengths, linking neighborhoodscale activity nodes and providing fitness-friendly circuits. These routes should connect back to primary spines at regular intervals, include shaded rest areas and seating, and be designed to disperse users around the park rather than funneling traffic into a single corridor.
Tertiary soft-surface paths. Integrate soft-surface trails within naturalized landscape zones to provide a quieter, immersive experience in desert planting and wash environments. These paths should be stabilized and erosion-resistant, routed to avoid concentrated drainage flows, and designed with clear transitions to hardscape routes so users can choose between accessible paved circulation and nature-based trail experiences.
Across all path types, align routes with clear sightlines, safe crossings, and consistent lighting, and coordinate paving, drainage, and shade to reduce heat exposure and improve year-round usability. This layered network will make the park easy to navigate, supportive of healthy lifestyles, and resilient as programming evolves.
D. Low-Emission Vehicles
Provide dedicated EV/low-emission vehicle charging stations within the park’s parking program, located near primary entries and core facilities for visibility and convenience. Where feasible, integrate chargers with PV-equipped parking shade canopies to offset charging demand and support a resilient on-site energy strategy. Designate and sign EV/low-emission parking bays—preferably in shaded, high-priority locations—while coordinating electrical capacity, conduit pathways, and panel space to allow future expansion as demand grows.
E. Universal Design & ADA Accessibility
Universal design should be a baseline requirement for the WHRC so that access, comfort, and participation are equitable across all amenities and user groups. All pedestrian crossings and approaches should incorporate high-visibility crosswalks, properly aligned curb ramps, and detectable warning surfaces that direct users predictably from sidewalks to park entrances. Within the park, primary routes should be continuous, ADA-compliant walking surfaces (stable, firm, slip-resistant) with appropriate widths,
slopes, and smooth transitions at joints and material changes to support wheelchairs, strollers, and mobility devices.
Inclusivity should extend beyond routes to the park experience itself. Provide distributed accessible seating and picnic amenities throughout the site—especially at play areas, event lawns, trailheads, sports viewing locations, and shaded respite nodes—by including companion spaces adjacent to benches and tables, clear floor space, and accessible connections to drinking fountains and restrooms. All new and replacement play and recreation facilities should apply universal design principles, including accessible surfacing, continuous accessible routes through the play environment, and integrated features (transfer platforms and/or ramped components, inclusive play elements, and nearby shaded caregiver seating) so that children and caregivers with varying abilities can participate fully and comfortably.
F. Clarity of Wayfinding
As a regional destination, the WHRC would benefit from a dedicated branding, wayfinding, and signage package—similar in intent to Heritage Park—that
Figure 4.29 - Carports with PV roofs at Heritage Park (2025).
PART FOUR
creates a cohesive identity and makes navigation intuitive at all scales. Implement a holistic wayfinding strategy with a clear hierarchy of sign types and placement that guides users from the vehicular arrival experience to pedestrian circulation throughout the park.
Provide identifiable entry monuments/gateway signage at all primary park entrances, coordinated with access drives, parking fields, and major trailheads. Install large-format directional signs at key vehicular and pedestrian decision points (major intersections, parking–to–promenade transitions, trail junctions) that clearly point to core amenities and facilities. Distribute amenity-level information signage near playgrounds, water features, sports complexes, and event areas to communicate rules, hours, and facility-specific guidance. Integrate emergency and heat-safety information at pavilions, shelters, and primary hubs, including emergency contacts, location references, and heat-illness/ hydration guidance.
Along internal pathways and soft-surface trails, include pedestrian-scale directional signs and location markers to help users confirm where they are, understand distances or routes to key destinations, and navigate the park’s loop system. Signage should be durable, consistent in typography and symbology, and sited to maintain clear sightlines while remaining visible under day and night conditions.
6. HEALTH & SAFETY
A.
Perception of Safety
As a regional destination, the WHRC will support a wide range of amenities and programming across a large site, making pedestrian safety and comfort foundational to the plan. The vision establishes a safe, walkable environment by prioritizing clear sightlines, intuitive circulation, and well-defined activity hubs that keep the park visibly active throughout the day. High-use features—especially playgrounds and family-oriented amenities—are located along primary routes and near public-facing edges with nearby support uses (seating, shade, restrooms, and water) to encourage continuous presence and passive oversight. Landscape and lighting are designed to reinforce safety and
comfort by avoiding hidden corners and visual barriers, concentrating illumination at paths and destinations, and maintaining visibility across open spaces. Together, these strategies strengthen both actual and perceived safety, creating a welcoming, comfortable park environment for users of all ages.
B. Physical Condition
Design the WHRC around low-impact development principles and long-term, efficient maintenance. Specify durable, desert-appropriate materials and fixtures that withstand UV exposure, heat, wind, and heavy use, and favor standardized, easily replaceable components to streamline repairs. Limit high-maintenance landscape areas by reducing non-functional turf, defining irrigated zones clearly, and using native or desert-adapted planting communities with appropriate mulches and aggregates to minimize pruning, mowing, and water demand. Select pavements and site furnishings for longevity and serviceability, and detail edges, joints, and drainage to reduce cracking, erosion, and debris buildup—supporting a consistently cared-for appearance with predictable maintenance cycles.
C. Intensity of Maintenance
Maintenance strategy for the WHRC should emphasize low-maintenance landscapes and durable, desert-rated finishes to support long-term stewardship at scale. Minimize irrigated acreage
Figure 4.30 - Wayfinding signage, at the Whitney Mesa Recreation Area (2025).
by limiting turf to programmed fields and clearly defined flexible lawns, and transition remaining areas to native or desert-adapted plant communities organized by hydrozones and supported by lowvolume irrigation during establishment. Specify robust pavements, shade structures, and site furnishings designed for intense sun, heat, and high-use conditions, with standardized components and readily available replacement parts. Limit nonessential equipment and specialty features that increase inspection, repair, and operational burden, so the park remains highly functional while simplifying maintenance routines, reducing lifecycle costs, and improving long-term performance.
D. Healthy Lifestyles
The WHRC should be planned as a regional “healthy lifestyle” destination, using a layered mix of amenities and programs that support daily physical activity, mental well-being, and multi-generational recreation. The park should include a connected network of loop trails and shared-use paths with varying lengths and difficulty, linked directly to key destinations—athletic fields, courts, playgrounds, and outdoor fitness zones—to encourage routine walking, running, cycling, and informal play. Outdoor fitness equipment should be organized as a circuit along primary loops, with accessible surfaces, shade and seating at rest nodes, and clear wayfinding to support structured workouts and casual use.
Athletic facilities and open lawns should be complemented by family-oriented and inclusive play environments, as well as flexible program space for classes and community health programming. A multi-generational recreation center can serve as the park’s wellness hub, providing year-round opportunities for fitness, education, and social connection. Across all amenities, prioritize shade, hydration access, and safe, well-lit circulation to extend usability in extreme heat and support consistent participation throughout the day and across seasons.
E. Access to Drinking Water
Provide convenient access to drinking water for both people and pets at all core amenity hubs and, where feasible, along primary loop paths. In highactivity areas—such as plazas, playgrounds, splash pads, and sports complexes—install multiple, welldistributed drinking fountain locations that are easy
to find from seating and circulation routes, reducing walking distances and supporting safe use during warm-weather periods.
F. Access to Emergency Information
The WHRC should establish a clear, consistent system for emergency communication that provides both real-time guidance and public education— especially for extreme heat conditions common in Henderson. Emergency information should be integrated into a coordinated package of kiosks, entry signage, and facility-mounted panels located at primary gateways, core amenity hubs, sports complexes, trailheads, restrooms, and the recreation center. These elements should include: the park name and address/location reference, mapped “you are here” orientation, emergency contact numbers, and concise guidance on recognizing and responding to heat-related illness (heat exhaustion/heat stroke), hydration, and when to seek help. Information should be easy to read in high-glare conditions, durable, and standardized across the site to reduce confusion.
Where feasible, incorporate real-time messaging at major hubs (digital kiosks or changeable message panels) to communicate heat advisories, facility closures, and event updates. Signage should be paired with supportive infrastructure—clearly marked water stations, shaded respite nodes, and access to conditioned refuge where provided—so users can act immediately on safety guidance.
For emergency response, consider installing emergency call stations at strategic, highly visible locations (e.g., recreation center plaza, sports complex hub, major trail intersections, and remote trail segments) with clear location identifiers to speed dispatch. Stations should be well lit, ADA accessible, vandal resistant, and integrated with a monitored communications system and defined operational protocol.
The overall goal is a distributed, legible safety network that helps visitors prevent heat-related emergencies, quickly find assistance, and feel confident using the park during a wide range of conditions.
PART FOUR
1. LANDSCAPE
A. Native and desert-adapted species, organized by hydrozones, integrated with landform and boulders that create shaded soils with optimal microclimate and habitat.
B. Shade trees located to the southwest of highuse areas block intense afternoon sun. Trees are clustered to shade root zones, reduce soil temperature and limit evapotranspiration.
C. Approx. 65,000 SF of warm season turf around a feature plaza for varied program scales. Shaded edges provide pleasant microclimate for daily leisure.
D. Irrigation - Lawn positioned northeast of shade trees has lower water needs. Shade trees and shaded lawn are prioritized for preservation.
E. Athletic-grade warm-season, hybrid Bermuda grass for tournament-grade athletic field facilities.
2. MATERIALS + SURFACES
A. Light colored pavements with high SRI values, and/or textured pavements that create microshadows that reduce surface temperatures.
B. Roofs and overhead elements use light-colored roofing or other high-reflectance roof systems to reduce solar heat gain and improve comfort.
C. Concrete/masonry site furnishings with high SRI values that provide cool places to sit by minimizing heat retention.
D. Light colored sports court surfacing with high SRI values and sufficient visual contrast.
E. Resilient poured-in-place (PIP) play surfacing with high SRI values in UV-stable colors.
3. LIGHTING + UTILITIES
A. Incorporate dry basins and constructed washes with boulders to slow, convey, and infiltrate stormwater, supporting native ecology.
B. Lighting with resilient controls like photocells, time schedules, and motion or demand-based activation for all sports program.
C. Shared on-street parking with permeable paving to capture run-off distributed throughout the site, reducing the need for large, contiguous expanses of paved parking.
D. Heavy use of photovoltaic systems on large building roofs as core infrastructure to reduce operating costs.
4. COMFORT + ACTIVATION
A. Seating is shaded and well-distributed along primary pathways or next to core amenities.
B. Provide shade shelters over spectator seating.
C. Core amenities are shaded by mature trees, sails, or shade structures.
D. Shaded splash pad.
E. Regional skate park.
F. Locate drinking fountains near high-use and event areas.
G. Place shade pavilions, picnic shelters, and grove-based seating nodes at regular intervals along loop paths and major pedestrian routes.
H. Conditioned indoor pavilion.
I. Indoor aquatics facility (approx. 56,000 SF).
J. Multi-use fieldhouse for indoor sports (approx. 250,000 SF).
K. Microclimate sensors evaluate heat-mitigation performance and trigger operational responses to poor performance.
L. Pickleball courts (8).
M. Conditioned restroom and concessions building.
N. Conditioned, elevated breezeways linking buildings and shared-parking structure.
O. Synthetic turf fields w/ on-demand irrigation to cool surface temperatures prior to summer use.
5. ACCESSIBILITY
A. Plan for marked and signalized pedestrian crossings at logical desire lines aligned with primary park gateways
B. Primary circulation - wide, fully ADA-compliant promenades.
C. Continuous perimeter looping exercise and fitness trail (paved and separated from roadways) at park edges connects to future regional trail networks.
D. Secondary loops link activity nodes and provide fitness-friendly circuits.
E. Tertiary soft-surface paths (DG) within naturalized landscapes provide an immersive experience in desert planting and wash environments.
F. Bike parking at primary access points and key amenities.
G. Coordinate with RTC and the City to site a bus stop and shelter at a primary park gateway along E. Larson Lane.
H. Incorporate shaded carports with PV roof systems in key areas; leverage renewable energy generation to power LEV charging stations and carport lighting.
I. Provide identifiable entry monuments/gateway signage at all primary park entrances.
J. Shared parking structure.
6. HEALTH + SAFETY
A. Perception of Safety - clear visibility to and from public right of way and private residences. Play areas are located near public-facing edges.
B. Multi-generational recreation center can serve as the park’s wellness hub, providing yearround opportunities for fitness, education, and social connection (approx. 150,000 SF).
C. Limit high-maintenance landscape areas by reducing non-functional turf, defining irrigation zones, and using native or desert-adapted plant communities with appropriate ground cover.
D. Healthy Lifestyles - Fitness equipment located intermittently along continuous walking loop.
E. Digital park kiosks display resources for emergency preparedness as well as community programming like environmental cleanups, recycling events, local markets, etc.
F. Emergency vehicle access to active use areas.
PART FOUR
+ Reduce energy and water demand and operational burden through strategies such as envelope improvements, HVAC modernization/ commissioning, water efficient fixtures, and other high impact efficiency measures identified through the assessment framework.
+ Strengthen long-term system performance and readiness (life safety, security, code compliance, and emergency functionality) while maintaining—and ideally improving—the visitor/ participant experience and the flexibility to meet changing recreation trends.
4.Provide a user-friendly structure that mirrors the facility resiliency evaluation framework, so the best practices align directly with the same categories and criteria used to assess existing building conditions and identify vulnerabilities/opportunities.
In summary, the Resilient by Design Best Practices for Facilities are intended to help Henderson consistently plan, design, renovate, and operate recreation buildings and structures that are comfortable, safe, energy and water smart, and programmatically adaptable—so they can meet rising demand for indoor recreation and community services, even as extreme heat and drought increasingly shape how, when, and where residents recreate.
B. ARCHITECTURAL SHADING & PASSIVE SOLAR CONTROL
The use of architectural elements to manage solar exposure is a fundamental component of increasing overall building resiliency. In new construction, by deliberately shaping and detailing the building mass, the project can reduce peak thermal loads, improve occupant comfort, and lessen reliance on mechanical systems during periods of high environmental stress. These outcomes can also be achieved on existing structures but your options are limited to those that can be retrofitted to the building.
1. INTEGRATION OF FIXED AND OPERABLE SHADING DEVICES.
Sensitive south and west facing elevations that can be protected through the integration of fixed and operable shading devices such as exterior window
screens, louvers, and overhangs. When properly designed, these elements block high angle summer sun, significantly reducing solar heat gain during the hottest parts of the day, while still permitting lower angle winter sun to penetrate the interior.
This response to seasonal characteristics of the sun supports passive heating during cooler months and minimizes overheating during summer conditions. To limit the cost factor of either including these elements in new construction or adding them to an existing structure can be mitigated by completing a site analysis and identifying which fenestrations are most vulnerable to sun at any given point in the year.
2. DEEPER INSET FENESTRATION SYSTEMS AND RECESSED WINDOW OPENINGS.
Further enhance shading performance by creating self-shaded apertures that reduce direct solar exposure without compromising daylight access. At a broader scale, thoughtful site orientation and massing can be employed to limit extensive glazing on the most solar-intensive elevations, or to align building forms in a manner that naturally mitigates heat gain through geometry rather than mechanical intervention.
3. HIGH ALBEDO FAÇADES.
Highly reflective finishes and colors may alleviate absorption of solar radiation and reduce passive heat gain. Increasing the albedo of existing structures may be one of the most cost-effective retrofitting strategies for increased resilience.
Together, these passive design measures allow HVAC systems to operate more efficiently by flattening peak demand and reducing cooling loads during critical hours. This improves the building’s ability to maintain safe and functional interior conditions during heat waves, power constraints, or grid disruptions, thereby enhancing long-term operational resilience while also lowering energy consumption and lifecycle costs.
C. LANDSCAPE-INTEGRATED SHADING & BIOPHILIC RESILIENCE
The integration of landscape architecture as a functional component of building shading provides a nature-based strategy for enhancing building resiliency. Thoughtfully placed trees, trellised plantings, and vegetated buffers can be used to shade sensitive building elevations while simultaneously improving the quality of the interior environment for occupants.
1. LEVERAGE DECIDUOUS TREE CANOPIES TO REDUCE SOLAR HEAT GAIN.
Deciduous tree canopies are especially effective in this role because they naturally align with seasonal solar patterns. During summer months, mature foliage provides significant shading, reducing direct solar heat gain and lowering cooling loads on the building envelope. In winter, leaf drop allows greater solar penetration, supporting passive heat gain and daylight access. When coordinated with interior views and window placement, this approach strengthens occupants’ visual and psychological connection to the outdoors, contributing to comfort, well-being, and long-term building usability.
2. BUDGET RESOURCES – AND TIME - FOR GROWTH.
Unlike architectural shading devices, landscapebased strategies require time to achieve full performance. Plantings must be allowed to reach sufficient maturity before providing meaningful solar protection, which necessitates careful phasing and interim shading strategies during early years of building operation. In addition, long-term irrigation, maintenance, and plant health must be considered as part of the resiliency equation, particularly in arid or water constrained environments.
Despite these considerations, landscape integrated shading offers a softer, adaptive layer of environmental control that complements built systems. When designed in coordination with architectural shading and mechanical strategies, landscape elements can reduce thermal stress on
the building, moderate microclimates at the material face, and enhance occupant experience, contributing to a resilient, high-performing space that balances energy efficiency with human-centered design.
D. SITE-RESPONSIVE DESIGN & PASSIVE ENVIRONMENTAL OPTIMIZATION
For new construction, a comprehensive site analysis is a critical first step in establishing long term building resiliency. Understanding the site’s environmental context including solar orientation, topography, prevailing wind patterns, and seasonal climate behavior allows the building to be shaped in response to natural forces rather than relying on mechanical systems to counteract them. This approach results in a more stable, efficient, and adaptable building over its operational life.
1. BUILDING ORIENTATION IS A PRIMARY DRIVER OF PASSIVE PERFORMANCE.
Aligning new buildings along a south or slightly eastof-south axis enables the project to capitalize on lowangle winter sun for passive heat gain while limiting exposure to high angle summer sun that drives peak cooling loads. When coordinated with controlled glazing and shading strategies, this orientation establishes a predictable and manageable solar profile that supports year-round thermal comfort.
2. THE STRATEGIC USE OF THERMAL MASS FURTHER ENHANCES THIS PASSIVE PERFORMANCE.
Materials such as concrete, masonry, or other highmass assemblies can be positioned to absorb excess heat during the day and release it gradually over time. In summer conditions, this helps flatten peak heat gain and reduce cooling demand during critical hours. In winter, thermal mass extends the benefit of daytime solar gain into evening and overnight periods, providing a higher lag and more consistent interior temperatures.
PART FOUR
3. PREVAILING WIND PATTERNS SHOULD ALSO INFORM BUILDING MASSING AND SECTION DESIGN
By aligning openings, courtyards, and vertical circulation elements with dominant wind directions, the building can take advantage of natural ventilation strategies such as cross-ventilation, chimney effect, and stack-driven airflow. These passive systems reduce internal heat buildup and improve air movement during non-peak conditions, allowing HVAC systems to be downsized or reserved for periods when environmental conditions exceed passive capacity.
Collectively, these site responsive strategies create a building that works with its environment rather than against it. By embedding solar orientation, thermal massing, and passive airflow into the foundational design, new construction can achieve greater energy stability, reduced mechanical dependence, and improved resilience to climate variability and utility disruptions over time.
E. ELECTRICAL EFFICIENCY & DISTRIBUTED ENERGY STRATEGIES
Improving electrical efficiency is a key component of building resiliency, as it directly reduces overall energy demand while increasing the building’s ability to operate effectively during periods of grid stress or disruption. Recommended practices focus on reducing baseline electrical loads, maintaining system performance over time, and integrating onsite energy generation where feasible.
1. STANDARDIZE THE USE OF HIGHEFFICIENCY FIXTURES AND EQUIPMENT.
At the building level, the use of high-efficiency electrical fixtures and equipment establishes a strong foundation for reduced energy consumption. LED lighting systems, “ENERGY STAR” rated appliances, and high efficiency motors and controls significantly lower electrical demand compared to legacy systems, while also reducing internal heat gains that contribute to cooling loads. When paired with daylighting controls, occupancy sensors, and
programmable lighting zones, these systems further optimize energy use by delivering power only when and where it is needed.
2. REGULAR INSPECTIONS AND UPGRADES SUSTAIN LONG-TERM PERFORMANCE.
Long term efficiency also depends on maintaining the integrity of core electrical infrastructure. Transformers, switchgear, and distribution boards experience gradual performance degradation over their service lives, often resulting in increased losses, heat generation, and reliability risks. Proactive inspection, testing, and replacement of these components at or before the end of their efficient lifespan helps preserve system performance, reduce downtime, and prevent cascading failures during peak demand events.
3. ON SITE RENEWABLE ENERGY GENERATION PROVIDES AN ADDITIONAL LAYER OF RESILIENCY.
The installation of photovoltaic arrays on welloriented rooflines or canopies allows the building to offset a portion of its electrical demand with clean, locally generated power. When thoughtfully integrated with building orientation and load profiles, photovoltaic systems can reduce peak demand, stabilize operating costs, and support critical functions during grid interruptions particularly when paired with energy storage, micro-grids or futureready infrastructure.
Together, these strategies create a more efficient and resilient electrical system by lowering baseline consumption, extending the functional reliability of infrastructure, and diversifying energy sources. This layered approach reduces dependence on external utilities and enhances the building’s capacity to maintain essential operations under a wide range of operating conditions.
F. ON-SITE ENERGY STORAGE & BACK-UP POWER
Access to stored renewable energy and supplemental backup power generation significantly enhances a building’s resilience during emergency and peakdemand events. By decoupling critical building functions from full reliance on the electrical grid, these systems enable continued operation when utility service is disrupted or constrained, supporting occupant safety and operational continuity.
1. RENEWABLE BACK-UP POWER SOURCES.
Battery energy storage systems paired with onsite renewable generation, such as photovoltaic arrays, allow excess energy produced during normal conditions to be retained and deployed during outages or peak load periods. This stored energy can be prioritized to serve essential systems including emergency lighting, communications, life safety systems, refrigeration, data infrastructure, and limited HVAC serving designated refuge areas. In doing so, the building maintains a baseline level of habitability and functionality even under extended grid interruptions.
2.
ENSURE RELIABLE EMERGENCY POWER FOR CRITICAL BUILDING OPERATIONS.
Supplemental backup generation through generators or hybrid renewable systems further strengthens this capability by providing sustained power when stored energy is depleted or when environmental conditions limit renewable production. When integrated with clear load-shedding strategies and critical system zoning, backup power can be used efficiently to extend operational duration and reduce fuel or resource consumption.
Together, these systems position the building as a reliable community asset during emergencies. The ability to provide power, lighting, thermal stability, and basic services supports its potential use as a public place of refuge during heat waves, extreme weather events, or other crises. This layered energy approach not only improves building survivability but also reinforces its role in broader community resilience planning.
G. WATER EFFICIENCY & RESILIENT USE STRATEGIES
Water efficiency is a critical component of building resiliency, particularly in regions subject to drought, infrastructure strain, or service interruptions. Reducing potable water demand while maintaining essential building functions increases the building’s ability to operate during both routine shortages and emergency conditions.
WATER CONSUMPTION.
1. USE ONLY HIGH-EFFICIENCY PLUMBING FIXTURES TO REDUCE
At the fixture level, the use of high-efficiency, codecompliant plumbing fixtures establishes a reliable baseline for reduced water consumption. Toilets equipped with regulated flushometers limit water use per flush while maintaining performance, and sensor-activated or timed shutoff faucets prevent excessive or unintended water flow. These measures significantly reduce daily water demand, lower utility costs, and decrease stress on municipal water systems without compromising user experience or hygiene.
2. INCREASE OPERATIONAL STABILITY OF AQUATICS FACILITIES THROUGH WATER CONSERVATION.
For community pools, reducing make up water demand is a key resiliency strategy that directly supports long-term operational stability. Measures such as the use of pool covers during non-operational hours, wind buffering through building enclosure or adjacent landscape elements, and splash-out control at pool edges can significantly reduce evaporative and incidental water loss. In addition, high-efficiency filtration systems and backwash water recovery can limit the volume of water discharged during routine maintenance, while automated level controls and leak detection help prevent unnecessary overfilling and undetected losses.
Collectively, these strategies reduce dependence on potable make-up water, lower operating costs, and allow pool facilities to remain functional and compliant during periods of water restriction or supply disruption.
PART FOUR
3. RECLAIM AND RE-USE WATER WHERE POSSIBLE.
Beyond fixture efficiency, more advanced strategies can further enhance water resilience. Systems that capture, treat, and reuse non-potable water like greywater or treated brown water can be integrated to serve toilet flushing, irrigation, or other nonpotable applications. When designed and permitted appropriately, these systems reduce reliance on potable water supplies and extend building operability during supply disruptions or restrictions.
While advanced water reuse systems introduce additional complexity in terms of infrastructure, maintenance, and regulatory coordination, they provide a meaningful layer of redundancy for critical water-dependent functions. Combined with efficient fixtures and thoughtful system design, these strategies create a water-resilient building that conserves resources under normal conditions and remains functional during periods of scarcity or emergency.
H. MECHANICAL SYSTEM RESILIENCY
The resilience of HVAC and associated mechanical systems is critical to maintaining safe, functional interior environments during periods of extreme weather, utility constraints, or extended operational demands. Resilient mechanical design balances system type selection, passive load reduction, and long-term maintenance to ensure durability, efficiency, and adaptability over the building’s lifecycle.
1. PICK THE RIGHT HVAC SYSTEM FOR THE INTENDED USE.
Centralized HVAC Systems:
Centralized HVAC systems are well suited for larger facilities with consistent occupancy patterns and centralized plant spaces. These systems offer high efficiency at scale, simplified maintenance through consolidated equipment, and strong compatibility with redundancy strategies and backup power. However, they can be more vulnerable to single-point failures if not designed with appropriate redundancy.
Multi-zone Systems:
Multi-zone Systems provide greater operational flexibility. By allowing different areas of the building to respond independently to varying loads, occupancy schedules, or exposure conditions. This approach improves comfort and energy efficiency while enhancing resilience by limiting the impact of localized system failures. Multi-zone systems are often appropriate for facilities with diverse programmatic uses or varying hours of operation.
Split Systems:
Split systems are best suited for smaller buildings, phased construction, or areas requiring independent control. Their distributed nature reduces reliance on a single central plant and allows portions of a building to remain operational if other units are offline. While they may involve higher cumulative maintenance effort, split systems can offer a pragmatic and resilient solution where central infrastructure is limited or where incremental replacement is desired.
2. LEVERAGE PASSIVE ARCHITECTURAL STRATEGIES TO INCREASE HVAC SYSTEM PERFORMANCE.
Architectural passive strategies directly influence HVAC system performance and longevity. By reducing peak heating and cooling loads, these measures allow mechanical systems to operate within more stable ranges, decreasing wear on compressors, fans, and controls. Lower peak demand and reduced cycling extend equipment life, improve energy efficiency, and reduce the likelihood of failure during extreme weather events.
3. PRIORITIZE PROACTIVE MAINTENANCE AND PERFORMANCE VERIFICATION
Regular preventive maintenance is the most crucial step in preserving HVAC resiliency for existing buildings. Routine inspection, cleaning, and component replacement help maintain design performance and prevent minor issues from escalating into system failures. Periodic testing, adjusting, and balancing (TAB) reports provide verification that air and water systems are operating as intended, ensuring proper distribution, pressure relationships, and energy use. Together, proactive maintenance and performance
verification extend system lifespan, improve reliability, and support consistent operation during both normal and emergency conditions.
I. SECURITY RESILIENCE
Security resilience in public facilities is most effective when it is integrated seamlessly into the architectural design, providing safety and preparedness without creating an overly restrictive or fortress-like environment. The goal is to enhance awareness, control, and durability while preserving openness, accessibility, and a welcoming public presence.
1. EMBRACE A LAYERED APPROACH TO BUILDING SECURITY.
In new construction buildings or where able in existing buildings layered security strategies are a foundational approach. Clearly defined site edges, controlled points of entry, and intuitive circulation patterns allow for passive oversight and natural access control without relying solely on physical barriers. Building placement, landscape design, and changes in grade can be used to subtly guide movement and discourage unauthorized access while maintaining visual openness.
2. VISIBILITY AND TRANSPARENCY PLAY A CRITICAL ROLE IN SECURITY RESILIENCE.
Strategic glazing, clear sight-lines, and well-lit interior and exterior spaces support natural surveillance by staff, occupants, and the public. This “eyes on the space” approach enhances safety while reinforcing a sense of openness and civic trust. Lighting design should prioritize consistent illumination of entries, paths, and gathering areas without creating harsh or defensive conditions.
3. RESILIENT PUBLIC FACILITIES ALSO BENEFIT FROM FLEXIBLE OPERATIONAL CONTROLS.
Spaces can be designed to transition between normal use and heightened security modes through lockable zones, operable partitions, and programmable access systems. This adaptability
allows the facility to respond to specific events or emergencies without permanently compromising accessibility or user experience.
4. PROTECTIVE BUILDING SYSTEMS FURTHER REDUCE VULNERABILITY.
Durable materials, impact-resistant glazing where appropriate, and protected building systems add another layer of resilience by reducing vulnerability to damage while remaining visually understated. When combined with thoughtful planning and passive design principles, these measures support a secure, welcoming environment that balances public access with safety and long-term operational resilience.
J. FIRE RESILIENCE
Fire resilience in public facilities is achieved through a combination of proactive planning, passive building design, robust systems, and operational preparedness. The objective is to limit fire spread, protect occupants, and support continued functionality while meeting life safety requirements and community resilience goals.
1. OPTIMIZE SITE ACCESS AND LANDSCAPING FOR FIRE RESPONSE AND RISK REDUCTION.
At the site and planning level, adequate fire department access, clear emergency vehicle routes, and appropriately sized fire lanes are essential. Building placement and landscape design should maintain defensible space, particularly in fireprone regions, by limiting combustible vegetation near structures and selecting fire resistant planting where feasible. These measures improve emergency response capability and reduce exposure to external fire threats.
PART FOUR
B. EMPLOY PASSIVE FIRE-RESISTIVE CONSTRUCTION TO COMPARTMENTALIZE AND PROTECT BUILDING OCCUPANTS AND CRITICAL INFRASTRUCTURE.
Passive fire-resistive construction forms the backbone of resilient design. Fire-rated walls, floors, and assemblies compartmentalize buildings to slow fire spread and provide protected areas for occupant egress. The use of non-combustible and fire-resistive materials protect structural systems and fire-rated enclosures for critical spaces enhances building survivability and reduces damage during fire events.
3. INTEGRATE REDUNDANT AND RELIABLE ACTIVE FIRE PROTECTION SYSTEMS.
Active fire protection systems further strengthen resilience. Automatic sprinkler systems, fire alarm and detection systems, and smoke control strategies provide early warning and rapid response, minimizing risk to occupants and property. Where feasible, these systems should be designed with redundancy and emergency power support to ensure operation during utility disruptions.
4. ENSURE CLEAR EGRESS AND MAINTAIN FIRE SYSTEM READINESS FOR SAFE EVACUATION.
Egress and operational readiness are equally important. Clear and intuitive exit paths, protected stair enclosures, and areas of refuge support safe evacuation for all occupants, including those with limited mobility. Ongoing inspection, testing, and maintenance of fire protection systems ensure continued reliability over time. Together, these integrated strategies create public facilities that are better prepared to withstand fire events while maintaining safe, accessible, and resilient environments for the community.
K. CODE RESILIENCY & REGULATORY COMPLIANCE
Code resiliency in public facilities is achieved by maintaining buildings in continuous alignment with applicable building, fire, accessibility, and energy codes throughout their operational life. Rather than viewing code compliance as a one time requirement at construction, resilient facilities treat it as an ongoing process that supports safety, functionality, and long-term adaptability. Collectively, these practices ensure that public facilities remain safe, functional, and resilient while avoiding deferred maintenance and regulatory risk over time.
1. CONDUCT REGULAR ASSESSMENTS AND PROACTIVE UPGRADES.
Conduct regular assessments and proactive upgrades to maintain code compliance and safety. Regular building assessments and condition surveys are essential to identifying systems or components that have fallen out of compliance due to code updates, material degradation, or changes in use. Proactive upgrades such as improvements to accessibility, fire protection, or energy performance can reduce the risk of sudden, costly interventions and ensure that facilities remain safe and legally operable as standards evolve.
2. DESIGN FOR FUTURE ADAPTABILITY.
Code resilient buildings are also designed with flexibility in mind. Providing accessible routes, appropriately sized structural systems, and adaptable mechanical and electrical infrastructure allows future modifications to be implemented with minimal disruption when codes or operational requirements change. This forward-looking approach reduces retrofit complexity and extends the useful life of the facility.
3. IMPLEMENT ROBUST DOCUMENTATION AND COORDINATION PRACTICES.
Ongoing documentation, inspection, and coordination with Authorities Having Jurisdiction (AHJs) further reinforce code resiliency. Maintaining accurate records of inspections, permits, and system certifications supports informed decision-making and timely compliance actions.
L. BUILDING PROGRAM & SPACEUSE RESILIENCY
Building program resiliency is achieved by designing and maintaining spaces that can adapt to changing operational needs, occupancy patterns, and community demands over time. Public facilities that support flexible use are better positioned to remain functional during emergencies, shifts in service delivery, or long-term demographic and programmatic change.
1. DESIGN MULTIPURPOSE AND ADAPTABLE SPACES.
At the planning level, resilient programs prioritize multipurpose spaces, clear structural grids, and appropriately sized service zones that allow rooms to be reconfigured without major construction. Spaces designed for shared or overlapping uses like community rooms, classrooms, or support areas can
be quickly repurposed to accommodate temporary shelter, emergency services, or expanded public functions during critical events.
2.
INCORPORATE FLEXIBLE INFRASTRUCTURE TO SUPPORT SPACE ADAPTABILITY.
Infrastructure flexibility is equally important. Providing distributed power, data, ventilation, and plumbing capacity allows spaces to change use without extensive system modifications. Clear ceiling zones, accessible pathways for future systems, and standardized room proportions support efficient adaptation while minimizing downtime and cost.
3. IMPLEMENT ROUTINE SPACE-USE EVALUATIONS.
Implement routine space-use evaluations to enhance facility responsiveness and resilience. Operational clarity and regular review further strengthen program resiliency. Periodic evaluation of how spaces are used helps identify underutilized areas, emerging needs, and opportunities for consolidation or expansion.
By aligning physical space with evolving program requirements, public facilities can remain relevant, efficient, and responsive, ensuring long-term resilience in both daily operations and extraordinary circumstances.
Figure 4.33 - MP room at the Heritage Park Senior Center, (2025).
B. QUANTIFYING THE NEED
1. ACREAGE LEVEL OF SERVICE
Acreage-based Level of Service (LOS) remains one of the most straightforward metrics for assessing whether the community is “keeping up” with the amount of park land needed to support population growth. The 2019 Parks and Recreation Master Plan reported that Henderson’s “Capacity” metric reflected 4.3 acres of developed park land per 1,000 people, compared to an established target of 5.5 acres per 1,000, illustrating that even prior to the current plan update, the city’s acreage provision was below the aspirational target originally set in P&R’s 2008 master plan.
As of December 31, 2025, the City of Henderson provides 76 park sites, totaling about 1,360 acres of developed public park land for an estimated population of approximately 359,000 residents. This results in an Acreage LOS of 3.79 acres of developed park land per 1,000 residents, which falls short of P&R’s 2008 master plan goal of 5.5 acres per 1,000 residents—a deficit amounting to 614.5 acres. This figure is also well below the median of 10.3 acres per 1,000 residents reported for cities with populations between 250,000 and 499,999 in the National Recreation and Parks Association’s (NRPA) 2025 Agency Performance Review.
Even though Henderson added 11 parks, increasing park land by 69 acres since 2018, the rapid population growth—nearly 50,000 more residents, or a 13.7% increase—has led to a decline in Acreage LOS, dropping 11.9% from 4.3 acres per 1,000 in 2017 to 3.79 acres per 1,000 in 2025. While the addition of park acreage is commendable, it has not kept pace with the city’s expanding population, highlighting the ongoing challenge Henderson faces in meeting its parkland targets and sustaining its reputation for high-quality recreational amenities as the community continues to grow.
Planning-level projections help illustrate the magnitude of parkland need as growth continues. If the city’s population growth continues at approximately 3.17% annually, the amount of additional park acreage needed to maintain the 2025 developed-park Acreage LOS of 3.8 acres per 1,000 residents grows quickly.
For example, under that assumption, maintaining a 2025 developed-park Acreage LOS through 2030 would require the acquisition and development of roughly 230 additional acres of parkland, while maintaining that same LOS through 2040 would require roughly 813 additional acres. Achieving the city’s previously established acreage target of 5.5 acres per 1,000 residents by 2040 would require on the order of 1,793 additional acres beyond the current developed-park baseline.
These figures are not intended to prescribe a single “correct” number of acres; rather, they illustrate a key planning reality: without continued park acquisition and development at a pace commensurate with population growth, acreage LOS will continue to decline even if new parks are added, simply because population is increasing faster than the supply of new developed park acreage.
2. ACCESS LEVEL OF SERVICE
Access-based LOS complements acreage-based LOS by emphasizing how well residents can reach park land close to home. The 2019 master plan used GRASP® analysis and reported that approximately 83% of Henderson was within the study’s defined level-of-service range for recreation opportunities, reinforcing that access is generally strong but not universal.
This master plan cites Trust for Public Land’s ParkServe® analysis using current City data, showing that about 85% of Henderson residents live within a 10-minute walk of a public park or greenspace. While methodologies differ, both analyses point to the same conclusion: Henderson performs well in access relative to many communities, but targeted geographic gaps remain—especially where growth is occurring fastest.
While Henderson has made progress in improving access to public parks, notable gaps still exist in several areas of the city. The most significant of these gaps are primarily found in the rapidly developing West Henderson area, where new neighborhoods are emerging and demand for recreational amenities is growing.
PART FOUR
C. PUBLIC PARKS & PRIVATE DEVELOPMENTS
1. HISTORICAL CONTEXT
Over the past three decades, Henderson has experienced rapid growth that has led to the development of numerous public parks citywide. Importantly, the vast majority of these parks— representing more than $100 million in public park infrastructure—were constructed by private developers as part of master planned neighborhood developments, with funding provided by the private development community. These parks, known as “turnkey” parks have significantly shaped the city’s recreational landscape, ensuring high-quality amenities for thousands of residents.
In addition, Henderson also contains numerous private or HOA-managed parks that supplement neighborhood access and walkable service levels, even though access is typically limited to residents or members of those communities. The 2019 master plan recommended that the city track these assets to better understand how private parks supplement overall access patterns—while also recognizing they are not a substitute for public parks.
2. TURNKEY PARK DEVELOPMENT PROCESS
As Henderson continues to grow, developer-delivered “turnkey” public parks will likely remain an important delivery tool for neighborhood-scale parks in master planned communities.
The process of developing turnkey parks in Henderson is a coordinated effort involving several city departments and private developers. It all begins with the Henderson Community Development and Services Department (CDS), which is responsible for negotiating and managing the park agreement with the private developer. This binding agreement clearly outlines the number, type, location, and programming of the parks that are to be included within a new master planned community. The
required amount of park space is determined by estimating the number of residents the development will serve, currently calculated using a standard of 2.4 people per household.
Throughout this process, P&R plays a critical directing role, working through park specifics with the developer regarding the desired design, amenities, and optimal locations for each planned park for inclusion in the park agreement. Additionally, the Henderson Parks and Recreation Board (often referred to as the Park Board) is given the chance to review proposed park concepts once a park agreement is approved, provided that the planned park will be maintained by P&R.
Construction of the parks is closely linked with the overall development of the master planned community, typically occurring in phases as new neighborhoods are built. Once a park is completed and any outstanding punch list items are addressed, ownership is formally transferred from the developer to the City of Henderson.
At this point, the Parks and Recreation Department takes on full responsibility for the site—overseeing its programming, daily operations, and long-term maintenance, ensuring that the park continues to serve the community for generations to come.
3. BENEFITS OF TURNKEY PARKS
The turnkey model can provide significant community benefits when executed with strong Department involvement and enforceable standards. It can accelerate park delivery, ensure parks are built alongside neighborhoods (rather than lagging development by years), and increase constructed value per dollar when developers can realize efficiencies through larger-scale construction programs.
When paired with thoughtful design standards and Department oversight, this approach can continue to deliver high-quality neighborhood parks that align with Henderson’s evolving expectations and performance requirements.
4. COMMON CHALLENGES WITH TURNKEY PARKS
The process of creating turnkey parks in Henderson is a collaborative venture between private developers and city departments, designed to ensure that new neighborhoods are equipped with quality recreational spaces as they are built. While this approach offers significant benefits, it is not without its challenges.
A. Compromises during negotiations.
During the negotiation of park agreements, concessions sometimes occur regarding the final size, location, or programming of proposed turnkey parks. If these decisions are made without sufficient input from the Parks and Recreation Department, they will potentially lead to unintended consequences that affect the park’s overall usefulness and alignment with community needs.
B. Perceptions of ownership.
Developers in Henderson have generally succeeded in designing parks that visually complement the unique character of their surrounding neighborhoods. However, issues arise when these parks lack clear City of Henderson branding—particularly signage at prominent entry or access points.
In such cases, residents may mistakenly believe that the park within their private HOA neighborhood is managed by the HOA rather than the City. This misconception can discourage broader community use, as individuals outside the neighborhood may not feel welcome or may assume they are not permitted to use the park. Furthermore, this confusion undermines the positive reputation and brand identity of the Henderson Parks and Recreation Department.
C. Differing priorities
Another complexity stems from the differing priorities between private developers and municipal entities. Developers are typically motivated by transactional, profit-driven objectives during the design and construction phases, while the City is more focused on the long-term implications of park ownership—such as maintenance, programming, and daily operations. Because these responsibilities ultimately rest with P&R, it is crucial that detailed and enforceable design standards are in place. These
standards must also be regularly updated to reflect evolving trends and best practices, ensuring that new parks serve the community effectively over time.
D. Long-term O&M costs
Despite the importance of design and construction, the greatest challenge associated with turnkey parks in Henderson is not the capital development itself, but rather the ongoing task of budgeting for and funding the long-term operations and maintenance that become the City’s responsibility once ownership of the park transfers from the developer. This enduring financial obligation requires careful planning and sustainable strategies to ensure that these valued public assets remain well-maintained and accessible for generations to come.
Figure 4.36 - Blooming Cactus Park (2025).
PART FOUR
D. O&M FUNDING OF TURNKEY PARKS
1. HISTORICAL APPROACH
The existing approach to funding turnkey parks in Henderson relies on a park agreement that covers the initial capital costs for constructing new neighborhood parks based on City of Henderson design guidelines. Under this model, the Parks and Recreation Department assumes only a limited role in financing the upfront expenses, while bearing full responsibility for the long-term maintenance and operational costs once the park is transferred to city ownership. Typically, no additional resources are allocated to P&R to compensate for these ongoing expenses, forcing it to absorb the financial burden within its current operational budget or seek increased funding through budget requests.
Over the past three decades, this strategy has enabled the city to develop over $100+ million in new public parks at minimal initial taxpayer expense. However, as discussed earlier in this report, the rapid pace of growth has led to mounting operational costs, many of which are now compounded by aging facilities that require major renovations and upgrades beyond routine maintenance.
The lack of dedicated funding for long-term park stewardship has made this delivery model unsustainable, particularly as the city faces the challenge of adding more than 200 acres of new parkland within the next five years to maintain its 2025 acreage level of service.
Compounding this issue, a dedicated property tax override represents a substantial portion of P&R’s funding for parks and recreation operations (approximately 40%). This is scheduled to sunset in 2027 unless renewed via public referendum— highlighting the importance of proactive, sustainable operating strategies as the system continues to grow.
2. ALTERNATIVE APPROACHES
There is no single “silver bullet” to fund long-term park ownership costs, but the park agreement model can, and should, evolve to better align responsibility for growth-related costs with the growth that generates them. As a baseline, Henderson should ensure that any new park construction associated with growth areas is built to current design guidelines and fully aligned with (and cost-shared through) applicable public facilities contribution frameworks and policies so that new growth pays an appropriate share of the burden.
Two high-level strategies implemented through development agreements and related policy tools include:
A. Maintenance and operations responsibility or cost-sharing mechanisms - The City may consider approaches where developers, special districts, or HOAs take on defined responsibilities, either directly maintaining specific assets or contributing dedicated funds to cover operations and lifecycle maintenance for a defined period. Enforceable maintenance standards would be necessary to ensure that quality remains consistent with Henderson’s expectations.
This type of approach may be implemented in multiple forms (up-front contribution, annualized contributions, or service contracting back to the City), but it must be supported by clear governance and “quality assurance” mechanisms that will prohibit the HOA/developer from making any substantive changes to the park program or amenities (such as just removing an amenity that is broken rather than repairing or replacing it in kind), without the approval of the Park Board and/or P&R.
B. Lifecycle-oriented funding structures and endowments - The 2019 master plan identifies the concept of maintenance endowments as an option that can be capitalized through a mix of revenue sources and dedicated to ongoing maintenance and infrastructure needs of specific facilities—an approach that aligns well with the reality that park costs are not constant across time but increase as assets age. This is especially important because many common development funding mechanisms (such as impact fees) are generally restricted to capital purposes and cannot typically be used for ongoing operations and maintenance.
Regardless of the specific mechanism, the central policy shift is the same: future growth-era parks should not be accepted without a clear, prenegotiated, and enforceable strategy for funding (and/or delivering) the ongoing operational and lifecycle maintenance costs that will be incurred once the park becomes a permanent public asset.
E. NEIGHBORHOOD PARKS
Neighborhood parks are one of the most important facilities in Henderson’s system and an essential tool for achieving the aspirational goal that every resident has a high-quality public park or greenspace within a 10-minute walk of home. The 2019 master plan explicitly emphasized maintaining the 10-minute walk standard and exploring new park delivery in low-service areas, reinforcing that neighborhood parks are foundational to both access equity and daily-life quality.
The current needs assessment reinforces this same direction even more strongly: Neighborhood parks ranked among the highest unmet needs and high priorities for investment, underscoring that “closeto-home” parks remain a defining expectation for residents across Henderson.
As Henderson continues to build new neighborhood parks, the “new model” of resilient neighborhood park design should remain the standard—emphasizing climate-appropriate shade, water-conscious landscapes, inclusive design, flexible programming spaces, and strong multi-modal connections so that neighborhood parks perform as dependable daily assets in an increasingly hot and water-constrained environment.
Specific attributes of the future neighborhood parks in Henderson include:
1. They embrace and educate visitors about the unique desert climate in which Henderson resides.
2. They utilize less natural turf and any natural turf provided yields multiple values beyond aesthetic beauty.
3. They are strategically designed to mitigate the effects of extreme heat and drought by providing more shade where it’s needed most with using a
combination of both structured (structures, shade sails, etc.) and natural solutions (trees, landforms, etc.).
4. They are more flexible in their design and configuration, allowing them to adapt to changes in trends and resident needs over time.
5. They are less resource intensive; requiring less irrigation
6. They embrace and activate xeric landscape areas by incorporating activating amenities in addition to native plant revegetation areas.
7. Trees, especially shade trees, are treated as critical infrastructure that are protected through strategic changes in species selection, irrigation system design, and planting and maintenance best practices.
8. They reflect and demonstrate the unique culture and attributes of the surrounding community through the incorporation of storytelling elements like public art and interpretative elements.
9. They provide additional opportunities to interact with natural environments and systems at a variety of scales.
10. They embrace a resiliency-focused approach to landscape design that utilizes a more contextappropriate naturalized aesthetic. and droughtfriendly plant material.
11. They intentionally facilitate multigenerational activation and interaction for people of all abilities.
In summary, future neighborhood parks in Henderson should continue to reflect high-performing, inclusive, and resilient parks that generate multiple benefits beyond play—supporting physical health, social connection, access to nature, and place-based identity in every neighborhood.
PART FOUR
F. NATURAL AREAS & NATUREBASED EXPERIENCES
Residents consistently express that parks and trails are not only for recreation, but also for relaxation, restoration, and connection to the natural beauty of Henderson. In the current needs assessment, natural areas/conservation areas ranked among the top facility needs and investment priorities, and related priorities, such as unpaved hiking trails within parks, also ranked highly. Market research in the current update similarly indicates strong interest in outdoor activities, including significant expected participation in hiking and camping, reinforcing the importance of both regional-scale natural assets and neighborhood-accessible nature experiences.
Importantly, this direction has been visible for years. The 2019 master plan’s statistically valid survey identified open space/natural areas as a highdemand priority—second only to trails and trail connections—and also emphasized the emerging importance of nature-based play, naturalized landscapes, and interpretive/educational elements integrated into parks.
To respond to these consistent priorities, P&R should pursue two coordinated strategies to increase residents access to natural areas and nature-based experiences:
STRATEGY 1: Acquire and develop new natural areas as part of new parks
As new parks and greenspaces are planned— particularly in West Henderson and other growth areas—Henderson should intentionally include conservation-oriented lands and natural open space systems as part of the public realm. This means looking beyond the traditional “developed park” template and ensuring that future park planning includes natural areas that protect desert landscapes, landforms, and habitat while still providing safe and welcoming public access where appropriate.
These lands can function as a community asset in multiple ways: preserving the desert context that makes Henderson unique; expanding access to hiking, nature viewing, and outdoor learning; and strengthening the citywide network of trails and nature-based recreation experiences.
Where feasible, new natural area park components should be planned as part of larger community and regional park projects and aligned with connected trail networks, trailheads, and access points so that natural lands are not “leftover space,” but rather intentionally designed for stewardship, public learning, and low-impact recreation. This aligns with current needs assessment implications calling on the city to protect key natural assets, complete
trail connections, and integrate nature play opportunities—delivered through an equity lens so that daily access to nature is not limited to only a few parts of Henderson.
STRATEGY 2: Retroactively add smaller, localized natural areas and nature-based experiences within existing parks.
While new conservation lands are important, the needs assessment also makes clear that residents value “close-to-home access” to natural areas, trails, and nature-based play and learning—meaning nature experiences must also be distributed throughout the existing park system at neighborhood and community scales. This strategy focuses on integrating nature into existing parks through smaller, achievable interventions that cumulatively expand access to nature across the city, including in built-out neighborhoods where new land acquisition is difficult.
At the neighborhood park scale, retroactive naturalization can include: small “micro-habitat” demonstration areas using native desert plant communities; nature play elements that use boulders, logs, sand, and landforms to provide play value while reflecting desert character; interpretive signage and storytelling that connects residents to local ecology and cultural history; and short, softsurface walking loops or nature paths within parks where feasible. These types of improvements can be especially powerful when paired with shaded seating, hydration, and clear wayfinding so that nature experiences remain usable and comfortable in Henderson’s climate.
At the community and regional park scale, retroactive natural area enhancements can include larger naturalized zones and unpaved trail segments within parks, habitat-friendly planting areas, expanded interpretive/education programs, and stewardship opportunities that translate access into long-term care for local landscapes—an approach explicitly supported in the current needs assessment implications and priorities.
G. RECOMMENDATIONS: NEW PARKS
1. Provide a minimum of 231 additional acres of developed parkland by 2030 (at current growth assumptions) to maintain the city’s developedpark Acreage LOS.
Henderson should prioritize the acquisition and development of additional parkland in growth corridors so that acreage LOS does not continue to decline as population increases. This will likely require delivering multiple larger community and/or regional parks (not only small neighborhood parks), because acreage needs cannot be met through small sites alone.
2. Maintain “10-minute walk” access as a defining standard for neighborhood park planning and gap-closure
Continue to use access-based analysis to target remaining gaps and ensure that new park sites are truly walkable in practice—connected by sidewalks, trails, shade, and safe crossings. Better understand and prioritize true gaps in access by mapping service areas for private, HOA parks and greenspaces that are restricted to the property boundaries of the HOA.
Figure 4.38 - Interpretative sign at the Henderson Bird Viewing Preserve (COH, n.d.)
PART FOUR
3. Ensure a fiscally-sustainable approach to turnkey park delivery that explicitly addresses long-term operations, maintenance, and lifecycle reinvestment costs upfront.
New parks should not be accepted without a clear, enforceable plan for how ongoing costs will be funded and/or delivered, recognizing that system expansion and aging infrastructure are occurring simultaneously.
4. Evaluate lifecycle cost and O&M proformas during development agreement negotiations and before park acceptance decisions.
Require a standardized, Department-led O&M estimate (staffing, utilities, landscape/irrigation, specialty amenities, lifecycle replacements) so that decision-makers understand the long-term implications of park program choices before agreements are finalized.
5. Pursue O&M funding mechanisms compatible with legal constraints, including maintenance endowments and other lifecycleoriented approaches.
Because many development funding tools are restricted from being used for ongoing O&M, Henderson should pair capital delivery with lawful mechanisms that support long-term maintenance, including endowment-style models where feasible.
6. Update P&R’s park design standards to reinforce the “new model” of neighborhood parks and reduce lifecycle burden
Standards should prioritize resilience, inclusive design, comfort (shade/hydration), and lowemissions/energy-efficient systems—while also reducing maintenance intensity where possible through consistent materials, standardized parts, and proven details.
7. Continue coordination between Community Development and Parks & Rec during the development agreement process.
Maintain clear review dates, shared criteria, and documented approval steps so that concessions affecting park size, location, or program do not inadvertently create long-term maintenance liabilities or reduce neighborhood access outcomes.
8. Update signage and wayfinding standards to reinforce public identity and improve usability.
Ensure clear, consistent City of Henderson branding and “public welcome” messaging at park entry points and trail access locations to strengthen system legibility and prevent the perception that parks are private or reserved for an HOA.
9. Implement a “Natural Areas and NatureBased Experiences” delivery program across both new and existing parks
For new parks, require that park planning evaluates opportunities for conservation-oriented lands, natural open space, interpretive programming, and low-impact trail connections.
For existing parks, identify candidate sites (from neighborhood parks to regional parks) where targeted naturalization and nature play interventions can expand daily access to nature citywide.
10. Align new park delivery with the community’s highest priority facility investments.
Ensure that new parks and greenspaces directly contribute to the highest priority facility needs— neighborhood parks, paved trail connections, natural areas/conservation areas, and large community parks—so that capital investments clearly track to resident priorities
PART FOUR
While this model has delivered significant capital value, the long-term stewardship burden rests with the City and has become increasingly difficult to absorb as the system expands and ages.
2. A MAJOR OPERATING FUNDING SOURCE IS APPROACHING A CRITICAL DECISION POINT.
The needs assessment identifies renewal (and potentially extension or adjustment) of the dedicated 12-cent property tax override—which accounts for roughly 40% of annual operations and maintenance funding—as essential to sustaining service levels, keeping pace with growth, and avoiding significant reductions in programs, maintenance, and facility operations. The override is scheduled to sunset in 2027 unless renewed by Henderson voters, elevating the importance of clear financial strategy, transparency, and communication.
In short: Henderson has a high-performing system with strong participation demand and a national reputation for quality, but it is operating in a context where cost escalation, growth-related O&M transfer, and a looming major funding decision require proactive planning. This subsystem establishes strategies to protect access, maintain quality, and sustainably fund the long-term care of the system.
B. FINANCE & OPERATIONS VISION
OVER THE NEXT 10 YEARS, HENDERSON WILL:
1. Align service levels, staffing, and lifecycle needs with sustainable funding so that system growth does not outpace the City’s ability to operate and maintain parks, trails, and facilities—particularly as ongoing costs rise and new assets come online.
2. Improve financial resilience by capturing “missed” and under-realized earned revenues while maintaining resident affordability and equity— recognizing that unmet program demand and “missed revenue” are concentrated in high-demand areas like aquatics and youth programming.
3. Increase transparency and trust through clear communication of costs, tradeoffs, and reinvestment priorities, especially for high-cost assets and heavily used services—so the community better understands what it costs to deliver quality parks and recreation and how revenues are reinvested.
4. Ensure that partnerships and developmentdelivered projects include long-term operations and maintenance considerations, not only capital delivery—so new parks and facilities are accepted with enforceable plans for how they will be staffed, operated, and maintained over time.
Figure 4.40 - NRPA Gold Medal Award Finalist plaques in the Henderson Parks & Recreation Dept. offices (2025).
C. PRIORITY
STRATEGIES
1. INCREASE COST RECOVERY:
A. Continuously examine and amend target cost recovery ranges by major service area, distinguishing between mission-subsidized services and those appropriate for higher recovery.
Henderson’s financial assessment shows that cost recovery varies widely—some areas (e.g., sports) can exceed 100% in certain months, while others (e.g., senior services and special events) are inherently subsidized due to mission and community benefit.
A tiered cost recovery framework allows the City to intentionally subsidize what should be subsidized— while setting clearer recovery expectations where market demand and service structure make higher recovery reasonable.
Recommended approaches include:
1. Establish and adopt department-wide cost recovery tiers (e.g., Essential Access / Community Benefit / Market-Responsive) and assign each major program/service line to a tier.
2. Update target ranges annually using a consistent set of inputs (direct costs, staffing, utilization, competitor pricing, residency mix, community benefit).
3. Use the benchmarking finding that Henderson’s overall cost recovery (~17%) trails the national median and comparable systems as a guidepost for improvement, while remaining consistent with Henderson’s access mission
B. Use a consistent framework to evaluate pricing decisions, including resident affordability, equity impacts, and community benefit.
Needs assessment findings reinforce that affordability is a cross-cutting “enabler” of participation. Residents want transparent pricing and tools such as resident discounts and scholarships to keep access equitable
while clarifying cost recovery expectations. The Vision should treat affordability as an intentional policy choice—supported by clear eligibility tools— rather than an informal outcome of static pricing.
Recommended approaches include:
1. Formalize an affordability and equity review step for fee changes (who benefits, who is burdened, what alternatives exist, how scholarships/ discounts mitigate).
2. Maintain (and better communicate) scholarship and fee reduction structures, bundling options, and other affordability mechanisms as part of the pricing “package,” not as an afterthought.
C. Introduce more nuanced pricing tools where appropriate (tiered, peak/off-peak, dynamic, and modest non-resident differentials) to better match demand while protecting core access.
Program performance analysis shows rising nonresident participation in several areas, supporting targeted non-resident differentials, and also points to the suitability of peak/off-peak pricing where premium time slots are limited. The analysis specifically recommends peak/off-peak and nonresident surcharges where demand is rising, paired with scholarships/bundles to preserve affordability.
Recommended approaches include::
1. Pilot peak/off-peak pricing first in the most capacity-constrained, high-waitlist programs (aquatics, youth programs, prime-time fitness) and evaluate impact on participation, equity, and revenue.
2. Apply modest non-resident differentials in program areas with strong non-resident demand—paired with clear resident discounts— to ensure residents retain the primary benefit of local tax support.
PART FOUR
2. INCREASE EARNED REVENUE CAPTURE:
A. Reduce structural “missed revenue” by aligning staffing, schedules, and capacity with demand, especially where participation demand exceeds supply.
Henderson’s program data analysis demonstrates that enrollment and revenue are concentrated in core families such as Battleborn Kids, aquatics, and sports, and that these areas account for most “missed revenue” tied to persistent waitlists. Waitlist pressure is most severe in aquatics and youth programs, indicating that added sections, extended hours, and/or instructor supply are primary mechanisms to capture unmet demand.
Recommended approaches include:
1. Implement a “capacity capture plan” for the top waitlist-heavy programs, including
+ Adding sections and micro/mini-sessions.
+ Selectively extending shoulder/peak hours.
+ Re -balancing room blocks to reduce unused time and shorten changeover between classes.
2. Build and maintain an instructor “bench” through targeted recruitment and retention tools (stipends, seasonal pipelines, partnerships).
3. Align facility operating hours with resident availability (early mornings, evenings, weekends), reinforcing the needs assessment finding that hours alignment is a major barrier-and-enabler for participation.
B. Ensure fees and staff charges more accurately reflect actual costs, particularly for rentals and tournament-related use that creates concentrated wear and operational burden.
Facility rentals have shown growth, boosted by demand for youth sports tournaments and private events. These uses can require concentrated staffing, increased maintenance response, higher utilities, and accelerated wear (fields, restrooms, trash service, irrigation impacts). Pricing that fails to capture these marginal costs effectively shifts tournament-related burden onto general users and core operations budgets.
Recommended approaches include:
1. Create a tournament and special-use fee framework that includes:
+ Direct staffing (weekend supervision, custodial, public safety, maintenance, etc.).
2. Apply pricing tools recommended in benchmarking (e.g., dynamic tournament fees) as part of an “elevate cost recovery” strategy that does not rely solely on generalized fee increases for residents.
C. Where feasible, redirect earned revenues to a non-reverting account or department-managed reinvestment mechanism so the system directly benefits from the demand it is managing.
A recurring community trust opportunity is to make reinvestment visible: when programs, rentals, or tournaments generate net revenue, a portion can be dedicated to the facilities and services experiencing the greatest wear and demand—improving both sustainability and public confidence.
Recommended approaches include:
1. Establish a “Parks & Rec Reinvestment Fund” (or similar mechanism) to capture defined revenue streams (selected rentals, tournament surcharges, premium time slot pricing, sponsorship revenue) and reinvest in:
+ Renewal and replacement of high-use assets.
+ Customer-facing service improvements.
+ Affordability tools (scholarships and access programs).
2. Report reinvestment outcomes through recurring dashboards, reinforcing stewardship and trust.
3. IMPROVE AGREEMENTS, PARTNERSHIPS, & DEVELOPMENT TERMS:
A. Revisit major shared-use or legacy agreements to ensure costs and benefits are equitable and reflective of current realities.
With continued demand for youth and family offerings and known scheduling pressures, shareduse arrangements—particularly school-related use where applicable—remain a critical tool to expand access and “squeeze more playable hours” out of limited assets. However, agreements must reflect current wear, maintenance responsibilities, staffing needs, and community expectations.
Recommended approaches include:
1. Conduct a targeted audit of the City’s highestimpact shared-use agreements (field access, gyms, parking, restrooms, lighting) and identify:
+ Where costs have shifted disproportionately to the City,
+ Where service levels need clarity, and
+ Where scheduling and priority rules should be updated to match current demand patterns.
2. Tie agreement updates to a broader strategy of operational sustainability—especially where shared-use expands service capacity without proportional capital expansion.
B. Expand sponsorship/naming/partnership tools with clear policy guardrails (context, appropriateness, safety, public trust).
Multiple plan components point to sponsorships as a viable tool to diversify funding—especially for events, sports fields, and aquatic features— when implemented with clear governance. The benchmarking implications also identify corporate sponsorships as a potential component of elevating cost recovery toward national norms.
Recommended approaches include:
1. Adopt a formal sponsorship and naming policy that defines:
+ Grounds and process for termination/ revocation of naming/sponsorship rights for cause.
+ How sponsorship dollars are allocated (including reinvestment commitments).
C. Ensure developer-delivered park assets account for long-term operational impacts before acceptance, not only capital delivery.
The needs assessment is explicit: growth and turnkey delivery models are increasing O&M obligations, often without corresponding O&M funding when assets transfer to the City. This is a structural sustainability challenge—not a one-time budgeting issue.
PART FOUR
The Master Plan Vision reinforces the direction clearly: Henderson should adopt a more fiscally sustainable approach to turnkey delivery, avoid accepting new parks without enforceable long-term funding plans, and incorporate lifecycle and O&M proformas into development agreements and park acceptance decisions.
Recommended approaches include:
1. Require a standardized Department-led O&M estimate for all proposed turnkey parks and major developer-delivered assets (staffing, utilities, irrigation/landscape, specialty amenities, lifecycle replacement schedule).
2. Negotiate development agreement-level mechanisms that reduce the City’s unfunded O&M exposure), including time-bound cost-sharing, maintenance endowment-style approaches where lawful, or defined responsibilities paired with enforceable maintenance standards.
3. Align new park design standards with lifecycle efficiency (standardized materials/parts, watersmart landscaping, heat-resilient features that do not create unsustainable maintenance intensity).
A. Continue translating budget and service-level decisions into clear public-facing messages (what it costs to operate, what is being reinvested, and what tradeoffs exist).
The plan’s financial strategy content emphasizes that as levy renewal approaches, clear communication of achievements, metrics, and return on investment is critical to building support. Recommended practices include recurring performance dashboards covering revenue, cost recovery, expenditures, and participation metrics, and demonstrating how tax and fee revenues support programs the community values.
Recommended approaches include:
1. Continue to publish an annual “State of Parks & Rec” (year-end) performance report within the that highlights:
+ Service impacts (expanded class sections, reduced waitlists, improved maintenance response).
Figure 4.41 - Ribbon cutting for Blooming Cactus Park (2025).
2. When fee adjustments occur, provide a simple explanation of the “why” (cost escalation, staffing needs, reinvestment) paired with affordability protections.
B. Explore developing simple public-facing communication tools (e.g., maintenance standards and frequency expectations) to build understanding and trust.
Henderson already has a strong operational framework through its Park Operations Manual, including standardized operating procedures, scheduled inspections, and data tracking that supports budgeting and accreditation requirements. The manual also includes a recommendation to share with residents why some parks receive daily
checks while others receive less frequent visits— exactly the kind of transparency that can strengthen public trust in stewardship.
Recommended approaches include:
1. Translate internal service frameworks into a public-facing “What to Expect” guide (e.g., restroom checks, trash pickup, playground inspections, irrigation response) to reduce frustration and clarify service levels.
2. Pair service-level communication with a clear reinvestment narrative: when P&R invests in comfort upgrades (shade, lighting, restrooms), the public also understands the maintenance commitment required to keep those upgrades reliable over time.
Figure 4.42 - Water management informational signage at Fox Ridge Park (2025).
PART FOUR
Barriers:
Finally, the barriers analysis makes clear that the success of P&R’s programs/events portfolio is increasingly linked to climate reality and access “friction.”
Workshop participants identified extreme heat as the dominant barrier to participation, with additional high-frequency barriers including “desired events/programs not oŸered,” “not knowing what’s oŸered,” and “limited hours of operation.”
This means the Programs & Events Vision must focus not only on what Henderson oŸers, but also when, where, and how residents discover and access those oŸerings.
B. PROGRAMS & EVENTS VISION
OVER THE NEXT 10 YEARS, HENDERSON WILL:
1. Expand access to high-value programs and events by growing capacity where demand is strongest and reducing barriers to participation.
2. Provide a program and event portfolio that is equitable by geography, age group, and ability, with particular attention to families, youth/teens, and older adults.
3. Adapt to climate realities by expanding evening, shoulder-season, and indoor programming so residents can participate safely during extreme heat periods.
4. Use data to continually refine the program portfolio, protecting quality while maximizing participation, community benefit, and operational sustainability.
Consistent with the overall Master Plan Vision framework, P&R’s long-term vision for programs and events should continue to balance “destinationquality” special events with dependable, aŸordable programs—delivered equitably and expanded in heat season through evenings and indoor-focused oŸerings.
Figure 4.44 - Community event with a “foam party” in Henderson (COH, n.d.).
C. PRIORITY STRATEGIES
1. CORE PROGRAM EXPANSION
A. Prioritize additional sections, extended hours, and/or instructor supply where waitlist demand is most persistent (notably aquatics and youth programs).
Program analytics show that the most persistent waitlist pressure is concentrated in aquatics and youth programs, indicating a straightforward—but operationally disciplined—opportunity: add capacity where demand is proven and recurring.
Recommended approaches include:
1. Add additional sections and micro/mini-sessions in aquatics and youth programs at high-demand facilities and times, aligned with “true demand periods” (after work, weekends).
2. Use waitlist analytics to shift from “calendarbased programming” to demand-based programming—where the default assumption is that core programs should scale until facility capacity, stašng capacity, or access goals create a defined constraint.
B. Address facility scheduling constraints at highdemand sites, especially where “missed” demand is highest and space limitations are a primary barrier.
Because facility concentration is so pronounced— especially at the Multigenerational Center— capacity expansion must include both physical and operational levers.
Recommended approaches include:
1. Conduct “prime time first” scheduling at the highest-demand sites: prioritize high-waitlist classes and strong program families for premium rooms/hours.
2. Re-balance room blocks, shorten changeover time between classes, and selectively extend shoulder/peak hours where stašng and safety can be maintained.
3. Use flexible spaces (studios, meeting rooms) for shorter, high-changeover classes to increase throughput and reduce bottlenecks.
C. Continue to use program performance metrics (fill rates, waitlists, cancellations, net revenue) to guide seasonal resource allocation.
The plan’s program analytics already track the right core measures (including waitlist statistics and “missed” revenue). The next step is institutionalizing how those metrics drive stašng, space, seasonal calendars, and program investment decisions.
Recommended approaches include:
1. Standardize “core performance dashboards” by season and facility (fill rate, cancellation rate, waitlist volume, net margin, residency share).
2. Set explicit “capacity capture goals” for the highest-demand program families each season (e.g., reducing waitlist volume by X% through added sections and schedule optimization).
Figure 4.45 - Annual Memorial Day Field of Honor flag display at Cornerstone Park (COH, n.d.)
C. Maintain innovation through introductory pilots, with clear success metrics and decision points.
A “yes to innovation” posture is compatible with fiscal/operational discipline when pilots are structured. Recommended pilot design practices, include:
1. Define success measures (e.g., minimum fill rate, maximum cancellation rate, equity targets, satisfaction) prior to administration of the program/event.
2. Establish a repeatable pilot calendar and a “go/ no-go” decision cycle/process (e.g., after 2–3 seasons or after a predetermined amount of revenue/loss is achieved).
3. PRICING
A. Maintain strong resident access while increasing revenue/cost-recovery using targeted tools such as modest non-resident differentials and peak/offpeak pricing where demand and residency patterns support it.
Program data indicates most areas retain a strong resident share, while several core areas show growing non-resident participation—supporting modest, targeted non-resident differentials and peak/off-peak pricing as long as resident affordability is protected.
Recommended approaches include:
1. Introduce peak/off-peak pricing for premium slots and times with persistent waitlists.
2. Continue to utilize non-resident surcharges, and increase non-residency fees where demand is rising and where residency ratios support it.
B. Establish consistent scholarship/subsidy practices, so affordability is protected while pricing remains defensible and transparent.
Survey benchmarking suggests Henderson’s overall perceived value is strong, but a small cohort experiences friction tied to price sensitivity, schedule/ access conflict, or registration usability—pointing to targeted affordability tools and improved user experience rather than major system-wide change.
Recommended approaches include:
1. Review scholarship eligibility, award levels, and application processes.
2. Continue to use clear, consistent messaging about resident discounts and scholarship to maintain public trust and reduce “hidden policy” perceptions.
C. Ensure special events and large rentals are priced to reflect true operational burden while protecting community-serving events.
As Henderson expands event offerings (and continues to host high-impact tournaments and community gatherings), pricing should distinguish between:
1. Signature community-serving events that merit subsidy due to broad benefit; and
2. Revenue-appropriate events/rentals that generate concentrated workload (staffing, cleanup, security, utilities, turf wear) and should recover more of their cost.
This aligns with the workshop direction to build a citywide activation framework that balances free/
PART FOUR
low-cost offerings with cost recovery programs and signature citywide gatherings.
4. HEAT-SEASON READY PROGRAMMING & EVENTS
A. Increase evening and indoor programming options during seasonal extreme heat periods to maintain participation and safety outcomes.
Extreme summer heat is consistently identified as a barrier to participation, reshaping demand toward evenings and increasing reliance on indoor, climatecontrolled options.
Recommended approaches include:
1. Expand “after dark” programming blocks during peak heat months (family nights, teen nights, adult fitness, indoor drop-in leagues).
2. Align hours with resident availability—early mornings, evenings, and weekends—especially during summer heat.
3. Explore strategies to deliver new indoor facilities in growing portions of the community, such as Cadence and notably West Henderson. Explore opportunities for P3 approaches to project delivery that ensure meaningful and equitable access for the public.
B. Prioritize flexible, easily activated outdoor spaces to support pop-up programming and adaptable event format.
The Vision draft recommends designing for “night park” functionality and building flexible shaded multi-use pads with power/water hookups to support pop-up programming (fitness, markets, events).
Recommended approaches include:
1. Retrofit priority event/program parks with activation-ready infrastructure (power/water, durable shaded nodes, modular seating), as described in Sections 4.2-4.3.
2. Use “seasonal reconfiguration” tools (movable
Figure 4.47 - Community watch party at WSP (COH n.d.).
shade sails/umbrellas, portable fans, modular seating) to adjust to changing heat conditions and budgets.
5. CONTINUOUS IMPROVEMENT
A. Regularly publish simple performance summaries to communicate and reinforce the value of programs/events and the stewardship of public funds.
Residents already report high program quality and value; publishing clear performance summaries helps maintain trust while explaining the “why” behind pricing, schedule changes, capacity growth, and program lifecycle decisions.
Recommended approaches include:
1. Track and report per-class contribution margin (price, attendance, instructor cost, room hours) and publish a quarterly scorecard that guides decisions.
2. Use baseline performance targets from the benchmarking work (e.g., maintaining ≥93% “Excellent/Good” for programs/events and ≥74% satisfaction on value) as simple “headline” measures for ongoing monitoring.
3. Track and report on positive changes observed in the City’s bi-annual resident satisfaction survey.
B. Continue to leverage data-informed decisionmaking to refine the program mix, measuring success beyond enrollment.
Continuous improvement should incorporate not only fill rates and revenue, but also:
1. Equitable access - who participates, where, and at what cost;
2. Geographic distribution - rotation of events and replication of core offerings; and,
3. Activation outcomes - whether programs/events are strengthening daily use and “third place” value).
PART FOUR
Regionally, the RTC’s Regional Bicycle & Pedestrian Plan (RBPP) reinforces the same barriers: “Safety concerns” and “Weather (too hot, not enough shade)” are among the most frequently cited obstacles to walking/biking. The OSTP community survey shows parallel concerns for open space and trails—not knowing what’s offered/where to go (39.7%), safety concerns (35.4%), and lack of amenities such as restrooms, shade structures, and signage (28%) — all of which directly influence whether people are willing to walk or bike to parks.
WHAT REMAINS VALID FROM THE 2019 P&R MASTER PLAN
The 2019 master plan emphasized connectivity as a high priority, including a directive to “concentrate on connectivity and expansion of unpaved trails and bike paths” and maintain the 10-minute walk standard for park access. It also identified “recreational connectivity” as a multi modal network (trails + sidewalks + bikeways + transit) that requires coordination among many stakeholders and noted that trail and pathway connectivity ranked #1 in future facility needs at that time. Those findings align with today’s needs assessment and should be carried forward—updated with heat resilient design and clearer implementation responsibilities.
B. KEY CONNECTIVITY CHALLENGES
1. GAPS AND BARRIERS ARE OFTEN ABOUT CROSSINGS, NOT DISTANCE.
As Henderson’s trail systems continue to grow, the key work becomes addressing barriers such as roadways and railroads that intersect with this network, requiring a toolkit of solutions that include crosswalks, pedestrian underpasses, and bridges. These challenges remain highly relevant for walkability to parks, particularly where parks are close “as the crow flies” but uncomfortable or unsafe to reach on foot.
The needs assessment conducted as part of this study identified site-specific examples of these same issues, for example:
1. Discovery Park: multiple crosswalks leading into the park are missing, reducing pedestrian accessibility.
2. Dundee Jones Park: crosswalks near the entrance are missing and adjacent roadways have high speeds/traffic volumes.
3. Paseo Verde Trailhead: limited bicycle amenities and missing crosswalks/mid block crossings affect safe internal and external movement
2. HEAT IS A CONNECTIVITY PROBLEM (NOT JUST A COMFORT ISSUE).
If extreme heat is the top barrier to participation, then the “walk shed” to parks effectively shrinks in summer unless routes provide shade, water, rest opportunities, and safe nighttime/early morning access. The needs assessment is explicit that shade, hydration, restrooms, lighting, and wayfinding are prerequisites for daily use of both parks and trails, not optional upgrades.
3. PEOPLE WON’T USE WHAT THEY CAN’T FIND OR CAN’T UNDERSTAND.
Survey results from the OSTP show that the top barrier to visiting open space and trails is lack of information/wayfinding (“I don’t know what is offered/where to go”). This finding was further reinforced by the needs assessment, which indicated that the lack of awareness of what P&R has to offer and/or where amenities/programs/facilities are located is a primary barrier to increased utilization of the existing parks and recreation system.
4. GOVERNANCE AND MAINTENANCE ARE PART OF THE USER EXPERIENCE.
The OSTP recommends streamlining responsibilities between departments and collaborating to increase annual funding contributions for maintenance. Workshops with P&R and other representatives from city government reinforced the complexity of shared responsibility between P&R longrange planning, DPW design/construction, HOAs maintaining landscape/lighting in some segments, and Code Enforcement enforcing agreements. This structure can work if clarified and operationalized as a consistent, publicly visible level of service.
C. RESILIENCY-FOCUSED STRATEGIES & RECOMMENDATIONS
1. BUILD A “PARK ACCESS NETWORK” FOCUSED ON WALKABILITY AND COMFORTABLE, ALL AGES CONNECTIVITY.
Intent: Treat walking/biking connections to parks as essential park infrastructure. Prioritize routes that connect neighborhoods to parks, trailheads, schools, and transit—especially where parks are nearby but hard to reach on foot.
Why this strategy is grounded: The 2019 plan defines recreational connectivity as an interconnected network of trails/paths, sidewalks, bikeways, and transit. The 2025 needs assessment calls for safer walk/bike connections and additional bicycle/ trailhead amenities and infrastructure as access enablers.
Actionable recommendations:
A. Adopt Trail Access Level of Service targets that complement existing standards - Maintain the 10-minute walk to a park goal (2019 and 2025 baseline) and pair with a trail access goal aligned with OSTP indicators (e.g., increase residents within a 10-minute walk to a trail/trailhead beyond the OSTP baseline of 76%).
B. Map and prioritize “Park Access Priority Corridors.” - Build a short list (e.g., top 15–25) of neighborhood-to-park corridors where upgrades would unlock the most walk/bike access, using:
+ Parks with documented crosswalk/connectivity issues (from your site evaluations)
+ Areas with trail access gaps identified in OSTP (e.g., East Henderson gaps and limited trailheads)
+ Grow th areas where connectivity must be planned early (West Henderson growth noted in OSTP)
C. Treat trail access points as “micro-trailheads”
- especially where trailheads don’t exist. The OSTP notes many residents access trails from the street network via neighborhood sidewalks, and these access points are important for connectivity. Formalize these with consistent signage, shade, and safety features (see Strategies 3–5).
Figure 4.48 - Cyclists enjoying a newly-constructed multi-purpose trail in Henderson (COH, n.d.).
PART FOUR
2. CLOSE GAPS AND REMOVE BARRIER CROSSINGS WITH A TARGETED “BARRIER BUSTER” PROGRAM.
Intent: Focus on the specific conditions that are barriers walking and biking to the city’s parks and recreational facilities. Commonly observed examples include high speed arterials, missing crossings, crosswalks that are difficult to see, railroad barriers, and discontinuous sidewalks/trails.
Why this strategy is grounded: The 2019 plan explicitly calls out barriers between trail networks and recommends crosswalks, underpasses, and bridges. OSTP’s Primary Trail principles emphasize using below grade crossings as much as possible at arterial streets.
Actionable recommendations:
A. Create a ranked list of “Barrier Buster” projects (10–20) and integrate them into the Master Plan CIP. - Typical project types include:
+ Signalized crossings or pedestrian hybrid beacons at park edges and trail crossings.
+ Median refuges/hardened crossings where full signals aren’t warranted.
+ Grade-separated trail crossings (bridges/ underpasses) where volumes/speeds make at grade crossings impractical.
+ Sidewalk gap closure that links neighborhoods directly to park entrances/trail access points.
B. Standardize entrance crosswalks - Standardize the “crosswalk in front of parks” expectation as a citywide policy, then operationalize it with DPW through a formal review checklist:
+ All parks: at least one safe, high visibility crossing aligned with primary entrances.
+ Community parks, regional parks, and trailheads: multiple crossings and/or controlled crossings where adjacent road speeds/volumes are high.
C. Leverage catalyst projects - Use planned catalyst projects to solve both regional and neighborhood connectivity. The OSTP Action Plan includes specific connectivity actions that are also neighborhood to park access improvements, such as identifying critical connections and safe crossings of Galleria Drive and Sunset Road for the Bird Viewing Preserve area and prioritizing “Regional Trail Connectivity” projects. The Parks Master Plan should explicitly “inherit” and reinforce these actions where they affect park access.
Figure 4.49 - Existing crosswalk at Stephanie Lynn Craig Park that is difficult to see due to the darkening of the concrete (2025).
3. MAKE WALKING/BIKING TO PARKS VIABLE IN EXTREME HEAT WITH “HEAT READY CORRIDORS.”
Intent: Because heat is the top barrier to participation, Henderson must treat shade/hydration/rest nodes as core mobility infrastructure—especially on routes connecting neighborhoods to parks and trailheads.
Why this strategy is grounded: The needs assessment explicitly calls for adding shade and rest nodes at intervals and improving trailhead wayfinding. The RBPP also flags hot weather and lack of shade as major barriers.
Actionable recommendations:
A. Adopt Heat Ready Corridor Design Standards for park access routes and high use trails, including:
+ Shade strategy: combine drought smart tree canopy (where feasible) with built shade (including solar shade canopies where appropriate, consistent with system-wide opportunities for solar shade and lighting retrofits).
+ Rest nodes: shaded seating and “wayside” stops at predictable intervals (see Strategy 4).
+ Hydration: water access at major trailheads and at key parks; protect and maintain as a reliability standard (drinking water access is a system strength).
+ Materials: prioritize cooler paving approaches where feasible (your park assessments already document the benefit of higher SRI pavements in reducing heat absorption).
B. Pair shade with drought realities by prioritizing:
+ Passive water harvesting where possible (bioswales are identified as a recommended trailhead amenity in OSTP).
+ Native/adapted plant palettes and lowmaintenance materials (consistent with the needs assessment focus on durable, lowermaintenance approaches).
C. Strategically add lighting at conflict pointsFacilitate increased early morning/evening use with targeted lighting at potential conflict pointsThe OSTP identifies lighting “when appropriate for safety” at trailheads, access points, underpasses, crosswalks, and intersections, and recommends Dark Sky compliant, motion activated lighting where lighting is used.
Figure 4.50 - Pedestrian bridge overpass with trail lighting and regulatory markings and signage (COH, n.d.).
PART FOUR
4. ESTABLISH TRAIL AMENITY STANDARDS.
Intent: Provide predictable, heat resilient amenities so users can confidently walk/bike longer distances to parks and along trails.
Why this strategy is grounded: OSTP documents that lack of amenities (restrooms, shade, signage) is a major barrier. The needs assessment synthesis calls for rest nodes at intervals. The OSTP provides trailhead definitions and amenity guidance.
Actionable recommendations:
1. Adopt trailhead typologies - and use them consistently in capital projects:
Major Trailheads (OSTP “Large Trailhead”) - Best at regional corridors, major parks and/or open spaces, intersections of trails. Include: parking, ADA parking, information/wayfinding kiosk that includes emergency information, shade structure with tables, benches, water fountain with bottle filler and dog
bowl, trash receptacle, dog waste station, bike racks, bicycle repair station, security light with camera, restroom, map kiosk and (as appropriate) EV and e-bike charging infrastructure.
Minor Trailheads (Enhanced Access Points) - smaller nodes within parks or at neighborhood trail entries that provide basic trail access and support amenities such as shaded seating, directional signage with locator information via emergency location markers and QR codes, trash receptacle, dog waste station, bike rack, a repair station, and a water fountain with bottle filler and dog bowl (where feasible).
Waysides (rest stops) - Rest and refuge points located along longer, hotter trail corridors where the next full trailhead is too far for comfortable travel in summer. At a minimum, waysides should include a simple shaded seating area and an emergency location marker with QR code locator.
Figure 4.51 - Wayfinding kiosk with adjacent playground and restroom at the Paseo Verde Trailhead (2025).
5. Provide unified wayfinding, mapping, and “know before you go” tools.
Intent: Remove the #1 barrier identified in the OSTP trail survey, people not knowing where to go/what’s offeredby making the network legible in the field at existing parks and trailhead sites, as well as online.
Why this strategy is grounded: The 2019 plan recommends building a hierarchy of signage and developing map resources—both hard-copy and web-based/mobile—to support trail users. OSTP also recommends preparing updated trail maps and coordinating with web apps to create a digital map integrated into the regional trail map. These recommendations are consistent with findings from the current needs assessment.
Actionable recommendations:
1. Implement a citywide trail/park wayfinding hierarchy - that ensures consistent branding and consistent placement, including:
+ Trailhead kiosks and signage at major trailheads and key park entries.
+ Directional blades/markers at intersections and park-trail interfaces.
+ Mile markers / emergency locator markers (and expand to include “location IDs” on benches/ shelters as your workshop notes suggest).
2. Publish a “built vs. proposed” trails and bikeways map and keep it current. - This directly addresses your workshop note and improves transparency for residents and developers. Ensure the map clearly shows:
+ Existing paved trails vs. soft trails.
+ On street bikeways (where relevant to park access).
+ Location of trailheads and access points.
+ Water, restrooms, shade nodes, and repair stations.
3. Deploy QR enabled wayfinding at trailheads and waysides - that includes a combination of:
+ Geo-located “you are here” links.
+ Multi-lingual support (e.g., integration with translation tools).
+ Links to rules, closures, heat safety guidance, and nearest water/restrooms.
Figure 4.52 - Directional trail signage along the Bearpaw Poppy Trail in Anthem Hills Park (2025).
PART FOUR
6. FORMALIZE GOVERNANCE, MAINTENANCE, AND FUNDING TO MATCH THE PUBLIC’S EXPECTATIONS.
Intent: People will only walk/bike to parks if routes and amenities are reliable. Reliability depends on clear responsibility and stable maintenance funding.
Why this strategy is grounded: OSTP recommends streamlining responsibilities between departments and increasing annual contributions for maintenance. The 2019 plan also recommends continuing regular inspection and monitoring of trails and pathways, and the current needs assessment has identified the need for additional, dedicated funding for the long-term maintenance and operation of the city’s parks and recreation system (including trails and trailheads).
Actionable recommendations:
1. Establish a formal Connectivity Working Group - a standing interdepartmental team focused on addressing park walkability and connectivity with:
+ Henderson Parks and Recreation as long-range planning and “user experience” lead.
+ DPW as design/construction lead for on-road facilities and shared corridors.
3. Expand “Trail Watch / Stewardship” initiativesas a safety and maintenance multiplier. The OSTP calls for expanding a trail watch program to include volunteer stewards. This can also support education, reporting, and early detection of maintenance issues.
Figure 4.53 - Connector pathway from the Sienna Heights Trailhead to a local commercial area with shops and dining (2025).
7. CONTINUE LEVERAGING DEVELOPMENT AND REDEVELOPMENT TO COMPLETE LOCAL CONNECTIONS.
Intent: Many neighborhood parks are reached via local streets, sidewalks, and short connectors. If new development creates internal trails/paseos but does not connect them outward to the larger, existing trail network, the City inherits gaps that are expensive to retrofit later.
Why this strategy is grounded: OSTP explains that the Development Code’s open space regulations are intended to ensure every resident can access usable open space within a 10 minute walk, and that neighborhood paseos can create internal subdivision connections. The RBPP recommends requiring pedestrian connectivity and connectivity standards for new development. Findings from the current needs assessment indicate the need to update P&R’s existing design standards to better regulate public parks, facilities, and trails built as part of private developments.
Actionable recommendations:
1. Make external connectivity an explicit requirement for large developments - require that internal trail/paseo systems connect to the City’s planned trail/bikeway network at designated connection points and utilize a “connectivity index” approach consistent with RBPP recommendations.
2. Establish minimum standards for “public-facing” elements along private trail/path segments - that function as citywide links (even if City doesn’t maintain them), including:
+ Wayfinding signage standards.
+ Emergency location marker standards.
+ Minimum shade node spacing at key access points.
+ Durable, UV-resistant sign materials.
3. Lock in long-term maintenance expectationsfor private segments that serve public connectivity:
+ Clarify responsibility for landscape and lighting.
+ Ensure repair/replace triggers are enforceable and funded.
+ Coordinate with Code Enforcement on inspection/verification procedures.
Figure 4.54 - Trail underpass tunnel between Vivaldi Park and Sonata Park (2025).
PART FOUR
8. PRIORITIZE SAFETY, PERCEIVED SAFETY, AND CONFLICT MANAGEMENT AT ACCESS POINTS AND ALONG TRAILS.
Intent: Safety concerns and perceptions directly suppress walking/biking—especially for families, youth, and older adults.
Why this strategy is grounded: Safety concerns are among top barriers in the RBPP and OSTP, and the OSTP includes recommended lighting at key conflict locations. The park and facilities analysis completed for the current master planning process identified multiple points along the trail network where lack of visibility/lighting, constrained/isolated locations, and incompatible adjacencies would likely reduce perceptions of safety for many casual trail users.
Actionable recommendations:
1. Focus safety upgrades where people decide whether to enter - such as trailheads, access points, crossings, underpasses.
+ Use CPTED-informed siting of lighting, sightlines, and signage.
+ Add cameras where appropriate (OSTP includes “security light with camera” at large trailheads).
D. IMPLEMENTATION PRIORITIES & PERFORMANCE MEASURES
NEAR-TERM PRIORITIES (1–3 YEARS):
1. Establish the interdepartmental Trails & Bikeways Working Group and publish a first annual work program (Strategy 6).
2. Deliver the unified wayfinding framework + updated map (Strategy 5), including “built vs. proposed.”
3. Identify and advance design for the top “Barrier Buster” crossings serving parks with documented missing crosswalks (Strategy 2).
4. Pilot Heat Ready Corridor upgrades on 2–3 high-use connections (shade + seating + hydration + wayfinding) (Strategy 3), aligned with the master plan’s “fix it first” comfort emphasis.
MEDIUM-TERM PRIORITIES (4–7 YEARS):
1. Expand trailhead/wayside typologies along major corridors and at key parks (Strategy 4).
2. Implement a private development connectivity requirement set (Strategy 7) and apply it in West Henderson growth areas.
3. Coordinate on OSTP catalyst projects that materially improve neighborhood-to-park access (Strategy 2), such as Bird Viewing Preserve area connections and safe crossings.
SUGGESTED KPI’S:
Track annually; publish as public dashboard:
1. % residents within 10-minute walk to a park (baseline ~85%)
2. % residents/households within 10 minute walk to trail/trailhead/access point (baseline ~76%; OSTP target 80%)
3. Miles of City-owned/maintained trails (OSTP baseline 170 miles; target +70 miles)
4. Crossing completeness at parks: % of parks with marked/controlled crossings at primary entrances (use your park evaluation dataset as baseline)
5. Heat-ready amenities: number of shade/ rest/hydration nodes delivered on Priority Corridors (tie to barrier that “it’s too hot”)
6. Wayfinding coverage: % of trailheads/access points with updated signage + QR mapping (aligns with OSTP “create a trail map” action)
CONCLUSION:
Connectivity must be comfortable, legible, and safe in Henderson’s extreme heat. The “next generation” of Henderson connectivity is less about adding trail mileage and more about:
+ Completing the missing links (especially safe crossings) between neighborhoods and the larger network,
+ Making routes usable in summer (shade, water, rest),
+ Delivering a consistent, branded user experience that facilitates safety and ease of use (wayfinding, trailheads, and maintenance reliability).
NOTE:
This map depicts the Master Bicycle and Trail Plan as adopted by the Henderson City Council on February 4th, 2014, illustrating the long-term vision for the development and enhancement of the City’s bikeway and trail network. For the most current bicycle and trail maps, which are regularly updated, please refer to the City’s online interactive Parks and Trails Webapp (https://www.cityofhenderson.com/government/ departments/geographic-information-systems/interactive-maps).
Figures 4.58 - City of Henderson Bicycle and Trail Master Plan Map, N.T.S. (COH, 2014).
MASTERBICYCLE&
MASTERBICYCLE& TRAILPLAN
Path-PavedSurface
Trail-SoftSurface
LastadoptiontoMBTPlanapprovedbyCityCouncil: February4,2014 Street
Community priorities for indoor recreation point clearly toward a new generation of “multigenerational indoor hubs”—facilities that blend active recreation, aquatics, social space, and flexible rooms that can evolve with programming needs. In the community workshop exercise focused on unmet indoor recreation needs, the highest priorities were eSports/ gaming space and indoor aquatics, followed by a set of amenities that combine fitness, “third place” social spaces, and community event capacity (e.g., café/snack bar, gymnasium, walking/running track, event hall, coffee shop, art studio, and strength training equipment).
Collectively, these results describe flexible facilities that support drop-in activity, scheduled programs, intergenerational interaction, and community gathering throughout the year—even during periods of extreme summer heat.
In parallel, the needs assessment found that unmet demand and “missed revenue” are heavily concentrated in aquatics and youth programs— reinforcing that indoor facility capacity is not only a quality-of-life priority, but also a core operational and financial consideration for sustaining service levels over time.
C. INDOOR RECREATION VISION STATEMENT
“Henderson’s future indoor recreation centers and aquatic facilities will form a connected system of flexible, resilient, multi-generational “indoor hubs” that provide equitable access to year-round recreation, wellness, learning, and intergenerational community gathering—while also serving as critical community-support facilities during extreme heat events and other emergencies.”
This vision aligns with the broader facilities resilience direction that indoor recreation facilities should function as essential public infrastructure and be planned and designed to remain safe, usable, and operational under both peak summer heat conditions and emergency scenarios.
Figure 4.59 - Heritage Park Aquatic Complex (2025).
D. CORE STRATEGIES
1. MODERNIZE EXISTING FACILITIES FOR RESILIENCE, RELEVANCE, AND ACCESSIBILITY
Henderson’s existing recreation centers and aquatics facilities represent major community investments, but many were designed for the needs, codes, and technology standards of earlier decades. The facilities evaluation and resiliency assessment findings reinforce that modernization must focus on both (1) building performance in extreme heat and (2) facility adaptability over time.
Long-range modernization strategy for existing indoor facilities should emphasize the following outcomes:
A. Remove and reduce accessibility barriers through prioritized ADA upgrades, with special attention to older facilities where barriers may be widespread and costly to retroactively address. Facility assessment findings reinforce that even when general access is strong, certain interior elements (e.g., ramps and restrooms) may still require upgrades to meet current standards. Ensure equitable access to all key/ destination amenities.
B. Address deferred maintenance and aging systems through proactive lifecycle reinvestment— particularly HVAC and electrical distribution—so buildings can maintain safe interior conditions during extreme heat and high-demand periods. The facility assessment recommendations emphasize continual maintenance and timely replacement of heating, cooling, and power distribution systems to avoid failures and service disruptions during peak or emergency conditions.
C. Increase operational resilience through redundant and diversified communications and upgraded building security systems. The facility resiliency recommendations call for alternative emergency communication methods that do not rely solely on traditional infrastructure (e.g., satellite phones or dedicated emergency cellular devices).
D. Reduce long-term operating costs while increasing resiliency by expanding renewable energy use and on-site energy strategies. The resiliency assessment recommends expanding on-site solar power generation and incorporating battery energy storage where feasible, improving energy independence and the ability to maintain critical operations during outages. This direction is reinforced by the finding that solar deployment is currently limited across evaluated facilities, representing a major opportunity for system-wide improvement.
E. Upgrade facilities to support contemporary programming and events, including improvements that increase flexibility, improve support spaces, and enable multi-use conversions (e.g., electrical and data capacity, acoustics, storage, and modern access control). This modernization focus supports the broader “future-ready facility” concept outlined in the Vision chapter, which emphasizes multipurpose spaces, flexible infrastructure, and routine space-use evaluations to ensure facilities remain relevant as needs evolve.
Importantly, modernization should be approached as a tiered system program—not a series of isolated projects. The City should establish “standard packages” for indoor facilities (e.g., accessibility upgrades, HVAC modernization, electrical and technology upgrades, energy resilience improvements, safety and security improvements), allowing reinvestment work to be planned, budgeted, and delivered consistently across multiple sites.
PART FOUR
2. BUILD NEW INDOOR RECREATION AND AQUATICS FACILITIES WHERE THE CITY IS GROWING
Modernization alone cannot meet Henderson’s longrange indoor recreation needs in all parts of the city. The needs assessment confirmed that additional indoor recreation centers and indoor aquatics expansion are high-priority needs—particularly as the city grows and as demand concentrates during heat-avoidance periods.
A. To close geographic gaps and keep pace with growth, the long-range strategy should prioritize the delivery of new indoor facilities in areas that currently lack convenient, equitable access, most notably southern and western parts of Henderson.
B. New indoor facilities should be planned as multi-generational hubs (rather than single-purpose buildings), ensuring they can accommodate both current demand and future changes in recreation trends.
3. ADVANCE A “YEAR-ROUND AQUATICS” MODEL THAT PRIORITIZES INDOOR CAPACITY
Aquatics is one of Henderson’s most in-demand service areas and one of the areas where unmet demand is most pronounced (as evidenced by program waitlists and missed revenue). The longrange aquatics vision recognizes that Henderson’s climate increasingly compresses outdoor comfort windows, while also extending and intensifying summer heat conditions.
In support of this vision, the City’s future aquatics strategy should prioritize:
A. Year-round indoor aquatics access as the system’s primary growth model. Investment in future (new) aquatics facilities should prioritize indoor aquatics facilities over outdoor facilities where feasible.
B. Flexible, multi-purpose facilities that support both competitive/athletic and community wellness/ leisure needs, including learn-to-swim, water fitness, therapy/aquatic rehab, and family leisure.
C. Improved building systems and ventilation performance in older indoor aquatics environments to support healthy air quality, code compliance, and long-term building durability.
D. Flexible programming and scheduling that expands aquatics capacity during peak demand periods (summer, evenings, weekends) and reduces the operational bottleneck created by limited indoor water space.
This strategy should be paired with an honest lifecycle assessment of existing outdoor pools (and the growing operational burden of maintaining safe, comfortable water and deck conditions during extreme heat), while maintaining equitable access to summer aquatic relief in the near and mid-term.
Figure 4.60 - Henderson Multigenerational Center Indoor Competition Pool
4. DESIGN INDOOR FACILITIES AS COMMUNITY RESILIENCE HUBS
The Vision chapter establishes a clear direction: recreation centers increasingly function as essential community infrastructure and can serve as emergency shelters or cooling stations—provided they are designed with the right passive strategies, mechanical capacity, and operational flexibility. Henderson’s long-range indoor facility vision builds on this premise and clarifies the intended role of recreation centers in the City’s broader emergency response framework.
Currently, all existing indoor centers in Henderson are designated as emergency shelters, and every Parks and Recreation indoor facility provides a temporary refuge for individuals seeking relief from heat or a place to rehydrate. As of 2026, the Downtown Senior Center stands out as the only Henderson Parks and Recreation facility officially serving as an emergency cooling center—a role it is expected to maintain in the future.
Looking ahead, there is a vision for the library system to assume the role of providing emergency cooling stations. This shift is warranted because libraries are structurally better equipped to handle such operations with less operational disruption, whereas recreation centers would face significant challenges, including the cancellation or relocation of all scheduled programs and events, potentially to public school sites if feasible.
Going forward, all future indoor recreation centers should be designed to function as emergency shelters (and to provide enhanced emergency cooling capability when activated), with infrastructure that supports safe, rapid conversion to emergency use.
As described in the facilities resilience recommendations, energy storage and reliable backup power enable facilities to maintain essential operations during outages and support their potential use as places of refuge during heat waves and other crises.
Key shelter-readiness and resilience design considerations include, at a minimum:
+ Backup power for priority “refuge zones” and critical building systems (e.g., limited HVAC, lighting, communications, refrigeration, life safety).
+ Redundant communications and emergency connectivity (diversified methods that do not rely solely on LAN/VoIP/internet).
+ Storage capacity for emergency equipment and supplies.
+ Flexible rooms that can serve as gender-specific, dorm-style shelter areas when needed.
+ Adequate restrooms and shower/locker capacity.
+ Outdoor staging areas for trailers, containers, and temporary support infrastructure.
+ Outdoor power tie-ins that are strategically located and properly sized for temporary trailers/ generators, etc. that may stage in the parking lot (or other designated areas on-site) during an emergency response event.
+ Clear protocols for maintaining public safety and managing impacts to normal recreation operations during activation.
+ Consistent Wayfinding that positions shelters within the framework of public parks, quickly guiding users to designated shelter areas.
Figure 4.61 - Heritage Park Senior Facility (2025).
PART FOUR
5. OPERATE SMARTER: TECHNOLOGY, DATA, & FLEXIBLE SPACE MANAGEMENT
Future indoor facilities must be designed not only for what they contain/offer, but for how they are operated—especially given the increasing costs of cooling, staffing, and maintaining high-use indoor spaces.
The long-range vision is to leverage technology and operational systems to improve reliability, safety, and cost control while enhancing the customer experience. This includes a commitment to:
+ Flexible, multipurpose building layouts and infrastructure that allow spaces to be adapted to changes in trends and community priorities without major reconstruction.
+ Routine space-use evaluations to ensure facilities respond to changing needs and to identify underutilized space or emerging demand trends.
+ Energy and building management systems that improve performance monitoring and reduce energy waste, aligned with resilience best practices (efficiency + distributed energy strategies).
+ Modernized safety and security systems, including upgraded cameras and monitoring, and modern digital access control systems.
E. CORE AMENITIES
While each site will respond to its unique service area and physical constraints, Henderson’s long-range indoor facility model should consistently provide a core set of amenities aligned with demonstrated community need and evolving recreation trends.
Based on the needs assessment and community workshop priorities, future indoor hubs should be planned to include, at a minimum, a balanced mix of:
+ High-demand active recreation spaces (e.g., multi-court gym capacity, indoor track/walking opportunities, fitness and training zones).
+ Teen and technology-forward recreation spaces and programs (notably eSports/gaming space and supporting tech infrastructure).
+ Aquatics components that expand year-round access, including indoor swimming capacity as a core feature of the indoor facility portfolio.
+ Flexible rooms/spaces that support classes, arts, and events, ensuring the facility can host both drop-in use and scheduled programs.
+ Social “third place” elements (such as café/ snack spaces and comfortable gathering areas) that encourage community connection and intergenerational interaction.
Aquatics facilities in particular should be planned as multi-generational, multi-purpose environments that can accommodate competitive needs while also supporting learn-to-swim pipelines, wellness programming, therapeutic use, and leisure play. This approach expands the facility’s community value, supports broader public health goals, and improves year-round utilization.
Figure 4.62 - Representatives from the Project Team conducting a facility evaluation at the Henderson Multigenerational Center (2025).
F. THE WHRC - THE NEXT-GENERATION INDOOR HUB
West Henderson represents the City’s most significant long-range opportunity to deliver a nextgeneration indoor recreation and aquatics complex. As identified in the WHRC case study (Vision Section 4.3), the 60+ acre future campus located southwest of the intersection of Via Centro and E Larson Ln. is envisioned as a regional destination in West Henderson that addresses gaps in recreation and community amenities, both indoor and outdoor.
At the core of the vision is a multi-generational recreation complex with key indoor components including a community recreation center, an indoor aquatics facility, and a large multi-use fieldhouse to support recreational athletic programming offered by P&R and daily community use.
The WHRC model reinforces several defining traits of Henderson’s future indoor facility approach:
+ Indoor recreation and aquatics planned together as a single, integrated hub.
+ Phased development that allows key outdoor athletic needs to be addressed early, followed by delivery of major indoor facilities as funding and timing align.
+ Climate-responsive, resilient design integrated from the start, including renewable energy strategies and technology integration to reduce operating costs and strengthen long-term reliability.
In addition, the WHRC sets a precedent for pairing major indoor buildings with supportive site infrastructure—such as shaded parking, utility-ready event spaces, and renewable energy systems— to create an indoor/outdoor campus that remains functional and comfortable across seasons.
The future multi-generational indoor recreation hub is envisioned to include the following core components (approximate facility sizes informed by prior concept plans and current needs/trends):
1. RECREATION CENTER (100,000-150,000
SF):
+ Main gym with at least (2) basketball courts and the ability to divide and reorganize the space for different sports, uses, events,
+ Auxiliary gym,
+ Elevated running/walking track
+ Indoor fitness area with both cardio and strength-training equipment/spaces,
+ Indoor playground,
+ Dedicated child-watch area with appropriate support spaces/infrastructure,
+ Multi-purpose rooms for programming,
+ “Third place” spaces that facilitate interaction and socialization, such as a café, coffee shop, and/or indoor/outdoor lobbies,
+ Esports space,
+ Teaching/demonstration kitchen,
+ Dedicated senior “wing” with access-controlled spaces/amenities,
+ Ar t room(s)/studio(s) with “maker space,”
+ Cultural arts facility with infrastructure to support the continued operation and growth of p&r’s robust cultural programs and events offerings, including elements such as a black box theater, dance room(s) with sprung floors, sound/music room(s),
+ Adjacent outdoor programming “rooms” and flexible event lawn/plaza,
+ Potential satellite library (partner-managed).
PART FIVE
1. DEDICATED VOTER-APPROVED PROPERTY TAX LEVY
A cornerstone of Henderson’s operating funding is the dedicated 12-cent ($0.12) property tax levy for parks and recreation, approved by voters in 1997. This dedicated levy functions as a stable backbone for the system’s O&M and is described as funding approximately 40% of ongoing maintenance and operations. The levy is scheduled to sunset in 2027 unless renewed, making continued voter authorization a central factor in sustaining current service levels.
This dedicated levy is also the clearest example of “system sustainability” funding: it supports the ongoing care of the City’s existing parks and facilities, helping protect maintenance standards and public expectations for quality and cleanliness.
Funds Generated Annually by the Existing $0.12 Tax Levy for P&R
2. CITY GENERAL FUND
A second major source of operational funding for P&R comes as appropriations from the City’s “general fund” during the annual budgeting process. For P&R, the General Fund functions as the primary backstop for ongoing departmental needs beyond dedicated revenues and earned income.
The General Fund role becomes especially important when operating pressures rise (e.g., salary/benefit escalation, utilities, contracted services) or when system growth brings new assets online faster than operating resources expand. If the dedicated levy were not renewed, the City would face a clear tradeoff: either increase General Fund support or reduce services and/or facilities to close the gap.
3. EARNED REVENUES (USER FEES, RENTALS, MEMBERSHIPS, AND RELATED CHARGES)
Henderson generates meaningful earned revenue from recreation services and facilities, including program registrations, admissions, rentals, and related charges. Key earned revenue drivers include:
+ Safekey / youth enrichment
+ Sports leagues
+ Membership and fitness passes
+ Facility rentals (including ballfields, event spaces, and pavilions), supported by demand for tournaments and private events
Recent performance indicates modest but steady growth in department revenues through FY24, with revenue tracking approximately 7–8% higher yearto-date in FY24 compared to FY23, driven primarily by participation in the program areas above and facility rentals
Figure 5.1 - Funds Generated Annually by the Existing $0.12 Tax Levy for P&R for FY2015 - FY2025 (estimated as of 5/25/25).
4. SPONSORSHIPS, NAMING RIGHTS, PHILANTHROPY AND PARTNERSHIPS
In addition to taxes and earned income, Henderson can expand fiscal resilience through sponsorships, naming rights, and other partnership-driven revenues—particularly tied to high-visibility assets (fields, aquatic features, signature amenities) and special events.
These tools are typically most effective when supported by clear policies (to ensure transparency, protect public trust, and align partnership opportunities with community values). While these sources may not replace core operating revenues, they can provide important supplemental funding and help reduce pressure on tax-supported resources.
C. RENEWAL OF THE EXISTING DEDICATED $0.12 TAX LEVY:
This exceptional quality of life enjoyed by Henderson residents can be attributed in substantial part to the city’s strategic investments in its parks and recreation system over the past three decades. These investments have been made possible largely by the dedicated $0.12 property tax specifically allocated to parks and recreation. Continued community support for this funding source is crucial to maintaining and enhancing these valued assets and programs.
1. EXISTING $0.12 PROPERTY TAX OVERRIDE CONTEXT AND CONSIDERATIONS
Since 2015, the dedicated $0.12 property tax has generated approximately $155 million for Henderson’s parks and recreation system. Projections for 2026 indicate that this funding source will provide approximately $20 to $21 million each year, which represents approximately 40% of P&R’s annual operating budget.
2. IMPLICATIONS OF NON-RENEWAL
The potential implications of not renewing the dedicated $0.12 property tax would be significant for Henderson’s parks and recreation services, affecting both recreation programming and park maintenance in dramatic ways that would be immediately noticeable to residents and visitors alike.
Recreation:
Should P&R face an approximate $20 million budget reduction solely impacting recreation services, the recreation division would be left with a budget of approximately $8 million annually. This drastic reduction would effectively necessitate the closure of all recreation centers, pools, senior centers, and associated facilities. Consequently, residents would lose access to vital recreational programming and services.
Additionally, P&R’s ability to generate revenue would be severely diminished, as opportunities for program enrollments, daily facility admissions, rentals, membership fees, and other service charges—such as catering and café operations—would no longer exist, thereby further exacerbating the funding deficit. For context, under the current system, P&R generates roughly $9 million annually through these types of charges.
Parks:
Similarly, if the same $20 million budget reduction were absorbed entirely by park services, the parks division would operate with an annual budget of approximately $9.5 million. This reduction translates to approximately $4,300 per acre in operating expenditures—only half of the national median spending benchmark within the parks and recreation industry.
With such limited resources, park maintenance standards would have to be substantially reduced, future system expansion would no longer be feasible, and discussions around potential park closures and/ or privatization would likely become necessary.
PART FIVE
3. POTENTIAL SCENARIOS & CONSEQUENCES OF NON-RENEWAL:
Given the unrealistic nature of distributing a budget reduction to one division over the other, a joint approach is warranted, albeit not without substantial risks or a perfect response to a +/-40% budget reduction.
Henderson has long provided an exceptionally high quality of life for generations of residents, driven significantly by its high-quality and highperforming parks and recreation system. However, maintaining this level of quality and service, along with accommodating future growth, will require increasing investments in both operational and capital funding.
The rapid population growth over the past four decades has led to the construction of hundreds of millions of dollars in parks, trails, and recreation facilities. Many of these amenities, constructed primarily from the 1990s through the mid-2000s, are now simultaneously approaching critical stages of lifecycle maintenance, resulting in escalating upkeep and renovation costs. Additionally, continued city growth — particularly in the Cadence and West Henderson areas — will further intensify the need to develop new parks, trails, and recreational facilities to serve an expanding community.
Without the renewal of the dedicated $0.12 property tax, even the most aggressive hybrid approach (Scenario D. in Figure 5.2) would leave Henderson with its smallest parks and recreation footprint in over two decades. This scenario would disproportionately affect senior programs, aquatics facilities, and free community events, lead to significant increases in deferred maintenance, require substantial fee increases, and would likely be met with considerable community resistance.
Notes & Assumptions
The figures below are illustrative planning ranges intended to show the magnitude of actions that would be required if the 12-cent property tax is not renewed. They are presented as annual, recurring impacts, and should be refined with the FY26/FY27 adopted line-item budget and staffing roster.
Some programs and services (such as special events) may be funded wholly or in part by special revenue, sponsorships, or the like rather than by levy support. In these cases, dollar amounts are not considered as impacting non-renewal savings unless the General Fund (or levy) truly subsidizes the net cost.
When a service is reduced, the city may lose some earned revenue concurrently with the reduction of expenses. Unless otherwise stated in this memo, the ranges included on the following pages are intended as net impacts. Fee increases may reduce participation or rental demand. Scenario C addresses this by presenting a moderate and aggressive scenario.
Scenario A. - Across the Board Cuts
Projected savings/revenue: ~$19-21 million.
This scenario takes a uniform reduction approach (hours, programming, and staffing) without giving much discretion among sites. This scenario may be the fastest to implement as a non-renewal response, but it spreads service reductions across the entire system.
The department’s projected annual operating cost was ~$51.5 million in 2024 and the FY26 budget is ~$57 million.
Cutting $20 million is structurally equivalent to cutting approximately 35% of the department’s operating capacity. Since the FY24 budget detail (the financial information used for this analysis) is oriented around operating revenues and expenses and not CIP-related matters, the shortfall is an operating gap issue if the levy is not renewed. Additionally, services and supplies are not large enough to cover the financial gap alone. Therefore, a ~$20 million annual loss cannot be absorbed through discretionary supplies, and this is why Scenario A presents a reduction in operating capacity across the board. Also, this scenario may be the most administratively feasible response to the non-renewal if replacement revenue is not identified.
Primary drivers for Scenario A:
+ Staffing and hours – city-wide hiring freeze within the department will be necessary along with reducing part-time hours, eliminating vacant positions (if applicable), and targeting staffing reductions.
+ Facility hours – recreation center hours will need to be reduced and aquatics seasons shortened.
+ Program and events – reduce or eliminate lowrecovery offerings and require full cost recovery for programs and events that remain.
+ Maintenance standards – major reduction to maintenance activities will be necessary such as mowing frequency, system inspections, restroom service frequency, trail sweeping, and moving toward reactive-only services (most likely).
+ Program and events – reduce or eliminate lowrecovery offerings and require full cost recovery for programs and events that remain.
Expected service outcomes for Scenario A include a system-wide reduction in customer service levels, program capacity, and park conditions, with an increase in deferred maintenance and longer response times for repairs and work-orders.
Scenario B. - Facility Consolidation
Projected savings/revenue: ~$8.5-12.5 million.
This scenario involves closing a subset of the most subsidy-intensive sites and services while concentrating the remaining demand into fewer facilities to preserve a core system.
Primary drivers for Scenario B:
+ Close two low cost recovery centers (such as Downtown Recreation Center, Downtown Senior Center, or Silver Springs Recreation Center. This action can net ~$2-3 million.
+ Consolidate senior services into one primary site and/or relocate select programs. This action can net ~$300,000-$800,000.
+ Consolidate aquatics operations by either closing one major aquatic facility or by reducing operating season/hours at multiple pools (Whitney Ranch, Heritage, and Multigenerational Center). This action can net ~$3-4.5 million.
+ Reduce supporting overhead tied to closed facilities (such as customer service, contracts, security, building systems, maintenance, etc.). This action can net ~$1.5-2.5 million.
+ Close Heritage social services/café. This action can net ~$1.6 million.
ACTION PLAN
Expected service outcomes for Scenario B include fewer geographic access points, increased crowing and waitlists at remaining facilities, loss of neighborhood-scale services, and potential equity concerns depending on which sites are selected for closure.
Scenario C. Fee-Heavy Strategy
Projected savings/revenue: ~$3-5 million (~$4-6 million aggressive upper range).
This scenario involves aggressively raising fees, rentals, memberships, and non-resident rates; offering premium pricing for prime-time, tournaments, and commercial uses; reducing discounts; and expanding cost recovery targets. For context, the department’s total fee-based revenue is too small relative to the levy’s non-renewal loss (~$8.3 million compared to ~$20 million). For example, even though the sports core program area achieves over 100% cost recovery, this area alone cannot cover the operating gap. Additionally, and with the department already correlating fees with cost recovery targets, increases can occur, but within policy constraints and political realities. Therefore, a fee-heavy approach is justified as a partial mitigation effort, consistent with the department’s adopted pricing/cost recovery framework. However, even substantial fee increases across-the-board cannot close the gap without major service reductions. This will also lead to increased affordability and/or equity trade-offs.
Scenario C assumes aggressive but policy-supported rate actions applied to the FY24 projected fee revenue base of ~$8.3 million. The department’s largest identifiable revenue buckets include facility rentals (~$1.7 million), sports (~$1.5 million), and youth enrichment (~$2.2 million). Using reasonable effective increases across major fee categories, with added event/tournament cost recovery, new revenue potential can be realized, but it must be recognized that demand response and affordability considerations will most likely constrain/limit upper end revenue.
Primary drivers for Scenario C:
+ Facility rentals (20% moderate net increase; 30% aggressive net increase).
+ Sports programs (10% moderate net increase; 20% aggressive net increase).
PART FIVE
+ Youth enrichment (10% moderate net increase; 20% aggressive net increase).
+ Admissions and memberships (50% moderate net increase; 100%+ aggressive net increase).
+ New premium fees such as prime-time pricing (+$1 million moderate net increase; +$2 million aggressive net increase).
Expected service outcomes for Scenario C include increased affordability concerns and potential participation declines, greater administrative burden for residency verification and pricing enforcement, and higher public scrutiny of fee policy decisions.
Scenario D. - Hybrid (B + C)
Projected savings/revenue: ~$12.5-18.5 million.
This scenario uses closures/consolidation to reduce the fixed cost base and implement fee increases to elevate cost recovery because neither mechanism is a sufficient solution alone (as mentioned in previous scenarios). This approach preserves higher cost recovery or higher demand centers (such as Valley View Recreation Center) while impacting lower cost recovery facilities (such as Downtown Senior Center and Downtown Recreation Center). Moreover, this hybrid approach may not fully address the ~$20 million gap, so additional cuts/reductions (see Scenario A) or identification of a replacement revenue source(s) may still be warranted. The projected savings/revenue range is calculated by the numbers presented in Scenarios B and C.
Expected service outcomes for Scenario D include concentrated geographic access with fewer buildings, higher prices for remaining services, reduced park maintenance standards, and a measurable reduction in overall level of service.
Secondary Consequences of Non-Renewal:
In addition, there would be multiple potential secondary consequences associated with nonrenewal:
+ The overall cost recovery percentage would improve on paper as there would be fewer subsidized programs; however, this would only be possible because many services would also disappear entirely.
+ Deferring necessary capital investments and extending replacement schedules beyond recommended asset lifecycles would result in deteriorating facility conditions, increased liability risks, and higher long-term rehabilitation costs. Once facilities and amenities degrade to the point of posing health and safety hazards, they would likely need to be completely removed without being replaced in-kind, resulting in permanent loss to the community.
+ As park /facility conditions deteriorate over time due to inadequate maintenance and reduced activity, the risk of vandalism and other undesirable behaviors is likely to increase. Parks perceived as unsafe, neglected, or poorly maintained could negatively impact adjacent property values, further diminishing the city’s revenue base.
+ Economic development and tourism would be negatively affected as there would be fewer tournaments and special events.
+ Health and public safety challenges would become a byproduct of increased youth idle time, increased police department interventions, and higher risks of drowning in private vs public pools.
+ Employee morale would drop citywide as parttime seasonal workers would be first to be cut and full-time specialists may be bumped into other departments and/or eliminated entirely.
+ Eliminating existing food assistance programs would likely lead to increased food insecurity among vulnerable populations, particularly seniors and homebound residents.
+ The capacity of Henderson’s parks and indoor recreation facilities to effectively support the city’s overall emergency response strategy would be significantly reduced.
+ The risk of heat-related illnesses and emergencies would likely increase due to reduced hours of operation for indoor facilities, limited availability of functioning water fountains, fewer shade structures, and the loss of shade trees resulting from insufficient irrigation and maintenance.
+ Challenges associated with unhoused individuals would likely increase as parks experience reduced activity levels and less frequent staff monitoring.
POTENTIAL SCENARIOS FOR NON-RENEWAL OF EXISTING $0.12 TAX LEVY FOR P&R
+ Significantly shorten recreation center and pool hours.
A. Across the Board Cuts
B. Facility Consolidation
+ Defer turf replacement, trail resurfacing, tree care, and other non-essential maintenance activities.
+ Close the three lowest-revenue centers.
+ Place two pools in “mothball” status.
+ Freeze all event subsidies.
C. Fee-Heavy Strategy
D. Hybrid (2+3)
+ Raise user fees by as much as 60% where cost recovery is low (<40%).
+ Introduce dynamic pricing for facility rentals.
+ Add non-resident surcharge
+ Close two centers and one pool and raise fees by 40% across the board.
+ Move Youth Enrichment programming offsite to reduce overhead.
+ Outsource concessions and some leagues.
$19 - $21 million potential saving
$8.5 - $12.5 million potential savings
+ Meets gap but reduces program capacity 40-50%.
+ Layoffs would lead to additional unemployment costs.
+ Increase in park deferred maintenance.
+ Reduces geographic service equity.
+ Most likely will receive significant community resistance.
+ Increase in facility deferred maintenance.
$3 - $5 million of new revenue
$12.5 - 18.5 million potential savings
5.2 - Potential scenarios for non-renewal of the existing $0.12 tax levy for P&R.
+ Does not fill gap.
+ Fee increases go against affordability and equity goals.
+ Comes close to balancing current (2026) deficit.
+ Requires policy changes, RFP processes, and workforce impacts.
+ Would significantly reduce indoor and aquatics capacity.
Figure
PART FIVE
4. EXISTING TAX
LEVY
RECOMMENDATIONS:
A. Ask Voters to Extend the Existing $0.12 Property Tax for Parks and Recreation.
If the City of Henderson intends to maintain its current high level of parks and recreation services, it is critical that the existing dedicated funding stream from the current $0.12 property tax be extended. According to the statistically valid public opinion survey conducted in the spring of 2025 as part of this master planning process, voter support for extending this measure is strong. Specifically, 67% of respondents indicated they would vote in favor of continuing the existing property tax rate, while only 1% expressed opposition.
These survey results are particularly favorable when compared to findings from the 2023 City of Henderson Community Survey, which assessed support for a separate public safety initiative. In that instance, only 48% of respondents were supportive (either very supportive at 22% or somewhat supportive at 26%) of an $8.75 per month property tax increase intended to enhance fire, ambulance, and emergency medical response services. Typically, ballot measures focused on parks and conservation initiatives garner significant public backing nationwide, though historically at somewhat lower levels than public safety measures.
To secure the extension of this dedicated tax, the City will need to hold a referendum prior to the existing measure’s expiration in 2027. Historical data from similar ballot initiatives across the country suggest that aligning this vote with larger, higher-turnout elections greatly improves the likelihood of success.
B. Communicate the “Value” of Parks and Recreation in Henderson.
Although the City of Henderson is legally prohibited from directly advocating on behalf of its own ballot measure, it is critical for both the City and the Parks and Recreation Department to actively engage with the community starting immediately. These efforts should clearly communicate the wide-ranging value and numerous benefits that residents gain from the city’s parks and recreation system.
It is essential that all Henderson voters understand how the parks and recreation system benefits them personally, regardless of their direct usage of parks, facilities, or recreation programs. To accomplish this, the City should emphasize the full scope of services provided by P&R, highlighting not only traditional recreation activities but also valuable programs such as preschool and before/after school care, meal assistance initiatives, and targeted services supporting vulnerable populations.
Additionally, the City should proactively educate residents on broader community benefits derived from its parks and recreation system, including enhanced public safety, improved public health outcomes, higher property values, increased walkability, and positive impacts on economic development. Whenever possible, this messaging should be supported by relevant local data to reinforce these claims.
This comprehensive educational outreach campaign should begin immediately and continue consistently up to the election. To effectively reach and inform all residents, a diverse range of communication channels—both digital and traditional—should be utilized.
C. Identify an NGO that can Advocate on Behalf of the Ballot Measure.
The City of Henderson should make every possible effort—within its legal capacity—to identify and support a qualified non-governmental organization (NGO), such as a foundation or political action committee (PAC), which can legally advocate on behalf of the ballot measure.
This entity would be responsible for – and legally capable of - raising funds necessary to implement and manage a targeted “vote yes” campaign in support of the measure. The campaign should strategically leverage existing community feedback and data gathered during the current parks and recreation master planning process, along with additional statistically valid public opinion polling conducted closer to the election date.
Additionally, should fundraising allow, this advocacy entity may consider hiring professional park planning and public relations consultants to enhance the effectiveness of the campaign. These partners would be instrumental in refining messaging, developing compelling graphic collateral, and conducting supplemental data and community feedback collection efforts.
Figure 5.3 - Pickleball players enjoying the newly constructed Montagna Park (2025).
PART FIVE
D. FUNDING CAPITAL PROJECTS
Capital projects—new parks, new facilities, major renovations, and system expansion—are funded through a different set of tools that, in contrast to operational funding mechanisms, are often projectbased, cyclical, or restricted to one-time construction costs. Henderson currently relies heavily on five (5) key funding mechanisms/sources for capital projects:
1. Southern Nevada Public Land Management Act (SNPLMA) grants
2. Residential Construction Tax (RCT)
3. Developer-delivered “turnkey” parks
4. Growth-related contributions and impact-feetype tools (including PFNA)
5. City-wide capital improvement Programs
1. SNPLMA GRANTS
A defining capital funding strength in Southern Nevada is the SNPLMA grant framework, particularly the Parks, Trails, and Natural Areas (PTNA) category. SNPLMA is identified as Henderson’s primary grant source used to build and upgrade parks and trails. As of 2025, Henderson has been awarded $235+ million across 30+ parks and trails projects through SNPLMA, demonstrating a long-term track record of leveraging regional grant funding to deliver major system investments.
2. RESIDENTIAL CONSTRUCTION TAX
Henderson leverages (RCT) revenue for park development and improvement. RCT is closely tied to housing production; as new home construction accelerates, RCT receipts rise and can help fund growth-related capital needs. However, RCT is also inherently cyclical: it fluctuates with development activity and is not a reliable long-term operating solution, particularly as growth slows or buildout progresses. RCT funds are also restricted to neighborhood parks (≤25 acres) and must be spent within the park district where it was collected.
3. DEVELOPER-DELIVERED “TURNKEY” PARKS
Over multiple decades, Henderson has partnered effectively with the development community to deliver new parks at low capital cost to taxpayers. Developer-delivered parks and infrastructure— often referred to as “turnkey” parks—represent a significant portion of Henderson’s system expansion, with more than $100 million in new parks delivered through such partnerships.
However, turnkey delivery also highlights a core fiscal challenge: while developers may deliver the initial capital asset, the City assumes responsibility for longterm operations and maintenance after transfer. As new parks and facilities come online, maintenance and operating demands rise proportionally—often without a commensurate increase in O&M funding automatically attached to the new asset.
4. GROWTH-RELATED CONTRIBUTIONS AND IMPACT-FEE-TYPE TOOLS (INCLUDING PFNA)
Growth management tools—such as West Henderson’s Public Facilities Needs Assessment (PFNA) contributions—can help ensure that new development pays a proportionate share of capital costs for parks and recreation infrastructure. These tools can be highly effective for capital delivery, but they are typically constrained in their use and generally cannot be relied upon to fund ongoing operations and maintenance.
5. CITY-WIDE CAPITAL IMPROVEMENT PROGRAMS
Henderson’s capital planning activity is substantial, with many projects planned or underway. The City’s capital pipeline includes approximately 125 projects totaling about $150 million, spanning improvements and expansions that will enhance resident service levels and system quality. This reinvestment also reinforces the importance of lifecycle planning: each new or renovated asset creates an ongoing cost footprint for staffing, utilities, preventive maintenance, and eventual replacement.
E. IMPLEMENTING A PARK IMPACT FEE (PIF) IN HENDERSON:
Henderson’s parks capital funding strategy is constrained by the use Nevada’s RCT alone: it is capped at $1,000 per dwelling (or 1% of permit valuation, whichever is less) and can be used only for neighborhood parks—defined in statute as ≤25 acres—within the park district where the money was collected. Funds must be spent on capital (not O&M) and are subject to a refund clock tied to occupancy. That design works for pocket parks and tot lots, but it struggles to finance multi field complexes, community parks, and other larger facilities.
Nevada’s impact fee law (NRS 278B) provides a complementary tool: a Park Impact Fee (PIF) tied to a Capital Improvements Plan (CIP) and service areas. Critically, state law allows a city to impose a PIF while continuing to collect RCT, so long as a credit is given to avoid double payment—meaning the PIF can extend Henderson’s funding capacity beyond the $1,000 RCT ceiling while still preserving RCT for small, close to home parks.
1. WHAT A HENDERSON PARK IMPACT FEE (PIF) WOULD ADD
Purpose.
A PIF would fund “park projects” (as defined in NRS 278B) identified in a citywide or area based Parks CIP—typically community parks, trailheads, or other capacity adding facilities that serve multiple neighborhoods. The fee is proportional to growth and organized by service area.
Credits ensure no double charge.
Under NRS 278B.240(3), if a developer pays RCT, dedicates park land, or constructs park improvements, they are entitled to a credit against the PIF for a park project. Practically, Henderson can (1) keep collecting RCT for small neighborhood parks, and (2) charge a PIF for larger projects, net of an RCT credit. This lets the City raise more than $1,000 per unit overall for parks while still honoring “growth pays for growth” and preventing double payment.
Spend down discipline. Impact fees must be used within 10 years of collection or refunded with interest—longer than the RCT timeline—providing more realistic delivery windows for large parks.
2. HOW A PIF AND RCT COULD WORK TOGETHER IN HENDERSON
Policy intent (simple split of responsibility):
+ RCT (keep): Small, walkable neighborhood parks (≤25 acres) and neighborhood scale improvements within each park district.
+ PIF (add): Community scale facilities (multi field parks, community park amenities, trailheads, district serving expansions) identified in a Parks CIP and programmed across broader service areas.
At permit/platting: one invoice, two lines, one credit.
1. Collect RCT per Henderson Development Code 19.17 at building permit. (HDC codifies state RCT; City’s code sections include collection, fund, districts, credits & bonding.)
2. Calculate the PIF due per the adopted Parks CIP and fee schedule.
3. Apply an automatic credit equal to the RCT paid (and any eligible land/improvement dedications) against the PIF for park projects (NRS 278B.240(3)). The developer pays only the net PIF after credit.
Result:
The City still receives the full RCT (restricted to small parks) plus a net PIF (for large parks). Total parks revenue per unit can now exceed the RCT cap while credits ensure fairness.
PART FIVE
Why this is beneficial (especially for larger parks):
+ Closes the funding gap. A PIF can be set (per CIP) at the additional amount needed for community scale facilities after accounting for RCT and other revenues, rather than being locked at $1,000/unit.
+ Right sizes service areas. The Parks CIP can define service areas that better match how residents use community parks, improving equity and delivery timing.
+ Reduces refund risk. PIFs have a 10 year spend requirement (vs. the RCT’s 3 years after 75% occupancy rule), improving the City’s ability to assemble funding for large projects without refund exposure.
+ Transparent, data driven fees. NRS 278B requires land use assumptions, a Capital Improvements Plan, and public hearings, grounding the fee in documented need and growth.
3. REGIONAL PIF BENCHMARKS
While Southern Nevada cities primarily rely on RCT and other sources for parks, several regional cities in the Southwest use parks impact fees. Several regional examples of current park impact fee ordinances are provided in Figure 5.3 on the opposing page.
These figures illustrate that parks specific impact fees above $1,000 per unit (the limit of RCT) are common where cities must fund land acquisition and larger-scale community amenities.
4. PIF ADOPTION PROCESS IN NEVADA
A. Create or designate a Capital Improvements Advisory Committee (CIAC) Before imposing an impact fee, Council must establish a CIAC (or designate the Planning Commission with added industry representation). Duties include reviewing land use assumptions, the Parks CIP, and reporting on progress every three years.
B. Prepare land use assumptions and a Parks Capital Improvements Plan (CIP). The CIP must, by service area, describe existing facilities and capacity, forecast demand from growth, identify eligible “park projects,” and establish the cost basis and level of service used to calculate the fee.
C. Hold required public hearings and act. NRS 278B requires a hearing on land use assumptions, then a hearing to adopt the CIP and impose the fee. If approved, Council adopts an ordinance and must place collected fees in dedicated, interest bearing accounts by category and service area.
MUNICIPALITY
REGIONAL PIF BENCHMARK COMMUNITIES
PARK IMPACT FEE (RECENT)
Phoenix, AZ
Glendale, AZ
$1,094 – $2,082 per EDU (by area)
$936 per single family unit
Chandler, AZ
$0 – $5,242 per single family unit (by park service area)
NOTES:
2025 Parks IIP “potential net fee per EDU” by impact fee area -
Ahwatukee area: $1,094
Northwest area: $1,409
Northeast area: $1,474
Southwest area: $2,082.
Citywide schedule; multifamily dwelling unit fee is $618 per unit.
NW service area: $0
NE service area: $129
SE service area: $5,242
Multi-family Units: $4,424
Shows how fees vary with land/ acquisition costs across different defined service areas.
Figure 5.4 - Regional PIF benchmark communities in Arizona.
Figure 5.5 - Ribbon cutting celebration for Montagna Park, delivered as a turnkey park project (2025).
PART FIVE
B. ACTION PLAN OBJECTIVES & SUPPORTING ACTIONS
1. Provide stable, long-term funding for operations and maintenance to meet both current requirements AND future increases as the system grows.
1.A Obtain consent from Henderson Council via an appropriate resolution to put the question to renew/increase the tax levy dedicated to P&R on the ballot of an upcoming election in the 2026 calendar year, with a preference for large-turnout elections (such as a general election or primary).
1.B Develop and adopt thoughtfully crafted ballot language for the referendum question.
1.C Submit ballot language and required forms/ documentation to the appropriate local Elections Department following specified protocol for the election date/type selected.
1.D IF the referendum to renew the existing $0.12 tax levy IS SUCCESSFUL, petition voters to raise the millage rate by up to $0.1430 per $100/AV to ensure sustainable funding for operations and maintenance of new capital projects needed to support the city’s growth and service levels, and the renovation and activation of the City’s existing, aging parks and facilities.
1.E IF the referendum to renew the existing $0.12 tax IS UNSUCCESSFUL, petition voters to raise the millage rate by up to $0.2630 per $100/AV to ensure enough ongoing funding for the operations and maintenance of the existing system previously supported by the 1997 dedicated tax levy, AND for new capital projects needed to uphold or improve the current level of service as the city continues to grow.
2. Raise public and stakeholder awareness of the comprehensive “value” of the Henderson Parks & Recreation Department and system.
2.A Formally adopt a new purpose statement for P&R that is reflective of its role within and impact to the community beyond traditional play and leisure - tie to overall community values and strategic goals.
2.B Develop and adopt a unique “brand identity” for P&R that is complementary but distinct from the City’s brand.
2.C Conduct an education and outreach campaign to raise awareness of the public of the successes of the existing tax levy adopted by voters in 1997 and to raise awareness of the comprehensive benefits that parks and recreation provide to the community. Use this campaign as an opportunity to communicate the outcomes of the current master planning process.
2.D To better reach Henderson’s large and growing senior population, consider reintroducing a limited (quarterly), hardcopy version of the “Henderson Happenings” program guide that can be made available to targeted audiences (such as seniors) or upon request.
2.E Install informational signage at prominent parks, facilities, and programs or events that have benefited from the dedicated parks and recreation tax levy adopted in 1997, enabling residents to recognize the positive outcomes of this funding source and the effective management by P&R. Priority should be given to highly visible locations with substantial pedestrian activity
PART FIVE
3. Leverage earned revenues to incrementally increase the overall cost recovery rate of Parks and Recreation from 17% in 2025 to align with the national median of 25%, while ensuring equitable access to all facilities and programs is maintained.
3.A Re-direct all revenues earned from fees, rentals, events, etc. to a non-reverting P&R account or P&R-managed reinvestment mechanism, so the system directly benefits from the demand it is managing.
3.B Establish and adopt a tiered program/event “portfolio pyramid” along with departmentwide cost recovery tiers (e.g., Essential Access, Community Benefit, Market-Responsive) and assign each major program/service line to a tier. Update target ranges annually using a consistent set of KPIs.
3.C Update program fees to reflect actual costs and community benefits, using a consistent framework for pricing decisions that considers affordability, equity, and benefit. Test nuanced pricing methods (tiered, peak/ off-peak, dynamic, non-resident differentials) to balance demand and maintain access.
3.D For facilities hosting tournaments and competitions, establish an operational model that aligns scheduling, staffing, and fee structures with the actual costs associated with wear-and-tear, facility conversions, and frequent use experienced by P&R, while ensuring the protection of the target (local) market share.
3.E Develop and adopt a formal sponsorship and naming policy with clear governance and accountability procedures to increase earned revenues, especially for large events, sports fields/facilities, and destination amenities. 3B
3.F Conduct a targeted audit of the City’s highestimpact shared-use agreements/MOUs (field access, trail maintenance, school sites, indoor facilities, event sites, etc.) to ensure costs and community benefits are equitable and reflective of current fiscal realities. 3B
3.G Increase the use of cooperative delivery models (nonprofits, local experts, shared delivery with schools/HOAs where appropriate) for specialized/niche programs.
4. Update the “Public Works and Parks and Recreation Department Standardized Design Guidelines” document to reflect changes in contemporary recreational trends and an increased focus on heat and drought resilience.
4.A Incorporate Resilient by Design criteria for parks and facilities, including detailed design guidelines for xeric areas and turf removal projects..
4.B Develop and adopt lifecycle-cost design standards for renovations and new “turnkey” parks, facilities, and trails to reduce long-term lifecycle costs while meeting Henderson’s contemporary expectations for resilience, activation, and quality.
4.C Consider revisiting/updating the established park typologies to better reflect the current diversity of park/facility types. Examples for inclusion would be trailheads (major, minor, and waysides), dog runs (small off-leash areas within parks), special-use facilities (standalone elements’/facilities with specialized and/or single/limited uses, such as a center, BMX track, event center, etc.), and natural/ conservation areas.
4.D Establish a minimum/baseline set of comfort (shade), safety (water access), and convenience features (lighting) by park typology that should be present at all parks to increase resilience, relevance, and safety.
4.E Define Henderson-specific “service areas,” based on geography or population, for primary community and neighborhood amenities (including sports courts, playgrounds, bocce courts, etc.) to guide the planning and programming of new parks and park improvements, thereby reducing redundant facilities.
4.F Develop and adopt uniform signage and wayfinding design standards that include a hierarchy of signage elements appropriate for each park/facility typology.
PART FIVE
5. Make strategic, incremental improvements to existing parks to increase activation, resilience, and safety.
5.A Continue implementing the turf removal and replacement projects necessary to satisfy State mandates and timelines. Where feasible, ensure that newly converted xeric areas add aesthetic, functional/ecological, and recreational value (e.g. not just flat planes of DG).
5.B Utilize the evaluation framework established in Section 4.3 to conduct site evaluations of parks not evaluated as part of this master planning process. Use the combined data to prioritize sites for future improvements.
5.C Utilize the evaluation framework established in Section 4.4 to conduct a building resiliency audit for the remaining indoor facilities not evaluated as part of this process to identify, prioritize, and budget for nearterm improvements to increase safety, programming capacity, accessibility, and comprehensive resiliency.
5.D Conduct an audit of each completed turf removal project site to determine if additional improvements should be made to increase the aesthetic beauty, functionality, and recreational value of all newly converted xeric areas. Establish an annual budget that supports making near-term improvements to sites where the xeric areas add little value to the park, and/or in parks with the greatest amount of turf removed.
5.E Develop park activation CIP (including budgets) for aging legacy parks that prioritize improvements that address health/safety issues, increase programming flexibility, provide shade/shelter, facilitate nighttime/ early-morning usage, increase access to drinking water, and increase activation/ usage.
ACTION PLAN
5. Make strategic, incremental improvements to existing parks to increase activation, resilience, and safety (cont’d.)
5.F Increase O&M staffing ratio from 1 FTE per 21.3 acres of maintained land to 1 FTE per 18 acres of land by adding a total of 16.5 additional FTEs. Cost assumes the addition of 16 additional work vehicles ($135,000/ea.)
5.G Make improvements to high-priority turfremoval project sites identified in Supporting Action 5.D to increase their visual beauty, functionality, and recreational value. Assume a budget of $5-$20/square foot of improved area, depending on size, for basic, self-performed improvements such as the addition of plant material, small-scale landforms, and boulders/cobbles.
5.H Make high-priority improvements to 3% of the existing park sites on an annual basis to increase their resiliency, relevance, and activation. Prioritize sites by the condition of aging infrastructure and those within communities that have experienced a significant change in population/ demographics. Planning-level budget of $312K/acre for improvements is reflective of 25% of new park construction cost ($1M-1.5M/acre in 2026).
5.I Install additional signage and wayfinding elements at strategic locations, including trailheads and neighborhood parks, to provide visitors with essential health and safety information as well as clear directions to nearby parks, trails, and community amenities or destinations. Integrate QR codes to direct users to online resources that are easy to update.
5.J Implement a “Natural Areas and NatureBased Experiences” delivery program across both new and existing parks to increase access to natural areas, experiences, and amenities at a variety of scales system-wide.
PART FIVE
6. Expand access to indoor recreation and aquatics facilities, programs, and events.
6.A Adopt year-round indoor aquatics access as the aquatic system’s primary growth model; to maximize operability and programmability, all future (new) aquatics facilities should be indoor aquatics facilities.
6.B Embrace a “demand-based” programming approach to increase access to youth and aquatics programs by adding capacity through extended hours, additional sessions and session-types (e.g. micro/mini-sessions) and additional offering locations.
6.C Commission a thorough feasibility study to inform the design, program, scale, and cost for a future indoor recreation and aquatics center at the future West Henderson Recreation Campus. Study should provide guidance on viable project delivery/ construction, financing, and operational/ staffing models that leverage partnerships, sponsorships/naming rights, and nontraditional delivery models.
6.D Expand programming opportunities at existing indoor recreation centers leveraging the findings from Supporting Action 5.C to make improvements that increase flexibility and capacity, adjusting operating hours (seasonally), and updating essential systems/ infrastructure. Prioritize initial interventions at the Multigenerational Center, which experiences the most significant demand/ pressure. 2R
6.E Make strategic investments in improving and updating 3% of the total square feet of existing indoor recreation and aquatics facilities on an annual basis.
6.F Construct a new multi-generational indoor recreation and aquatics center as part of the West Henderson Recreation Campus (see Section 4.3) to address the current scarcity of accessible indoor amenities in the rapidly growing area.
7. Increase program and event participation by eliminating equity and access barriers.
7.A Establish consistent scholarship/subsidy practices, so aŸordability is protected while pricing remains defensible and transparent. Standardize scholarship eligibility, award levels, and application processes and use clear, consistent messaging about resident discounts and scholarships to maintain public trust.
7.B Maintain innovation through introductory pilots of new programs/events, with clear, measurable success metrics and decision points. Prioritize youth, teen, and indoor programs. Leverage private contractors/ operators for highly specialized pilots before investing in staŸ training or purchasing equipment.
7.C Expand “after dark” and “early morning” programming blocks during peak heat months, prioritizing family nights, teen nights, sunrise classes, adult fitness, indoor drop-in leagues.
7.D Remove and reduce accessibility barriers at existing facilities through prioritized ADA upgrades, with special attention to older facilities where barriers may be widespread and costly to retroactively address; address concurrently with Supporting Actions 6.D and 6.E.
Figure 5.6 - Families participating in a swim skills program at the Multigenerational Center indoor pool (COH, n.d.).
PART FIVE
8. Continue to pursue P&R’s longstanding aspirational goal of providing 5.5 acres of parkland per 1,000 population by building new parks in growing and underserved areas.
8.A Continue coordination between Community Development and P&R during the development agreement process to maintain clear review dates, shared “success criteria,” and documented approval steps so that concessions affecting park size, location, or program do not inadvertently create long-term maintenance liabilities or reduce neighborhood access outcomes.
8.B Adopt and incorporate strategies that plan for anticipated lifecycle costs and O&M proformas into development agreement negotiations and park acceptance decisions for all future turnkey parks.
8.C Commission a park impact fee (PIF) study to establish the regulatory framework for an equitable and “development friendly” PIF ordinance that can be used as an alternative to traditional RCT to specifically fund larger community scale projects.
8.D Adopt a PIF ordinance that can be used selectively as an alternative to RCT funds to fund larger scale projects that offset the increased demand brought by new development.
8.E Acquire and develop, either directly or through development agreements, a minimum of 230 acres of new parks by 2030 to maintain the current Acreage LOS of 3.79 acres/1,000 pop. Prioritize new park development where the city is experiencing active growth, such as the Cadence and West Henderson areas. Assumes $1M-$1.5M/acre capital (2026), $8,800/acre O&M per year, and target O&M FTE ratio of 1 FTE per 18 acres.
8.G Acquire and develop, either directly or through development agreements, an additional 1,563 acres of new parkland, (requiring approx. 87 additional FTEs), by 2040 to meet P&R’s goal of providing an Acreage LOS of 5.5 acres/1,000 pop. Assumes $1M-$1.5M/acre (2026).
9. Increase efficiency and reduce long-term costs by better leveraging available technologies and systems to streamline maintenance and operations processes.
9.A Institutionalize a quarterly review of workorder trends to shift resources from reactive repairs toward preventative maintenance and targeted hot-spot interventions.
9.B Establish a formal Park Asset Management Program (PAMP) that inventories all major park assets (e.g., irrigation systems, playgrounds, sports courts/fields, shade structures, lighting, restrooms, splash pads, trail furnishings, trees) and assigns each asset a useful life, condition score, replacement cost, and replacement year.
9.C Use the data from the PAMP to develop parkspecific maintenance management plans that reflect P&R’s defined maintenance modes and service levels (Modes I–V) and link those plans directly to work-order software and mobile tools for use by staff in real-time in the field.
Figure 5.7 - Henderson residents participating in a volunteer clean up day at a local park (COH, n.d.).
PART FIVE
10. Increase the utilization and activation of parks and facilities by improving communitywide walkability and connectivity.
10.A Develop and adopt mandatory private development connectivity requirements to ensure that new developments facilitate both internal (within the development) and external (from the development to the existing trail/sidewalk network) connectivity and walkability.
10.B Improve park accessibility and pedestrian safety by ensuring that there are highly visible crosswalks at all appropriate park entrances. Consider utilizing reflective, thermoplastic markings, crosswalk “murals,” or other approved system that increases the visual contrast of the delineated crossing from the pavement surface.
10.C Update bikeways and trails map to differentiate existing vs. proposed trails and paths. Make the updated map available at all trailheads (kiosks) as well as online via a QR code or dedicated trails app. Update the online maps regularly to reflect the addition of new parks, community destinations, newly completed trail/path connections, and trail/path closures.
10.D Bridge walkability gaps between the existing trail network and densely populated residential areas by developing a system of “local connectors” that offer residents safe, convenient, and efficient access to the broader trail network without the need for car travel. Examples of potential local connector interventions include the use of on-road bike lanes, widened sidewalks, improved utility easements, and sharrows. Prioritize improvement efforts in established areas of the community where residential neighborhoods were originally constructed with more limited pedestrian infrastructure. Look for opportunities to leverage larger roadway and/or infrastructure projects to economize implementation.
10. Increase the utilization and activation of parks and facilities by improving communitywide walkability and connectivity (cont’d.).
10.E Pilot Heat Ready Corridor upgrades on 2–3 existing, high-use trail connections (shade + seating + hydration + wayfinding), aligned with the master plan’s “fix it first” comfort emphasis.
10.F Continue to develop new trail connections in growing portions of the city (West Henderson and Cadence) through the development agreement process.
Figure 5.8 - Family enjoying the paved paths at Anthem Hills Park in Henderson (COH, n.d.).
PART FIVE
C. WHY CAPITAL & OPERATING FUNDING MUST BE ALIGNED
1. CHALLENGES WITH FUNDING O&M
Henderson’s overall funding picture demonstrates a common reality for high-performing park systems: capital delivery can be accelerated through grants, development partnerships, and growth-related tools (such as RCT/PIF fees and bonds), but long-term sustainability depends on stable operating revenues.
As operating expenditures rise—driven by salary/ benefit increases, utility costs, and expanded maintenance needs—system expansion must be paired with strategies that strengthen recurring funding sources (dedicated tax support and General Fund stability) while responsibly improving earned revenue performance (fees, rentals, memberships, and cost recovery strategies).
Sustaining quality standards and resident expectations requires a deliberate connection between what is built and what can be operated, maintained, and renewed over the full lifecycle of the system.
2. EXISTING $0.12 LEVY IS NECESSARY BUT NOT SUFFICIENT ALONE.
It is essential to recognize that the existing $0.12 dedicated tax levy was set in 1997, when Henderson’s parks and recreation system was roughly 80% of its current size (as of 2026). The levy has enabled the City to significantly expand the parks system—and, in turn, enhance the community’s quality of life. However, the cumulative operation and maintenance (O&M) costs associated with this rapid growth, compounded by higher staffing and construction costs and nearly three decades of inflation, now exceed the level of funding the existing levy can generate, even if it is renewed.
The existing tax levy also does not cover costs associated with developing new programs, maintaining or constructing new and future facilities, or incurring new debt. In addition, the levy does not provide funding for the additional P&R staff (FTEs) that will be necessary to adequately operate and maintain a parks system that is both aging and expanding.
3. SECOND (NEW) VOTER-APPROVED LEVY
Accordingly, even if voters choose to renew the existing dedicated tax levy at its current rate, it is recommended that City Council seek voter approval of a new dedicated tax levy (override) of up to $0.1430 per $100/AV to provide sufficient, sustainable longterm funding for the maintenance, operation, and activation of aging infrastructure as well as future parks, trails, and facilities. This additional $33 million in annual funding will be necessary to maintain the City’s current level of service as Henderson continues to increase in both size and age.
If approved, this new tax levy would serve as a sustainable long-term mechanism that will allow the Department to:
A. Address Current (2025) O&M Funding Deficit.
Revenues generated by the existing dedicated $0.12 tax levy are used exclusively to fund the ongoing operations and maintenance of the City’s existing parks and recreation facilities and programs at current (2026) service levels. Current Parks and Recreation (P&R) staffing supports a maintenance ratio of approximately 1 full-time equivalent (FTE) per 21.3 acres of maintained land. This acreage includes parks and trails, as well as other maintained assets such as fire/police stations, streetscapes, and utility sites. This ratio falls below commonly cited benchmarks and best practices established by the National Recreation and Park Association (NRPA) of approximately 1 FTE per 13.5 to 17.1 acres, as well as the International City/County Management Association (ICMA) general standard of 1 FTE per 18 to 20 acres.
It is recommended that P&R establish a target ratio of 1 FTE per 18 acres of maintained land. As of January 1, 2026, P&R maintains approximately 1,892 acres with a total of 89 FTEs dedicated to parks maintenance. Achieving the recommended ratio will require 16 additional maintenance and operations FTEs. At an average annual cost of $102,667 per FTE (based on City-provided data), meeting this staffing target will require an additional $1,654,079 in annual funding.
In addition, P&R currently provides approximately one administrative (Admin.) FTE per 21.6 general FTEs, which indicates a need for 0.75 additional Admin. FTE. At an average annual cost of $115,689, this represents an additional $86,290 per year.
Impact: Addressing the current O&M deficit will require a total of 16.5 additional FTEs, at an estimated annual cost of $1,740,370 (approximately $0.0075 per $100 of assessed valuation).
Up-Front Costs: In addition, it is assumed that each new FTE will require a new work truck to perform assigned duties. At an estimated $135,000 per vehicle, providing 16 additional work vehicles would represent a one-time up-front cost of approximately $2.175 million. This cost would likely need to be funded through a bond or other mechanism that supports immediate, up-front capital financing.
The Action Plan in Section 5.3 envisions renovating or updating approximately 3% of the City’s existing indoor recreation and aquatics facilities each year. As of January 1, 2026, P&R maintains approximately 271,277 gross square feet of indoor facilities. At a 3% annual reinvestment rate, this equates to upgrades totaling approximately 8,138 square feet per year. Using an assumed cost of $150 per square foot (approximately 25% of the cost of new construction), the estimated annual cost is $1,220,747.
P&R also maintains approximately 260,090 gross square feet of aquatic facilities (including pool decks and supporting spaces). A 3% annual reinvestment rate results in upgrades totaling approximately 7,803 square feet per year. At $150 per square foot, the estimated annual cost is $1,170,405.
Impact: In total, renovating or updating 3% of existing indoor recreation and aquatics facilities annually will require approximately $2,391,152 per year (approximately $0.0104 per $100 of assessed valuation).
ACTION PLAN
3. Improve & Update Existing, Aging Parks.
A key component of the Master Plan Vision is reinvesting in the City’s existing, aging park sites to improve relevance, resilience, and activation. Consistent with established best practices, the Action Plan recommends renovating or updating approximately 3% of the developed park system each year. As of January 2026, P&R maintains approximately 1,360 acres of developed parkland; at a 3% annual reinvestment rate, this equates to approximately 40.8 acres renovated each year.
As of January 2026, City-provided data indicate that new park construction costs typically range from $1.0 million to $1.5 million per acre. Renovations to existing parks are generally less costly than new construction. Accordingly, the Action Plan assumes an average renovation cost of $312,500 per acre (approximately 25% of the average cost of new construction).
Impact: Renovating approximately 40.8 acres of existing parkland annually at $312,500 per acre results in an estimated annual cost of $12,752,578 (approximately $0.0552 per $100 of assessed valuation).
4. Sustainably Operate & Maintain Future (New) Parks.
To maintain the current acreage level of service, the City must add approximately 230 acres of new parkland by 2030 to keep pace with projected population growth (57.5 acres per year). The capital costs of developing these new parks are anticipated to be funded through a combination of proven, existing funding mechanisms such as bonds, revenue-based sources (PFNA and RCT), grants (SNPLMA), and/or a future PIF.
As has been previously noted, none of these mechanisms fund the long-term O&M costs associated with new capital. Currently, it costs the City approximately $8,800 per acre per year to maintain its parks and trails. The addition of 57.5 acres per year results in an annual increase of $506,000 to cover O&M costs associated with the increased acreage.
PART FIVE
To achieve target FTE ratios, adding 57.5 acres of park land will require 3.34 additional FTEs (3.2 General FTEs and 0.15 Administrative FTEs), at a combined annual cost of $345,073.
Impact: When combined, the incremental O&M and staffing costs associated with adding 57.5 acres of new parkland per year are estimated at approximately $851,073 annually (approximately $0.0037 per $100 of assessed valuation). While this calculation reflects the cost impact of the first year of additional acreage and staffing, the staffing component is not a onetime expense: FTE costs recur each year and will compound over time as additional staff are added annually to support continued system growth. As a result, the long-term affordability of this strategy will depend on generating sufficient ongoing revenue through growth in the City’s overall tax base (net assessed valuation) to absorb these compounding costs.
Up-front Costs: As previously noted, it is assumed that each new FTE for park maintenance will necessitate the purchase of a new work truck to perform their duties at a current cost of $135,000 per vehicle. The cost to provide 13 new work vehicles at $135,000 per vehicle reflects a one-time up-front cost of $1.725 million that will need to be funded through a bond or other mechanism that allows for immediate funding.
5. Operations & Maintenance of the WHRC Indoor Recreation & Aquatics Facilities.
To meet the needs of an underserved and rapidly growing portion of the city, the Action Plan supports the construction of a new indoor recreation and aquatics center at the future West Henderson Recreation Campus (WREC) site. The combined facility is anticipated to be approximately 202,000 gross square feet (150,000 SF for indoor recreation and 52,000 SF for indoor aquatics).
Similar to new parks, the capital costs associated with these facilities are anticipated to be funded through a combination of existing funding mechanisms, however funding for their operations and maintenance will need to come from a secondary (future), dedicated tax levy once the capital funding and construction timelines are more clearly defined.
As of January 2026, P&R spends approximately $25.54 per square foot per year to operate and maintain its existing indoor recreation facilities. At 202,000 GSF, the future indoor recreation and aquatics center at the WHRC will cost approximately $5,159,406 to operate annually.
The City’s existing indoor facilities currently have a staffing ratio of 1 FTE per 855 square feet, meaning that the future indoor recreation and aquatics facilities at the WHRC will require 236 additional General FTEs. At a current average cost of $37,482/ FTE, this represents an annual expenditure of $8,855,927. The addition of 236 General FTEs will subsequently trigger the need for 10.9 additional Administrative FTEs, which at an average annual cost of $115,689 each, represents an annual expenditure of $1,265,472.
Impact - When O&M and FTE costs are combined, adding 202,000 square feet of new indoor recreation and aquatics facilities at the future WHRC will cost approximately $15,280,805 (or $0.0662 per $100/AV) annually.
4. WHRC INDOOR FIELDHOUSE:
The Action Plan does not currently include a dedicated funding strategy for the envisioned 250,000+ square foot indoor fieldhouse and associated parking structure. The WHRC fieldhouse is anticipated to be one of the final phases of development at the WHRC, as it will likely serve a narrower user group than other project components. As a result, the City would not expect to initiate design and planning for at least five to ten years, and there are significant unknowns between now and that time.
In addition, a facility of this scale will likely require a creative and equitable funding approach—such as a public-private partnership (P3)—to address both up-front capital costs and the long-term operational burden. Before a funding strategy can be defined, the City should undertake a future feasibility study to better understand the building program, preferred operational model, anticipated capital costs, and cost-recovery and revenue potential, while also accounting for uncertainties related to future construction costs and evolving community needs.
ACTION PLAN
5. ASSUMPTIONS & DISCLAIMERS:
Planning-Level Financial Projections:
The projections presented in this Action Plan were developed in consultation with the City of Henderson Parks and Recreation Department and the City of Henderson Finance Department, using the best available data during the master planning process. These projections are planning-level estimates and should be refined and validated by qualified financial professionals prior to petitioning voters for approval of any secondary (new) dedicated tax levy. Future refinement should account for potential changes in the City’s fiscal status, debt capacity, and overall priorities.
Assessed Valuation Basis for Millage Estimates:
All millage rate estimates are based on the City of Henderson’s 2025–2026 net taxable assessed value of $23,092,486,085.
Cost Basis and Escalation:
All costs are expressed in 2026 dollars. Actual future costs will require escalation to account for inflation, staffing cost growth, and construction cost increases over time.
Staffing Scope and Secondary Impacts:
The Action Plan includes estimates of additional full-time equivalents (FTEs) needed to operate and maintain the facilities and assets proposed. However, staffing impacts associated with expanding offsite indoor recreation and youth-enrichment programming (e.g., programs delivered at school sites) are not fully captured at this level of planning.
As Henderson continues to grow, additional offsite programming is anticipated and may require an undetermined number of additional FTEs. The recurring costs of these future positions may be partially offset by revenues generated through program fees and cost recovery.
Figure 5.9 - Hikers overlooking the city from the mesa (COH, n.d.).
PART SIX
CMU Concrete Masonry Unit
COH City of Henderson
COLA Cost-of-Living Adjustment
COVID Coronavirus Disease 2019 (COVID-19)
CPI Consumer Price Index
CPRE Certified Park and Recreation Executive
CPTED Crime Prevention Through Environmental Design
DPW Department of Public Works
EDU Equivalent Demand Unit
EIFS Ex terior Insulation and Finish System
EMS Emergency Medical Services
EPA Environmental Protection Agency
ETC ETC Institute
EV Electric Vehicle
FRMWRK FRMWRK Planning + Design
FTE Full-Time Equivalent
FY Fiscal Year
GFCI Ground-Fault Circuit Interrupter
GIS Geographic Information System
GRASP Geo-Referenced Amenities Standards Process
GSF Gross Square Feet
H2ONE H2ONE Water Conservation Initiative
HDC Henderson Development Code
HMC Henderson Municipal Code
HMGC Henderson Multigenerational Center
HOA Homeowners Association
HVAC Heating, Ventilation, and Air Conditioning
IIB Type IIB Construction
IIP Infrastructure Improvements Plan
IPM Integrated Pest Management
IR Importance Rating
KPI Key Performance Indicator
LAN Local Area Network
LED Light-Emitting Diode
LEV Light Electric Vehicle
LID Low Impact Development
LOS Level of Service
Low-E Low Emissivity
MB&T Master Bicycle and Trails (Plan)
MBT Master Bicycle and Trails (Plan)
MJHMP Multi-Jurisdictional Hazard Mitigation Plan
MMA Mixed Martial Arts
MOU Memorandum of Understanding
MP Master Plan
MPI Market Potential Index
MRI Mediamark Research & Intelligence
MSC Mail Stop Code
MSHCP Multiple Species Habitat Conservation Plan
N/A Not Applicable
NCARB National Council of Architectural Registration Boards
n.d. No Date
NGO Non-Governmental Organization
NRPA National Recreation and Park Association
NRS Nevada Revised Statutes
N.T.S. Not To Scale
NV Nevada
O&M Operations and Maintenance
OSTP Open Space and Trails Plan
P&R Henderson Parks & Recreation Department
PAC Political Action Committee
PAMP Park Asset Management Program
PFNA Public Facilities Needs Assessment
PIF Park Impact Fee
PIR Priority Investment Rating
PLA Professional Landscape Architect
PTNA Parks, Trails, and Natural Areas
PV Photovoltaic
QR Quick Response
RBD Resilient by Design (criteria)
RBPP Regional Bicycle & Pedestrian Plan
RCT Residential Construction Tax
REMI Regional Economic Models, Inc.
RFCD Regional Flood Control District
RFP Request for Proposals
ROI Return on Investment
RTC Regional Transportation Commission of Southern Nevada
RTP Recreational Trails Program
SF Square Feet
SFIA Sports & Fitness Industry Association
SLAM Sports Leadership and Management Academy of Nevada
SMS Sports Marketing Surveys
SNPLMA
Southern Nevada Public Land Management Act
SNRPC Southern Nevada Regional Planning Coalition
SNS Southern Nevada Strong
SNWA Southern Nevada Water Authority
SOP Standard Operating Procedure
SPI Sports Participation Index
SRI Solar Reflectance Index
STEM Science, Technology, Engineering, and Mathematics
TAB Testing, Adjusting, and Balancing
TBD To Be Determined
TPL Trust for Public Land
TSK TSK Architects
U.S United States
UNLV University of Nevada, Las Vegas
UNR Unmet Needs Rating
UPRR Union Pacific Railroad
US United States
USA United States of America
UV Ultraviolet
UX User Experience
VoIP Voice over Internet Protocol
WSP Water Street Plaza
ZIP Zone Improvement Plan
PART SIX
City of Henderson. (2023). West Henderson PFNA update; (2014). West Henderson Land Use Plan (growth phasing and facility demand).
City of Henderson. (2023, July 12). Henderson cooling stations activated due to Excessive Heat Warning. https://www.cityofhenderson.com/Home/Components/News/News/695/45
City of Henderson. (2024) Fact sheet. https://www.cityofhenderson.com/our-city/about-henderson/cityfacts
City of Henderson. (2024). 2024-2027 Strategic Plan. https://www.cityofhenderson.com/home/ showpublisheddocument/13520/638459259287470000
City of Henderson. (2024, January 8). City of Henderson thanks residents and businesses for water conservation efforts in 2023. https://www.cityofhenderson.com/Home/Components/News/ News/941/567
City of Henderson. (2024, July 29). City of Henderson continues water conservation with Anthem Hills Park tur f removal. https://www.cityofhenderson.com/Home/Components/News/News/1236/567
City of Henderson. (2024, June 5). Henderson activates cooling stations due to Excessive Heat Warning https://www.cityofhenderson.com/Home/Components/News/News/1182/567
City of Henderson. (2025). 5 0+ centers—Downtown Senior Center; Heritage Park Senior Facility (facility directory). https://www.cityofhenderson.com/Home/Components/FacilityDirectory/ FacilityDirectory/160/784
City of Henderson. (2025). Adaptive recreation & inclusion services. https://www.cityofhenderson.com/ government/departments/parks-and-recreation/programs-classes/adaptive-recreation-inclusionservices
City of Henderson. (2025). America First Center (facility page). https://www.cityofhenderson.com/ government/departments/parks-and-recreation/facilities/america-first-center
City of Henderson. (2025). Boulder Highway initiatives and Connecting Communities to Transit (corridor reinvestment/safety context).
City of Henderson. (2025). City Council ward boundaries (open data) and My Neighborhood interactive ward map. City of Henderson Open Data; GIS/Interactive Maps.
City of Henderson. (2025). City names Henderson a 2025 National Gold Medal Award finalist https://www.cityofhenderson.com/Home/Components/News/News/1570/15
City of Henderson. (2025). Demographic profile (ACS 2019–2023 5 year). https://www.cityofhenderson.com/
City of Henderson. (2025). Maps & trails. https://www.cityofhenderson.com/government/departments/ public-works/bike-henderson/maps-trails
City of Henderson. (2025). Parks & Recreation—department overview. https://www.cityofhenderson.com/ government/departments/parks-and-recreation
City of Henderson. (2025). Parks & trails. https://www.cityofhenderson.com/government/departments/ parks-and-recreation/parks-and-trails
City of Henderson. (2025). Recreation centers (facility directory). https://www.cityofhenderson.com/ government/departments/parks-and-recreation/facilities/recreation-centers
City of Henderson. (2025). Senior nutrition services. https://www.cityofhenderson.com/government/ departments/parks-and-recreation/facilities/50-centers/nutrition-services
City of Henderson. (2025). Special events. https://www.cityofhenderson.com/government/departments/ parks-and-recreation/special-events
City of Henderson. (2025). Useless grass removal (AB356 ). https://www.cityofhenderson.com/government/ departments/utility-services/water-conservation/useless-grass-removal-ab356
City of Henderson. (2025). Ward I page (notes inclusion of the historic Water Street district); Ward II page (current council representation).
City of Henderson. (2025). Water conservation in parks & trails. https://www.cityofhenderson.com/ government/departments/parks-and-recreation/parks-and-trails/water-conservation
City of Henderson. (2025). Water Street Plaza (venue page). https://www.cityofhenderson.com/ government/departments/parks-and-recreation/facilities/other-venues/water-street-plaza
City of Henderson. (2025). Youth programs (Safekey & Teen Scene). https://www.cityofhenderson.com/ government/departments/parks-and-recreation/programs-classes/youth-programs
City of Henderson. (2025). All-In Henderson Sustainability & Climate Action Plan. https://www. cityofhenderson.com/home/showpublisheddocument/16793/638961333852930000
City of Henderson. (n.d.) Nonfunctional grass law (AB356): Useless grass removal. https://www. cityofhenderson.com/government/departments/utility-services/water-conservation/useless-grassremoval-ab356
City of Henderson. (n.d.-a). Our history. https://www.cityofhenderson.com/government/departments/ mayor-and-council/our-history
City of Henderson. (n.d.-b) Fact sheet. https://www.cityofhenderson.com/government/departments/ mayor-and-council/fact-sheet
City of Henderson. (n.d.-c). Parks & trails. https://www.cityofhenderson.com/government/departments/ parks-and-recreation/parks-and-trails
City of Henderson. (n.d.-e). Parks and Recreation. https://www.cityofhenderson.com/government/ departments/parks-and-recreation
CityPopulation.de. (2024, July 1). Henderson (Clark, Nevada, USA) – population statistics. https://www. citypopulation.de/en/usa/nevada/clark/3231900__henderson/ Crompton, J. L. (2007). Community benefits and repositioning: the keys to park and recreation’s future viability. National Recreation and Park Association.
ETC Institute. (2023). 2023 City of Henderson Community Survey Findings Report. https://www. cityofhenderson.com/home/showpublisheddocument/13058/638385851566200000
ETC Institute. (2025) City of Henderson Community Needs Assessment Survey: National benchmarking slides (slides 41–43).
GreenPlay, LLC. (2019). City of Henderson Parks and Recreation Master Plan
Heat.gov. (n.d.). At risk: People experiencing homelessness. National Integrated Heat Health Information System. https://heat.gov/who-is-most-at-risk-to-extreme-heat/at-risk-people-experiencinghomelessness/
IBWC. (2024, August 15). 2025 Colorado River water allocations announced for the United States and Mexico (Fact sheet). International Boundary & Water Commission. https://www.ibwc.gov/ wp-content/uploads/2024/08/2025-COLORADO-RIVER-WATER-ALLOCATIONS-final-8-15-2024.pdf
Las Vegas Review Journal. (2023, July). Lake Las Vegas and Calico Ridge moved to Ward 1 (redistricting action). Las Vegas Review-Journal
Las Vegas Valley Water District. (n.d.) Where your water comes from. Las Vegas Valley Water District /Southern Nevada Water Authority. https://www.lvvwd.com/water-system/where-your-watercomes-from/index.html
Logan Simpson. (2024). City of Henderson Open Space & Trails Plan. https://www.cityofhenderson.com/ government/departments/community-development-and-services/land-use-plans/open-space-andtrails-plan
National Golf Foundation. (2025). Golf industry research: Rounds played. https://www.ngf.org/theclubhouse/golf-industry-research/
National Recreation and Park Association. (2021). How strained budgets led to maintenance deferments and capital project delays. National Recreation and Park Association. https://www.nrpa.org/parksrecreation-magazine/2021/february/how-strained-budgets-led-to-maintenance-deferments-andcapital-project-delays/
National Recreation and Park Association. (2024). 2024 Agency Performance Review. https://www.nrpa. org/siteassets/research/2024-agency-performance-review.pdf
National Recreation and Park Association. (2025). 2025 Agency Performance Review. https://www.nrpa. org/globalassets/research/research-reports/2025-agency-performance-review-report.pdf
National Recreation and Park Association. (2025). Park Pulse: The value of local community activities https://public.tableau.com/app/profile/nrpa/viz/LocalCommunityActivitiesforFamilies/Dashboard1
National Recreation and Park Association. (2025). NRPA Park Metrics. https://www.nrpaparkmetrics.com/
Nevada Independent. (2025, August). Nevada will see another year of Colorado River water cuts. https:// thenevadaindependent.com/
Nevada Legislature. (2021). AB356 (81st Session): Nonfunctional turf; Southern Nevada Water Authority plan. Nevada Electronic Legislative Information System (NELIS). https://www.leg.state.nv.us/App/ NELIS/REL/81st2021/Bill/7910/Overview
NOAA/NCEI. (2024, July). National climate report: July 2024. National Centers for Environmental Information. https://www.ncei.noaa.gov/access/monitoring/monthly-report/national/202407
NWS Las Vegas. (2021). Precipitation overview (1991–2020 normals): Annual 4.18 inches [PDF]. National Weather Service. https://www.weather.gov/media/vef/Climate/Las%20Vegas%20Climate%20 Book%20Temp/Precipitation%20Overview.pdf
NWS Las Vegas. (2025). Climatological report—Las Vegas (product CLA/CLM) (records include all time high 120°F on 07/07/2024). National Weather Service. https://forecast.weather.gov/product. php?issuedby=LAS&product=CLA&site=NWS
Outdoor Industry Association. (2024, July 30) Outdoor participation hits record levels for ninth consecutive year (press release). https://outdoorindustry.org/press-release/outdoor-participationhits-record-levels-for-ninth-consecutive-year/
PROS Consulting. (2025). Clark County Parks and Recreation Strategic Plan. https://www.clarkcountynv. gov/adobe/assets/urn:aaid:aem:2e3b196e-0b2c-4607-bd18-bacc163a0054/original/as/Clark-CountyParks-and-Recreation-Strategic-Plan-Final-Draft-with-Appendix-A-and-CIP-Lists-10_8_25.pdf
Rails-to-Trails Conservancy. (2022, December 21) New data show strong demand for places to walk, bike and be active outside (Trail Counts 2022). https://www.railstotrails.org/wp-content/uploads/2024/02/ Trail_Counts_2022.pdf
RTC. (2015). Regional Bicycle and Pedestrian Plan. https://assets.rtcsnv.com/wp-content/uploads/ sites/4/2019/06/24162244/1-RTC-RBPP-April-2017-Final-Chapters-1-8.pdf
Southern Nevada Water Authority. (2021). Southern Nevada Water Authority & Southern Nevada Regional Planning Coalition Regional Plant List. https://www.snwa.com/assets/pdf/water-smart-plant-list.pdf
Southern Nevada Water Authority. (n.d.). Where your water comes from. https://www.snwa.com/waterresources/where-water-comes-from/index.html
Sports & Fitness Industry Association. (2024). 2024 Sports, Fitness, and Leisure Activities Topline Participation Report. Sports & Fitness Industry Association.
Sports & Fitness Industry Association. (2024) 2024 State of Pickleball report (topline). https://sfia.org/ resources/as-pickleball-continues-unprecedented-growth-in-every-age-group-and-region-for-thirdstraight-year-significant-investments-still-needed-for-court-and-facility-demand/
Sun City Anthem HOA. (2025). Community description (age restricted status, amenity context).
Trust for Public Land. (2016). The benefits of green infrastructure for heat mitigation and emissions reductions in cities. Trust for Public Land. https://www.tpl.org/wp-content/uploads/2023/05/ Benefits-of-Green-Infrastructure.pdf
PART SIX
Trust for Public Land. (2022, May 4). Washington, DC named best big city park system in USA; record investment and persistent funding gaps highlighted (ParkScore® press release). https://www.tpl. org/media-room/washington-dc-named-best-big-city-park-system-usa-lifted-strong-scores-parkaccess-and
Trust for Public Land. (2025). ParkScore®: Henderson, NV. https://www.tpl.org/city/henderson-nevada
U.S. Census Bureau. (1992). 1990 census of population and housing: Population and housing unit counts —Table 4, Population: 1790 to 1990 (CPH 2). https://www.census.gov/ (PD).
U.S. Census Bureau. (2024). QuickFacts: Henderson city, NV; United States — Population, Census (April 1, 2020). https://www.census.gov/ (CSV/QuickFacts page).
U.S. National Weather Service – Las Vegas. (2024). Climatological report (record high 120°F on July 7, 2024). https://forecast.weather.gov/product.php?issuedby=LAS&product=CLA&site=NWS
Urban Land Institute. (2019). Scorched; Extreme Heat and Real Estate. https://knowledge.uli.org/-/media/ files/research-reports/2019/scorched-final-pdf.f?rev=c98feb55fb4d4e7e9308bc7a6d7602cb&hash=301 54A7EADBE0149991F01F618E1AFB4
USGS. (2012). Mojave Basin and Range Ecoregion (Professional Paper 1794 A, ch. 29). U.S. Geological Sur vey. https://pubs.usgs.gov/pp/1794/a/chapters/pp1794a_chapter29.pdfpdf?rev=c98feb55f b4d4e7e9308bc7a6d7602cb&hash=30154A7EADBE0149991F01F618E1AFB4
USGS. (2012). Mojave Basin and Range Ecoregion (Professional Paper 1794 -A, ch. 29). U.S. Geological Sur vey. https://pubs.usgs.gov/pp/1794/a/chapters/pp1794a_chapter29.pdf
(This page intentionally left blank)
APPENDIX
PART SIX
Figure 2.9 - Aerial view of one of Henderson’s many dense residential neighborhoods (COH, n.d.).