
Who
Pays for the Lake District?


Research commissioned by Friends of the Lake District
DECEMBER
2024

By DR DAVINA STANFORD with introduction and discussion from FRIENDS OF THE LAKE DISTRICT
©
Andrew Bisset


PAYS FOR THE LAKE DISTRICT?
Research commissioned by Friends of the Lake District
Executive Summary
The Invisible Burden of Tourism is where the number of visitors exceeds infrastructure capacity and causes harm to the environments and communities of a tourist destination. This damage is often not perceived to be a direct result of tourism, and no mechanism exists to pay for it. Friends of the Lake District asked sustainable tourism specialist Dr Davina Stanford to identify where tourism is creating an invisible burden on the Lake District National Park’s landscape, environment and communities, and then to investigate how different tourist destinations across Europe deal with visitor impacts.
There are significant negative issues directly linked to the 18 million visitors a year who come to the Lake District. These include sewage discharge into lakes and rivers, high carbon emissions, congestion and damage to the landscape from visitor car journeys, and the ‘hollowing out’ of communities due to second homes and holiday lets. The capacity of the Lake District to deal with visitors is being exceeded at certain times of the year, with more than three quarters of national park residents polled saying that “Parts of the Lake District are full. Our infrastructure cannot cope with more visitors”. 2
Without a plan to deal with the invisible burden of tourism in the Lake District the negative impacts of visitors on the National Park could become worse, with significant consequences for the landscape and environment, communities and businesses. Failure of tourist destinations to deal with the negative impacts of tourism can lead to residents eventually becoming antagonistic to visitors, once the downsides of tourism outweigh the expected benefits.
Options to raise money from visitors so that it can be invested in infrastructure improvements should be investigated by local authorities and the Lake District National Park Authority. Dr Stanford’s research shows that there are a number of different ways that money can be raised. These include:
Tax on overnight stays
Visitor vehicle charge
Visitor parking levy
Development of a Tourism Business Improvement District
We know that tourism plays a vital role in supporting local economies. But unbalanced, poorly supported tourism can also put pressure on local communities and undermine the visitor experience. This is happening right now in the Lake District and without measures put in place to address the damage being done, the National Park’s landscapes, communities, and ultimately its tourism businesses could suffer and decline.
Based on this research, Friends of the Lake District believes that a compulsory visitor payback scheme should be implemented to address the negative impacts of tourism in the Lake District and unlock investment in vital areas like public transport. We hope that this report provides the basis for a discussion about the most appropriate type of scheme for the Lake District and for developing a plan to make this happen.
1 https://www.cumbriaaction.org.uk/resources/research-other/pub0262019-06lakedistrictcommunitiesandwhsreport.pdf
PAYS FOR THE LAKE DISTRICT?
Research commissioned by Friends of the Lake District
Introduction
In autumn 2023 Friends of the Lake District commissioned sustainable tourism expert Dr Stanford to examine the impact of visitors on the Lake District National Park’s environment, cultural heritage, communities, and economy and then to explore how different visitor charges of various kinds are used elsewhere across the world to address the unintended negative consequences of tourism.
In her report, Dr Stanford uses the Invisible Burden of Tourism model described in research2 by the Travel Foundation, to investigate seven categories of externalised environmental and social costs3 of tourism and how they impact on the Lake District. The Travel Foundation’s Invisible Burden Report states “the failure to adequately account for and manage tourism’s invisible burdens means that the long-term social, environmental and economic health of those destinations are in peril”.
The seven categories impacted by tourism that Dr Stanford looked at are:
• Energy use and greenhouse gas emissions
• Water
• Solid Waste
• Sewage
• Natural Capital
• Social Capital
• Transport
In the report, Dr Stanford looks at several ways that popular tourist destinations use visitor charging mechanisms to alleviate the invisible burden of tourism and protect and enhance the environment, whilst also supporting communities that are suffering from the impacts of high visitor numbers. The measures put in place to capture visitor revenue outlined in this study vary widely, but include a charge for entry per person, a car charge and a bed tax. They are all mandatory, administered by local government rather than by tourist organisations, and the benefits feed back into the community and to environmental works to mitigate visitor impact rather than promoting or funding tourist attractions and businesses directly.
The aim of this research is to demonstrate that it is possible to continue to welcome visitors, whilst implementing a tourist charging mechanism. It is also to show what destinations can achieve when they recognise the invisible burden and are provided with enough resources to manage and relieve the impacts of tourism.
A few early readers wanted to know why the report concentrates on the negative impacts of tourism on the Lake District National Park (although significant benefits are recognised on the first page of the report). An investigation into the invisible burden of tourism and ways to ameliorate it is of course going to concentrate on the burdens rather than the benefits as that is the nature of this piece of research.
2 https://www.thetravelfoundation.org.uk/invisible-burden/
3 In economics, an externality or external cost is an indirect cost to an uninvolved third party (both human and environment) that arises as an effect of another party’s (or parties’) activity. Externalities can be considered as unpriced components that are involved in either consumer or producer market transactions. Air pollution from motor vehicles is one example. The cost of air pollution to society is not paid by either the producers or users of motorized transport to the rest of society. Water pollution from wastewater treatment works is another example. People and the environment are made worse off by pollution but are not compensated by the market for the damage. Externalised costs are examples of market failure where the market is unable to fix the damage done in the course of economic activity. Gruber, J. (2018). Public Finance & Public Policy
Research commissioned by Friends of the Lake District
To find out more about the benefits of tourism to Cumbria, we suggest reading Cumbria’s recently launched Destination Management Plan (co-developed by a wide range of organisations including local government businesses, communities, transport providers, public sector organisations and more). This document which was led by Cumbria Tourism in 2024 sets out the benefits of tourism to the area very clearly. We consider that our report provides a balance to the Destination Management Plan, which doesn’t necessarily recognise or address the nature and extent of the invisible burden of tourism on the Lake District’s environment, heritage, and communities.
We present this research into some of the issues that comprise the invisible burden of tourism in the Lake District on the basis that if truly sustainable tourism is to be practiced in the National Park, then the invisible burden needs to be recognised fully and plans need to be put in place that will address the social and environmental costs that tourism places on the national park. Whilst the report acknowledges benefits generated by the visitor economy both to those working in the tourist industry and to some residents of the Lake District, the research shows that there are areas where tourism is causing significant harm to the environment, cultural heritage, residents and non-tourist businesses in the Park and that there is currently no compulsory mechanism in place to compensate for the damage.
A draft version of this report was presented to a sub-group of the Lake District National Park Partnership in January 2024.4 The presentation by Dr Stanford was accompanied by a lively question, answer and comment session. We are grateful to those who gave their time to see the initial presentation of our research. We have taken these comments into account in this final report. In December 2024, we made additional amends to the report following feedback from partner organisations.
Purpose of the Report
Dr Stanford’s compilation of visitor levies from across Europe and further afield was carried out to show that other popular tourist destinations recognise the invisible burden that the visitor economy places on sensitive areas and are putting in place measures to address the impact of visitors on these places.
We specifically asked Dr Stanford to make no recommendations in the body of the report; the aim of the research was to open a conversation about the options here in the Lake District, by looking around the world at visitor levy models operating in tourist areas today.
Friends of the Lake District recommends that this report is read with an open mind. We are asking people and organisations to recognise that as well as benefitting the Lake District’s businesses, tourism also has significant negative impacts on the environment and communities of the Lake District National Park. These invisible burdens, the unpaid costs to society and the environment of high visitor numbers, must be addressed in order to maintain and sustain the Lake District’s culture, community, landscape and environment, which are the very reasons that people visit the National Park.
Whilst we are aware that there is concern that a visitor levy would have an impact on visitors to the Lake District, recent research shows that there isn’t an obvious direct link between a visitor levy and reduction in visitors to places where tourist taxes have been implemented.5
The Welsh Government who are currently consulting on a visitor levy5b neatly sum up why some form of visitor payback is necessary:
We know that tourism plays a vital role in supporting local economies. But unbalanced, poorly supported tourism can also put pressure on local communities and undermine the visitor experience.
A visitor levy is not intended to put people off visiting. Instead, we propose that it would be a small contribution by overnight visitors that will generate additional revenue for local authorities to reinvest in local communities. This would enable them to address some of the costs associated with tourism and encourage a more sustainable approach.
You can see our analysis recommendations and conclusions in the Discussion section of the report.
4 LDNPA, LDNPP, LDF, CT, Westmorland and Furness Council, Business Task Force, Windermere Lake Cruises, Action With Communities in Cumbria
5 https://www.bangor.ac.uk/news/2024-05-09-why-you-should-expect-to-pay-more-tourist-taxes-even-though-the-evidence-for-them
5b https://www.gov.wales/a-visitor-levy-for-wales
Research
Benefits of Tourism in the Lake District
Tourism is a significant contributor to the economy of Cumbria and the Lake District.
According to the 2023 figures from Cumbria Tourism, 45,882* 6 full-time equivalent jobs were supported by tourism activity across the County (separate figures for the Lake District are not given). Total tourism revenue in the Lake District was £2.305 billion compared to £2.34 billion for the rest of the county outside the Lake District.

In addition, there are further benefits from these visitors:
• Local services such as shops, churches and independent cinema are viable and able to remain open
• Tourism jobs for young people are created and can help to fund their studies
• Transport is better than it might be for a comparable rural area due to tourism (albeit the services benefit visitors but don’t always work well for local use)
• Stagecoach cross-fund winter bus services from summer revenue
• Farmers can supplement their income by diversifying into tourism
• Tourism can help support nature recovery programmes such as Wild Haweswater.7
Cumbria Tourism’s most recent Destination Management Plan published in March 2024 offers a full rundown of the benefits of tourism for the Lake District and Cumbria.8
* The number of jobs created covers the whole of Cumbria and includes workers who may travel to work from outside the county
6 www.cumbriatourism.org/resources/research
7 https://wildhaweswater.co.uk
8 https://issuu.com/cumbriatourism3/docs/a_destination_plan_for_cumbria_2024_to_2030
Challenges of Tourism in the Lake District
As well as the benefits, the large numbers of visitors attracted to the Lake District also bring some challenges.
In 2023, the Lake District National Park received around 18.11 million visitors equating to 27.21 million visitor days.9
These additional visitors add up, on average, to an additional population of just under 80,000 per day (i.e. visitors days divided by 365) or more than double the population of just 39,000. This is problematic because much of the funding for essential services and infrastructure is based on the resident population.
Visitor numbers are expected to grow. According to the Lake District National Park Local Plan (Policy 18: Sustainable tourism and holiday accommodation), tourism modelling of visitors to the area suggests that the number of visitors (as well as the economic impact) will continue to increase year on year at a rate of about 2.5%.10
The Lake District National Park Partnership State of the Park Report acknowledges that although visitors to the park provide economic benefits, the park may lack the capacity to cope with these numbers resulting in social and environmental impacts:
“Whilst high visitor numbers are beneficial to the economy there is some question as to the National Park’s capacity to deal with this level of visitors and the impacts that this has on infrastructure, services and the environment. …there is a need to better understand and manage both visitor movement around the Park; as well as its associated environmental impacts, both direct and indirect”. 11
In response to these issues, this report has the following objectives and structure:
• The first section of the report identifies the main externalities of tourism in the Lake District and the hidden costs associated with large numbers of visitors. The section uses a framework from the Travel Foundation’s Invisible Burden12 report to structure these externalities. This includes greenhouse gas emissions and climate change, water use, solid waste and sewage management, natural and social capital and transport issues and management.
• The second half of the report gives an overview of the various mechanisms that can be used by destinations for capturing additional visitor revenue to help pay for these externalities. This includes taxes, levies and other mandatory charges.
• The final section of the report presents five case studies that illustrate different mechanisms for raising revenue.
• This includes explanations of how the revenue is raised, the ways in which visitor revenue is spent and, where available, the governance and administration of visitor revenue capture models. WHO PAYS
The report aims to demonstrate a range of possible mechanisms for revenue capture and the innovative ways in which such revenue has been spent.
This information is intended to act as a catalyst to commence conversations with key stakeholders and reach agreement on fair and transparent solutions.

9 https://www.lakedistrict.gov.uk/learning/factstourism
10 www.lakedistrict.gov.uk/planning/planningpolicies/local-plan/policies/policy-18-sustainable-tourism-and-holiday-accommodation
11 Lake District National Park Partnership State of the Park Report 2018 p.40
12 www.thetravelfoundation.org.uk/invisible-burden
The Costs: Externalities Created by Visitors
Externalities are costs generated by producers but carried by society as a whole. For example, a factory may pollute water by dumping waste in the river without paying for it to be cleaned up. In the Lake District, the numbers of visitors exceed the capacity of infrastructure and cause harm the landscape and communities without a mechanism existing to pay for the damage.
This section explores some of the externalities created by large numbers of visitors to the Lake District. In particular, the section focusses on impacts and externalities that are not fully accounted for.
It should be noted that some of the issues outlined in this section are not entirely attributable to visitors, (for example residents also contribute to waste, greenhouse gas emissions etc.). However, it is a reasonable assumption that the impacts will be exacerbated by the larger number of visitors to the Lakes.
The 2019 report by The Travel Foundation refers to the externalities of tourism as ‘the invisible burden’.13
The report states that: “…the failure to adequately account for and manage tourism’s invisible burdens means that the long-term social, environmental, and economic health of those destinations is in peril…”
The term ‘invisible burden’ is further explained in this video.
Externalities
The invisible burden identifies six categories of ‘burden’:
1. Energy and Greenhouse Gas Emissions e.g. cost of infrastructure upgrades, cost of managing peak demand, increased reliance on non-renewables
2. Water e.g. cost of infrastructure upgrades, overexploitation
3. Solid Waste e.g. cost of infrastructure upgrades, uncollected waste, unsanitary waste dumps and pollution
4. Sewage e.g. cost of infrastructure upgrades, untreated sewage
5. Natural Capital e.g. cost of climate change adaptation and mitigation, costs to maintain, biodiversity, green corridors, and protected areas, loss of biodiversity and ecosystem services
6. Social Capital e.g. higher cost of living, amenities for residents displaced by visitors, undermined community values. This report uses these categories as a framework to explore the externalities of tourism in the Lake District. For the purposes of this research a seventh category has been added:
7. Transport e.g. cost of road maintenance, congestion, provision of public transport. Each of these are presented in further detail in the following section.
Research commissioned by Friends of the Lake District
Energy & Greenhouse Gas Emissions
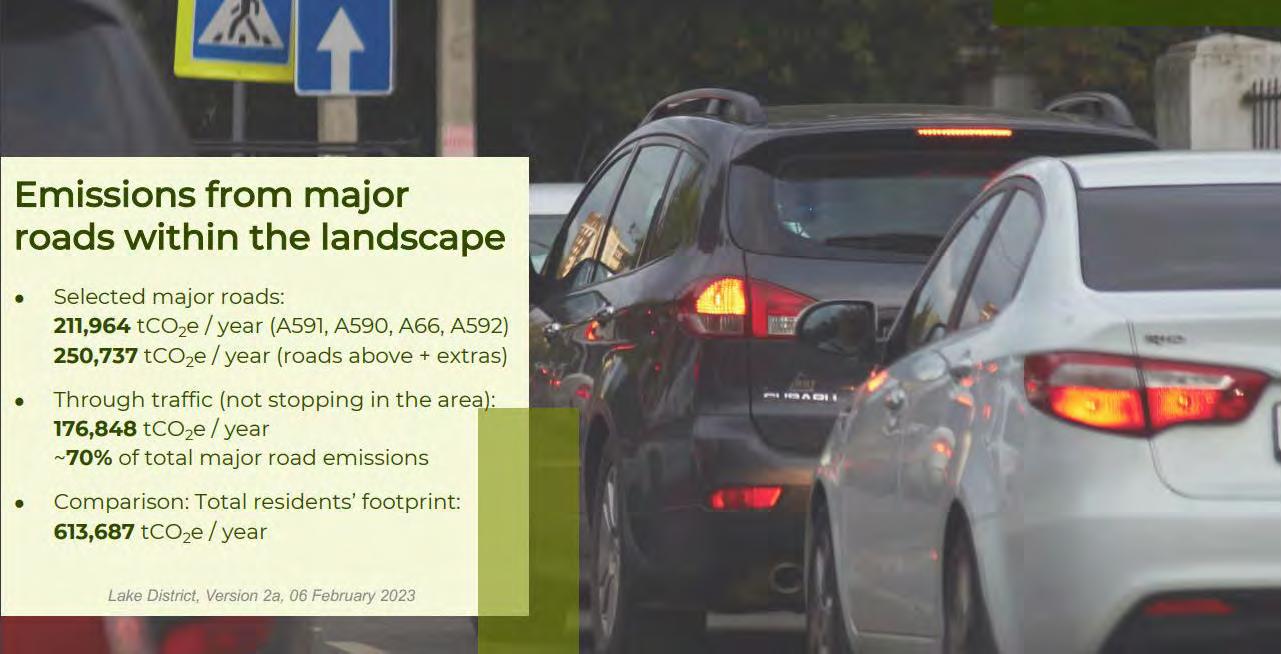
Greenhouse Gas Emissions
According to Small World Consultation, greenhouse gas emissions by consumers are broken down into two categories: Residents of Cumbria and Visitors to Cumbria.
The emissions for residents per year are 613,687 tCO2e, whereas the emissions for visitors are 517,202 tCO2e.
Visitors travelling to and from the area account for 1,130,135 4CO2e/year. The majority of this is from vehicle fuel. Visitors emit more carbon travelling to and from Cumbria than they do during their stay.
Consumption-Based Greenhouse Gas Emissions for Residents and Visitors
Key
Leisure, Recreation & Attractions
Health, Education, Other Public Services & Administration
Housing
Other Bought Services
Water, Waste and Sewage
Other Non-Food Shopping
Accommodation (Non Home)
Excl. Food
Food & Drink
Trains, Buses & Other Transport
Ferry Crossings & Cruises
Personal Flights
Car Manufacture & Maintenance
Vehicle Fuel
Household Electricity
Household Fuel
Source: Small World Consulting
Impact of Climate Change
According to the Lake District National Park Authority14 there are multiple and significant impacts of climate change in the Lake District:
• Species loss: plants and animals which are at the edge of their range could become locally extinct. Examples include the mountain ringlet butterfly and the Arctic charr a cold water loving fish which has lived in Windermere since the ice age.
• Migration upwards: Migrations of habitats upwards, squeezing upland landscapes into smaller areas making them more vulnerable.
• Increase in non-native species: Examples include pygmy weed in wetland habitats, Himalayan balsam and Japanese knotweed. All are invasive plants which spread rapidly pushing out native plants and the wildlife which depend on them. Another unwelcome arrival could be Bluetongue disease in cattle which is spread by a species of midge seen for the first time in Britain in 2007. This disease would have a serious effect on farmers.
• Changes to lakes: Falling lake levels in summer and poorer water quality as pollutants become more concentrated. Erosion caused by heavy rain will increase siltation. Toxic blue-green algae may become more common in lakes affecting recreational use. Midges may be more of a problem near lakes.
• Changes to woodlands: Woodlands will suffer more storm damage and trees could suffer from summer drought. Woodlands will change as some species adapt better than others.
• Drying out of peat: Peat locks carbon into the soil. It is estimated the peat in the UK stores around three billion tonnes of carbon – the equivalent of 20 years of UK carbon emissions. Hot dry summers could lead to peat drying out releasing carbon into the atmosphere. Footpath erosion caused by high numbers of visitors contributes to this problem.
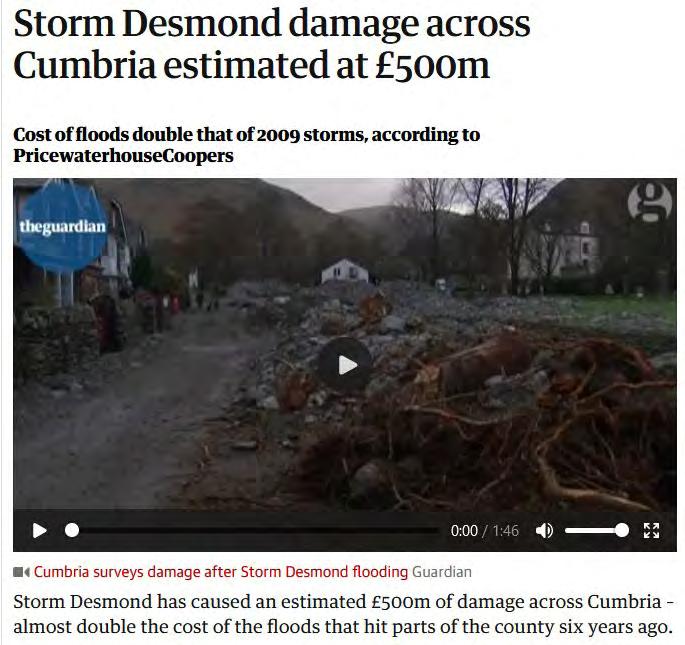
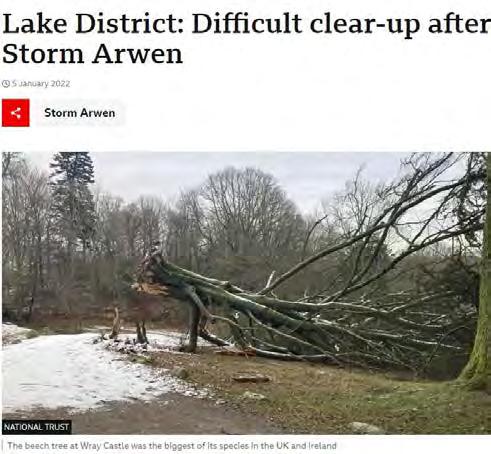
• Greater risk of extreme weather events: Storms, high winds, flooding, drought and forest fires could all increase. Storm Desmond in 2015 was estimated to have caused £500m of damage across Cumbria. Storm Arwen in 2021 felled 35 hectares of trees.
• Footpath erosion: Heavy winter rainfall can have a devastating effect on footpaths – the extreme rainfall events in November 2009 and December 2015 washed away many footpaths and footbridges.
Cost of Infrastructure
Work is underway by Electricity North West to upgrade 5.4km of underground electricity cables in Windermere.15
The cost of the project is £1m.
The project will create new capacity in the local electricity grid to enable the installation of Windermere’s first electric ferry as well as potential new electric car charging points in the town.
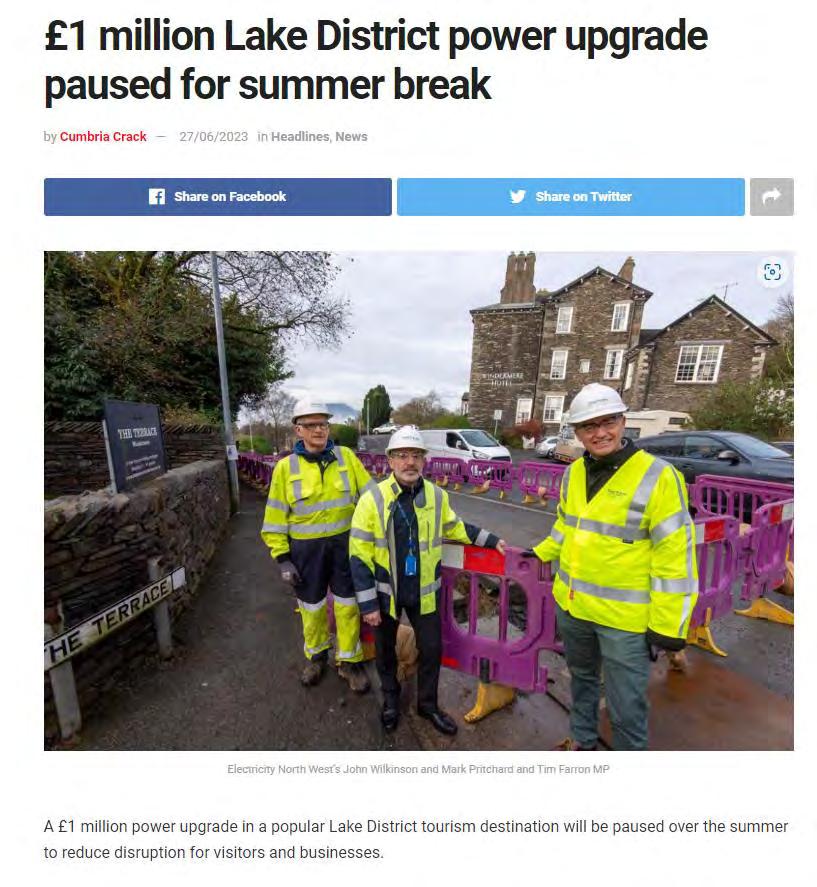
Image source: Cumbria Crack
Research commissioned by Friends of the Lake District
Water Use
The Lake District receives significant rainfall. Seathwaite in Borrowdale is often cited as being England’s wettest inhabited place receiving 3,300mm of rainfall per year. However, the region can experience droughts and falling water levels in the Lakes.16
“experts said the high visitor numbers to drought-stricken areas in summer were potentially unsustainable.”17
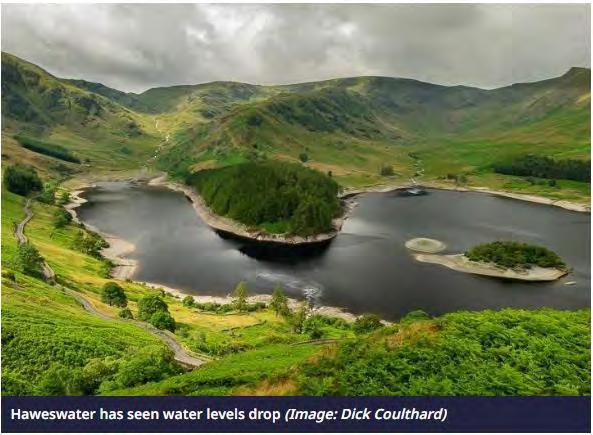
16 www.theguardian.com/environment/2023/jun/29/drought-cumbria-lake-district-devon-cornwall-government-committee-leak
17 www.newsandstar.co.uk/news/23623874.threat-lake-district-drought-water-levels-drop
Research commissioned by Friends of the Lake District
In general terms, tourism water use per person per guest night in the UK is 178 litres on average.18 This compares to around 146 litres per person per day domestic use.19
The issue is not that staying visitors use a disproportionate amount of water per person, but that there is such a high volume of visitors compared to the resident population.
The commission on Sustainable Development (2012) reports that, in many locations, the seasonal influx of tourists can more than double demand for potable water.20

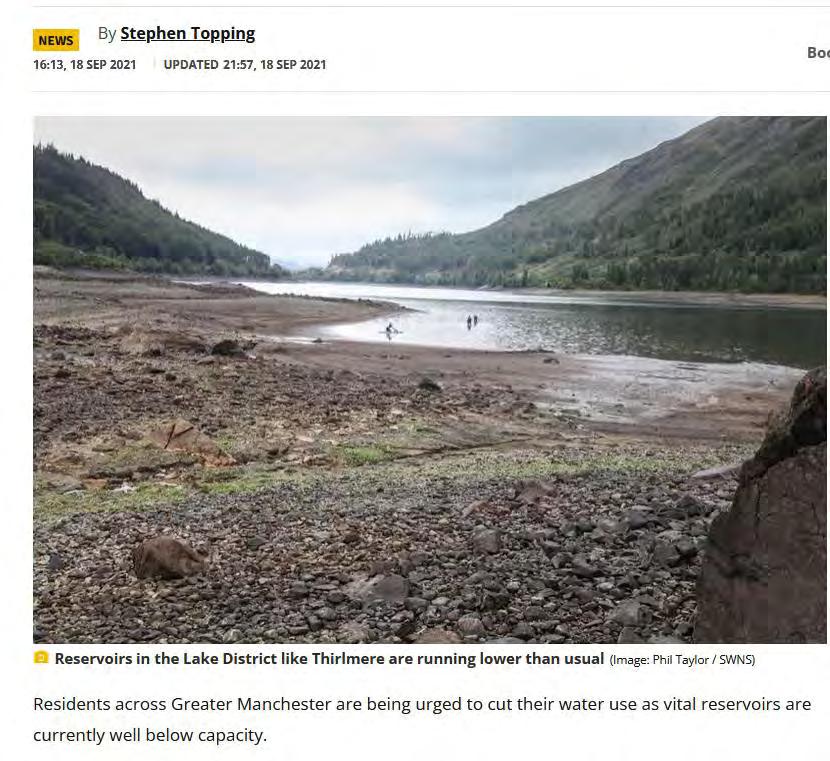
Image source: www.manchestereveningnews.co.uk/news/greater-manchester-news/millions-greater-manchester-residents-urged-21608907
18 Water use with that of the local community, Water Resources and Industry, Volumes 7–8, 2014, Pages 9-22 https://www.sciencedirect.com/science/article/pii/S221237171400034
19 www.statista.com/statistics/1211708/liters-per-day-per-person-water-usage-united-kingdom-uk/#:~:text=Average%20water%20usage%20 per%20person,England%20and%20Wales%202016%2D2022&text=The%20average%20person%20in%20England,liters%20of%20water%20 a%20day
20 www.sciencedirect.com/science/article/abs/pii/S0959652614008737
Research commissioned by Friends of the Lake District
Solid Waste
Commercial Rubbish
The United Nations Environment Programme (UNEP) estimates that 1.3 billion tons of waste, between four and eight per cent of global waste, is produced each year solely by tourists.
UNEP also estimates that European tourists generate about 1kg per person per day and American tourists generate up to 2kg per person per day.
“This waste can potentially overload waste management systems, especially in destinations that are more rural in nature or have a low population.”21
By comparison, the Department for Environment, Food and Rural Affairs data shows Cumbria County Council collected an average of 487.7kg of household waste per person from homes in the area in 2020-2117 which equates to 1.33kg per day.
As with other issues, the challenge for the Lake District is not that visitors produce more waste per person than the resident population, but that they treble the population of the Lake District from 39000 to 119000 on a daily basis significantly adding to the Local Authority waste stream.
“The population of the Lake District is significantly increased each year …. generating waste which is collected through the Local Authority Collected Waste stream, much of which ends up in landfill or incineration.”22
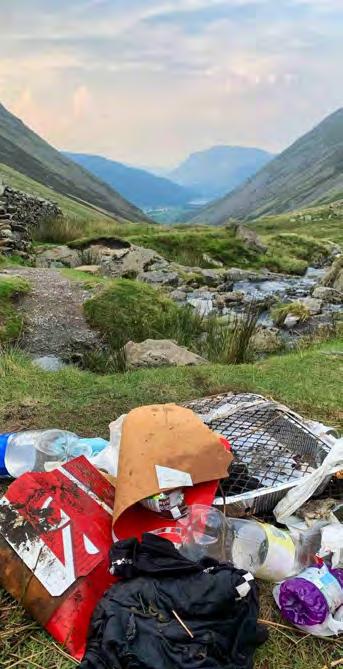
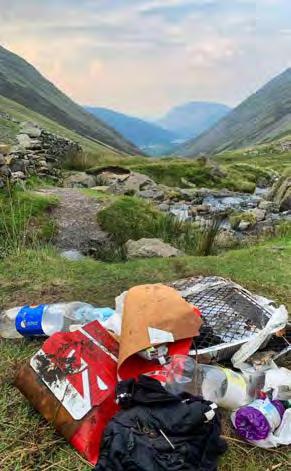
Litter
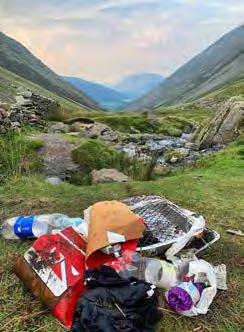
Following the easing of 2020 lockdown measures, the Lake District experienced an increase in visitors to the Lake District National Park. This resulted in significant problems with litter. Friends of the Lake District undertook and published research23 in collaboration with Keep Britain Tidy to understand more about littering behaviour. The report found that more than a quarter of visitors to the Lake District admitted to littering (27%). The most commonly admitted-to-behaviours were as follows:
• Leaving an item next to or on top of the bin (8%)
• Dropping unwanted food (7%)
• Leaving behind toilet roll, tissues or wipes after going to the toilet outdoors (5%)
• Leaving items of rubbish behind after eating (4%)
• Dropping rubbish because it was dirty, smelly or messy (4%)
• Leaving behind camping equipment because it was broken or no longer needed (6%).
21 https://resource.co/article/managing-waste-tourist-cities-2023
22 https://www.lakedistrict.gov.uk/planning/planningpolicies/local-plan/policies/policy-28-waste-management
23 www.friendsofthelakedistrict.org.uk/news/litter-research
Image: Friends of the Lake District and Keep Britain Tidy (2021)
Research commissioned by Friends of the Lake District
Sewage
Water companies are legally allowed to discharge untreated wastewater through sewer overflows during periods of heavy rain in order to avoid flooding. However, this happens more frequently as outdated infrastructure is unable to cope with increases in population and the effects of climate change.24
The discharged sewage contains contaminants that can disrupt ecosystems and harm biodiversity, including bacteria, heavy metals, chemicals, pharmaceuticals, recreational drugs, and nutrients.
According to Unearthed,25 a 2023 report from Greenpeace’s investigative unit, several waters with protected status in the Lake District have been heavily hit with sewage discharges.
The report gives the example of the River Derwent and Bassenthwaite Lake which received more than 6,600 hours of sewage spills in 2022, while Esthwaite Water, received over 2,700 hours.
The report also identifies the worst-performing pipe, near the village of Ravenglass, which poured sewage for a total of 4,605 hours into the Morecambe Bay and Duddon Estuary Special Protection Area and Drigg Coast Site of Special Scientific Interest/Special Area of Conservation.
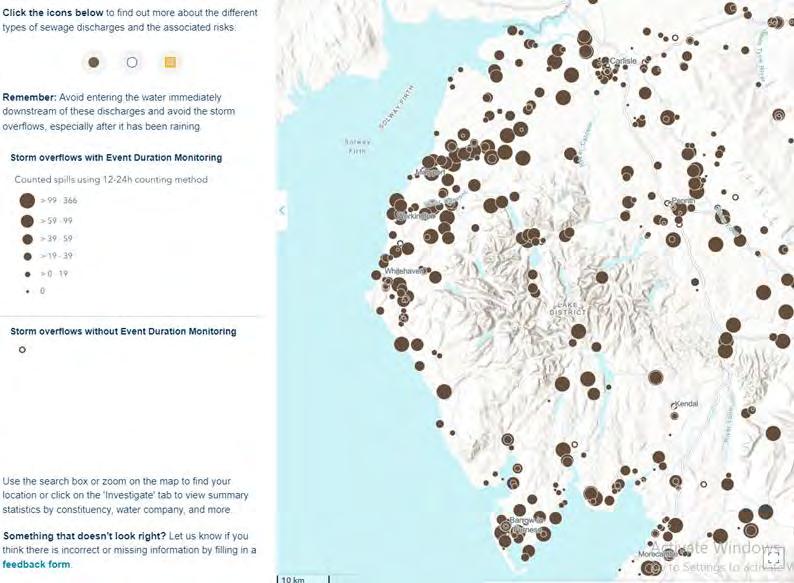
Data from the Rivers Trust records the extent of storm overflow events, illustrated here for the Lake District:26
24 www.cnp.org.uk/news/saving-windermere-sewage#:~:text=The%20main%20culprit%3F,examples%20of%20this%20h appening%20routinely
25 https://unearthed.greenpeace.org/2023/07/31/sewage-uk-water-pollution/#:~:text=Unearthed’s%20analysis%20found%20that%20 rivers,source%20of%20pollution%20entering%20waterways
26 https://theriverstrust.org/key-issues/sewage-in-rivers
Image source: The Rivers Trust
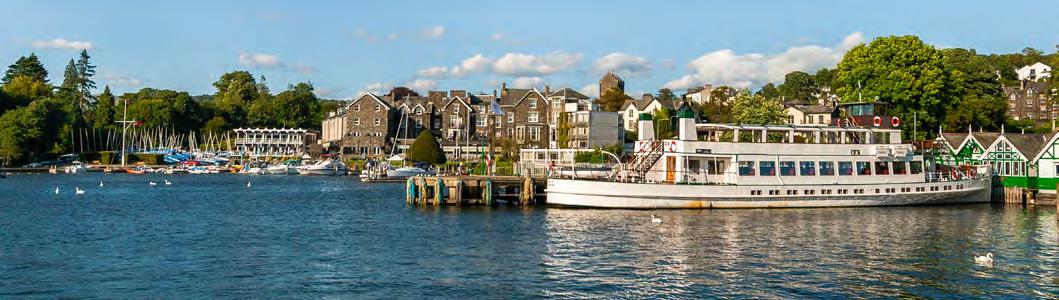
The Example of Windermere
Given its iconic status as England’s largest lake and situated in the heart of the National Park, much of the research and campaigning regarding sewage discharge and its impact focuses on Windermere.
In 2019 data provided by Love Windermere stated that there were seven million visitors a year to the Windermere catchment area which averages out to 19,178 extra people per day.27
The system is not coping as there are on average three times the number of people using it compared to the levels of effluent the wastewater treatment system was designed to deal with.
“The population living around the lake can double between winter and summer, putting an extra load of nutrients into septic tanks, wastewater treatment works, and sewage facilities at campsites.” 29
More recent research by Map Impact published in March 2024 used phone data to extrapolate actual visitor numbers indicated that there could be up to 320,000 people in the catchment on busy days, more than 36 times the number of people that live in the catchment area. The Map Impact research compared visitor numbers with blue-green algal blooms and found that there was a direct correlation between high numbers of visitors and algal bloom events 2-10 days after. It is no surprise that the sewage works are discharging raw sewage via overflow when there are up to 36 times more people using bathrooms in the catchment than the waste water treatment works was designed to deal with.30
This ‘additional load’ was evident in 2022, when 246 full days of sewage were discharged from storm overflows into the Windermere catchment area.31
27 https://lovewindermere.co.uk/#:~:text=Tourism%20underpins%20the%20economy%20of,inputs%20to%20 the%20wastewater%20system
28 https://www.bbc.co.uk/news/uk-england-cumbria-61897192
29 https://lovewindermere.co.uk/the-challenges
30 www.mapimpact.io/project/windermere-catchment-analysis
31 www.savewindermere.com
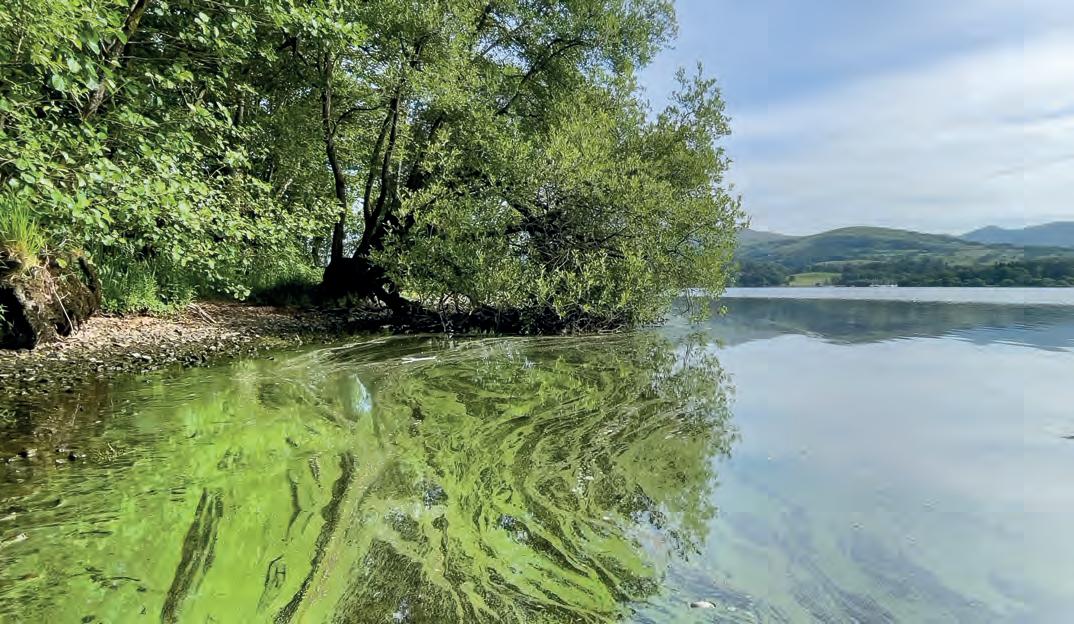
Blue-green algae in Winderemere caused by pollution. Image source: Matt Staniek. 28
Recent research data suggests that permitted conditions to discharge sewage in Windermere were breached on up to 70 days, although United Utilities disputes these findings.32
United Utilities are proposing to invest a further £156 million to “help improve and protect water quality in Windermere”. This builds on their £45 million investment at Windermere, Ambleside and Grasmere as part of their improvement programmes between 2015 and 2020.33
The impact of sewage in Windermere is as follows:
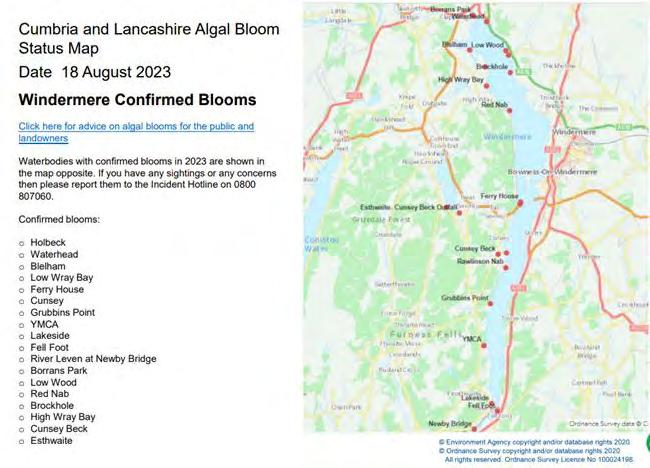
• Sewage adds phosphorus which creates algal blooms (see figure below for confirmed 2023 blooms)
• The blooms starve the lake of dissolved oxygen and if a bloom is severe enough, the lack of dissolved oxygen can kill the life within its water
• Blooms are hazardous to animals and have caused the death of dogs, cattle and wild animals, including fish
• Blooms are also hazardous to humans resulting in skin rashes, eye irritation, vomiting, diarrhoea and fever.34
The cancellation of the Great North Swim in 2010 due to the presence of blue green algae led to an estimated loss of approximately £1.5 million to the local economy.35
All that said, in 2023 bathing water quality monitored by DEFRA at Fell Foot, Windermere, is classed as ‘excellent’. 36
“Tourists are unwitting contributors to the ecological deterioration of the sites they visit and enjoy. Visitor numbers are highest between spring and autumn, which is also the time of year when nutrients are likely to have the largest stimulating effect on the lake phytoplankton.”
– Freshwater Biological Association (2022) 37
32 www.theguardian.com/environment/2023/nov/16/sewage-dumps-windermere-data-analysis
33 https://www.unitedutilities.com/my-local-area/news-in-your-area/cumbria/windermere/action-windermere/
34 https://consult.environment-agency.gov.uk/cumbria-and-lancashire/blue-green-algae-in-cumbria-and-lancashire/user_uploads/bluegreen-algae-leaflet.pdf
35 https://climate.copernicus.eu/sites/default/files/2020-01/LNDPA_technical_report_approved.pdf
36 https://environment.data.gov.uk/bwq/profiles/profile.html?site=ukd 1203-45700
37 Cited in www.cumbriawildlifetrust.org.uk/blog/stephen-trotter-ceo/windermere-iconic-lake-trouble
Research commissioned by Friends of the Lake District
Natural Capital
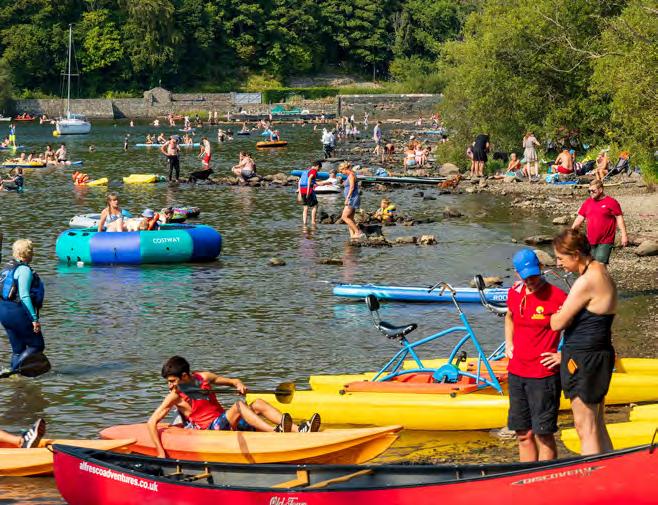
It is estimated that over 10 million people use the National Park’s paths annually.38
Scafell Pike alone was climbed by 250,000 people in 2022.39
The volume of walkers on the fells can lead to footpath erosion, defined as the loss or substantial alteration of vegetation and soil structure, due in part to the concentrated pressure of people.
The increasing number of extreme weather events linked to climate change, coupled with erosion from visitor use of footpaths and bridleways means that damage is currently outstripping the funding available to keep them in good order.
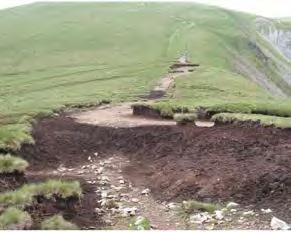
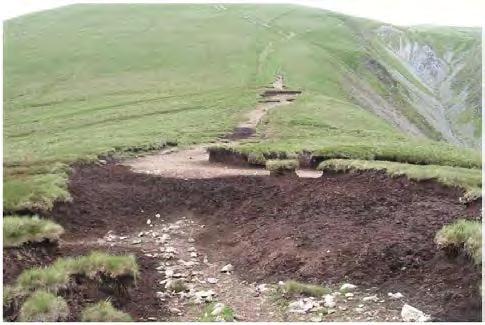
The Impact of Footpath Erosion
“Eroded paths are not only unsightly, but unpleasant to walk on and can lead to habitat loss as well as damage to the heritage, archaeological and natural history qualities of the area.” 40
According to Joanne Backshall, Fix the Fells programme manager, excessive erosion on popular routes also has an impact on wildlife:41
• Once vegetation is lost through erosion, soil and stone quickly washes off the hillside.
• This loss of habitat can affect rare mountain plants and animals which are already at risk and living at the very edge of their range.
• Degradation also has a harmful impact on the rivers and lakes as sediment washed off the hillside can cover the gravel in rivers and lakes used by fish to lay their eggs, reducing their breeding habitat.
• Sediment can also impact plant and insect numbers, which in turn will attract fewer birds.
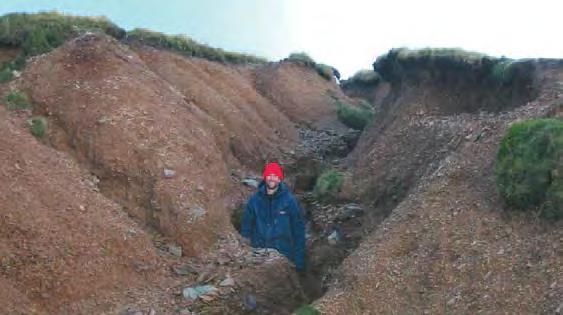
““The photo appears to show a river gully. In fact this is the path that runs from Coledale Hause towards Wandope, near Buttermere. No work has ever (yet) been done to this path, and it demonstrates what other paths in the Lake District could look like if nothing was done to stabilise them.” – Fix the Fells (2017) 42
Image: www.fixthefells.co.uk
38 www.fixthefells.co.uk/wp-content/uploads/2017/12/path_erosion_factsheet.pdf
39 www.nationaltrust.org.uk/visit/lake-district/wasdale/climbing-scafell-pike
40 www.fixthefells.co.uk/wp-content/uploads/2017/12/path_erosion_factsheet.pdf
41 Joanne Backshall, Fix the Fells programme manager, quoted in https://keswickreminder.co.uk/2021/08/27/500000-annual-cost-totackleerosion-on-lake-district-fells
42 www.fixthefells.co.uk/wp-content/uploads/2017/12/path_erosion_factsheet.pdf

The Cost of Fixing the Fells
The Lake District National Park Authority and other charitable organizations operating in the area fund Fix The Fells (www.fixthefells.co.uk) an organisation which operates using volunteers to maintain and repair mountain paths, clear drains and generally try to increase the resilience of the Lake District’s upland rights of way.
Each year Fix the Fells requires around £500k to maintain their current level of work.
Over the next 10-15 years they are looking to repair another 120 paths as well as maintain the existing network. Every metre of path costs £150 to create.43
43 https://keswickreminder.co.uk/2021/08/27/500000-annual-cost-to-tackle-erosion-on-lake-district-fells
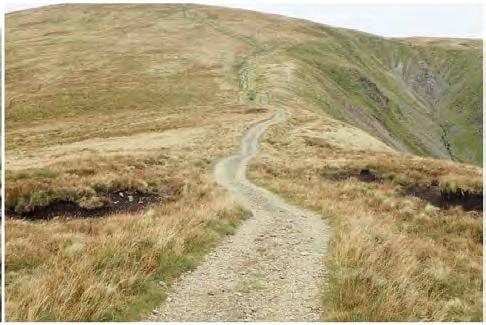
Yoke to Thornthwaite Beacon, Kentmere – before (2005) and after work by Fix the Fells (2019) Images: www.fixthefells.co.uk
44
Social Capital
Housing
There are multiple issues relating to social capital in the Lake District, these include housing, the increase in second home ownership, the cost of living and access to services. Many of these impacts relate to the prevalence of second home ownership, holiday lets and Airbnb and an increase in commuter and retirement homes.
It is generally accepted that if the percentage of second homes and holiday lets in any one settlement / parish is over 20% then the sustainability of settlements is adversely impacted.
According to recent figures (Revenue and Benefits data June 2022), 25% of the existing housing stock in the Lake District has no permanent residents.
38 of the 52 Parishes (73%) in the Lake District exceed 20% second home/holiday let ownership and there are 12 parishes (23%) where this figure is higher than 40%:44
• Martindale 77%
• Matterdale 55%
• Patterdale 55%
• Borrowdale 52%
• Skelwith 50%
• Barton with Pooley Bridge 49%
• Under Skiddaw 49%
• Wasdale 46%
• Above Derwent 43%
• Eskdale 41%
• Claife 41%
• Lakes 41%

“I’ve lived here all my life (50 years). My family have lived here for generations but I’m the only one left because we have been priced out. My children couldn’t stay despite wanting to because there are no jobs apart from tourism and no homes they can afford despite being in professional occupations.” – Local resident; unpublished analysis from research undertaken by UCLan (2020-2022)
Second Home and Holiday Let Data by Parish
A 2023 study from Generation Rent has shown that increasing holiday let properties nearly cancel out the supply of new homes in tourist areas. In the Copeland area of the Lake District there were 426 new homes created in the last three years.45 Over the same period, 407 existing homes were converted to commercial holiday lets or second homes.46 Housebuilding is supposed to be part of the solution to high rents, but when so much of the existing stock then leaks into the holiday homes/second homes sector, this negates any benefit of new homes. In addition, new homes in the Lake District often have significant impacts on landscape as there are few places where new homes can be built without causing damage to the special qualities of the national park.
The need for quality design and use of materials sympathetic to the National Park to fit in with the surrounding environment is costly.47

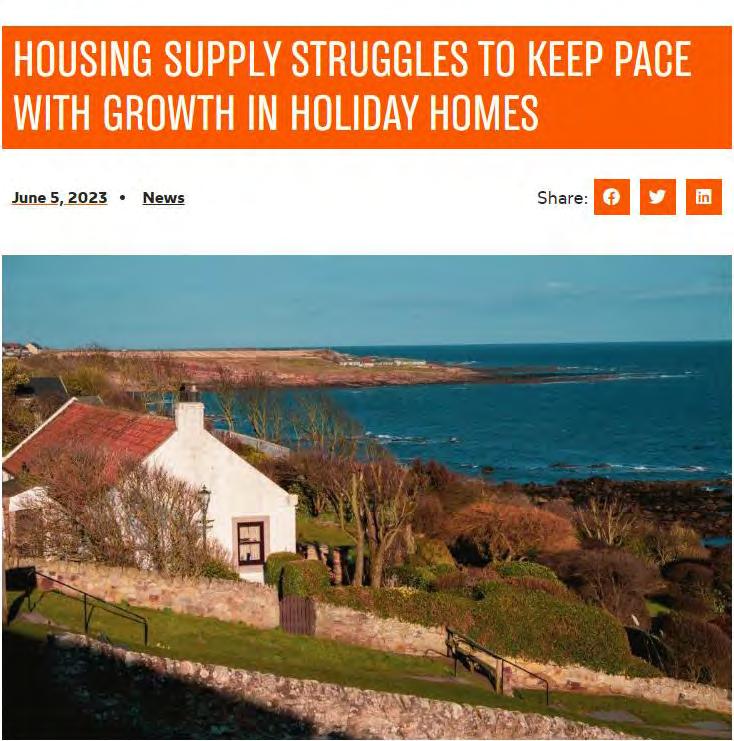
Image: www.generationrent.org/2023/06/05/housing-supply-struggles-to-keep-pace-with-growth-in-holiday-homes
45 Generation Rent 2023 – www.generationrent.org/2023/06/05/housing-supply-struggles-to-keep-pace-with-growth-in-holiday-homes
46 www.theguardian.com/society/2023/jun/04/holiday-lets-nearly-negate-supply-of-new-homes-in-tourist-areas-study-shows
47 www.lakedistrict.gov.uk/planning/planningpolicies/affordablehousing
Research
Erosion of Community
The growth in the number of second homes and holiday lets has been at the expense of homes in permanent occupation and has helped drive prices to very high levels and as a result the population is declining.
This decline in the resident population and the loss of people of working age is threatening the viability of the range of local services crucial to community vitality for example, GPs, dentists, local shops and businesses, nurseries and schools.
In the farming sector, labour shortages contribute to the threat to local farming traditions and practices which are an integral part of Lake District life.
The overall sense of community, including local clubs, voluntary groups and societies, community centres and voluntary activity is being progressively undermined.48
“In the Lakes and the dales of Cumbria we have 63% of our employers operating below capacity because there aren’t enough workers in the area. The big problem for us – which I know he is seeking to tackle – is the collapse of the long-term private rented sector into Airbnb”. – Tim Farron, MP
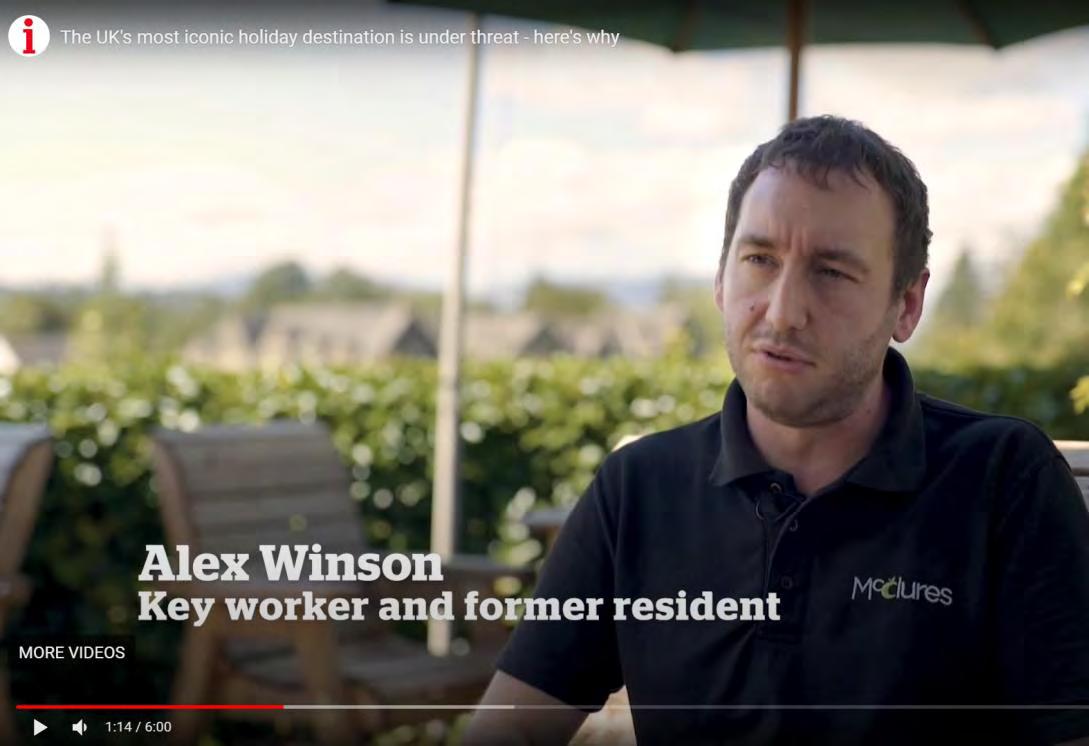
“As a working-class person, I don’t feel welcome in this area any more.” – Alex Winson 49
48 Written evidence submitted to Parliament by the Lake District National Park Partnership (supported by LDNPA) (LRB39)
49 https://inews.co.uk/news/if-youve-got-money-you-can-stay-the-lake-district-residents-forced-out-by-holiday-lets-1844210
Mountain Rescue
Another impact of tourism on social capital is the impact on the Lake District’s Mountain Rescue Teams.
In 2018, the 12 volunteer mountain rescue teams dealt with 654 emergency call-outs, compared with 627 the previous year. Volunteers were called out 680 times in 2021.50
Lake District Search and Mountain Rescue Association chairman Richard Warren said volunteers had answered a “significantly bigger” number of 999 calls than in previous years... “It’s a growing trend and it’s a worrying trend”.51
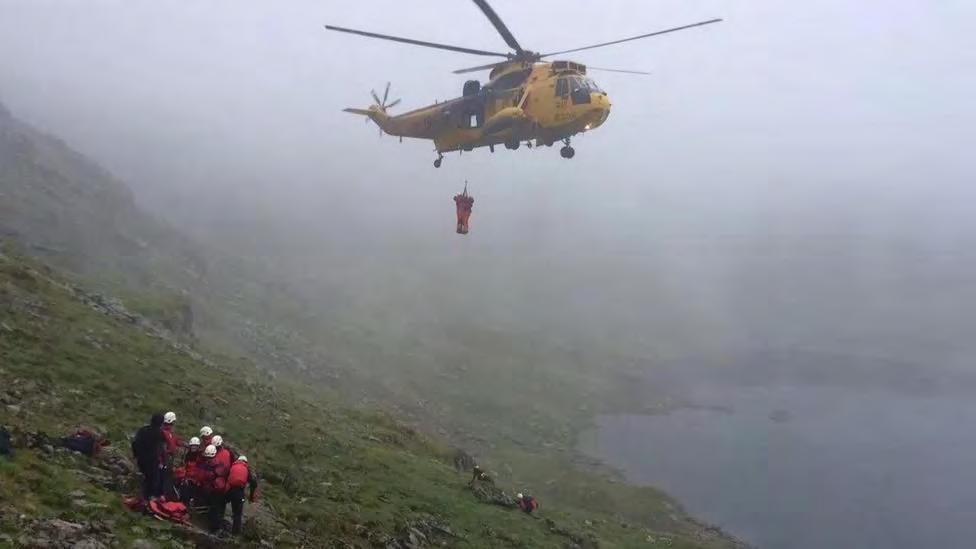
Call-outs by the ambulance service and police have risen from 474 in 2014, which was itself a rise of 10% on the 2013 figures.
To keep mountain rescue teams running requires around £750,000 across all the Cumbria teams. The teams raise all of this money themselves, as they receive no government or council funding.
50 www.bbc.co.uk/news/uk-england-cumbria-46730674
51 www.bbc.co.uk/news/uk-england-cumbria-59858501
Image source: Patterdale Mountain Rescue Team – www.bbc.co.uk/news/uk-england-cumbria-46730674
Transport
The Scale of the Problem
As seen previously, transport to the Lake District, is a significant cause of greenhouse gas emissions.
The latest figures from Cumbria Tourism show that:
• In terms of Cumbria as a whole, travelling to the area 65% of visitors came to Cumbria and the Lake District by car (internal combustion engine), 11% in motorhomes, 9% in electric or hybrid vehicles and 7% by motorbike. In total 91%arrived by private vehicle
• In terms of getting around the area: 71.7%travelled mainly by private vehicle, 5.9% of these were electric or hybrid. The second highest mode of transport was walking.
• In 2021/22, 57% of visitors to Cumbria came from within the North West region, compared to 32% in 2018. Of these, many visitors were more local to the county than in previous years. Almost a fifth (19.4%) were from within Cumbria itself, with another 18% from Lancashire, 12% from Yorkshire and the Humber.
• Broken down by day and staying visitors 64% of day visitors were from the North West region, with a third (34%) from within the county of Cumbria and another 21% from Lancashire. 45% of staying visitors were from the North West region.
The below figure demonstrates the increase in motor vehicles in Cumbria, though it should be noted that this relates to all traffic, not just tourist traffic.
TRAFFIC IN GREAT BRITAIN FROM 1993 TO 2022 BY VEHICLE TYPE IN VEHICLE MILES (MILLIONS)
Whilst historically significant, the long-term trends can be misleading in most cases due to the extraordinary circumstances observed as a result of the Coronavirus pandemic. Vehicle miles travelled in Great Britain have had year-on-year growth in each year between 2011 and 2019. Following a sharp decline in 2020, traffic levels in 2021 and 2022 increased, but 2022 levels still remain lower than 2016 levels. Therefore, to say traffic has fallen since 2016 would misconstrue as the overall decrease is entirely due to the decline in traffic levels observed during the pandemic.
Key All Motor Vehicles Cars and Taxis
Annual Traffic by Vehicle Type in Cumbria
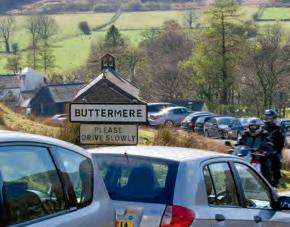
Impact of Car Use
There are a number of issues associated with increased reliance on private car:
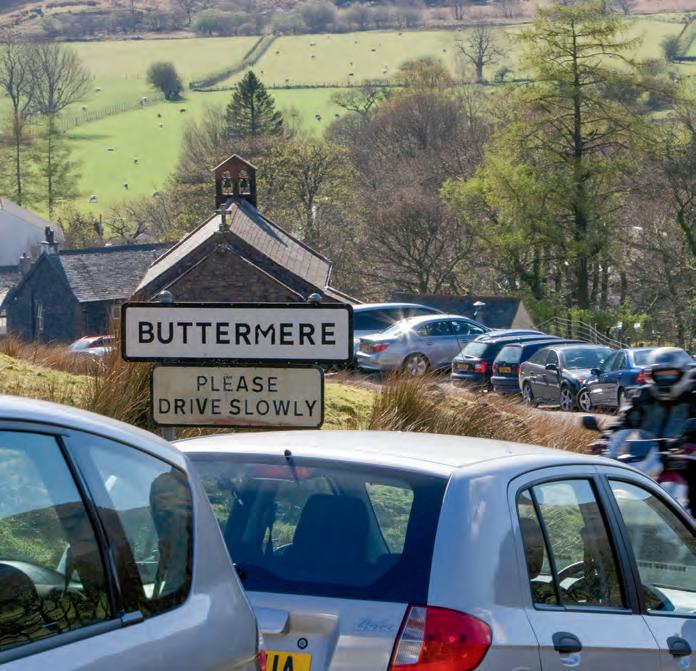
Car use is the source of local environmental impacts such as pollution, noise, danger, congestion and physical damage, all of which lessen the attractiveness of an area for tourists and residents.52
“It’s not just the climate and congestion issues, it is also that the lichens are dying from emissions, and the otters are washed out by the tarmac, leading to increased runoff rates, and the bats are disturbed by the lights.” – Dr Julie Carter 53
Access for emergency services can also be hindered by cars parking on verges.54
The Honister bus is often unreliable because its route blocked by inappropriately parked vehicles.55
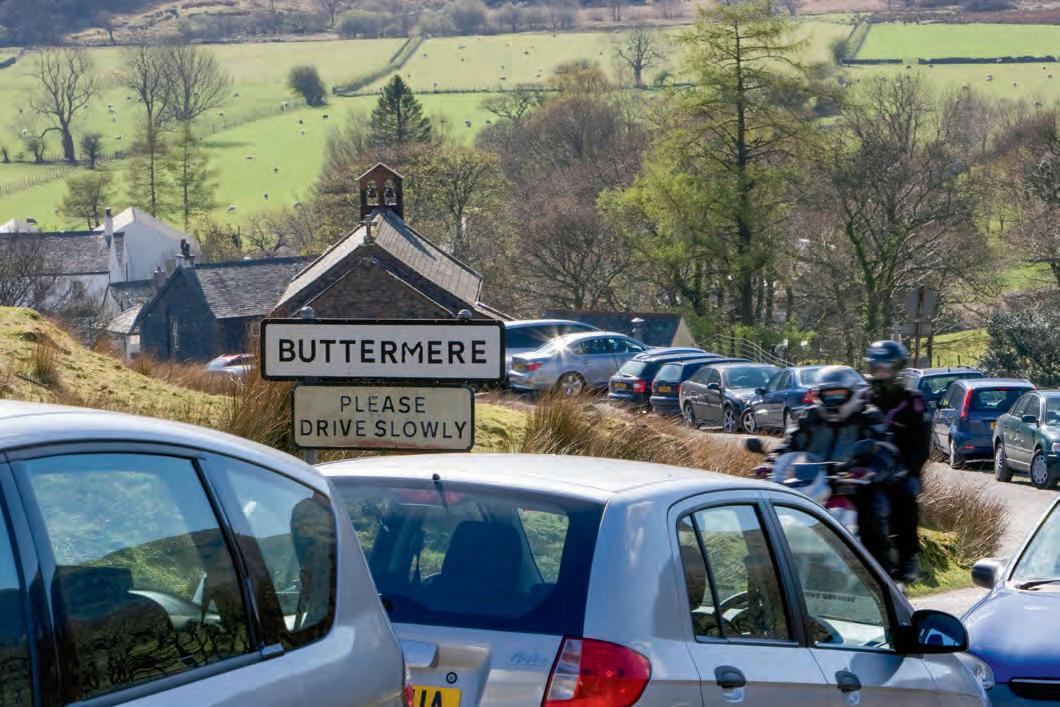
The situation is summed up by the Cumbria 2037: Decarbonising Mobility Futures Report:
“At peak times cars dominate the landscape as visitor numbers increase at popular hotspots, impacting on the lives and livelihoods of those working and living in the area. This influx of vehicles damages the landscape and creates tensions between locals and visitors, which negatively affects the visitor economy. At the same time the lack of an integrated public transport network also deters those without cars from visiting the area... [Although] electric cars are becoming more widely adopted, this will not solve the congestion problem”. 56
52 Guiver and Stanford, (2013)
53 www.theguardian.com/uk-news/2021/nov/14/tourists-cars-may-be-banned-from-most-popular-parts-of-lake-district
54 www.newsandstar.co.uk/news/19340167.emergency-services-issue-parking-plea-wasdale-head-congestion-lakes
55 https://keswickreminder.co.uk/2023/06/13/anti-social-parking-brings-lake-district-bus-services-to-standstill
56 https://decarbon8.org.uk/instant-journal-cumbria-2037
Research
The Financial Cost
As stated previously, the Lake District’s 29.2 million visitor days relates to an effective extra population of about 80,000 which is more than double the Lake District’s resident population of about 39,000. However, funding for the Lake District’s Transport Authorities is linked to resident population.
In 2018 Cumbria County Council stopped all subsidies to bus services. Compare this with the £722m spent on bus subsidies in London.
Concessionary Bus Pass Use (ENCTS)
These provide free off-peak bus travel to people over state pension age or with a disability. In the Lake District, many users are from outside of the area, yet the Transport Authorities only receive reimbursement as a proportion of their resident populations. This means the Transport Authorities need to find the difference – to pay for ENCTS use by visitors from their own budgets..
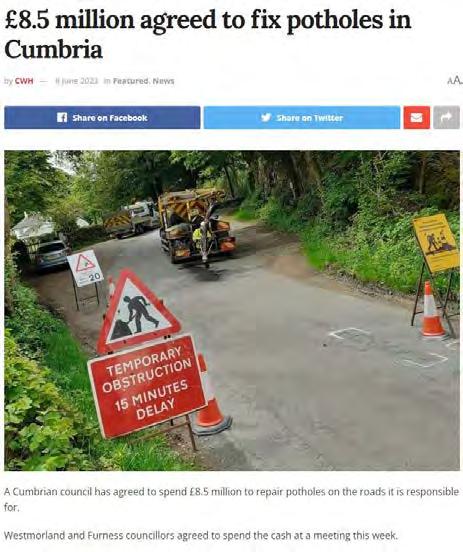
Highways Wear and Tear
According to a recent news article,51 Westmorland and Furness councillors have agreed to spend £8.5 million to repair potholes on roads that they are responsible for.
“...our highways are in a state because we do not get a penny from the government to compensate for any one of the cars that those 20 million people visit us in. Is it time that the government gave a funding formula to Westmorland and Furness Council, and Cumberland Council, that takes account of the fact that our roads, and indeed our hospitals, doctors services and police services, are used by others, and not just by ourselves?” – Tim Farron, MP
Electric Vehicles
A £1.4m bid has been approved to install a network of EV charge points in the Lake District. The project is funded by the government and topped up to by almost £500,000 by private charge point installers and operators.57
57 https://crig.org.uk/2023/03/01/cumbria-partnerships-successful-bid-to-drive-forward-electric-vehicle-charge-points/
The Community Voice
This section concludes by highlighting the opinions of the local community.
Summary of findings from the Lake District Communities and World Heritage Status – exploring the opportunities and challenges (ACTion with Communities in Cumbria and Lake District National Park Partnership58) found that:
• Expensive housing and the impact of second homes and holiday lets were frequently cited as areas of concern. There is concern that the planning system is not working for the benefit of those who live and work in the Lake District and is causing tensions in the outlying areas where the National Park borders another planning authority with different rules.
• Poor travel infrastructure is a major concern for an area with so many visitors. Those who are living and working in the area see no alternative to car ownership, and they are troubled by the volume and nature of visitor traffic – not, when clarified, by the visitors themselves.
• There is an underlying concern about environmental damage caused by any increase in visitor numbers. This encompasses physical erosion on footpaths, uninformed use of the countryside (including littering and fouling) and climate change factors associated with international air travel and reliance on cars.
On behalf of the Lake District National Park Partnership, ACT carried out an online survey, collecting data from 255 local people between 13th February and 18th March 2019. The aim was to generate conversation between communities and agencies, to foster working relationships in order to tackle some of the difficult issues facing Lake District communities.
Below are some initial headlines from this survey:
• 81% of respondents agreed that World Heritage Status provides an opportunity to develop the international visitor profile of the Lake District.
• 76% of respondents agreed that “Parts of the Lake District are full. Our infrastructure cannot cope with more visitors.”
• 75% of respondents agreed that Hill Farming is at the heart of World Heritage Status and is a way of life which must be protected.
Respondents were asked to identify high and low priorities, from a list of eight
1. Reducing the impact of second homes and holiday lets in rural communities (81%)
2. Improving transport links for people coming to, and moving around, the Lake District (80%)
3. Investing in rural skills (79%)
4. Protecting Lake District villages from over-development (76%)
58 www.cumbriaaction.org.uk/resources/research-other/pub0262019-06lakedistrictcommunitiesandwhsreport.pdf
How to Pay? Tourist Tax and Levies
This section of the report looks at ways in which additional revenue can be raised to pay for the externalities created by tourism.
There are a number of ways of referring to this additional revenue raising, such as visitor revenue capture, visitor levies, tourist levies, ecolevies, entrance fees and permits, occupancy taxes, bed taxes, congestion charges and so on. The term used in this report to cover all these terms is “tourism tax” and it should be assumed that this includes a broad range of mechanisms for collecting additional visitor revenue.
This section looks at some general principles of tourist taxation and attitudes towards this.
Tourist Taxes in Europe
Tourism taxes are used widely throughout the world and are considered “an effective means of internalizing external costs and deriving equitable benefits from tourism for the host community” – Kato et al, cited in Göktas and Çetin (2023)59
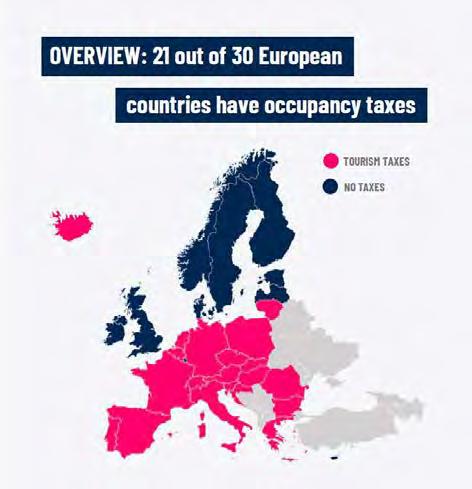
According to a recent report on tourism taxes in Europe, “Tourism-related taxation is widespread across Europe. In the latest snapshot from 2020, 21 out of 30 European countries covered in Nao Group research have occupancy taxes (bed taxes), while only nine do not. The countries that do not tax are mainly found in the Nordics and Baltics.”60
Since the Nao Group publication, Britain can be added to the list of destinations that have a tourist tax. Overnight visitors to Manchester now pay £1 + VAT per room or unit per night, administered through the Manchester Accommodation Business Improvement District (ABID). Both Scotland and Wales are considering the introduction of a tourist tax.
Beyond Europe tourism taxes are used widely and can be found in North and South America, Africa, Asia and Australasia.
59 www.researchgate.net/publication/371634431_Tourist_tax_for_sustainability_Determining_willingness_to_pay 60 https://groupnao.com/tourism-taxes-by-design
Types of Tourist Tax and Levies
In the UK, tourism is a significant contributor to the UK Exchequer. Revenue is raised from taxes such as Air Passenger Duty, VAT, corporation tax and income tax. This revenue is not ringfenced for tourism purposes and is used for general government expenditure.
There are options to raise revenue which can be ringfenced to address the externalities of tourism.
Typically, these levies are raised from the following three options:
• Voluntary levies such as visitor payback schemes which give visitors the choice to opt-in or opt-out of a voluntary contribution. Research exploring options for a visitor levy in London found that the revenue raised by voluntary schemes falls well short of mandatory levies.61
The focus of this report is on mandatory levies as these have the greatest financial impact. These are categorised as:
• Levies requiring new primary legislation. These includes occupancy taxes
• Levies with existing primary legislation such as congestion charges
• Income raised through the introduction of a Business Improvement District (BID) or Tourism Business Improvement District (TBID).
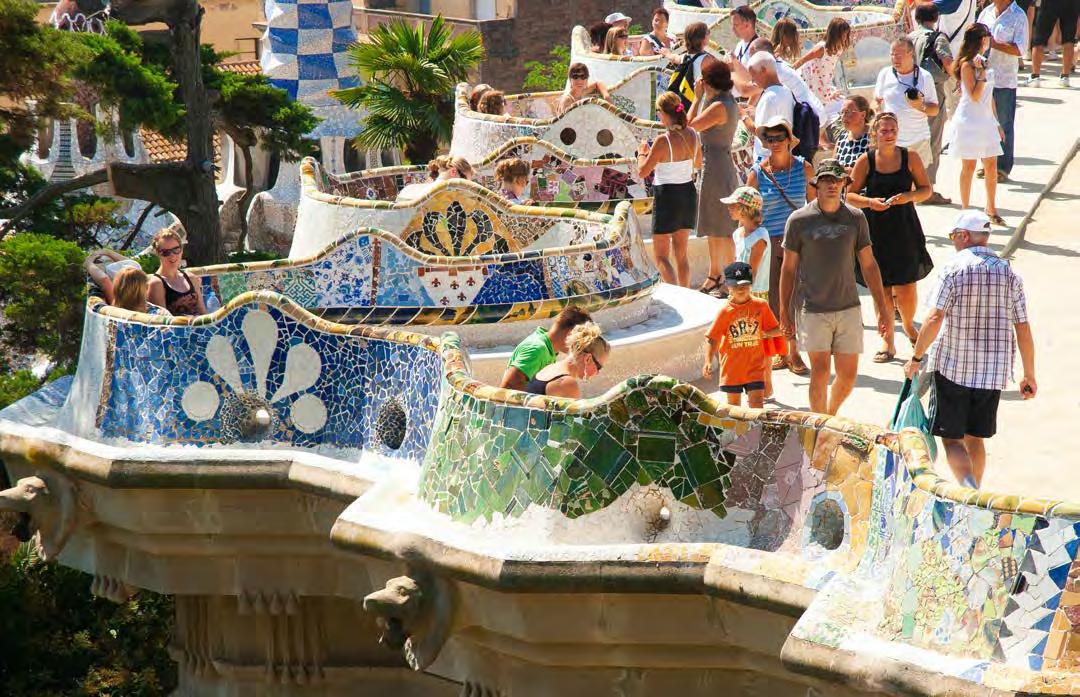
Barcelona: administering a tourist tax since 2012
Primary Legislation: e.g. Occupancy Tax
The most frequently used type of tourist tax is an occupancy tax charged on a hotel room. There are different variations in the way this is collected. For example, the charge may be per person or per room, it could be a flat-rate fee or it could be a percentage of the room charge (both of which may vary according to the star-rating of the hotel). The tax could apply to all nights spent in the hotel or be capped after a certain number of nights are spent in the hotel.62
Charges may also vary according to seasonal demand with higher taxes charged at the busier times of year.
Examples are:
• Variable flat fee e.g. Paris charge per person per night, rates vary by the star rating of the hotel
• % of room rate, e.g. Berlin’s City Tax is 5% of the net room rate
• Non-variable flat fee, e.g. €2 per night Bruges.
BIDs and TBIDs

A Business Improvement District is described as “a partnership between a council and local businesses. The basic concept is that selected non-domestic ratepayers in a defined area are charged a levy, usually in the form of a percentage of the rateable value of a ratepayer’s property. The funds arising from the levy are ring-fenced for a specific purpose within the BID area. A BID can be applied to a specified class of property, e.g. a retailer. Non-domestic ratepayers who would be liable for the proposed levy get to vote on the BID proposal in a ballot.” 63
Tourism Business Improvement Districts or TBIDs are very similar to a BID. The legislation, setting up, ballot, and management arrangements are all identical to BIDs. To better focus on the tourism economy TBIDs can cover a wider geographic area (crossing local authority boundaries) and can select the levy arrangements and activities.
The options for levies are as follows:
• Flat rate per night occupied
• % of rateable value
• % of revenues, for example a 1% levy on room and admission ticket sales
• A levy based on historical business performance data
• A levy based on £/customer, possibly with different categories for hotels and attractions.
TBIDs which are based in predominantly touristic areas are often just referred to as BIDs.
62 www.local.gov.uk/publications/tourist-levy-what-where-and-how
63 https://coastaltourismacademy.co.uk/resource-hub/resource/business-improvement-districts-why-create-one
Image: Bruges
The expenditure from TBID programmes, which are locally determined, are likely to fall into five categories:
1. Sales and marketing campaigns such as advertising, PR, field sales and online marketing.
2. Research such as customer research, business trends, and brand mapping.
3. Business support such as technical advice, training and networking.
4. Tourism services such as visitor services, festivals and events, guiding and information.
5. Capital investment to fund infrastructure projects.64
BIDs to Fund Green Infrastructure
Recent research has looked at the role of BIDs in London as a way of addressing Local Authority funding deficits and enabling the funding of investment in Green Infrastructure. The research states:
“Business Improvement Districts (BIDs) are one set of stakeholders that potentially have a role to play in addressing funding deficits. As subscriber funded organisations, they work at a local level to enhance economic prosperity, as well as delivering socio-cultural and ecological enhancement in identified urban areas”.
The case is made that BIDs can act as critical advocates for Green Infrastructure planning when this aligns with local economic objectives.
The paper concludes that the organisational structure of BIDs combined with a focus on local economic development enables them to work alongside Local Planning Authorities and deliver investment that might otherwise have been delayed due to procurement, political, or financial constraints.
BIDs, therefore, can “act as entrepreneurs addressing locally prescient issues associated with climate change and air quality, all while promoting economic activity”.
– Moore and Mell (2023)65
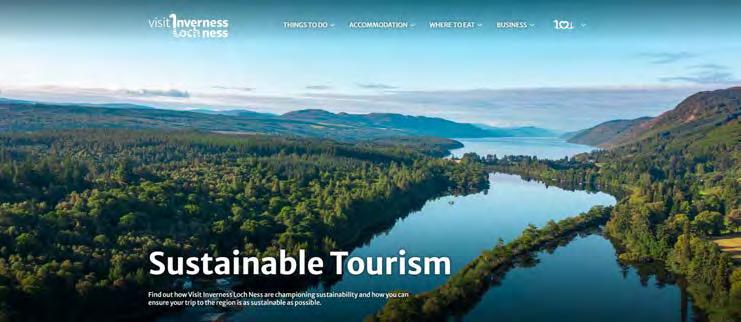
BIDs can also be used for furthering sustainability aims.
In 2022 the TBID Visit Inverness Loch Ness was named as the first carbon neutral BID in the UK and has also signed the Glasgow Climate Declaration and the Tourism Declares a Climate Emergency declaration in line with its sustainability goals. See www.visitinvernesslochness. com/sustainable-tourism
64 https://destinationthink.com/wp-content/uploads/2016/10/intro_to_tbids.pdf
65 www.sciencedirect.com/science/article/pii/S1618866723000754
Process for Additional Tourism Revenue Capture
The process for developing and raising additional tourism revenue can be understood from the diagram66 below which outlines the key stages.
1
Decide on mechanism for revenue capture e.g. via legislation; voluntary scheme
2
Conduct assessment of economic impact of mechanism
3
Agree destination of the revenue e.g. local amenity services; marketing; environmental enhancements
Attitudes to Taxes
4
Decide on charging structure e.g. flat fee; percentage fee
5
Design system for collection and administration of revenues
In considering the introduction of a tax, it is important to take into account the views of different stakeholders. Whilst not exhaustive, recent research is presented below from two relevant examples – the case of Edinburgh and of Wales.
Both Edinburgh and Wales are considering the introduction of a tourism tax – a ‘visitor levy’ in Wales and a ‘transient visitor levy’ (TVL) in Edinburgh. Both destinations have undertaken research with stakeholders to better understand their attitudes to proposed tourism taxes. In both cases the mechanism of taxation would be an occupancy tax.
Edinburgh
Edinburgh consulted industry stakeholder and residents and found that 85% of all respondents expressed strong support for the introduction of a TVL in Edinburgh. The majority of all category stakeholders supported the introduction of a TVL in the city: 67
• Edinburgh residents – 90%
• Edinburgh businesses – 77%
Other research canvassed opinions from consumers and found that. When consumers were asked what effect a tourist tax would have on their overnight stays in Edinburgh, three out of every four visitors to Edinburgh said that a tourism tax would have no effect on their stay.68
• Edinburgh tourist attractions – 67%
• Edinburgh accommodation providers – 51%
Impact of £1-2 tourist tax on overnight stays in Edinburgh
No change; would still visit 75%
Would not have visited Edinburgh at all 2%
Would have stayed outside the city 6%
Would have stayed in cheaper accommodation 9%
Not sure 7%
66 Adapted from: www.local.gov.uk/publications/tourist-levy-what-where-and-how
67 https://consultationhub.edinburgh.gov.uk/ce/tvl/user_uploads/tvl-consultation-report.pdf
68 https://str.com/article/tourism-tax-blessing-curse
Wales
The key findings from the Welsh survey exploring the attitudes of consumers and residents to a proposed visitor levy.69
Key findings
Key findings
1. A majority (58%) of the UK public agree that tourists should contribute towards the costs of maintaining and investing in the destinations they stay in, rising amongst people with lots of tourism in their area – in Wales (66%) and the UK (72%). Very few (13%) disagree with this.
1.A majority (58%) of the UK public agree that tourists should contribute towards the costs of maintaining and investing in the destinations they stay in, rising amongst people with lots of tourism in their area – in Wales (66%) and the UK (72%). Very few (13%) disagree with this.
2. When introduced to the concept of a ‘visitor levy’ in a place where they go on holiday or in their area, the UK public were more positive than negative – 45% were positive, and 25% were negative. Again positivity increased amongst people with lots of tourism in their area.
2. When introduced to the concept of a ‘visitor levy’ in a place where they go on holiday or in their area, the UK public were more positive than negative – 45% were positive, and 25% were negative. Again positivity increased amongst people with lots of tourism in their area.
3. Although reactions were more positive than negative, it’s important to note that when the visitor levy was turned from an abstract commitment (i.e. for tourists to contribute to tourism areas) to a tangible concept (an actual visitor levy in areas they visit or live in), negativity does increase, and for some respondents, negativity was visceral. Furthermore, for those with lower household incomes, positivity drops significantly, suggesting financial means are a driver of a positive response.
3. Although reactions were more positive than negative, it’s important to note that when the visitor levy was turned from an abstract commitment (i.e. for tourists to contribute to tourism areas) to a tangible concept (an actual visitor levy in areas they visit or live in), negativity does increase, and for some respondents, negativity was visceral. Furthermore, for those with lower household incomes, positivity drops significantly, suggesting financial means are a driver of a positive response.
4. Not all objections related to personal financial means. The qualitative research indicated some objected on principle – ‘paying to travel in their own country’, ‘lack of understanding of the details’, ‘regional reputation’, ‘national reputation damage’ and ‘concern for local business’ (particularly those that locals also used) all mentioned. Positively, however, the qualitative research indicated that explaining the reasoning behind the levy and adding clarity to what it would look like, helped allay some negativity.
4.Not all objections related to personal financial means. The qualitative research indicated some objected on principle –‘paying to travel in their own country’, ‘lack of understanding of the details’, ‘regional reputation’, ‘national reputation damage’ and ‘concern for local business’ (particularly those that locals also used) all mentioned. Positively, however, the qualitative research indicated that explaining the reasoning behind the levy and adding clarity to what it would look like, helped allay some negativity.
5. Almost all subgroups felt it was very important that they be told where the funds would be spent, particularly Wales residents who have lots of tourism in their area. ‘Protecting the local environment’ and ‘maintaining local services and infrastructure’ were the main ways in which both holiday-makers and locals felt funds should be spent, although the order of priority changed between the two.
5.Almost all subgroups felt it was very important that they be told where the funds would be spent, particularly Wales residents who have lots of tourism in their area. ‘Protecting the local environment’ and ‘maintaining local services and infrastructure’ werethe main ways in which both holiday-makers and locals felt funds should be spent, although the order of priority changed between the two.
6. A range of ideas were put forward to ensure the levy is a success – including trialling in busy destinations, being accountable for funds raised, relabelling as an environmental tax, launching with other destinations and waiting until the cost-of-living crisis has lifted before launching.
6.A range of ideas were put forward to ensure the levy is a success – including trialling in busy destinations, being accountable for funds raised, relabelling as an environmental tax, launching with other destinations and waiting until the cost-of-living crisis has lifted before launching.


Image source: www.gov.wales
It is interesting to note that the majority of respondents support that tourists should support the cost of maintaining the destination, though this support drops when specifically phrased as a ‘visitor levy’. Respondents want to know how the money will be spent; levies might be more acceptable to the public if labelled as an environmental tax.

Image source: https://groupnao.com/tourism-taxes-by-design
ARE TOURISM TAXES THE ANSWER?
Destination Management Organisations (DMOs)
As part of their White Paper on tourism taxes, Nao Group surveyed 67 European city DMOs in the summer of 2020. The headlines from that research are as follows:
the survey agree that revenues from tourism taxes are importantto secure funding for marketing and destination development More than 70% see tourism taxes asa legitimate way to regulate thenegative impact of tourism. The latter is aparadox, sincethe DMOsalso differ somewhatintheiropinions about whether tourism taxes are effective tools to regulate visitorflows - oreven todeter visitors altogether On one side, 63 %disagree that tourism taxes have a negative impact on visitornumbersand 75%report consumers tendnot tocare much about the taxes On the other hand 50% of DMOsalso agree that tourism taxescan (and sometimes should) be used toreduce visitornumbers to the destination.
70% see tourism taxes as a legitimate way to regulate the negative impact of tourism
63% disagree that tourism taxes have a negative impact on visitor numbers
The central argument, that tourism taxescaps demand and hurts the competitive position of the destination, is oneDMOs generally disagree upon Two thirdsdo not believe that tourism taxes (under normal circumstances) have a negative impact on thenumber of visitors to the destination. Fifty four percent believe that tourism taxes generally do nothurtthe competitivenessof the destination, and roughly a third believe thatthey can
Two thirds do not believe that tourism taxes have a negative impact on the number of visitors to the destination
Looking forward, there iswide-spread agreement among the DMOs that tourism tax, tariffs and levies are a pivotal way to regulate andfinancethetransition to carbon-neutral andsustainable tourism. Assuch,they must betargetedat the most non-sustainable tourism such as air travel andcruiseships (60%).
54% believe that tourism taxes generally do not hurt the competitiveness of the destination
60% believe that taxes should be levied from the most nonsustainable tourism activities.
– Group Nao, DMO Funding Survey (2020)
The Tourism Alliance report “Taxing Tourists”70 is often referred to when UK tourism organisations push back against additional visitor taxes on the basis that UK tourists have a higher tax burden than most of Europe. However, it’s worth looking at the recommendations arising from that report which concludes that visitor payment: “is not being recycled into the maintenance and development of the resources on which the UK tourism industry is based”.
According to the report, the solution is a reformulation of the way in which tourists in the UK are taxed:
“Therefore, the most appropriate course of action would be to reformulate the taxation of UK visitors so that there is a more equitable distribution of revenue between central and local government. One of the reasons that local government are often keen on implementing a tourism tax is that the high level of taxation paid by tourists currently is not felt locally. A redistribution of this tax take in order to assist local authorities pay for the services used by tourists, to invest in tourist assets, to fund tourism marketing, and to grow and support the visitor economy in their area, would be widely welcomed.”
This is an acknowledgement by the industry that tourism can have a negative impact on areas with significant visitor numbers, and that it needs to be addressed by a redistribution of resources to support those areas which welcome high numbers of tourists.
70 https://tourismalliance.com/wp-content/uploads/2023/09/Tourism-Alliance-Tourism-Taxation-Report-FINAL-FOR-PUBLICATION.pdf
How to Pay? Case Studies
This section presents five case studies that outline different mechanisms for collecting tourist taxes.
The first three case studies describes examples were are aimed specifically at revenue collection from tourists.
The final two case studies are not aimed specifically at tourists but could potentially be useful mechanisms for tourist taxes.
Case Study One: Occupancy Tax, the Balearic Islands
The Balearic Islands have administered a tourist tax since 2016. The following figure71 gives an overview of the key achievements of the tax.
Why an Occupancy Tax?
Prior to the introduction of the tax there were a number of issues facing the Balearic Islands which the tax helps to address. These included:
• Issues of traffic management and congestion
• Unaffordable housing
• Solid waste
• Sewage
• Footpath trampling

In Majorca there is an uneven ratio of residents to visitors which may exacerbate the issues. Over 13 million passengers arrived by plane to Mallorca in 2016, up from around 11 million in 2015. Mallorca at that time had a population of less than one million and almost two million passengers arrived by plane per month over the summer months.72
Biel Barcelo, vice president of the Balearics coalition government described the tax is ‘absolutely necessary’ to conserve the environment.
Image source: https://cafebabel.com/en/article/mass-tourismin-mallorca-trouble-in-paradise-5ae00bf4f723b35a145e8195
How are taxes collected and how much is raised?
The figure73 below illustrates the amount of tax which is paid. It is variable according to the type of accommodation and to high or low season. Children under 16 and cruise ships with a home port in the Balearics are exempt. The fee is reduced by 50% from the ninth day of any stay in the same establishment.
K
72 https://cafebabel.com/en/article/mass-tourism-in-mallorca-trouble-in-paradise-5ae00bf4f723b35a145e81955
73 Adapted from: www.illessostenibles.travel/en/sustainable-tourism-tax/tax-amount-and-exemptions
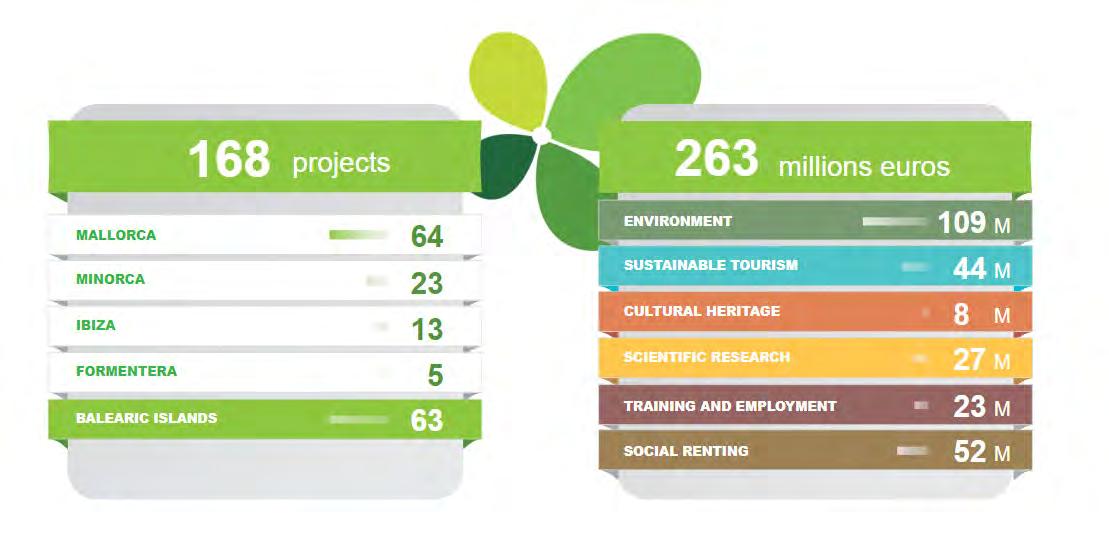
What is the Money Spent on?
The fund74 is used to subsidise Sustainable Tourism projects in the following categories:
01. Environment
The protection, preservation, modernisation and recovery of the natural, rural, agricultural and marine environments refer to, for example, improvements in protected natural parks and the effort to conserve natural ecosystems and native flora and fauna.
02. Sustainable Tourism
The promotion of deseasonalisation (i.e. tourism throughout the year rather than just in the summer months), the creation and activation of possible tourist products for the low season, and the promotion of sustainable and low season tourism, which can be achieved through projects such as the recovery of cycling and hiking routes, with better signposting, in order to boost deseasonalisation.
03. Cultural Heritage
The recovery and rehabilitation of historical and cultural heritage. The purpose of the tax here is for historical buildings or elements with archaeological value to be reformed and made more accessible in such a way that the cultural heritage of the islands can be maintained and the Balearic Islands’ history and culture made known.
04. Scientific Research
The promotion of scientific research projects, technological development and innovation (R+D+I) which contribute to economic diversification, the fight against climate change or are related to the tourism sector. In this sense, investment will be made to continue the process of acting as a leading area in the tourism sector.
05. Training and Employment
The improvement of training and quality of employment available as well as increasing employment in the low season. The aim is to create qualified job positions and improve working conditions through active measures that will optimise the training for service sector jobs, for example, by means of a more varied offering of vocational training courses.
06. Social Renting
Investment in the acquisition and rehabilitation of housing for social renting with a criterion of energy sustainability so as to directly allocate the income generated from tourist stays to a housing policy and the extension of the public rental area.
What is the Tax Spent on?
The Commission for the Promotion of Sustainable Tourism of the Balearic Islands is responsible for analysing, assessing and selecting the projects corresponding to actions submitted by the administrations and the rest of the entities that make up the Commission, which are to be paid for from the Promotion of Sustainable Tourism Fund.
Number of Projects per Purpose and Island
Amounts per Purpose and Island
Mallorca Minorca
Ibiza Formentera
Minorca Mallorca Ibiza Formentera
Research commissioned by Friends of the Lake District
One project of note is the allocation of €5,163,434 for the development of social housing.
The aim of the housing programme is to alleviate the collateral effects of tourism. The project will provide elderly people with social housing and a day centre.
The day centre and the premises are on the ground floor, with the homes located on the first, second and third floors. The homes are being designed with a layout to ensure that they all have sea views. They are also oriented to take into account the sunlight and sea breezes in summer.
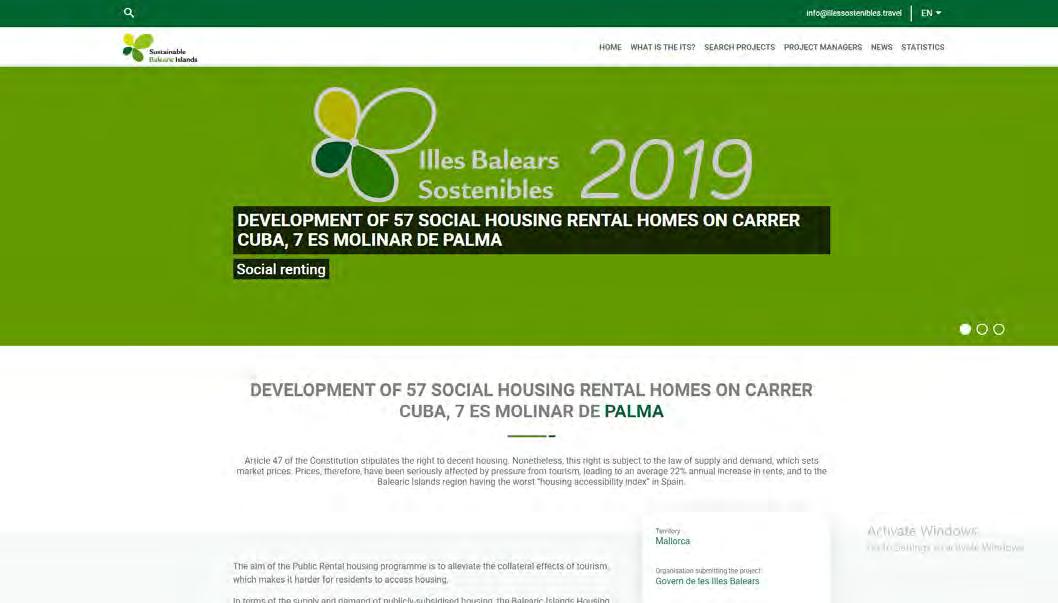
The housing will have close to zero energy consumption (nZEB) in order to comply with the EU’s 20/20/20 energy goals, which in Spain equates to an A-class rating for residential buildings.
The full range of all the projects associated with the fund can be explored in further detail here: www.illessostenibles.travel/en/financed-projects/search
What is the Impact?
Visitor Numbers and Visitor Spend
The following two figures track visitor arrivals and spending since prior to the introduction of the tax in 2016. There were concerns that the tax would affect arrival and expenditure. There does not appear to be a reduction in either measure since the tax was introduced.
Number of Tourist Arrivals in the Balearic Islands, Spain from 2010 to 2022, by Main Origin (in Millions)
Expenditure of International Tourists in the Balearic Islands, Spain from 2010 to 2022 (in Billion Euros) Shows No Decline in Spend Since the Introduction of the Occupancy Tax in 2016
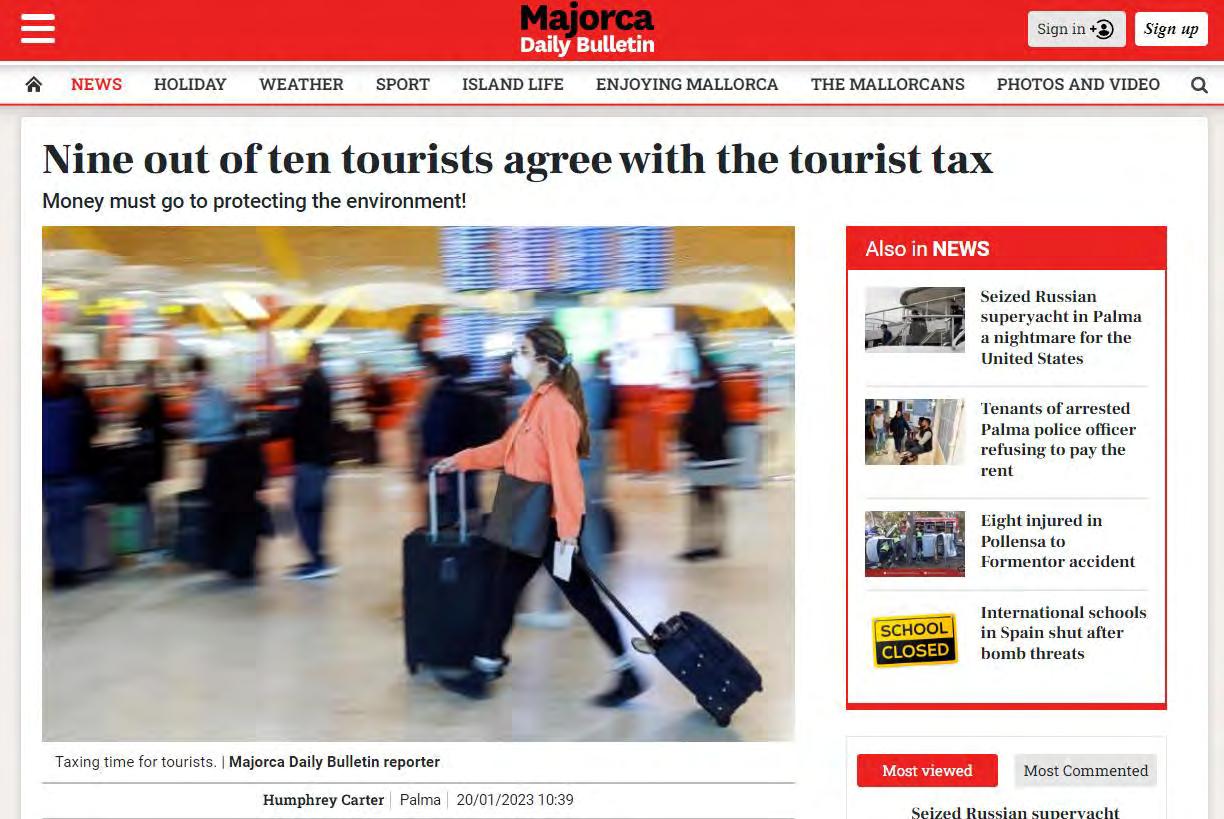
How has the Occupancy Tax been received by visitors?
According to a study by the Balearic University (UIB),76 89.8% (practically nine out of every 10) of tourists who visit the Balearics supports paying more for accommodation if it helps to finance measures to offset or reduce emissions.
The study was carried out between August and September 2022 at Palma airport and 1,530 tourists of 18 different nationalities were interviewed.
76
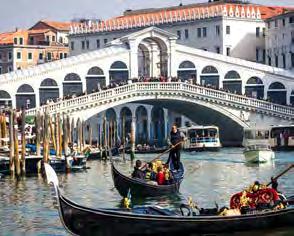
Case Study Two: Day Visitor Tax, Venice
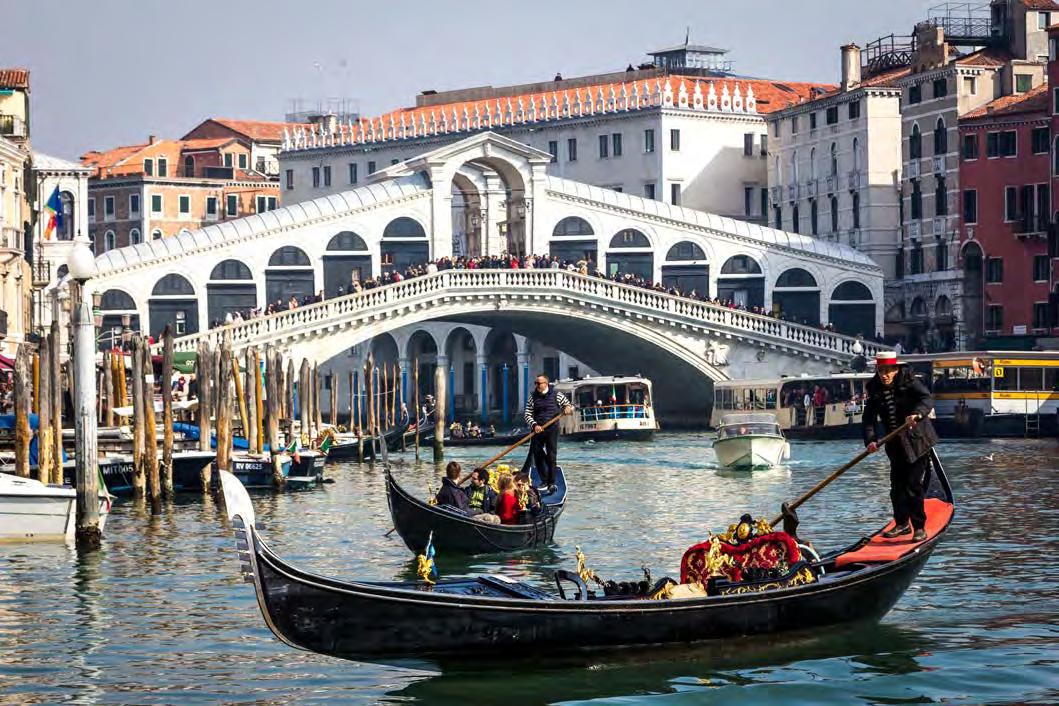
“Though still proudly known as La Serenissima, ‘the most serene’, Venice on a typical day is anything but.” 77 Venice already has an overnight occupancy tax and introduced a tax on day visitors between January and July 2024 as a way of investigating whether an entry tax would help solve the problems that the large numbers of tourists cause.

Why an Entrance Fee?
The city is just 2.7sq miles and attracts 20 million visitors a year. 80% of visitors come for just one day. This results in the following impacts:
• Noise disturbance and nuisance behaviours
• Limited employment opportunities
• Increase in solid waste
• Overcrowded conditions and congestion
• The closure of public services in education and healthcare due to a diminishing population
• The closure of local food and clothing stores, often transformed into tourism boutiques
• The conversion of resident accommodation into ‘sharing economy’ units (Airbnb or similar) and unaffordable housing.
Research commissioned by Friends of the Lake District
There are 55,000 permanent residents in Venice. By 2030, some demographers predict, there could be no more full-time residents.
According to Jonathan Keates, chairman of Venice in Peril, if the population falls below 40,000, Venice will not be a viable, living city any longer.
The United Nations cultural agency has recommended that Venice be added to the heritage danger list, saying that the city faced “irreversible” damage due to a litany of problems ranging from the effects of climate breakdown to mass tourism.78
Unesco said in a statement: “The effects of the continuing deterioration due to human intervention... and mass tourism threaten to cause irreversible changes to the outstanding universal value of the property”.
How and How Much?
Between January and July 2024 Venice trialled a ticketing system. Day visitors had to make an online reservation to visit the city on weekends and holidays totalling 29 days over this period.
The cost was €5 per person. Children, people visiting a relative or for medical reasons, those who live in the Veneto region, and anyone staying in the city for at least one night were exempt.
The city implemented a QR code as a proof of payment which was to be presented by the day tripper if challenged by an authority, possibly presented at certain key points within the city.
There were fines of €50-300 for those found to be violating the ticket rules and a criminal prosecution.

Image source: www.thestar.com/news/world/mock-funeral-bemoansdying-venice/article_d4830853-ede2-5375-9f47-0c07923d67d9.html
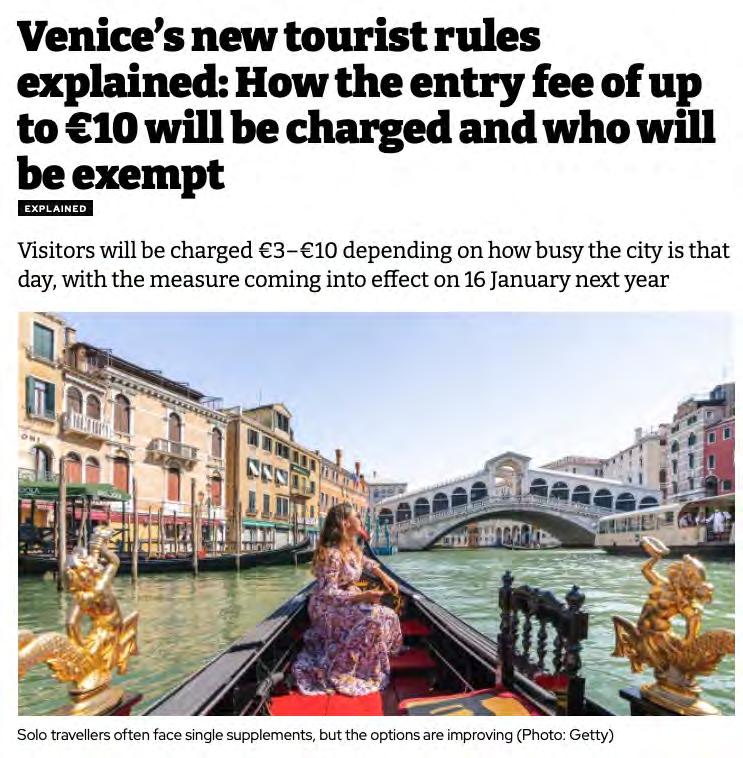
Image source: https://inews.co.uk/inews-lifestyle/travel/venice-newtourist-rules-explained-entry-fee-how-charged-who-exempt-1722052
What will the Tax be spent on?
Proceeds from the tax would be invested in the development of tourism management systems, such as the Venice Smart Control Room to gain more knowledge and control of tourism.
Authorities want to know the number, flows, and patterns of people in the city so that they might adapt policies and services to more effectively manage mass tourism.
78 www.theguardian.com/world/2023/jul/31/unesco-recommends-putting-venice-on-heritage-danger-list
In 2009 a mock funeral for the death of Venice was held

What was the Impact?
The Venice Smart Control Room,79 which aims to paint a portrait of tourism in Venice – opened in 2020, but still very much under development – this €3 million control system is financed by the European Union and the city council.
The Venice Smart Control Room aims to understand tourism flows in Venice, including the neighbourhoods and streets that are recurrently overcrowded and when; the nationality of tourists; the pressures on public transport and traffic, and much else.
The long-term objective of a Venetian entry tax is to encourage day-trippers to come during slower periods by adjusting the tax according to the season; to spread tourism throughout the year and to reduce crowding in the summer months. The outcome of the trial period still needs to be fully evaluated, but initial reports indicate that the tax raised €2.2 million. However it did not appear to decrease the number of day-trippers coming into the city, the numbers even rose slightly.80 The mayor of Venice is now looking at doubling the entry fee in 2025.81
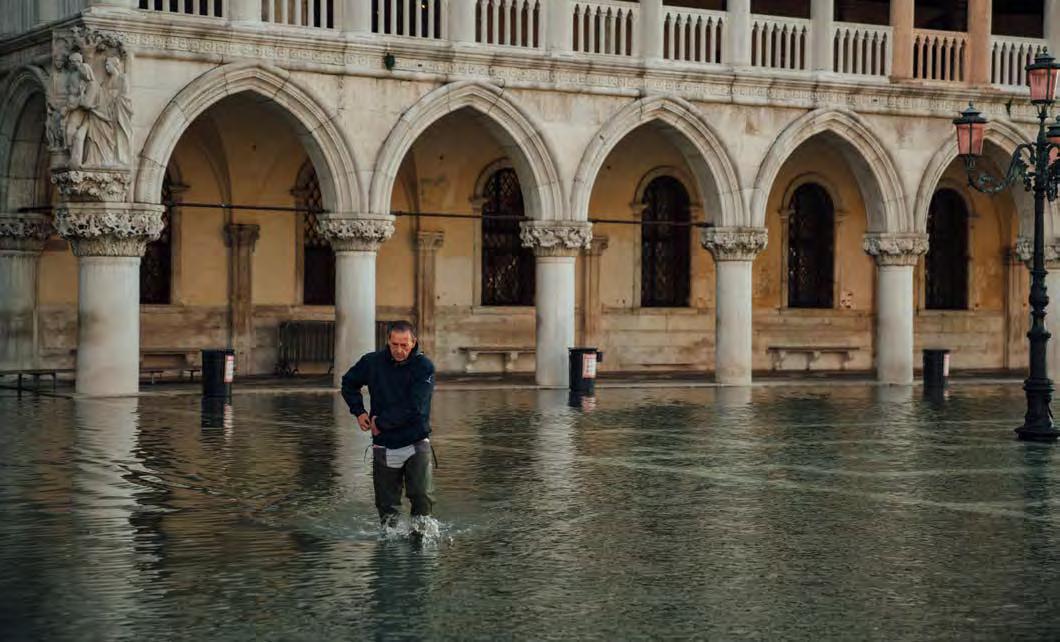
A Venice Smart Control Room screen representing the origin and number of tourists in the city
Case Study Three: Île de Ré Ecotax

Since 1988, the Île de Ré off the Atlantic coast of France has been linked to La Rochelle on the mainland by a 3km bridge.
An environmental tax was established on 01/01/2012 to cross the bridge to Île de Ré.82
“the aim of [the ecotax] is the preservation of the island. Indeed, the islands are fragile, and because we want to benefit from them for a long time to come, our common objective is to contribute to their protection.”

Île de Ré
How does it work?
All visitors (excluding main residents) pay a right of passage to finance environmental projects on the Île de Ré.
Half is used for the maintenance of the bridge and operating costs. The rest is distributed between the Department of the Community of Municipalities and the Municipalities.
An Ecotax Monitoring Committee, bringing together all the stakeholders concerned as well as State services, meets every year to examine the results of the actions undertaken.
The ecotax also finances the Respi Ré mobility network, the first French transport network in “clean” and “free” vehicles.
82 https://la.charente-maritime.fr/actualites/ecotaxe-du-pont-lile-re
Image:
How Much?
The Ré bridge is open all day every day and charges are as follows:
• The summer rate per car is €16 (June 20 – September 11)
• The winter rate per car is €8 (September 12 – June 19)
• Up to €40 is charged for class 4 vehicles (HGVs and coaches)
• Motorbikes are charged €3
The charge generates €13.8 million a year.

Image source: Electric bus, Île de Ré – www.holidays-iledere.co.uk/ practical-information/transports/bus-schedules-and-village-shuttles

Image source: www.francebleu.fr/infos/environnement/grandeurnature-l-azure-du-serpolet-un-papillon-protege-qui-prend-sesquartiers-pres-de-chabeuil-1595432968 – Clément Chauvet
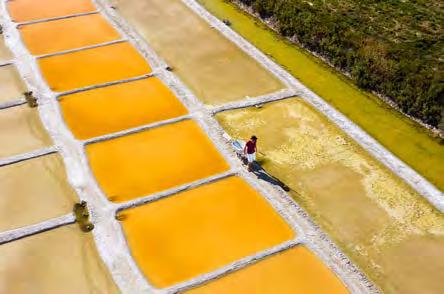
Image source: www.saltinourhair.com/france/ile-de-re
• Pedestrians and cyclists are free
• The return journey is exempt
• Residents are exempt.
What is the Tax spent on?
According to the law, it is intended for “financing [...] measures to protect and manage natural areas” as well as for the development, since 2009, “of public transport operating with clean vehicles.” 83
‘Clean’ public transport vehicles84 – Provision of free electric bus shuttle circuits and on-demand transport service access the entire island = nearly 200,000 trips per year. The general council and the community of municipalities each put €1.3 million into deploying the electric shuttles.
Land acquisition in order to preserve the environment and landscape for example the acquisition of plots in sensitive natural areas: more than 28 hectares in 2022.
Regeneration of degraded plots with 18 projects in 2022 (including for example the demolition of a building located on the wooded dune at La Flotte).
Maintaining, monitoring and managing biologically significant sites for example inventories and management plans for protected species such as Cultriped Pelobates, Azuré du Serpolet and different species of chiroptera (bats).
More than €2 million are used to maintain wetlands (cleaning of channels, protection of banks, fight against invasive plants, etc.) and woods, to pay 12 ‘ecoguards’ and to restore the dunes.
A success story is the return of eels to the marshes and the reintroduction of lobster.
The ecotax is also seen as a way of protecting the residents traditional way of life. This includes farmers and vineyards and salt workers (increased from 15 in 1980 to 80 today).
“80% of the island is unbuildable; without this ecotax, the real estate pressure would be so strong that we would not be able to fight. I refuse 90% of building permit requests.” – Lionel Quillet, president of the community of communes of Île de Ré mayor Loix village.
83 www.lesechos.fr/2017/06/lecotaxe-de-lile-de-re-une-manne-qui-fait-des-envieux-173492
84 https://la.charente-maritime.fr/actualites/ecotaxe-du-pont-lile-re

Case Study Four: Better Bankside BID
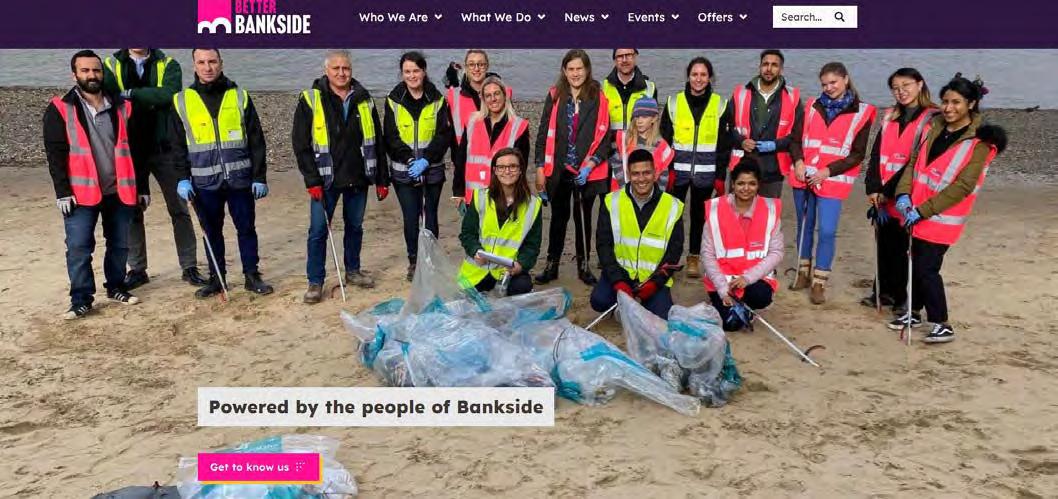
“Powered by the people of Bankside, Better Bankside leads innovative economic, environmental and social action to drive positive change in one of the world’s great neighbourhoods”.
The Purpose of the BID
Better Bankside is an example of a Business Improvement District (BID). It is a non-profit, independent company, led and funded by Bankside-based businesses.
Although not a Tourism BID it is located in the South Bank of London and includes a number of key visitor attractions and services such as Shakespeare’s Globe Theatre, The Tate Modern and Borough Market.
Established in 2005, Better Bankside was one of the first BIDs in the UK. It was established to respond innovatively to urban challenges. Their overall purpose is to make Bankside a better place to live, work and visit. The income raised by the BID is used to develop projects and services that benefit businesses and the neighbourhood and which are in addition to services provided by local authorities. There are three strategic work areas:
• Driving economic growth
• Energising the community into climate action
• Shaping a happy neighbourhood.
How and How Much?
The Bankside BID followed the typical process for establishing a BID:
• The area for the BID was defined and the BID was created through a ballot process with businesses in the defined area voting for or against establishing a BID.
• Every five years, businesses have the opportunity to vote on whether they want Better Bankside to continue.
• The BID is legally binding and businesses cannot opt out.
• Businesses with a rateable value of £26,000 and over become members of the BID and pay 1.13% of their rateable value.
• Charities have an 80% discount.
• Income is processed through the local authority.
Better Bankside BID generates an annual levy income of £1,957,000. In addition, the BID has a track record of levering additional investment from grants and external organisations. In 2015-20 they supplemented the levy with £2.5m in additional income.
The BID levy is a separate cost and is not included in business rates or council tax. The BID levy is used to provide extra services, on top of what the local council provides. The levy is used for services only in Bankside, so businesses and the local neighbourhood directly benefit from the investment.
As can be seen from the figure above, there is significant investment in environmental and sustainability schemes.
More detail can be found here: https://betterbankside.co.uk/who-we-are/what-is-a-bid
INVESTMENT IN BANKSIDE 2020-25
Better Bankside year business delegating theme groups, by representatives businesses, enterprising ensuring accountability participation. Full financial available betterbankside.co.uk If you would detail on would be

PAYS FOR THE LAKE DISTRICT?
Research commissioned by Friends of the Lake District
What is the Revenue Spent on?
The levy is used to develop projects and service which will benefit businesses and the neighbourhood. These projects are focussed around three work areas: people, business and environment. The work programmes are co-designed with local businesses and other stakeholders. Details can be found here: https://betterbankside.co.uk/what-we-do
1,000 BUSINESSES IN THE BETTER BANKSIDE COMMUNITY, INCREASED FROM 450 IN 2010
1,000 BUSINESSES
1,000 BUSINESSES
1,000
1,000 BUSINESSES IN THE BETTER BANKSIDE COMMUNITY, INCREASED FROM 450 IN 2010
1,000 BUSINESSES IN THE BETTER BANKSIDE COMMUNITY, INCREASED FROM 450 IN 2010
29M FOOTFALL
29M
29M FOOTFALL IN 2018, INCREASING YEAR ON YEAR
29M FOOTFALL IN 2018, INCREASING YEAR ON YEAR
29M FOOTFALL
IN 2018, INCREASING YEAR ON YEAR 275 TREES PLANTED
GOLD AWARD
IN RHS LONDON IN BLOOM 2017 AND 2018
300M3 OF SUSTAINABLE DRAINAGE INSTALLED
300M3 OF SUSTAINABLE DRAINAGE INSTALLED
300M3 OF SUSTAINABLE DRAINAGE INSTALLED
300M3 OF SUSTAINABLE DRAINAGE INSTALLED
300M3 OF SUSTAINABLE DRAINAGE INSTALLED
300M3 OF SUSTAINABLE DRAINAGE INSTALLED
275 TREES PLANTED
275 TREES PLANTED
275 TREES PLANTED
275 TREES PLANTED
835
835
835 TONNES OF WASTE DIVERTED FROM LANDFILL
97% OF BANKSIDERS AGREE THIS IS A GOOD PLACE TO WORK
21,500M2
21,500M2
21,500M2
21,500M2 OF PUBLIC SPACE IMPROVED 97% OF BANKSIDERS AGREE THIS IS A GOOD PLACE TO WORK
21,500M2
21,500M2 OF PUBLIC SPACE IMPROVED
£8M
£8M EXTERNAL FUNDING SECURED
£8M EXTERNAL FUNDING SECURED
4,000 TONNES
4,000 TONNES
1ST BID TO SECURE THE GREEN FLAG AWARD 2018 AND 2019
1ST BID TO SECURE THE GREEN FLAG AWARD 2018 AND 2019
97%
97% STREET CLEANLINESS RATING IN INDEPENDENT
97% STREET CLEANLINESS RATING IN
97% STREET CLEANLINESS RATING IN INDEPENDENT AUDIT
AUDIT 835 TONNES OF WASTE DIVERTED FROM LANDFILL
1,750M2
1,750M2
1,750M2 OF STREET GREENING
1,750M2 OF
1,750M2 OF STREET GREENING
1,750M2 OF STREET GREENING
9,000
9,000
9,000 HOURS OF
9,000 HOURS OF PATROLLING BY OUR WARDENS TEAM EVERY YEAR
2,500 PEOPLE VOLUNTEERED IN THE LOCAL COMMUNITY 11 £8M EXTERNAL FUNDING SECURED
4,000 TONNES
4,000 TONNES OF CO2 SAVED THROUGH
4,000 TONNES OF CO2 SAVED THROUGH RECYCLING SINCE
4,000 TONNES OF CO2 SAVED THROUGH RECYCLING SINCE 2015
2,500 PEOPLE VOLUNTEERED IN THE LOCAL COMMUNITY
2,500 PEOPLE VOLUNTEERED IN THE LOCAL COMMUNITY
2,500 PEOPLE VOLUNTEERED IN THE LOCAL COMMUNITY
2,500 PEOPLE
VOLUNTEERED IN THE LOCAL COMMUNITY
2,500 PEOPLE VOLUNTEERED IN THE LOCAL COMMUNITY
1,000 BIKES
1,000 BIKES
INCREASED
1,000 BIKES
1,000 BIKES
SECURITY MARKED
1,000 BIKES
1,000 BIKES INCREASED CYCLING AMONGST COMMUTERS (10% - 17% SINCE 2011) SECURITY MARKED
120 COMMUNITY BUILDING EVENTS ANNUALLY
120 COMMUNITY BUILDING EVENTS ANNUALLY
120 COMMUNITY BUILDING EVENTS ANNUALLY
120 COMMUNITY BUILDING EVENTS ANNUALLY
120 COMMUNITY BUILDING EVENTS ANNUALLY
120 COMMUNITY BUILDING EVENTS ANNUALLY
97%
97% REDUCTION IN EMISSIONS AS A RESULT OF OUR PILOT AIR QUALITY PROJECT
97% REDUCTION IN EMISSIONS AS A RESULT OF OUR PILOT AIR QUALITY PROJECT
97% REDUCTION IN EMISSIONS AS A RESULT OF OUR PILOT AIR QUALITY PROJECT
CHALLENGE
BUSINESS CLIMATE CHALLENGE
BUSINESS CLIMATE CHALLENGE
Better Bankside: Business Climate Challenge
One of the initiatives which is supported by Better Bankside is the Business Climate Challenge (BCC) 2022. The BCC supports businesses across Bankside as follows:
• Businesses will commit to reducing their workplaces’ energy consumption by at least 10% in a year and develop an action plan to reach net zero emissions.
• Businesses can work with technical experts over the course of the programme to set targets for and get bespoke technical support, coaching and quarterly training.
It’s time to take action and move towards a
It’s time to take action and move towards a
ZERO CARBON
ZERO CARBON
• Buildings will undergo an energy efficiency audit and receive a Display Energy Certificate (DEC). Audits of office buildings will review lighting, ventilation, heating and cooling, taking into account challenges offices face after the pandemic.
• The results of the audit will be used to develop a route map towards net-zero emissions and inform the process for other buildings with similar characteristics.
• Better Bankside will supply promotional materials and support so businesses can communicate their involvement in the Business Climate Challenge externally.
BUSINESS CLIMATE CHALLENGE
It’s time to take action and move towards a
ZERO CARBON
Is your business keen to be more energy efficient and reduce emissions? Better Bankside has partnered with the Mayor of London on a Business Climate Challenge, offering 40 businesses the opportunity to reduce their office building’s energy consumption by 10%.
Is your business keen to be more energy efficient and reduce emissions? Better Bankside has partnered with the Mayor of London on a Business Climate Challenge, offering 40 businesses the opportunity to reduce their office building’s energy consumption by 10%
Is your business keen to be more energy efficient and reduce emissions? Better Bankside has partnered with the Mayor of London on a Business Climate Challenge, offering 40 businesses the opportunity to reduce their office building’s energy consumption by 10%.
Emissions from heating and powering commercial and industrial buildings currently make up 36% of London’s carbon footprint. This pioneering initiative is a first for London and gives our neighbourhood the opportunity to become a catalyst for change.
Emissions from heating and powering commercial and industrial buildings currently make up 36% of London’s carbon footprint. This pioneering initiative is a first for London and gives our neighbourhood the opportunity to become a catalyst for change.
It’s
Emissions from heating and powering commercial and industrial buildings currently make up 36% of London’s carbon footprint. This pioneering initiative is a first for London and gives our neighbourhood the opportunity to become a catalyst for change.
ZERO CARBON
With funding from the Mayor of London, participating businesses will receive customised expert advice and support over the next year to improve the environmental performance, health and value of their building. In return Banksiders will be contributing to London’s target of becoming a zero carbon city by 2030.
Is your business keen to be more energy efficient and reduce emissions? Better Bankside has partnered with the Mayor of London on a Business Climate Challenge, offering 40 businesses the opportunity to reduce their office building’s energy consumption by 10%
With funding from the Mayor of London, participating businesses will receive customised expert advice and support over the next year to improve the environmental performance, health and value of their building. In return Banksiders will be contributing to London’s target of becoming a zero carbon city by 2030.
With funding from the Mayor of London, participating businesses will receive customised expert advice and support over the next year to improve the environmental performance, health and value of their building. In return Banksiders will be contributing to London’s target of becoming a zero carbon city by 2030.
Emissions from heating and powering commercial and industrial buildings currently make up 36% of London’s carbon footprint. This pioneering initiative is a first for London and gives our neighbourhood the opportunity to become a catalyst for change.
With funding from the Mayor of London, participating businesses will receive customised expert advice and support over the next year to improve the environmental performance, health and value of their building. In return Banksiders will be contributing to London’s target of becoming a zero carbon city
Image source: https://betterbankside.co.uk/wp-content/uploads/2022/09/ Business_Climate_Challenge_Business_UPDATE_0922.pdf
Case Study Five: Milan Ecopass
In January 2008, the city of Milan, Italy, introduced an ‘Ecopass’ to try and reduce traffic and related pollution in the city.86
The Ecopass program was a traffic pollution charge implemented in Milan, as part of the overall sustainable mobility strategy of the Municipality of Milan. It was designed to discourage the use of polluting private vehicles inside the central Milan “Cerchia dei Bastioni” area by applying an entrance charge related to the polluting emission levels.
How and How Much?
Certain types of vehicle were charged the toll when travelling within a designated traffic restricted zone on weekdays between 7.30 and 19.30.
The charging scheme was applied to the central city area, controlled by 43 toll gates. Cameras were installed at each of the 43 gates and provided data for a system based on automatic numberplate recognition technology.
The number plates of the vehicles entering the zone were read and the corresponding pollution level of the vehicle was calculated.
Vehicles were charged according to their vehicle Euro category with the least polluting cars exempt from the charge.
See the figure below for details of the charge.
Milan Pollution Charge – ECOPASS Vehicles

Image source: https://news.bbc.co.uk/1/hi/world/ europe/7167992.stm
86 www.itf-oecd.org/sites/default/files/docs/charging-scheme-other-strategies-milan.pdf
What was the Money Spent on?
The annual charge payments were as follows:87
• €12.4 million in 2008
• €9.6 million in 2009 and
• €8.9 million in 2010.
The income from the Ecopass was invested in projects aimed at improving urban mobility:
• Public transport
• Cycle mobility
• Car sharing
• Mobility Management
• Low impact vehicles
Impact
The impact of the Ecopass was significant:
• As of 30 June 2011, traffic inside the tolled area was reduced by 16.2% when compared to 2007 levels, before the Ecopass was implemented
• Road accidents within the tolled area were reduced by 21.3% in the same period
• In the tolled the number of high polluter vehicles declined by 48.1% and the number of low-emission vehicles increased by 478%.88
After the introduction of the Ecopass, the share of exempted vehicles increased. In 2007 50% of vehicles entering the area were from Ecopass, in the first year of the scheme this percentage went up to 75% and in 2010, the share of exempted vehicles was as high as 90%.
This gradually reduced the dissuasive power of Ecopass and its revenue raising potential.

For more details on the implementation and impact of the Ecopass scheme see video linked above

Image source: www.ilgiorno.it/milano/cronaca/rincari-area-c-milano-jjdcl3ov
87 Kodukula and Morandini, ICLEI World Secretariat (2013) – www.researchgate.net/publication/325987968_The_Ecopass_ pollution_charge_and_Area_C_congestion_charge_-_comparing_experiences_with_cordon_pricing_over_time
88 www.itf-oecd.org/sites/default/files/docs/charging-scheme-other-strategies-milan.pdf
Area C
On June 12th, 2011 a referendum was held to move from the former pollution charge “Ecopass to the new congestion pricing “Area C”. The proposal was approved by 79% of voters. Now, all vehicles entering the area between 7:30 and 19:30 are charged (public service vehicles are exempt).
The data show that AREA C has had a direct effect on traffic in the city centre.89 Its introduction has helped to significantly reduce car generated pollution. It has helped to change the car fleet in the city towards more ecological choices. This momentum has been supported by the Administration, which in recent years invested more than €20 million in grants for the purchase of vehicles with a lower environmental impact.
The reduction of cars in the city centre has also enabled the reuse of the public space previously used for parking.
Area C covers the same area as the Ecopass and uses the same infrastructure.
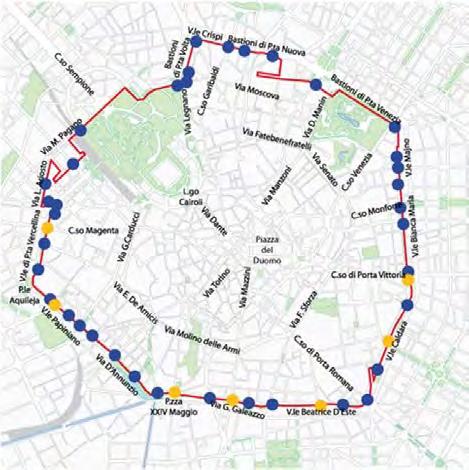

Findings
Research
• Other destinations experience similar externalities to the Lake District.
• Visitor taxes are well accepted in many European countries, as well as globally.
• They can raise significant amounts of revenue for environmental and social projects.
Discussion
It is essential that the Invisible Burden of Tourism on the Lake District is not disregarded. If not dealt with, the negative impacts of tourism on the National Park will become progressively worse with significant consequences: e.g.
• Sub-optimal levels of public transport and active travel provision leading to standing traffic and poorly parked cars making travel difficult with impacts on air quality, businesses, local residents and visitors;
• Direct physical harm and impacts on tranquillity and the landscape from increases in the number and size of vehicles;
• Local people priced out of their communities by short-term holiday lets and second homes, leading to a breakdown of communities and cultural events, and a shortage of people available to work, affecting service levels in local visitor businesses both in the tourist and local economy;
• Increasing occurrence and extent of algal blooms on Windermere and other lakes due to inadequately sized sewage treatment facilities. Not only does this impact on the waterbodies and their flora and fauna; they will also become less attractive for swimming, watersports and sightseeing;
• Continuing loss of nature from fells and valleys due in part to disturbance by visitors and their dogs.90
Even taken alone, each one of these example burdens has an impact on nature, landscape and community. Together the cumulative impact is significant. When the visitor experience itself is negatively affected by the invisible burden of tourism, then a tipping point has been reached where the weight of numbers starts to destroy the very thing that people come to experience.

90 A Right to Roam - for Whom (2024) Karen Lloyd, Ian Convery, Simon Leadbeater, Sally Hawkins and Steve Carver https://theecologist. org/2024/jul/16/right-roam-whom WHO PAYS
Failure of tourist destinations to introduce measures to deal with the invisible burden of tourism on host communities has been an issue since mass tourism took off in the 1970s. In 1975 the Irridex model91 (also known as the “irritation index”) was introduced and suggests that residents’ attitudes to tourism evolve in several stages. Starting with euphoria, then apathy, irritation, and eventually, antagonism, this progression occurs as the perceived costs of tourism begin to outweigh expected benefits with the growth of tourist numbers and destination development.92 The tipping point into antagonism has been reached in destinations across Europe and other parts of the world this year.93
During the summer of 2024, there have been increasing conflicts between inhabitants and tourists, including in Barcelona where residents fired water pistols at visitors highlighting the current water-stress that the city is suffering, which is exacerbated by visitor pressure, alongside lack of housing for local people.94 At one point in summer 2024 the 15,000 residents of popular Greek island Santorini were warned to stay at home to allow for the disembarkation of 17,000 cruise ship passengers.95
Evaluation of Options for the Lake District
To address the impact on the environment and communities of the invisible burden of tourism, Friends of the Lake District believes that options to raise money from visitors should be investigated by local authorities and the Lake District National Park Authority. There are several ways that this can be done.
Overnight Stay Supplement
A visitor levy in the form of a bed tax is not yet an option in England as there is currently no legal route to make it happen. The government could legislate to give local authorities new powers to implement a visitor levy in order to tackle the impacts of tourism on areas suffering from the invisible burden of tourism. After new government powers were introduced by the Scottish Government in 2023, residents and businesses in Edinburgh recently voted to back a 5% tourist tax to put funding into council housing, green infrastructure and the arts96 97 The Welsh Government is currently consulting on a visitor levy for Wales98 to be implemented by local authorities. Their consultation introduction makes it clear why they are considering this step:
“We know that tourism plays a vital role in supporting local economies. But unbalanced, poorly supported tourism can also put pressure on local communities and undermine the visitor experience.
“A visitor levy is not intended to put people off visiting Wales. Instead, we propose that it would be a small contribution by overnight visitors that will generate additional revenue for local authorities to reinvest in local communities. This would enable them to address some of the costs associated with tourism and encourage a more sustainable approach.” – Welsh Government 2024.
The monies raised would be used by the local authorities for better public transport, social housing, environmental enhancement and water quality improvement etc in the same way as those used in the Balearic Islands as described in the research above.
The Lake District National Park and the two Unitary Authorities in Cumbria could lobby the government to start a conversation about legislating to give local authorities the power to impose a visitor levy should they want to. We would like to work with them to offer support to do this.
Another way to deal with the problem of housing for residents is to licence holiday lets and short-term rental properties and only allow a sustainable number of lets per year, refusing licences once the number issued reached a threshold. This is being enacted in Barcelona,99 and by 2028, 10,000 rental properties will be returned to the local market to try to relieve the housing crisis there. WHO PAYS FOR THE LAKE DISTRICT?
91 https://tourismteacher.com/doxeys-irritation-index/
92 www.bangor.ac.uk/news/2024-08-09-barcelona-protests-holiday-hotspots-need-fairer-tourism-for-local-communities
93 www.theguardian.com/environment/article/2024/aug/13/drunk-visitors-rocketing-rents-homogenised-cafes-europe-tourist-hotspots
94 www.theguardian.com/world/article/2024/aug/09/protests-mass-tourism-spain-europe-unesco
95 www.mirror.co.uk/news/world-news/popular-tourist-island-santorini-tells-33346172
96 www.theguardian.com/uk-news/article/2024/aug/14/edinburgh-councillors-say-new-tourist-tax-will-help-build-council-housing
97 www.bbc.co.uk/news/articles/c7v5l29q2dvo
98 www.gov.wales/a-visitor-levy-for-wales
99 www.theguardian.com/world/article/2024/jun/22/barcelona-to-ban-apartment-rentals-to-tourists-in-bid-to-cut-housing-costs
Business Improvement Districts/Tourism Business Improvement Districts
One fundraising possibility for consideration is a Business or Tourism Business Improvement District (BIDs and TBIDs). Funds raised via Business or Tourism Business Improvement Districts go back to the BID and the funding is often used to promote further tourism. However, BIDs have to be approved by 50% of businesses in the area, and this approval has to happen every five years. This makes BIDs and TBIDS not as useful for dealing with the major problems of housing and inadequate infrastructure caused by overtourism as they first appear. The control by the affected businesses of the money raised creates a substantial risk that projects would be funded which increased rather than reduced harmful pressures on the landscape.
Visitor Vehicle Levy
Currently the only visitor levy option with existing legislation available to local authorities is a local transport tax. Other local authorities in the UK have used local transport taxes to raise funds to address transport problems under Part III of the Transport Act 2000.100 Such a charge would not only raise funds but also provide a disincentive to vehicle usage which is a major cause of harm to the landscape and its tranquillity.
The best-known example in the UK is in London where a congestion charge was first implemented in 2003. The aims of the congestion charge were to reduce the length of journeys within the congestion zone, improve the flow of buses and encourage motorists to use public transport instead of cars. The charge is only payable at certain times of the day, in line with its aims of congestion reduction, and residents of the zone only pay 10% of the charge. After 20 years of operation, congestion has been reduced by 30%, bus travel has been increased by 33% and 10% more journeys are made by bike or on foot.101 In 2019 the Ultra Low Emissions Zone charge was implemented to reduce air pollution and CO2 emissions. This charge is payable 24 hours a day if a vehicle is not Euro 6 compliant (i.e. it has high pollutant levels). The money raised by the congestion charge and ULEZ is ploughed back into sustainable, public and active transport in the city. A visitor vehicle charge could be considered as a method of addressing transport issues which arise in the Lake District. A small charge could be enacted for the whole Park, or it could be deemed more appropriate at set times and/or in specific valleys in order to address demand at peaks times and in busy places. All funds raised by such measures are legally ringfenced to be spent on furthering the local transport plan which includes measures to improve public transport, on-demand transport and active travel options (such as cycling and walking). The charge could be significantly higher for certain types of vehicles (eg camper vans).
Any action would need to be front-loaded in the way that public transport and active travel options were significantly improved in London prior to the Congestion Charge being implemented. A visitor vehicle charge could cause resentment and possibly failure if charges were imposed for travelling by one mode of transport without offering other modes of sustainable transport that are just as effective. Fortunately there is already a good bus service for visitors in the 555 corridor between Windermere/Ambleside/Grasmere/Keswick and the foundation of a good service in some popular valleys such as the Langdales. A visitor vehicle levy could fund improvements to such services. The charge would be a disincentive to vehicle use which would support long term viability of such services.
The new bus routes into and out of the Ullswater Valley and the work that SITU102 (Sustainable Integrated Transport Ullswater) is doing shows that provision of public transport services can change visitor behaviour. However, without a sustainable way of financing increased public transport provision over the long-term, it has been proven repeatedly that when funds are removed, car use returns back to previous levels. As an example, the Go Lakes scheme decreased car use between 2011-2015,103 but when funding ran out, car use returned to previous levels.
100 Friends of the Lake District 2019 Transport Conference paper ‘An Introduction to Road Usage Charging and National Park ’
101 https://tfl.gov.uk/info-for/media/press-releases/2023/february/congestion-charge-marks-20-years-of-keeping-london-moving-sustainably
102 https://situcumbria.org.uk/ullswater-bus
103 www.lakedistrict.gov.uk/__data/assets/pdf_file/0024/135384/GoLakes-Travel-and-See-More-Headline-achievements-pdf.pdf
Visitor Parking Levy
A parking levy is another option that could be investigated. This would involve a small (£1-2) charge added to parking fees in certain areas. This money would be collected and used to fund and improve public transport and active travel up into the valleys with the parking restrictions. In conjunction with this, the removal of unofficial parking spots in various valleys and implementing associated clearways with fines and towing to prevent parking would reduce the access problems that many of the valleys with narrow roads have because of poorly parked cars.Parking levy transport measures have already been implemented in Eryri (Snowdonia) National Park tackling parking problems in the valleys around Yr Wyddfa.104 Making parking close to the mountain expensive, putting “tow-away zones” in place and then providing shuttle buses funded by car park charges has gone some way towards solving the endemic traffic and parking problems in this small area. It demonstrates that implementation of visitor levy methods over even a relatively small area can start to solve seemingly intractable problems and the measures also meet with approval from local communities.104 Nottingham City Council raised £90million over 10 years through a workplace parking levy106 107 which was used to help fund a tram system throughout the city. This has significantly reduced the number of cars on the roads by enabling many more people to travel using public transport. Air pollution has decreased, and Nottingham has become a more equal city with more travel opportunities for those with disabilities and households without cars. Additionally, there is more physical activity due to new opportunities for active travel. Millions of pounds have been spent on improving the city’s cycling and active travel facilities, with over 300 miles of new or upgraded cycle paths.
Public Appetite for Change
Action With Communities in Cumbria recently published work on appetites to travel differently108 showing that both visitors and residents in the Lake District are keen to see transformational change of the transportation system in the National Park (see preferred scenarios image). Other surveys by tourist organisations109 110 have shown a willingness to pay to visit places, as long as the money collected is used to maintain and enhance the destination itself and not diverted into government funds. Visitors themselves recognise that their numbers can cause problems in some places at some times.
Figure 11: Scenarios preferred by questionnaire respondents
Key Face-to-face Other
104 https://services.thebmc.co.uk/snowdon-new-parking-restrictions
105 www.walesonline.co.uk/news/wales-news/serves-you-right-walkers-whose-28940593
106 www.transportnottingham.com/wp-content/uploads/2022/10/WPL-10-Year-Impact-Report-Digital-Nov-22.pdf
107 https://groups.friendsoftheearth.uk/climate-action/how-nottingham-used-parking-levy-cut-congestion-and-raise-millions
108 www.cumbriaaction.org.uk/resources/assets/transport-appetite-report-main.pdf
109 www.sciencedirect.com/science/article/abs/pii/S2212571X20301621
110 www.newsandstar.co.uk/news/23403920.tourist-tax-raise-17-5m---will-drive-visitors-away
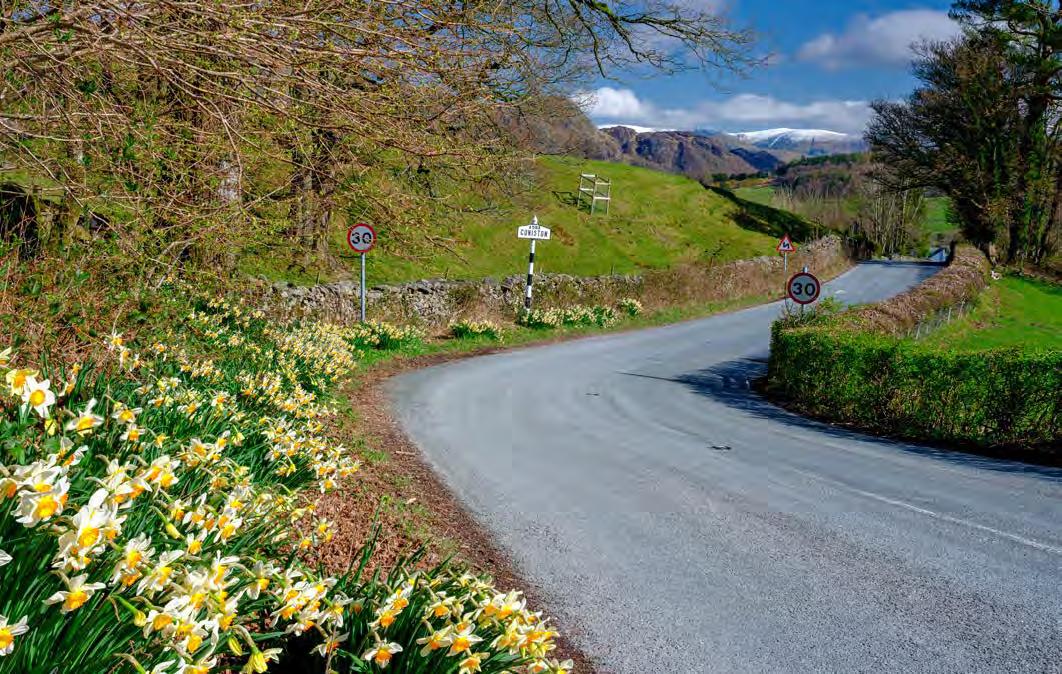
We want to make it clear that our focus on transport here doesn’t acknowledge all the visitor burdens that need addressing, but that at the moment transport is really the only area where the LDNPA and Unitary Authorities have powers to deal with these issues.
Whilst fixing transport in the Lake District would be a huge step forward, it leaves many other burdens that need addressing including housing for local people, community cohesion, water pollution, damage to and loss of biodiversity, disturbance and loss of tranquillity and footpath erosion. There could be a mix of visitor levy options in place in order to pay for the action that is needed to address all the currently unaccounted-for impacts of tourism on the Lake District.
Conclusions
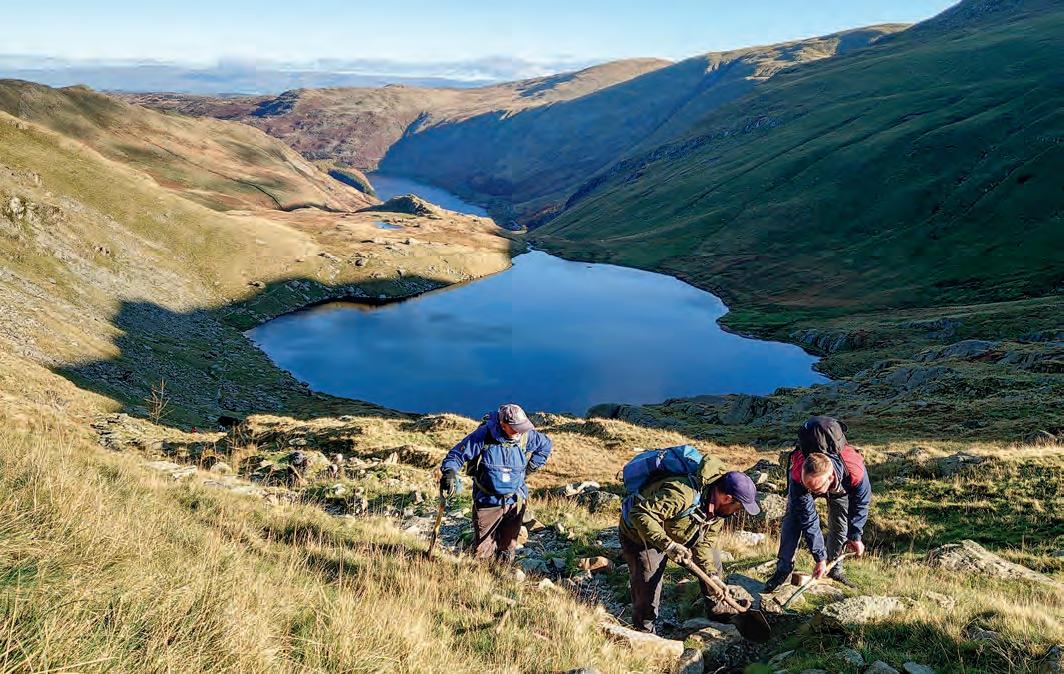
The current solutions in place to deal with overtourism issues in the Lake District like ad hoc donations and fundraising are not adequate to address the strategic-level community, social and environmental problems that the National Park is facing because of the volume of visitors. The most intractable of the problems such as water quality, housing supply and transport are too large to be dealt with via voluntary donations distributed by charities and/or the goodwill of local businesses, and because of this, they remain unaddressed. What is needed is a more systematic and statutory approach to dealing with visitor impacts.
The invisible burden of tourism in the Lake District needs to be acknowledged, and a mechanism for addressing it needs to be implemented, funded by some form of mandatory visitor levy. We ask the National Park Partnership, and Cumberland and Westmorland and Furness councils to examine different visitor levy methods, and to identify the best method to pay for the maintenance of the Lake District’s landscape, environment and communities.
Further Resources
For more information on tourism taxes:
https://groupnao.com/wp-content/uploads/2020/11/TOURISM-TAXES-BY-DESIGN-NOV12-2020_rettet-compressed-2.pdf www.local.gov.uk/publications/tourist-levy-what-where-and-how www.london.gov.uk/sites/default/files/tourism-levy-for-london-wp83.pdf
https://tourismalliance.com/new-tourism-alliance-report-spotlights-high-tax-rate-on-tourists-in-uk#:~:text=Because%20of%20the%2high%20 rate,25.33%20per%20night%20in%20taxes
For more information on BIDs and TBIDs:
https:// britishbids.info
https://coastaltourismacademy.co.uk/resource-hub/resource/business-improvement-districts-why-create-one https://destinationthink.com/wp-content/uploads/2016/10/intro_to_tbids.pdf www.gov.uk/guidance/business-improvement-districts https://journals.sagepub.com/doi/full/10.1177/00420980211066420 www.sciencedirect.com/science/article/pii/S1618866723000754
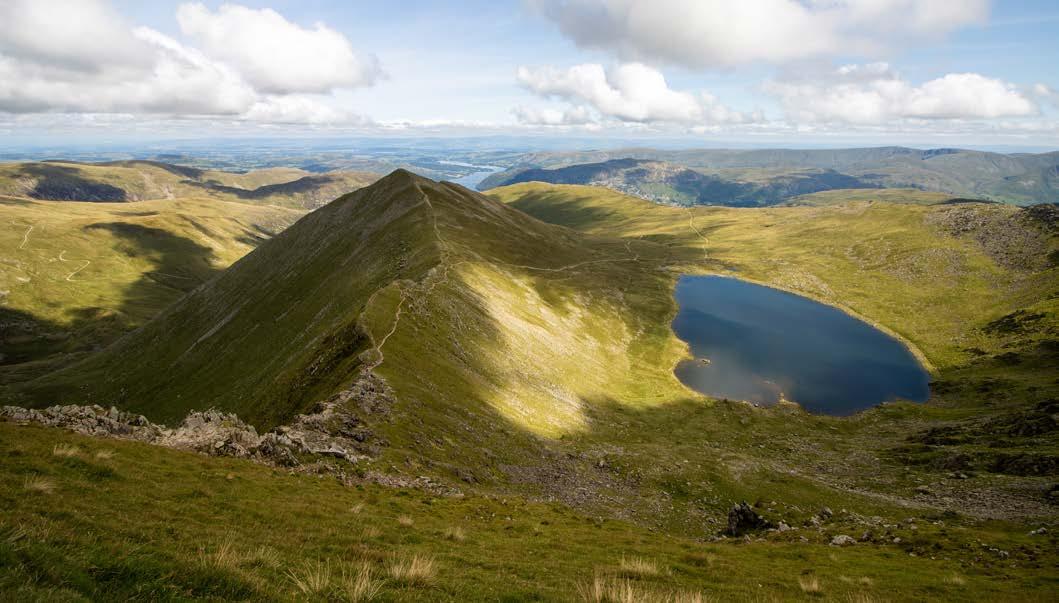
Acknowledgements and Thanks
Thanks are due to the following people who provided invaluable information and advice in the production of this report:
• Lorenzo Bagnoli | Associate Professor, University of Milano-Bicocca
• Tony Brien | Associate Professor, Lincoln University, New Zealand
• Rhys ap Gwilym | Senior Lecturer, Bangor University Business School
• Jo Guiver | Honorary Visiting Fellow, University of Central Lancashire
• Alistair Kirkbride | Churchill Fellow
• Sarah Mason | Chief Executive Officer, Morecambe Bay Partnership
• Linda Osti | Senior Lecturer, Bangor University Business School
• Gemma Proctor | Sustainable Tourism Officer, Cumbria Tourism
• Lorrainne Smyth | Chief Executive, Action with Communities in Cumbria WHO PAYS FOR THE LAKE DISTRICT?
Who Pays for the Lake District?
Notes on the Author

Dr Davina Stanford is a Lancaster-based freelance consultant, educator and researcher who has worked in responsible tourism development for over 20 years. Her consultancy projects have focused primarily on best practice in destination management for a range of clients including destination management organisations, local authorities, regional, national and international agencies (e.g. the Northwest Development Agency, Natural England, VisitEngland, UNEP and UNWTO) small businesses and local community groups. This included work for Natural England, Friends of the Lake District, and Cumbria Tourism, on the What Makes You Move? project. The project explored how best to reduce the transport-related environmental burden of visitors to the Lake District National Park.
Her academic research focuses on tourist behaviour and persuasive communication to promote sustainable tourism for partnerships, destinations and individuals. She has also published on sustainable visitor transport in National Parks.
Prior to her current freelance work, she led the award-winning Responsible Tourism Management MSc at Leeds Beckett University.
She sits on the board of the Ninki Nanka Foundation, a charity which promotes the development of responsible tourism along the River Gambia.
LINKEDIN www.linkedin.com/in/davinastanford | Envelope-Square davina.stanford@gmail.com
Friends of the Lake District, Murley Moss, Oxenholme Road, Kendal, LA9 7SS
Tel: 01539 720788 | Email: info@fld.org.uk | Website: www.friendsofthelakedistrict.org.uk
Charity Number: 1100759 | Company Number: 4878364