


Melbourne is a city of international significance. It has long been ranked in the top ten of the world’s most liveable cities, including number one from 2011-2017.
Melbourne is home to two universities ranked in the top 50 global universities.
Victoria, Australia’s second-largest economy, grew by +1.5% over FY 2023 – FY 2024, out-performing Australia’s national growth rate.
Public sector investment in health, education, transport and utilities projects remain key to Victoria’s economic prospects.


50 Global Universities
Currently ranked 4th Ranked 1st 7 consecutive times (2011-2017)
Economic Growth

FY2023/24

University of Melbourne ranked 13th and Monash University ranked 37th
Unemployment Rate

April 2025 (down from June 2020 peak of 7.5%)
Prior to Covid-19, population growth in Melbourne was extremely strong. Growth was driven predominantly by high levels of net overseas migration. After contracting to -1.6% during the pandemic, Melbourne’s population has bounced back strongly due to the return of net overseas migration.
Over the past 12 months, Victoria’s population growth (+2.1%) has outpaced Australia’s (+1.8%). Looking forward, Melbourne is forecast to to have the largest population growth in absolute terms among Australian capital cities over the next decade.
Plan Melbourne identifies the need for an additional 1.6 million dwellings to house the growing population over the coming decades.


September 2024 Annual change Sep 23 – Sep 24


1.6 million dwellings
Metropolitan Melbourne’s Requirements 2016 - 2051
Melbourne

Largest population increase among capital cities over the next decade.
Australian Government – Centre for Population Annual Statement 2024
Detached housing is the predominant form of housing stock in Melbourne. Policy aspirations however aim to achieve greater levels of higher density dwellings to accommodate future population growth.
House price growth in Melbourne has been high over the last two decades which has supported the development of higher density housing stock. Despite some softening since early 2022, the tight supply outlook is supporting prices across the city.
Historically, Melbourne has been the leading supplier of new greenfield lots across Australia with an average of around 17K annual lot sales recorded over the past decade.

Existing Housing Composition Melbourne (2021) Composition of Future Housing Supply (2011-2051)


Historic House Price Growth - Melbourne

Greenfield Lot Sales 17K Annual Lot Sales (2015 – 2024) Metropolitan Melbourne


AFFORDABILITY:
Clyde North offers an affordable alternative when compared to the broader metropolitan Melbourne region.
CONNECTIVITY:
Clyde North is located close to key arterial roads and public transport nodes.
AMENITY:
Clyde North is complemented by its proximity to amenity including a number of retail precincts, recreational areas and educational institutions.


$735K & $880K
Clyde North & Berwick 2025 median house price.
(Metro Melbourne: $825K)
+9.3% p.a.
10-year average annual house price growth in Clyde North. (Metro Melbourne: +3.4% p.a.)
$551 p.w.
Median weekly three-bedroom house rent in Clyde North. (Metro Melbourne: $711 p.w.)
+4.5% p.a.
10-year average annual house rental growth in Clyde North. (Metro Melbourne: +4.0% p.a.)
(See page 11-13 for more info)

The predominant age cohort across Clyde North, accounting for 41% of all residents.
Predominant household type, accounting for 59% of total households in Clyde North.
Younger age demographic than Metropolitan Melbourne. (Metro Melbourne = 37 years)
+2.4% p.a.
Forecast population growth across Casey LGA to 2036.
(See page 15-17 for more info)


1,550
Number of new residential building approvals in Clyde North during the last 12 months. This measures close to the long-term average at almost 390 per quarter.
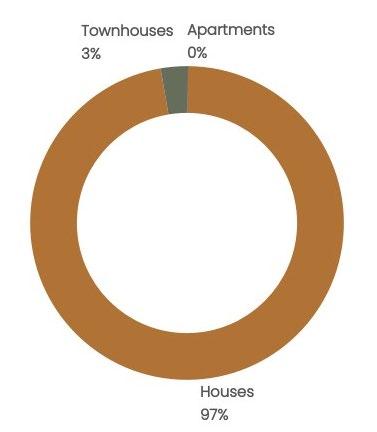
97% of dwellings in Clyde North are detached houses. Recent supply data indicates a densification of the suburb with an increased representation from townhouses.
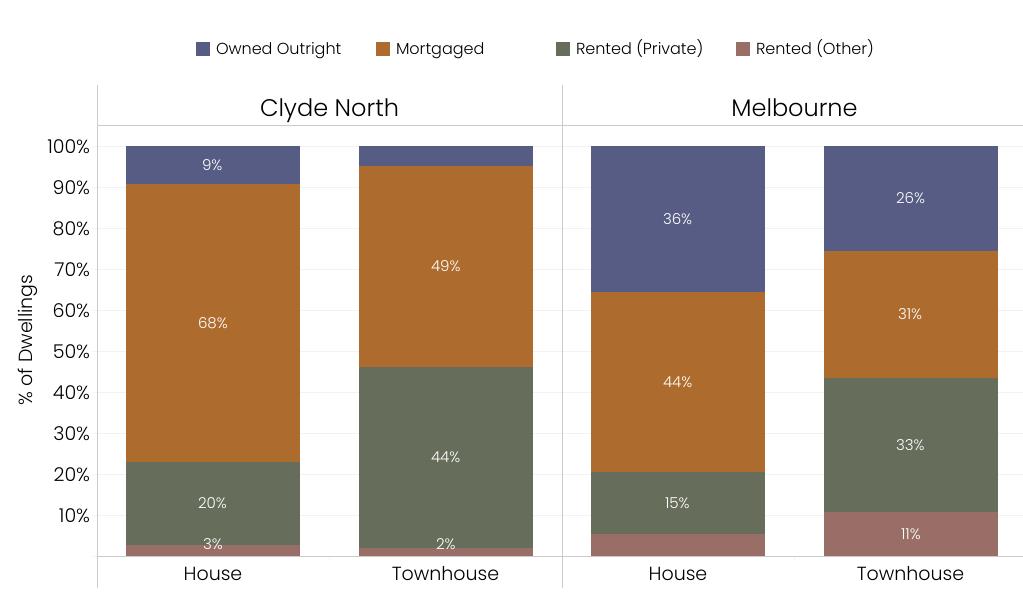
77% of detached houses are owned outright or owned with a mortgage.
(See page 19-21 for more info)

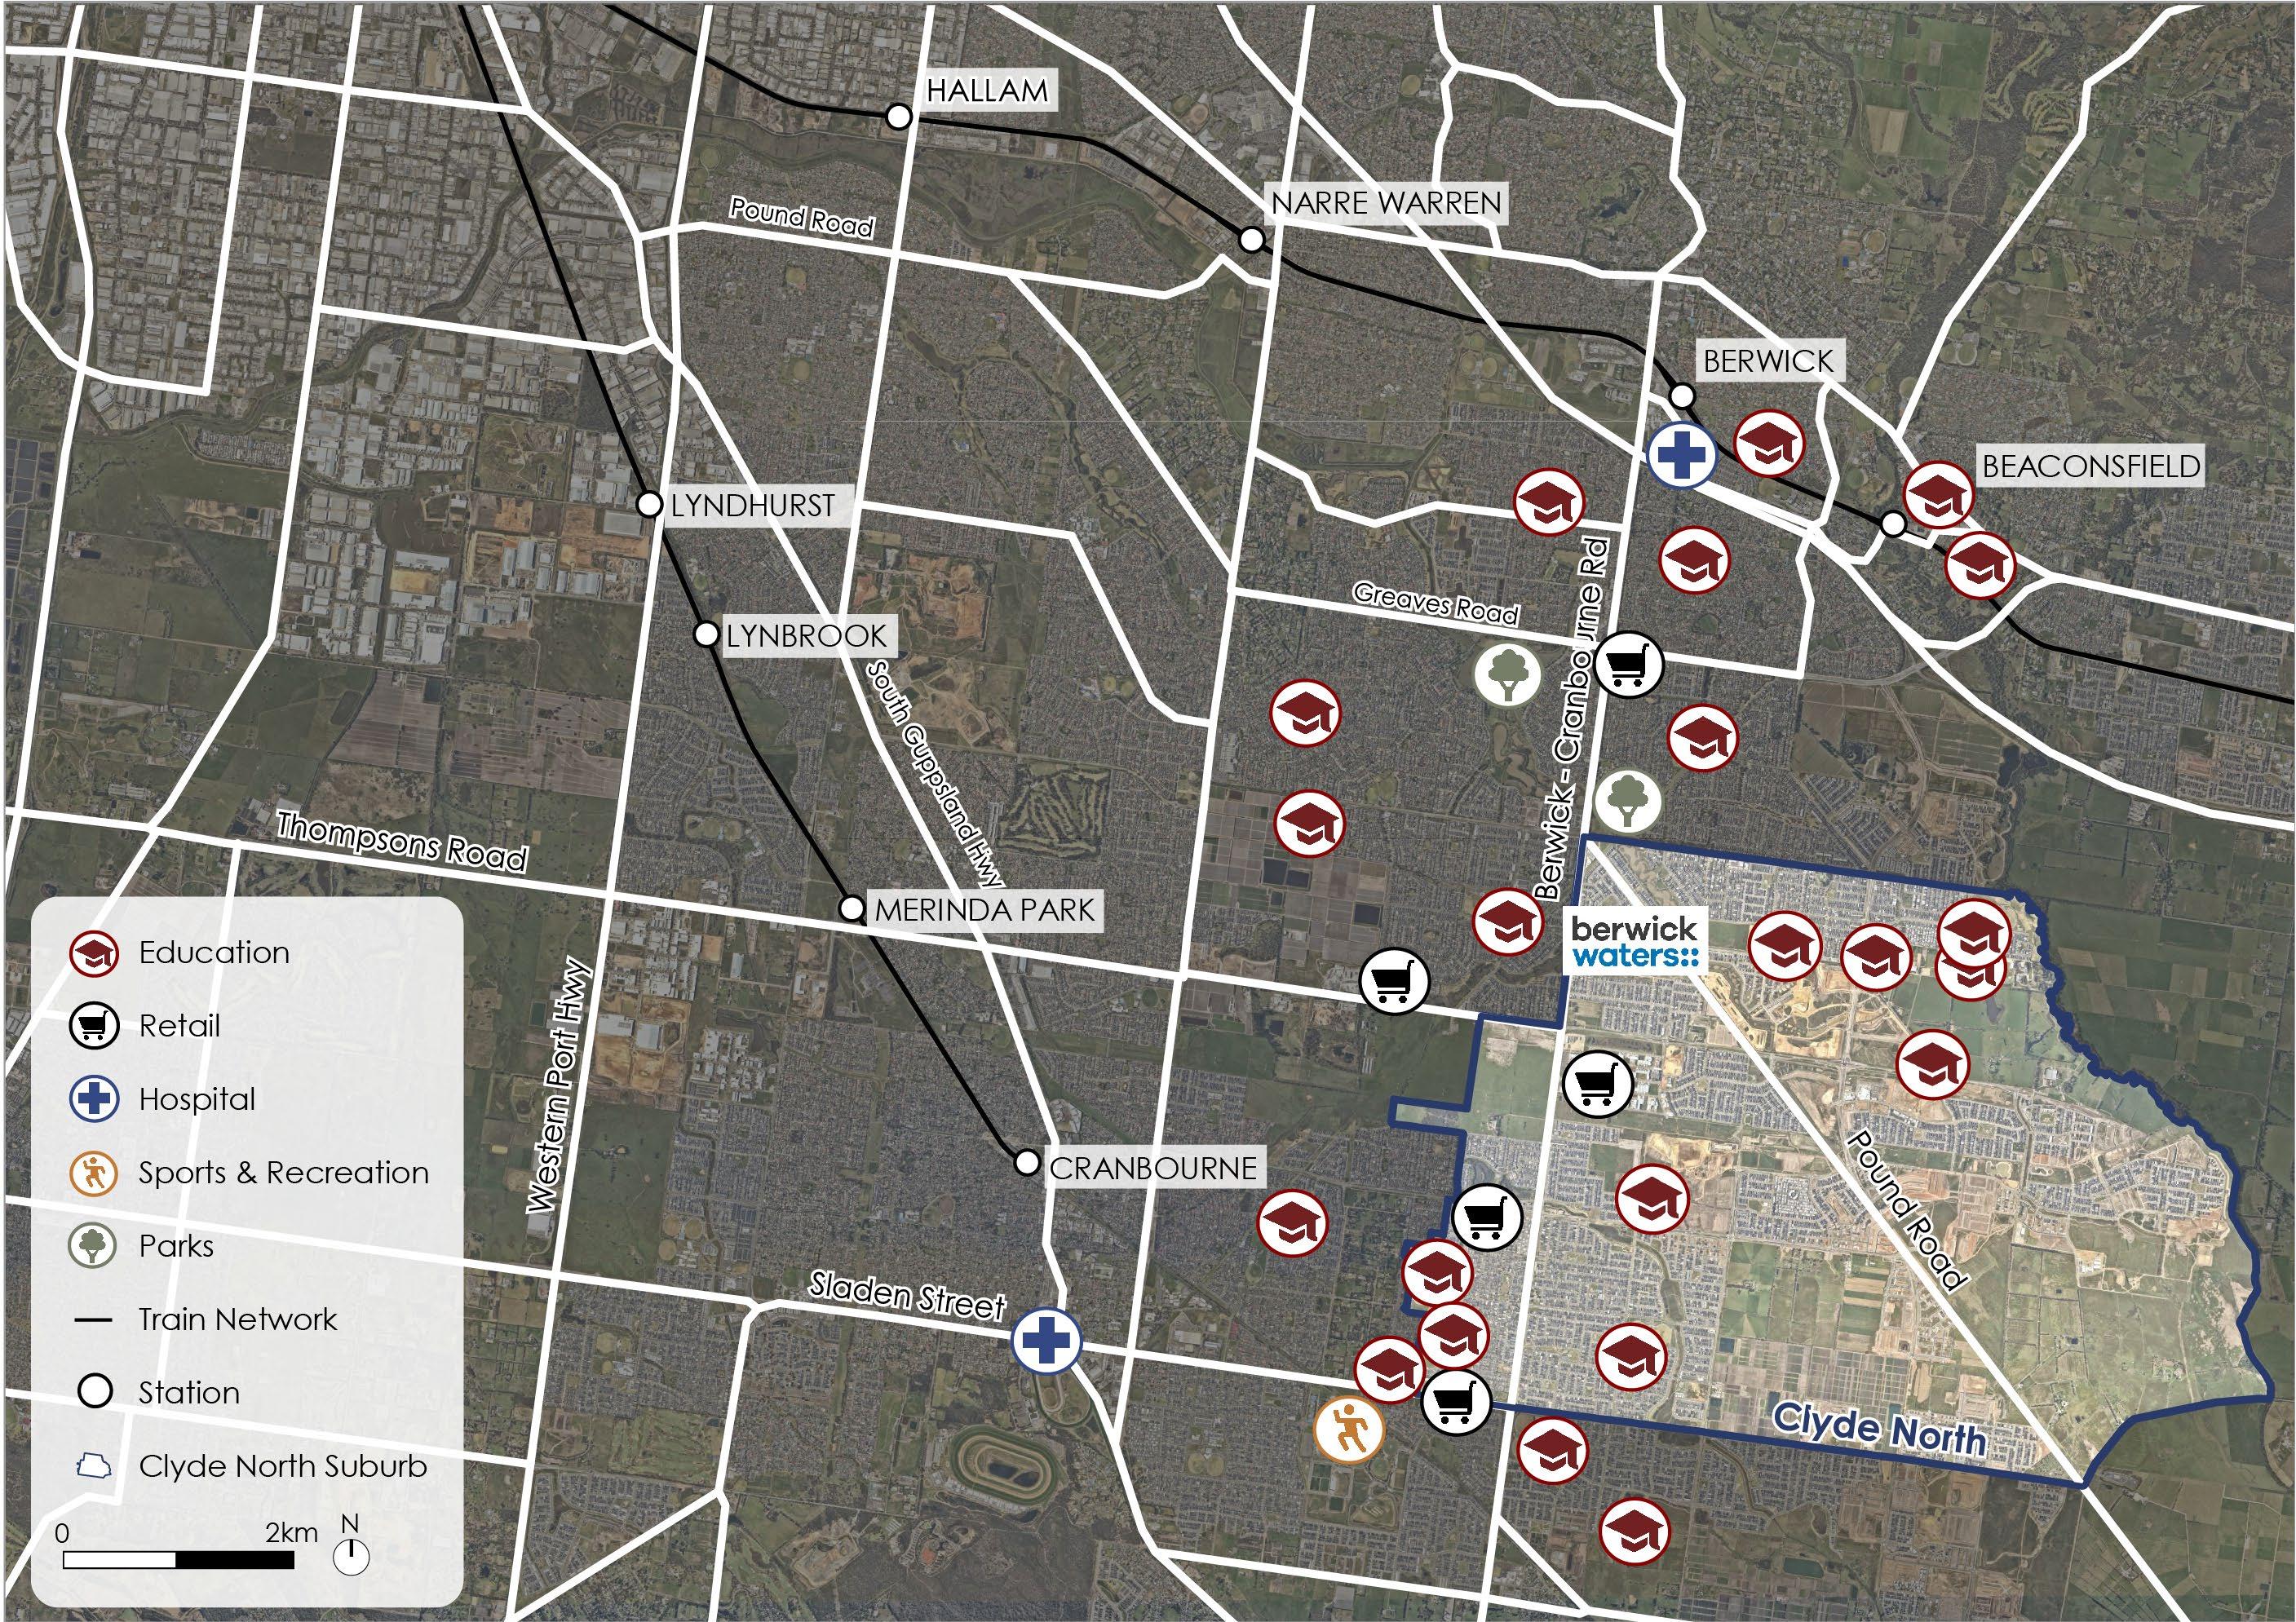
Clyde North is a suburb within the City of Casey Local Government Area (LGA), located approximately 43km south-east of the Melbourne CBD.
Significant residential development in Clyde North first began in the mid2010s. Prior to this, the area was an undeveloped rural locality mostly comprising farmland.
Clyde North has the advantage of having not been affected by the legacy of older generation facilities and is representative of a new suburb which, of itself, has strong market appeal to a wide range of future homeowners.
Clyde North is predominantly a residential suburb, with small pockets of retail activity located throughout. Much of the suburb is presently undeveloped but will support additional housing over the coming years.


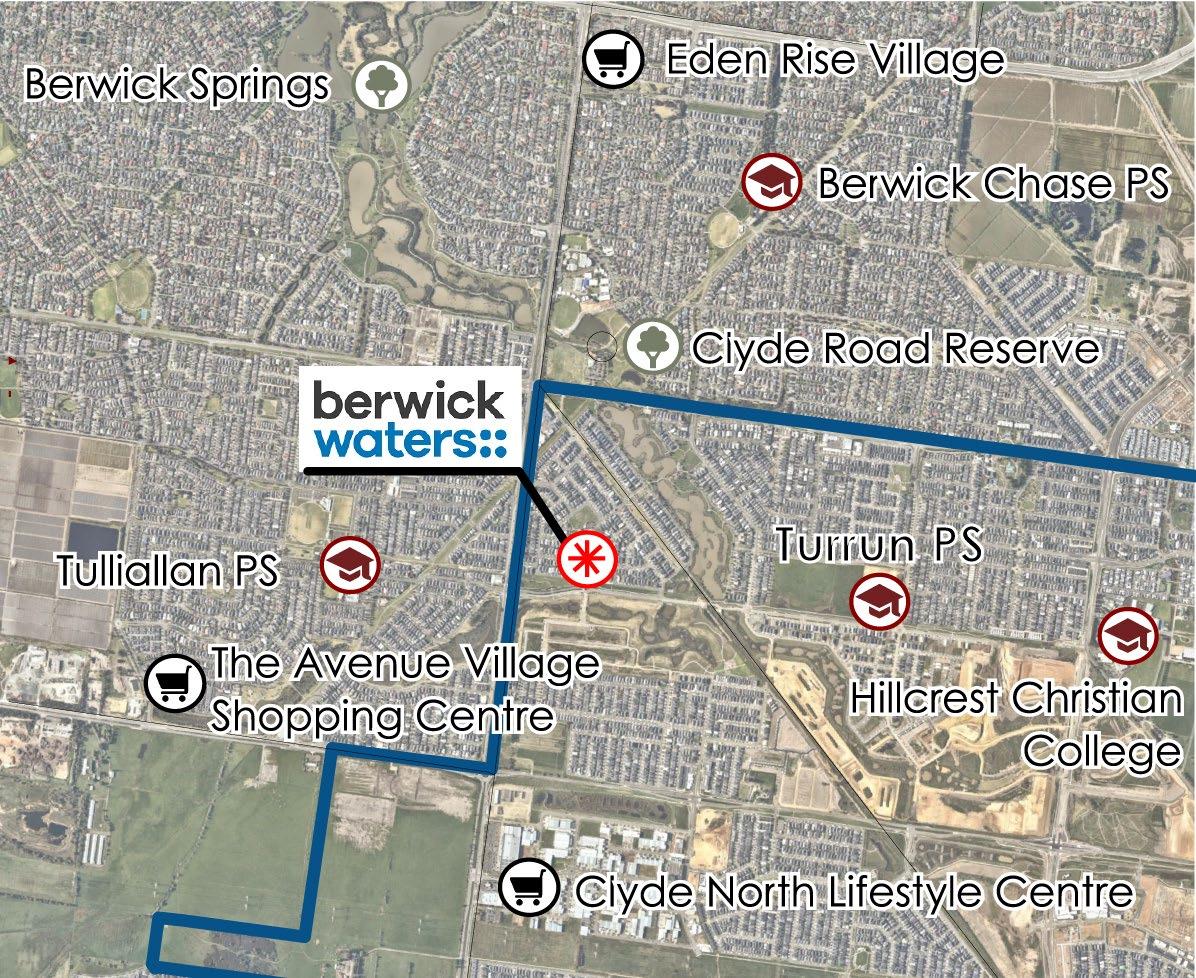
There are numerous parks and watercourses within or nearby the suburb including; Clyde Road Reserve, Clyde Wetlands, Clyde Creek, Berwick Springs, Hallam Main Drain Reserve and Cardinia Creek. Additionally, there are many playgrounds located throughout the suburb’s housing developments.

There are a number of shopping centres within and surrounding Clyde North including the newly developed Clyde North Lifestyle Centre, St Germain Central, Selandra Rise Shopping Centre, The Avenue Village Shopping Centre, Eden Rise Village and Fountain Gate Shopping Centre.


Clyde North has numerous schools (primary and secondary), including the newly opened Turrun PS, Grayling PS and Wulerrp SC.
Casey Hospital, Casey Cardinia Health Services and Monash Health Cranbourne Centre are closely located to Clyde North.


43km south-east of the Melbourne CBD.
Proximity to hospitals and employment precincts of Dandenong and the Monash corridor.
Direct connectivity to the CBD and Dandenong, via Princes Freeway and South Gippsland Highway. Connectivity to Princes Freeway has been improved by the Beaconsfield interchange upgrade.
Clyde North is serviced by the Cranbourne and Pakenham rail lines via Berwick and Cranbourne Stations - each within a short drive. Numerous bus routes run through the suburb, providing a connection to the train stations, and key shopping precincts.
Clyde Creek provides a popular shared bike and pedestrian trail.

Approximately one hour drive to Melbourne Airport via M1 and M2 freeways.

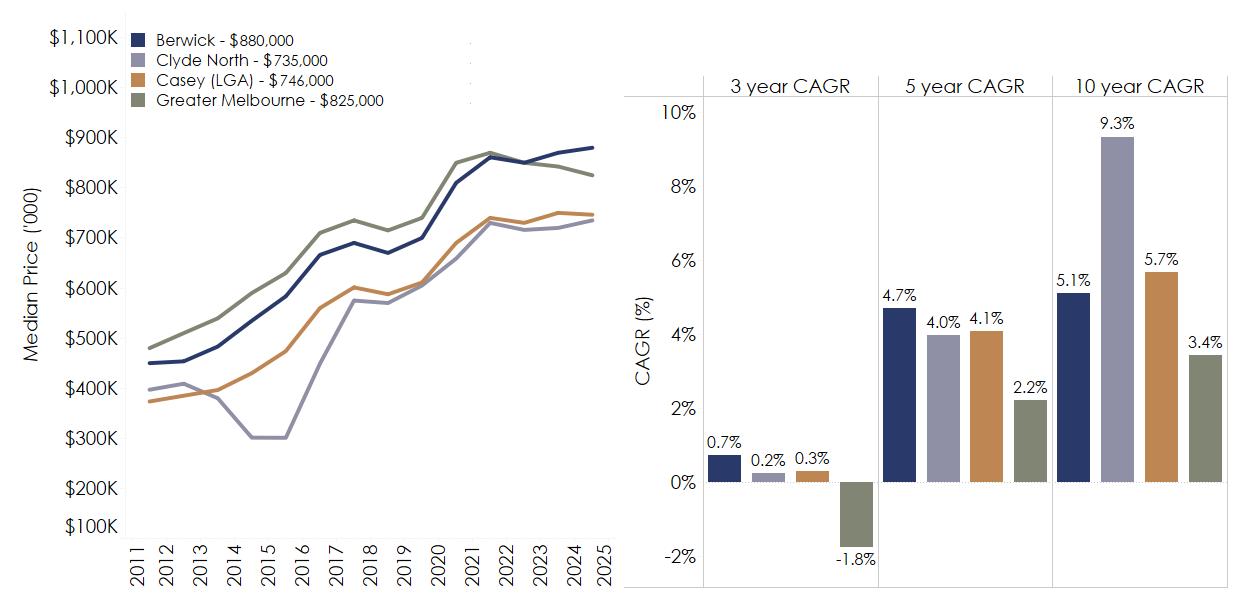
The 2025 median house price in Clyde North was $735,000. The neighbouring suburb of Berwick recorded a notably higher median price of $880,000, measuring above metropolitan Melbourne ($825K) and well above the broader Casey LGA ($746K).
Clyde North and Berwick have historically recorded stronger house price growth than Metropolitan Melbourne, over 3-, 5- and 10years. During the past decade, Clyde North and Berwick recorded strong price growth of +9.3% p.a. and +5.1% p.a. respectively. This compares to +3.4% p.a. in Metropolitan Melbourne over the same period.
Clyde North is a highly sought-after location within the Casey LGA with significant housing demand driving strong price growth.
These figures reflect transacted and settled sales recorded by Domain.
Clyde North has a lower median house price than some of its surrounding suburbs. However, the suburb has benefited from the development of new infrastructure and retail precincts. This has been capitalised into strong price growth as highlighted above.
Clyde North’s amenity and locational attributes will continue to attract strong housing demand into the future and the northern portion of this suburb stands to attract buyers from more expensive housing markets such as Berwick and Narre Warren South.
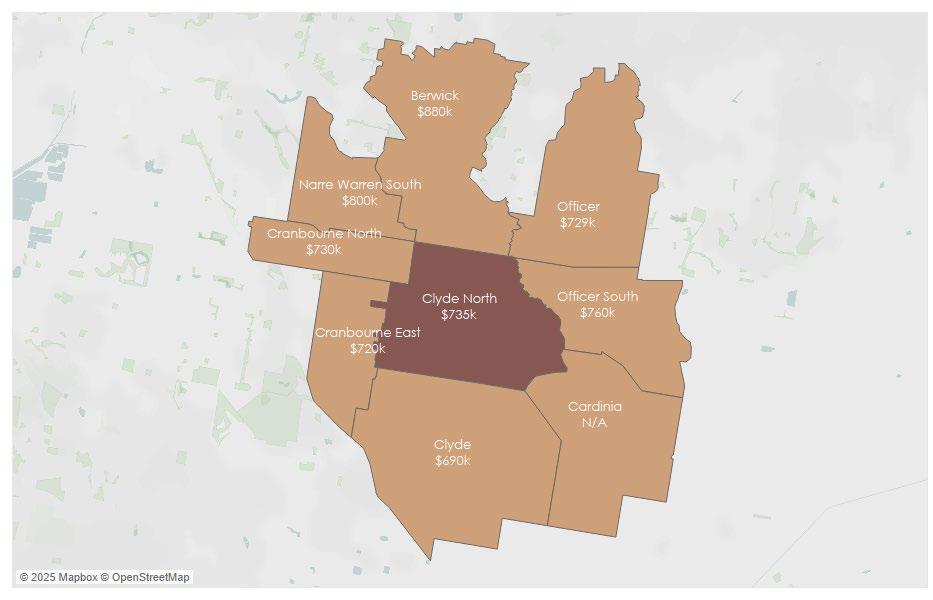
These figures reflect transacted and settled sales recorded by Domain. Officer’s median house price is at 2024 due to low sales volume.
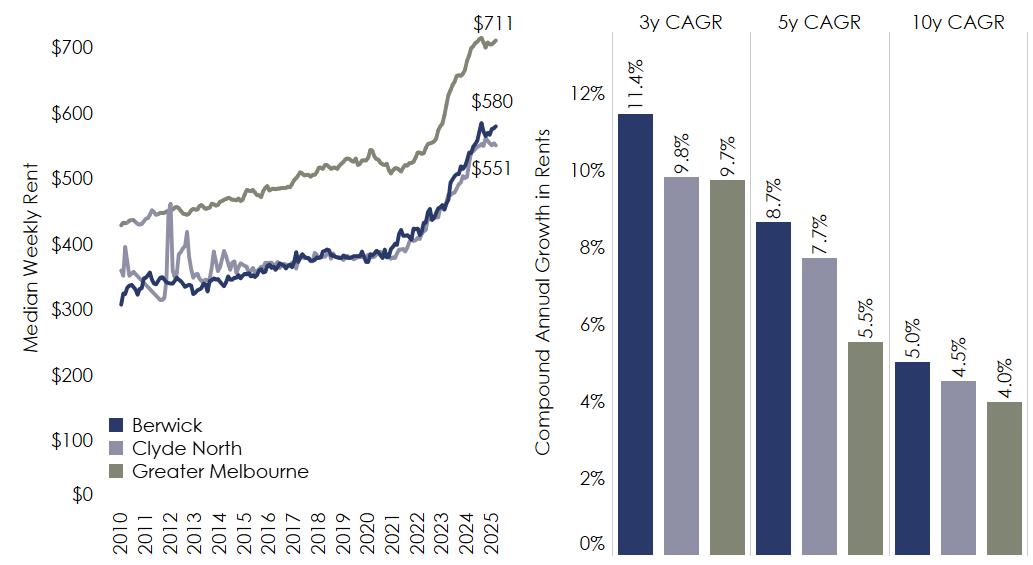
As at April 2025, the median weekly rent for a three-bedroom house in Clyde North and Berwick was $551 and $580 p.w. respectively. This was significantly more affordable than the Metropolitan Melbourne equivalent of $711 p.w.
Rents in Clyde North and Berwick did not suffer the falls experienced in central and inner Melbourne suburbs during the pandemic. As a result, rental growth over the last five years in these suburbs has outperformed the Greater Melbourne average.
Despite weekly median rents measuring below metropolitan Melbourne, recent rental growth indicates a strong demand for rental properties in the area.
*Rental data was obtained from SQM Research and is compiled at a postcode level. Clyde North in within postcode 3978 which also includes the neighbouring suburbs of Cardinia and Clyde. Berwick is within postcode 3806 which also includes Harkaway.

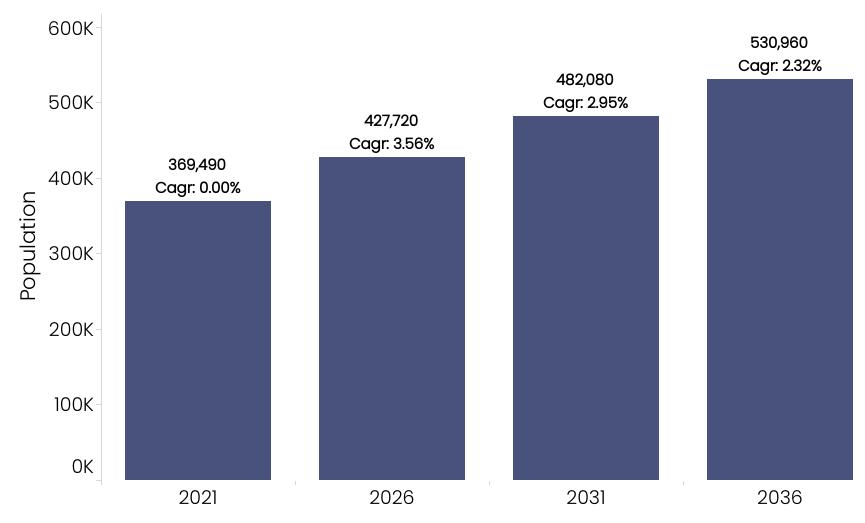
Based on the Victoria in Future (VIF) 2023 projections, the population in the Casey LGA is forecast to grow considerably to 2036. At +2.4% p.a. over the period 2021-2036, average growth is set to outpace Metropolitan Melbourne (+1.8% p.a.).
2021-2026 is expected to achieve particularly strong population growth in Casey, suggesting the LGA will benefit more than the Metropolitan Melbourne average from the return in net overseas migration.
The 25-44 years (41%) age cohort makes up the largest segment of Clyde North’s population, whilst the predominant household type is Couples with Children (59%).
The median age of Clyde North’s residents is 30 years, notably below that of Metropolitan Melbourne. This is reflective of its strong appeal to first-home buyers and young families. Over 50% of Clyde North’s population were born overseas, with 19% of the total population born in India.
Clyde North is a diverse suburb with a notable proportion of residents born overseas. Clyde North is home to many young families as evidenced by its young median age and large proportion of family households.


The primary occupation for residents in Clyde North in 2021 was Professionals (21%) and the primary industry of employment was Health Care & Social Assistance (20%).
The median annual household income of residents in Clyde North was $113,000 in 2021. This measured above the metropolitan Melbourne equivalent ($99,000).
Residents of Clyde North tend to be employed in higher paying jobs (compared to metropolitan Melbourne) across a diverse range of industries and occupations. Greater purchasing power has the potential to lead to price and rental growth as these households can afford to live in the area.

OCCUPATION

ANNUAL HOUSEHOLD INCOME

PRIMARY INDUSTRY OF EMPLOYMENT Health Care and Social Assistance


Clyde North contains a high proportion of detached housing (97%) with only a limited number of townhouses (3%) and no representation of apartment stock (as at the 2021 Census).
Clyde North’s dwelling mix contains a significantly larger proportion of detached dwellings than metropolitan Melbourne (68%).
Clyde North’s location in Melbourne’s southeastern growth corridor makes it one of the leading providers of new detached dwellings in Victoria.
Clyde North is a relatively new suburb making it a popular destination for first home buyers attracted by the area’s comparative affordability. As a result, Clyde North contains a significant proportion of homes being purchased (68%) but only a small number of homes which are owned outright (9%).
In comparison to Metropolitan Melbourne, a greater proportion of dwellings in Clyde North are currently mortgaged or rented.
Across Clyde North, a significant proportion of houses are mortgaged, pointing to the substantial demand from first home buyers. While less significant, the investor market supports the notable proportion of rented properties in the suburb.
Building approvals for new residential dwellings in Clyde North have averaged around 395 approvals per quarter since 2017.
Whilst the market slowed through 2019-20, there was an evident market uplift through 2021. This was supported by the HomeBuilder Scheme and historically low interest rates.
However, following rising construction costs and interest rates, building approvals slowed in 2022 and into 2023.
Approvals across the last 12 months have measured close to the long-term average at almost 390 per quarter.
There has been a growing representation from townhouses in Clyde North as affordability pressures support demand for more compact forms of accommodation. However, detached housing remains the predominant form of new dwelling in the suburb.
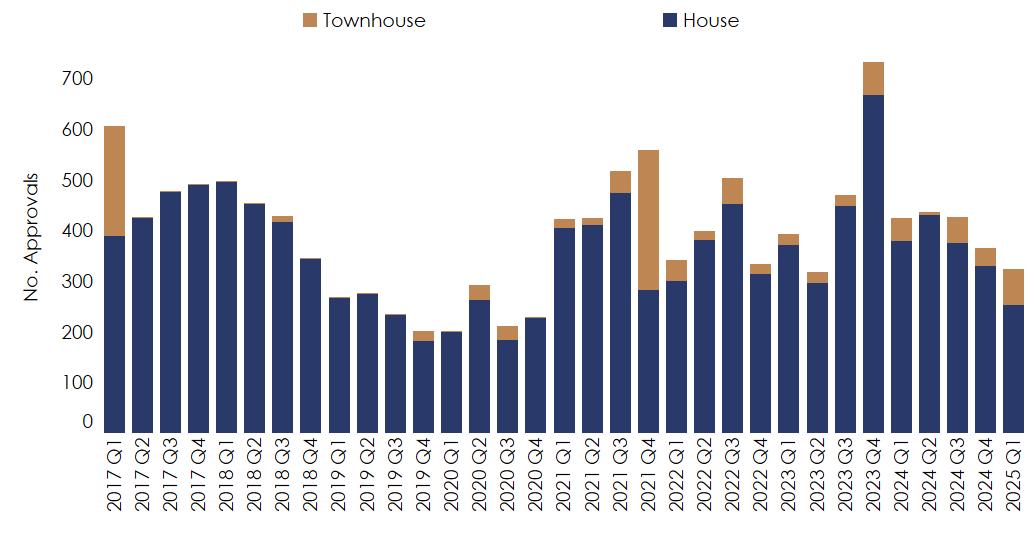
*Data is at an SA2 level and includes areas of Clyde North - North and Clyde North - South. Charter notes building approvals can be granted for a lot on a certified plan and may therefore reflect more recent supply conditions than settled sales.

The following table provides a summary recent lot sales within the suburb of Clyde North. Where available, sale prices from previous transactions have also been included.
The following table provides a summary recent lot sales within the suburb of Berwick. Where available, sale prices from previous transactions have also been included.