

Frankston City Council currently delivers a range of services under the Federal Commonwealth Home Support Programme (for clients 65 years of age and over) and the State Home and Community Care Programs for Younger People (for clients under 65 years of age).
In July 2025, a number of significant reforms to the aged care system will become operational. Like all Victorian councils, Frankston City Council must determine the future of its current CHSP services. This community engagement project is one of the first steps towards Council making its decision in mid-2025. The key engagement question was: What should Council’s future role be in supporting older residents in their homes, and supporting HACC-PYP clients?
The secondary engagement questions were:
● What services do the current clients value and require? What services do carers value and require?
● How can clients and family members/carers become aware of, and gain access to, available services and programs?
● What are the emerging needs or service gaps that Council could address to better support the community?
● What are the strengths of Council’s current services; and the challenges?
● What are the emerging needs or service gaps that Council could address to better support the community?
The following engagement activities were planned and implemented:
1. Online and hardcopy survey for clients, carers and community members.
2. Online survey for Council staff and local service providers.
3. Local service provider interviews.
4. Client interviews.
5. Community based pop-ups.
6. Community focus groups.
Engagement participants and their characteristics
The engagement activities involved a total of 929 participants (with an additional 28 participants who did not specify their connection to the project). The online/hardcopy survey was the most used engagement tool (85%) allowing participants to complete anonymous feedback in their own time.
Just over two-thirds of the participants were current CHSP clients (69%), many of whom were receiving house cleaning and laundry and home maintenance services. Over one quarter of clients could be considered long-term clients, having used Council services for
five to ten years (28%), with approximately another third using them for between one and four years (32%).
The majority of engagement participants were women (74%) and there were high levels of participation from 70-84 year olds and 85+ year olds of both genders. The living arrangements of engagement participants reflects this older age profile, with 56% living alone (spouse may have died or moved into nursing home) and 22% living with their spouse.
Current clients, their carers and community members were asked which changes would likely affect them in the next few years, or affect them more than they do now. The top five changes predicted for the future were:
● Mobility and ease of moving around (14% of all responses).
● Level of independence (13%).
● Having falls or accidents (11%).
● Illness/declining health (10%).
● Being able to drive (9%).
Council clients more frequently mentioned future changes to their level of independence, their declining health, having falls or accidents and their mobility and ease of moving around. However, community participants more frequently mentioned future changes to their understanding of how to get the services they need, loneliness, losing contact with friends and/or family, feeling unsafe at home or in the community. This may be due to the fact that they feel stable now, and anticipate that these things are likely to change as they get older.
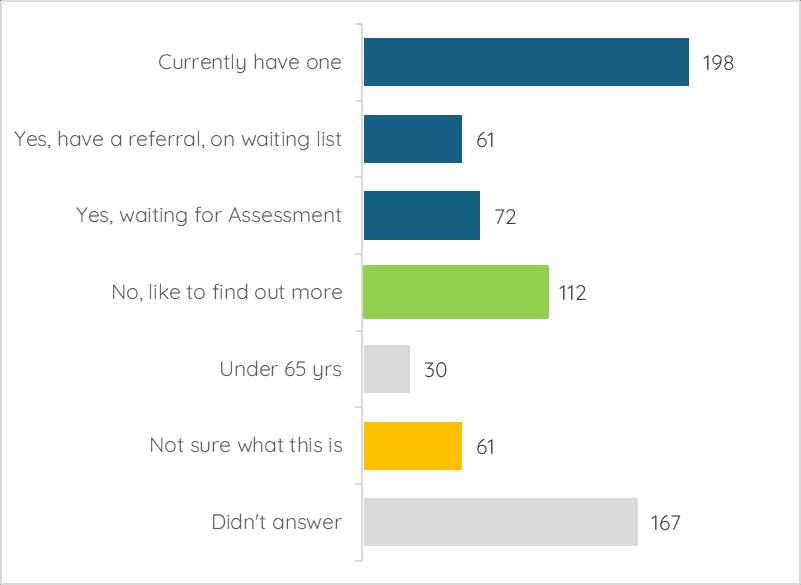
Nearly half of the Council clients indicated they were either already receiving a Home Care package (28%) or were in the process of the package application process (19%). A substantial proportion wanted to find out more about Home Care Packages (16%) or didn’t know what they were (9%). It is important to note that Council is not a Home Care Package provider.
The majority of Council clients (79%) have to pay for (some of) their fees themselves “out of pocket” but some did note that the overall fees were subsidised by either Council or through their Home Care Package. The second most common funding source was Home Care Packages (15%).
There was good engagement participation from Council staff (53 staff) with the majority being Community Care staff (81%) who worked directly with older clients. However there was low survey participation from primary carers and local service providers. Although there was limited participation from local service providers in the online survey, personal interviews were conducted with five major service providers in the area.
The key engagement question was: What should Council’s future role be in supporting older residents in their homes, and supporting HACC-PYP clients? Engagement participants were asked this question and were provided with a list of options, plus opportunity to suggest their own idea. The options were:
● I think Council should provide all community care services using Council employees (no change).
● I think Council should provide services where there is/expected to be limited new providers (fill gaps in services only).
● I think Council should provide information about available services and how to get help (no other services provided).
● I think Council should cease providing community care and allow other organisations to provide a similar service.
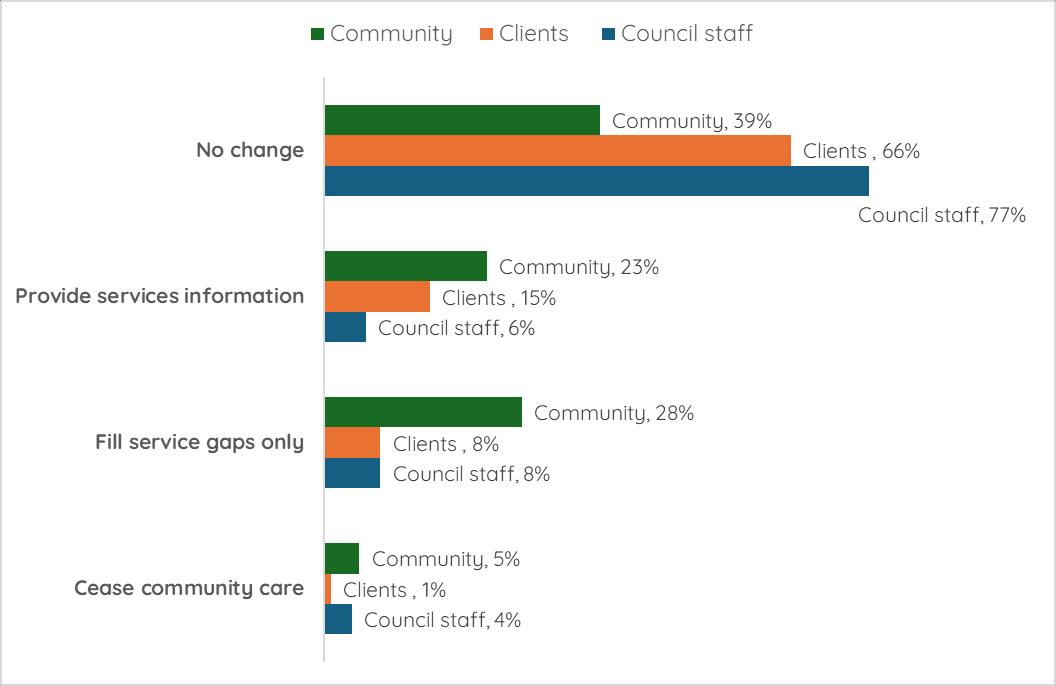
Nearly two-thirds of engagement participants (61%) supported the ‘no change’ option, that Council should provide all community care services using Council employees. Not surprisingly support for the ‘no change’ option was highest for current clients (66%) and Council staff (77%). There were a small number of carers and local service providers overall but most carers supported the ‘no change’ option and service providers were split between ‘no change’ and other types of roles for Council.
The key reasons behind this belief in a ‘no change’ option were:
● Council is a trusted service provider that is important to the community.
● Quality of care should be prioritised over making a profit.
● Uncertainty about the quality of care and potential for exploitation if changes were made.
● No change is less disruptive to clients.
The second most popular option was that Council should provide information about available services, system navigation and how to get help (16%). This option created confusion for some engagement participants in the first week of engagement. It was intended to be an information role only for Council (that is, no other services would be provided). However in some survey responses it was interpreted as an add-on service to the options available, not as an alternate option. This option was clarified in all subsequent faceto-face engagements and, in the online survey.
The third most popular option was that Council should ‘fill gaps in services only’, that is to provide services where there is/expected to be limited new providers (12%). Looking at just the feedback from the wider community, their reasoning was about not duplicating existing services, Council only delivering larger scale services such as community transport and delivered meals, staying in the market as they are trusted and that there should be no net cost increases to Council.
Only 2% supported Council ceasing as a provider of community care and accepting the increase of other organisations to provide a similar service.
When local service providers were asked about the future role of Council, five participants selected the ‘no change’ option, two participants selected ‘fill service gaps’ option and four responded with an unclear response or alternate option (coded as another role for Council). Reasons for giving the ‘no change’ option were about the quality and trustworthiness of Council services and their strengths in service access and navigation. Another consideration was retaining continuity of care for clients and minimising disruption to aged care services.
One service provider shared concerns about competing with Council on the private market, as Council owns their facilities and amenities which other providers do not (leasing buildings).
The top five strengths of the current Council service according to clients and staff were:
● Friendly and understanding staff.
● Meets their needs well.
● Easy to contact to change service/appointments.
● Continuity of care/ongoing relationship with staff.
● Punctuality and, Quality of service/skilled staff (equal number of mentions).
The other strengths identified by participants were reliability (different to punctuality) and the holistic model of care offered by Council.
Clients were more likely to nominate the strengths of the Council service as punctuality, staff speaking their language and being easy to understand, friendly and understanding staff, staff being the same gender and being easy to contact to change services or appointments. Council staff were more likely to nominate the cost of the service, the quality of service (attentive and skilled staff), continuity of care/ongoing relationship with the staff and that the organisation is trusted and has a good reputation.
The potential improvements or changes to the current Council service according to clients and staff were:
● Expanded range of services/more or increased frequency of services.
● Resolving barriers using the ‘system’, better communications.
● Improvement to specific services.
● Improvement related to timing, scheduling, staff resourcing.
Clients suggested more assistance with resolving their barriers using the ‘system’ and better communications - they wanted a one-on-one conversation with someone who could take the time to listen and answer their questions. Understandably clients were more likely to suggest improvements to specific services such as cleaning of windows, gutters, cobwebs;
meal choices that are suitable to personal taste or dietary restrictions; assistance with lifting or moving heavy items and having consistency of cleaning standards across different staff. Council staff were more likely to suggest improvements related to timing/scheduling and staff resourcing.
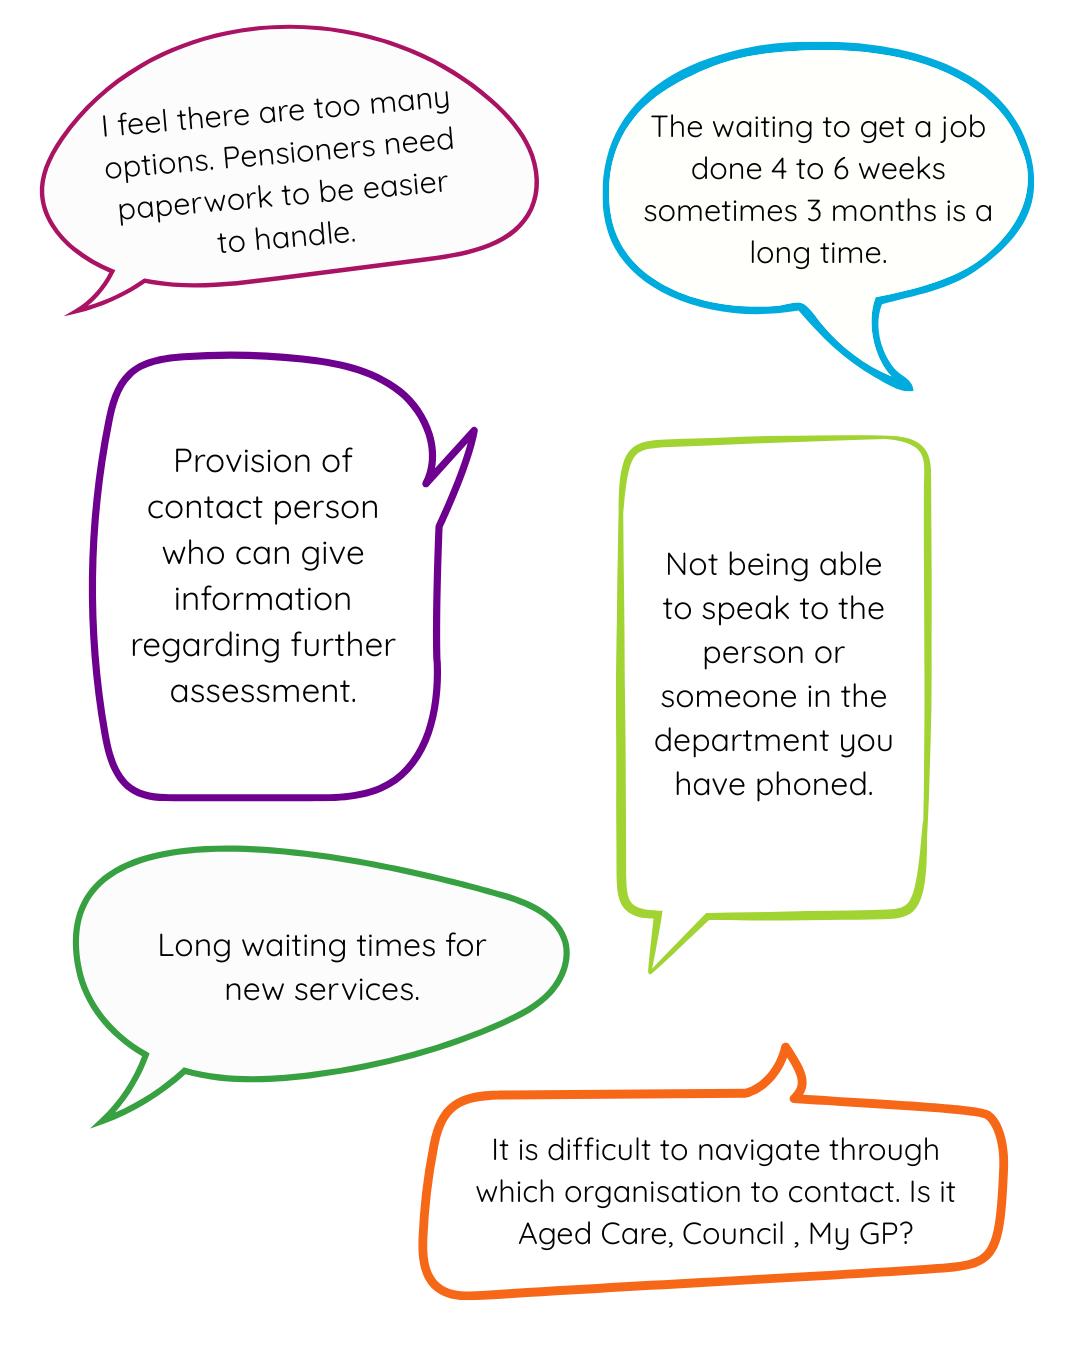
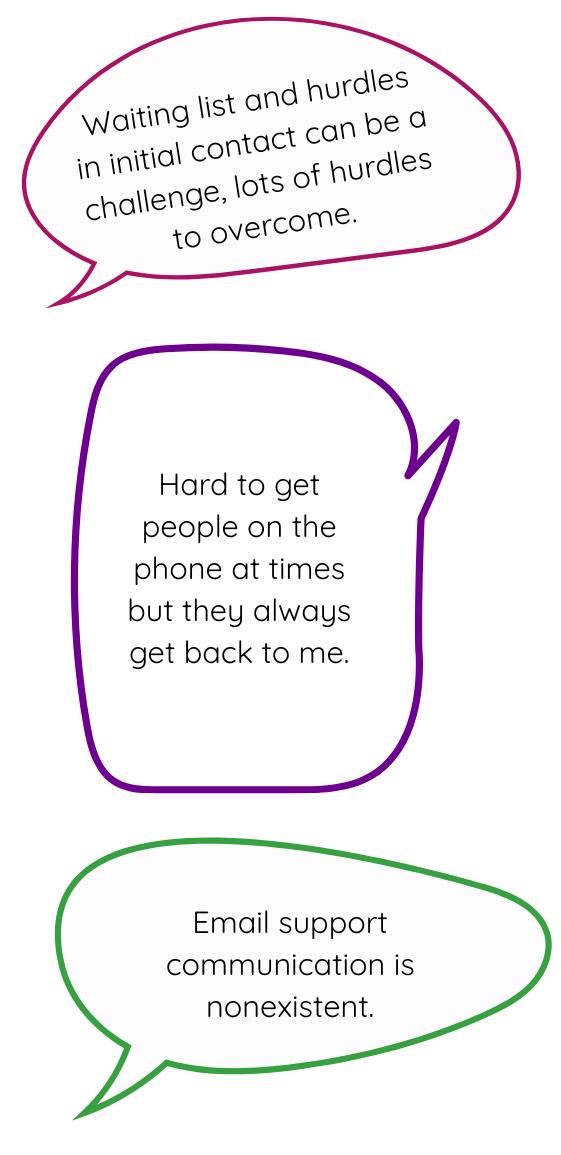
Current Council clients and their carers were asked about any frustrations or challenges when trying to get support or assistance. They mentioned being told there is no capacity (service is ”full”) or that the requested service is not offered/unavailable, experiences of poor communication, not being eligible for services, the complex assessment process and the costs of services not provided in Packages.
When asked about what would help older people the most to access the services and support they need, participants said:
● Description of the different services available - what is … (25%).
● Information on how to access these services - who to call, apply to (25%).
● Speaking to someone on the phone or in person (18%).
The enablers needed by current Council clients and primary carers mirrored these preferences above. Community members were more likely to say: speaking to someone on the phone or in person and more funding/more services.
Council staff were more likely to say the enablers were speaking to someone on the phone or in person, or a description of the different services available. Workers from local service providers were more likely to say the enablers were a description of the different services available and services being located close to the client’s home.
Participants who answered surveys or were interviewed were asked about the most important supports in service delivery for people who were born outside Australia, come from a culturally diverse background and/or speak a language (other than English at home). Their top two responses were: opportunities to speak in their language (23%) and opportunities to socialise with people from their home country (22%).
Other services being used by older people in the Frankston council area included SAI Home Care, Jim's Mowing, NDIS, Orange Door, Trilogy Care, Benetas, Brotherhood of St Laurence, Mercy Health, Australian Unity, Focus Care, HenderCare, Vasey RSL, Bolton Clarke, cohealth, Kingston Council, Mentis, Peninsula Health - Aged Strong and Uniting Age Well.
Some local service providers participated in this engagement by completing the online survey or a personal interview (targeted to Benetas, Brotherhood of St Laurence, Peninsula Health, Bolton Clarke and mecwacare). Overall the bulk of service provider participants worked for not-for-profit organisations, rather than ‘for profit’ businesses. They provided a range of aged and community care services including social programs and residential care.
In terms of best practice, Council Community Care staff recognised their service for being one that listens and provides human contact; a service that has clear rules on the delivery of service and the stability, consistency and accessibility of the service. Local service providers recommended training in clinical governance in CHSP, doing timely assessments with detailed documentation, MARAM domestic violence and trauma informed training and the Dementia Specialist at Benetas.
Commonly participants noted that the demand is greater than the supply for many services. Participants described many of these services were provided within their organisations, however funding is not adequate to support the number of referrals. Participants also described referring clients to other organisations and finding there are long wait lists.
In terms of supporting older people, service providers saw the following specific gaps:
● Home modifications and specific equipment such as fall monitors, incontinence products.
● Transport, gardening and domestic assistance services.
● Social support programs, companionship, social visits.
In terms of supporting younger people, service providers mentioned home help, system navigation support with NDIS and transport. There were service gaps for carers needing respite care, social/mental health support and transport. Participants noted that their services did not have funding or deal directly with carers, referring them often to the Carer Gateway.
Both Council Community Care staff and local service providers were asked about their current challenges with client care and support. The most commonly mentioned challenges were:
● Service demand well exceeds what's available.
● Waiting times after package funds are used early, and long wait lists to access support when not on an appropriate plan and, for initial CHSP assessments and reassessments.
● Poor quality aged assessments completed on the phone.
● Managing the carer workforce - lack of staff, staff wanting casual work only, loss of corporate knowledge when staff leave following exit from CHSP.
● Inaccurate information about services on MyAgedCare
● Poor client understanding of the service offering, funding and how it works.
● Clients not keeping appointments.
● Dealing with clients that struggle with loneliness, mental health issues and/or substance abuse.
● Clients using three or four different providers - multiple procedures and documents to read/sign, no continuity of care.
This engagement involved 929 participants including current Council clients, carers, older residents, local service providers and Council staff. When asked what Council’s future role should be in supporting older residents in their homes and supporting HACC-PYP clients, nearly two-thirds of engagement participants (61%) supported the ‘no change’ option - that Council should provide all community care services using Council employees.
The key reasons behind this belief in a ‘no change’ option were that Council is a trusted service provider that is important to the community, that quality of care should be prioritised over making a profit and uncertainty about the quality of care and potential for exploitation if changes were made.
Frankston City Council currently delivers a range of services under the Federal Commonwealth Home Support Programme (for clients 65 years of age and over) and the State Home and Community Care Programs for Younger People (for clients 65 years and under).
The Commonwealth Home Support Programme (CHSP) is an “entry-level in-home aged care support program that helps older people to live independently in their homes and communities. The CHSP also provides respite services to give carers a break.” 1 As at November 2024, there were 1850 CHSP clients receiving services from Council.
The services currently provided by the 110 Council staff are:
● Meals on Wheels.
● Home maintenance and modifications.
● Community Transport.
● Planned activity outings/social support.
● Personal care including escorted and unescorted shopping.
● Domestic assistance (approximately 80% of all Council service delivery).
● Respite care.
● HACC-PYP Assessment.
The Home and Community Care Program for Younger People (HACC-PYP) is funded and managed by the Victorian Department of Health. The program supports people when their capacity for independent living is at risk due to chronic illness, mental health issues, disability or other conditions. 2 As at November 2024, there were 160 HACC-PYP clients receiving services from Council.
In July 2025, a number of significant reforms to the aged care system will become operational. The new Aged Care Bill 2024 passed both houses of Parliament on 25 November 2024 and following Royal Assent, it will become the new Aged Care Act from 1 July 2025.
The Act focuses on empowering older people and upholding their rights, needs and personal choices. The Act will include a Statement of Rights which recognise (amongst other rights):
● Independence, autonomy, empowerment and freedom of choice.
● Equitable access.
● Quality and safe funded aged care services.
1 https://www.health.gov.au/our-work/chsp/about
2 https://www.health.vic.gov.au/home-and-community-care/hacc-program-for-younger-people
Like all Victorian councils, Frankston City Council must determine the future of its current CHSP services. This community engagement project is one of the first steps towards Council making its decision in mid-2025.
The purpose of this engagement project was to:
● Understand the experiences of Council staff in delivering the current services and their perspective on what their clients value and require.
● Understand which aspects of the current services are valued by the clients and their family members and/or carers.
● Identify other service providers being used by current clients for support.
● Seek feedback on which aspects of the current services that could be improved.
● Identify emerging needs or service gaps that Council could address to better support the community.
● Explore what the community believes is the role of Council in the community care sector.
The scope of the engagement excluded the following topics:
● Decisions associated with the administration of Council such as organisational staffing for community care.
● Measuring client satisfaction levels with current service provision.
● The amount of funding clients are eligible to receive through the different State or Federal funding packages, and wait times to receive packages.
● The size of Council’s Community Care operational budget.
● Any Council-owned/managed community infrastructure for older adults and the elderly.
An external engagement company, Conversation Co., was responsible for the planning and delivery of the engagement program. An engagement plan was developed outlining:
● Project timelines and scope.
● Challenges and opportunities associated with engaging young people.
● Level of stakeholder influence, including negotiables and non-negotiables for input.
● Outline of engagement activities planned.
● Measures of success for the project.
A mixed-method community engagement program consisting of online and face-to-face activities was used to reach participants from a range of different levels of interest in the project. The engagement activities were based on the IAP2 Public Participation Spectrum of ‘Inform’ and ‘Consult’.
The key engagement question was: What should Council’s future role be in supporting older residents in their homes, and supporting HACC-PYP clients?
The secondary engagement questions were:
● What services do the current clients value and require? What services do carers value and require?
● How can clients and family members/carers become aware of, and gain access to, available services and programs?
● What are the emerging needs or service gaps that Council could address to better support the community?
● What are the strengths of Council’s current services; and the challenges?
● What are the emerging needs or service gaps that Council could address to better support the community?
The engagement activities are listed in Table 1 and were developed to best suit the project timeline and budget. Community engagement was conducted from 26 February to 6 April 2025.
Online survey hosted on the Engage Frankstonpage and hardcopy client survey posted to all clients
Staff and service provider online surveys hosted on the EngageFrankston page
Local service provider interviews (5 interviews x 60 mins duration)
Client interviews (minimum of 20 interviews x 30 mins duration)
Provided an opportunity for participants to provide confidential feedback at their convenience, without having to attend face-to-face engagement.
Provided an opportunity for participants to provide confidential feedback at their convenience, without having to attend face-to-face engagement.
Provided an opportunity for participants to provide confidential feedback at their convenience, without having to attend face-to-face engagement. Ability to probe and clarify answers.
Provided opportunity for participants to provide confidential information at their convenience, without having to attend face-to-face engagement. Ability to probe and clarify answers.
CHSP and HACC PYP clients, carers and the wider community
Council staff and service providers
Service providers (list provided by Council)
Council clients (list provided by Council)
Community based pop-ups organised by Conversation Co. (3 locations x 2 hours duration)
An additional 5 pop ups were organised by Council.
Focus groups (maximum 5 sessions x 60 mins duration)
Captured participants’ feedback whilst out in the community. Participants were invited to provide feedback in a variety of ways.
Focus groups provided an opportunity to explore key themes in more detail, provide a facilitated environment for informed contributions
All stakeholders
Targeted advisory groups (list provided by Council)
The five online surveys were hosted on the EngageFrankstonproject page from 26 February to 6 April 2025. A hardcopy version for clients was also used.
An interview script was developed based around the service provider survey questions. The five targeted organisations were
1. mecwacare - a not-for-profit, non-denominational charitable organisation.
2. Bolton Clarke - formerly known as Royal District Nursing Service and RSL Care.
3. Brotherhood of St Laurence - a social justice organisation.
4. Peninsula Health - a major public health service.
5. Benetas - a not-for-profit organisation. The five interviews were conducted via telephone or Zoom.
All current clients (as at 26 February 2025) were informed by letter of this engagement project. Council provided a list of 45 client names and contact information to Conversation Co, who had previously provided consent for further contact to discuss the services they use. From this list, a minimum of 20 clients were randomly selected to participate in a telephone interview. Overall 27 interviews were completed using an interview script based around the Council client survey questions.
Three pop-up sessions of two hours duration were conducted by Conversation Co at the Chatty Cafe at Frankston Library/Community Centre, the Foot Street shops and the Carrum Downs Shopping Centre during March 2025. Five other pop-up sessions were conducted by Council at various locations across the municipality.
Pop-up activity plans were developed based on the following survey topics:
● Health and wellbeing factors that could change as people age.
● Ways that people access support or get in touch with a service.
● Which services they use, if any.
● Key strengths of the Council service, if used.
● Future role Council will play in the delivery of community care services.
The five targeted community groups were
1. Age Friendly Ambassadors.
2. U3A Frankston.
3. Disability, Access and Inclusion Committee (DAIC).
4. Frankston Youth Hang out and Secondary College Social Justice Group.
5. PESC (Peninsula Ethnic Seniors Council).
Focus group activity plans were developed based on the following survey topics:
● Health and wellbeing factors that could change as people age.
● Ways that people access support or get in touch with a service.
● Future role Council will play in the delivery of community care services.
● Any other perspectives based on their experiences as clients, carers or interested residents.
The members of PESC (Peninsula Ethnic Seniors Council) could not meet as a group during the engagement period so they were offered the opportunity to participate in a guided discussion using the online survey questions. Three members of the group participated.
The first three focus groups were conducted as planned during March 2025. Members of the Frankston Youth Council and other young persons’ groups were difficult to engage, which was understandable given the topic. As an alternative, Conversation Co. attended Frankston Youth Central during an after-school session and also ran a short workshop with a group of students from a local secondary school.
Six personas were developed to assist the young participants to understand the support needs and typical service usage of the HACC-PYP clients. The personas covered the following scenarios:
● Primary school aged child with autism.
● Teenager with cerebral palsy.
● Teenager with long-term depression and anxiety.
● Adult aged in their twenties requiring an assessment to manage a chronic illness.
● Adult aged in their twenties who uses a wheelchair.
● Adult aged in their thirties with schizophrenia.
The project was promoted to community members, Council staff and local service providers using a variety of Council communication channels and tools. The Australian Service Union was informed by Council.
Project information and the available opportunities to participate in the engagement were provided to the community using the following channels:
● Printed postcards distributed during the pop-up sessions, and in libraries and community buildings, with QR code linked to the EngageFrankstonproject page.
● Hardcopy versions of the online surveys.
● Engagement boards/A4 posters for use at community pop-ups and display at libraries, reception areas and community centres.
● Email, SMS and calendar invites to all Community Care staff.
● CEO Updates to all Council staff.
● Letters mailed to all active CHSP and HACC-PYP clients.
● Emails to key service providers of CHSP and HACC-PYP services, residential care providers, seniors’ groups and Positive Ageing contacts.
● March issue of Frankston City Council eNews and PositiveAgeingTogether , libraries, community centres and Let’sBeFrankeNews.
● Media release sent to local media outlets.
● Project page on EngageFrankstonwebsite.
● Social media – organic and paid advertisements about the project milestones and dates of community pop-ups.
● Email request to an existing contact at a local secondary school.
● Project information distributed via the Peninsula Care Planning Group (PCPG) which represents CHSP and Home Care Package providers - private, not for profit and local government.
Some noted barriers to engagement participation were:
● Under-utilised engagement location: Although selected for its typical high level of foot traffic on a weekday morning, the Foot Street shopping strip did not attract the anticipated volume of participants.
● Complex service system and language: The aged care system and the reform agenda is complex and uses technical terms or abbreviations. Older people, their families and their carers often struggle with accessing information and understanding its implications. Potential participants in the engagement may have had interest in the issue but found the terminology too challenging. For example the term “community care” means different things to different people. This may have put off potential participants, thinking they have no personal experience in the issue.
● Difficulty articulating future needs: One of the engagement questions asks participants to anticipate or express their future service requirements or health and wellbeing impacts (e.g. loneliness, level of independence etc). Responses to this question may have been affected by inability to appreciate their likely needs and difficulty accepting the inevitable future changes.
● Unclear service responsibility: Related to the previous point about the complex servicer system, some participants may be unclear about exactly who provides their service (contracted by Council or Council itself) and which organisation is partfunding or fully funding their services (My Aged Care, Council).
● Participation by carers: Carer participation was low. This may be because of nontargeted project communications or the nature of the carers’ everyday lives (time poor, often physically and mentally exhausted). It could also be a result of CHSP clients having low needs and receiving entry level care only. Home Care Package clients have higher needs.
● Absence of costing information and specific service delivery options: The key question about the future role of Council is a complex one and some participants may have found the engagement questions too broad in nature and so more difficult to ‘weigh up’ their response.
Throughout this report, the abbreviation “n=” is used to indicate the number of participants or responses and percentages have been rounded to whole percentages (x%).
4.1 Participation by engagement activity
Table 2 shows a summary of the engagement activities which involved a total of 929 participants. The online/hardcopy survey was the most used engagement tool (85%) allowing participants to complete anonymous feedback in their own time.
The community pop-ups were used to collect real-time feedback but also to encourage online survey completion at a later time (if preferred). Participants at pop-ups and community focus groups were asked to complete the demographics survey card ‘on the spot’. These were then entered as survey responses so are counted in the number of surveys.
Table 2. Participation by engagement activity
Attendance at three community pop-ups (estimated) 85
Attendance at community focus group participants 40
Note: An additional client interview was conducted after the close of the engagement and is not included in Table 2.
Note: There were 28 additional participants who attended a community pop-up or a focus group however they did not indicate how they connected to the project (e.g. were a carer or client etc).
It should be noted that participants were given the choice to complete one of the following surveys:
● Survey for current clients receiving Council services.
● Survey for primary carers.
● Survey for interested community members.
● Survey for local service providers.
● Survey for Council staff (any staff).
Consistent with the issues noted in 3.4 Barriers to participation, this terminology caused confusion for some participants. Some Council staff completed either the service provider or carer survey. Some carers completed the client survey, maybe not relating to the term “primary carer”. Some Council clients completed the community survey. Responses were reassigned to their correct stakeholder group where it was obvious the ‘incorrect’ survey had been completed. However there will be missing data across all the engagement questions as different questions were included in each survey.
There were 28 additional participants who attended a community pop-up or a focus group however they did not indicate how they connected to the project (e.g. were a carer or client etc).
Just over two-thirds of the participants were current CHSP clients (69%) and a further 11% were older residents aged 65 years and over (some of whom were receiving services from other providers). Only 13 carers participated in the engagement (1%). There was good participation from Council staff (53 staff) - more information about this group is presented in 4.3.3
Data sources: Surveys, interviews, youth activities, pop-ups and focus groups. Note: There were 28 additional participants who attended a community pop-up or a focus group however they did not indicate how they connected to the project (e.g. were a carer or client etc).
Table 4 provides a broad overview of the age groups for these sub-groups. Further age data is shown in 4.3 Characteristics of clients and carers. Community participants ranged from teenagers and young adults, through to the elderly age groups.
Table 4. Broad age groups by connection to the project
Data sources: Surveys, client interviews. The number of carers is too small so ticks are shown instead of percentages.
4.3.1 Services used by clients and community members
Current Council clients and their carers were asked which Council service they were using - as expected the majority were aged or home and community care clients (88%), with a small number of HACC-PYP clients (7%).
Table 5. Services used by clients and community members
organised services, informal carer only
TOTAL participants using range of services
Data sources: Surveys, client interviews.
The HACC-PYP clients and community members were asked what additional services they were currently using (other than Council). In total there were 38 participants (5%) using other aged or home and community care services. The HACC-PYP clients were using SAI Home Care, Jim's Mowing, NDIS “disability services”, Orange Door social workers, university student support (social workers), volunteers from their temple and an unnamed private provider.
The community members were using the following services:
● Trilogy Care (n=5).
● Benetas incl. Benetas Hurlingham Day Centre (n=4).
● Brotherhood of St Laurence (n=4).
● Mercy Health (n=3).
● Australian Unity, Focus Care, HenderCare, Vasey RSL (each n=2).
● Bolton Clarke, cohealth, Kingston Council, Mentis, Peninsula Health - Aged Strong, Polish community service, Uniting Age Well (each n=1).
● unnamed private providers or “aged care package”.
Current Council clients and their carers were asked then which specific services they were using, selected from a provided list. Figure 1 shows that house cleaning and laundry (n=518, 48%) was the most commonly used service, followed by home maintenance (n=197, 18%).
Figure 2 shows that over one quarter of clients could be considered long-term clients, having used Council services for five to ten years (28%), with about another third using them for between one and four years (32%). A large proportion of clients did not answer this question (24%) but were using a variety of Council services.
1. Specific services used by Council clients
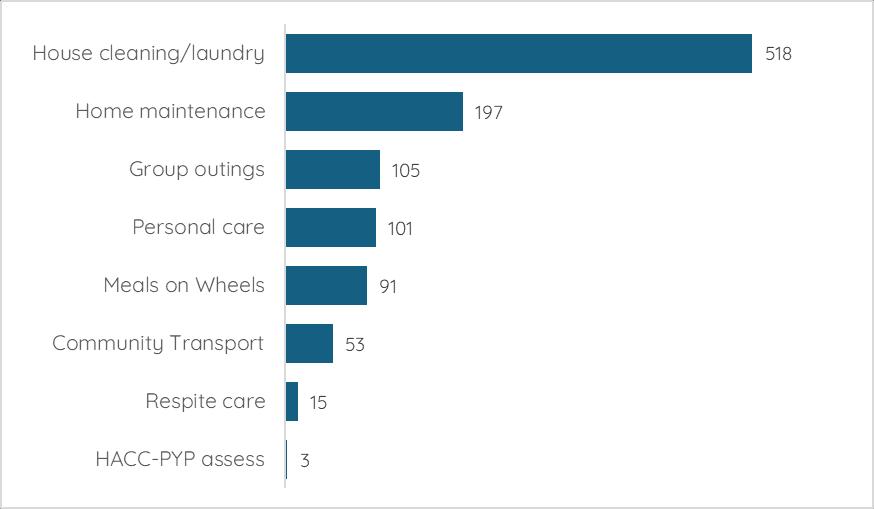
Data sources: Surveys, client interviews, community pop-ups. Multi-response question so percentages are % of total responses (n=1090), not participants.
2. Length of time using Council services
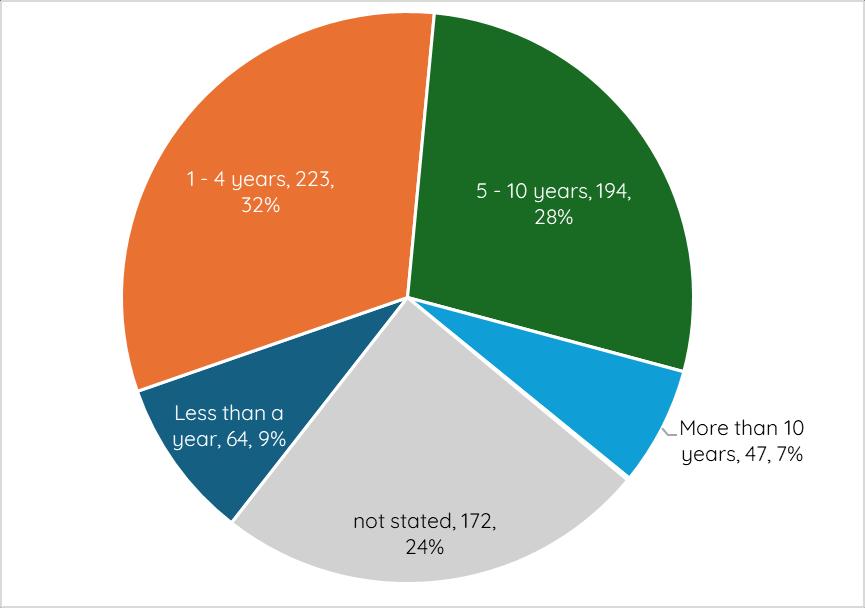
Data sources: Surveys, client interviews.
Nearly half of the Council client participants were either already receiving a Home Care package (n=198, 28%) or were in the process of the package application process (n=133, 19%). A substantial proportion wanted to find out more about Home Care Packages (n=112, 16%) or didn’t know what they were (9%). Again a large proportion of clients did not answer this question (24%) which may indicate another sub-group of people who have low/no
awareness of Packages. It is important to note that Council is not a Home Care Package provider.
Current Council clients and their carers were asked how they currently pay for the services they receive. Table 6 shows that the majority of clients (n=546, 79%) have to pay for (some of) their fees themselves “out of pocket” but some did note that the overall fees were subsidised by either Council or through their Home Care Package. The second most common funding source was Home Care Packages (n=105, 15%), with a small additional number of clients using their private health insurance or Medicare (n=19, 3%)
A small number of clients had their services funded through the National Disability Insurance Scheme or had family covering their costs. The additional comments made by clients were: they were a Department of Veterans Affairs Gold Card holder, or were putting off applying for a Package or NDIS until they really needed it.
Further information about affordability of service fees are presented in 5.3 Improvements or changes to Council services.
for it themselves ‘out of pocket’ (often Council subsidised)
No need to pay, cared for by family/friend
Prefer not to answer
(1%)
(1%) Other source/comment
(0%)
Data sources: Surveys, client interviews. Multi-response question so percentages are % of total responses (n=699), not participants. Where the total number of responses was under ten, no further analysis was undertaken (grey shaded cells).
Demographic questions were included in the client, community and carer surveys and popups and focus group participants were also encouraged to complete using the postcard shown in Appendix 1 - Promotional poster and postcard. On average about 830 participants (out of the 1043) answered the basic demographic questions of age group, gender and suburb. Tables 7 and 8 show these characteristics, compared to the general community characteristics from the 2021 Census.
Table 7. Demographic characteristics of participants
Gender
Data sources: Surveys, community pop-ups, client interviews, focus groups. Data source for 2021 Census data is https://profile.id.com.au/frankston/ * Percentages for living arrangements are estimated for households without children, or households with older children.
As expected the majority of engagement participants were women (74% compared to community proportion of 51%), common for community engagement overall but particularly for a topic of this nature. Representativeness by age group is not particularly relevant for this engagement project as the primary target group was persons aged 65 years and over. There were high levels of participation from 70-84 year olds (54%) and 85+ year olds (26%), and proportional participation from 60-69 year olds (10%). The living arrangements of engagement participants reflects this age profile with 56% living alone (spouse may have died or moved into nursing home) and 22% living with their spouse. This high percentage of older people living alone should be noted when looking at the engagement findings about support needs.
Participants were also asked if they identified with particular communities of interest from a provided list (refer to Table 7). Overall 719 participants responded, with 376 participants identifying with one or more of these communities. The remaining 44% did not identify with any of these communities (n=316) and 4% (n=27) preferred not to answer the question.
The 376 participants provided 411 responses to this multi-response question. Not surprisingly a large proportion of participants said they were a person with a disability or long-term health condition (n=311, 76% of responses).
A positive outcome was the relatively high proportion of participants who spoke a language other than English (n=83, 20% of responses). Participants who indicated they spoke a language other than English at home spoke a wide range of languages or were bi-lingual, with the most common languages being German (n=9), Italian (n=8) and Polish (n=6). A small number of participants identified as part of the LGBTIQA+ community (n=10, 2% of responses) and/or being an Aboriginal and/or Torres Strait Islander (n=7, 2% of responses).
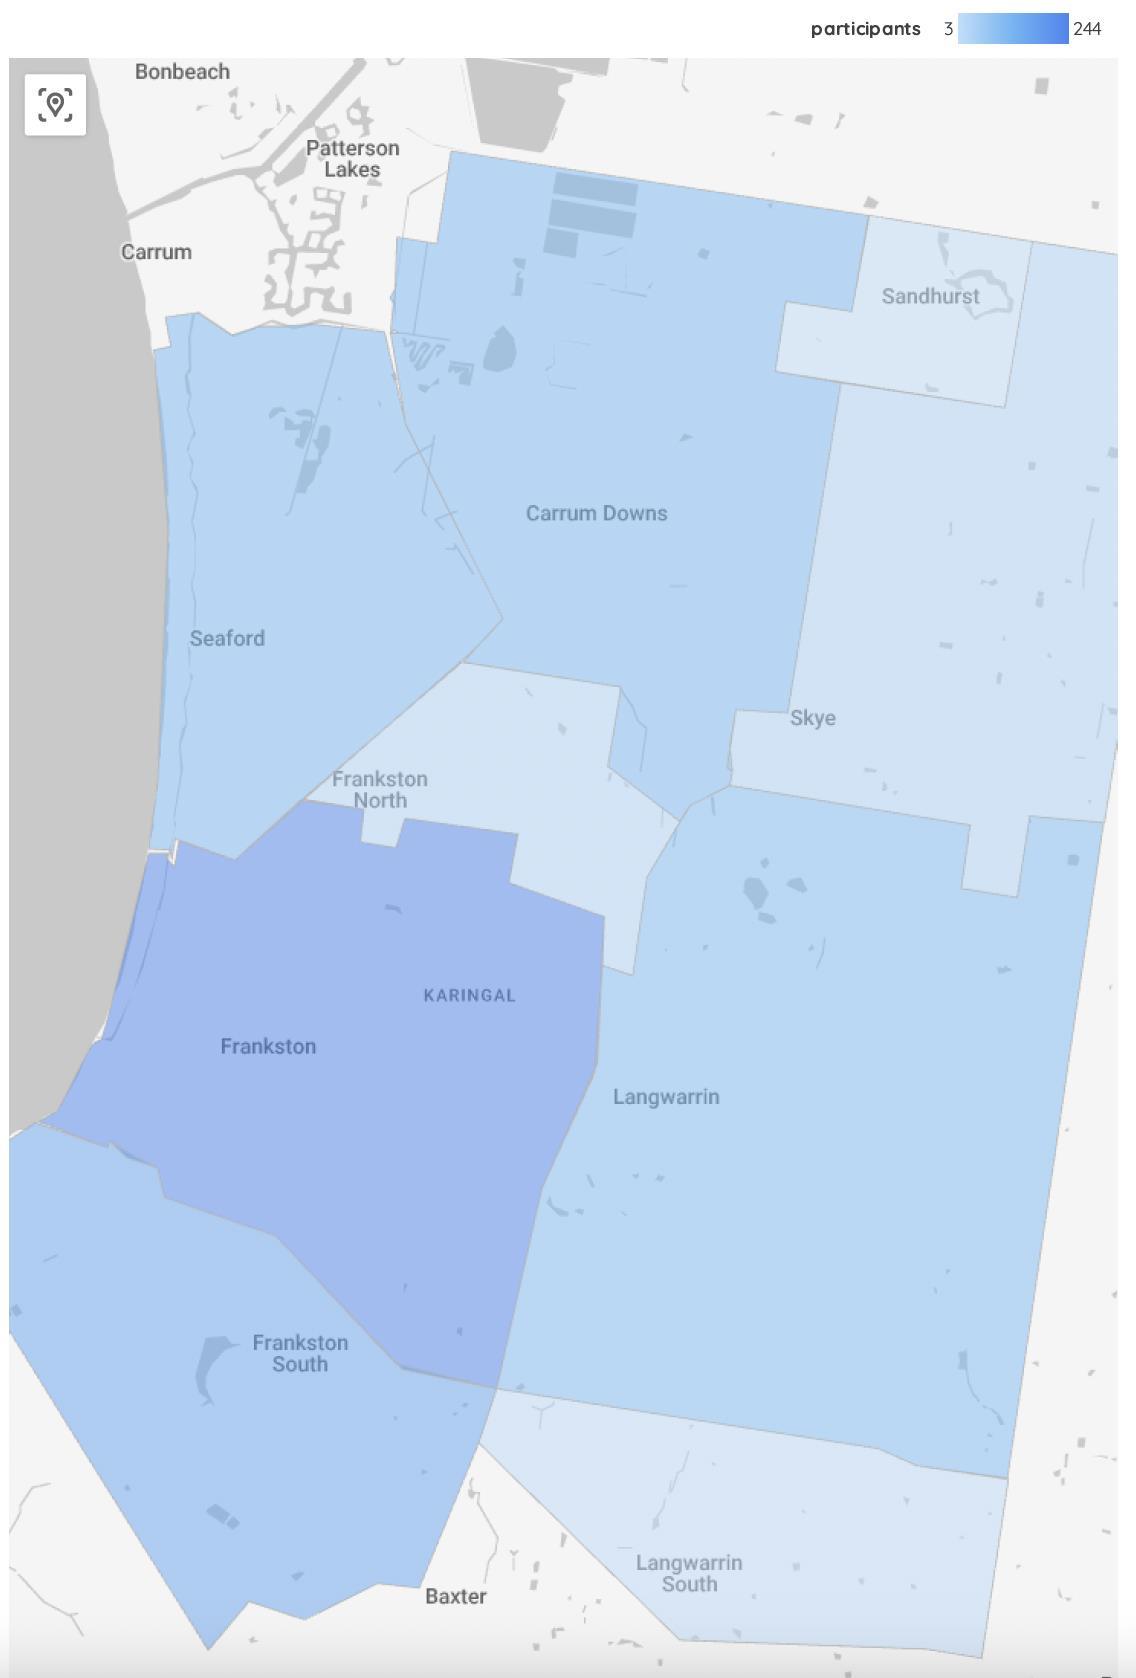
At the time of the 2021 national Census, the largest populations of older adults - in number terms - lived in Carrum Downs, Seaford, Langwarrin and Frankston South. There are large retirement villages and aged care sites in both Frankston South and Carrum Downs. The largest populations - in percentage terms - lived in Seaford, Frankston and Frankston South.
Table 8 shows the participants’ residential locations in the municipality. There was a good spread of participants across the suburbs and largely proportional representation. One of three community pop-ups was based in Carrum Downs however did not achieve proportional participation in this engagement. Appendix 4 shows a thematic map of participants’ residential locations - refer to Appendix 4 - Map of participants’ residential location
Data sources: Surveys, community pop-ups, client interviews, focus groups. Data source for 2021 Census data is https://profile.id.com.au/frankston/
4.3.4 Profile of Frankston City Council staff participants
Frankston City Council staff were asked to provide some additional details to distinguish Community Care staff from other Council staff. The majority of staff participants were Community Care staff (81%) who worked directly with older clients.
Current clients, their carers and community members were asked which changes (provided from a list) would likely affect them in the next few years, or affect them more than they do now. Table 10 shows that the top five changes predicted for the future were:
● Mobility and ease of moving around - 531 responses (14% of all responses).
● Level of independence - 509 responses (13%).
● Having falls or accidents - 404 responses (11%).
● Illness/declining health - 381 responses (10%).
● Being able to drive - 341 responses (9%).
Comparing the responses of Council clients with those from general community participants, there were a total of 2950 responses from clients and 620 from community members. Council clients more frequently mentioned future changes to their level of independence, their declining health, having falls or accidents and their mobility and ease of moving around.
The age profile of the community participants was mostly 70 to 84 years or 60 to 69 years. Community participants more frequently mentioned future changes to their understanding of how to get the services they need, loneliness, losing contact with friends and/or family, feeling unsafe at home or in the community. This may be due to the fact that they feel stable now, and anticipate that these things are likely to change as they get older.
Almost all the ‘Other’ changes mentioned by participants were explanatory comments giving extra detail about living arrangements or specific illnesses.
Table 10. Predicted changes for clients by stakeholder category
TOTAL responses 3824
Data sources: Surveys, community pop-ups, client interviews. Multi-response question so percentages are % of total responses (n=3824), not participants.
Figure 4 shows a summary of these predicted future changes.
Figure 4. Summary of predicted changes in future years
Data sources: Surveys, community pop-ups, client interviews.
The key engagement question was: What should Council’s future role be in supporting older residents in their homes, and supporting HACC-PYP clients?
Engagement participants were asked the specific question of ‘What do you think Frankston City Council’s future role should be, regarding the community care service?’ and were provided with a list of options:
● I think Council should provide all community care services using Council employees (no change).
● I think Council should provide services where there is/expected to be limited new providers (fill gaps in services only).
● I think Council should provide information about available services and how to get help
● I think Council should cease providing community care and allow other organisations to provide a similar service.
● Other roles for the Council (specify). They were then asked to comment on the reason for their response.
Table 11 shows the answers provided by all participants and also for each of the sub-groups of current Council clients, carers, local service providers, Council staff and the general community. It should be noted that there were a total of 957 responses to this question, with an additional 28 participants not indicating how they were connected to the project.
Nearly two-thirds of engagement participants (61%) supported the ‘no change’ option, that Council should provide all community care services using Council employees.
The second most popular option was that Council should provide information about available services and how to get help (16%). This option created confusion for some engagement participants in the first week of the engagement. It was intended to be an information role only for Council (that is, no other services would be provided). However it was interpreted as an add-on service to the options available, not as an alternate option. From the second week, this option was explained clearly at all the face-to-face engagements and wording was clarified in the online survey to read “I think Council should provide information about available services and how to get help (no other services provided)”.
The third most popular option was that Council should provide services where there is/expected to be limited new providers (12%). Only 2% supported Council ceasing as a provider of community care and accepting the increase of other organisations to provide a similar service.
Council should provide all community care services using Council employees (no change)
Council should provide services where there is/expected to be limited new providers (fill gaps in services only)
provide information about available services and how to get help
Council should cease providing community care and allow other organisations to provide a similar service
Data sources: Surveys, community pop-ups, interviews and focus groups.
Not surprisingly support for the ‘no change’ option was highest for current clients (66%) and Council staff (77%). Community members however responded with a variety of opinions39% supported the ‘no change’ option, 28% supported Council filling service gaps, 23% supporting Council providing information and 5% supported Council ceasing community care.
There were a small number of carers and local service providers overall but most carers supported the ‘no change’ option and service providers were split between ‘no change’ and other types of roles for Council. Further detail on the perspectives of local service providers are provided in the section 5.7.7 Future role of Council
5. Future role for Council (main options only) by
There were 326 written comments from participants about why they had chosen the option for Council’s future role in community care. However there was a mix of comments that weren’t very useful in understanding their reasoning - there were specific comments about how their service is currently being delivered, suggestions about service improvements and irrelevant comments about other Council services (waste, planning etc.). Table 12 shows some of the reasoning behind the options selected by engagement participants.
The third most popular option was that Council should provide services where there is/expected to be limited new providers (12%).
Looking at just the feedback from the wider community (n=46), their reasoning was:
● Council shouldn’t be duplicating services already in the private market, beneficial to have a mix of Council and private providers (n=7).
● Council should focus on larger scale services such as community transport and delivered meals, Council should only provide “what is needed” (n=4).
● Council should focus on the service gaps but stay in the market as they are dependable, easy to contact (n=4).
● Too expensive for Council to do everything, alternate option needs to have a financial benefit or have no cost increase (n=4).
● Council needs to shift its focus to other needs - youth, social support for older people, crisis support, local economy (n=3).
● Council cannot provide all services - the market is too big and is growing.
No change (n= 588)
● FCC is a trusted service provider that is important to the community
● Comment or query about how the system/processes will work
● Quality of care should be prioritised over making a profit ● Uncertainty
and potential for exploitation
Provide information about available services only (n=152)
Cease service (n=17)
Comments indicated a need for Council to focus on service navigation and advocacy - they saw Council as an informed service navigator and there was a clear need for accurate information.
Most comments acknowledged the imminent or likely changes however some comments appeared to support an alternate option.. Some examples are:
➢ “Reformingtheagedcaresystemwillmeanthatpeoplereceiving serviceswillhavetherighttochoosebetweenmultipleapproved providerswhilealsoenablingthemtoinfluencetheservicestheyreceive astheirneedschangesotheygetthecarethattheywantandneed. Especiallyfromproviderswhoareverticallyintegratedandableto provideservicesfrombasicinhomesupportsthroughtocomplex residentialcare.
➢ ChangestoStateandFederalfundingmodelswillleaveCouncil competingwithotherserviceproviders-whowilldeliverhigh-quality, personalisedcareatalowercostthanCouncil.
➢ Frankstonhaslimitedservicesandmyfriendsareusingotherproviders andgettingbetterservices.iftheycan'tprovidetheservicesthatothers aregivingthentheyshouldletthemdoit.
➢ Iamincreasinglydisheartenedbythelackofsupport/servicesthatare availabletometobeabletoremainlivinginmyhome.
Other roles (n=10)
➢ Itisconfusing-theassessmentsystemdoesnotseemtransparentor clearenough.
➢ IhadalwaysthoughtthatIwouldtooutilisetheservicesintime.IhopeI stillcan,asithelpstheseolder,sometimesisolatedresidents immeasurably.
➢ IhaveregisteredforHomecaresupport.I’vetriedtocontactpeopleand nobodycomesbacktome.”
Most comments indicated some indecision or having a mix of the options. Some comments appeared to support one of the options yet these options weren’t selected.
Some examples are:
➢ “Eitherstayinallorjustbeaninformation/navigationsupportprovider astheblendedcareisdifficultfortheclientandcarer.Weneed navigationsupport.
➢ I'mfallingtoamixofthoseoptions
➢ Unsure(nochange/fillingaps)
➢ Ifwecanaffordit,stayineverythingandifnot,thenmustdothegaps.
➢ It'sbettertohavetheservicesprovidedbyoneperson/provideronly whetherit'shealthorcouncil-itstopspeoplerunningaroundandmakes itmoresimple
➢ Keepdoingwhatyouarenow,ifnotgapsandmustprovideinformation andsupportatleast.
➢ Onceaweeklunchforanyresidentwhowantstoattend.
➢ Thisalldependsonthelegislation.Thecompetitionpeopleseethisas notbeingfairascouncilsdon'tpayrentforcouncilbuildingsbutservice providersdo…It'snotfairforthemtocompeteintheprivatemarket thisway.Iftheycancreatealevelplayingfieldinthemarket,thenthey shouldkeepdeliveringservices“
Data sources: Surveys, community pop-ups, interviews and focus groups.
Current clients, their carers and Council Community Care staff were asked ‘What do you think are the key strengths of the service Council provides? A list of options was provided and participants could also add their own responses. Table 13 shows the answers provided by all participants and also separately for current Council clients and Council staff.
The top five strengths of the Council service according to clients and staff were:
● Friendly and understanding staff.
● Meets their needs well.
● Easy to contact to change service/appointments.
● Continuity of care/ongoing relationship with staff.
● Punctuality and, Quality of service (skilled staff).
Table 13. Key strengths of Council’s service by stakeholder category
Data sources: Surveys, client interviews. Multi-response question so percentages are % of total responses (n=4216), not participants.
The other strengths identified by participants were reliability (different to punctuality, n=10) and the holistic model of care (n=9). Some comments by clients about this holistic approach were:
➢ “Personalisedandyou'vegotaworkerthat'sveryversedwiththesystem-theycan helpyoutoadvocateforyouaswellandgetsomeonefromtheteamtohelpyou.
Theworkersareempatheticandconnectedandlookaftertheclient.Continuityof care.
➢ SeeingsomeonefromCouncileachfortnightandhavingsomeonearoundforan hourisgreatandIdon'tknowwhatIwoulddowithout.Italsotakesaburdenoffme, somethingIdon'thavetothinkabout.Ilikethattheytellmewhoiscoming.Ilove (name)sheissoupbeat.Theycomeinuniform,theyhavetheirnamebadgeonit's thefeelofsafety.Italsoisaregularhealthandwelfarecheckthatisregular- Ihave afallsalarm.
➢ SomeonecomesintothehouseandmakessureIamnotonthefloor,thatregular contactandcheckin.HavingregularstaffthatIhavebuiltuparelationshipwith,they careaboutmeandarealsoabletonoticechangesinmyhealthorconditionand eithertalktomeortelltheirsupervisorsoIamgettingmonitored.Havingaccessto theseservicesevenalittlebitkeepsyougoing,keepsyouthinkingandmotivatedto keepgoing.Ontrackandontopandnotoverwhelmed.”
Clients were more likely to nominate the following strengths of the Council servicepunctuality, staff speaking their language and being easy to understand, friendly and understanding staff, staff being the same gender and being easy to contact to change services or appointments.
Council staff were more likely to nominate the cost of the service, the quality of service (attentive and skilled staff), continuity of care/ongoing relationship with the staff and that the organisation is trusted and has a good reputation.
Current clients, their carers and Council Community Care staff were asked ’Is there anything about the Council service that you feel could be improved (or changed)?’. There were 214 comments made by participants and Table 14 shows the thematic grouping of their suggested improvements or changes to Council services.
Improvements or changes (collated into themes)
Data sources: Surveys, client interviews, community pop-ups if applicable. Multi-response question so percentages are % of total responses (n=265), not participants.
The top improvements or changes according to clients and staff were:
● Expanded range of services/more or increased frequency of services.
● Resolving barriers using the ‘system’, better communications.
● Improvement to specific services.
● Improvement related to timing, scheduling, staff resourcing.
Clients suggested more assistance with resolving their barriers using the ‘system’ and better communications - they wanted a one-on-one conversation with someone who could take the time to listen and answer their questions. Clients can be told particular services aren’t available from Council but were not referred on, just told to try elsewhere. The assessment process was also mentioned as being overly focused on restrictions and some clients are unclear about the process.
Understandably clients were more likely to suggest improvements to specific services such as:
● Cleaning for a longer period or cleaning more items in the house (e.g. windows, gutters, cobwebs).
● Offerings of meal choices that are suitable to personal taste or dietary restrictions.
● Assistance with lifting or moving heavy items.
● Consistency of cleaning standards across different staff.
Council staff were more likely to suggest improvements related to timing/scheduling and staff resourcing such as:
● Increasing the minimum service duration to two hours.
● Increased allowance of travel time (traffic congestion is worse).
● All staff use the same method to communicate so messages aren’t lost.
● Reduce duplicate documentation and better computer systems.
● Reducing impact of sick leave and lack of staff on clients.
During the 27 client interviews, they were asked to comment on affordability of the service and the fee payment process offered by Council. Of the 29 responses given (some clients mentioned more than one topic), 16 clients commented that the current fees were affordable or reasonable, 6 clients said they were just manageable and 7 clients said the direct debit automated system worked well for them.
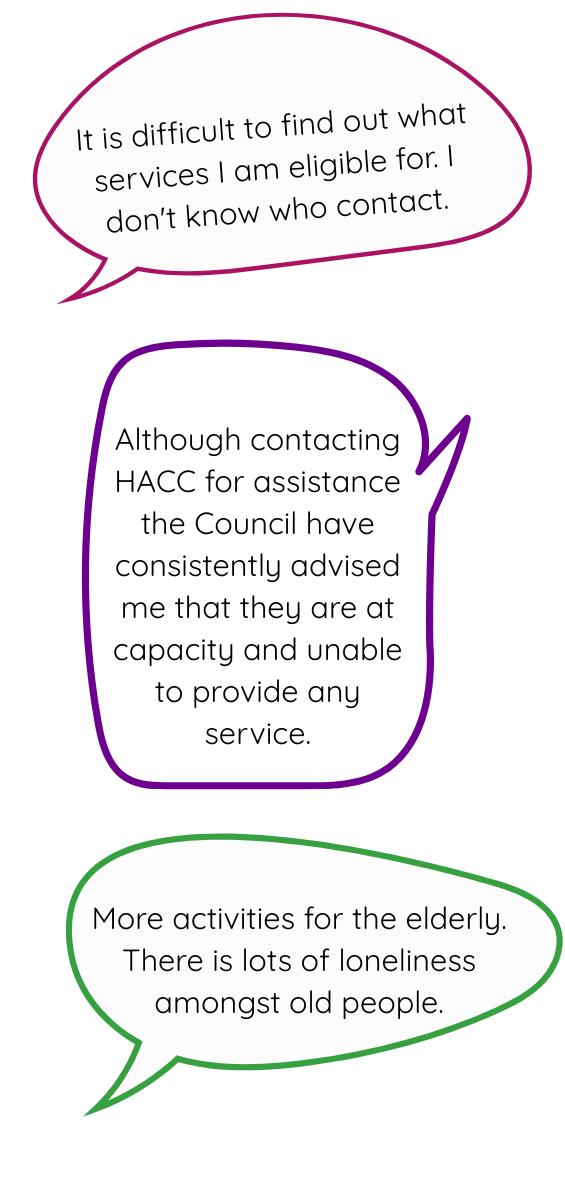
It is widely acknowledged that the changes made under the aged care reform, to date, have been confusing for clients, their carers and families.3 To provide some local context, current Council clients and their carers were asked the question ‘Is there anything you find frustrating or challenging when you try to get some support or assistance?’ There were 111 comments from Council clients and these issues are summarised in Table 15.
3 https://www.igac.gov.au/resources/summary-2024-progress-report-implementationrecommendations-royal-commission-aged-care-quality-and-safety
Table 15. Frustrations or challenges for clients accessing services Issue
(sorted in descending order by frequency of mention)
Availability/additional services (n=30)
Communicating to/with clients (n=18)
Eligibility for services (n=15)
Assessment process (n=11)
Costs of service or payment process (n=8)
Some examples
Being told there is no capacity (service ”full”)
Being told the service is not offered
Inconsistent or poor communication
“Not being told” things
Inability to contact on phone or have email responded to
Being told they are not eligible for particular services, “not part of the agreement”
Working the system to become eligible
Long complicated process
Waiting on My Aged Care
Having to coordinate all information themselves
Assessment outcome not provided help needed
Costs too high for particular services or convoluted process e.g. DVA
Quality of service delivery (n=7) Complaints about quality or inconsistent quality
Staffing levels (n=3)
Comment not relevantpositive sentiment or unrelated (n=20)
Staff changes and availability
Data sources: Surveys, client interviews.
Only three carers made comments - one said “ElderlyneedMealsonWheelsortheywon't eat”, one said “Moresupportforcarers,evenifthepersontheycareforgetsNDIS- like housecleaningandlawnmaintenance” and one commented that more services were needed.
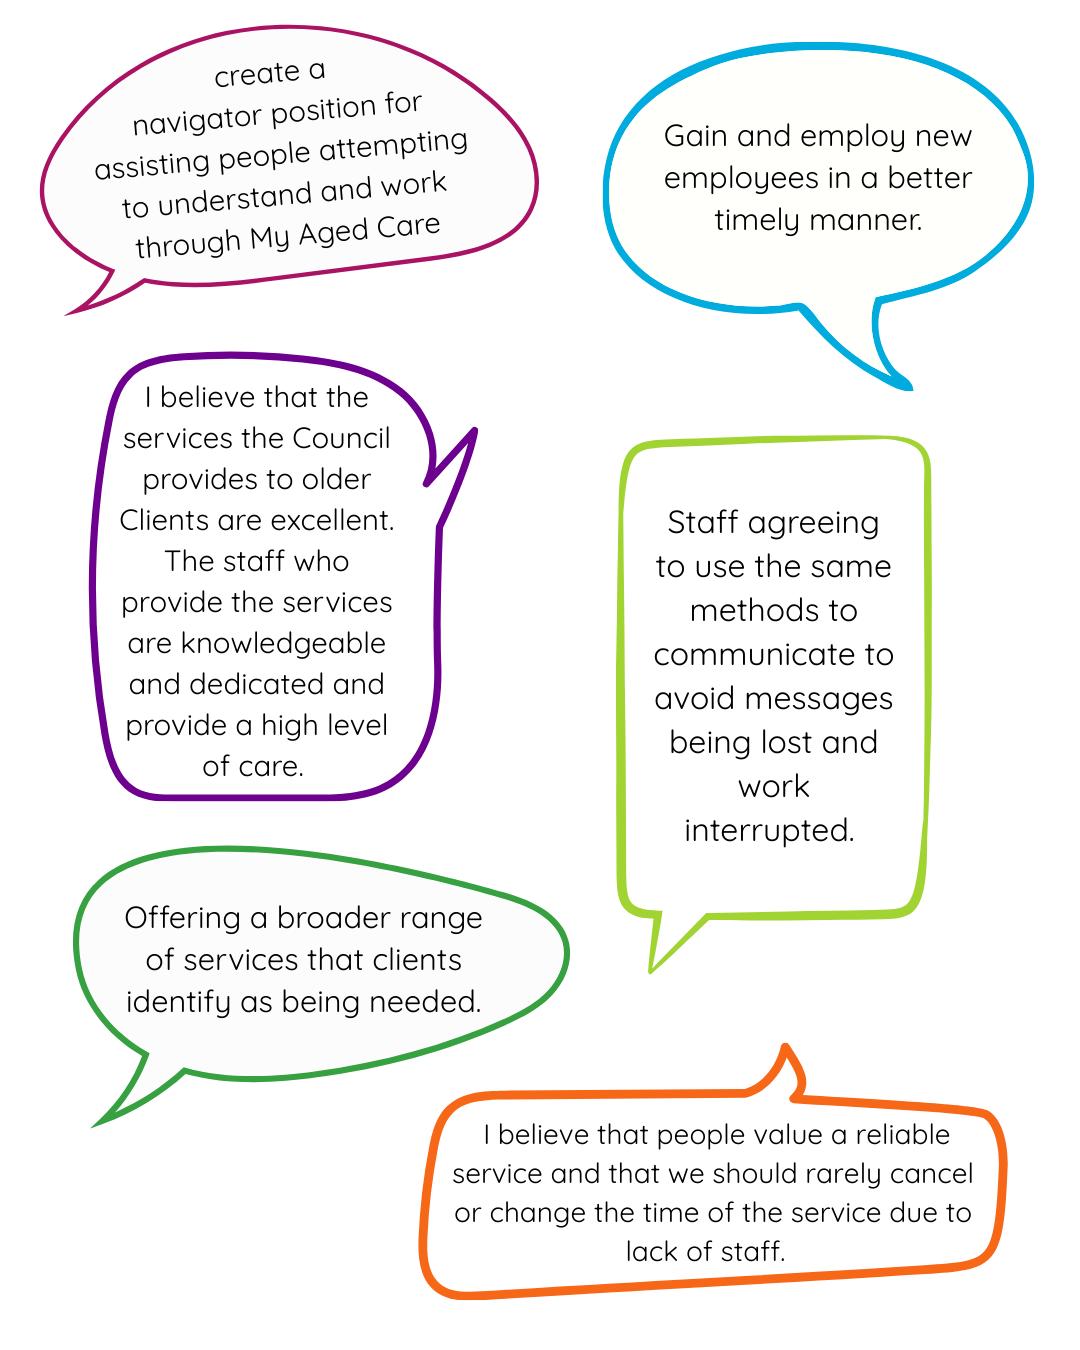
Figure 7. Selected verbatim comments about system frustrations or challenges
All participants across the engagement activities were asked about what would help older people the most to access the services and support they need, and were asked to select their top three from a list provided. There were a total of 2054 responses to this question. Where the number of responses is small (n<30), only raw numbers are provided. Table 16 shows the breakdown of how each stakeholder group responded to the question.
The enablers that would help older people the most to access the services and support they need were:
● Description of the different services available - what is … (25%).
● Information on how to access these services - who to call, apply to (25%).
● Speaking to someone on the phone or in person (18%).
The enablers needed by current Council clients and primary carers mirrored the preferences of all participants, as shown in Table 16. Community members were more likely to sayspeaking to someone on the phone or in person, more funding/more service or that they were “not sure”.
Council staff were more likely to say the enablers were speaking to someone on the phone or in person, or a description of the different services available. Workers from local service providers were more likely to say the enablers were a description of the different services available and services being located close to the client’s home.
Table 16. Service access enablers by stakeholder category
Data sources: Surveys, interviews, community pop-ups, focus groups. Multi-response question so percentages are % of total responses (n=2054), not participants.
Of those who mentioned ‘something else’, the following common themes are shown below with some of the verbatim comments:
● Advocacy/translation/system navigation (n=24).
“Encouragepeopletoaccessservicesbeforetheyneedthemastheassessment processtakesalongtime.’
Affordableserviceandsupportwithnavigationandadvocacy.Knowinghowtoget thefastestcareandsupportneeded.”
● Alterations to existing services and additional services (n=22).
“Generalwellbeingcheckorbetter/easieraccesstophysiotherapyorexercise therapy.
Moretypesofservicesandeligibilitytoaccesstheseonmypackagelevelgardening,repairwork,accesstotrades-doingitprivatelymypensiondoesn'tcover me.”
● Marketing and communications (n=5).
“Moremarketingbycounciltolifttheprofileofcommunitycareservicesandfocus onthebenefitsofhavingelderswithinourcommunityandthebenefitstoeldersof livinginourcommunity.”
Participants who answered surveys or were interviewed were asked about the most important supports in service delivery for people who were born outside Australia, come from a culturally diverse background and/or speak a language (other than English at home). They were required to select their top two items from the provided list and their responses were opportunities to speak in their language (23%) and opportunities to socialise with people from their home country (22%).
Table 17. Supports for culturally diverse clients
TOTAL responses
Data sources: Surveys, interviews. Multi-response question so percentages are % of total responses (n=271), not participants.
A separate survey was provided for local service providers to complete with six organisations responding. During March 2025, Conversation Co. also undertook stakeholder interviews with five key providers in the municipality - Benetas, Brotherhood of St Laurence, Peninsula Health, Bolton Clarke and mecwacare.
Table 18 presents a breakdown of the characteristics of service provider participants in this engagement. The bulk of service provider participants worked for not-for-profit organisations, rather than ‘for profit’ businesses. They provided a good range of services including social programs and residential care.
Seven of the participants worked directly with clients with the remaining four saying they had some understanding of the needs of clients (in their management or coordination roles). The service providers covered a range of geographic locations from the Frankston and Mornington Peninsula council areas, to the wider Melbourne metropolitan area and Victoria.
of the needs of older people, or younger
Data sources: Surveys, interviews. Services provided was a multi-response question.
Service providers were asked the question, ‘What do you think are the key strengths of the service/s your organisation provides?’. There were ten responses to this question and Table 19 shows the common themes.
Table 19. Key strengths of the service/s the organisation provides Strength Description
Client centred care (n=5)
Friendly and professional service (n=4)
Providing tailored care suited to client needs.
Needs based, client centred goals rather than episodic care.
Informed care- provide opportunities for client feedback and evaluation and advocate for client needs/goals over family/carer needs.
Trustworthy service: professional and knowledgeable staff
Service consistency and reliable staff
Friendly and engaging, work with clients face to face, relationships with clients and families.
Locally based with community knowledge and connections.
Smooth system navigation and referral (n=3)
Flexibility (n=2)
The breadth of services provided within the organisation allows for swift referral, shorter wait times and continuity of care for clients.
Comprehensive and/or clinical assessment and ability to offer linkages to other services if needs are identified reduces the complexity for clients.
Quality case management and good communication helps the client navigate the service.
Ability to respond to client needs, refer appropriately and adjust services to changing circumstances.
Ability to spread hours and charges to suit client needs.
Data sources: Surveys, service provider interviews.
5.7.3
Participants were asked the question ‘Are there any services or programs you currently do not provide that your clients have requested?’ in relation to older people, younger people with disabilities, and carers.
In terms of supporting older people, service providers saw the following gaps:
● Home modifications and specific equipment such as fall monitors, incontinence products (n=5)
● Transport (n=4).
● Social support programs, companionship, social visits (n=3).
● Domestic assistance (n=4).
● Gardening (n=3).
● Personal care.
● Specialised support for hoarding and squalor.
Commonly participants noted that the demand is greater than the supply for many services. Participants described many of these services were provided within their organisations, however funding is not adequate to support the number of referrals. Participants also described referring clients to other organisations for services their organisation does not do, and finding there are long wait lists. Others reflected that changes to CHSP services in the region meant that available staff and funding for those programs in the Frankston municipality were transferred to other areas to fill gaps where there was greater need, thin markets or no available services.
In terms of supporting younger people, service providers saw the following gaps:
● Home help (gardening, domestic assistance, shopping, personal care (n=4)
● System navigation support (NDIS) (n=2)
● Transport (n=2)
● Specialised disability services
● Mental health services
● Social support
Service providers typically reported having lower numbers of HACC-PYP clients in their services - they either did not target this group or believed that clients will be accessing support through the NDIS. They noted the difficulty for clients in applying for the NDIS and supporting HACC clients to receive the appropriate care through NDIS.
In terms of supporting carers, service providers saw the following gaps:
● Respite care (n=4).
● Social and mental health support (n=3).
● Transport (n=2).
● Case management, service navigation support.
● Financial support/advice.
Participants noted that their services did not have funding for carers or did not deal directly with carers, referring them often to the Carer Gateway. Participants also described a distinct gap in carer supports during assessment or while clients are awaiting a package often when carers needs are heightened suggesting an intervention if wait times cannot be minimised.
Community Care staff and local service providers were asked about the key challenges they experience when delivering services to older (or younger) clients. There were 44 comments made by participants - ten by local service providers covering multiple issues, and 34 by Community Care staff.
From the perspective of local service providers, their challenges were:
● Family members not agreeing with each other.
● Clients refusing services.
● Exhausting work especially with mental health clients.
● Waiting times after package funds are used early.
● Long wait lists to access supports when not on an appropriate plan.
● Limited-no service providers providing actual support work outside of the NDIS.
● Having to open and close the MyAgedCareportal to referrals.
● Service demand well exceeds what's available, people have much greater needs than about 10 years ago. Only accept people with the highest needs/dire situations.
● Poor quality aged assessments completed on the phone, with insufficient contact information given to the client for follow-up. Many clients miss out on essential services they need.
● Relying on inaccurate information provided by clients (e.g. with dementia).
● Managing the carer workforce - lack of staff, staff wanting casual work only, loss of corporate knowledge when staff leave following exit from CHSP.
● Lack of CHSP services available. MyAgedCarelists providers who do not provide services in the area, or the providers listed do not have any capacity and do not have waiting lists.
● Incorrect messaging from the government department.
● Large geographical areas to cover, servicing remote areas.
● Need more funding for aged care navigators.
● Wait times for initial CHSP assessments and re-assessments.
For the Community Care staff their challenges were:
● Council systems and being told to do other compliance tasks rather than start clients on services. Inconsistent record keeping, omitting important client information that should be documented to better support the client and other teams providing services.
● Lack of direct care staff and administrative support.
● Expectation to solve clients’ complaints about MyAgedCare .
● Poor client understanding of the service offering, funding and how it works. Council systems for invoice queries.
● Clients not keeping appointments due to cognitive decline, not at home or cannot hear door. Clients not upholding their ‘agreed to’ obligations.
● Clients experiencing difficulty and delay (waiting times) in accessing MyAgedCareto begin services.
● Dealing with clients that struggle with loneliness, mental health issues and/or substance abuse.
● Lack of a transport service to appointments, gardening service, window washing.
● Clients using three or four different providers - multiple procedures and documents to read/sign, no continuity of care.
There were mixed views about digital technology - some staff said clients who do not use the internet whereas others said the clients have ample capacity to navigate emails and online booking services. Examples are clients' expectations regarding communication don’t
fit (don’t like voicemail, automated systems) however they also mentioned the lack of automated SMS system to remind clients of their appointments.
From 1 July 2025 the Support at Home program will replace the Home Care Packages Program and Short-Term Restorative Care Programme. After 1 July 2027, the Commonwealth Home Support Program (CHSP) will transition to the new Support at Home program.4
Service provider participants were given some context about the upcoming changes and asked the question ‘What are your organisation’s future plans for Support at Home?’. There were a total of nine responses - one service was currently servicing the Frankston region and planned to expand their service offering, four were planning to register for Support at Home and the remaining four were “unsure at this stage”.
Lastly, the service provider participants and Council Community Care staff were asked to share any ‘best practice’ services or programs that they would recommend. There were 18 comments provided by 16 Council Community Care staff and five local service providers.
Council Community Care staff recommended mostly their own service but in particular:
● Service that listens and provides human contact.
● Clear guidelines, clear rules on the delivery of service.
● Stability, consistency and accessibility of the service.
● Referral to Older Persons Advocacy Network.
● Meals on Wheels cooked and delivered fresh Monday to Friday. They also noted Encara (a dementia in-home rehabilitation program for 12 weeks), Mentis Assist and Wellbeing Local.
Local service providers recommended a mix of their own services and external services or training such as:
● Training in clinical governance in CHSP - “this is where we are going to”.
● Doing timely assessments with detailed documentation.
● MARAM domestic violence training, trauma informed training.
● Dementia Specialist at Benetas with training provided for all staff including managers.
● ermha Carers Program.
● Frankston Wellbeing Local, Frankston Community Support.
4 https://www.health.gov.au/our-work/support-at-home
When service providers were asked about the future role of Council, five participants selected the ‘no change’ option, two participants selected ‘fill service gaps’ option and four responded with an unclear response or alternate option (coded as another role for Council).
Reasons for giving the ‘no change’ option were about the quality and trustworthiness of Council services and their strengths in service access and navigation:
● “Councilinhomecareisanorganisedandreliableservice”.
● “Ithinkitisimportantforcounciltoremaindirectlyengagedwiththecommunity”
● “Ithinkwe'veactuallyworkedwithanumberofdifferentcouncilsthattransitionedat difftimes-depofhealthhavetakenadiffapproach-Iseecouncilasveryvaluableas thatcommunityconnectorrole/workingwithcompanies”
● “ClientshaveoftensaidtheyhopetheCouncildoesn'tstoptheserviceastheyhave friendsunderothercouncilsthatnolongerhavetheserviceandtheyarenotgetting anyhelp”.
● “Councilhasaprovenrecordofprovidingqualityservices,whenyoutakeonexternal staffyoucannotguaranteetheywillfollowthesameguidelines”
Another consideration was retaining continuity of care for clients and minimising disruption to aged care services.
One participant shared concerns about competing with Council on the private market, as Council have access to facilities and amenities which other providers do not - “Please continuetoprovideservicesifyoucanworkaroundthoseunfairbits -keepdoingit-you're supportingthecommunityandprovidingagreatservice”
One service provider who selected the ‘fill service gaps’ option suggested Council was better placed to “fillservicegapswithmoreflexibleprogramsandsupport”.
Finally, service providers were asked the question ‘Is there any other feedback that you would like to provide to Frankston City Council?’ There were a total of eight comments that mostly identified other service gaps for supporting older people (see 5.7.3 Service gaps in the region).
Other participants had queries around Council’s next step in terms of the aged care reform:
● Considerations about the Mornington Peninsula exit and how Council might manage this differently, particularly with reputational risk.
● Concerns for an exit from services as the Mornington Peninsula Shire exit has affected service providers capacity to support the number of referrals.
● Consideration if Frankston City Council choose to exit - will they extend CHSP services to 2027?
● Positive feedback on the Council’s Community Care services“Theyprovidegood servicesfromwhatI'mhearing;Notmotivatedbymoney;Easiertonavigatefrom clientperspective,it'seasier;Cheaperandmoreaffordable.”
All participants were asked if they had any other feedback for Council. The 191 comments received were summarised as follows:
● Reiteration of previous comments made about Council or other service providersboth positive and negative (n=114).
● Comments about other services for positive ageing - transport, social programs, computer help (n=25).
● Council’s future role (managing reputation during transition), MyAgedCareor the aged care reforms (n=15).
● Generic comments such as the size of the envelope used for return of the hardcopy survey (n=6).
● Comments unrelated to aged care or ageing (n=12).
Some direct quotes regarding Council’s future role were:
➢ "It’svitalforthecounciltoactivelyshowcaseitssupportforolderandvulnerable residents.Weshouldenhanceourcommunityprofiletohighlightsupportforall familymembers,especiallyelders.“
➢ “Thecouncilisviewedasareliableproviderofqualitysupport,standingoutina worldwhereolderindividualscanbevulnerabletoexploitation.Thistrustworthinessis increasinglyrareandessential,councilneedstobeviewedinthisway.”
➢ “Needstoprovideservicetoitscommunity.Toaidresidentsthroughthemaze& safeguardourresidents.”
➢ “Iwouldliketoknowmoreaboutthefinancialsideofthingswiththischange,would theybereceivinglessfundingasaresult?Also,whatchangesshouldweexpect?”
➢ “Privatisationstheservicewilladdconfusion,competition,addedcostandnot necessarilyabetterserviceformymother”
➢ “Atatimewhenthelinebetween"need"and"want"isbeingincreasinglyblurredwith theintroductionofMyAgedCareandNDIS,councilholdsauniqueabilitytoreally meet"need"asthisiswhatwehavebeendoingforsomanyyearswithclear guidelinesandexperienced,caringstaffcommittedtosupportingpeopletomaintain independenceathome.”
➢ “ThefamiliesIspeaktolikeservicesfromcouncilbecausetheyfeelsafe.Councilis respectedandatrustedorganisation."
The following measures of success were identified prior to the engagement commencement. Following the finalisation of this engagement report, the project team will also be conducting a debrief session to review all engagement and communications activities and consider any process improvements.
Engagement measures - Process
Total participation by minimum of 500 persons
Participation by minimum of 50 CHSP clients (N=1850)
Participation by minimum of 5 HACCPYP clients (N=160)
Participation by minimum of 20 carers/family members
Participation from suburbs across the municipality
Success criteria Result
Participation numbers across all engagement activities
Proportional participation as per Census data
Participation by gender, target age groups and culturally diverse populations
Proportional participation as per Census data
Achieved - There was participation from 929 persons.
Achieved - There was participation from 643 CHSP clients.
Achieved - There was participation from 45 HACC-PYP clients.
Achieved - There was participation from 13 primary carers and 19 relatives/friends of an older person.
Participation of the ten targeted organisations (interviews, focus groups)
Participation by minimum of 30 Council officers/volunteers working in Community Care team
There was a good spread of participants across the suburbs and largely proportional representation. The suburbs that were slightly under-represented were Langwarrin-Langwarrin South, Carrum Downs and Sandhurst.
Gender - Not Achieved: 74% of participants were women which is expected for a topic of this nature (community proportion is 51%).
Target Age Groups - Achieved: There were high levels of participation from 70-84 year olds (54%) and 85+ year olds (26%), and proportional participation from 60-69 year olds (10%).
Culturally diverse populations - Achieved: 20% of participants spoke a language other than English (community proportion is 11%).
Target is 100% Achieved - Of the five focus groups three were completed as planned but alternative engagement activities were used for the remaining two to ensure their input to the engagement.
Target is 30 Achieved - There was participation from 53 Community Care staff.
Frankston City Council must determine the future of its current CHSP services and make a formal decision in mid-2025. Conversation Co. has noted the following considerations for Council based on the findings from this community engagement.
As part of the Community Vision and Council Wellbeing Plan engagement in 2024, participants were asked to assess future service ‘levels’ for aged and community care by indicating whether they would like ‘more’, ‘less’ or ‘the same’ focus from Council. There was a clear majority support for these services either remaining the same, or having more of a focus from Council.
This community sentiment has been confirmed by this 2025 engagement with nearly twothirds of engagement participants (61%) supporting the ‘no change’ option, that Council should provide all community care services using Council employees. Support for the ‘no change’ option was highest amongst current clients (66%) and Council staff (77%). This consistency of sentiment reflects both the general community views from 2024 and also the views of those most affected, from this 2025 engagement.
Notwithstanding the support from various stakeholders to continue delivering services with no change, Council will need to consider the increasing cost of service delivery and compliance of the reform requirements including new legal and regulatory matters. Competitive neutrality laws will also need to be considered when the market becomes more competitive.
Overall 12% of participants said that in future, Council should provide services where there is/expected to be limited new providers (fill service gaps only). If Council decides to further explore this option, it should consider the following beliefs expressed by members of the wider Frankston community:
● To not duplicate services already in the private market rather to add value.
● To provide larger scale services only, such as community transport and delivered meals.
● That Council should stay in some service provision as it has community trust.
● That any future option be cost-neutral or achieve a social benefit.
Current clients, their carers and community members have identified which changes would likely affect them in the next few years, or affect them more than they do now. The top five changes predicted for the future were mobility and ease of moving around, their level of independence, having falls or accidents, illness/declining health and being able to drive. An
expanded community transport service (with extensive promotion) and a one-on-one transport service to medical/social support appointments appears to be a service gap.
Regarding the future role of Council, 16% of participants said that Council should provide information about available services and how to get help. There is a community-held belief that Council should be the first point of contact for trusted information and advice. There is a clear community need for personalised information about the services available and the associated financial costs.
Some frustration was expressed by clients about having to rely on complex written hardcopy information or website content. Some service providers reported that clients were given information however it wasn’t being read. Clients and the general community value one-on-one support and advice provided on the telephone or in person. In addition to the current client load, there will be a growing number of residents aged in their sixties and seventies who have already identified in this engagement that they will need to “know how to get the services they need”.
The specific information needs - in addition to system navigation and service provider selection - are:
● Explaining how fees are charged and by whom and the relative amounts of subsidy and out-of-pocket charges.
● Advising older people who are “holding off” on seeking help or applying for a package due to cost concerns, fear or apprehension.
● Advising older people who have been told previously that a service wasn’t available and have ‘given up’.
Council could consider reviewing its process for customer service calls and emails for community care focusing on telephone automation instructions, call dropouts, call waiting times on hold and the response times to emails.
Current Council clients reported a lack of available services providing the specific tasks of gutter cleaning, clearing cobwebs/dusting, window washing and assistance with lifting or moving heavy items. This perception could be investigated further by Council.
An expanded community transport service (with extensive promotion) is noted above as an opportunity to increase awareness and use.
Regardless of the decision about in-home community care, there is a clear role for Council in providing social support programs. Older residents require social connection, integration into community groups and networks and opportunities to socialise formally and informally. In this engagement community members who weren’t currently receiving any community
care services mentioned that they expected to experience anxiety and/or depression, loneliness or losing contact with friends/family in future years - in addition to the expected physical changes.
Older residents have identified a number of issues that they think they will face in future years, which can be used to supplement any current seniors education programs. Topics such as preventing falls or accidents, retaining a drivers licence, awareness of memory problems and potential solutions, options for residential living and managing their finances.
It is recommended that:
1. Council prepares and implements a plan for the next phase of communication which will take place mid-2025 when the engagement findings are ready to be presented back to Council and the community.
2. Council publishes and promotes the engagement report or a summary on Engage Frankstonto allow service providers and interested community members to read the engagement feedback.
Appendix 1 - Promotional poster and postcard
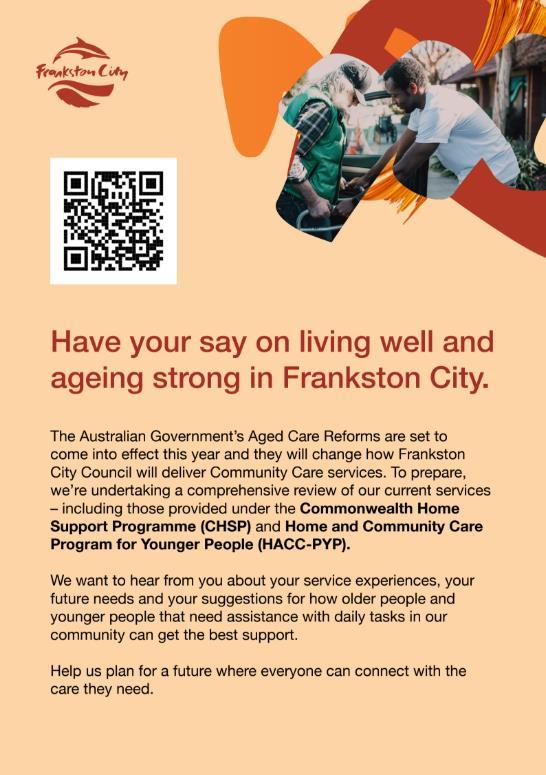
Appendix 2 - Key engagement question & demographics survey card
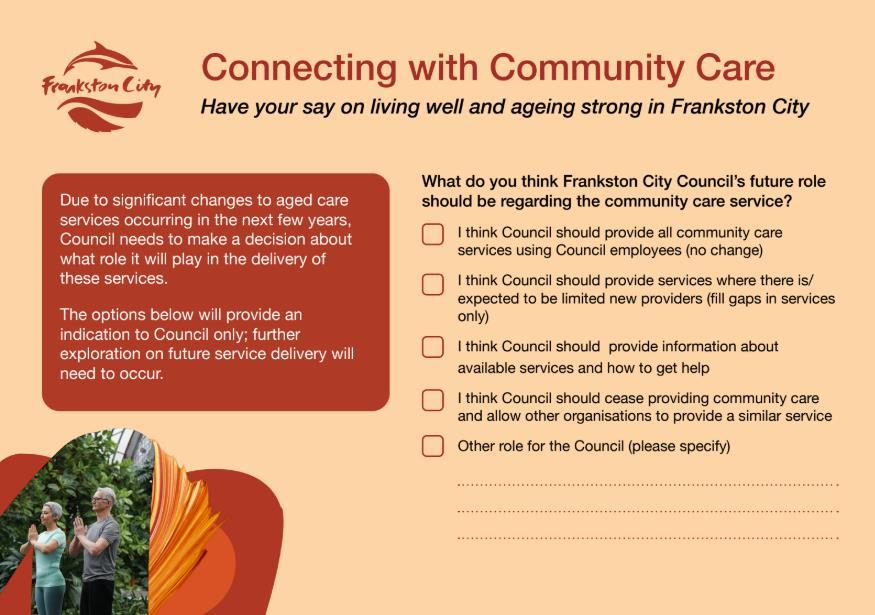
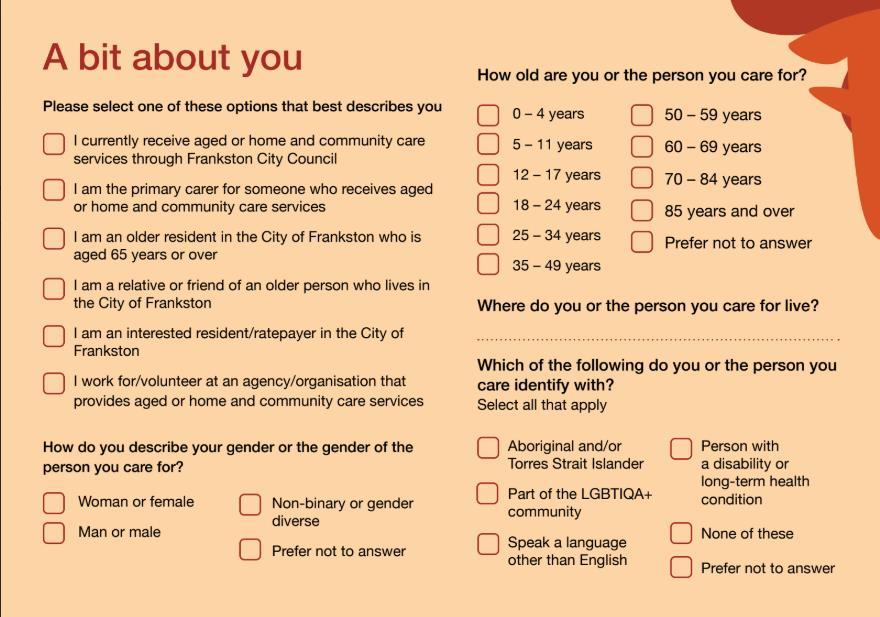
Four other versions of this survey were created for:
● Clients currently receiving aged or home and community care services (through Frankston City Council).
● Primary carers for someone who receives aged or home and community care services.
● Workers/volunteers at an organisation that provides aged or home and community care services.
● Frankston City Council staff member or volunteer.
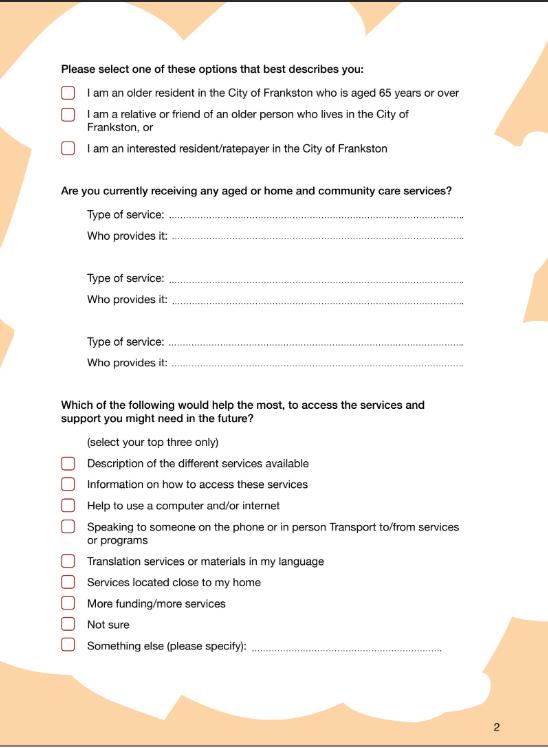
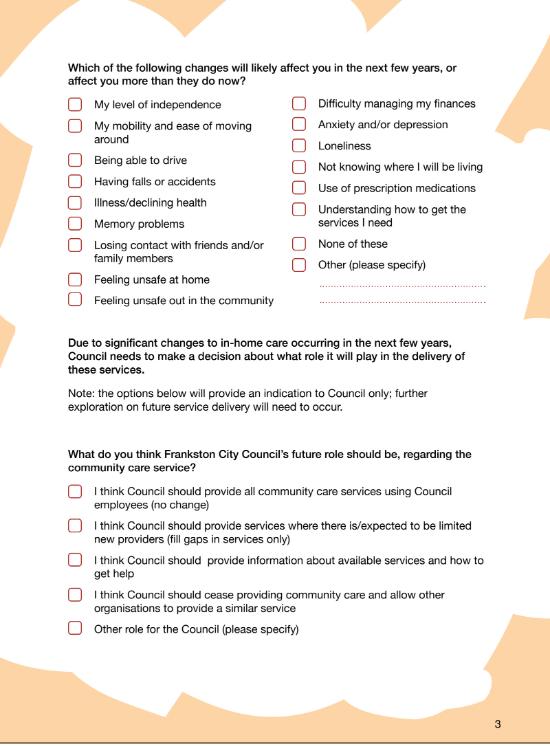
The third option in this question was clarified in the online version to read “I think Council should provide information about available services and how to get help (no other services provided)”.
This option created confusion for some engagement participants in the first week of the engagement. It was intended to be an information role only for Council (that is, no other services would be provided). However it was interpreted as an add-on service to the available options, not as an alternate option. From the second week, this option was explained clearly at all the face-to-face engagements and wording was clarified in the online survey to read “I think Council should provide information about available services and how to get help (no other services provided)”.
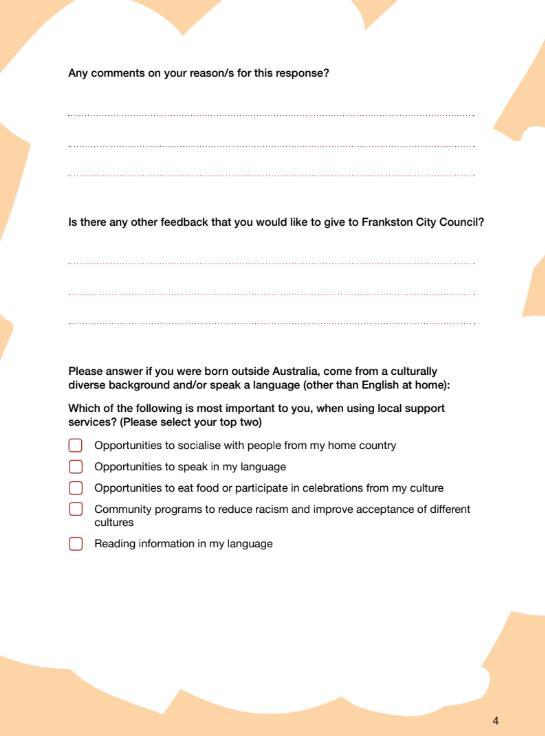
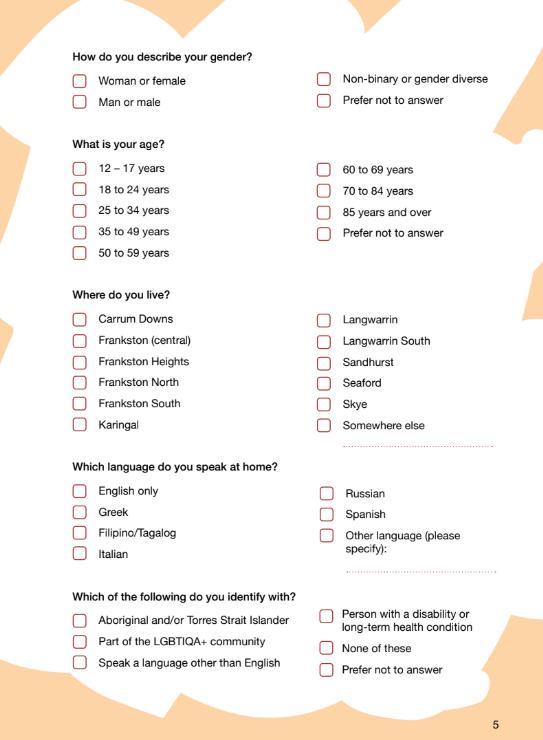
Appendix 4 - Map of participants’ residential location