
Economic Outlook 2024
Canadian Franchise Industry
April 2024


Franchising is a major economic force that continues to grow in Canada, despite the difficult economic conditions the country has faced over the past several years and continues to face today.
Franchising is now the 12th largest industry in Canada, up from the 13th position in 2023. This is thanks to the significant role franchising plays in the Canadian economy: it is projected to contribute more than $120 billion to the national GDP by 2025. This represents 3.24 per cent growth, which is a major achievement, as the overall Canadian economy is expected to remain flat for much of 2024.
While many industries are contracting due to challenges such as rising inflation, increased costs, and labour shortages, franchising is expanding, which is evidenced beyond its GDP contribution. Franchised businesses will contribute nearly $30 billion in federal and provincial taxation in 2024. It is also projected that there will be more than 66,000 franchise establishments in Canada by the end of the year, an increase of approximately 1,000 locations. As we continue to see more and more businesses shutter their doors, this is a major testament to the strength of Canadian franchising, backed by the Canadian Franchise Association (CFA).
The CFA community continues to focus on Growing Together ® to support the future of franchising, and helping everyday Canadians make their business dreams come true through the power of franchising is paramount to this goal. This is something the CFA takes seriously as it works to help franchisors become the best they can be, to drive the success of their systems, especially the success of their franchisees.
These franchisees are operating in local communities from coast to coast to coast, employing almost two million people in their communities and paying nearly $62 billion in wages in 2024, up nearly $2 billion from 2023.
The Canadian franchise industry is projected to contribute more than $120 billion to the national GDP by 2025
Franchising ranks as the 12th largest industry in Canada
On a regional level, every province is expected to experience growth in the coming year. Alberta is projected to add the most franchise establishments, while the provinces set to experience the highest percentage of franchise growth are Prince Edward Island, Newfoundland and Labrador, and Saskatchewan.
The CFA community can be proud of the strength and resilience we have shown. We will continue to focus on Growing Together ® in the year to come so we can meet these 2025 projections. But we won’t stop there—we will also build on this growth in the years ahead as we help even more Canadians make their dreams of business ownership come true through the power of franchising.
Sincerely,
 Sherry McNeil, President & CEO Canadian Franchise Association
66,000+ franchise units in Canada
Almost
2 million Canadians are projected to be employed by the franchise industry in 2024
An independent study conducted on behalf of:

The Canadian Franchise Association (CFA) helps everyday Canadians realize the dream of building their own business through the power of franchising. CFA advocates on issues that impact this dream on behalf of more than 700 corporate members and over 40,000 franchisees from many of Canada’s best-known and emerging franchise brands. Beyond its role as the voice of the franchise industry, CFA strengthens and develops franchising by delivering best-practice education and creating rewarding connections between Canadians and the opportunities in franchising. Founded in 1967, CFA consistently advances and supports the franchise community, and is the essential resource for information, insight, and expertise through its award-winning education, events, services, and websites: www.cfa.ca and FranchiseCanada.online.
The Canadian Centre for Economic Analysis (CANCEA) is Canada’s foremost independent socio-economic advisory and data firm.
We enable intelligent and responsible decisionmaking and dialogue through the provision of timely, data-driven social, economic and business insights and solutions that are trusted by over 400 leading organizations for their policy and business-critical forward-looking analysis.
Our services are powered by Canada’s largest, fully-integrated socio-economic platform that simultaneously examines hundreds of topics by geospatially simulating over 35 million people and 2 million firms across more than 56,000 Canadian regions.
Equipped with this powerful socio -economic intelligence, our experts and analysts help clients to track, analyze and report the many factors that make up and drive complex regional-level socio-economic communities. This allows the implications of socio-economic micro and macro trends across many topics to be understood by our clients in support of their policy and business-critical decisions.
CANCEA does not accept any research funding or client engagements that require a predetermined result or policy stance or otherwise inhibit its independence.
In keeping with CANCEA’s guidelines for funded research, the design and method of research, as well as the content of this study, were determined solely by CANCEA.
This information is not intended as specific investment, accounting, legal or tax advice. This report was commissioned by the Canadian Franchise Association.
Check out our services and case studies and ask us how we can use Canada’s largest and most detailed socio-economic simulation platform to help you at https://www.cancea.ca.
©2024 Canadian Centre for Economic Analysis
©2024 Canadian Franchise Association
Printed in Canada • All rights reserved
ISBN: 978-1-989077-50-4
Citation:
The Canadian Centre for Economic Analysis. Canadian Franchise Industry Economic Outlook 2024. February 2024.
This report outlines the economic forecast for the Canadian Franchise Industry for the upcoming year and covers the net change in the number of franchise establishments as well as franchise -related economic indicators, such as gross domestic product (GDP), employment (number of jobs and full -time equivalents), and tax revenue generated by franchises. These results are further brok en down by province and selected industry sectors.
The Canadian franchise industry is estimated to have over 1,100 brands with at least one Canadian establishment and over 66,000 franchise establishments in a variety of industry sectors. Over the next year, the Canadian economy is expected to continue facing tight monetary policy, with a potential gradual easing starting in 20251 As a result, growth is expected to remain slow in 2024. However, the outlook for individual provinces varies based on their economic conditions and industry mix.
Nationwide, we anticipate only a small growth in the number of franchise establishments in the country. While the growth rate in franchise establishments and em ployment may slow down, we expect to observe an increase in GDP, wages, and taxation revenues. This positive trend is likely to continue as inflation is expected to persist throughout the year.
In 2024, the nominal economic activity of the Canadian franchise industry is expected to grow by 3.24% (+$3.7 billion net increase), increasing the total franchise -related GDP contribution to $120.1 billion by 2025. As illustrated in Table 1, the total number of franchise establishments in Canada is expected to grow by 0.28% to a total of nearly 66,400 franchise establishments. Furthermore, the Canadian fran chise industry’s contribution to federal and provincial tax revenue is expected to increase, respectively, by 3.24% (+$500 million net increase) to $15.9 billion and by 3.21% (+$421 million net increase) to $13.5 billion by 2025. Higher prices and wages ar e driving the majority of the increases rather than growth in the number of franchises.
Total franchise-related employment in the country is expected to grow by 0.27% to 1.73 million jobs (1.49 million FTEs) by 2025, which is equivalent to 4,700 net new jobs (3,600 of which are directly due to franchises) Growth in employment is associated with a 3.23% increase in total franchise-related wages to almost $61.7 billion (a net increase of $1.9 in wages over the coming year). Part-time franchise-related employment is expected to increase slightly less than full-time employment, by 0.25% (+1,200 net new jobs) to 481,200 jobs while full-time employment is expected to grow by 0.28% (+3,500 net new jobs) to 1.25 million.
At the provincial level, in absolute terms, Alberta is estimated to have the largest number of franchise establishments added, as well as the fourth largest percentage growth, with an increase of 61 establishments (growth of 0.78%) to 7,878. Ontario has the second largest number of franchise establishments added (+45 net establishments, growth of 0.14%) to 32,191. In terms of percentage growth, Newfoundland and Labrador and Prince Edward Island both experience the highest growth at a rate of 0.9. The third largest growth province is Saskatchewan , where the number of franchise establishments is expected to increase by 0.85% (13 net establishments) to 1,557. Meanwhile, the lowest percentage growth is projected to occur in British Columbia, Ontario and Quebec, where the number of franchise establishments is estimated to grow by 0.16%, 0.14%, and 0.21%, respectively. A breakdown of the provincial and territory projections for the franchise industry is provided in Table 2 and Table 3
Table 4 provides an overview of the outlook of the top franchise industry sectors across total franchiserelated GDP and total franchise-related employment in terms of full-time equivalents ( FTEs). Notably, we anticipate significant gains in GDP, wages, and taxation revenues due to the expectation that inflation will remain above target during most of 2024 Sectors which may experience above average growth include agriculture, construction, and mining, though many of these have smaller franchise footprints . The growth in the accommodation and food services sector, despite being the largest sector by number of franchises and employment, is expected to be softer given the slower overall growth in 2024. Of the combined $32.8 billion of franchise-related GDP in this sector, the majority, 93%, is from the food services sector.
The sectors with the lowest changes from 2024 to 2025 (included in the “Rest of sectors” category) include utilities; wholesale trade; retail trade; transportation and warehousing; professional, scientific and technical services; other services (except pub lic administration); management of companies and enterprises; and public administration.
2 Refer to Figure 1 on the next page for an overview of industry sectors and the types of franchises that fall under each industry sector category.
Figure 1 below provides an overview of the North American Industry Classification System (NAICS) industry sectors and the types of franchises that fall under each sector category.
F Figure 1 Industry sector descriptions
Accommodation Services (NAICS 721)
Hospitality Products / Services
Hotels / Motels / Campgrounds
Commercial and Residential Services (NAICS 56)
Administrative and Support
Commercial - Janitorial Services
Employment / Personnel Services
Environmental Products and Services
Event Planning
Fire Prevention / Safety & Security
Furniture / Upholstery Repair
Home - Inspection Services
Home - Maid / Cleaning Services
Janitorial & Maid Services
Lawn & Garden Supplies / Services
Remediation
Security Systems & Services
Travel
Waste Management
Arts, Health and Fitness (NAICS 71)
Health / Fitness / Nutrition
Sports / Recreation / Entertainment
Weight Loss Services / Body Contouring
Educational Services (NAICS 61)
Educational Products & Services
Real Estate and Business Services (NAICS 52-53)
Business - Supplies / Equipment & Services
Business Services / Office Space / Co-working Space
Financial / Cash Services
Insurance
Leasing and Holding Companies
Rental
Printing and Manufacturing (NAICS 31-33)
Building & Design Services
Commercial - Supplies / Equipment & Services
Printing / Copying / Shipping
Sign Products & Services
Wine Making
Other Services (except Public Administration) (NAICS 81)
Automotive & Truck Services / Products / Rentals
Beauty / Cosmetics / Supplies
Dry Cleaning / Clothing Care
Hair & Nail Salons / Spas
Tanning Salons
Other
Professional and Technical Services (NAICS 54)
Accounting / Tax Services
Advertising / Marketing / Promotional Products & Services
Business Consultants / Services / Training
Computer / Software / Internet
Legal
Painting Services
Photo Imaging / Photography
Scientific
Construction (NAICS 23)
Custom Deck
Home/Commercial Improvement / Renovation / Restoration
Retail (NAICS 44-45)
Automotive dealers
Children's Products & Services
Commercial / Residential Services
Food - Grocery / Specialty Shops/ Meal Assembly
Home - Decorations / Furnishings
Home Based Businesses
Real Estate Mobile Businesses
Food Services (NAICS 722)
Pets - Sales / Supplies / Services
Food - Baked Goods / Coffee / Donuts Pharmacy
Food - Quick Service Restaurants Retail
Food - Restaurants / Dining Rooms
Health Care (NAICS 62)
Seniors Services / Home Care / Transition
Social Assistance
Information and Cultural Industries (NAICS 51)
Magazines / Publishers
Water Treatment
Transport and Warehousing (NAICS 48-49)
Consumer Buying Services
Designated Driving / Transportation Services
The Canadian franchise industry is projected to grow by over 180 net new franchise establishments in the coming year, an increase of 0.28% over 2024 to nearly 66,400 establishments As shown in Figure 2, this growth consolidates the increase since the 2021 pandemic numbers3
F Figure 2 Number of franchise establishments since 2021 at the start of each year
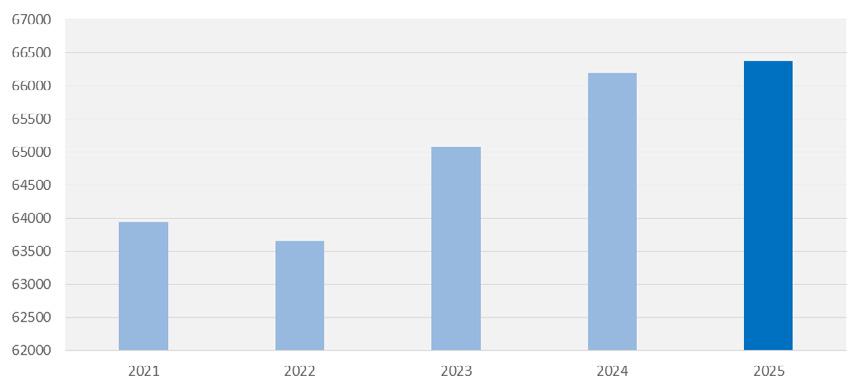
Across the country, Alberta is expected to have the largest number of franchise establishments added (+61 net increase, growth of 0.78%) to 7,878. This represents 33% of all new franchise establishments in Canada in the upcoming year Alberta is followed by Ontario, projected to grow by 45 net establishments, resulting in a total of 32,191 establishments Saskatchewan, British Columbia, and Quebec are expected to see franchise growth with 13, 16, and 22 new franchise establishments , respectively. In terms of percent growth, Ontario, Quebec and British Columbia are expected to experience the lowest growth rates, at 0.14%, 0.21%, and 0.16%, respectively Further provincial breakdowns are provided in Table 5
3 Historical data has been revised since the publication of ear lier reports.
The total franchise-related GDP is estimated to be $120.1 billion in 2025, a 3.24% increase over 2024 In 2025, the direct GDP attributed to Canadian franchises is estimated to be $70.7 billion, which represents 59% of the expected total franchise-related GDP Table 6 provides an overview of the direct and total franchise GDP growth projected for 2025 by industry sector
The sectors with the lowest nominal GDP (included in the “Rest of sectors” category) include agriculture, forestry, fishing and hunting; mining, quarrying, and oil and gas extraction; utilities; wholesale trade; transportation and warehousing; information and cultural industries; health care and social assistance; management of companies and enterprises; and public administration.
The primary driver of the growth in total franchise-related GDP is the food and accommodation services sector, which is expected to increase by 3.21% to $32.8 billion (+$1.02 billion from 2024) with 93% arising from the food services component of the sector due to the much larger number of food service franchises. This is followed by the administrative and support, waste management and remediation services sector, which is expected to increase by 3.20% to $14.9 billion (+$460 million from 2024). Combined, these two industry sectors represent nearly 40% of the growth in the total-franchise related GDP.
If we consider direct franchise GDP contributions (i.e. GDP that is generated through the operation of franchise establishments and not through indirect and induced effects), the top three industry sectors with the largest direct franchise GDP percentage growth in Canada are projected to be:
Professional and technical services, growing by $200 million (+3.42%);
Construction and related services, growing by $90 million (+3.41%); and
Manufacturing, growing by $90 million (+3.28%).
The differences are due to the indirect and induced impacts within these industry sectors which include the rent paid by many employees and franchisees.
Figure 3 provides an overview of the change in total franchise-related GDP in the franchise industry between 2024 and 2025 by province. As evident below, the largest total franchise-related GDP is projected to occur in Ontario followed by British Columbia and then Quebec.
F Figure 3 Provincial and territories total franchise-related nominal GDP
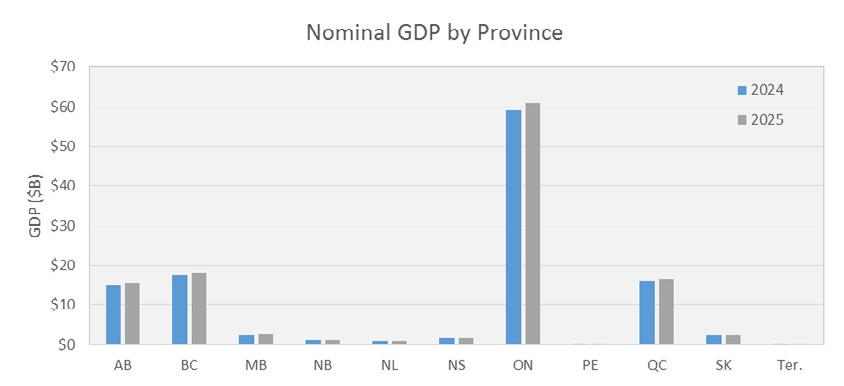
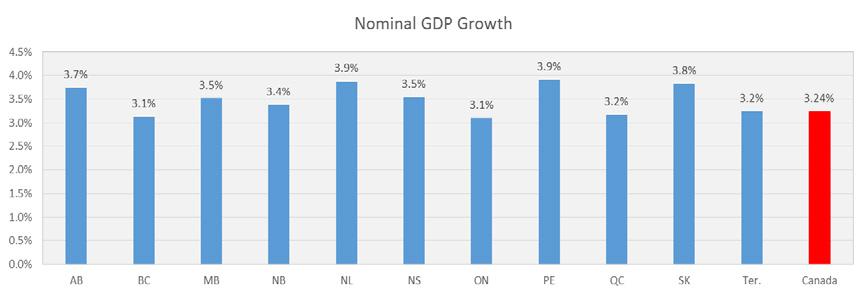
Of all the provinces and territories, most of them are projected to experience total franchise-related GDP growth equal to or above the national average of 3.24%, with the exception of British Columbia, Ontario, Quebec, and the Territories, as illustrated in Figure 4 The largest percentage growth in total-franchise related GDP is projected to occur in PEI, with an increase of 3.91% (20.7% greater than the national average), followed by Saskatchewan (17.2%).
The significance of franchise ecosystem to the Canadian economy is highlighted in Table 8 which shows that if franchises were considered its own sector, it would rank 12 th in Canada.
The total franchise-related employment is projected to grow to 1.73 million jobs (1. 49 million FTEs) by 2025, a 0.28% increase over 2024 and equivalent to 4,700 net new jobs Direct employment in Canadian franchises, representing 75% of the total franchise-related employment, is expected to grow by 3,600 new jobs (3,000 FTEs) by 2025, a 0.27% increase Table 9 provides an overview of the direct and total franchise employment growth projection by province
T Table 9 Canadian franchise employment growth
Full-time total franchise-related employment growth is expected to be greater than part-time employment growth, which are expected to increase in 2025, respectively, by 0.28% (+3,500 net new jobs) to 1.25 million jobs and by 0.25% (+1,200 net new jobs) to 481,200 Table 10 further breaks down the employment growth across the provinces and territories by type of employment.
At the provincial level, in absolute terms, Alberta is estimated to have the largest number of total franchiserelated jobs added by 2025 (+1,532 new jobs, growth of 0.78%) to 198,700 jobs (172,400 FTEs). This represents 33% of the total franchise-related new jobs projected to be created by 2025. Ontario, given its size, is the province with the next largest number of total franchise-related jobs added (+1,227 new jobs).At the same time, PEI’s projected percentage growth in franchise-related employment for 2025, at 0.92%, is the highest of all provinces and is over 3 times higher than the national average.
The Atlantic Provinces and the Territories are expected to add the fewest franchise -related jobs, each collectively adding under 400 jobs. These regions have lower population sizes, and therefore, there is less demand for net new franchise establishments (i.e., some franchises may close and new franchises may open, but net numbers are not changing as much as in other provinces).
In terms of the industry sectors that will contribute the most to the total franchise-related employment in 2024, the food and accommodation services sector (39 8%) and retail (13 5%) are projected to have the two largest contributions, making up over half of all franchise-related employment Figure 5 provides a breakdown of the sectors contributing to total franchise-related employment.
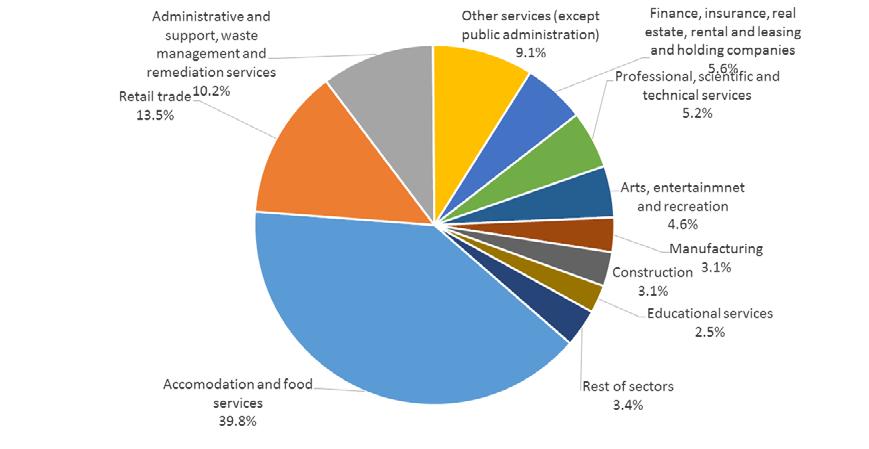
The “Rest of sectors” group include agriculture, forestry, fishing and hunting; mining, quarrying, and oil and gas extraction; utilities; wholesale trade; transportation and warehousing; information and cultural industries; health care and social assistance; management of companies and enterprises; and public administration.
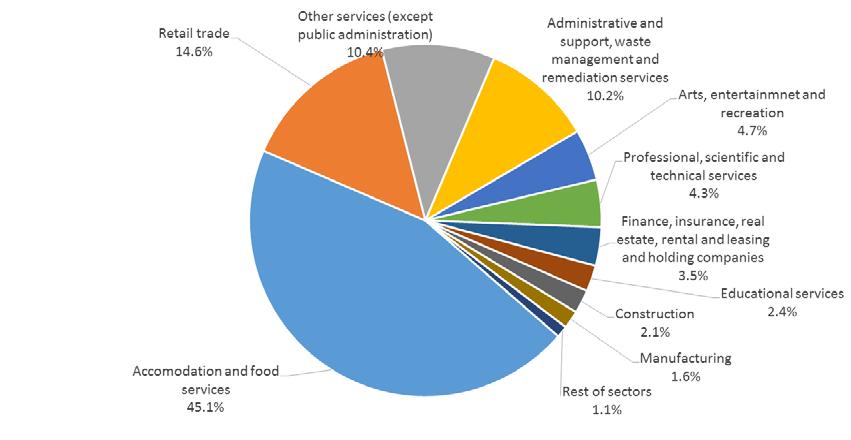
In terms of direct franchise employment, the food and accommodation services (45.1%) and retail (14.6%) sectors are also projected to contribute the most, followed by other services (excluding public administration) (10.4%). A further breakdown is provided in Figure 6.
The “Rest of sectors” category includes the same sectors as in Figure 5
The increase in franchise-related employment and wage growth is estimated to be associated with a 3.23% increase in the total franchise-related wages to $61.7 billion by 2025. This is a projected net increase of $1.9 billion in wages over the coming year. Table 11 provides a breakdown of the wage increases across the different provinces.
The total franchise-related gross operating surplus4 (GOS) is estimated to be $37.6 billion by 2025, a 3.25% increase (+$1.19 billion net increase) over 2024 Table 12 provides an overview of the total franchiserelated GOS growth projected by province and territories The largest increase in total franchise-related GOS is projected to occur in Ontario (+$ 551 million net increase, growth of 3.10%), followed by Alberta (+$200 million net increase, growth of 3.75%) and then British Columbia (+$182 million net increase, growth of 3.12%).
$0.06 3.24%
The primary driver of the growth in total franchise-related GOS growth in the Canadian franchise industry is the food and accommodation services sector, which is estimated to increase by 3.22% by 2025 to $8.65 billion (+$270 million net increase from 2024). With food services franchises outnumbering the accommodation franchises by more than 10 to 1, over 90% of the GOS $8.65 billion is associated with the food services franchises. This is followed by the financial, insurance and real estate sector , which is estimated to increase by 3.22% by 2025 to $6.02 billion (+$190 million net increase). Further breakdowns of the total franchise-related GOS growth by sector are provided in Table 13
4 Operating surplus is the return to capital of incorporated business. It consists of gross profits (including bad debts and charitable contributions) of corporations before income taxes, including capital consumption allowances, miscellaneous investment income, dividend pay net of dividend received, interest paid net of interest received, and inventory valuation adjustment. See full definition on the Statistics Canada website
The sectors with the lowest GOS growth (included in the “Rest of sectors” category) include utilities; wholesale trade; retail trade; transportation and warehousing; professional, scientific and technical services; management of companies and enterprises; and public administration.
By 2025, the Canadian franchise industry is projected to generate a total of $15.91 billion in federal taxation revenue (+$500 million net increase, growth of 3.24%) and $13.51 billion in provincial taxation revenue (+$420 million net increase, growth of 3.21%) Table 14 provides a breakdown of the federal and provincial taxation revenue projected to be generated by the Canadian franchise industry.
T Table 14
Federal and provincial taxation revenue generated
Given its size, Ontario’s franchise industry is expected to generate the most federal tax revenue out of all provinces at $8.07 billion (growth of 3.10%) and provincial tax revenue at $6.98 billion (growth of 3.10%) by 2025 In terms of taxation revenue growth, Alberta is estimated to see the largest increase out of all the provinces and territories, with its tax revenue contribution growing by 3.74% to $2.05 billion federally and $1.03 billion provincially
All provinces and territories are expected to see growth across all franchise-sector metrics, although growth is expected to differ considerably from province to province (and territories). Most provinces are expected to have higher growth rates than the national average across all franchise-sector metrics, with the exception of British Columbia, Ontario, and Quebec. These trends are presented by province in Table 15
T Table 15 Provincial growth trends: establishments, nominal GDP, employment, GOS, wages and taxes
While GDP and employment are expected to grow across all industry sectors related to business, the professional and technical services sector is expected to have the greatest growth at a rate of 0.44%. For 2024, growth in the food and accommodation sector continues to recover slowly from pandemic disturbances with growth in the food services subsector exceeding that of the accommodation subsector. The trends in expected franchise-related growth by industry sector is shown in Table 16 below.
The sectors with the lowest nominal GDP and employment growth (included in the “Rest of sectors” category) include agriculture, forestry, fishing and hunting; mining, quarrying, and oil and gas extraction; utilities; wholesale trade; transportation and warehousing; information and cultural industries; management of companies and enterprises; health care and social assistance; and public administration.
In conclusion, our economic outlook for the upcoming year indicates that while the growth of franchise establishments will continue to be slow, we still expect to see positive gains in key economic indicators. This includes an increase in GDP, wages, and taxation revenues, driven by the persistence of inflation throughout the year. As a result, we anticipate a growth rate of approximately 3.24% for the Canadian franchise industry, which will push its total franchise-related GDP contribution to $120.1 billion in nominal terms. These projections are a positive sign for the franchise industry and suggest that it will continue to be a significant contributor to the Canadian economy in the coming year.
Total franchise-related employment in the country is estimated to grow by 0.27% to 1.73 million jobs (1.49 million FTEs) throughout 2024 (equivalent to 4,700 net new jobs, 3,600 of which are directly due to franchises) Total franchise-related employment growth is split between full-time employment, which is estimated to increase by 0.28% (+3,500 net new jobs) to 1.25 million jobs, and part-time employment, which is expected to grow by 0.25% (+1,200 net new jobs) to nearly 481,200. Growth in employment is associated with a 3.23% increase in the total franchise-related wages to nearly $61 7 billion (a net increase of $1.9 billion in wages over the coming year)
The increased GDP, employment, and associated wages will result in an estimated 3.25% increase in federal and provincial taxation revenue contributed by th e Canadian franchise industry Federal tax revenue contributed by the franchise industry is estimated to reach $15.9 billion, while provincial tax revenue contributed by the franchise industry is estimated to reach $13.5 billion.
In terms of the provinces and territories , the largest increases in absolute terms in franchise-related GDP, employment, wages, GOS and taxation revenue are estimated to occur in Ontario, due to the size of the economy Total franchise-related GDP and wage growth in Ontario is projected at $1.83 billion and $960 million (growth of 3.10%), respectively. However, in terms of new franchise establishments, Albert a is expected to grow the most Of the 183 net new franchise establishments projected to be created countrywide, over 33% are expected to be located in Alberta. PEI is estimated to outperform all other provinces and territories in terms of percentage growth in franchise-related GDP (3.91%), employment (0.91%), wages (3.90%), total taxation revenue (3.91%), and number of establishments (0.9%, tied with Newfoundland and Labrador).
Agent
Agent-based modeling (ABM)
Direct Impact
Employment (Fulltime equivalents)
Employment (Total)
Franchisee
Franchising
Franchisor
Gross Domestic Product (GDP)
Gross Operating Surplus
Indirect Impacts
An autonomous individual, firm or organization that responds to cues from other agents and their environment using a set of evidence -based behavioural rules in response to those cues.
A framework for modeling a dynamic system, such as an economy, using individual agents, their mutual interaction with each other, and their mutual interaction with their environment(s).
The impacts directly involved in the operation of franchises. This includes the income and value of production of economic agents (i.e., workers and firms) directly involved in a franchise
Equivalent to person-years of employment refers to the amount of work typically performed by one person working full-time for one year.
The number of employed residents living in a region, in a given year. These residents may work within their region of residence or may commute outside of the region to work.
An individual or organization that gets granted and holds the rights contained in the franchise agreement for the sale of goods or the operation of a service.
Method of doing business in which one person, the franchisor, grants another, the franchisee, certain rights contained in the franchise agreement.
An individual or organization that grants the rights contained in the franchise agreement to a third party for the conducting of a business under their marks.
The total unduplicated value of the goods and services produced in the economic territory of a country or region during a given period.
Gross operating surplus is the surplus generated by operating activities after the labour factor input has been recompensed. It can be calculated from the value added at factor cost less the personnel costs. It is the balance available to the unit which allows it to recompense the providers of own funds and debt, to pay taxes and eventually to finance all or a part of its investment.
The indirect effects are the economic impacts that arise through business to business interactions throughout the supply chain.
Induced Impacts
Induced effects are the economic activity created through increased spending of those workers receiving incomes from franchises They can also occur due to reinvestment of business profits to expand capacity or replace depreciated capital stock. These purchases or activities can lead to further employment, wages, income, and tax revenue that reverberate throughout different industries.
CANCEA’s cutting-edge and innovative “big data” computer simulation platform that incorporates social, health, economic, financial, and infrastructure factors in an agent-based system
The belief that in complex systems, the whole is not equal to the sum of its parts. Such an approach requires the understanding that different combinations of assets can have different values for agents and that agents have different constraints and desires, and cannot be treated as aggregates.
Impacts that transcend direct, indirect and induced effects, which are not traditionally measured by economics. These impacts arise from the relationship between every economic agent and the environment in which they operate, as they influence one another’s states and behaviours.
The tax collected by the provincial and federal governments and is made up of income, consumption, and corporate taxes.
The economic forecast of the Canadian franchise industry was conducted using CANCEA’s Prosperity at Risk® platform. Using over 170 tables from Statistics Canada, including Statistics Canada input -output data (I/O), and over 56,000 Canadian Census dissemination areas, the Prosperity at Risk® platform takes into account the demand and supply of commodities across industry sectors and unifies it with demographics, labour force dynamics, government finances, private capital investment, and the interdependencies of production to allow for the Canadian franchises to be quantified and forecasted.
As the Prosperity at Risk® platform is an agent -based, event-driven microsimulation platform, it is capable of capturing the direct, indirect, and induced contributions, as well as ident ifying the contribution at different regional levels. By incorporating household behavio ur, industry and firm behavio ur, and federal and provincial tax rates, Prosperity at Risk® is capable of providing the economic impact across different economic indicators such as GDP (real and nominal), employment, wages, government revenue, and household income. Furthermore, Prosperity at Risk® also captures the “system impacts”, which consider the broader impact of franchises
In addition to internal model validation, the output from the Prosperity at Risk® platform is regularly tested against the results of other models. Cross model validation ensures Prosperity at Risk® is producing baselines that are in accordance with other models Key models include:
Public sector forecasts including Ontario Ministry of Finance (e.g., population and GDP) ; and
Private-sector forecasts including major Canadian banks
For more information on the Prosperity at Risk® platform and its applications, please refe r to CANCEA (2017).
Bank of Canada. 2023. October 2023 Monetary Policy Report. Bank of Canada.
Canadian Franchise Association. 2017. Franchising in Canada: Policy Briefing. Toronto: Canadian Franchise Association.
CFA. 2017. "Franchising Research and Facts." Canadian Franchise Association. https://www.cfa.ca/newsabout-cfa-members/franchise-research-facts/.
Frazer, L., S. Weaven, A. Grace, and S. Selvanathan. 2016. Franchising Australia 2016. Griffith Business School.
Heintz, J., R. Polin, and H. Garrett-Peltier. 2009. How Infrastructure Investments Support the U.S. Economy: employment, productivity and growth. Political Economy Research Institute, University of Massachusetts Amherst.
International Trade Administration. 2016. 2016 Top Markets Report: Franchising. U.S. Department of Commerce.
PWC. 2016. The Economic Impact of Franchised Businesses: Vollume IV, 2016. Price Waterhouse Cooper.
The Canadian Centre for Economic Analysis. 2016. "The Economic Impact of Canadi an P3 Projects: Why building infrastructure 'on time' matters."
The Canadian Centre for Economic Analysis. 2017. Understanding the forces driving the shelter affordability issue: A linked-path assessment of housing market dynamics in Ontario and the GTHA. The Canadian Centre for Economic Analysis.