MASTER DATA EXCELLENCE: A 3-STEPS FRAMEWORK
How Data Analytics & AI can improve the quality of business-critical master data


How Data Analytics & AI can improve the quality of business-critical master data
Master data acts as the cornerstone for a multitude of business processes. Its accuracy has far-reaching implications, from the glaringly obvious - such as merchandise being blocked at customs - to the less visible, like recurring stock-outs caused by an underestimated distribution lead-time in Distribution Requirements Planning (DRP). Erroneous master data can disrupt operations, degrade performance, and affect a company's bottom line.


However, relying solely on the implementation of procedures and best practices for managing master data is not sufficient: the reality of any complex system is that anomalies will eventually appear. A more proactive approach is required: establishing a robust measure of master data quality and creating an effective feedback loop. This goes beyond wishful thinking and into actionable territory where master data quality is continuously monitored and improved.
This is where modern data analytics platforms empower organizations to set up dynamic master data control rules. Leveraging advanced analytics and AI models, these platforms can detect inconsistencies and provide alerting capabilities, ensuring quick corrective actions. This article outlines a three-step framework - Establish, Monitor, and Enhance - to achieve master data excellence and harness the potential of Data Analytics and AI in maintaining the quality of business-critical master data.
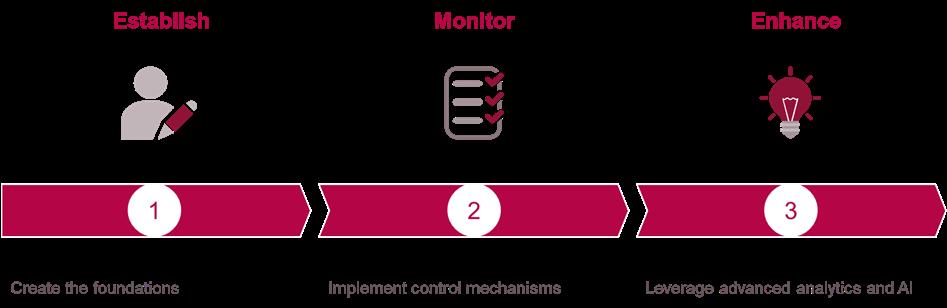
Establishing a solid foundation for master data excellence begins with adhering to a set of base principles:
• Firstly, ownership of master data must be explicitly defined. This should be at the domain level at the very least, but for more granular control, ownership should also be designated at the field level. Clear ownership ensures accountability and is required before taking further steps towards end-to-end master data governance.
• Procedures for data entry must exist, and they need to be accessible, current, and easily searchable. These procedures should cover the entire spectrum of data entry activities, ensuring that everyone involved adheres to the same standards and practices.
• Validation of data at the point of entry is another critical aspect. Wherever possible, systems should be configured to accept only valid values. In instances where this isn’t feasible, a validation workflow could be established to ensure that erroneous data does not enter the system.
One of the cardinal rules of master data management is to establish a single source of truth for each master data element. This involves creating a father-child relationship between systems, with automated links wherever possible. This ensures data consistency and reliability across different systems and processes. For instance, the concept of [product category] should only be defined and updated in a single source system, and other systems needing this information will inherit this property from the source, rather than maintaining it in multiple locations.
It is also essential to recognize that not all critical master data resides within a system (ERP, APS, MDM, WMS, to name a few). Businesscritical data that exists outside the system – for instance, S&OP product families used for rough-cut capacity planning - require the same level of governance as in-system master data. Ignoring these can lead to significant planning and operational inefficiencies.
While these principles are fundamentally sound, they alone are not enough to ensure master data excellence. Without clear metrics and objectives for data quality, it becomes difficult to incentivize and motivate a decentralized group of data owners to maintain high standards. Master data management can be time-consuming, and without measurable goals, efforts can quickly lose momentum: as the adage goes, "What you can’t measure, you can’t manage." But how do you quantitatively measure the quality of master data? This question will be explored in the next section of our framework.
Establishing a solid foundation for master data excellence begins with adhering to a set of base principles:
The second step of the framework is to put in place a set of control rules that will alert in case of deviations and drive remediation action plans. These rules should first be defined in plain language and often obey the format of:
On the scope defined by {these filters}, The expected value of {this master data field} must be {equal/comparable} to {this reference value}
Let us illustrate this with a couple of examples:
• Rule “saleable products” : On the scope of finished products ([product type] = “Finished Goods”) marked with the flag [is_active] = TRUE, the expected value of the flag [is_saleable] must be equal to “1”
• Rule “active contract for subcontracting”: On the scope of subcontractors with at least 1 open Purchase Orders, the [validity_ end_date] of their contract must be higher than the [expected delivery date] of the related PO
With the examples above, we see that these rules can be non-trivial to implement. Ultimately, control rules must check multiple dimensions of master data (MD) quality, including:
• Completeness: Ensuring all required fields are filled.
• Validity: Verifying data conforms to set standards or formats.
• Coherence: Checking logical consistency across related data fields.
• Integrity: Ensuring relationships between data elements
• Freshness: Confirming data is current and up-to-date.
Testing for data quality is not new, and data engineers have long leveraged powerful frameworks to ensure that data pipelines work properly in modern data platforms. Examples of such frameworks include Great Expectations, DBT tests, along with data quality modules present in various ETL/ELT tools on the market. Data engineers would typically verify Completeness, Freshness and sometimes Integrity, since these three checks are less dependent on proper business understanding and interpretation of the master data field contents.
However, these frameworks fall short of expectations in the case of Master Data quality management. In fact, business-driven control rules can be arbitrarily complex (multiple if clauses, need to merge and reconcile data coming from separate sources before applying the rule...). In addition, the data engineering frameworks mentioned above are meant for technical profiles, while the observability of the rule results (OK/KO) must be business-oriented and not only in the hands of IT/data teams.
So, how do you implement a business-oriented data quality control solution? By relying on the same data platform as mentioned above, but with a different split of responsibilities. The simplified process will look like this:
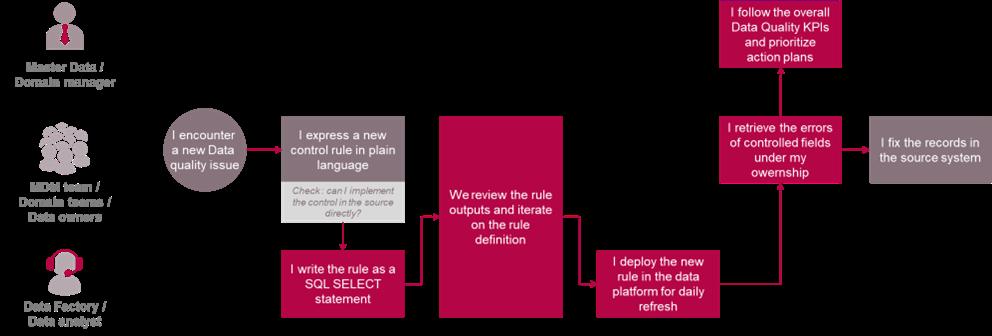
Most often, the first attempt at defining a new rule is incorrect due to the scope of it being loosely defined, requiring a few iterations before landing on a definition that does not generate “false positives”. The enabler of this data quality control solution is the transverse data platform, particularly since data checks need to happen across various systems (and even address out-of-system data, as mentioned earlier).
While the process illustrated above still relies on a technical profile (data analyst, engineer, etc.) to set up the rule code (in SQL language or Python most likely), Large Language Models (LLMs) and AI-enabled text-to-SQL approaches now allow business users to iterate on their own in a no-code way. The user can simply express the rule in plain English language and let the AI assistant infer the corresponding code, run the rule and show the results.
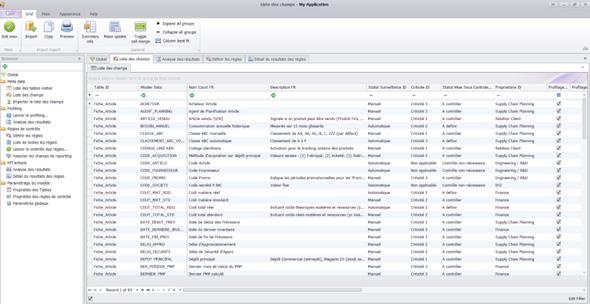
Now that control rules are defined, the measurement of MD quality becomes much more straightforward. 3 KPIs can be set up:
• % of field in control scope = (Count of master data fields with owner,description and criticality)/(Total count of used master data field)
• % of fields under control rules = (Count of master data fields with at least one control rule)/(Count of master data fields in control scope)
• % Quality = (Number of records with no rule violation)/(Total number of records in scope)
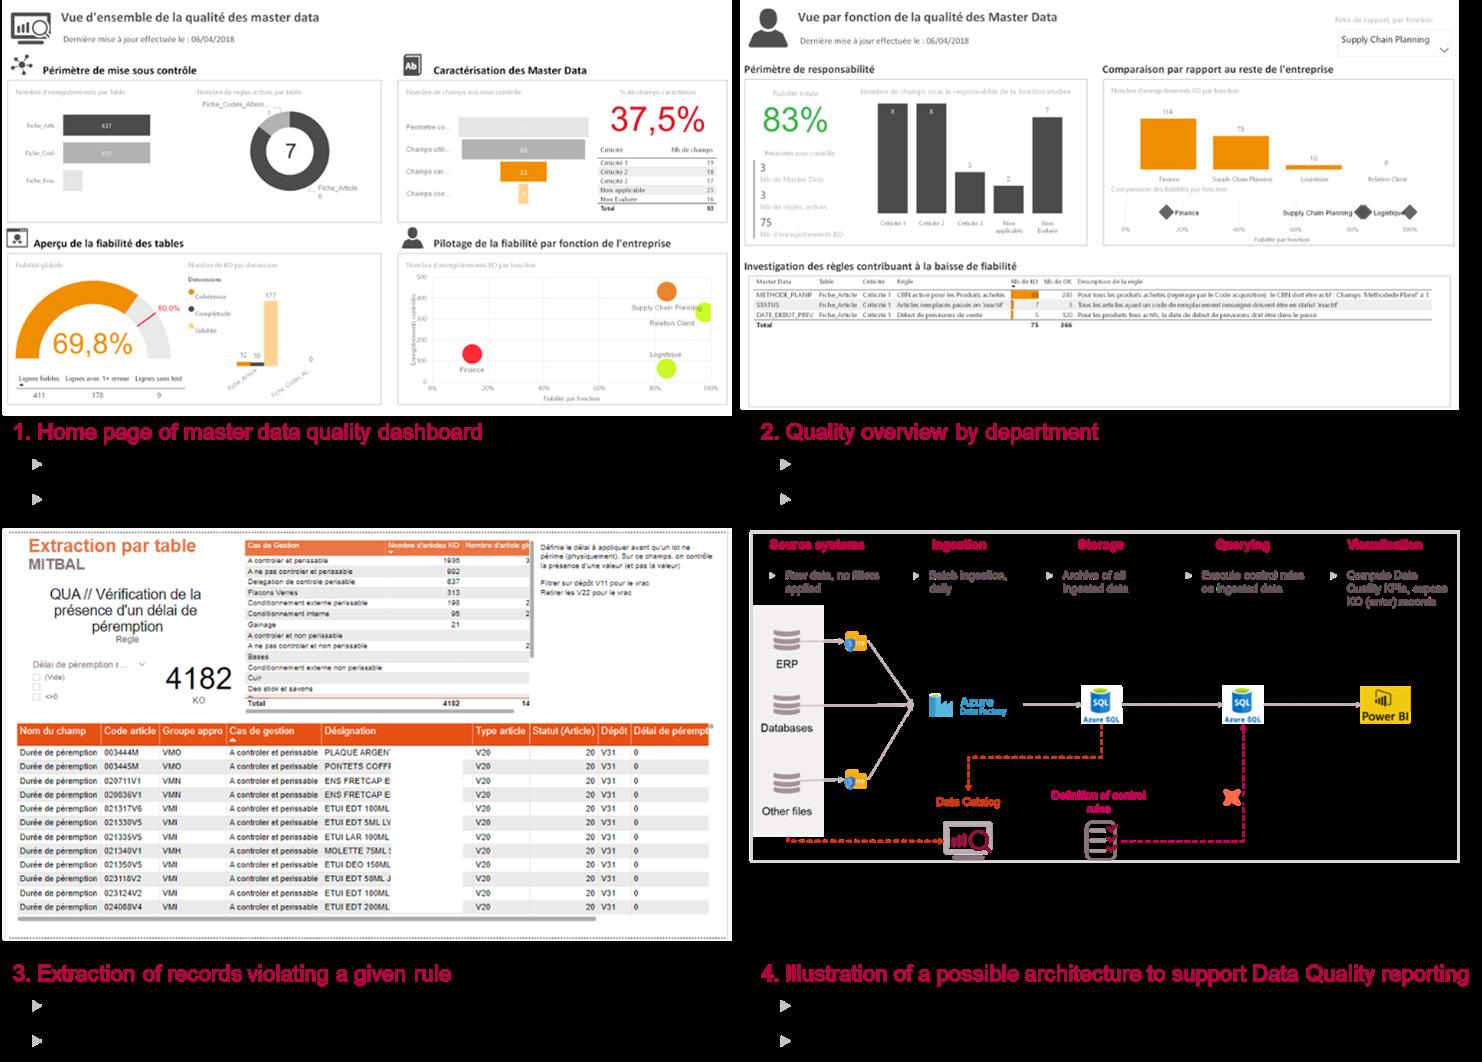
In the definitions above, “scope” can be defined both in terms of master data tables (e.g. Products, Products x Supplier, Products x Location, …) and in terms of row context (e.g. exclude all archived products from control scope). Once defined and calculated at field and record level, these KPIs can be further analysed and drilled-down by rule criticality and domain ownership in any data visualization tool (see illustrations below).
In addition to the rule-based control process described above, it is beneficial to automatically detect issues and propose resolutions, going as far as automatically fixing master data values in the source. Sometimes, value entry rules are so complex and multidimensional that they become lost or only known by a single person in the entire organization. As a result, setting a new control rule becomes a very time-consuming and frustrating process due to false positives.
This is where Artificial Intelligence (AI) can help, by understanding hidden patterns in structured and semi-structured datasets, without having to explicitly describe the control rules. The table below highlights three different applications of AI to improve master data quality, selected from recent projects conducted with Argon & Co.
Re-categorization of products Major online marketplace

Price anomaly detection Major online marketplace

Product weights & measurement correction

Leader in perfume & cosmetics
Vendors create new products on the marketplace every day. They need to choose the product categories from a list of 8000 values, and sometimes do not choose the correct one.
This leads to lower sales because miscategorized products are not well referenced in user search results.
High rate of New Products introduction, product teams working in silos, each pricing is “unique”. 80k SKUs.
Additionally, prices can drift due to frequent repricing, following changing exchange rates and intense competition dynamic.
Leverage product descriptions, title and all available text and numerical attributes to classify the product into one of the 8000 possible product categories.
Achieved by recursively applying LLMs on this classification task.
+10M€ revenue / year
The Product database contains measurements of dimensions (height, width, depth) and weight.
Missing or erroneous information can block logistics operations (under 3PL), particularly during new product introductions.
Leverage product attributes and style proximities to detect discrepancies on listed price.
Side benefit: also detect errors in product attributes (price is correct but other attributes are incorrect.
Ex: price is very high but flag [has diamond paving] is set to false in database).
Achieved by using decision tree regressors.
Map relevant product attributes and descriptors allowing to infer the weights & measurements; in order to provide a first estimate for missing values or to detect potential anomalies.
Achieved by using rich product embedding features as an input to a decision tree regressor.
3% anomalies detected, on a threshold of 10-15% price variation depending on product categories. Additional revenue opportunities in ~1/3 of cases.
60% of products with <10% error on all dimensions, enabling an automated suggestion.
From the examples above, it becomes clear that the variety of use-cases is extensive. Most often, they are unique to a particular industry and require significant customization to achieve a satisfactory level of accuracy. And even then, the AI recommendation will almost never be 100% accurate. This is why, in some cases, AI models outputs should be reviewed by a data owner, keeping a “humanin-the-loop” approach for business-critical fields.
It is worthy to note that all these models operate on a similar kind of logic:
• Define the Target Field to Control: Identify the specific field in the master data that needs monitoring.
• Find the Explainer Fields: Manually or automatically identify fields that help control the value in the target field.
• Utilize Explainer Fields: These fields are used as inputs for a Machine Learning model. They can be combined into advanced features to better understand similarities between comparable records. As an example, product embeddings are a powerful tool when acting on product master data.
• Execute the Model: Ask the AI model to predict the target field value by iterating over the dataset.
• Evaluate the Model: Assess the model on a test set where the target value is known to be correct. Define the accuracy metric according to the actual value, whether it is numeric or categorical.
By integrating a foundational framework leveraging advanced analytics and AI, organizations can significantly enhance their master data quality.
From our three-steps framework, it is important to note that all three steps are complementary. The AI-driven approach cannot be the only solution, since it would not scale well to large control scopes (sizeable time investment from a data scientist profile may be necessary to develop an evaluation model for every field). On the other hand, continuous monitoring, proactive issue detection, and the strategic application of AI allow businesses to effectively manage complex, multi-dimensional data quality rules.

IRIS are the specialists within Argon & Co that have deep expertise in data and AI for operations.
With services spanning data and AI advisory, advanced operations analytics and AI applications, underpinned by our innovation lab, we work together with clients to generate real change.
Our people have a proven track record of applying a mix of operations experience, data expertise and broad business knowledge to design and implement robust solutions.
We are based in Paris, London and Sydney, and work collaboratively across the Argon & Co offices globally.

Guilhem Delorme Associate Partner guilhem.delorme@argonandco.com
Guilhem led Supply Chain transformation projects for several years before joining the IRIS by Argon & Co team as Data Project Manager. Now as an Associate Partner, He manages the design, construction, deployment and execution phases of Data-based use cases applied to Supply Chain and Logistics (Business Intelligence, Machine Learning models, Enterprise Data platform, etc.).