
SustainabilityIndicatorSelectionbyaNovelTriangular IntuitionisticFuzzyDecision-MakingApproachinHighway ConstructionProjects

HassanHashemi 1 ,ParvizGhoddousi 1,*andFarnadNasirzadeh 2
1 SchoolofCivilEngineering,IranUniversityofScienceandTechnology,P.O.Box16765-163,Narmak, Tehran1684613114,Iran;hashemi.h@live.com
2 SchoolofArchitectureandBuiltEnvironment,DeakinUniversity,Geelong,VIC3220,Australia; farnad.nasirzadeh@deakin.edu.au
* Correspondence:ghoddousi@iust.ac.ir;Tel.:+98-21-77240398
Citation: Hashemi,H.;Ghoddousi, P.;Nasirzadeh,F.SustainabilityIndicatorSelectionbyaNovelTriangular IntuitionisticFuzzyDecision-Making ApproachinHighwayConstruction Projects. Sustainability 2020, 13,1477. https://dx.doi.org/10.3390/su13031
477
Received:1October2020
Accepted:13November2020

Published:1February2021
Publisher’sNote: MDPIstaysneutralwithregardtojurisdictionalclaims inpublishedmapsandinstitutional affiliations.
Abstract: Theconstructionindustryhasbeencriticizedasbeinganon-sustainableindustrythat requireseffectivetoolstomonitorandimproveitssustainabilityperformance.Themultiplicityof indicatorsofthethreepillarsofsustainability—economic,social,andenvironmental—complicates constructionsustainabilityassessmentsforprojectmanagers.Therefore,prioritizingandselecting appropriatesustainabilityindicators(SIs)isessentialpriortoconductingaconstructionsustainability assessment.ThemainpurposeofthisresearchistoselectthemostappropriatesetofSIstoaddress allthreepillarsofhighwaysustainabilitybyanewgroupdecision-makingapproach.Theproposed approachaccountsforriskattitudesofexpertsandentropymeasuresunderatriangularintuitionistic fuzzy(TIF)environment,tohandletheinherentuncertaintyandvaguenessthatispresentthroughout theevaluationprocess.Furthermore,newseparationmeasuresandrankingscoresareintroducedto distinguishthepreferenceorderofSIs.Eventually,theapproachisimplementedinacasestudyof highwayconstructionprojectsandtheapplicabilityoftheapproachisexamined.Toinvestigatethe stabilityandvalidityofcomputationalresults,asensitivityanalysisiscarriedoutandacomparison ismadebetweentheobtainedrankingoutcomesandthetraditionaldecision-makingmethods.
Keywords: sustainablehighwayconstruction;sustainabilityindicators;triangularintuitionistic fuzzy;multi-criteriadecision-making;entropymeasure;riskattitudes
1.Introduction
Thepreliminaryconceptofsustainabledevelopmentwasintroducedinthe1980s[1]. AccordingtotheWorldCommissiononEnvironmentandDevelopment(WCED)report, sustainabledevelopmentreferstodevelopmentthatcanbeusefulfornature,notharmful andaidsinmeetingtheneedsofpresentgenerationswithoutcompromisingtheneedsof futuregenerations.Sustainabledevelopmentisgenerallybalancedamongthreeaspects orpillars:economic,environmentalandsocialsustainabilityandaimstomeetallthese needs/objectivessimultaneously[2].
Copyright: ©2020bytheauthors.LicenseeMDPI,Basel,Switzerland.This articleisanopenaccessarticledistributed underthetermsandconditionsofthe CreativeCommonsAttribution(CCBY) license(https://creativecommons.org/ licenses/by/4.0/).
Inrecentdecades,sustainableconstruction—asafundamentalcontributortowards sustainabledevelopment—hasbeenthefocusofagreatdealofresearch.Recentresearch effortshavelargelyconcentratedontheperformancemeasurementprocessandsustainabilityassessmentinbuildingandconstructionprojects,basedonanalyticalandcomputational evaluationapproaches,sustainableconstructiontools,standardsandratingsystems,ora combinationofthese.Indeed,thesestudieshaveattempted—byvarioustechniques—toaid theconstructionindustryinreachingsustainabledevelopmentidealsandgoals.Asillustratedbelow,someoftheseresearchstudieshavebeenreviewed.Yuetal.[3]providedthe projectmanagementteamwithplanningstrategiesusingasustainability-assessingsystem. Theproposedsystemwasdevelopedtomonitorandevaluatethesustainabilityofwhole
activitiesthroughouttheconstructionprojects’lifecycle.GoubranandCucuzzella[4] presentedtwoanalyticalmappingtoolsfordesignteamsofbuildingprojectstoutilize SustainableDevelopmentGoals(SDGs)asasustainabilityanalyzingframeworkinthe designprocess.Thefirsttoolwasconstructedbasedondistinguishingbetweenthearchitectural,engineeringandoperationalconcerns,whilethesecondtoolwasdesigned basedonthecharacteristicsofthedesignapproach(eitherproductorhuman-focused) anditsinspiration(historyvs.futuredriven).Karacaetal.[5]developedarapidsustainabilityassessmentmethodusingindicatorsandtheirrelativeweightsattainedfrom stakeholders,andanassessmentapproachbasedontheresponsesofbuildings’occupantstomeasurethesustainabilityperformanceofresidentialbuildingsinNur-Sultan, Kazakhstan. Lietal. [6]providedacomprehensiveanalysisofvariousstakeholdergroups associatedwithsustainableconstructioninChina.Inaddition,thelevelofstakeholder influenceindecision/evaluationswasmeasuredusingsemi-structuredinterviewsand theDelphitechnique.OmerandNoguchi[7]developedaconceptualframeworkforthe selectionofappropriatebuildingmaterialsconsideringtheimplementationofthe2030 AgendaforSustainableDevelopment.Indeed,theypresentedaknowledge-baseddecision supportsystemtoassistpolicymakers,designersandconstructionstakeholdersinmaking appropriatedecisionstowardstheachievementofSDGs.Xuetal.[8]evaluatedthesustainabilityoftheconstructionindustrybyanassessmentmodelbasedontheentropymethod inChina.Thelevelofsustainabilityinconstructionprojectswasdeterminedbytwoindices namedthesocial,economic,andenvironmentalbenefitsindexandtheecologicalcosts index.Illankoonetal.[9]suggestedascoringmodelregardingtheinter-linksbetweenthe LeadershipinEnergyandEnvironmentalDesign(LEED)creditsandSDGstoevaluate buildingsconstructedinAustralia.TheirproposedmodelidentifiedaComprehensive ContributiontoDevelopmentIndex(CCDI)topolicymakersasaguidelineforevaluating buildingprojectsinordertoachievetheUnitedNations(UN)’sSDGs.Olawumietal.[10] introducedagradingsystemofbuildingsinNigeria,namedtheBuildingSustainability AssessmentMethod(BSAM)scheme.Theschemeinvolvestheidentificationofkeysustainabilityassessmentcriteriaandassignsweighted-scorestothevariouscriteriabythe multi-expertconsultationmethod.Manselletal.[11]usedempiricalevidencetoidentify agoldenthreadbetweensustainabilityreportingframeworksattheprojectlevelandthe organizationallevel,andimpactsoftheUN’sSDGs.Theframeworksbenefitfromthe CeequalreportingmethodologyattheprojectlevelandtheGlobalReportingInitiative (GRI)methodologyattheorganizationallevel.Accordingly,adatabaseofindicatorswas extractedthatalignedwiththespecificSDGtargets.Additionally,arobustinvestment appraisalwasprovidedforthedesignstageofinfrastructureprojects.
Sincehighwayprojectsareoneofthemostimportantaspectsforthedevelopment oftransportationinfrastructure—necessaryduetohigherpopulationconcentrationsand greatertransportationdemandsinurbanareas[12,13]—theyhavebeenconsideredas oneofthemostcrucialcomponentsofsustainabledevelopment.Moreover,highway constructionprojectsuseavastquantityofenergyandnaturalmaterials,generatewaste, andproducegreenhousegasesthatcangreatlyaffectthesustainabilityoftheconstruction industry.
Thesustainabilityindicators(SIs)aresignificantfactorsinthesustainabilityassessmentofhighwayprojects.VariousstudiesandtoolshaveintroducednumerousSIsforthe assessmentofthesustainabilityofconstructionprojectsthathasledtothecomplication oftheassessmentprocess.Therefore,theprioritizationofindicatorsandtheadoptionof anoptimalnumberofSIsaremajorissues.Inaddition,theevaluationofSIsiscomplex fordecision-makers,owingtoinadequateevidenceanduncertaintysurroundinghighway constructionprojects[13–15].Hence,Multi-CriteriaDecision-Making(MCDM)techniques underuncertaintyareusefultoolstocopewiththeseproblems[16–20].Whiletheconstructionindustryplaysanimportantroleinglobalsustainabledevelopment,numerousresearch effortshavestudieddifferentsubjectsregardingthesustainabilityoftheconstructionindustryandtheuseofmulti-criteriadecisionmakingtoevaluatesustainabilityinthisindustry.
HuangandYeh[21]developedaframeworktoanalyzethegreenhighwayprojectsapplyingthemax-minfuzzyDelphimethodtorecognizethemainclassificationsandrelated items.Chenetal.[22]proposedamodelcalledtheconstructionmethodselectionmodel aimedatlendingsupporttoassesstheprefabricationfeasibilityattheinitiallevelutilizing thesimplemulti-attributeratingtechniqueandsubsequentlytoadoptthebeststrategy toemployprefabricationatthefollowinglevel.Rezaetal.[23]proposedathoroughassessmenttechniqueusingTripleBottomLine(TBL)criteriatoassessflooringsystemswith respecttothecombinationofAnalyticHierarchyProcess(AHP)andLifeCycleAnalysis (LCA)techniques.Warisetal.[24]establishedcriteriaforselectingsustainableconstructionequipmentbasedonqualitativeandquantitativefeedbacksofconstructionindustry expertsandfinallyselectedthetopfivecriteria.Lietal.[25]proposedacomprehensive methodologyusingentropy,whichissuitableforcalculatingweights,andtheTechnique forOrderofPreferencebySimilaritytoIdealSolution(TOPSIS)methodsatthesametime toevaluatethedevelopmentofhighwaytransportation.Kucukvaretal.[26]presenteda fuzzyMCDMmethodforprioritizingpavementsandselectingthebestonebasedonthe respectivesustainabilityperformanceusingtheTOPSISmethod.Medineckieneetal.[27] proposedanovelMCDMtechniquetoadoptcriteriafromwhichtheirsetsandweightsare determinedinaccordancewiththeSwedishcertificationsystemMiljöbyggnadandused AHPforbuildingsustainabilityassessment.KamaliandHewage[28]identifiedsustainabilityperformanceindicatorstoevaluatelifecyclesustainability.Subsequently,anorganized frameworkwasdevelopedbasedondesigningandconductingasurveytochoosethemost suitablesustainabilityperformanceindicatorsformodularandconventionalconstruction methodsinNorthAmerica.Panetal.[29]developedasustainabilityindicatorframework toreliablyassesstheperformanceofconstructionautomationandroboticsinthebuilding industrycontext.Indeed,thestudyproposedguidelinesforsustainableautomatedand roboticoptionsforadvancedconstructiontechnology.Zolfanietal.[30]presentedahybrid MCDMmethodologyapplyingStep-wiseWeightAssessmentRatioAnalysis(SWARA) andComplexProportionalAssessment(COPRAS)forcriteriaweightsandprioritizing alternatives,respectively.
LiuandQian[31]developedanintegratedsustainabilityassessmentmethodologyin accordancewiththelifecyclesustainabilityassessmentframework.Inaddition,acombinationofAHPandELiminationEtChoiceTranslatingREality(ELECTRE)wasappliedto derivecriteriaweightsandprioritizealternatives.Reddyetal.[32]introducedadecisionmakingmethodtoadoptasustainablematerialwithoutLifeCycleInventory(LCI)informationrequirements.Inthismethod,criteriathathighlyinfluencematerialsustainability wereinvestigatedandconsequentlyappliedtoanalyzetheperformanceofmaterialsin differentaspectsofthemateriallifecycletodevelopasustainablematerialperformance indexutilizingAHP.Chen[33]usedanewmulti-criteriaassessmentapproachintegrating theGreyRelationalAnalysis(GRA)andTOPSIStechniques,whichoperateaccording totheintuitionisticfuzzyentropymethod,forselectionoftheappropriatesustainable supplierofconstructionmaterials.Royetal.[34]developedacombinativedistance-based evaluationmethodutilizingInterval-ValuedIntuitionisticFuzzyNumbers(IVIFNs)to decidecomprehensivelyandlogicallytodealwiththeproblemofmaterialadoptionunder uncertainty.Tsengetal.[35]introducedvariousfeaturesandmeasurestobuildamodel andassesstheconstructionprojectsinEcuador,employingfuzzydecision-makingtrials withDecisionMakingTrialandEvaluationLaboratory(DEMATEL)inadditiontoan AnalyticNetworkProcess(ANP)toevaluateinterdependencebetweenthefeaturesof asustainableproduct–servicesystem.HendianiandBagherpour[14]presentedanovel socialsustainabilityperformanceassessmentinconstructionprojectsusingfuzzynumberstoevaluatethepresentsocialsustainabilitypositionassociatedwithconstruction. Furthermore,thebarriers thatreducethevalueofthesocialsustainabilityindexwererecognizedandaddressed.Alawnehetal.[36]proposedanovelframeworkthatidentifiesand weighsSIsforsustainablenon-residentialbuildingsandcontributestoachievingtheSDGs inJordan.TheframeworkappliestheDelphitechniquetoidentifyandcategorizeSIsand
thenintegratesAHPandRelativeImportanceIndex(RII)methodstoweighSIs.Inaddition, amanagementtool(Ganttchart)integratesSIsintotheprojectphasestowardssustainable constructionmanagement.Dabousetal.[37]proposedamulti-criteriadecision-support approachtohandledecision-makinginsustainablepavementadoption.Themainsustainabledecisionfactorswererecognizedthroughahierarchystructureintheirapproach. Inaddition,theAHPtechniqueincombinationwithmulti-attributeutilitytheorywas usedtorankthenetworksofpavementsections.Forsustainablelandfillsiteselection, Rahimietal.[38]introducedaGeographicalInformationSystem(GIS)-MCDMmethodologyconsideringthegroupfuzzyBest-WorstMethod(BWM),fuzzyMULTIMOORA methodandGIS-basedsuitabilitymaps.ThemethodologywasemployedinMahallatcity, Iran,anditcouldprovidesuitableguidanceforthewastemanagementdepartmentof municipalities.Navarroetal.[39]developedanassessmentmethodologytomeasurethe sustainabilityperformanceoftheconcretebridgedeckbasedonaneutrosophicgroupAHP approach.Inaddition,theTOPSIStechniquewasutilizedtoaggregatethesustainability criteria.
Theaforementionedstudiesdemonstratethatthepreviousresearchdidnotpaymuch attentiontothesustainabilityperformanceofhighwayconstructionprojects.Furthermore, therearenostudiesfocusingonprioritizingandselectingtheindicatorsofthethree sustainabilitypillars.Fortherecognizedgaps,anewmulti-criteriaweightingandranking approach,accordingtogroupdecision-making,ispresentedinthepresentstudytoanalyze andadoptSIsinhighwayconstructionprojects.Initially,SIsandcriteriaarecollectedand listedconcerningexperts’viewsandtheliteraturereview.Thus,triangularintuitionistic fuzzy(TIF)decisionmatricesareconstructedbasedonexperts’viewsintermsoflinguistic variables.Subsequently,theweightsofexpertsaregainedaccordingtotheconceptof entropy.Afterward,primaryweightvectorsofcriteriaarespecifiedbyentropymeasures andexperts’views.Finally,SIsarerankedbasedonthepositiveandnegativeideal separationmatricesviapresentinganewrankingscore.Moreover,acasestudyinhighway constructionprojectsisaddressedtodemonstratetheefficiencyofthepresentedapproach. Therestofthispaperisorganizedasfollows.InSection 2,anovelmulti-criteria groupdecision-makingapproachisproposedandappliedinacasestudyofahighway constructionproject.Section 3 presentstheresultsoftheapproachimplementationin detail.Theobtainedresultsarecomparedwiththeprevalentdecision-makingmethods andothermentionedSIsinthecitedliterature,andthesensitivityanalysesareconducted inSection 4.Toconcludethepaper,Section 5 depictstheconcludingremarks.
2.MaterialsandMethods
2.1.TIFGroupDecision-MakingApproach
Theproposedapproachaimstoassistprojectmanagersinselectingthemostsignificant SIsforsustainabilityassessmentofhighwayconstructionprojectsbasedonanovelTIF groupdecision-makingapproach.Figure 1 presentstheproposedapproachfortheselection ofSIs.
Thephasesofthepresentedapproachareasfollows:
Step1. Constituteagroupofexperts (Ee; e = 1,2, , t),whoseviewsandjudgmentswill beemployedtobuildandassesstheproblem.
Step2. Gatheralistofindicatorsthatarepossibletobeappliedforthesustainability evaluationofhighwayconstructionprojects(Ii; i = 1,2,..., m). Step3. RecognizeasetofcriteriaforanalyzingSIsthroughconsensusofexperts’views (Cj; j = 1,2,..., n). Step4. Assigntheriskattitudetoeachexpertandincorporateitintotherelatedtriangular intuitionisticfuzzynumbers(TIFNs)(DefinitionA1).
Linguistic Variables
TIFN Derived from ⟨(��,��,��);��,��⟩ for Benefit Criteria
TIFN Derived from ⟨(��,��,��);��,��⟩ for Cost Criteria
Absolutely optimistic (AO) ⟨(��,��,��);��+��,��⟩ ⟨(��,��,��);��,��+��⟩
Optimistic (O) ⟨(��, (��+��)⁄2 ,��);��+��2 ⁄ ,��⟩ ⟨(��, (��+��)⁄2 ,��);��,��+��2⁄⟩
Neutral (N) ⟨(��,��,��);��,��⟩ ⟨(��,��,��);��,��⟩
Pessimistic (P) ⟨(��, (��+��)⁄2 ,��);��,��+��2⁄⟩ ⟨(��, (��+��)⁄2 ,��);��+��2 ⁄ ,��⟩
Absolutely pessimistic (AP) ⟨(��,��,��);��,��+��⟩ ⟨(��,��,��);��+��,��⟩
Figure1. Theproposedapproachfortheselectionofsustainabilityindicators(SIs).
Figure 1. The proposed approach for the selection of sustainability indicators (SIs).

Eachexpertisassignedariskattitudeaccordingtohisorhercharacter.Therisk attitudesareabletobespecifiedbyahighermanagementlevelandexpressedbylinguistic variables,likeabsolutelyoptimistic(AO),optimistic(O),neutral(N),pessimistic(P), andabsolutelypessimistic(AP)[40,41],for5-scaleTIFNs(Table 1).
In Table 1, �� indicates the hesitation degree of TIFN ⟨(��,��,�� );��,�� ⟩ and is equal to 1−��− Step 5. Construct the primary decision matrices based on the experts' views.
The primary decision matrices are constructed from the performance rating of each indicator versus each criterion based on the experts' view in terms of linguistic terms (Table 2) and converted into TIFNs.
Table1. Linguisticvariablesoftheriskattitudesassignedtoeachexpertfor5-scaletriangular intuitionisticfuzzynumbers(TIFNs).
�� = �� × = �� ,�� ,�� ;�� ,�� ×
LinguisticVariables
TIFNDerived from 〈(a,b, c);µ, ν〉 forBenefit Criteria
TIFNDerived from 〈(a,b, c);µ, ν〉 forCost Criteria
Table 2. Linguistic variables applied for the rating of SIs.
Linguistic Variables Triangular Intuitionistic Fuzzy Numbers
Extremely high (EH) 〈(0.95,1.00,1.00);0.95,0.05〉
Very very high (VVH) 〈(0.90,1.00,1.00);0.90,0.10〉
Absolutelyoptimistic(AO) (a, c, c) ; µ + π, ν (a, a, c) ; µ, ν + π Optimistic(O) (a, (b + c)/2, c) ; µ + π/2, ν (a, (a + b)/2, c) ; µ, ν + π/2 Neutral(N) (a, b, c) ; µ, ν (a, b, c) ; µ, ν Pessimistic(P) (a, (a + b)/2, c) ; µ, ν + π/2 (a, (b + c)/2, c) ; µ + π/2, ν Absolutelypessimistic(AP) (a, a, c) ; µ, ν + π (a, c, c) ; µ + π, ν
Very high (VH) 〈(0.80,0.90,1.00);0.80,0.10〉
High (H) 〈(0.70,0.80,0.90);0.70,0.20〉
Medium high (MH) 〈(0.50,0.60,0.70);0.60,0.30〉
Medium (M) 〈(0.30,0.50,0.70);0.50,0.40〉
InTable 1, π indicatesthehesitationdegreeofTIFN (a, b, c) ; µ, ν andisequalto 1 µ ν
Medium low (ML) 〈(0.30,0.40,0.50);0.40,0.50〉
Step5. Constructtheprimarydecisionmatricesbasedontheexperts’views.
Low (L) 〈(0.10,0.20,0.30);0.25,0.60〉
Very low (VL) 〈(0.00,0.10,0.20);0.10,0.75〉
Theprimarydecisionmatricesareconstructedfromtheperformanceratingofeach indicatorversuseachcriterionbasedontheexperts’viewintermsoflinguisticterms (Table 2)andconvertedintoTIFNs. Xe = xe ij m×n = axe ij , bxe ij , cxe ij ; µxe ij , νxe ij m×n
Very very low (VVL) 〈(0.00,0.00,0.10);0.10,0.90〉
Step 6. Convert the primary decision matrices to the individual decision matrices based on expert's risk attitude.
Table2. LinguisticvariablesappliedfortheratingofSIs.
LinguisticVariablesTriangularIntuitionisticFuzzyNumbers
Extremelyhigh(EH) (0.95,1.00,1.00) ;0.95,0.05 Veryveryhigh(VVH) (0.90,1.00,1.00) ;0.90,0.10 Veryhigh(VH) (0.80,0.90,1.00) ;0.80,0.10 High(H) (0.70,0.80,0.90) ;0.70,0.20 Mediumhigh(MH) (0.50,0.60,0.70) ;0.60,0.30 Medium(M) (0.30,0.50,0.70) ;0.50,0.40 Mediumlow(ML) (0.30,0.40,0.50) ;0.40,0.50 Low(L) (0.10,0.20,0.30) ;0.25,0.60 Verylow(VL) (0.00,0.10,0.20) ;0.10,0.75 Veryverylow(VVL) (0.00,0.00,0.10) ;0.10,0.90
Step6. Converttheprimarydecisionmatricestotheindividualdecisionmatricesbasedon eachexpert’sriskattitude.
Theprimarydecisionmatricesareconvertedtodecisionmatricestakingintoaccount eachexpert’sriskattitudeaccordingtoTable 1 Re = re ij m×n = are ij , bre ij , cre ij ; µre ij , νre ij m×n (2) Step7. Computeeachexpert’sentropy-weightaccordingtotheindividual decisionmatrices Theentropymeasure Fe ij iscalculatedby[42]: Fe ij = f e ijln f e ij ln(t) ,(3) where f e ij = are ij + bre ij + cre ij × 1 + µre ij νre ij ∑t e=1 are ij + bre ij + cre ij × 1 + µre ij νre ij
.(4)
Thus,eachexpert’sentropy-weightisdeterminedasfollows[42,43]: αe ij = ∑t e=1 Fe ij + 1 2 × Fe ij ∑t e=1 ∑t e=1 Fe ij + 1 2 × Fe ij ,(5) where0 ≤ αe ij ≤ 1,and ∑t e=1 αe ij = 1. Step8. BuildtheaggregatedTIFdecisionmatrixtakingintoaccounttheentropy-weights ofexperts.
AccordingtotheTIFweightedgeometricaggregation(TIFWGA)operator[44],theaggregatedTIFdecisionmatrixconcerningtheentropy-weightsofexpertsisgainedas follows: R = rij m×n = arij , brij , crij ; µrij , νrij m×n (6) where rij = r1 ij α1 ij ⊗ r2 ij α2 ij ⊗···⊗ rt ij αt ij .
Step9. Constructtheprimaryweightvectorsofcriteriabasedonexperts’views. Thesignificanceofcriteriaisprovidedbasedontheexperts’viewsintermsoflinguistic terms(Table 3). ωe = ωe j = aωe j , bωe j , cωe j ; µωe j , νωe j ,(7)
Table3. Linguisticvariablesappliedforratingthesignificanceofcriteria.
LinguisticVariablesTriangularIntuitionisticFuzzyNumbers
Veryimportant(VI) (0.80,0.90,1.00) ;0.90,0.10 Important(I) (0.60,0.70,0.80) ;0.75,0.20 Medium(M) (0.40,0.50,0.60) ;0.50,0.45 Unimportant(UI) (0.20,0.30,0.40) ;0.35,0.60 Veryunimportant(VUI) (0.00,0.10,0.20) ;0.10,0.90
Step10. Converttheprimaryweightvectorstotheindividualweightvectorsbasedon eachexpert’sriskattitude.
Theprimaryweightvectorsareconvertedtotheindividualweightvectorstakinginto accounteachexpert’sriskattitudeaccordingtoTable 1 we = we j = awe j , bwe j , cwe j ; µwe j , νwe j ,(8)
Step11. Computeeachexpert’sentropy-weightaccordingtotheweightvectors. Theentropymeasure Ge j iscalculatedby[42]: Ge j = ge j ln ge j ln(t) ,(9) where ge j = awe j + bwe j + cwe j × 1 + µwe j νwe j ∑t e=1 awe j + bwe j + cwe j × 1 + µwe j νwe j
.(10)
Thus,eachexpert’sentropy-weightaccordingtotheexpert-basedweightvectoris determinedasfollows[42,43]: βe j = ∑t e=1 Ge j + 1 2 × Ge j ∑t e=1 ∑t e=1 Ge j + 1 2 × Ge j ,(11) where0 ≤ βe j ≤ 1,and ∑t e=1 βe j = 1.
Step12. ProvidetheTIFweightvectorofthecriteria. TheTIFweightvector W isbuiltaccordingtoexperts’entropy-weightbyusing DefinitionA2asfollows: W = Wj = W1, W2, , Wn ,(12) where Wj = aWj , bWj , cWj ; µWj , νWj = w1 j β1 j ⊗ w2 j β2 j ⊗···⊗ wt j βt j .(13)
Step13. ComputetheTIFpositive-idealsolution(PIS)andtheTIFnegative-idealsolution (NIS)vectors.
TheTIFPIS r∗ j andtheTIFNIS rj are,respectively,definedasfollows:
max i crij , max i crij , max i crij ; max i µrij , min i νrij forj ∈ J1 min i arij , min i arij , min i arij ; min i µrij , max i νrij forj ∈ J2,
min i crij , min i crij , min i crij ; min i µrij , max i νrij forj ∈ J1 max i arij , max i arij , max i arij ; max i µrij , min i νrij } forj ∈ J2, (15)
where J1 and J2 arethebenefitcriteriaandcostcriteria,respectively.
Step14. Determinethepositive-idealseparation(PISE)andthenegative-idealseparation (NISE)matrices.
The PISE matrix(∆∗)andthe NISE matrix(∆ )aredefinedbasedonhamming distance[45].
1 , r11 ∆(r∗ 2 , r12) ∆(r∗ n, r1n )
r
1 , r21 . ∆(r∗ 2 , r22) . . ∆(r∗ n, r2n )
r∗ 1 , rm1 ∆(r∗ 2 , rm2) ··· ∆(r∗ n, rmn )
,(16) and
= ∆ij m
n =
∆ r1 , r11 ∆ r2 , r12 ∆(rn , r1n ) ∆ r1 , r21 .
∆ r2 , r22 ··· . ∆(rn , r2n ) ∆ r1 , rm1 ∆ r2 , rm2 ∆(rn , rmn )
.(17) Step15. Computethe Ai, Bi, Ai,and Bi values.
The Ai, Bi, Ai,and Bi valuesarecomputedaccordingtothescorefunction[46] asfollows:
Ai = ∑n j=1 ∆∗ ij · Wj = 1 4 n ∑ j=1 ∆∗ ij aWj + 2∆∗ ij bWj + ∆∗ ij cWj 1 n ∏ j=1 1 µWj
Bi = max j d∗ ij Wj = max j 1 4 ∆∗ ij · aWj + 2∆∗ ij · bWj + ∆∗ ij · cWj 1 1 µWj
Ai = ∑n j=1 ∆ij · Wj = 1 4 n ∑ j=1 ∆ij aWj + 2∆ij bWj + ∆ij cWj 1 n ∏ j=1 1 µWj
Bi = max j ∆ij Wj = max j 1 4 ∆ij · aWj + 2∆ij · bWj + ∆ij · cWj 1 1 µWj
Step16. Calculatethe κi and ϑi values.
Thevaluesofindices κi and ϑi arecalculatedasfollows:
∆∗ ij n ∏ j=1 ν ∆∗ ij Wj
∆∗ ij ν ∆∗ ij Wj
∆ij n ∏ j=1 ν ∆ij Wj
(18)
(19)
(20)
∆ij ν ∆ij Wj
(21)
κi = χ Ai A∗ A A∗ + (1 χ) Bi B∗ B B∗ ,(22) and ϑi = ψ Ai A A ∗ A + (1 ψ) Bi B B ∗ B ,(23)
and1 ψ aretherelativeimportanceoftheindividualregret.
Computethenovelrankingscore.
aredefinedasfollows:
Step18. RanktheSIsaccordingtotherankingscore (Ci values). TheSIsaresortedbythe Ci valuesindecreasingorder.Themaximumvalueofthe Ci indicatesthehigherimportance.
2.2.CaseStudy
Theefficiencyofthepresentedapproachwasexaminedthroughacasestudyofa highwayconstructionproject.Tothatend,anIranianconstructionfirmwasinvolvedin transportationinfrastructures.Thefirmhasnumeroushighwayconstructionprojectsbeing builtinvariousareasofthecountry.Toevaluatetheprojectsaccordingtosustainable constructionprinciples,thefirmmanagersintendedtorecognizeandprioritizeSIstoadopt thekeyevaluationindicatorsfromapoolofnumerousSIsintheseprojects.
Accordingtostep1,fiveexpertsworkingonhighwayprojectswereadoptedfrom employeesofthefirm.Theparticipantscomprisedconstructionprojectmanagersand sustainableconstructionexperts.Theyhadenoughexperienceandknowledgeofnearly allthesustainableaspectsofconstructionprojects.Assuch,agroupoffiveexperts(E1, E2, ,E5)wasconsideredforanalyzingpotentialSIs.Afterformingthecommittee, theexpertspickedoutasetofpotentialSIsinadditiontoasetofrelevantcriteriafor SIsassessment(Steps2and3).Tothatend,abrainstormingsessionwasheldwiththe expertsandthirtysustainabilityindicators(SoI1, SoI2, , SoI9, EcI1, EcI2, , EcI9, EnI1, EnI2, , EnI12),aswellassevencriteria(C1, C2, ,C7)wereobtainedfromthevarious investigationsintheliterature(e.g.,[22,47–64])andtheconsensusopinionofthegroup members (Tables 4 and 5).Furthermore,theprojectmanagerutilizingTable 1 specifies theexperts’riskattitudeaccordingtohisorherrecognitionofthem.Theoutcomesare representedinTable 6 (Step4).
Sustainabilityaspects
Social
Economic
Environmental
Table4. Listofobtainedsustainabilityindicators.
SustainabilityIndicatorsDescription
SoI1:HealthHighlightingon-sitesanitation,andtheprovisionofhealthcare
SoI2:EducationNumberandtimeoftrainingcoursetodifferentlevelsofemployees
SoI3:CultureandheritageMeasureofnegativeimpactsfromconstructionoperationsonanyculturalheritage
SoI4:Safety Numberofaccidents,thesupplyrateofon-sitesupervisionandtrainingcoursetoemployeestoprovideasafeand reliableworkplace
SoI5:StakeholdersatisfactionMeasureofstakeholdersatisfactionbyusingstakeholdermanagementmodels
SoI6:JobopportunitiesProvidingdirectandindirectjobs
SoI7:TourismImpactsontourismdevelopment
SoI8:TrafficVehicletrafficcongestion
SoI9:AccesstopublictransportationExtensionofpublictransportationservicesandproximitytoit
EcI1:Netpresentvalue(NPV)
NPV = ∑n t=1 Rt (1+i)t where Rt isthenetcashinflow-outflowsduringasingleperiodt, i isthediscountrateofreturnthatcould beearnedinalternativeinvestmentsandtisthenumberoftimeperiods
EcI2:PaybackperiodInitialInvestment/NetCashFlowperPeriod
EcI3:InvestmentplanningCompliancewiththeinvestmentplan
EcI4:Benefit–costratioRelationshipbetweentherelativecostsandbenefitsofaproposedprojectexpressedinmonetaryorqualitativeterms
EcI5:Debt–assetratio(Short-termDebt+Long-termDebt)/TotalAssets
EcI6:ProjectbudgetCompliancewithbudget
EcI7:Internalrateofreturn(IRR)
NPV = ∑T t=1 Ct (1+IRR)t C0 = 0 where Ct isthenetcashinflowduringtheperiodt, C0 isthetotalinitialinvestmentcostandt isthenumberoftimeperiods
EcI8:FinancialriskPossibilityoflosingmoneyontheinvestment
EcI9:Life-cyclecostTotalcostforaconstructionprojectoveritslife
EnI1:MaterialconsumptionEfficiencyrateofusingmaterialsandresources
EnI2:AirpollutionMeasureofmixtureofsolidparticlesandgasesintheair
EnI3:landscaperespectProtectionoflandscapefeaturesduringconstruction
EnI4:NoiseemissionsRateofnoisepollutionduringtheconstructionphaseintheenvironmentoftheproject
EnI5:ErosionRateofsoilerosionduringtheconstructionphaseintheenvironmentoftheproject
EnI6:EcologicalimpactsMeasureofnegativeimpactsfromprojecttoflora,fauna,andecosystems
EnI7:HabitatlossanddamageDestructiveeffectsonthelivingenvironmentforbothhumanbeingandanimals
EnI8:SoilcontaminationMeasureofalterationinthephysical,chemicalandbiologicalcharacteristicsofthesoilenvironment
EnI9:AestheticalandvisualimpactsAestheticqualityoftheprojectduringtheconstructionphase
EnI10:WaterpollutionMeasureofalterationinthephysical,chemicalandbiologicalcharacteristicsofwaterenvironment
EnI11:WatersavingRateofreductionwaterconsumptionduringtheconstructionphase
EnI12:HazardouswasteProductionrateofhazardouswaste
Criteria
C1:Measurability
Table5. Listofobtainedcriteria.
CriteriaType Description BenefitCost
Measurabilityinqualitativeorquantitativeterms
C2:Applicability Practicalityandstraightforwarduseofsustainabilityindicator(SI)forevaluation
C3:Dataavailability RelativesimplicitytogatherthenecessarydataforevaluationofSI
C4:Acceptant AcceptanceofSIbymajorstakeholders
C5:Complexity
RelativedifficultyinmeaningfulinterpretationofSI
C6:Timeconsuming RequiredtimefortheevaluationofSI
C7:Uncertainty
AmbiguityinassigningthevaluetoSIduringevaluation
Table6. Experts’riskattitudes.
Experts E1 E2 E3 E4 E5
Riskattitudes Neutral Absolutely optimistic PessimisticOptimisticNeutral
3.Results
Theprimarydecisionmatricesareconstructedbyexpertsemployinglinguisticterms inTable 2.ThematricesareshowninTable 7 (Step5).Afterward,theprimarydecision matricesareconvertedtodecisionmatricestakingintoaccounteachexpert’sriskattitude accordingtoTable 1 (Table 8)(Step6).Owingtospacelimitations,onlytheoutcomes associatedwiththreeSIs(SoI6, EcI4 and EnI10)areshownasasampleofeachdimensionof sustainabilityinsomeofthefollowingtables.
Then,eachexpert’sentropy-weightandaggregatedTIFdecisionmatrixiscalculated. TheoutcomesofthesestepsarerepresentedinTables 9 and 10,respectively(Steps7and8). Inaddition,thecriteriaweightvectorisachievedaccordingtoexperts’preferencesandis illustratedinTable 11 (Step9).Accordingtosteps10to12,basedoncriteriaweightvector, expert’sriskattitudeandexpert’sentropy-weight,theTIFcriteriaweightvectorsarebuilt. TheresultsarepresentedinTable 12.Next,theTIFPISandNISvectorsarespecifiedas giveninTable 13 (Step13).Then,asshowninTable 14,thePISEmatrix(D∗)andNISE matrix(D )arebuilt(Step14).
Table7. Performanceratingofeachindicatorversuseachcriterionbasedonexperts’viewsinterms oflinguisticterms.
Table7. Cont.
SIs Experts
SoI3
SoI4
SoI5
SoI6
SoI7
SoI8
SoI9
EcI1
EcI2
EcI3
Criteria
C1 C2 C3 C4 C5 C6 C7
E1 VLMLMHMHHMHVH E2 LLHHMHHH E3 VVLLHVHVHHVH E4 VLVLVHHHMHVH E5 VLLVHVHMHMHH
E1 HMHHHMLLML E2 VHMHVHVHMVVLL E3 HMVVHVHMLVLML E4 HMVHHLVVLL E5 VHMHVHVVHMLVLL
E1 LHMLVHVHHH E2 VLVHLHHMHVVH E3 MLVHVLVVHHVHVH E4 MLVVHVLVHVHHVH E5 LVVHMLVHVVHVHH
E1 VHVHHMHLLL E2 MHHHHVLMLL E3 HHMHMHVLLM E4 HVHMHMLMLM E5 VHVVHHHLLL
E1 VHMHMHLMHH E2 VHHMMHVLMHVH E3 VVHHMLVHVLHH E4 VHMHMLHVVLHMH E5 VVHMHMLHVLVHMH
E1 HMHMMHLHVH E2 MHHMHMHVLVHVVH E3 HHMHMVLHVH E4 HVHMHMVVLVHVVH E5 VHHMHLVHVH
E1 VHMHLMLVLMH E2 HHMLMHVLMLM E3 VHMHMLMLVLLM E4 HVHMLMVLLH E5 HHMMVVLMLMH
E1 EHEHHMLVLVVLH E2 EHVVHVVHMVVLVVLMH E3 EHEHVHMHVLVVLMH E4 EHVHVHMHVVLVVLM E5 EHEHVVHMLVVLVVLH
E1 VVHHHMLVLMH E2 VHVHHMLVLLH E3 VHHHLLLVH E4 VHHHLLVLH E5 VVHHVHMLVLVLVH
E1 HMHMHLMMLH E2 MHMHMVLMMLMH E3 HHMLMHMVH E4 VHHMLVLMHMMH E5 VHHMMLMHMHH
Table7. Cont.
SIs Experts
EcI4
EcI5
EcI6
EcI7
EcI8
EcI9
EnI1
EnI2
EnI3
EnI4
Criteria
C1 C2 C3 C4 C5 C6 C7
E1 EHEHVHMLMLML E2 EHVVHVVHMHMLLM E3 EHVVHVVHMLLML E4 EHEHVVHMHLMLML E5 EHEHEHMHVLLL
E1 VHHHMLLMLH E2 HHMHLLMLMH E3 VVHMHHLMLMMH E4 HMHMHLLMH E5 HHMHMLLMMH
E1 HVHHMLLMMH E2 VHVHHMVLMHH E3 HHMHMLVVLMH E4 VHVHVHMLVLMHMH E5 VHVVHVHMVVLMLH
E1 VVHEHVHMLVLVLMH E2 EHEHVHMLVVLVLH E3 EHEHVHMVVLVLMH E4 EHEHHMVLVVLMH E5 EHEHVVHMHVVLVVLML
E1 MLVVHMMLHMHEH E2 MHMLMLMHMHVVH E3 MHMLLMHHVH E4 MLMHMLMHVVH E5 MVVHMMLMMHVH
E1 MHHMMHMVHH E2 MHVHMLHMLHVH E3 HVHMLHMHVHVH E4 HHLVHMLVVHH E5 HVVHMLHMHMHMH
E1 HMHHMHLLH E2 HMHVHMLLVLMH E3 HMHHMLVLVLM E4 HHVHMHLLH E5 VHHVVHMVLVVLM
E1 VHVHMLMHMMLVH E2 HHMHMHMHMH E3 HHMHHMMLVH E4 VHVHMLHMHMLH E5 HVVHMHHMLH
E1 MLLMLMMHHVH E2 LLMLMHHHH E3 LMLMLMMHVHMH E4 VLLMLMHHMH E5 MLMLMMHMHHVH
E1 MMLMMLMHH E2 MHMLVLMHMMH E3 MLMLLMMLMLMH E4 MLMLMLMLMVH E5 MHMMLMHLMLMH
Table7. Cont.
SIs Experts
EnI5
EnI6
EnI7
EnI8
EnI9
EnI10
EnI11
EnI12
Criteria
C1 C2 C3 C4 C5 C6 C7
E1 MHMLLMLHHVH E2 MLVLLMHVHH E3 MLVLVLLHVHVH E4 MLLLVLVHHH E5 MHLMLMLMHHMH
E1 MHHMMHHH E2 MMHMLMHVHMHVH E3 MHMMHMHH E4 MHHMMLVHHMH E5 HVHMHMHVVHVHMH
E1 MLMHMLMMLMHH E2 MMLLMLMLMMH E3 MHMHMLLMMHMH E4 MMHMLMMH E5 MHMMMMLMH
E1 HVHHMHMLMHH E2 MHHMHMHMLMMH E3 HMHMHVLMH E4 MHMHMHHMLMHVH E5 VHVHHHLMLMH
E1 MMHMLMHMHMVH E2 MLHLHHMH E3 MLMHVLHHMHH E4 MLMHLVHMHHMH E5 MHMLVHMHMMH
E1 HHMHHMMM E2 VHHHHMMHMH E3 HMHMVHMMMH E4 VHHMHMLMHM E5 VVHVHMHVHMLMML
E1 HHMHHVLMH E2 HMHHMHVLMLVH E3 HMHMHHVLMHH E4 HHMMHLMLH E5 VHVHMHVHVLMLMH
E1 VHLMHMHVLMLVH E2 HMLMHLLH E3 MHLHMVLMLVH E4 MHMLMHMHVLMLH E5 HLHHVVLLMH
Table8. Experts’viewconcerningtheratingofsampleindicatorswithrespecttothecriteriabytakingintoaccounteachexpert’sriskattitude.
SIs
Criteria Experts
C1
C2
C3
SoI6 EcI4 EnI10
E1 (0.800,0.900,1.000) ;0.800,0.100 (0.950,1.000,1.000) ;0.950,0.050 (0.700,0.800,0.900) ;0.700,0.200
E2 (0.500,0.700,0.700) ;0.700,0.300 (0.950,1.000,1.000) ;0.950,0.050 (0.800,1.000,1.000) ;0.900,0.100
E3 (0.700,0.750,0.900) ;0.700,0.250 (0.950,0.975,1.000) ;0.950,0.050 (0.700,0.750,0.900) ;0.700,0.250
E4 (0.700,0.850,0.900) ;0.750,0.200 (0.950,1.000,1.000) ;0.950,0.050 (0.800,0.950,1.000) ;0.850,0.100
E5 (0.800,0.900,1.000) ;0.800,0.100 (0.950,1.000,1.000) ;0.950,0.050 (0.900,1.000,1.000) ;0.900,0.100
E1 (0.800,0.900,1.000) ;0.800,0.100 (0.950,1.000,1.000) ;0.950,0.050 (0.700,0.800,0.900) ;0.700,0.200
E2 (0.700,0.900,0.900) ;0.800,0.200 (0.900,1.000,1.000) ;0.900,0.100 (0.700,0.900,0.900) ;0.800,0.200
E3 (0.700,0.750,0.900) ;0.700,0.250 (0.900,0.950,1.000) ;0.900,0.100 (0.500,0.550,0.700) ;0.600,0.350
E4 (0.800,0.950,1.000) ;0.850,0.100 (0.950,1.000,1.000) ;0.950,0.050 (0.700,0.850,0.900) ;0.750,0.200
E5 (0.900,1.000,1.000) ;0.900,0.100 (0.950,1.000,1.000) ;0.950,0.050 (0.800,0.900,1.000) ;0.800,0.100
E1 (0.700,0.800,0.900) ;0.700,0.200 (0.800,0.900,1.000) ;0.800,0.100 (0.500,0.600,0.700) ;0.600,0.300
E2 (0.700,0.900,0.900) ;0.800,0.200 (0.900,1.000,1.000) ;0.900,0.100 (0.700,0.900,0.900) ;0.800,0.200
E3 (0.500,0.550,0.700) ;0.600,0.350 (0.900,0.950,1.000) ;0.900,0.100 (0.300,0.400,0.700) ;0.500,0.450
E4 (0.500,0.650,0.700) ;0.650,0.300 (0.900,1.000,1.000) ;0.900,0.100 (0.300,0.600,0.700) ;0.550,0.400
E1 (0.500,0.600,0.700) ;0.600,0.300 (0.300,0.500,0.700) ;0.500,0.400 (0.700,0.800,0.900) ;0.700,0.200
E2 (0.700,0.900,0.900) ;0.800,0.200 (0.500,0.700,0.700) ;0.700,0.300 (0.700,0.900,0.900) ;0.800,0.200
E3 (0.500,0.550,0.700) ;0.600,0.350 (0.300,0.400,0.700) ;0.500,0.450 (0.800,0.850,1.000) ;0.800,0.150
E5 (0.700,0.800,0.900) ;0.700,0.200 (0.950,1.000,1.000) ;0.950,0.050 (0.500,0.600,0.700) ;0.600,0.300 C4
E4 (0.300,0.600,0.700) ;0.550,0.400 (0.500,0.650,0.700) ;0.650,0.300 (0.700,0.850,0.900) ;0.750,0.200
E5 (0.700,0.800,0.900) ;0.700,0.200 (0.500,0.600,0.700) ;0.600,0.300 (0.800,0.900,1.000) ;0.800,0.100
E1 (0.100,0.200,0.300) ;0.250,0.600 (0.100,0.200,0.300) ;0.250,0.600 (0.300,0.500,0.700) ;0.500,0.400
E2 (0.000,0.000,0.200) ;0.100,0.900 (0.300,0.300,0.500) ;0.400,0.600 (0.300,0.300,0.700) ;0.500,0.500
C5
E3 (0.000,0.100,0.200) ;0.175,0.750 (0.100,0.167,0.300) ;0.325,0.600 (0.300,0.400,0.700) ;0.550,0.400
E4 (0.100,0.150,0.300) ;0.250,0.675 (0.100,0.150,0.300) ;0.250,0.675 (0.300,0.350,0.500) ;0.400,0.550
E5 (0.100,0.200,0.300) ;0.250,0.600 (0.000,0.100,0.200) ;0.100,0.750 (0.300,0.400,0.500) ;0.400,0.500
E1 (0.100,0.200,0.300) ;0.250,0.600 (0.300,0.400,0.500) ;0.400,0.500 (0.300,0.500,0.700) ;0.500,0.400
E2 (0.300,0.300,0.500) ;0.400,0.600 (0.100,0.100,0.300) ;0.250,0.750 (0.500,0.500,0.700) ;0.600,0.400
C6
E3 (0.100,0.167,0.300) ;0.325,0.600 (0.100,0.167,0.300) ;0.325,0.600 (0.300,0.400,0.700) ;0.550,0.400
E4 (0.300,0.350,0.500) ;0.400,0.550 (0.300,0.350,0.500) ;0.400,0.550 (0.500,0.550,0.700) ;0.600,0.350
E5 (0.100,0.200,0.300) ;0.250,0.600 (0.100,0.200,0.300) ;0.250,0.600 (0.300,0.500,0.700) ;0.500,0.400
E1 (0.100,0.200,0.300) ;0.250,0.600 (0.300,0.400,0.500) ;0.400,0.500 (0.300,0.500,0.700) ;0.500,0.400
E2 (0.100,0.100,0.300) ;0.250,0.750 (0.300,0.300,0.700) ;0.500,0.500
(0.500,0.500,0.700) ;0.600,0.400
C7
E3 (0.300,0.400,0.700) ;0.550,0.400 (0.300,0.300,0.500) ;0.450,0.500
E4 (0.300,0.400,0.700) ;0.500,0.450 (0.300,0.350,0.500) ;0.400,0.550
E5 (0.100,0.200,0.300) ;0.250,0.600 (0.100,0.200,0.300) ;0.250,0.600
(0.500,0.433,0.700) ;0.650,0.300
(0.300,0.400,0.700) ;0.500,0.450
(0.300,0.400,0.500) ;0.400,0.500
SIs Experts
SoI6
EcI4
EnI10
Criteria
Table9. Entropy-weightassignedtoeachexpert.
Criteria
C1 C2 C3 C4 C5 C6 C7
E1 0.1960.1990.1970.2020.1870.2060.208 E2 0.2070.2020.1950.1930.2280.1910.217
E3 0.2020.2050.2070.2040.2080.2050.184 E4 0.1990.1980.2040.2070.1900.1900.184
E5 0.1960.1970.1970.1940.1870.2060.208
E1 0.2000.1990.2020.2040.1960.1880.196
E2 0.2000.2010.2000.1950.1870.2140.193 E3 0.2000.2010.2000.2070.1950.2040.197 E4 0.2000.1990.2000.1960.2000.1890.198 E5 0.2000.1990.1980.1970.2220.2050.217
E1 0.2040.1990.1990.2020.1960.2020.200 E2 0.1970.1970.1910.2000.2000.1980.196 E3 0.2050.2100.2080.1990.1960.2020.195 E4 0.1980.1980.2030.2010.2050.1970.202 E5 0.1970.1950.1990.1980.2030.2020.208
Table10. Aggregatedtriangularintuitionisticfuzzy(TIF)decisionmatrix(R).
SIs
SoI6 EcI4 EnI10
C1 (0.688,0.814,0.890) ;0.748,0.196 (0.950,0.995,1.000) ;0.950,0.050 (0.775,0.892,0.958) ;0.803,0.154
C2 (0.776,0.895,0.958) ;0.806,0.153 (0.930,0.990,1.000) ;0.930,0.070 (0.670,0.784,0.872) ;0.724,0.216
C3 (0.610,0.726,0.812) ;0.685,0.254 (0.888,0.969,1.000) ;0.888,0.090 (0.432,0.596,0.734) ;0.600,0.338
C4 (0.512,0.674,0.772) ;0.642,0.297 (0.405,0.557,0.700) ;0.583,0.355 (0.738,0.859,0.938) ;0.769,0.171
C5 (0.000,0.000,0.251) ;0.188,0.746 (0.000,0.169,0.302) ;0.234,0.654 (0.300,0.384,0.610) ;0.465,0.475
C6 (0.152,0.232,0.365) ;0.316,0.591 (0.151,0.210,0.364) ;0.315,0.614 (0.367,0.487,0.700) ;0.548,0.390
C7 (0.150,0.222,0.410) ;0.328,0.587 (0.236,0.300,0.478) ;0.386,0.533 (0.366,0.444,0.653) ;0.521,0.415
Table11. Criteriaweightvectorbasedonexperts’preferences.
Experts
Criteria
C1 C2 C3 C4 C5 C6 C7
E1 IIIIMMI E2 MVIIVIIUII E3 IIIIIMI E4 MIVIIMMVI E5 IVIIIIMVI
Table12. TIFandcrispcriteriaweightvectors.
Criteria
WeightVectors
~ W
C1 (0.509,0.637,0.712) ;0.655,0.317 C2 (0.672,0.789,0.874) ;0.811,0.167 C3 (0.635,0.752,0.836) ;0.788,0.186 C4 (0.635,0.750,0.836) ;0.783,0.186 C5 (0.509,0.587,0.712) ;0.640,0.328 C6 (0.346,0.413,0.552) ;0.469,0.504 C7 (0.672,0.751,0.874) ;0.811,0.173
Table13. TIFpositive-idealsolution(PIS)andTIFnegative-idealsolution(NIS)vectors.
Criteria
IdealSolutions
TIFPISTIFNIS
C1 (0.950,0.995,1.000) ;0.950,0.050 (0.000,0.248,0.332) ;0.302,0.625 C2 (0.950,0.995,1.000) ;0.950,0.050 (0.151,0.263,0.363) ;0.318,0.584 C3 (0.888,0.969,1.000) ;0.888,0.090 (0.000,0.190,0.301) ;0.243,0.676 C4 (0.858,0.959,1.000) ;0.869,0.100 (0.000,0.202,0.278) ;0.253,0.672 C5 (0.123,0.176,0.330) ;0.279,0.637 (0.775,0.788,0.958) ;0.786,0.171 C6 (0.151,0.210,0.364) ;0.315,0.614 (0.758,0.773,0.958) ;0.769,0.171 C7 (0.151,0.199,0.363) ;0.305,0.623 (0.867,0.865,1.000) ;0.878,0.090
Table14. Positive-idealseparation(PISE)andnegative-idealseparation(NISE)matrices.
IdealSeparation SIs
PISE
NISE
Criteria
C1 C2 C3 C4 C5 C6 C7
SoI6 0.3130.2080.3440.3920.0490.0060.016 EcI4 0.0000.0280.0000.4900.0220.0000.063 EnI10 0.2110.3480.4860.1560.1460.2150.188
SoI6 0.5540.6290.4660.3920.6600.5720.718 EcI4 0.8670.8100.8100.2940.6330.5780.670 EnI10 0.6560.4900.3240.6280.4650.3630.545
Ultimately,the Ai, Bi, Ai, Bi, κi and ϑi valuesarecalculated(χ and ψ areconsidered 0.5).Then,thenovelrankingscoreiscalculated(η considered0.5),andSIsareprioritized accordingtorankingscore(Ci values).ThegatheredresultsarepresentedinTable 15 (Step15to18).
are represented for �� and �� values above 0.7.
Sustainability 2020, 13,1477
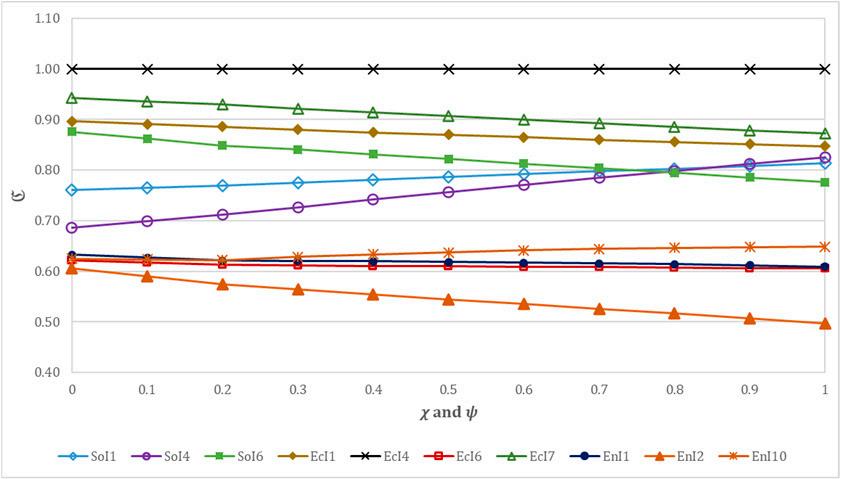
As can be seen in Figure 2b, changing the graph for �� and �� values above 0.7 leads to few changes in the ranking order of SIs. In addition, for variations of �� and �� between 0.2 and 0.7, the rank of all SIs remains unchanged, and also a set of the top ten SIs remains in a range from 1 to 10. Hence, the conclusion can be drawn that the top ten SIs have the lowest sensitivity to the values of �� and �� between 0.2 and 0.7, and the assumed value of 0.5 for this variable in the case study is suitable.
As can be seen in Figure 2b, changing the graph for �� and �� values above 0.7 leads to few changes in the ranking order of SIs. In addition, for variations of �� and �� between 0.2 and 0.7, the rank of all SIs remains unchanged, and also a set of the top ten SIs remains in a range from 1 to 10. Hence, the conclusion can be drawn that the top ten SIs have the lowest sensitivity to the values of �� and �� between 0.2 and 0.7, and the assumed value of 0.5 for this variable in the case study is suitable.


(a) (b)
(a) (b)
Figure 2. (a) Sensitivity analysis on the ℭ values and (b) preference ranking order of top ten SIs related to majority attributes (�� and �� ).
Figure 2. (a) Sensitivity analysis on the ℭ values and (b) preference ranking order of top ten SIs related to majority attributes (�� and �� ).
Figure2. (a)Sensitivityanalysisonthe C valuesand(b)preferencerankingorderoftoptenSIsrelatedtomajorityattributes (χ and ψ).
(a) (b)
(a) (b)
Figure 3. (a) Sensitivity analysis on the ℭ values and (b) preference ranking order of top ten SIs related to �� coefficient.
Figure 3. (a) Sensitivity analysis on the ℭ values and (b) preference ranking order of top ten SIs related to �� coefficient.
Figure3. (a)Sensitivityanalysisonthe C valuesand(b)preferencerankingorderoftoptenSIsrelatedto η coefficient.
InFigure 3a,b, C valuesandrankingordersversus η valuesrangingfrom0to1are represented,respectively.Figure 3arepresentsthatthegraphof C valuesforallSIsis ascendingbyincreasingthe η valuefrom0to1.However,accordingtothefigure,thegap betweenthevaluesof C increasesbydecreasing η.Thus,forsmallervaluesof η,thegap betweenthe C valuesofdifferentSIsislarger,allowinganaccuratedistinctionfordecisionmakers.Inaddition,accordingtoFigure 3b,itcanbeconcludedthattherankingorderof alltopSIsisconstantfor η valuesotherthan EnI2 forthevalueof η = 0.2.
Withtheseinmind,thisconclusioncanbedrawnthat C valuesandrankingorders havenosensitivityto η.Hence,choosing0.5asamediannumberoftheintervalfor η in thecasestudyisasuitablechoice.
4.2.ComparisonbetweentheProposedApproachandOtherCitedLiterature
Tovalidatethepresentedapproachoutcomes,acomparisonismadebetweenthe achievedresultsbytheproposedapproachandthetraditionalfuzzyMCDMmethods. Table 16 showstheoutcomesofthiscomparison.ThecomparisonresultsforthetoptenSIs arealsorepresentedinFigure 4
Table16. Comparativeoutcomesofthepresentedapproachandothertraditionalfuzzymulti-criteriadecision-making (MCDM)methods.
FuzzyMCDMMethods
SIs
ProposedApproach
Ranking Score
FuzzyVIKOR[65]FuzzySAW[66]FuzzyTOPSIS[67]
Preference Order Ranking Ranking Score
Preference Order Ranking Ranking Score
Preference Order Ranking Ranking Score Preference Order Ranking
SoI1 0.78650.17850.86650.6485
SoI2 0.363160.486150.756160.48316
SoI3 0.154280.721250.678240.39123
SoI4 0.75660.16040.87630.6802
SoI5 0.295210.755260.685230.40121
SoI6 0.82240.24160.85160.6286
SoI7 0.438140.490160.757150.49015
SoI8 0.302200.707230.701210.38924
SoI9 0.361170.491170.755170.46517
EcI1 0.87030.15030.87540.6674
EcI2 0.480130.380100.796100.53710
EcI3 0.238230.607200.712200.40520
EcI4 1.00010.00010.93710.7351
EcI5 0.341180.459140.766140.49214
EcI6 0.61090.36790.79890.5609
EcI7 0.90720.12520.88520.6743
EcI8 0.220240.839280.646280.30628
EcI9 0.430150.586190.731180.45718
EnI1 0.61880.35380.80280.5648
EnI2 0.544100.450130.770130.50313
EnI3 0.062290.916290.612290.25029
EnI4 0.161270.704220.677250.37025
EnI5 0.000301.000300.588300.19530
EnI6 0.315190.802270.662270.31027
EnI7 0.197260.712240.674260.36426
EnI8 0.515110.426120.775120.52911
EnI9 0.251220.661210.692220.39622
EnI10 0.63770.30470.82070.6037
EnI11 0.500120.420110.778110.52712
EnI12 0.211250.557180.730190.44119
Figure 4. Preference order ranking of top ten SIs prioritized by the proposed approach and other fuzzy MCDM methods.
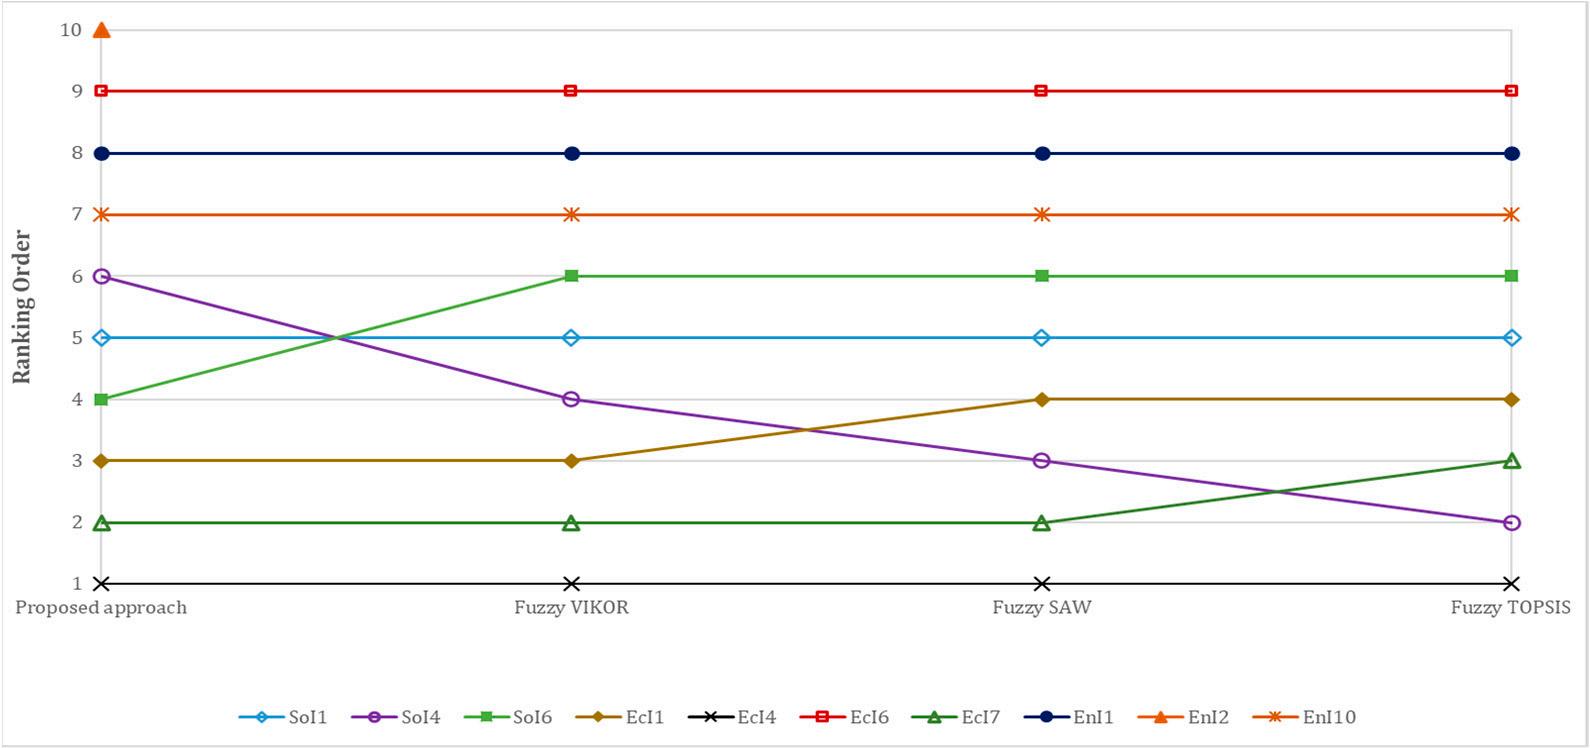
Figure4. PreferenceorderrankingoftoptenSIsprioritizedbytheproposedapproachandotherfuzzyMCDMmethods.
As presented in Table 16 and Figure 4, the priority of SIs derived from the presented approach is not very different from other methods in most cases (in most cases, the number of ranks is changed by up to three or four rank shifts in SIs priority). Besides, EcI4 has the first priority in all methods, and EnI5 has the last priority in the presented approach and all methods. For the ten first priorities
AspresentedinTable 16 andFigure 4,thepriorityofSIsderivedfromthepresented approachisnotverydifferentfromothermethodsinmostcases(inmostcases,thenumber ofranksischangedbyuptothreeorfourrankshiftsinSIspriority).Besides, EcI4 hasthe firstpriorityinallmethods,and EnI5 hasthelastpriorityinthepresentedapproachand allmethods.Forthetenfirstprioritiesthatarekeyindicators,despitesomechangesof ranks(atmostfourranks)insomemethods,theprioritiesofindicatorsremainwithinthe tenfirstprioritiesexcept EnI2.Furthermore,ascanbeobservedinthefigure,mostkey indicatorshavethesameranksintheproposedapproachandalltraditionalmethods. However, SoI4 hadrelativelymorechanges,whichcanbeconsideredasthemostsensitive keyindicator.
Fromtheabove,theconclusioncanbedrawnthattheproposedapproachisreliable anditsresultsbenefitfromthemeritsoftakingintoaccountriskattitudesofexperts, conceptsofentropyindeterminingweightsofexperts,andanewTIFS-rankingapproach concurrently.
Asanotheraspect,theresultsoftheapproachfortenSIswithahigherpriority arecomparedwiththeindicatorsprovidedbysevencitedliteraturestudiesandtools. ThecomparisonresultsareindicatedinTable 17 Table17. ComparisonoftenSIswithhigherpriorityandotherliteraturestudiesandtools.
AspresentedinTable 17,mostofthetenfirstprioritieshavebeenutilizedasSIs’ assessmentinthecitedliterature.MuchhigheradaptationisrelatedtoYaoetal.[59]and Envision[64]andlessadaptationisrelatedtoAwasthietal.[47].ThreeSIsoftenkey indicators, SoI1, SoI4 and EnI2,existinallcitedliterature.Inaddition, EnI10 isintroduced inalltheliteratureexceptAwasthietal.[47].Inaddition,itcanbeobservedthatthesocial andenvironmentalindicatorshavebeenincorporatedinallcitedtools(except SoI6 in Invest)buteconomicindicatorshavenotbeenconsideredinthecitedtools(except EcI4). Thesecomparisonsdemonstratethattheoutcomesoftheapproacharereliableandcanbe employedinasustainableassessmentofhighwayconstructionprojects.
5.ConcludingRemarks
Analyzingsustainabilityindicators(SIs)inconstructionprojectsbetweendifferent potentialindicatorsandconsideringvariousassessmentcriteriaconcurrentlycanbeconsideredasacomplicatedgroupdecisionproblem.Anewtriangularintuitionisticfuzzy set(TIFS)groupdecisionapproachforthemulti-criteriaevaluationispresentedinthis studytodealwiththisproblemunderuncertainty.Anovelmulti-criteriagroupdecisionmakingapproachconsidersexperts’riskattitudesandviewsandentropyconceptswere developedintheTIFSenvironment.Furthermore,newrankingscoreswereproposed throughsimilaritytoidealsolutionsbytheconceptofclosenesscoefficienttoprioritizeand choosethesustainableindicators.Acasestudyregardinghighwayconstructionprojects waspresentedtoanalyzethesustainableindicatorsunderuncertainty.Theconsideredcase studywassolvedusingtheintroducedgroup-decisionapproach.
Theprimaryaimofthispaperistopresentasoundapproachfortheassessmentand adoptionofSIsinhighwayconstructionprojects.Theprincipalnoveltiesofthisstudyare asfollows:
• Tocopewithuncertaintyinhighwayconstructionprojects,triangularintuitionistic fuzzysets(TIFSs)areused.TheTIFSsmaketheprocessofdecision-makingmore flexibleregardingdegreesofagreement,disagreement,andhesitancyutilizinga triangularfunction.
• Riskattitudesofexpertsareconsideredwithintheassessmentandprocessofgroup decision-makingbecausetheycanhavevariousperspectives,suchasoptimisticor pessimistic,intheirviewsowingtotheirvariousbackgroundsandcharacteristics.
• Anovelmethodologyisproposedtospecifyexperts’weightswithintheprocessof groupdecision-makingbasedontheconceptsofentropy.
• Anewcompromiserankingscoreisproposedtoevaluateandchoosesustainability indicatorsinhighwayconstructionprojects.
Ultimately,somesensitivityanalyseswereperformedonthepreferenceorderranking ofthetoptenSIsinacasestudyaccordingtothechangeofapproachcoefficientsand differentriskattitudesofexperts.Thedrawnconclusionofthesensitivityanalyseswas thatapproachcoefficientsselectedinthecasestudyweresuitablechoices.Moreover, thepresentedapproachwascomparedwiththetraditionalfuzzyMCDMtechniques, includingfuzzySAW andfuzzyVIKOR.Thecomputationalresultsrepresentedthatthere wasnomajordifferencebetweentheproposedapproachandotherfuzzyMCDMtechniquesregardingthepriorityofSIsinmostcases.Inaddition,boththefirstandlast prioritiesderivedfromthisapproachwerethesameinalltheaforementionedmethods.
Theintroducedcomprehensiveapproachhasproposedanefficientdecision-making methodforhighwayconstructionregardingsustainabledevelopmentprinciples.Infact, itpresentedadependablemodelinwhichtheresultsbenefitedfromthemeritsoftaking intoaccounttheriskattitudesofexpertsandthenewTIFS-rankingmethod.Furthermore, theappliedfundamentalconceptswereintelligibletothecommitteeofexpertsandproject managers,andtherequiredcalculationswerestraightforward.Hence,byintroducing evaluatedsustainableindicators,thispaperhelpsprojectmanagersimprovehighway projects’sustainabilityandmakethemostsustainabledecisions.Asfutureresearch, aholisticframeworkcanbedevelopedthatutilizesthementionedcriteriaandconsiders environmentalandsocialimpactsascriteriaintheevaluationofsustainabilityindicators. Inaddition,therankedSIswithhigherprioritycanbeusedaskeyindicatorsinthe sustainabilityassessmentofhighwayconstructionprojects.
AuthorContributions:
havereadandagreedtothepublishedversionofthemanuscript.
AppendixA
References
andnon-membershipfunctionisdefinedasfollows: νA (x) =
b x+(x a)ν b a ifa ≤ x < b ν ifx = b x b+(c x)ν c b ifb < x ≤ c 0 otherwise (A2)
wherea, bandcarerealnumbers,0 ≤ µ ≤ 1,0 ≤ ν ≤ 1 and 0 ≤ µ + ν ≤ 1. DefinitionA2. [44] Let A = (a, b, c) ; µ, ν and B = (a , b , c ) ; µ , ν betwoTIFNs,thenthe arithmeticoperationsaredefinedasfollows: A ⊕ B = a + a , b + b , c + c ; µ + µ µ µ , ν ν ,(A3) A ⊗ B = a a , b b , c c ; µ µ , ν + ν ν ν ,(A4) λ A = (λa, λb, λc) ;1 (1 µ)λ , νλ (λ ≥ 0),(A5) Aλ = aλ , bλ , cλ ; µλ ,1 (1 ν)λ (λ ≥ 0).(A6)
1. WCED. OurCommonFuture-BrundtlandReport;OxfordUniversityPress:Oxford,UK,1987.
2. Shen,L.Y.;LiHao,J.;Tam,V.W.Y.;Yao,H.Achecklistforassessingsustainabilityperformanceofconstructionprojects. J.Civ. Eng.Manag. 2007, 13,273–281.[CrossRef]
3. Yu,W.D.;Cheng,S.T.;Ho,W.C.;Chang,Y.H.Measuringthesustainabilityofconstructionprojectsthroughouttheirlifecycle: ATaiwanlesson. Sustainability 2018, 10,1523.[CrossRef]
4. Goubran,S.;Cucuzzella,C.Integratingthesustainabledevelopmentgoalsinbuildingprojects. J.Sustain.Res. 2019, 1,e190010. [CrossRef]
5. Karaca,F.;Guney,M.;Kumisbek,A.;Kaskina,D.;Tokbolat,S.Anewstakeholderopinion-basedrapidsustainabilityassessment method(RSAM)forexistingresidentialbuildings. Sustain.CitiesSoc. 2020, 60,102155.[CrossRef]
6. Li,H.;Zhang,X.;Ng,S.T.;Skitmore,M.Quantifyingstakeholderinfluenceindecision/evaluationsrelatingtosustainable constructioninChina—ADelphiapproach. J.Clean.Prod. 2018, 173,160–170.[CrossRef]
7. Omer,M.A.;Noguchi,T.Aconceptualframeworkforunderstandingthecontributionofbuildingmaterialsintheachievementof SustainableDevelopmentGoals(SDGs). Sustain.CitiesSoc. 2020, 52,101869.[CrossRef]
8. Xu,X.;Wang,Y.;Tao,L.ComprehensiveevaluationofsustainabledevelopmentofregionalconstructionindustryinChina. J.Clean.Prod. 2019, 211,1078–1087.[CrossRef]
9. Illankoon,I.C.S.;Tam,V.W.;Le,K.N.UnitedNation’ssustainabledevelopmentgoals:EstablishingbaselineforAustralian buildingsector. Intell.Build.Int. 2020.[CrossRef]
10. Olawumi,T.O.;Chan,D.W.;Chan,A.P.;Wong,J.K.Developmentofabuildingsustainabilityassessmentmethod(BSAM)for developingcountriesinsub-SaharanAfrica. J.Clean.Prod. 2020, 263,121514.[CrossRef]
11. Mansell,P.;Philbin,S.P.;Broyd,T.;Nicholson,I.Assessingtheimpactofinfrastructureprojectsonglobalsustainabledevelopment goals. Proc.Inst.Civ.Eng.Eng.Sustain. 2020, 173,196–212.[CrossRef]
12. Mousavi,S.M.;Tavakkoli-Moghaddam,R.;Azaron,A.;Mojtahedi,S.M.H.;Hashemi,H.Riskassessmentforhighwayprojects usingjackknifetechnique. ExpertSyst.Appl. 2011, 38,5514–5524.[CrossRef]
13. Ghoddousi,P.;Nasirzadeh,F.;Hashemi,H.EvaluatingHighwayConstructionProjects’SustainabilityUsingaMulticriteria GroupDecision-MakingModelBasedonBootstrapSimulation. J.Constr.Eng.Manag. 2018, 144,04018092.[CrossRef]
14. Hendiani,S.;Bagherpour,M.Developinganintegratedindextoassesssocialsustainabilityinconstructionindustryusingfuzzy logic. J.Clean.Prod. 2019, 230,647–662.[CrossRef]
15. Rostamnezhad,M.;Nasirzadeh,F.;Khanzadi,M.;Jarban,M.J.;Ghayoumian,M.Modelingsocialsustainabilityinconstructionprojectsbyintegratingsystemdynamicsandfuzzy-DEMATELmethod:Acasestudyofhighwayproject. Eng.Constr. Archit.Manag. 2020, 27,1595–1618.[CrossRef]
16. Hashemi,H.;Mousavi,S.M.;Zavadskas,E.K.;Chalekaee,A.;Turskis,Z.Anewgroupdecisionmodelbasedongrey-intuitionistic fuzzy-ELECTREandVIKORforcontractorassessmentproblem. Sustainability 2018, 10,1635.[CrossRef]
17. Mousavi,S.M.;Antucheviˇciene,J.;Zavadskas,E.K.;Vahdani,B.;Hashemi,H.Anewdecisionmodelforcross-dockingcenter locationinlogisticsnetworksunderinterval-valuedintuitionisticfuzzyuncertainty. Transport 2019, 34,30–40.[CrossRef]
18. Stojˇci´c,M.;Zavadskas,E.K.;Pamuˇcar,D.;Stevi´c,Ž.;Mardani,A.ApplicationofMCDMmethodsinsustainabilityengineering: Aliteraturereview2008–2018. Symmetry 2019, 11,350.[CrossRef]
19. Zavadskas,E.K.;Antucheviciene,J.;Kar,S.Multi-ObjectiveandMulti-AttributeOptimizationforSustainableDevelopment DecisionAiding. Sustainability 2019, 11,3069.[CrossRef]
20. Hashemi,H.;Bazargan,J.;Mousavi,S.M.;Vahdani,B.Anextendedcompromiseratiomodelwithanapplicationtoreservoirflood controloperationunderaninterval-valuedintuitionisticfuzzyenvironment. Appl.Math.Model. 2014, 38,3495–3511.[CrossRef]
21. Huang,R.Y.;Yeh,C.H.Developmentofanassessmentframeworkforgreenhighwayconstruction. J.Chin.Inst.Eng. 2008, 31, 573–585.[CrossRef]
22. Chen,Y.;Okudan,G.E.;Riley,D.R.Sustainableperformancecriteriaforconstructionmethodselectioninconcretebuildings. Autom.Constr. 2010, 19,235–244.[CrossRef]
23. Reza,B.;Sadiq,R.;Hewage,K.SustainabilityassessmentofflooringsystemsinthecityofTehran:AnAHP-basedlifecycle analysis. Constr.Build.Mater. 2011, 25,2053–2066.[CrossRef]
24. Waris,M.;Liew,M.S.;Khamidi,M.F.;Idrus,A.Criteriafortheselectionofsustainableonsiteconstructionequipment. Int.J. Sustain.BuiltEnviron. 2014, 3,96–110.[CrossRef]
25. Li,Y.;Zhao,L.;Suo,J.Comprehensiveassessmentonsustainabledevelopmentofhighwaytransportationcapacitybasedon entropyweightandTOPSIS. Sustainability 2014, 6,4685–4693.[CrossRef]
26. Kucukvar,M.;Gumus,S.;Egilmez,G.;Tatari,O.Rankingthesustainabilityperformanceofpavements:Anintuitionisticfuzzy decisionmakingmethod. Autom.Constr. 2014, 40,33–43.[CrossRef]
27. Medineckiene,M.;Zavadskas,E.K.;Björk,F.;Turskis,Z.Multi-criteriadecision-makingsystemforsustainablebuildingassessment/certification. Arch.Civ.Mech.Eng. 2015, 15,11–18.[CrossRef]
28. Kamali,M.;Hewage,K.Developmentofperformancecriteriaforsustainabilityevaluationofmodularversusconventional constructionmethods. J.Clean.Prod. 2017, 142,3592–3606.[CrossRef]
29. Pan,M.;Linner,T.;Pan,W.;Cheng,H.;Bock,T.Aframeworkofindicatorsforassessingconstructionautomationandroboticsin thesustainabilitycontext. J.Clean.Prod. 2018, 182,82–95.[CrossRef]
30. Zolfani,S.H.;Pourhossein,M.;Yazdani,M.;Zavadskas,E.K.Evaluatingconstructionprojectsofhotelsbasedonenvironmental sustainabilitywithMCDMframework. Alex.Eng.J. 2018, 57,357–365.[CrossRef]
31. Liu,S.;Qian,S.Towardssustainability-orienteddecisionmaking:Modeldevelopmentanditsvalidationviaacomparativecase studyonbuildingconstructionmethods. Sustain.Dev. 2019, 27,860–872.[CrossRef]
32. Reddy,A.S.;Kumar,P.R.;Raj,P.A.Preferencebasedmulti-criteriaframeworkfordevelopingaSustainableMaterialPerformance Index(SMPI). Int.J.Sustain.Eng. 2019, 12,390–403.[CrossRef]
33. Chen,C.H.Anewmulti-criteriaassessmentmodelcombiningGRAtechniqueswithintuitionisticfuzzyentropy-basedTOPSIS methodforsustainablebuildingmaterialssupplierselection. Sustainability 2019, 11,2265.[CrossRef]
34. Roy,J.;Das,S.;Kar,S.;Pamuˇcar,D.;Roy,J.;Das,S.;Kar,S.;Pamuˇcar,D.AnextensionoftheCODASapproachusingintervalvaluedintuitionisticfuzzysetforsustainablematerialselectioninconstructionprojectswithincompleteweightinformation. Symmetry 2019, 11,393.[CrossRef]
35. Tseng,M.L.;Lin,S.;Chen,C.C.;Sarmiento,L.S.C.;Tan,C.L.Acausalsustainableproduct-servicesystemusinghierarchical structurewithlinguisticpreferencesintheEcuadorianconstructionindustry. J.Clean.Prod. 2019, 230,477–487.[CrossRef]
36. Alawneh,R.;Ghazali,F.;Ali,H.;Sadullah,A.F.AnovelframeworkforintegratingUnitedNationsSustainableDevelopment Goalsintosustainablenon-residentialbuildingassessmentandmanagementinJordan. Sustain.CitiesSoc. 2019, 49,101612. [CrossRef]
37. Dabous,S.A.;Zeiada,W.;Zayed,T.;Al-Ruzouq,R.Sustainability-informedmulti-criteriadecisionsupportframeworkforranking andprioritizationofpavementsections. J.Clean.Prod. 2020, 244,118755.[CrossRef]
38. Rahimi,S.;Hafezalkotob,A.;Monavari,S.M.;Hafezalkotob,A.;Rahimi,R.Sustainablelandfillsiteselectionformunicipalsolid wastebasedonahybriddecision-makingapproach:FuzzygroupBWM-MULTIMOORA-GIS. J.Clean.Prod. 2020, 248,119186. [CrossRef]
39. Navarro,I.J.;Yepes,V.;Martí,J.V.Sustainabilityassessmentofconcretebridgedeckdesignsincoastalenvironmentsusing neutrosophiccriteriaweights. Struct.Infrastruct.Eng. 2020, 16,949–967.[CrossRef]
40. Ebrahimnejad,S.;Mousavi,S.M.;Tavakkoli-Moghaddam,R.;Hashemi,H.;Vahdani,B.Anoveltwo-phasegroupdecisionmaking approachforconstructionprojectselectioninafuzzyenvironment. Appl.Math.Model. 2012, 36,4197–4217.[CrossRef]
41. Fenton,N.;Wang,W.Riskandconfidenceanalysisforfuzzymulticriteriadecisionmaking. Knowl.BasedSyst. 2006, 19,430–437. [CrossRef]
42. Zhang,X.;Jin,F.;Liu,P.Agreyrelationalprojectionmethodformulti-attributedecisionmakingbasedonintuitionistictrapezoidal fuzzynumber. Appl.Math.Model. 2013, 37,3467–3477.[CrossRef]
43. Zhou,H.C.;Zhang,G.H.;Wang,G.L.Multi-objectivedecisionmakingapproachbasedonentropyweightsforreservoirflood controloperation. J.Hydraul.Eng. 2007, 38,100–106.
44. Chen,Y.;Li,B.Dynamicmulti-attributedecisionmakingmodelbasedontriangularintuitionisticfuzzynumbers. Sci.Iran. 2011, 18,268–274.[CrossRef]
45. Wan,S.P.;Wang,F.;Lin,L.L.;Dong,J.Y.Somenewgeneralizedaggregationoperatorsfortriangularintuitionisticfuzzynumbers andapplicationtomulti-attributegroupdecisionmaking. Comput.Ind.Eng. 2016, 93,286–301.[CrossRef]
46. Wang,J.Q.;Nie,R.;Zhang,H.Y.;Chen,X.H.Newoperatorsontriangularintuitionisticfuzzynumbersandtheirapplicationsin systemfaultanalysis. Inf.Sci. 2013, 251,79–95.[CrossRef]
47. Awasthi,A.;Chauhan,S.S.;Omrani,H.ApplicationoffuzzyTOPSISinevaluatingsustainabletransportationsystems. ExpertSyst.Appl. 2011, 38,12270–12280.[CrossRef]
48. Diabat,A.;Kannan,D.;Mathiyazhagan,K.Analysisofenablersforimplementationofsustainablesupplychainmanagement— Atextilecase. J.Clean.Prod. 2014, 83,391–403.[CrossRef]
49. Govindan,K.;Shankar,K.M.;Kannan,D.Sustainablematerialselectionforconstructionindustry—Ahybridmulticriteria decisionmakingapproach. Renew.Sustain.EnergyRev. 2016, 55,1274–1288.[CrossRef]
50. Kandziora,M.;Burkhard,B.;Müller,F.Interactionsofecosystemproperties,ecosystemintegrityandecosystemserviceindicators— Atheoreticalmatrixexercise. Ecol.Indic. 2013, 28,54–78.[CrossRef]
51. Michael,F.L.;Noor,Z.Z.;Figueroa,M.J.Reviewofurbansustainabilityindicatorsassessment—CasestudybetweenAsian countries. HabitatInt. 2014, 44,491–500.[CrossRef]
52. Nasirzadeh,F.;Ghayoumian,M.;Khanzadi,M.;RostamnezhadCherati,M.Modellingthesocialdimensionofsustainable developmentusingfuzzycognitivemaps. Int.J.Constr.Manag. 2020, 20,223–236.[CrossRef]
53. Niemeijer,D.;deGroot,R.S.Aconceptualframeworkforselectingenvironmentalindicatorsets. Ecol.Indic. 2008, 8,14–25. [CrossRef]
54. Oltean-Dumbrava,C.;Watts,G.;Miah,A.Transportinfrastructure:Makingmoresustainabledecisionsfornoisereduction. J.Clean.Prod. 2013, 42,58–68.[CrossRef]
55. Roy,R.;Chan,N.W.AnassessmentofagriculturalsustainabilityindicatorsinBangladesh:Reviewandsynthesis. Environmentalist 2012, 32,99–110.[CrossRef]
56. Shen,L.Y.;Tam,V.W.;Tam,L.;Ji,Y.B.Projectfeasibilitystudy:Thekeytosuccessfulimplementationofsustainableandsocially responsibleconstructionmanagementpractice. J.Clean.Prod. 2010, 18,254–259.[CrossRef]
57. Shen,L.;Wu,Y.;Zhang,X.Keyassessmentindicatorsforthesustainabilityofinfrastructureprojects. J.Constr.Eng.Manag. 2010, 137,441–451.[CrossRef]
58. Ugwu,O.O.;Haupt,T.C.Keyperformanceindicatorsandassessmentmethodsforinfrastructuresustainability—ASouthAfrican constructionindustryperspective. Build.Environ. 2007, 42,665–680.[CrossRef]
59. Yao,H.;Shen,L.;Tan,Y.;Hao,J.Simulatingtheimpactsofpolicyscenariosonthesustainabilityperformanceofinfrastructure projects. Autom.Constr. 2011, 20,1060–1069.[CrossRef]
60. Yuan,H.Keyindicatorsforassessingtheeffectivenessofwastemanagementinconstructionprojects. Ecol.Indic. 2013, 24,476–484. [CrossRef]
61. Zhao,Z.Y.;Zhao,X.J.;Davidson,K.;Zuo,J.Acorporatesocialresponsibilityindicatorsystemforconstructionenterprises. J.Clean.Prod. 2012, 29,277–289.[CrossRef]
62. CEEQUALVersion6:TechnicalManual—InternationalProjects.Watford,UK.Availableonline: https://www.ceequal.com/ version-6/ (accessedon30September2019).
63. Reid,L.;Bevan,T.;Davis,A.;Neuman,T.;Penney,K.;Seskin,S.;VanZerr,M.;Anderson,J.;Muench,S.;Weiland,C.;etal. Investv1.3:SustainableHighwaysSelf-EvaluationTool.Availableonline: https://www.sustainablehighways.org/files/4735.pdf (accessedon12February2019).
64. Envisionv3:SustainableInfrastructureFrameworkManual.Availableonline: https://sustainableinfrastructure.org/envisionversion-3/ (accessedon18February2019).
65. Opricovic,S.FuzzyVIKORwithanapplicationtowaterresourcesplanning. ExpertSyst.Appl. 2011, 38,12983–12990.[CrossRef]
66. Chou,S.Y.;Chang,Y.H.;Shen,C.Y.Afuzzysimpleadditiveweightingsystemundergroupdecision-makingforfacilitylocation selectionwithobjective/subjectiveattributes. Eur.J.Oper.Res. 2008, 189,132–145.[CrossRef]
67. Chu,T.C.FacilitylocationselectionusingfuzzyTOPSISundergroupdecisions. Int.J.Uncertain.FuzzinessKnowl.Based 2002, 10,687–701.[CrossRef]
68. Li,D.F.AratiorankingmethodoftriangularintuitionisticfuzzynumbersanditsapplicationtoMADMproblems. Comput.Math.Appl. 2010, 60,1557–1570.[CrossRef]