2022 Community Health Needs Assessment


Seminole County

The Central Florida Collaborative Community Health Needs Assessment is a unified effort by the following organizations serving the Lake, Orange, Osceola, and Seminole Counties:
AdventHealth Central Florida Division A spire Health Partners

Community Health Centers, Inc. O range Blossom Family Health
community health centers
Florida Department of Health: Lake, Orange, Osceola and Seminole counties
Orlando Health Osceola Community Health Services
True Health
The following document provides an overview of the Seminole County service area. It includes a summary of key county-level demographics, an in-depth health equity profile, a summary of other research results, and prioritized needs for the county.
AdventHealth Central Florida Division is represented in the Collaborative by the following:
• AdventHealth Altamonte Springs
• AdventHealth Apopka
• AdventHealth Celebration
• AdventHealth East Orlando
• AdventHealth Kissimmee
• AdventHealth Orlando
• AdventHealth Waterman
• AdventHealth Winter Garden
• AdventHealth Winter Park Aspire Health Partners with their principal locations at:
• Kassab Plaza (Inpatient)
• Princeton Plaza (Inpatient)
• Sanford (Outpatient)
Orlando Health hospitals participating in the CHNA include the following:
• Orlando Health Arnold Palmer Hospital for Children
• Orlando Health Dr. P. Phillips Hospital
• Orlando Health – Health Central Hospital
• Orlando Health Horizon West Hospital

• Orlando Health Orlando Regional Medical Center
• Orlando Health South Lake Hospital
• Orlando Health South Seminole Hospital
• Orlando Health St. Cloud Hospital
• Orlando Health Winnie Palmer Hospital for Women and Babies
2022 COMMUNITY HEALTH NEEDS ASSESSMENT
Community Health Needs Assessment
The Central Florida Collaborative includes several hospitals within the larger, multisite health systems.

Table of Contents
LETTER TO THE COMMUNITY 8 INTRODUCTION 11
CHNA Process 15
About the Central Florida Collaborative Approach 16 Purpose 16 Equity Champions 17 Goals of the Assessment and Subsequent Steps 18 Summary of Methods Used in the CHNA including the Needs Prioritization Process 18
2022 COMMUNITY HEALTH NEEDS ASSESSMENT
Market Area, Service Use, and Demographic and Community Profile Data Highlights 21 Community and Service Area Definition 22 CFC County Map 22 Secondary Data Highlights and Limitations 23 Data Sources and Highlights 23 Data Limitations 25 P opulation Demographics 26 Population 27 S elect Demographic Changes Since the Previous CHNA 28 Median Age 30 Race and Ethnicity 31 Education 32 P overty & Social Determinants of Health 3 3 Housing 34 Housing Insecure Population 35 Employment & Income 36 Population Living with a Disability 38 Morbidity & Mortality 39 Key Risk Factors and Morbidity / Mortality 4 0 Unintentional Injuries 42
Mental Health & Substance Use Disorder 45
Mental Health Care Capacity 46
Substance Use 48
The Opioid Epidemic 50
Qualitative Research Overview and Themes 52
Strengths 52
Top Challenges 52 Policy, Advocacy and System Level 53 Community Level 53 Individual Level 54
Health Equity Profiles 57 H ealth Equity Data 58
Introduction 58 Data Limitations and Details 59 Seminole County 60
Executive Summary 60 Health Equity Profiles 62 Demographics 62
Social Determinants of Health 64
Healthy Behaviors 70 Chronic Diseases 72 Homicide & Suicide 81
Maternal Health 82
Community Survey Highlights 86
P rioritization Process Results: L ist of Higher-priority Needs, Seminole County 8 7
Top Five Needs 87
Top 15 Granular Issues 87
Top 15 Granular Issues within the Five Top Needs 88 Community Asset Inventory 90
Letter to the Community

The publication of the 2022 Community Health Needs Assessment (CHNA) has been possible through a collaborative effort with hospitals, surrounding county health departments and other stakeholders and community partners.
The health of a community is often measured by the physical, mental and social wellbeing of the people who live there. The resilience of our community was tested in many ways during the COVID-19 pandemic. This public health crisis brought awareness to health disparities and widened gaps in inequity, access to care and other social determinants of health in underserved communities. COVID-19 also offered opportunities for the public, non-profit and private sectors to create and strengthen partnerships, finding innovative solutions through limited resources to keep communities safe and healthy.
Routine assessment of key community health indicators is core to public health and remains a valuable method to identify significant health issues affecting a community. The top 5 priority needs reflected in the assessment for Seminole County include continued efforts to increase public health system capacity, enhance mental health outreach and treatment, streamline access to care, refine primary care and specialized medical care services and address housing and other social determinants of health.
Identifying improvement areas and gaps, and planning for projected needs are essential to ensure resilient communities. This Community Health Needs Assessment provides a unique opportunity to further explore our communities’ needs, identify disparities in diseases and access to care through collaborative efforts, and plan for future generations.
Donna J. Walsh, MPA, BSN, RN Health Officer
 Florida Department of Health in Seminole County
2022 COMMUNITY HEALTH NEEDS ASSESSMENT 8


2022 COMMUNITY HEALTH NEEDS ASSESSMENT 10
Chapter 1 Introduction

11
Introduction
The Central Florida Collaborative (CFC) Community Health Needs Assessment (CHNA) reflects the dedication, compassion and insight of a highly diverse set of organizations. Collectively (and individually) CFC organizations focus on embracing the community, learning their stories and working diligently to meet a broad set of health and community needs.

The number and the quality of partners involved is a key measure of an effective collaborative. The CFC includes a robust number of partners outside of the traditional health care providers, e.g., hospitals and clinics. The individuals represent community populations that can speak about health challenges from personal and professional perspectives.
Throughout the process there were regular meetings and communications with partners; and the final priorities of the assessment utilized the community’s input. CFC members include the following:
• AdventHealth
• Aspire Health Partners
• Community Health Centers, Inc.
• Florida Department of Health in Lake County
• Florida Department of Health in Orange County
• Florida Department of Health in Osceola County
• Florida Department of Health in Seminole County
• Orange Blossom Family Health
• Orlando Health
• Osceola Community Health Services
• True Health
In addition to the organizations listed above, the Florida Department of Health in Seminole County (DOH-Seminole) thanks the following individuals and organizations for their valuable contributions.
2022 COMMUNITY HEALTH NEEDS ASSESSMENT 12
Asian American Community Bike/Walk Central Florida
Black Nurses Rock Bright Community Trust – Housing Center for Independent Living Central Florida Evictions & Foreclosures Group
Choice Neighborhoods Initiative (CNI)
City of Altamonte Springs City of Casselberry
Creating a Resilient Community Network
Faith-based Leaders Florida Alliance for Healthcare Value
DOH-Seminole staff Health and Hunger Task Force Health Council of East Central Florida
Healthy Start Coalition in Seminole County Hospitality Industry
Key Counseling Solutions
No Limit Health Education
Palm Point Behavioral Health
Primary Care Access Network (PCAN)
Refugee Health Taskforce
Second Harvest Food Bank Seminole County Emergency Medical Services Seminole County Opioid Council Seminole County Sheriff’s Office The Center Orlando (LGBTQ+)
The Children’s Cabinet of Seminole County CivCom - Tobacco Prevention Partnership University Behavioral Center
Please note that the following report is a synopsis of the larger, more comprehensive Central Florida Collaborative report. The larger report includes much more extensive data sets, CFC organizational profiles, qualitative research analysis, and more.
This report document includes the following categories of information:
• CHNA Process including the Needs Prioritization Process
• Market Area, Service Use, and Demographic and Community Profile Data Highlights for Seminole County
• Seminole County Health Equity Profiles
• List of higher-priority needs in the county
• Community Asset Inventory
For additional information, please reference the Central Florida Collaborative Community Health Needs Assessment available at https://www.orlandohealth.com/about-us/communityinvolvement/community-benefit
13

2022 COMMUNITY HEALTH NEEDS ASSESSMENT 14
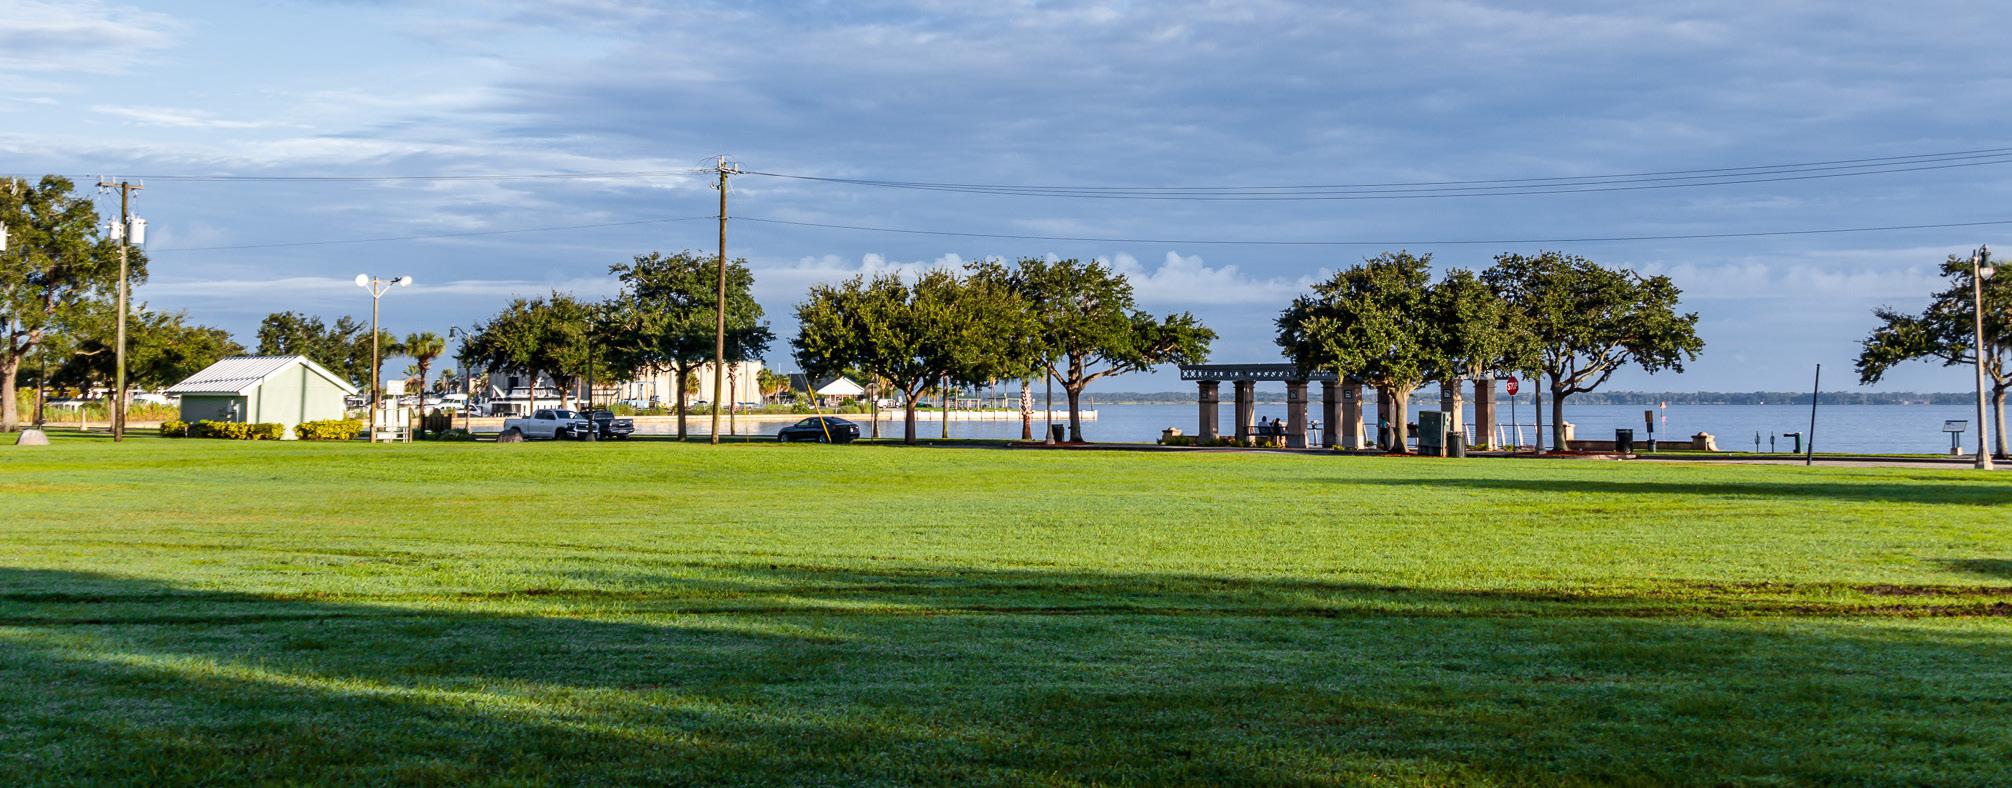
Photo courtesy of Seminole County Government
Chapter 2
CHNA Process

15
About the Central Florida Collaborative Approach
As its name implies, collaboration is a central operating principal of the Central Florida Collaborative (CFC). In public health, the collaborative approach has been decades in the making and organizations have identified a number of activities common to successful collaboratives. Key collaborative process components include:
• Creating a vision that is broadly understood.
• Working across organizational boundaries.
• Including those most affected by health challenges in solution-creation.
• Utilizing ongoing planning and joint accountability to measure change.
The CFC has used these principles and others to implement the 2022 Community Health Needs Assessment (CHNA).
Purpose
The CHNA serves as a critical phase in the overall effort to improve community health and health equity. It is a process that provides a means of identifying and collecting community data while engaging community members in both the data collection and the implementation of prioritized efforts for improving the well-being of Central Florida.
This resulting document creates a frame of reference for community members to discuss the health status of the community. The process itself has been a collaborative effort to identify health issues, barriers, assets and to prioritize the implementation activities needed to address the identified issues.
2022 COMMUNITY HEALTH NEEDS ASSESSMENT 16
Equity Champions
A first step in nearly every new health improvement plan is to recognize the need to reduce and eliminate health disparities and to increase diversity at the leadership and governance levels of health care and other local organizations. The second step to improving health equity is to collect and use data about race, ethnicity and language preference to develop a shared understanding of the challenges in the community. Education about cultural competency is also required. The CFC took a unique approach to working on all these steps simultaneously by creating a team of Equity Champions – ten individuals or organizations who represented multiracial or other minority communities. They assisted the CFC with the following objectives:
• Reviewing research instruments for cultural appropriateness
• Participating in stakeholder interviews
• Participating in the prioritization process and strategy development discussions
• Providing guidance regarding the most effective ways to engage unique community members (e.g., via interviews, surveys or other methods)
Recruitment included outreach to individuals in the following categories:
Racial/Ethnic
• Black/African American
• Hispanic/Latino/Spanish language speakers
Gender and Sexual Self-Identification
• LGBTQ+
Other Community Strength and Diversity
• Members of the community of people living with disabilities (including HIV/AIDS)
• Members of the community of people experiencing homelessness or housing instability
• New Americans/immigrants/migrant workers
• Members of faith-based communities
• Inmates; others in the criminal justice system
• Members of the veteran community
17
Goals of the Assessment and Subsequent Steps
To meet the objective of improving community health and health equity, the CHNA process has included the following goals:
• Identifying resources, strengths and barriers to improving health outcomes
• Developing a deeper understanding of community access to care challenges, including those faced by minority communities
• Enabling partners to collaborate around the opportunities for population health improvement
Ultimately, the group is working toward an ongoing process that monitors, refreshes, adds data and analyzes community health to improve the quality of life for people throughout the service area. Dissemination of the information in this document in different forms is a critical step in communications that informs partners, stakeholders, community agencies, associations and the public about the availability of the community health assessment and what community members can do to make a difference. The CHNA results will be used on local and regional levels to inform and guide Implementation Plans, Community Health Improvement Plans and other strategic initiatives.
Summary of Methods Used in the CHNA including the Needs Prioritization Process
The CFC CHNA had a comprehensive methodology that included a mixed method approach consisting of the following components:
• Data analysis: In-depth review of dozens of validated data sources. Information was tabulated and parsed to identify disparities and other insights.
• Digital research: This included a review of health-related online search terms with the intent to identify new or emerging health trends.
• Primary qualitative research: This component included 30 focus group discussions and 105 key stakeholder interviews.
• Survey research: The community survey engaged over 4,000 respondents and provided insights by county on a breadth of key CHNA issues.
• Access Audit: Over 45 “mystery shopper” calls were conducted during the Access Audit to illuminate real-life customer service and access to care issues.
2022 COMMUNITY HEALTH NEEDS ASSESSMENT 18
• Prioritization process: The CFC leadership and approximately 12 to 15 stakeholders in each county participated in a modified Delphi Process to incorporate quantitative and qualitative insight to the final needs prioritization at a county level. The process also included a series of county-level, focused meetings, as well as an “all service area” meeting.
19
PUBLIC SCHOOL WELLNESS CENTER OFFICE Market Day Fresh Produce ChangeLab Solutions is a nonprofit organization that provides legal information on matters relating to public health. The legal information in this document does not constitute legal advice or legal representation. For legal advice, readers should consult a lawyer in their state. This document was supported by a grant from The California Endowment and produced in partnership with the California Chronic Disease Prevention Leadership Project. © 2019 ChangeLab Solutions www.changelabsolutions.org Elements of a Healthy, Equitable Community Access to Healthy Food Together, these elements provide cumulative health and equity benefits: Physical health Mental health Economic security Safety Community cohesion Civic engagement Safe, Stable, Affordable Housing Health & Supportive Services Parks & Community Spaces Safe, Connected Transportation System Quality Schools Thriving Local Economy Healthy Workplaces & Quality Jobs Environmental Quality & Sustainability PUBLIC SCHOOL et Day Fresh Produce is a nonprofit organization that provides legal information on matters relating to public health. The legal information in this document does advice or legal representation. For legal advice, readers should consult a lawyer in their state. This document was supported by a grant from Endowment and produced in partnership with the California Chronic Disease Prevention Leadership Project. © 2019 ChangeLab Solutions Accessto HealthyFood Community cohesionCivic engagement Affordable Housing Safe, Connected Transportation System Quality Schools Quality

2022 COMMUNITY HEALTH NEEDS ASSESSMENT 20
Photo courtesy of Seminole County Government

21
Market Area, Service Use, and
Chapter 3
Demographic and Community Profile Data Highlights
Community and Service Area Definition
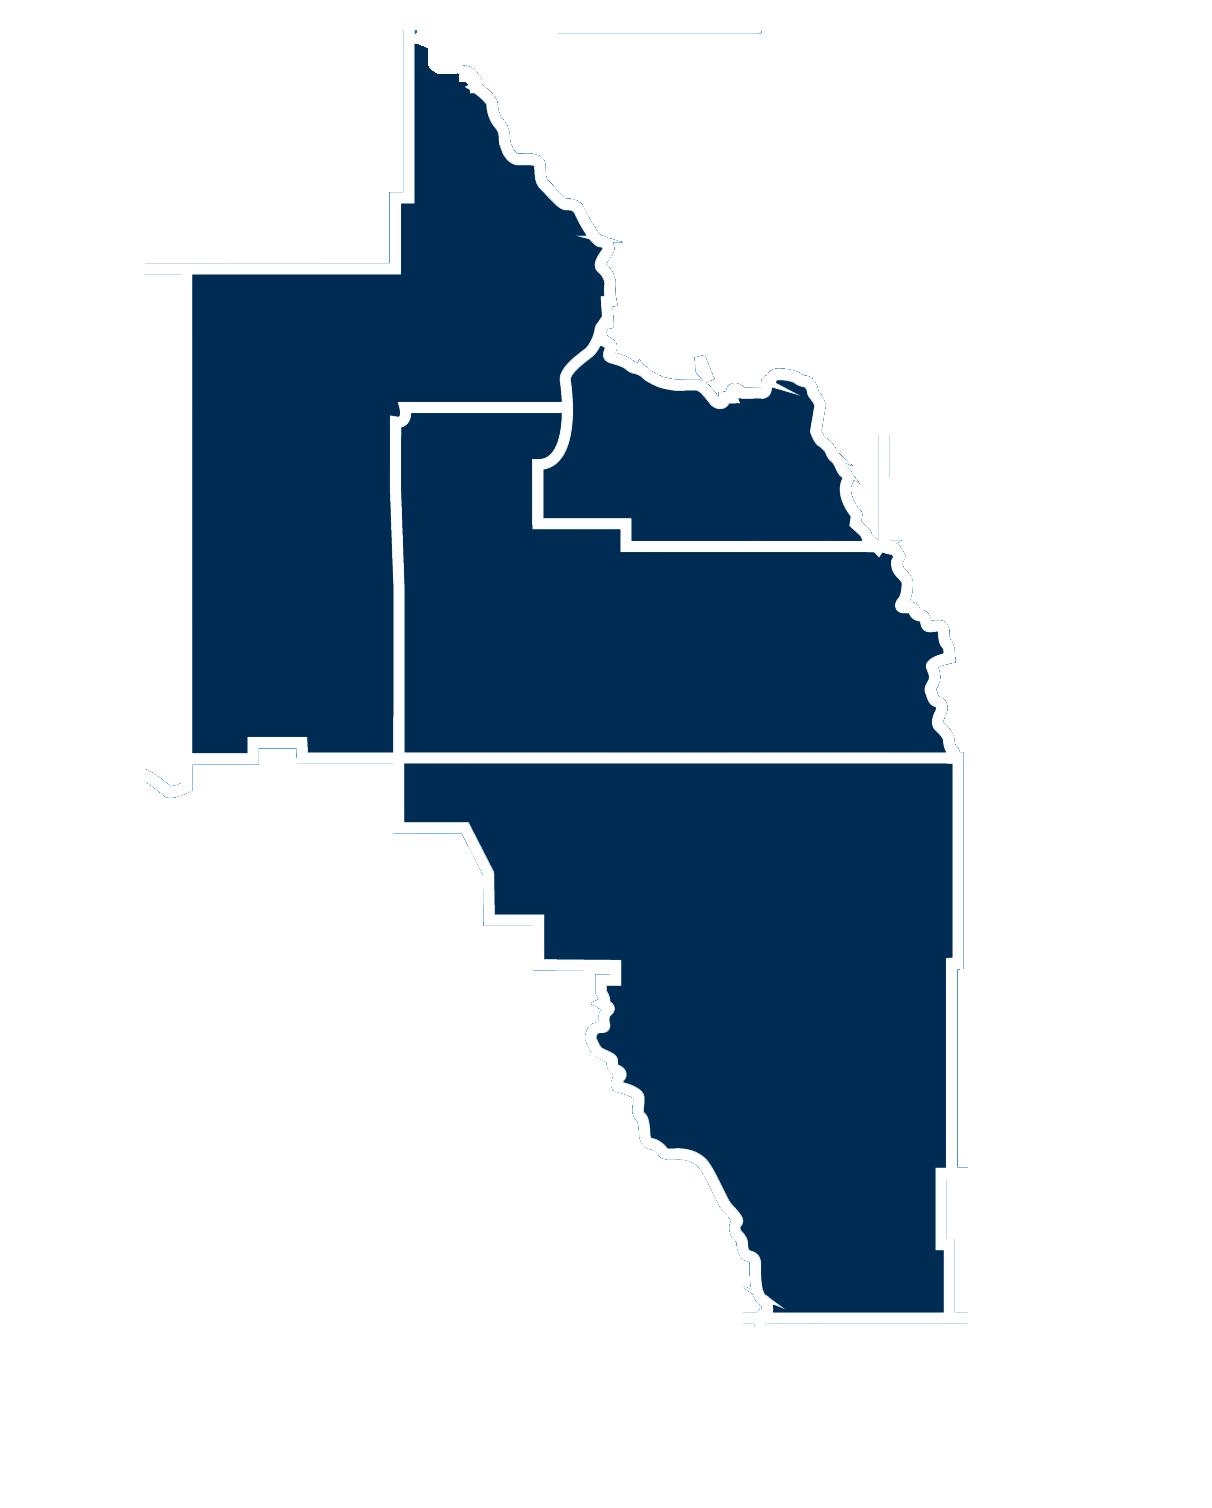
CFC County Map
The service areas and data included in the collaborative CHNA encompass all of Lake, Orange, Osceola and Seminole counties. Each is identifiable individually. Every individual, participating hospital and CFC partner’s service area was determined by patterns based on a review of their patient origins. Please see the map below
Lake COUNTY
2022 COMMUNITY HEALTH NEEDS ASSESSMENT 22
Orange COUNTY
Osceola
COUNTY Seminole COUNTY
Secondary Data Highlights and Limitations
The extensive demographic and secondary data analysis in the full report provides the framework from which to better understand individual neighborhoods, population trends and the overall fabric of the Central Florida community.
Data Sources and Highlights
Data was collected from the United States Census Bureau 2015-2019 American Community Survey (ACS) which covers a broad range of topics about social, economic, demographic and housing characteristics of the United States population. Comparison data from 2010 was captured from the 2006-2010 United States Census 5-year ACS report. The primary advantage of using multi-year estimates is the increased statistical reliability of the data for less populated areas and small population subgroups.1
The secondary data describes Seminole county, and, in some cases, the tables make comparisons to the State of Florida as well as the U.S.
A summary of findings are highlighted below.
• The total population in Seminole County has grown approximately 10% over the last 10 years and it is projected to reach that same percentage by 2024. Florida experienced a near 12% increase in population between 2010 and 2019, the second-largest increase in population after Texas.
• Overall diversity continues to increase. For example, the percent of Hispanic/ Latino Seminole County residents has increased from 16.2% in 2010 to 21.4% in 2019.
• The percent of adults with a college degree in Seminole County is notably above the U.S. and statewide average.
• In Seminole county, approximately 28% or more of the Black/African American community live in poverty, which is the same as the state level and approximately one percentage point or more above the U.S.
• Approximately one out of six homeowners across Seminole County are housing cost burdened, meaning that ownership costs exceed 30% of the household income.
• Overall, 10.6% of Seminole County’s total population live with a disability, which is below the statewide average (13.4%).
1 American Community Survey, 2010 & 2019 5-Year Estimates.
23
• Similar to the nation, heart disease and cancer (of all types) were the leading causes of death in the four service area counties between 2017 and 2019, followed by unintentional injuries.
• Rates for a majority of the leading causes of death have declined over the last 20 years. However, death rates due to Alzheimer’s Disease have increased from 15.1 deaths in 1999-2001 to 19.9 deaths in 2017-2019 per 100,000 people.
• In 2019, over 33.2% of the adult population in Seminole county had high blood pressure, which is slightly lower than statewide (335%).
• The 2018-2020 death rate from unintentional falls in Seminole County (15 deaths per 100,000 population) is nearly 50% higher than the state rate. In addition, an increase of 3.3 percentage points was observed when compared to 2017-2019 death rate.
• Over the five-year reporting period (2015-2019), the percentage of the total population who do have health insurance has increased. Compared to the State (87.3%), Seminole county has a higher percentage of population who do have health insurance (90.3%). Hispanic/Latino population continues to show the lowest percentage when compared to other races.
• Preliminary research indicates that as a result of the COVID-19 pandemic, there is a high probability of an increased burden of mental health issues in the post pandemic era.
• Approximately one in eight service area adults reported notable mental health challenges in 2019; this number likely increased dramatically in 2020 and 2021.
• With 358.5 total mental health providers per 100,000 population, Seminole County was the only one in the CFC service area who was not currently classified as a mental health professional shortage area.
• Fentanyl deaths have skyrocketed in Seminole County over 400% from 2013 to 2019.
• Similarly, overdoses from methamphetamines increased by 300% or more in Seminole county from 2013 to 2019.
2022 COMMUNITY HEALTH NEEDS ASSESSMENT 24
Data Limitations
In general, secondary data utilizes the most current data sets available at the time. 2 The dramatic changes in 2020 due to the COVID-19 pandemic may have impacted some of the traditional projection tools, source data and data collection methods. For example, the American Community Survey (ACS), which provides detailed population and housing information revised its messaging, altered their mailout strategy and made sampling adjustments to accommodate the National Processing Center’s staffing limitations. 3 Where relevant, the impacts or new data due to the COVID-19 pandemic are noted.
Additionally, in-person interviews were limited to telephone and virtual formats. Although some interviews were conducted face-to-face, the decision to conduct most interviews via telephone or virtually may have impacted some of the traditional in-person dynamics.
2 Please note that the five-year American Community Survey data was released March 17, 2022 – too late for inclusion in this analysis. Spot checks did not indicate results in wide variation with the October 2021 data.

3 U.S. Census Bureau.

25
Photo courtesy of Seminole County Government
Population Demographics
The demographic analysis provides the framework from which to better understand individual neighborhoods, population trends and the overall fabric of the community. The following analysis highlights diverse ethnicities, median incomes and other lifestyle factors that impact the needs of Seminole County and sometimes of the service area, as well as the development of effective strategies to meet evolving needs. To analyze these and other characteristics, the domains included in the secondary research include an examination of factors such as general demographics of Seminole County and the health status profile and disease burden.
Seminole County is in East Central Florida just north of Orlando. With an estimated population of 470,856 in 2020, 1522 persons per square mile in a 309 square miles area, Seminole County is the fourth most densely populated county in Central Florida 4 . The county is comprised of seven cities and six unincorporated areas represented by 26 zip codes and 86 census tracts as of the 2010 Decennial Census. 51.7% of the population is female, 78.5% White, 21.4% Hispanic/Latino, and 12% Black/African American.

2022 COMMUNITY HEALTH NEEDS ASSESSMENT 26
4 Bureau of Economic and Business Research, University of Florida. Florida Estimates of Population 2021
Fort Mellon Park | Seminole County
Population
The total population of the service area has grown by a large margin over the last 10 years. Florida experienced a nearly 12% increase in population between 2010 and 2019, the second-largest increase in population after Texas.4 Florida, including the service area, experienced a tremendous influx of new residents during the COVID-19 pandemic. These numbers are not reflected in the below data, yet anecdotally this is changing the face of the state. 6
Exhibit 1: Total Population Growth & Projections
27
United States Florida Seminole County
18,511,620 417,330
Seminole
Source: United States Census Bureau. American Community Survey 5-Year Estimates, 2015-2019; 2024 Projection7 U.S. 2024 Projections 8 Florida 2024 Projection 9 5 United States Census. Around Four-Fifths of All United States Metro Areas Grew Between 2010 and 2020, 2021. 6 Note the years 2010 and 2019 were selected for comparison to provide the closest decennial comparisons as possible since 2020 data was not available at the time this CHNA research was conducted. The 2024 projection year was the most helpful available from the U.S. Census Bureau. 7ArcGIS. 8 Statistica, 2022. 9 University of Florida Bureau of Economic & Business Research, 2020.
2010 303,965,272
2019 324,697,795 20,901,636 461,402 2024 Projected Population 335,710,000 21,869,660 511,232 417,330 461,402 511,232 0 100,000 200,000 300,000 400,000 500,000 600,000 700,000 800,000 900,000 1,000,000
County 2010 2019 2024
Select Demographic Changes Since the Previous CHNA
The following few tables show some of the key demographic shifts occurring in Seminole County since the prior CHNA. Total population, the percent of seniors and the percent of community members indicating that they are Hispanic / Latino reflect some foundational shifts in the area.
Compared to the previous CHNA, in Seminole County the population rose by just over 3,000 from 2018 to 2020.
Note: At the time of this publishing, the 2020 US Census data was recently released. The data reflected in the table below may slightly differ from other tables showing the total population which were constructed based on the 2016-2019 5-year averages.
Exhibit 2: Population Shifts Since the Previous CHNA
Population
470,856 466,000 466,500 467,000 467,500 468,000 468,500 469,000 469,500 470,000 470,500 471,000 471,500 2018 2020*
467,832
Seminole County
Note that the asterisk (*) indicates that the most recent data (i.e., 2020) was used in the charts –different from some other data references in other portions of the CHNA which use 2019 data.
2022 COMMUNITY HEALTH NEEDS ASSESSMENT 28
Seminole County experienced the smallest change in population, 10.6%. Continued, rapid growth is expected.
Exhibit 3: Population Percent Change
United States Florida Seminole County
Percent change (2019 from 2010) 6.8% 12.9% 10.6%
Percent change (2024 from 2019) NA NA 10.8%
Source: United States Census Bureau. American Community Survey 5-Year Estimates, 2015-2019
All CFC areas are expected to see continued growth between 2019 and 2024. Seminole County’s population is projected to reach more than 500,000 by 2024. The rapid population growth in Central Florida was identified as one of the top challenges in the qualitative research by many stakeholders identifying the lack of infrastructure to handle the growing population as one of the most pressing needs. Infrastructure includes roads, housing and more.
Exhibit 4: Seminole County Population Change
Source: United States Census Bureau. American Community Survey 5-Year Estimates, 2015-2019
29
511,232 461,402 417,330 2024 Projected Population 2019 2010
Seminole County
Median Age
Comparisons show that the median age of a Florida resident remains slightly older compared to the median age of Americans. In Seminole County the median age slightly increased from 37.7 in 2010 to 39.2 in 2019.
Exhibit 5: Median Age
United States Florida Seminole County
39.2
Source: United States Census Bureau. American Community Survey 5-Year Estimates, 2015-2019
Shown above, the median age is useful in summarizing whether a population is aging, but it’s important to note that there is more to the age structure of the population than the snapshot that median age alone can pro vide.10
Between the five-year period ending 2010 and the five-year period ending 2019, the percent of seniors increased in Seminole as it did in other CFC, the state of Florida and the US, generally.
Exhibit 6: Trends of Population of People over 65+
United States Florida Seminole County 2006-2010 2015-2019
Seminole county has a notably lower percentage of seniors than the state average.
10 U.S Census Bureau. Counties Can Have the Same Median Age But Very Different Population Distributions, 2019.
2022 COMMUNITY HEALTH NEEDS ASSESSMENT 30
37.7 42.0 40.3 38.1 36.9 2019 2010
12.7% 16.9% 11.4% 15.6% 20.1% 15.2%
Race and Ethnicity
Florida is primarily comprised of residents who identify as White (75.1%), Black/African American (16.1%) and Hispanic/Latino (25.6%). The overall population identifying as Hispanic/ Latino increased on national and statewide levels, as well as in all four counties since 2010. In Seminole County Backs/African Americans represent 12% of the population, similar to the national percentages. The proportion of individuals identifying as Asian in Seminole is slightly higher (4.5%) than across the state (2.7%).
Exhibit 7: Race
United States Florida Seminole County
White 72.5% 75.1% 75.8%
Black/African American 12.7% 16.1% 12.0%
American Indian & Alaska Native 0.8% 0.3% 0.3% Asian 5.5% 2.7% 4.5%
Native Hawaiian & Pacific Islander 0.2% 0.1% 0.1% Other race 4.9% 3.0% 4.3%
Two or more races 3.3% 2.7% 3.1%
Source: United States Census Bureau. American Community Survey 5-Year Estimates, 2015-2019
Exhibit 8: Ethnicity
2010
United States Florida Seminole County
Hispanic/Latino of any race 15.7% 21.6% 16.2%
Mexican 10.1% 3.2% 1.8%
Puerto Rican 1.5% 4.3% 7.1%
Cuban 0.6% 6.2% 1.6%
Other Hispanic/Latino 3.6% 7.9% 5.6% Not Hispanic/Latino 84.3% 78.4% 83.8% 2019
Hispanic/Latino of any race 18.0% 25.6% 21.4%
Mexican 11.2% 3.5% 1.8%
Puerto Rican 1.7% 5.4% 10.0%
Cuban 0.7% 7.3% 2.1%
Other Hispanic/Latino 4.3% 9.4% 7.5%
Not Hispanic/Latino 82.0% 74.4% 78.6%
Source: United States Census Bureau. American Community Survey 5-Year Estimates, 2015-2019
• Increases among the Hispanic population were seen across service area.
• In Seminole County, individuals identifying as Hispanics increased from 16.2% in 2010 to 21.4% in 2019. Puerto Ricans make up a larger portion of this increase, with a 41% growth during this period (from 7.1% to 10%).
31
Education
The following data provides a high-level overview of educational achievement within Seminole County area while highlighting inequalities between educational attainment, race and ethnicity. The percent of adults with a Bachelor’s degree in Seminole County is notably above the United States and statewide average.
Exhibit 9: Educational Attainment
United States Florida Seminole County
40%
35%
30%
25%
20%
15%
10%
5%
0%
9th to 12th Grade, No Diploma
High School Graduate
Some College, No Degree
Associate Degree Bachelor’s Degree Graduate or Professional Degree
United States Florida Seminole County
9th to 12th Grade, No Diploma 12.0% 11.8% 5.7% High School Graduate (Includes Equivalency) 27.0% 28.6% 21.1%
Some College, No Degree 20.4% 19.9% 19.7% Associate Degree 8.5% 9.8% 13.9% Bachelor’s Degree 19.8% 18.9% 26.4% Graduate or Professional Degree 12.4% 11.0% 13.2%
Source: United States Census Bureau. American Community Survey 5-Year Estimates, 2015-2019
In the CFC service area, Seminole County presents the highest percentage of those who pursue higher education overall, as two of five (39.6%) earned a bachelor’s degree, graduate or professional degree
2022 COMMUNITY HEALTH NEEDS ASSESSMENT 32
Poverty & Social Determinants of Health
The term “population living in poverty” refers to the population living 100% below the Federal Poverty Level (FPL). Overall, the total population in Florida living 100% below the FPL is slightly higher compared to the United States.
Exhibit 10: Population Living in Poverty
15.3% 16.5% 10.6% 12.3% 12.7% 9.3%
United States Florida Seminole County
Population Living in Poverty (1 Year Estimates) 2010 2019
Source: United States Census Bureau. American Community Survey 5-Year Estimates, 2015-2019
Exhibit 11: Population Living in Poverty by Race
United States Florida Seminole County
White (Total Population) 72.5% 75.1% 75.8% White (Living in Poverty) 12.5% 13.7% 8.7%
Black/African American (Total Population) 12.7% 16.1% 12.0%
Black/African American (Living in Poverty) 27.1% 28.6% 28.6%
Asian (Total Population) 5.5% 2.7% 4.5% Asian (Living in Poverty) 12.5% 13.2% 4.5%
Source: United States Census Bureau. American Community Survey 5-Year Estimates, 2015-2019
• Approximately 12% of the population in Seminole County identifies as Black/African American. Of this population, over a quarter (28.6%) are considered to be living in poverty.
• Nationwide, the proportion of the population who reported living in poverty decreased slightly. However, in Seminole County the percent decrease was less (12.3%) than for the state of Florida (23%) and the US (19.6%).
33
Housing
Indicators related to household composition and housing-related finances are important factors to review, as housing is an important social determinant of health that highlights the link between where people live and their health. People with low incomes and minority communities tend to reside in places with more health risks and face housing cost burdens that encourage housing instability, which can jeopardize the ability to meet their basic needs.11
Exhibit 12: Total Housing Units
United States Florida Seminole County 137,428,986 9,448,159 190,156
Source: United States Census Bureau. American Community Survey 5-Year Estimates, 2015-2019
Many homes within the service area are considered to be cost burdened which means that ownership costs exceed 30% of household income. The burden is more extreme for renters.
Exhibit 13: Monthly Owner Costs as a Percent of Household Income
United States Florida Seminole County
Less than 20.0% 45.9% 40.7% 45.8% 20.0 to 24.9% 15.7% 15.3% 16.1% 25.0 to 29.9% 10.5% 10.7% 10.5% 30.0 to 34.9% 6.9% 7.5% 6.4% 35.0% + 20.9% 25.8% 21.2%
Source: United States Census Bureau. American Community Survey 5-Year Estimates, 2015-2019
• In Seminole County 27.6% homeowners pay 30% or more of income for housing, meaning that approximately three of every 10 homeowners in Seminole county are housing cost burdened.
• More than 60% (61.9%) homeowners pay less than a quarter of household income which is higher than the State (56%) and the nation (61.6%).
11 Centers for Disease Control & Prevention, Social Determinants of Health.
2022 COMMUNITY HEALTH NEEDS ASSESSMENT 34
Housing Insecure Population
The Point in Time (PIT) Count is a one-day snapshot of the persons experiencing homelessness on a given night and should not be interpreted as a measure of the number of people who experience homelessness over a year. Persons experiencing homelessness are divided into unsheltered and sheltered population categories and include not only people living on the streets, but also those residing in emergency shelters, safe havens and transitional housing units. All those experiencing homelessness who are sheltered on the night of the count are not included in the PIT figures shown below.
*Note: The 2021 Point in Time Count numbers are not comparable to the previous years’ counts. Typically, Continuums of Care (CoCs) conduct a PIT Count of both sheltered and unsheltered households. This year, due to COVID-19 related safety concerns, only six of the 27 CoCs conducted such a count; 10 CoCs did not conduct an unsheltered count; and others conducted a modified form of the unsheltered count. All CoCs conducted a sheltered PIT count. For those that did not conduct an unsheltered count, the CoCs reported zero unsheltered persons, resulting in an undercount of homelessness.
Exhibit 14: Point in Time Count: Seminole
County Persons Experiencing Homelessness
35
12 Florida Department of Children & Families. Annual Council on
2021 Report.
313 210 344 50 150 250 350 450 550 650 2015201620172018201920202021 Count
Source: Florida’s Council on Homelessness 2021 Annual Report 12
Homelessness
209 372 252 288
Employment & Income
Economic stability is a known social determinant of health as people living in poverty are less likely to have access to health care, healthy food, stable housing and opportunities for physical activity. These disparities mean people living in poverty are more likely to die from preventable diseases.13 Research suggests that low-income status is associated with adverse health consequences, including shorter life expectancy, higher infant mortality rates and other poor health outcomes.14 In Florida, the median household income is nearly $10,000 less compared to the average household in the United States. Seminole County income exceeds the United States average.
Exhibit 15: Median Household Income by Income Group
Median Household Income
$62,843
$55,660
United States Florida Seminole County $66,768
$66,768
United States Florida Seminole County
Less than $10,000 6.0% 6.5% 5.6% $10,000 to $14,999 4.3% 4.3% 2.7% $15,000 to $24,999 8.9% 9.9% 7.9% $25,000 to $34,999 8.9% 10.3% 8.5% $35,000 to $49,999 12.3% 13.9% 12.3% $50,000 to $74,999 17.2% 18.3% 18.1% $75,000 to $99,999 12.7% 12.4% 14.2% $100,000 to $149,999 15.1% 13.1% 15.4% $150,000 to $199,999 6.8% 5.3% 7.4% $200,000 + 7.7% 6.0% 7.9%
Median Household Income $62,843 $55,660 $66,768
Source: United States Census Bureau. American Community Survey 5-Year Estimates, 2015-2019
13 Social Determinants of Health, Economic Stability. 14 American Academy of Family Physicians, Poverty & Health, The Family Medicine Perspective.
2022 COMMUNITY HEALTH NEEDS ASSESSMENT 36
• The 2021 Federal Poverty Level (FPL) of annual household income for a typical family of four was approximately $26,500. In Seminole County, one of six (16.2%) families earns less than $25,000 per year; nearly two of five (37.0%) earn less than $50,000.
• More households in Seminole County earn an annual household income of $150,000 or higher – 15.3%, compared to 11.3% in Florida state average.15

37
15 Note that columnar percentages in the exhibit may not equal 100.0% due to rounding.
Photo courtesy of Seminole County Government
Population Living with a Disability
Research indicates that in comparison to those living without a disability, people with disabilities have less access to health care, experience more depression and anxiety, engage more often in risky health behaviors such as smoking and are less physically active.16
The total population in Florida living with a type of disability is slightly higher compared to the national average. The population aged 65 and older naturally experience the highest percentage of those living with a disability, indicating that this population within communities may require more resources to achieve an equal quality of life compared to those without a disability. The data below indicates the percentage of those within each demographic who are living with a disability.
Exhibit 16 : Population Living with a Disability Summary
% of Population Living With a Disability
10.6%
12.6%
13.4%
Percent Living with a Disability 12.6% 13.4% 10.6%
Living with a Disability, by Gender
Male 12.5% 13.5% 10.1% Female 12.7% 13.4% 11.1%
Living with a Disability, by Race & Ethnicity
White 13.1% 14.2% 11.0%
Black/African American 14.0% 11.9% 10.5% Asian 7.1% 7.7% 5.4%
White, Not Hispanic/Latino 13.9% 15.9% 11.4% Hispanic/Latino of Any Race 9.0% 10.0% 9.5%
Source: United States Census Bureau. American Community Survey 5-Year Estimates, 2015-2019 The Asian community tends to have the lowest percentage of people living with a disability.
16 Centers for Disease Control and Prevention. Health Equity for People with Disabilities, 2021.
2022 COMMUNITY HEALTH NEEDS ASSESSMENT 38
2019 United States Florida Seminole County
United States Florida Seminole County
Morbidity & Mortality
Mortality rates measure the frequency of occurrence of death in a defined population during a specified interval.17 Mortality data answers critical questions to help health care organizations and providers understand how many people are dying and – importantly – why. Cancer (of all types) and heart disease were the leading causes of death between 2017 and 2019, followed by Stroke in Seminole County.
Exhibit 17: Leading Causes of Death for Seminole County
Florida Seminole County
Per 100,000
146.0 146.5 40.7 55 38.1
146.7 135.0 55.3 48.3 35.3
Cancer Hearth Disease Stroke Unintentional Injury Chronic Lower Respiratory Disease
Age-Adjusted Mortality Rate, per 100,000
Florida Seminole County
Heart Disease 146.5 135.9 Cancer 146.0 146.7
Unintentional Injury 55.0 48.3 Stroke 40.7 55.3 Chronic Lower Respiratory Disease 38.1 35.3 Diabetes 20.3 19.8 Alzheimer's Disease 19.9 19.5 Suicide 14.6 11.7
Source: Florida Department of Health. Bureau of Vital Statistics, 2017-2019
17 Deputy Director for Public Health Science & Surveillance. Center for Surveillance, Epidemiology & Laboratory Services, Division of Scientific Education & Professional Development.
39
Key Risk Factors and Mortality/Morbidity
Risk factors for heart disease include family history and lifestyle behaviors. While family history is not in the control of the individual, controllable risk factors include high blood pressure or cholesterol and obesity. Behaviors such as tobacco and alcohol use as well as an unhealthy diet can increase the chance of developing some type of heart disease.18
Exhibit 18: Heart Disease & Cancer-Related Deaths
Florida
Seminole County
146.0 Heart Disease
146.7 146.5
135.9
Cancer Per 100,000
Source: Florida Department of Health. Bureau of Vital Statistics, 2017-2019
Seminole County presents lower heart disease-related death rates compared to Florida.
18 Florida Department of Health. Risk factors of Heart Disease.
2022 COMMUNITY HEALTH NEEDS ASSESSMENT 40
Seminole County as well as Florida has decreased both cancer and heart disease-related deaths over the last two decades. While a majority of the leading causes of death have declined over the last 20 years, death rates related to Alzheimer’s Disease have increased from 15.5 deaths to 19.5 deaths per 100,000 people. Deaths from unintentional injuries also increased notably (44.7%).
41
Exhibit 19: Leading Causes of Death in Florida, Two-Year Comparison Source: Florida Department of Health. Bureau of Vital Statistics, 2017-2019 Age-Adjusted Mortality Rate, Florida, per 100,000 Florida Seminole 1999-2001 2017-2019 Percent Change 1999-2001 2017-2019 Percent Change Cancer 187.6 146.0 -22.2% 194.3 146.7 -24.5% Heart Disease 238.5 146.5 -38.6% 271 135.9 -49.9% Stroke 48.9 40.7 -16.8% 53.9 55.3 2.6% Unintentional Injury 38.0 55.0 44.7% 30 48.3 61.0% Chronic Lower Respiratory Dis-ease 41.3 38.1 -7.7% 46.5 35.3 -24.1% Diabetes 21.7 20.3 -6.5% 25.4 19.8 -22.0% Alzheimer’s Disease 15.1 19.9 31.8% 15.5 19.5 25.8% Suicide 12.8 14.6 14.1% 10.2 11.7 14.7% 238.5 187.6 146.5 146.0 Heart Disease Cancer Per 100,000 2017-2019 1999 - 2001 238.5 187.6 146.5 146.0 Heart Disease Cancer Per 100,000 2017-2019 1999-2001 238.5 187.6 146.5 146.0 Per 100,000 2017-2019 1999-2001 1999-2001 238.5 187.6 146.5 146.0 Heart Disease Cancer Per 100,000 2017-2019 1999-2001 238.5 187.6 146.5 146.0 Heart Disease Cancer Per 100,000 2017-2019 1999-2001 238.5 187.6 146.5 146.0 Heart Disease Cancer Per 100,000 2017-2019 1999-2001
Unintentional Injuries
As presented in this report previously, unintentional injuries were the third leading cause of death in Florida and the service area in 2019. Florida experienced an increase in unintentional injury death rates between the three-year cumulative data collection spans.
Exhibit 20: Leading Causes of Fatal Unintentional Injuries 19
Age-Adjusted Rate Per 100,000
Florida Seminole County
2017 - 2019 2018 - 2020 2017 - 2019 2018 - 2020
Falls 10.0 10.3 11.7 15.0
Motor Vehicle Crashes 14.4 14.7 10.7 10.3 Drowning 2.0 2.0 2.2 2.2
Source: Florida Department of Health. Bureau of Vital Statistics Profile of Fatal Injuries
Exhibit 21: Hospitalizations & Deaths From Unintentional Injuries 2019
Age-Adjusted Rate Per 100,000
Unintentional Falls
Florida Seminole County
Death Rate 10.0 18.0 Hospitalization Rate 243.9 298.9
Motor Vehicle Fatalities & Hospitalizations
Death Rate 14.7 11.9 Hospitalization Rate 76.4 55.8
Firearm Injuries
Non-Fatal Hospitalization Rate 4.2 4.7 Emergency Room Visits 14.4 6.9
Source: Florida Agency for Health Care Administration, 2019
• According to Exhibit 20, the leading cause of fatal unintentional injuries in Seminole County was falls between 2017-2019 and 2018-2020. Exhibit 21 shows that in Seminole County the death rate from unintentional falls was almost twice that of the state. The hospitalization rate from unintentional falls was also higher (298.9) when compared with the state (243.9).
• Exhibit 21 also shows that Seminole County presents a lower rates of emergency room visits caused by firearm injuries and the higher rate of non-fatal firearm injury hospitalizations compared to Florida state.
19 These deaths are reported by the decedent’s county of residence. The 2019 data numbers overlap.
2022 COMMUNITY HEALTH NEEDS ASSESSMENT 42
Deaths due to drowning have improved slightly in Seminole County and statewide since 2010.
Exhibit 22: Trend of Unintentional Drowning Deaths
Florida Seminole County
Source: Department of Health, Bureau of Vital Statistics
43
2010 2011 2012 2013 2014 2015 2016 2017 2018 2019
2.0 1.8 1.8 1.8 2.0 2.1 2.0 2.0 1.9 1.7
1.7 2.7 2.0 1.7 2.1 1.6 1.8 1.1 0.9 1.2 0 1 2 3 4 5 2013 2016 2019 Per 100,000
Florida
Seminole County
Photo courtesy of Seminole County Government
Morbidity refers to having a disease, or a symptom of disease, or to the amount of disease within a population. Morbidity also refers to medical problems caused by a treatment. 20
Exhibit 23: Population Diagnosed with a Chronic Disease
Florida
Seminole County
% of Population
12.7% 11.7%
33.5% 14.4% 9.5%
33.2%
Asthma Diabetes Hypertension
2019 Florida Seminole County
Asthma 12.7% 14.4% Diabetes 11.7% 9.5% Hypertension 33.5% 33.2%
Source: Florida Behavioral Risk Factor Surveillance System, 2019 21
• In 2019, over 30% of the adult population in Seminole County had hypertension high blood pressure.
• As shown above, while Seminole County present a lower percentage of adults diagnosed with diabetes, the prevalence of asthma remains higher than comparable the statewide percentage.
20 National Cancer Institute, Morbidity.
21 Behavioral Risk Factor Surveillance System (BRFSS) Survey.
2022 COMMUNITY HEALTH NEEDS ASSESSMENT 44
Mental Health & Substance Use Disorder
Preliminary research indicates that as a result of the COVID-19 pandemic, the existence of an emotional epidemic curve and a high probability of an increased burden of mental health issues in the post-pandemic era is certain. The current evidence and published literature related to previous epidemics suggest that mental health issues may arise after the peak of the pandemic, with increased prevalence among the vulnerable population and people with risk factors. 22 The following data indicate the percentage of adults who reported poor mental health at least 14 out of the past 30 days. 23
This is a large and growing challenge to Central Florida. Approximately one in eight service area adults reported notable mental health challenges in 2019; this number likely skyrocketed in 2020 and 2021. This appears to be a significant and ongoing challenge – especially noting the rapid population growth rates. A higher percentage of the population struggling with mental health issues, married with population growth, implies an accelerated number of men, women and families in need of mental health support.
Exhibit 24: Adults Who Had Poor Mental Health 14 + of Past 30 Days
Florida Seminole County
% of Adult Population
11.0% 0% 2% 4% 6% 8% 10% 12% 14% 16% 18% 20% 2013 2016 2019
12.7% 11.4% 13.8% 11.5% 7.2%
Source: Florida Behavioral Risk Factor Surveillance System
Although Seminole County rates are lower than those in the State, there has been an increase in the percentage of adults reporting mental health challenges in Seminole County.
22 BJM Journal. Mental health in the post-COVID-19 era: challenges and the way forward, 2020.
23 Note: For terminology, Behavioral Health is the promotion of mental health, resilience, and well-being; the treatment of mental and substance use disorders; and the support of those who experience and/or are in recovery from these conditions, along with their families and communities. Behavioral health conditions and the behavioral health field have historically been financed, authorized, structured, researched, and regulated differently than other health conditions.
45
Mental Health Care Capacity
The state of Florida has a notable shortage of providers. The state-based Health Professional Shortage Area (HPSA) data has only 19% of providers needed to achieve a level of not being designated as an HPSA. Statewide, this indicates that over 380 additional professionals are needed. 24 On a per-capita basis, this suggests that the service area needs a minimum of 46 additional providers to meet 2019 needs. This number is likely higher in 2022 given the reported increase in mental health needs nationwide and locally.
Exhibit 25: Licensed Mental Health Providers
Per 100,000 Florida Seminole County
Licensed Mental Health Counselors 57.3 103.9
Licensed Psychologists 23.4 21.9
Licensed Clinical Social Workers 49.7 56.6
Behavioral or Mental Health Professionals 117.1 176.1
Total 247.5 358.5
Source: Florida Department of Health Bureau of Community Health Assessment. Division of Public Health Statistics & Performance Management’s Suicide and Behavioral Health Profile, 2020
Exhibit 26: Total Psychiatric Beds
Per 100,000 Florida Seminole County
Adult Psychiatric Beds 20.6 15.0 Child and Adolescent Psychiatric Beds 3.0 1.7
Source: Florida Department of Health Bureau of Community Health Assessment. Division of Public Health Statistics & Performance Management’s Suicide and Behavioral Health Profile, 2020
• Seminole County has about 40% more mental health providers per capita than the state average. Across all counties, there is a widespread shortage of licensed mental health providers.
• There is a pronounced shortage of beds in Seminole County, residents sometimes require inpatient care provide on nearby counties exacerbating the service area capacity issue.
24 Kaiser Family Foundation. Mental Health Workforce, 2021.
2022 COMMUNITY HEALTH NEEDS ASSESSMENT 46
Exhibit 27: Hospitalizations for Mental & Behavioral Health Disorders by Age in Florida
Per 100,000 Drug & AlcoholInduced Mental Disorders Mood & Depressive Disorders Schizophrenic Disorders Eating Disorders
Hospitalizations Attributable to Mental Disorders
Total Hospitalizations 166.9 430.3 235.7 11.5 928.4 Under 18 5.9 446.2 18.1 18.1 599.9 18-21 85.0 742.0 269.9 30.4 1,262.3 22-24 131.4 594.0 386.3 19.4 1,230.9 25-44 263.0 497.3 415.3 11.8 1,256.7 45-64 275.4 460.0 300.6 6.5 1,093.9 65-74 134.1 252.9 140.6 4.6 593.7 75 + 39.0 139.9 75.1 6.8 413.0
Source: Florida Department of Health Bureau of Community Health Assessment. Division of Public Health Statistics & Performance Management’s Suicide and Behavioral Health Profile, 2019
• In 2019, there were 928.4 hospitalizations per 100,000 people caused by mental health disorders/illnesses in Florida.
• Mood and depressive disorders were the most common primary diagnosis upon admission across all age groups which is also the highest cause of hospitalizations for Seminole County.
Exhibit 28: Hospitalizations for Mental & Behavioral Health Disorders
Source: Florida Department of Health Bureau of Community Health Assessment. Division of Public Health Statistics & Performance Management’s Suicide and Behavioral Health Profile, 2019
47
Per 100,000 Florida Seminole County Total Hospitalizations 1,006.0 963.9 Drug & Alcohol-Induced Mental Disorders 166.9 115.7 Mood & Depressive Disorders 430.3 610.9 Schizophrenic Disorders 235.7 155.9 Eating Disorders 11.5 9.7
Substance Use
The Behavioral Risk Factor Surveillance Survey defines binge drinking as, males having five or more drinks on one occasion, females having four or more drinks on one occasion. 25
Binge drinking rates in the state have been relatively stable since 2002 with approximately 15% to 18% of adults engaging in heavy or binge drinking. Seminole County experienced a decrease in adult binge drinking from 2016 to 2019.
Exhibit 29: Adults Who Engage in Heavy or Binge Drinking
2022 COMMUNITY HEALTH NEEDS ASSESSMENT 48
Behavioral Risk Factor Surveillance System
10% 12% 14% 16% 18% 20% 22% 2002 2005 2008 2011 2014 2017 %
2002 2007 2010 2013 2016 2019 Florida 16.4% 16.2% 15.0% 17.6% 17.5% 18.0% Seminole County 20.8% 20.4% 15.4% 13.2% 20.1% 17.4%
Source: Florida
25 RFSS Prevalence & Trends Data Binge Drinking.
of Adult Population Florida Seminole County
The table below displays a comparison of substance use-related overdose rates in 2013 and 2019 per 100,000 residents. Death rates related to fentanyl and methamphetamine have increased in Seminole County.

Exhibit 30: Rate of Overdose Deaths
Per 100,000 2013 2019 Percent Change
Florida
Benzodiazepine ND 11.6 ND
Cocaine ND 9.6 ND Fentanyl ND 11.3 ND Heroin ND 3.6 ND Methamphetamine ND 9.1 ND Opioids ND 23.6 ND Seminole
Benzodiazepine 44.0 8.5 -80.7% Cocaine 14.0 9.3 -33.6% Fentanyl 2.0 10.2 410.0% Heroin 7.0 5.1 -27.1% Methamphetamine 1.0 4.0 300.0% Opioids 54.0 17.4 -67.8%
Source: Florida Drug-Related Outcomes Surveillance & Tracking (FROST) System, 2019. Note: “ND” means “No Data available.”
• Fentanyl deaths have skyrocketed in Seminole County up over 300% from 2013 to 2019. See FROST data in Exhibit 30.
• Similarly, overdoses from methamphetamines increased by 300% or more.
• Deaths from opioids, heroin, cocaine and benzodiazepine declined in 2019 from 2013.
• Although fully comparable data was not available at the state level from the FROST system, trends between 2017 and 2020 similarly show decreased deaths from benzodiazepine and rising death rates from fentanyl and methamphetamine.
49
The Opioid Epidemic
For general context, note that fatal overdoses are rising at an unprecedented rate in the state of Florida, and Central Florida is rising even faster than the statewide average. In the greater Central Florida region, there were over 1,618 deaths between March 2020 and March 2021, a rate of 34.51 per 100,000 of the population. In Central Florida, there were 616 overdose deaths between March 2020 and March 2021, a 28% increase in the same period in 2019-2020. This equals 51 overdose deaths a month and over 1.5 a day. 26
As shown in the graphic below, prescribing rates have decreased in Seminole county by approximately 20%.
Exhibit 31: Trend of Opioid Prescribing Rates in Seminole County
600
500
400
300
662.1 200
505.8 566.4
700 2018 2019 2020 Per 1,000
Source: Florida Department of Health Bureau of Community Health Assessment Division of Public Health Statistics and Performance Management Substance Use Dashboard
26 Project Opioid. The Changing Overdose Crisis in Central Florida: A Community Needs Assessment, 2021.
2022 COMMUNITY HEALTH NEEDS ASSESSMENT 50
Opioid deaths decreased in 2020 from 2019 in each service area county, as well as the state total.

51
Florida Seminole
2019 2020 2019 2020 4,294 3,034 61 20
Exhibit 32: Trend of Opioid-Related Deaths in Seminole County Source: Florida Department of Health Bureau of Community Health Assessment Division of Public Health Statistics and Performance Management Substance Use Dashboard, 2020
County
20 61 2020 2019
Photo courtesy of Seminole County Government
Qualitative Research Overview and Themes
The core of the assessment involved substantial onsite data gathering, local knowledge and expertise and outreach efforts for community engagement. The primary qualitative approach engaged policy leaders, key stakeholders throughout the area, non-profit organization representatives, health care consumers, the criminal justice system, diversity representatives, people experiencing homelessness and others. The qualitative techniques used included:
• Equity Champions - Diversity Group Outreach
• Stakeholder One-to-One Interviews (105 interviews)
• Focus Group Discussions (30 focus group discussion)
The combination of individual interviews and focus group discussions provided an in-depth perspective of high-level topics impacting the general four-county service area. In addition, several more “Granular Qualitative Research Themes and Insights” were identified. Please refer to the full report to see some of the many comments shared.
Strengths
Many individuals who participated in the qualitative research highlighted positive aspects of living and working in the Central Florida region. The growing diversity of the population was mentioned by numerous stakeholders in all four counties. One stakeholder noted, “With diversity comes interesting things to do that we didn’t use to have. It’s also attracting younger, highly educated, diverse individuals; so, now there is a breadth of thought leaders.”
The Central Florida region is home to numerous non-profit organizations throughout the four counties. A majority of the stakeholders agreed that many organizations are very collaborative and have developed supportive partnerships over the years with a goal to break down silos. A stakeholder said, “Passion for helping people has brought people together.”
Many stakeholders commented on the positive economic impact of the local theme parks and tourism industry. There was also consensus that the weather is generally nice year-round with many opportunities for outdoor activities and recreation.
Top Challenges
Challenges and barriers were identified at three levels: (1) Policy, Advocacy and System, (2) Community and (3) Individual.
2022 COMMUNITY HEALTH NEEDS ASSESSMENT 52
Policy, Advocacy and System Level
Many of the challenges identified through the qualitative research were issues at a state or national level and require policy and regulatory change within state and federal laws or system-wide regulations to reduce the impact felt by individual community members. Some of the most common comments relate to:
• Complex Health Care System including staffing shortages
• Financial Issues including the fact that many have no realistic access to health insurance without Medicaid expansion
• Non-profit Organization Funding and Sustainability Challenges
• Workforce development and staffing challenges
Community Level
Community-level challenges are a step below system-level challenges, but there is an overlap between system-, community- and individual-level challenges. Community-level challenges generally affect the wider population as a whole and not just select individuals within a community. Many of the community-level challenges are interrelated. The clusters of community-level challenges include:
Rapid Population Growth in Central Florida
The rapid population growth in Central Florida was identified as one of the top challenges in the qualitative research by many stakeholders. In addition, there is a lack of infrastructure to handle the growth and a lack of affordable housing.
Behavioral Health
Driven by the opioid epidemic and COVID-19 pandemic, the acuity of behavioral health in the community has increased significantly in the Central Florida region and across the country. One silver lining of the COVID-19 pandemic is that people tend to be somewhat more candid about mental health issues and are breaking through some of the stigmatization found in specific populations.
Chronic understaffing and an opioid epidemic that is not going away anytime soon exacerbate these behavioral health challenges.
Many other stakeholders also identified the importance of assisting with housing, transitions, nutrition and other basic needs to help people experiencing a mental health condition maintain some stability in the community.
53
Health Care Access is Not Equitable Across the Region
Stakeholders identified a variety of potential barriers and challenges people may experience when it comes to accessing health care services. Common barriers include lack of transportation or inadequate public transportation system, lack of health insurance or the ability to pay and mistrust of the health care industry. The COVID-19 pandemic has intensified the need to build trust in the health care industry in many priority populations27 given the increasing prominent role of public health information and leaders.
Awareness of Community Services
There is a consensus among various stakeholders across the four-county region that community-wide awareness of what services and resources are available is low. Word of mouth tends to be the best method to share information, especially in priority populations.
Individual Level
Many of the identified challenges and barriers at the system and community level trickle down, and they impact the community residents who make up the over 2.8 million people who live in the Central Florida region. Some of the key individual challenges include:
Affordable Housing Crisis
The affordable housing crisis is one of the top challenges impacting the Central Florida region and across the country. The lack of affordable housing is a root cause driver of many other needs and challenges in the community. As one stakeholder said, “Housing burden leads to a chain reaction to bad health care.”
Chronic Disease
Many barriers exacerbate increasing chronic disease rates, especially in more outlying rural communities in Central Florida Transportation issues, including challenges getting to a grocery store or a health clinic, present another barrier.
Other stakeholders identified the lack of prevention and education programs, especially in the region’s youth population as another contributing factor to high chronic disease rates in the community. Health literacy and culturally appropriate health information were also identified as challenges for the increasingly diverse communities of Central Florida.
27 Priority populations include communities historically underrepresented, such as Black/African American communities, Hispanic/Latino communities, members of the LGBTQ+ community and others.
2022 COMMUNITY HEALTH NEEDS ASSESSMENT 54
The Wage Gap
The recent increases in wages are closer to the living wage needed for one adult with no children living in the Greater Orlando area. However, with inflation and the continuing rise of housing-related costs, the new wages may still not be enough for many hospitality and tourism workers to live in a safe, non-cost-burdened home.
Access to Care
Throughout the qualitative research process, many challenges and barriers to accessing health care and social services in the Central Florida region were identified. Many of the top barriers have been identified in the sections above. A list recapping the most common barriers for individuals includes:
• Transportation gaps and inefficiencies with the public transportation system
• Lack of health insurance or the financial ability to pay for services, including insurance copays

• Long wait times to see providers
• Lack of awareness of resources, services and providers in the community
• Health literacy and health information not available in multiple languages
• Mental health stigma
55
Photo courtesy of Seminole County Government

2022 COMMUNITY HEALTH NEEDS ASSESSMENT 56
Chapter 4 Health Equity Profiles

57
Health Equity Data
Introduction
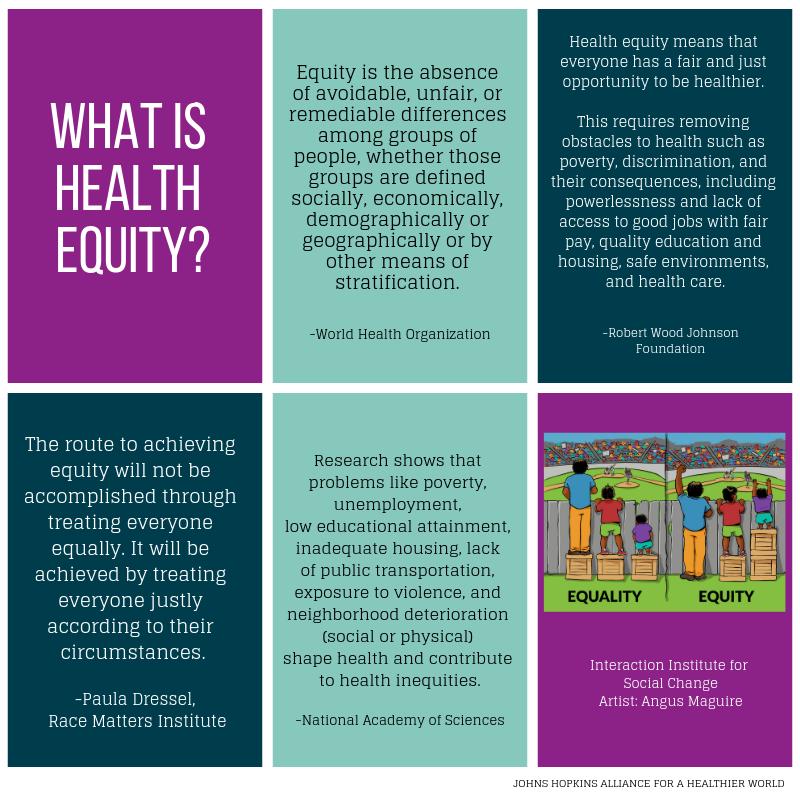
The following section highlights inequities and disparities that ultimately impact the health of individuals, families and the overall community. Health equity exists when individuals have equal opportunities to be healthy. The ability to be healthy is often associated with factors such as social position, race, ethnicity, gender, religion, sexual identity or disability. When these factors limit a person’s ability to be healthy it can lead to health inequity. 28
28
2022 COMMUNITY HEALTH NEEDS ASSESSMENT 58
Source: Johns Hopkins, Alliance for a Healthier World. Health Equity, Defining a Complex Concept
The Community Guide, Health Equity.
Health disparities indicate differences in health linked with social, economic and/or environmental disadvantages. Health disparities adversely affect communities who have systematically experienced greater barriers to healthcare, based on their racial or ethnic group; religion; socioeconomic status; gender; age; mental health; cognitive, sensory or physical disability; sexual orientation or gender identity; geographic location; or other characteristics historically linked to discrimination or exclusion. 29
Data Limitations and Details
The health equity data was primarily captured from the Florida Health Community Health Assessment Resource Tool Set (FLHealthCharts) database and the United States Census Bureau 2015-2019 American Community Survey (ACS) which covers a broad range of topics about social, economic, demographic and housing characteristics of the U.S. population. The primary advantage of using multiyear estimates is the increased statistical reliability of the data for less populated areas and small population subgroups.
In addition to limitations noted above and earlier in the report, it is important to note that some health equity data can have percentage changes that look dramatic simply because the raw counts of some populations are so small.
As part of county-specific summaries, there are data change tables utilizing The Social Vulnerability Index (SVI) model. The SVI was developed by the U.S. Centers for Disease Control and Prevention as a metric for analyzing data to identify vulnerable populations.
The SVI may be used to rank overall population well-being and mobility relative to County and State averages. The SVI can also be used to determine the most vulnerable populations during disaster preparedness and public health emergencies (e.g., pandemics). The SVI tables include 2021 Federal Reserve Economic Data (FRED) and note increases of more than 10% (up or down) from the 2010 American Community Survey 5-Year estimate and the FRED Economic Data.
59
29 Health.gov. How does Healthy People 2030 define health disparities and health equity?
Seminole County Executive Summary
People cannot choose the circumstances of their birth, a variable that has significant impact on their well-being throughout their lives. Even the minds of babies begin to construct realities about the world almost immediately. From a mother’s first touch, human brains create a feedback loop about the world. Geographic location, adverse childhood experiences and other characteristicsmany of which are historically linked to discrimination or exclusion - have a dramatic impact on an individual’s health and well-being.
The short list of health issues highlighted below are unique due to their geographic and social realities. The data points help illustrate some of the impacts that these health equity realities are having on individuals’ health in Seminole County.
• The percentage of households below the poverty line has decreased in the county with Seminole County levels (9.3%) lower than those in the nation (12.3%) and the state (12.7%) respectively.
• A higher percentage of minority populations in Seminole County are living in poverty which is also reflected in lower median household incomes by race. The average median income for those who identify as White is $74,451 compared to the median income of $49,139 for those who identify as Black/African American.
• Only 57.8% of Hispanic/Latino residents had a personal doctor while 77.6% of nonHispanic/Latino White residents had a personal doctor.
• In Seminole County the rate of hospitalizations from or with diabetes was 2,247.1 per 100,000 but for Black/African American residents (4,143.2)
• Unintentional injury death rate, unintentional poisoning and traumatic brain injury death rate were highest in those who identify as White and non-Hispanic/Latino.
• The population with HIV in Seminole County was 288.5 per 100,000, but by race and ethnicity, those who identify as non-Hispanic/Latino Black/African American had rates over three times higher than in Seminole County.
• Homicide rates were highest in those who identify as Black/African American (16.9), more than three times higher than the Seminole County average (4.0).
• Suicide rates were highest in those who identify as White at 12.7 per 100,000.
• Women who identify as Black/African American had higher rates of fetal death, infant deaths and sudden unexpected infant deaths (11.1, 15.7, 3.1, respectively) than Seminole County as a whole (6.7, 6.3, 1.0, respectively).
Please note that a complete listing of hospitals that serve the area is contained in the joint CHNA.
2022 COMMUNITY HEALTH NEEDS ASSESSMENT 60

61
Nurture at Cranes Roost | Seminole County
Health Equity Profiles
Demographics
Notable SVI characteristics are seen in the table below across the United States, Florida and Seminole County. Data in this table comes from the 2019 American Community Survey 5 -Year Estimates and the 2021 Federal Reserve Economic Data (FRED), with trends and changes noted by arrows ↑↓. An upward arrow (↑) indicates an increase of more than 10% from the 2010 American Community Survey 5-Year estimate and the FRED Economic Data, a downward arrow (↓) indicates a decrease of more than 10%. If no arrow is present, there is no identified change from 2010.
Exhibit 33: Seminole County Social Vulnerability Index
United States Florida Seminole County
Seminole County Population 324,697,795 20,901,636↑ 461,402↑
Below Poverty 12.3%↓ 12.7%↓ 9.3%↓ Unemployed 5.4%↓ 5.1%↓ 3.2%↓
Median Income $62,843↑ $55,660↑ $66,768↑ Median Age 38.1 42.0 39.2 Age 65 + 15.6%↑ 20.1%↑ 15.2%↑ Age 17 or Younger 22.6% 20.0% 21.2%↓ Household with Disability 12.7% 13.7% 11.7%↑
Single-Parent Households 31.6% 30.2% 34.2% Ethnic Minority 39.3%↑ 46.1%↑ 39.7%↑ Do not Speak English 8.4% 11.9% 6.5%↑ Multi-Unit Housing Structures 26.3% 30.5% 26.8% Mobile Homes 6.2% 8.9% 2.9% No Vehicle 8.6% 6.3% 4.0%
Source: American Community Survey, 2010 & 2019 5-Year Estimates
• The population in Florida (20,901,636) and Seminole County (461,402) has grown over the past 10 years. However, the percentage of residents in Seminole County under 18 years of age has decreased to 21.2% of the population (Note: the downward arrow indicates a decrease of more than 10% from 2010).
• The percentage of households that are below the poverty line in 2019 decreased in the county with Seminole County levels (9.3%) lower than those in the nation (12.3%) and the state (12.7%). See Exhibit 33.
• Median income has risen in the United States, Florida and Seminole County. The median income in Seminole County ($66,768) is higher than in Florida and the United States ($55,660, and $62,843 respectively).
2022 COMMUNITY HEALTH NEEDS ASSESSMENT 62
• The population of those aged 65 years and older has increased at the national, state and county levels. The percentage of those 65 years and older in Seminole County is 15.2%, lower than the average in Florida (20.1%) and the United States (15.6%).

• Over the past 10 years, the percentage of households who have a person with a disability has increased in Seminole County (11.7%).
• The percentage of the population of ethnic minorities has increased in the past 10 years in the United States, Florida and Seminole County (39.3%, 46.1%, 39.7%, respectively). Those who do not speak English have increased in Seminole County and make up 6.5% of the population.
Median life expectancy in Seminole County for those who identify as Hispanic/Latino was 83.6 years, higher than Seminole County (80.3). Median life expectancy for those who identify as Black/ African American was 77.9 years, lower than Seminole County (80.3).
Exhibit 34: Median Life Expectancy by Race & Ethnicity
Total White Black / African American Asian Other/ Multiple Races Hispanic/ Latino White, not Hispanic/ Latino
United States 77.8 ND 72.0* ND ND 79.9 78.0 Florida 79.4 79.7 76.7 ND ND 83.0 78.5 Seminole County 80.3 80.6 77.9 87 ND 83.6 79.8
Sources: For state and county data except Asian and Other/Multiple Races: Florida Department of Health referencing data from 2018-2020 (https://www.flhealthcharts.gov/ChartsReports/rdPage.aspx?rdReport=ChartsProfiles.LifeExpectancyProfile&islYears=2020 retrieved June 9, 2022). For Asian and Other/Multiple Races data: County Health Rankings, referencing data from 2018-2020 (https://www.countyhealthrankings. org/app/florida/2022/measure/outcomes/147/data, retrieved June 9, 2022). For U.S. data: National Center for Health Statistics. 2021, referencing 2020 data (https://www.cdc.gov/nchs/products/databriefs/db427.htm, retrieved June 9, 2022).
*This data point represents those identified as Black/African American, not of Hispanic/Latino origin, while the other figures in this column are only indicative of race.
63
Social Determinants of Health
Social determinants of health (SDoH) are the conditions in the environments where people are born, live, learn, work, play, worship and age that affect a wide range of health, functioning and quality-of-life outcomes and risks. Social determinants of health have a major impact on people’s health, well-being and quality of life and heavily contribute to wide health disparities and inequities. 30
Racial and ethnic minorities may face unique barriers to higher education. Black/African American and Hispanic/Latino individuals have lower college enrollment and graduation rates compared to White individuals. Hispanic/Latino individuals are most likely to attend college part-time, which reduces their odds of graduating. 31
Educational attainment and unemployment rates in Seminole County vary across race and ethnicity, but those who identify as Black/African American have greater disparities.
Exhibit 35: Educational Attainment (percent high school diploma or higher)
Total White Black / African American Asian Other/ Multiple Races Hispanic/ Latino White, not Hispanic/ Latino
United States 88.5% 90.7% 86.7% 87.3% 74.2% 70.3% 93.2% Florida 88.5% 90.2% 83.7% 87.2% 82.1% 80.4% 93.0% Seminole County 94.4% 95.5% 90.8% 91.9% 91.3% 91.1% 96.4%
Source: U.S. Census Bureau, 2016-2020 American Community Survey 5-Year Estimates
• The percentage of Seminole County residents who identify as Black/African American and have graduated high school was 90.8%, lower than the County average (94.4%).
Seminole County housing issues are slightly better than the state average. However, approximately one in six 2020 households are severely cost burdened (14%) or have severe housing problems (17%). 32
Exhibit 36: Housing Challenges in Seminole County
Severe Housing Cost Burdened
Severe Housing Problems
Seminole County 14% 17% Florida 17% 19%
Source: County Health Rankings
30 Healthy People 2030. Social Determinants of Health.
31 Healthy People 2030, Enrollment in Higher Education.
32Severe Housing Problems, Percentage of households with at least 1 of 4 housing problems: overcrowding, high housing costs, lack of kitchen facilities or lack of plumbing facilities. Available at https://www.countyhealthrankings.org/explore-health-rankings/ measures-data-sources/county-health-rankings-model/health-factors/physical-environment/housing-transit/severe-housingproblems.
2022 COMMUNITY HEALTH NEEDS ASSESSMENT 64
Educational attainment (i.e., the percent of adults with a Bachelor’s degree or higher) notably differs by race and ethnicity with Blacks/African Americans much less likely to have earned a bachelor’s degree.
Exhibit 37: Trend in Educational Attainment (percent with a Bachelor’s degree or higher) by Race and Ethnicity
56.4% 40.8% 27.0%
28.5%
56.4% 60.0%
Population with a Bachelor’s Degree or Higher by Race & Ethnicity 2006-2010 2015-2019
60.0% 29.0%
White Black/African American Asian Hispanic/Latino
White Black/African American Asian Hispanic/Latino
Population with a Bachelor’s Degree or Higher by Race & Ethnicity 2006-2010 2015-2019
Source: American Community Survey, 2015-2019
Note: The data above references two data points: the 5-year period ending 2010 (i.e., 2006-2010) and the 5-year period ending 2019 (i.e., 2015-2019).
Workplace inequalities among racial and ethnic minorities can have negative health consequences as those who are unemployed have reported feelings of depression, anxiety, low self-esteem, demoralization and stress. 33
Exhibit 38: Unemployed Civilian Labor Force
Source: U.S. Census Bureau, 2016-2020 American Community Survey 5-Year Estimates


• Seminole County residents who identify as Black/African American made up 7.2% of the unemployed civilian labor force, higher than the Seminole County average and individuals of different races and ethnicities. 33 Healthy People 2030, Employment.
65
Total White Black / African American Asian Other/ Multiple
Hispanic/ Latino White, not Hispanic/ Latino United
5.4% 4.6% 9.2% 4.3% 7.3% 6.2% 4.4% Florida 5.4% 4.7% 8.5% 4.4% 6.0% 5.0% 4.7% Seminole
4.6% 4.1% 7.2% 3.5% 5.4% 4.7% 4.0%
Races
States
County
Racial and ethnic minorities living in poverty often present more adverse health outcomes compared to the White population. Residents of impoverished communities are at increased risk for mental illness, chronic disease, higher mortality and lower life expectancy.
A higher percentage of minority populations in Seminole County are living in poverty which is also reflected in lower median household incomes by race.
Exhibit 39: Median Household Income
Source: U.S. Census Bureau, 2016-2020 American Community Survey 5-Year Estimates
• The average median income for those who identify as White is $74,451 compared to the median income of $49,139 for those who identify as Black/African American.
The median household income differs substantially among racial and ethnic groups in Seminole County.
Exhibit 40: Trend in Median Household Income by Race and Ethnicity
2022 COMMUNITY HEALTH NEEDS ASSESSMENT 66
Hispanic/Latino
$61,835 $38,678 $66,010 $45,669 $70,200 $48,421 $88,172 $52,571 White Black/African American Asian Hispanic/Latino 2006-2010 2015-2019 Total White Black / African American Asian Other/ Multiple Races Hispanic/ Latino White, not Hispanic/ Latino
$64,994 $68,943 $43,674 $91,775 $55,965 $54,632 $70,843 Florida $57,703 $61,065 $43,418 $73,412 $53,706 $52,092 $63,474
$70,297 $74,451 $49,139 $87,925 $54,945 $57,141 $76,799
• Asians in Seminole County (more likely to have higher educational attainment) had median household income of over $88,000 in 2019 – over 30% since 2010 (the largest percent increase of any racial or ethnic group). • Black/African American households’ median income increased almost 30% over the same time period. Incomes for White and
residents also increased but not by as high of a percentage.
United States
Seminole County
Exhibit 41: Population Living in Poverty
Total White Black / African American Asian Other/ Multiple Races Hispanic/ Latino White, not Hispanic/ Latino
United States 12.8% 10.6% 22.1% 10.6% 17.8% 18.3% 9.3% Florida 13.3% 11.5% 20.7% 11.9% 15.6% 16.4% 9.7% Seminole County 9.8% 8.1% 16.5% 8.9% 14.1% 12.5% 7.4%
Source: U.S. Census Bureau, 2016-2020 American Community Survey 5-Year Estimates
• The percentage of people in Seminole County (2016-2020) who identify as Black/African American, Other/Multiple Races and Hispanic/Latino had higher rates of living below the federal poverty level (16.5%, 14.1%, 12.5% respectively) than people who identify as White (8.1%) and Non-Hispanic/Latino (7.4%).
• Similar rates are seen in minority populations under 18 years old that live below the federal poverty level—27.0% Black/African American, 18.9% of another race and 17.8% Hispanic/Latino, higher than Seminole County’s average (13.7%). 34
There are large disparities in the percentage of people living poverty based on race and ethnicity; however, poverty levels for all groups declined from 2010 to 2019.
Exhibit 42: Trend in the Percentage of People Living in Poverty
18.1% 4.4%
14.1% 7.7%
4.5%
11.8%
White Black/African American Asian Hispanic/Latino
Population Living in Poverty by Race (1 Year Estimates) 2010 2019
• Poverty levels in Seminole County among Blacks/African Americans are roughly 2.5 times higher than Whites.
• Fewer than one in 20 Asians (4.4%) lives in poverty.
34Source: U.S. Census Bureau, 2016-2020 American Community Survey 5-Year Estimates.
67
Inadequate health insurance coverage is one of the largest barriers to health care access, and the unequal distribution of coverage contributes to disparities in health. The consequences of not having health insurance are exacerbated within specific ethnicities. For example, research indicates that people who speak another language besides English are less likely to receive recommendations for preventative health screenings and immunizations. This factor, in addition to not a lack of health insurance, only worsens health outcomes over time. 35
In Seminole County, 90.6% of adult residents had health insurance. Utilization of health care services and numbers of immunizations varied by race and ethnicity.

Exhibit 43: Population with Health Insurance
Source: U.S. Census Bureau, 2016-2020 American Community Survey 5-Year Estimates *Civilian noninstitutionalized population 35Healthy
2022 COMMUNITY HEALTH NEEDS ASSESSMENT 68
People 2030, Access to Primary Care.
Total* White Black / African American Asian Other/ Multiple Races Hispanic/ Latino White, not Hispanic/ Latino
91.3% 92.4% 90.1% 93.6% 84.6% 82.3% 94.1% Florida 87.3% 88.5% 85.1% 88.6% 82.2% 81.4% 90.7%
90.6% 91.6% 89.3% 91.8% 84.7% 85.6% 92.6%
Sanford Mural | Artist: Mark Seppala | Seminole County
United States
Seminole County
Exhibit 44: Utilization of Health Care Services by Adults
2019 Seminole County
Non-Hispanic/ Latino White
Non-Hispanic/ Latino Black/ African American Hispanic/ Latino
Adults who could not see a doctor at least once in the past year due to cost 13.3% 9.8% 16.5% 24.0%
Adults who have a personal doctor 70.7% 77.6% 61.3% 57.8%
Adults who said their overall health was good to excellent 83.1% 84.7% 80.8% 75.7%
Had a medical checkup in the past year 76.1% 76.6% 80.5% 75.1%
Visited a dentist or a dental clinic in the past year (2016) 72.2% 75.4% 68.3% 64.9%
Immunizations
Received a flu shot in the past year 36.6% 40.7% 20.1% 34.6%
Have ever received a pneumonia vaccination 29.7% 33.3% 22.0% 22.5%
Source: Florida Behavioral Risk Factor Surveillance System, 2019
• Seminole County residents who could not see a doctor in the past year due to cost was lowest in non-Hispanic/Latino White residents (9.8%) and highest in Hispanic/Latino residents (24.0%).
• Only 57.8% of Hispanic/Latino residents had a personal doctor while 77.6% of nonHispanic/Latino White residents had a personal doctor.
• Approximately 80.5% of non-Hispanic/Latino Black/African American residents had a medical checkup in the past year, higher than the Seminole County average (76.1%).
• Under 50% of Seminole County residents received immunizations for the flu and pneumonia. Immunizations for the flu in the past year were lowest in non-Hispanic/ Latino Black/African American residents (20.1%). Only 22.0% of non-Hispanic/Latino Black/African American residents have ever received a pneumonia vaccine.
69
Healthy Behaviors
Not everyone has the means and opportunity to make healthy decisions. Policies and programs put in place have marginalized some population groups and communities, keeping them from the support and resources necessary to thrive. Many of the leading causes of death and disease are attributed to unhealthy behaviors. For example, poor nutrition and low levels of physical activity are associated with a higher risk of cardiovascular disease, type 2 diabetes and obesity. Tobacco use is associated with heart disease, cancer and poor pregnancy outcomes if the mother smokes during pregnancy. Excessive alcohol use is associated with injuries, certain types of cancers and cirrhosis. 36
Exhibit 45: Adult Health Behaviors
Current Smokers 15.2% 11.2% -26.3% 15.4% 12.6% -18.2% 6.6% 12.4% 87.9% Engage in Heavy or Binge Drinking 20.1% 17.4% -13.4% 21.3% 18.6% -12.7% 13.7% 18.0% 31.4% Obese 27.9% 22.7% -18.6% 27.9% 24.3% -12.9% 25.9% 26.9% 3.9% Overweight 34.8% 37.6% 8.0% 32.8% 37.7% 14.9% 29.2% 45.8% 56.8% Sedentary 22.8% 22.6% -0.9% 20.7% 20.8% 0.5% 22.8% 26.4% 15.8% Inactive or Insufficiently Active 47.6% ND ND 43.1% ND ND 56.1% ND ND
Meet Aerobic Recommendations 53.5% ND ND 57.7% ND ND 50.6% ND ND
Meet Muscle Strengthening Recommendations 41.4% 37.3% -9.9% 38.2% 39.4% 3.1% 53.6% 39.5% -26.3%
Current Smokers ND ND ND 21.8% 5.7% -73.9% ND ND ND Engage in Heavy or Binge Drinking ND ND ND 16.4% 14.0% -14.6% ND ND ND Obese ND ND ND 32.1% 12.0% -62.6% ND ND ND
Overweight ND ND ND 43.1% 37.4% -13.2% ND ND ND Sedentary ND ND ND 30.8% 27.6% -10.4% ND ND ND
2022 COMMUNITY HEALTH NEEDS ASSESSMENT 70
White Black/African American
Change
% Change
36County Health Roadmaps & Rankings, Health Behaviors. Seminole County
2016 2019 % Change 2016 2019 %
2016 2019
Non-Hispanic/Latino
% Change 2016 2019 % Change
2019 % Change
Other Race Hispanic/Latino
2016 2019
2016
Exhibit
71
Source: Florida Behavioral Risk Factor Surveillance System In Seminole County 114.1 per 100,000 people under 65 had preventable hospitalizations from nutritional deficiencies. The nutritional deficiency death rate in Seminole County was 4.6 per 100,000 but is highest in those who identify as non-Hispanic/Latino (5.1).
46: Nutritionally Deficient Population
Non-Hispanic/Latino 2016 2019 % Change 2016 2019 % Change 2016 2019 % Change Inactive or Insufficiently Active ND ND ND 58.7% ND ND ND ND ND Meet Aerobic Recommendations ND ND ND 41.3% ND ND ND ND ND Meet Muscle Strengthening Recommendations ND ND ND 48.0% 34.6%
White Black/ African American Other
Hispanic/ Latino
Latino
ND
4.0 4.4
Source: Florida Department of Health. Bureau of Vital Statistics, 2019 Other Race Hispanic/Latino
-27.9% ND ND ND Per 100,000 Seminole County
Race
Non-Hispanic/
Preventable Hospitalizations Under 65 from Nutritional Deficiencies 114.1 ND
ND ND ND Nutritional Deficiency Death Rate 4.6 4.7
0.0 5.1
Chronic Diseases
Research indicates that racial and ethnic minorities experience higher rates of diabetes, obesity, stroke, heart disease and cancer than the White population. In America, the risk of being diagnosed is 77% higher for Black/African American residents and 66% higher among Hispanic/ Latino residents, compared to the White population. Additionally, those identifying as Asian American, Native Hawaiian and Pacific Islander are at twice the risk of developing diabetes than the population overall. 37 The following section highlights inequities and disparities within Seminole County that ultimately impact the health of individuals, families and the overall community.
The leading cause of hospitalization per 100,000 in Seminole County was congestive heart failure. The leading cause of death per 100,000 in Seminole County was coronary heart disease. Variations in hospitalization and death rates are seen among race and ethnicity.
Exhibit 47: Adult Chronic Disease Profile
Ever Been Told They Had Diabetes 9.5% 10.6% 12.4% ND 4.7% ND
Ever Been Told They Had a Stroke 2.3% 5.8% 4.0% ND 4.0% ND
Source: Florida Behavioral Risk Factor Surveillance System, 2019
2022 COMMUNITY HEALTH NEEDS ASSESSMENT 72
Non-Hispanic/
Non-Hispanic/ Latino
Other
Non-Hispanic/ Latino Hispanic/ Latino
37 Health Affairs. The United States Can Reduce Socioeconomic Disparities by Focusing on Chronic Diseases, 2017.
Seminole County
Latino White
Black/ African American
Race
Exhibit 48: Chronic Disease Hospitalizations & Death Rates
Per 100,000
Hospitalization Rates
Seminole County White Black/ African American Other Race Hispanic/ Latino Non-Hispanic/ Latino
Coronary Heart Disease 225.9 192.2 278.6 603.3 207.8 224.7
Congestive Heart Failure 1233.5 1025.5 2252.6 2590.5 1004.2 1264.0 Stroke 217.3 179.2 369.4 490.9 169.2 221.9
Death Rates
Congestive Heart Failure 18.0 17.5 21.6 17.7 15.2 18.5 Stroke 59.0 58.7 61.0 ND 55.8 59.0
Coronary Heart Disease 73.3 73.0 82.9 ND 54.8 76.2 Chronic Liver Disease & Cirrhosis 10.7 11.7 6.7 ND 7.0 11.3
Nephritis, Nephrotic Sydrome & Nephrosis 9.5 7.7 21.9 ND 9.0 9.7
• Seminole County death rates were highest in Black/African American residents who died from congestive heart failure, stroke and coronary heart disease (21.6, 61.0, 82.9 respectively).
• More than twice as high as Seminole County (9.5 per 100,000), the nephritis, nephrotic syndrome and nephrosis death rate for those who identify as Black/African American was 21.9 per 100,000.
• Those who identify as White and non-Hispanic/Latino had higher death rates of chronic liver disease and cirrhosis (11.7 and 11.3 respectively).
73
Source: Florida Agency for Health Care Administration, 2018-2020
Although cancer incidence and mortality overall are declining in the United States, certain groups continue to be at increased risk of developing or dying from particular cancers. Due to social, environmental and economic disadvantages, racial and ethnic groups bear a disproportionate burden of cancer compared with other groups. Cancer disparities can also be seen when outcomes are improving overall but the improvements are not seen in some groups relative to other groups. 38
Exhibit 49: Cancer Incidence
Per 100,000
Seminole County White Black/ African American Other Race Hispanic/ Latino Non-Hispanic/ Latino
Total Incidence Rate 424.5 428.2 370.3 388.0 324.8 458.1
Cervical Cancer 8.7 9.1 9.1 5.8 9.5 8.3
Prostate Cancer 90.5 80.5 125.8 80.3 74.8 95.4
Breast Cancer 117.4 117.1 97.5 125.8 85.6 127.5 Colorectal Cancer 39.5 39.7 33.0 40.5 36.1 40.8
Source: University of Miami Medical School. Florida Cancer Data System, 2016-2018
Exhibit 50: Cancer Cases at Advanced Stage When Diagnosed
Lung Cancer 49.6 52.2 41.7 33.0 26.8 33.9 Seminole County White Black/ African American Other Race Hispanic/Latino Non-Hispanic/ Latino
Source: University of Miami Medical School. Florida Cancer Data System, 2016-2018
38 National Cancer Institute, Cancer Disparities.
2022 COMMUNITY HEALTH NEEDS ASSESSMENT 74
48.3% 48.3% 51.8% ND 50.3% 48.1%
Exhibit 51: Deaths Caused by Cancer
Per 100,000
Seminole County White Black/ African American Other Race Hispanic/ Latino Non-Hispanic/ Latino
Overall Cancer Death Rate 141.9 142.6 148.9 ND 102.8 148.7
Cervical Cancer 2.4 1.1 3.5 ND 0.3 1.5
Prostate Cancer 16.7 6.2 12.1 ND 4.1 7.3
Breast Cancer 10.8 10.5 16.0 ND 6.6 11.6
Colorectal Cancer 13.0 12.7 15.7 ND 11.4 13.3
Lung Cancer 33.1 34.0 28.3 ND 17.8 35.7
• Those who identify as White and non-Hispanic/Latino had higher rates of lung cancer death (34.0, 35.7 respectively), higher than the Seminole County average (33.1).
• Approximately 48% to 51% of all races and ethnicities received a diagnosis of their cancer at an advanced stage. The population that identifies as other race and non-Hispanic/ Latino had the highest rates of breast cancer (125.8, 127.5 respectively), higher than the average in Seminole County (117.4). Breast cancer mortality was highest in Black/African American residents (16.0) and non-Hispanic/Latino residents (11.6), higher than the average in Seminole County (10.8).
75
Source: Florida Department of Health. Bureau of Vital Statistics, 2018-2020
Photo courtesy of Seminole County Government
Emergency room visits due to diabetes were over two times higher in those who identify as Black/ African American (408.4) and of other race (338.7) than in Seminole County as a whole (147.8).
Exhibit 52: Diabetes Emergency Room Visits
Per 100,000
Emergency Room Visits Due to Diabetes 147.8 95.4 408.4 338.7 175.6 142.3
Preventable Hospitalizations Under 65 from Diabetes 121.4 ND ND ND ND ND
Hospitalizations from or with Diabetes 2,247.1 1,784.8 4,143.2 5,602.4 2,340.5 2,209.3
Source: Florida Agency for Health Care Administration, 2018-2020
• In Seminole County, preventable hospitalizations of diabetes in those under 65 years were 121.4 per 100,000.
• In Seminole County, the rate of hospitalizations from or with diabetes was 2,247.1 per 100,000 but for Black/African American residents (4,143.2) and Other Race (5,602.4) it was notably higher.
2022 COMMUNITY HEALTH NEEDS ASSESSMENT 76
Seminole County White Black/ African American Other Race Hispanic/ Latino Non-Hispanic/ Latino
Exhibit 53: Prevalence of Respiratory Disease
Per 100,000
Emergency Room Visits Due to Asthma
Seminole County White Black/African American
2019 2020 % Change 2019 2020 % Change 2019 2020 % Change
394.3 248.4 -37.0% 233.9 155.6 -33.5% 967.5 570.7 -41.0%
Asthma Hospitalizations 54.8 38.3 -30.1% 38.7 26.6 -31.3% 86.8 78.0 -10.1% Hospitalizations from CLRD (Including Asthma) 209.4 145.2 -30.7% 178.9 124.9 -30.2% 283.2 204.6 -27.8%
CLRD Death Rate 30.8 25.6 -16.9% 32.5 27.1 -16.6% 20.7 21.6 4.3%
Exhibit 54: Prevalence of Respiratory Diseases (continued)
Per 100,000
Other Race
Hispanic/Latino Non-Hispanic/Latino
2019 2020 % Change 2019 2020 % Change 2019 2020 % Change
Emergency Room Visits Due to Asthma 800.4 523.4 -34.6% 505.8 302.7 -40.2% 358.4 229.6 -35.9%

Asthma Hospitalizations 163.6 98.9 -39.5% 74.9 45.1 -39.8% 49.7 37.8 -23.9% Hospitalizations from CLRD (Including Asthma) 396.8 269.1 -32.2% 189.8 109.1 -42.5% 210.5 152.2 -27.7%
CLRD Death Rate 19.3 15.3 -20.7% 25.9 13.9 -46.3% 31.3 27.1 -13.4%
Source: Florida Agency for Health Care Administration

77
Sanford Civic Center Chainsaw Tree | Seminole County
Non-fatal unintentional injury hospitalizations in Seminole County had rates of 552.7 per 100,000 in 2019 and 553.1 per 100,000 in 2020. Hospitalizations for non-fatal unintentional falls decreased from 2019 to 2020 but remained the highest unintentional injury (298.9, 289.1 per 100,000 respectively). Rates of unintentional injuries and unintentional death by race and ethnicity presented disparities in Seminole County.
Exhibit 55: Unintentional Injuries, 2019
Unintentional Injury Hospitalizations
552.7 ND ND ND ND ND
Unintentional Injury Death Rate 51.4 56.0 33.4 24.1 38.6 54.6
Unintentional Poisoning Death Rate 15.2 17.1 13.1 2.8 6.2 17.9
Drug Poisoning Death Rate 15.0 16.8 13.1 2.8 7.0 17.4
Hospitalizations for Non-Fatal Unintentional Falls 298.9 286.3 162.4 638.8 205.2 302.2
Unintentional Falls Death Rate 18.0 19.7 2.6 ND 20.1 17.8
Hospitalizations for Non-Fatal Motor Vehicle Traffic-Related Injuries 54.2 41.0 56.1 109.1 34.4 49.8
Motor Vehicle Crash Death Rate 11.9 12.5 12.0 ND 6.6 12.8
Hospitalizations for Non-Fatal Traumatic Brain Injuries 72.8 63.2 58.9 132.7 41.4 71.8
Traumatic Brain Injury Death Rate 17.4 18.4 13.1 ND 14.5 18.3
Hospitalizations for Non-Fatal Firearm Injuries 5.9 1.5 21.7 ND ND 5.3
Firearms-Related Death Rate 9.9 9.6 11.1 7.7 ND ND
Hospitalizations for Non-Fatal Unintentional Firearm Injuries 4.7 ND 16.1 ND ND 4.0
Unintentional Death Rate Due to Fire 0.5 0.6 0.0 ND 0.0 ND
Unintentional Drownings Death Rate 1.7 1.9 0.0 ND 2.1 ND
• Shown above, unintentional injury death rate, unintentional poisoning and traumatic brain injury death rate were highest in those who identify as White and nonHispanic/Latino.
• Residents who identify as other race had the highest rates of hospitalizations for nonfatal unintentional falls, non-fatal motor vehicle traffic-related injuries and nonfatal traumatic brain injuries (638.8, 109.1, and 132.7, respectively)—much higher than the Seminole County average (298.9, 54.2, 72.8, respectively).
• Those who identify as Black/African American had the highest rate of hospitalizations for non-fatal firearm injuries (21.7), firearms-related death rate (11.1) and hospitalizations for non-fatal unintentional firearm injuries (16.1) – higher than the Seminole County average (5.9, 9.9, 4.7, respectively).
• Those who identify as Hispanic/Latino had the highest death rates due to unintentional falls.
2022 COMMUNITY HEALTH NEEDS ASSESSMENT 78
Source: Florida Agency for Health Care Administration, 2019
Per 100,000
Seminole County White Black/ African American Other Race Hispanic/ Latino NonHispanic/ Latino
Exhibit 56: Unintentional Injuries, 2020
Per 100,000
Unintentional Injury Hospitalizations
553.1 ND ND ND ND ND
Unintentional Injury Death Rate 59.9 65.2 44.9 ND 36.4 66.0
Unintentional Poisoning Death Rate 27.0 30.1 20.9 ND 14.6 31.0 Drug Poisoning Death Rate 27.6 30.5 20.9 12.0 13.9 31.9
Hospitalizations for Non-Fatal Unintentional Falls 289.1 285.6 139.9 507.2 185.0 301.8
Unintentional Falls Death Rate 16.5 18.3 3.5 ND 10.0 17.4
Hospitalizations for Non-Fatal Motor Vehicle Traffic-Related Injuries 52.9 39.1 59.0 103.4 34.7 48.7
Motor Vehicle Crash Death Rate 9.7 9.2 16.1 ND 5.8 10.9
Hospitalizations for Non-Fatal Traumatic Brain Injuries 82.0 75.0 54.2 116.7 38.0 84.0 Traumatic Brain Injury Death Rate 16.2 17.1 10.6 ND 6.0 18.6
Hospitalizations for Non-Fatal Firearm Injuries 4.9 ND 20.8 ND ND 4.2 Firearms-Related Death Rate 10.4 10.0 14.4 2.5 ND ND
Hospitalizations for Non-Fatal Unintentional Firearm Injuries 2.2 ND 8.2 ND ND 1.6
Unintentional Death Rate Due to Fire 0.0 0.0 0.0 ND 0.0 0.0 Unintentional Drownings Death Rate 1.9 2.3 0.0 ND 1.8 1.9
• Unintentional injury death rate, unintentional poisoning and drug poisoning death rate were highest in those who identify as White and non-Hispanic/Latino. Traumatic brain injury death rate was highest in those who identify as non-Hispanic/Latino (18.6). Residents who identify as White had the highest death rate due to unintentional falls (18.3) and unintentional drownings (2.3). Motor vehicle crash death rate, hospitalizations for non-fatal firearm injuries, firearm-related death rate and hospitalizations for non-fatal unintentional firearm injuries were highest in residents who identify as Black/African American.
• Residents who identify as other race had the highest rates of hospitalizations for non-fatal unintentional falls (507.2), hospitalizations for non-fatal motor vehicle traffic-related injuries (103.4) and hospitalizations for non-fatal traumatic brain injuries (116.7) – much higher than the Seminole County average (289.1, 52.9, 82.0, respectively).
79
Source: Florida Agency for Health Care Administration, 2020
Seminole County White Black/ African American Other Race Hispanic/ Latino NonHispanic/ Latino
Black/African American and Hispanic/Latino communities are disproportionately affected by HIV compared to other racial and ethnic groups. In 2019, the Black/African American community represented 13% of the United States population, but 40% of people with HIV. Hispanic/Latino residents represented 18.5% of the population, but 25% of people with HIV. 39
The data below shows HIV and AIDS diagnoses and death in residents of Seminole County. When looking at rates by race and ethnicity, disparities are seen in those who identify as non-Hispanic/ Latino Black/African American.
Exhibit 57: HIV & AIDS Diagnoses
Adults Less Than 65 Who Have Ever Been Tested for HIV (2019) 49.8% 45.2% 59.5% 59.8% ND Population with HIV (2020) 288.5 170.0 933.9 317.6 280.3 2017-2019 HIV Diagnoses 16.4 8.9 51.7 21.6 14.9 AIDS Diagnoses 7.0 3.1 30.0 7.4 6.9
Source: Florida Department of Health, Bureau of Communicable Diseases
• The population with HIV in Seminole County was 288.5 per 100,000, but by race and ethnicity, those who identify as non-Hispanic/Latino Black/African American had rates over three times higher than in Seminole County (933.9, 288.5, respectively).
• Those who identify as non-Hispanic/Latino Black/African American had the highest HIV and AIDS diagnoses (51.7 and 30.0 per 100,000), approximately three to four times higher than Seminole County (16.4 and 7.0 per 100,000).
Exhibit 58: HIV & AIDS Death Rate
Source: Florida Department of Health. Bureau of Communicable Diseases, 2018-2020
HIV and AIDS death rate among those who identify as Black/African American was nearly four times that of the second highest group (non-Hispanic/Latino) (8.0 and 2.1, respectively).
39 HIV.gov, Impact on Racial and Ethnic Minorities.
2022 COMMUNITY HEALTH NEEDS ASSESSMENT 80
Seminole County Non-Hispanic/ Latino White Non-Hispanic/ Latino Black/ African American Hispanic/ Latino Non-Hispanic/ Latino
Rates Per 100,000
Seminole County White Black/African American Hispanic/ Latino Non-Hispanic/ Latino
1.9 1.2 8.0 0.9 2.1
Per 100,000
Homicide & Suicide
In Seminole County, 2020 homicides rates were 4.0 per 100,000 while suicide rates were 11.4 per 100,000. Both measures are higher than in the previous year, though figures decreased within the Hispanic/Latino community.
Exhibit 59: Homicide & Suicide Deaths by Race
Per 100,000
Homicide 3.3 4.0 2.0 1.9 12.3 16.9 Suicide 10.4 11.4 11.9 12.7 1.2 1.2
Source: Florida Department of Health. Bureau of Vital Statistics
Exhibit 60: Homicide & Suicide Deaths by Ethnicity
Per
Homicide 4.2 3.8 3.0 4.1 Suicide 8.3 4.5 10.8 13.0
Source: Florida Department of Health. Bureau of Vital Statistics
• Homicide rates in 2020 were highest in those who identify as Black/African American (16.9), more than four times higher than the Seminole County average (4.0).
• Suicide rates in Seminole County in 2020 were highest in those who identify as White at 12.7 per 100,000.
81
Seminole County White Black/African American 2019 2020 2019 2020 2019 2020
100,000 Hispanic/Latino Non-Hispanic/Latino 2019 2020 2019 2020
Photo courtesy of Seminole County Government
Maternal Health
Historically, maternal mortality in the United States has been a key indicator of the overall health of a population. Maternal mortality reflects the whole health system and illustrates the socio-cultural, political and economic philosophy of society. Over the past two decades, the United States maternal mortality rate has not improved while maternal mortality rates have decreased for other regions of the world. Significant racial and ethnic disparities persist in both the rate of women in the United States who die due to complications of pregnancy or delivery and the rate that women experience negative health consequences due to unexpected pregnancy or childbirth outcomes.40
Severe Maternal Morbidity is the presence of a complication during a hospital delivery. Complications during pregnancy or delivery can lead to negative outcomes for the woman and the infant. Monitoring the trend and disparities in severe maternal morbidity allows public health and medical professionals to take steps to improve the health of women and children.
Exhibit 61: Maternal Fatalities 41
Per 100,000 Live Births Seminole
Hispanic/ Latino NonHispanic/ Latino Maternal Mortality per 100,000 live births 21.8 20.2 44.9 ND 58.1 9.7 Severe Maternal Morbidity per 1,000 delivery hospitalizations 13.2 10.2 18.0 17.8 12.8 13.4
Source: Florida Department of Health. Bureau of Vital Statistics, 2018-2020
• In Seminole County, the maternal mortality rate was 21.8 per 100,000 births while severe maternal morbidity was 13.2 per 1,000 delivery hospitalizations.
• Maternal mortality was highest in women who identify as Black/African American and Hispanic/Latino (44.9, 58.1, respectively), much higher than in Seminole County (21.8). Women who identify as Black/African American and other race had the highest rates of severe maternal morbidity (18.0, 17.8, respectively).
40 United States Commission on Civil Rights 2021 Statutory Enforcement Report, Racial Disparities in Maternal Health.
41 Maternal Deaths, Rate Per 100,000 Live Births. Severe Maternal Morbidity, Rate Per 1,000 Delivery Hospitalizations
2022 COMMUNITY HEALTH NEEDS ASSESSMENT 82
County White Black/African American Other Race
Exhibit 62: Prenatal Care
Births to Mothers with First-Trimester Prenatal Care 80.1% 81.9% 71.7% ND 77.7% 80.9%
Births to Mothers with No Prenatal Care 1.5% 1.2% 3.2% ND 1.3% 1.6%
Florida Department of Health. Bureau of Vital Statistics, 2018-2020

• More than three-quarters of pregnant mothers received first-trimester prenatal care (80.1%).
• A very small percentage of mothers received no prenatal care (1.5%).
• Women with the lowest percentage of receiving first-trimester prenatal care were women who identify as Black/African American (71.7%).
• Women who identify as Black/African American made up the highest percentage of women who received no prenatal care (3.2%).
83
Seminole County White Black/African American Other Race Hispanic/ Latino NonHispanic/ Latino
Fort Mellon Park | Seminole County
In Seminole County, mothers between the ages of 15 and 19 who were not married make up the largest percentage of women giving birth in that age group (93.1%).
Exhibit 63: Maternal Characteristics
Repeat Births to Mothers Ages 15-19 10.7% 10.4% 13.4% ND 10.4% 10.9%
Births to Unwed Mothers Ages 15-19 93.1% 90.0% 98.3% ND 95.1% 91.8%
Births to Unwed Mothers Ages 15-44 36.9% 32.9% 67.1% ND 46.8% 33.6%
Births to Mothers Who Are Underweight at the Time Pregnancy Occurred42 3.4% 3.3% 2.3% ND 3.2% 3.4%
Births to Mothers Who Are Overweight at the Time Pregnancy Occurred43 25.9% 26.5% 24.4% ND 30.5% 24.4%
Births to Mothers Who Are Obese at Time Pregnancy Occurred44 26.2% 25.0% 39.3% ND 28.9% 25.1%
Births with Inter-Pregnancy Interval45 34.0% 34.6% 36.4% ND 30.8% 35.0%
Source: Florida Department of Health. Bureau of Vital Statistics, 2018-2020
• Approximately 26.2% of all mothers were obese at the time pregnancy occurred.
• Those who identify as Black/African American are more likely to be unwed mothers than other races in Seminole County.
• Approximately 13.4% of Black/African American teen mothers between the ages of 15 and 19 had given birth to multiple children, 98.3% of Black/African American teen mothers ages 15 to 19 were not married and 67.1% of Black/African American mothers aged 15 to 44 were not married.
42BMI <18.5
43 BMI 25.0-29.9
44 BMI >= 30
45 < 18 Months.
2022 COMMUNITY HEALTH NEEDS ASSESSMENT 84
Seminole County White Black/African American Other Race Hispanic/ Latino NonHispanic/ Latino
In Seminole County, the three-year cumulative sum, 2018 to 2020, indicates that just over 9% of infants were born preterm, 7.5% of infants were born at low birth weight, 1.4% of infants were born at very low birth weight and 86.3% of infants of very low birth weight were born in subspeciality perinatal centers. County-wide rates of fetal deaths were 6.7 per 1,000 deliveries, infant deaths were 6.3 per 1,000 deliveries and sudden unexpected infant deaths were one per 1,000 deliveries.
Exhibit 64: Infant Characteristics
Preterm Births46
Seminole County White Black/ African American Other Race Hispanic/ Latino NonHispanic/ Latino
9.4% 8.4% 14.2% ND 8.4% 9.8%
Very Low Birth Weight Infants Born in Subspecialty Perinatal Centers 86.3% 88.0% 85.2% ND 90.9% 85.3%
Low Birth Weight47 7.5% 5.9% 13.3% ND 6.2% 7.9%
Very Low Birth Weight48 1.4% 1.1% 2.7% ND 1.3% 1.4%
Source: Florida Department of Health. Bureau of Vital Statistics, 2018-2020
Exhibit 65: Fetal & Infant Fatalities
Source: Florida Department of Health. Bureau of Vital Statistics, 2018-2020
• Women who identify as Black/African American had the highest percentage of preterm births (14.2%), births to infants of low birth rate (13.3%) and infants of very low birth weight (2.7%) – higher than Seminole County (9.4%, 7.5%, 1.4%, respectively).
• Women who identify as Black/African American had higher rates of fetal death, infant deaths and sudden unexpected infant deaths (11.1, 15.7, 3.1, respectively) than Seminole County (6.7, 6.3, 1.0, respectively).
46 < 37 Weeks of Gestation. 47<2500 Grams. 48< 1500 Grams.
85
Per
Deliveries
Fetal Deaths 6.7 5.6 11.1 ND 5.5 6.7 Infant Deaths (0-364 days) 6.3 4.1 15.7 ND 4.9 6.3 Sudden
Infant Deaths 1.0 0.6 3.1 ND 0.9 1.1
1,000
Seminole County White Black/ African American Other Race Hispanic/ Latino NonHispanic/ Latino
Unexpected
Community Survey Highlights
The community survey conducted for the CFC included over 4,000 total responses. As shown below, there were 639 responses from Seminole County residents.
Exhibit 66: Survey Responses by County
In which county do you live?
County Responses Total Percent Net Percent Cumulative Percent
Lake 266 6.2 7.2 7.2 Orange 822 19.3 22.2 29.4 Osceola 1,729 40.5 46.7 76.2 Seminole 639 15.0 17.3 93.4 Other 243 5.7 6.6 100.0
Total 3,699 86.7 100.0 No Response 565 13.3 Total 4,264 100.0
As a result of the survey, the highest priority needs included the following: 1. Affordable, quality housing 2. M ental health care services for seniors 3. Suicide prevention 4. Recruitment and retention of culturally diverse and informed providers who demographically reflect the community 5. Dental care for children, especially those from low income or other priority communities 6. C ommunity services to reduce illegal drug use and abuse or misuse of prescription medications 7. Access to free or low-cost health care services for all residents 8. Access to primary care services 9. Support for family members of a person being treated for substance use disorder 10. M ental health outpatient services capacity 11. M ental health crisis services and community awareness of available resources 12. Childcare services, especially for children with special needs 13. Youth mental health services 14. Suicide prevention initiatives in middle and high schools 15. M ental health and substance use disorder transition care for inmates being released f rom jail
2022 COMMUNITY HEALTH NEEDS ASSESSMENT 86
Prioritization Process Summary
As noted above, the secondary data analysis, qualitative research and community survey generated a list of approximately 50 granular needs. The needs were then prioritized by a group of Seminole County leaders using the Modified Delphi method (i.e., a three-stage mixed qualitative and quantitative) process. The results of the prioritization process yielded a rank-ordered set of prioritized needs falling into five specific categories. The top 15 granular needs were then folded under the five specific categories. Please see the results below.
Top Five Needs
• Increase system capacity
• Enhance Mental Health (including substance use disorder) outreach and treatment
• Streamline access to care
• Refine primary care and specialized medical care (e.g., chronic conditions) services
• Address housing and other social determinants
Top 15 Granular Issues
1. Support for additional affordable, quality housing – affects recruitment and retention of culturally diverse and informed providers, as well as access to free or low-cost health care for families
2. Information sharing among providers
3. Mental health outpatient services capacity
4. Mental health crisis services and community awareness of available resources
5. Case managers, Community Health Workers and similarly credentialed professionals to guide high-need patients
6. Mental health stigma reduction
7. Mental health inpatient bed capacity
8. Co-located case managers and behavioral health providers at community-based primary care sites
9. Behavioral health outpatient services for children
10. Integrated community collaborations (e.g., schools, Criminal Justice System, health care providers and Public Health Departments) to share information and ultimately identify and more efficiently serve high-need community members
11. Access to free or low-cost health care services for all residents
12. Access to healthy food 13. Youth mental health services 14. Suicide prevention.
15. Mental health and substance use disorder transition care for inmates being released from jail.
87
Top 15 Granular Issues within the Five Top Needs
Increase system capacity 3. Mental health outpatient services capacity 7. Mental health inpatient bed capacity
Enhance Mental Health (including substance use disorder) outreach and treatment 4. Mental health crisis services and community awareness of available resources 9. Behavioral health outpatient services for children 13. Youth mental health services 14. Suicide prevention 15. Mental health and substance use disorder transition care for inmates being released from jail
Streamline access to care 11. Access to free or low-cost health care services for all residents
Refine primary care and specialized medical care (e.g., chronic conditions) services 2. Information sharing among providers 5. Case managers, Community Health Workers and similarly credentialed professionals to guide high-need patients 6. Mental health stigma reduction 8. Co-located case managers and behavioral health providers at community-based primary care sites 10. Integrated community collaborations (e.g., schools, Criminal Justice System, health care providers and Public Health Departments) to share information and ultimately identify and more efficiently serve high-need community members
Address housing and other social determinants
1. Support for additional affordable, quality housing – affects recruitment and retention of culturally diverse and informed providers, as well as access to free or low-cost health care for families 12. Access to healthy food
2022 COMMUNITY HEALTH NEEDS ASSESSMENT 88

89
Reiter Park | Seminole County
Community Asset Inventory
For an up-to-date list of resources in your community, please visit: Findhelp.org
Basic Needs Assistance Organization
Contact Information
Arab American Community Center
Catholic Charities of Central Florida
Center for Multicultural Wellness and Prevention
Christian Service Center of Central Florida
Community Hope Center
Harvest Time International
Heart of Florida United Way
Second Harvest Food Bank of Central Florida
The Salvation Army
The Sharing Center
United Against Poverty/ UP Orlando
407-985-4550 aaccflorida.org 407-658-1818 cflcc.org 407-648-9440 cmwp.org 407-425-2523 christianservicecenter.org 321-677-0245 hope192.com 407-328-9900 harvesttime.org 407-835-0900 hfuw.org 407-295-1066 feedhopenow.org 407-423-8581 salvationarmyorlando.org 407-260-9155 thesharingcenter.org 407-650-0774 communityfoodoutreach.org
Services Overview
Eligibility/Insurance, employment Services, Immigration/Refugee Services, Legal Services, Abuse, Domestic Violence
Access to Care, Behavioral Health, Emergency Services, Immigration/ Refugee Services, Human Trafficking Services, Elder Services
Housing and Homeless Services, HIV/AIDS, Mental Health, Access to Care, Chronic Disease
Food Assistance, Housing and Homeless Services, Emergency Services
Housing and Homeless Services, Employment Services, Food Assistance, Legal Services
Food Assistance, Emergency Services Resource Connection
Food Assistance
Housing and Homeless Services, Emergency Services
Food Assistance, Housing and Homeless Services
Emergency Services, Mental Health, Education, Food Assistance
2022 COMMUNITY HEALTH NEEDS ASSESSMENT 90
91
Seminole County Heroes Memorial | Seminole County
Florida Department of Health

Organization
Contact Information
407-665-3000 seminole.floridahealth.gov
Overview
Cancer, Dental, Women’s Health, HIV/AIDS, STI, Primary Care, Immigration/ Refugee Services, Chronic Disease, Child Services
Federally Qualified Health Center (FQHC)
Contact Information
Overview
Primary Care, Pediatric Care, Women’s Health, Eligibility/ Insurance, Laboratory, Dental
Primary Care, Pediatrics, Dental, Behavioral Health
2022 COMMUNITY HEALTH NEEDS ASSESSMENT 92
Florida Department of Health in Seminole County Organization True Health Orange Blossom Family Health
407-322-8645 mytruehealth.org 407-428-5751 obfh.org
Photo courtesy of Seminole County Government
Children and Youth Organizations
Organization
Boys and Girls Club of Central Florida
Boys Town Central Florida
Central Florida Urban League
Children’s Home Society of Florida
Department of Children and Families
Embrace Families
Contact Information
Overview
Give Kids the World
407-841-6855 bgccf.org 407-588-2170 Boystown.org/locations/ central-Florida/programs 407-842-7654 cful.org 407-846-5220 chsfl.org/ 1-800-962-2873 reportabuse.dcf.state.fl.us 321-207-8200 embracefamilies.org 407-396-1114 gktw.org
Youth Engagement
Housing and Homeless Services (Youth), Mental Health (Youth)
Youth Engagement
Child Services, Mental Health
Report child abuse, child services
Child Services
Children with critical illnesses and their families
Healthy Start Coalition Kids House
New Hope for Kids
YMCA of Central Florida
Zebra Coalition
Lake : healthystartlake.org Orange: healthystartorange.org Osceola: healthystartosceola.org Seminole: healthystartseminole.org 407-324-3036 kidshouse.org 407-331-3059 Newhopeforkids.org 407-896-9220 ymcacentralflorida.com 407-228-1446 zebrayouth.org
Education and care coordination to pregnant women and families of children under the age of three
Abuse (Child), Mental Health (Youth), Child Services
Mental Health, Grief Counseling, Children with critical illnesses
Youth Engagement
Housing and Homeless Services, Mental Health for youth ages 13-24 LGBTQIA+
93
Mental & Behavioral Health
Organization
Aspire Health Partners
Devereux IMPOWER
Mental Health Association of Central Florida
National Alliance on Mental Illness (NAMI)
Orlando Behavioral Health Park Place
Contact Information
407-245-0045 aspirehp.org
1-800-338-3738 Ext. 77130 devereux.org 407-304-3444 impowerfl.org
407-898-0110 mhacf.org 407-253-1900 namiflorida.org
orlandobehavioral.com
407-846-0068; 407-846-0023; 321-402-0690 ppbh.org
Overview
Mental Health, Substance Use, HIV/AIDS
Mental Health, Substance Use, Chronic Disease (Diabetes), Child Services
Child Services, Mental Health (Youth), Behavioral Health (Youth)
Substance Use, Mental Health
Mental and Behavioral Resources
Mental Health, Substance Use
Mental Health, Substance Use
2022 COMMUNITY HEALTH NEEDS ASSESSMENT 94
Life Skills/Job Training
Organization
Adult Literacy League
Career Source of Central Florida Center for Independent Living Central Florida Employment Council

Division of Vocational Rehabilitation Employ Florida
Goodwill Industries of Central Florida, Inc.
Contact Information
407-422-1540 adultliteracyleague.org 407-531-1222 careersourcecentralflorida.com 407-623-1070 cilorlando.org 407-834-4022 cfec.org 407-846-5260; 407-897-2725 rehabworks.org
1-800-438-4128 employflorida.com 407-857-0659 goodwillcfl.org
Overview
Education
Employment Services
Disabled Adults, Employment Services
Employment Services
Employment Services, Disabled Adults
Employment Services Employment Services, Education
95
Photo courtesy of Seminole County Government
Clinics and Other Healthcare Providers
Organization
Contact
Grace Medical Home Healthcare Access Alliance
Hispanic Health Initiatives Hope and Help Center of Central Florida

Planned Parenthood
Shepherd’s Hope
The Orlando Veterans Affairs Medical Center
Information
407-936-2785 gracemedicalhome.org 407-952-9233 healhaccessall.org 386-320-0110 hhi2001.org 407-645-2576 hopeandhelp.org 407-246-1788 plannedparenthood.org 407-876-6701 shepherdshope.org 407-631-1000 orlando.va.gov
Overview
Primary Care, Dental, Mental Health, Laboratory, Chronic Disease, Housing and Homeless Services
Primary Care, Resource Connection
Chronic Disease (Diabetes), Food Assistance, Cancer, Primary Care
HIV/AIDS, STI, Primary Care
Women’s Health, HIV/AIDS, STI
Primary Care
Veteran Services, Employment Services, Primary Care, Mental Health
2022 COMMUNITY HEALTH NEEDS ASSESSMENT 96
Photo courtesy of Seminole County Government
Housing/Homelessness
Organization
Central Florida Commission on Homelessness
Coalition for the Homeless of Central Florida
Covenant House
Contact Information
Overview
Dave’s House
Family Promise of Greater Orlando
Habitat for Humanity
Homeless Services Network of Central Florida
Hope Helps, Inc.
IDignity
Orlando Union Rescue Mission
Rescue Outreach Mission of Central Florida
Samaritan Resource Center
Wayne Densch Center
321-710-4663 www.cfchomelessness.org 407-652-5300 Centralfloridahomeless.org 1-800-441-4478 covenanthousefl.org 407-457-1282 daveshouseevents.org 407-893-4580 familypromiseorlando.org habitatorlandoosceola.org habitatseminoleapopka.org
407-893-0133 hsncfl.org 407-366-3422 hopehelps.org 407-792-1374 idignity.org 407-423-3596 Ext. 2100/2105 ourm.org 407-321-8224 rescueoutreachcfl.org 407-482-0600 samaritanresourcecenter.org
407-599-3900 abilityhousing.org/waynedensch-center
Housing and Homeless Services
Housing and Homeless Services
Housing and Homeless Services
Housing and Homeless Services
Housing and Homeless Services
Housing and Homeless Services
Housing and Homeless Services
Housing and Homeless Services
Housing and Homeless Services
Housing and Homeless Services, Food Assistance
Housing and Homeless Services, Food Assistance
Housing and Homeless Services
Housing and Homeless Services, Mental Health, Substance Use
97
Resources Phone Numbers and Crisis Lines
Organization
Contact Information
Overview
Adverse Childhood Experiences (ACEs)
www.acesconnectioninfo.com
PACEs Connection is a social network that recognizes the impact of a wide variety of adverse childhood experiences (ACEs) in shaping adult behavior and health, and that promotes trauma-informed and resilience-building practices and policies in all families, organizations, systems and communities.
Crisis Text Line Findhelp.org
Lesbian, Gay, Bisexual and Transgender (LGBT) National Help Center
National Domestic Violence 24 Hr. Hotline
National Drug Abuse National Elder Abuse Resources National Human Trafficking Hotline
Text HOME to 741741 https://www.crisistextline.org/ https://www.findhelp.org/ 1-888-843-4564 https://www.glbthotline.org/ 1-800-787-3224
Crisis Text Line provides free, 24/7 support via text message. We’re here for everything: anxiety, depression, suicide, school.
Search and connect to support for financial assistance, food pantries, medical care and other free or reduced-cost help
Serving the lesbian, gay, bisexual, transgender, queer and questioning community by providing free & confidential peer-support and local resources
Hotline for domestic violence and abuse
1-800-662-4357 (HELP) https://www.samhsa.gov/ 1-855-500-3537 (ELDR) https://ncea.acl.gov/ 1-888-373-7888
Support, information, advice, & referrals to address substance use and mental health
The NCEA provides the latest information regarding research, training, best practices, news and resources on elder abuse, neglect and exploitation to professionals and the public.
Abuse, Domestic Violence, Human Trafficking Services
2022 COMMUNITY HEALTH NEEDS ASSESSMENT 98
National Sexual Assault
National Suicide Prevention Lifeline United Way 211 Veterans Crisis Line
1-800-656-4673 (HOPE) https://www.rainn.org/
1-800-273-8255 https://suicideprevention lifeline.org/
Dial 211 https://www.hfuw.org/ gethelp/
1-800-273-8255 https://www.veterans crisisline.net/
Support, information, advice, & referrals to address sexual assault
The Lifeline provides 24/7, free and confidential support for people in distress and prevention and crisis resources
Local resources to address financial assistance, health programs, crisis support and more.
24/7 confidential crisis support for veterans and their loves ones
99
Photo courtesy of Seminole County Government
As noted at the beginning of this facility report, the document provides a synopsis of the larger, more comprehensive Central Florida Collaborative report. The larger report includes much more extensive data sets, CFC organizational profiles, qualitative research analysis, and more. For additional information, please reference the Central Florida Collaborative Community Health Needs Assessment available at https://www.orlandohealth.com/about-us/community-involvement/ community-benefit .
2022 COMMUNITY HEALTH NEEDS ASSESSMENT 100
Healthy Seminole Collaborative Meeting | Seminole County
101
COMMUNITY HEALTH NEEDS ASSESSMENT