Flatiron NoMad Partnership - Q2 2023 Mobility Report

Page 1

Q2 2023 Mobility Report

Data Locations

Pedestrian Counts

(By location)

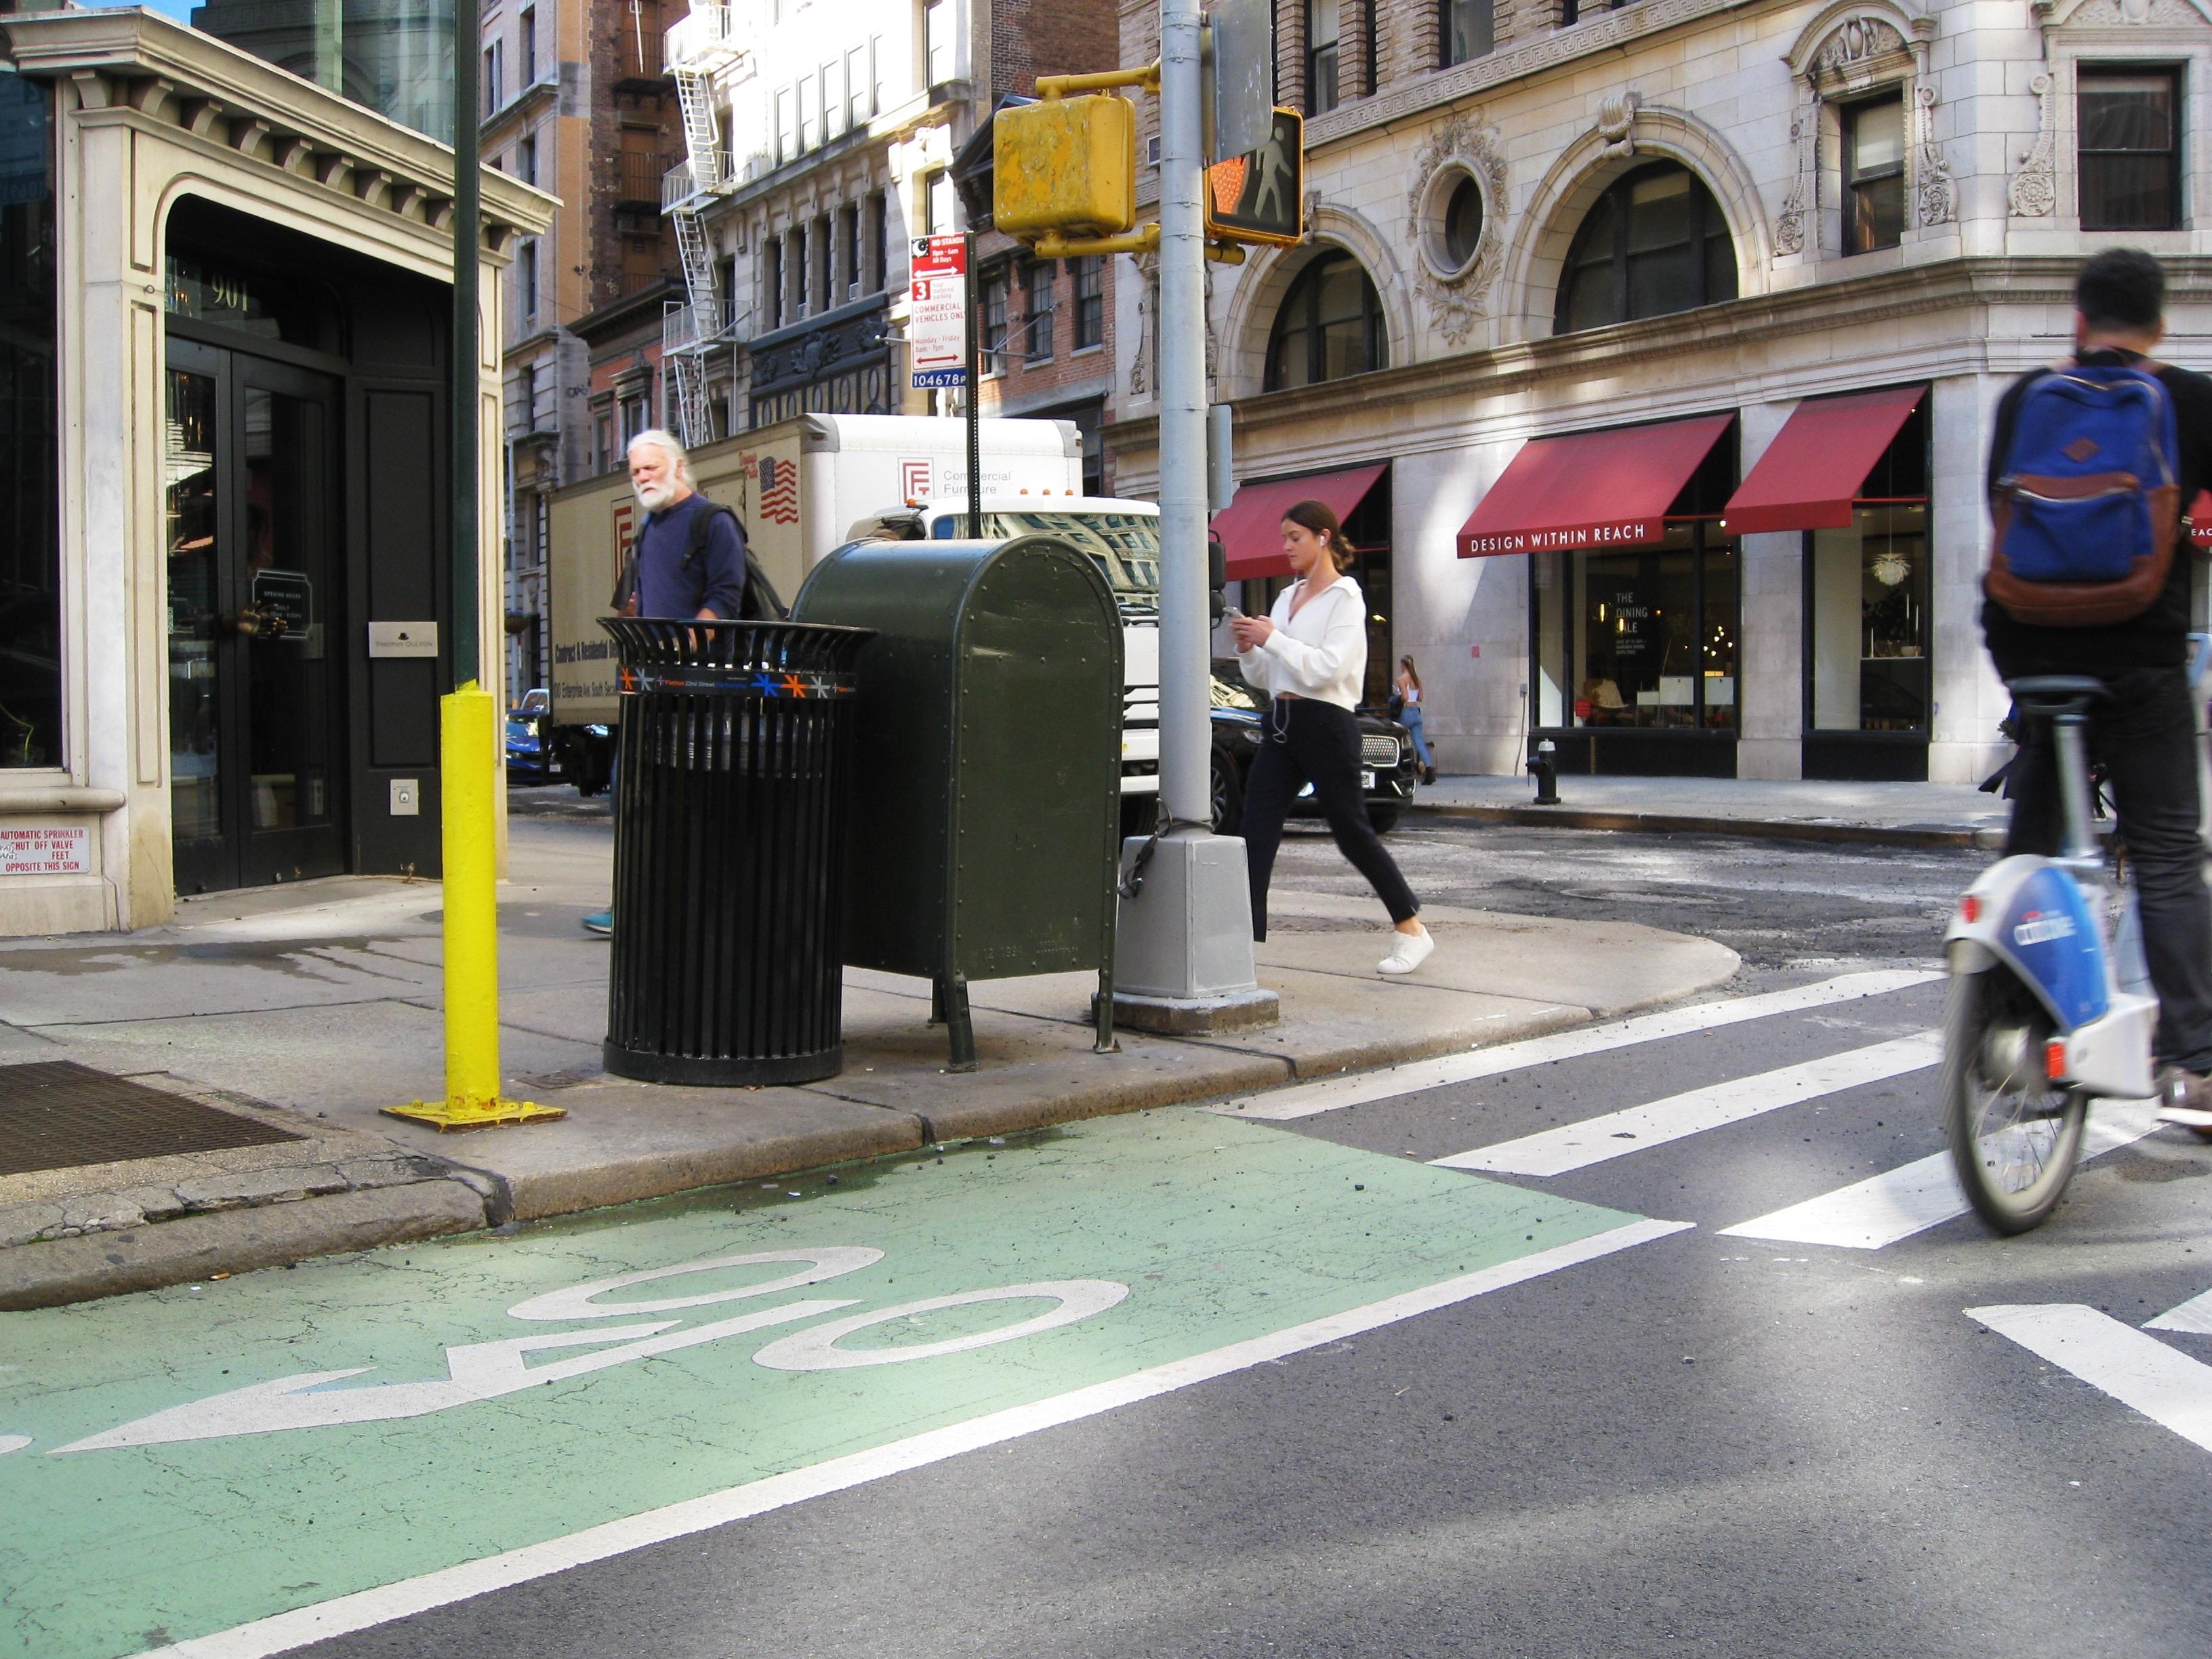
Pedestrian counts at the Flatiron Public Plazas decreased from May to June by 16 4%, due in part to poor air quality days Foot traffic at 28th Street and Park Avenue South gradually increased throughout Q2 with June seeing 62,000+ counts per day (18% increase over March 2023).

DAY-OF-WEEK (JUNE 2023)

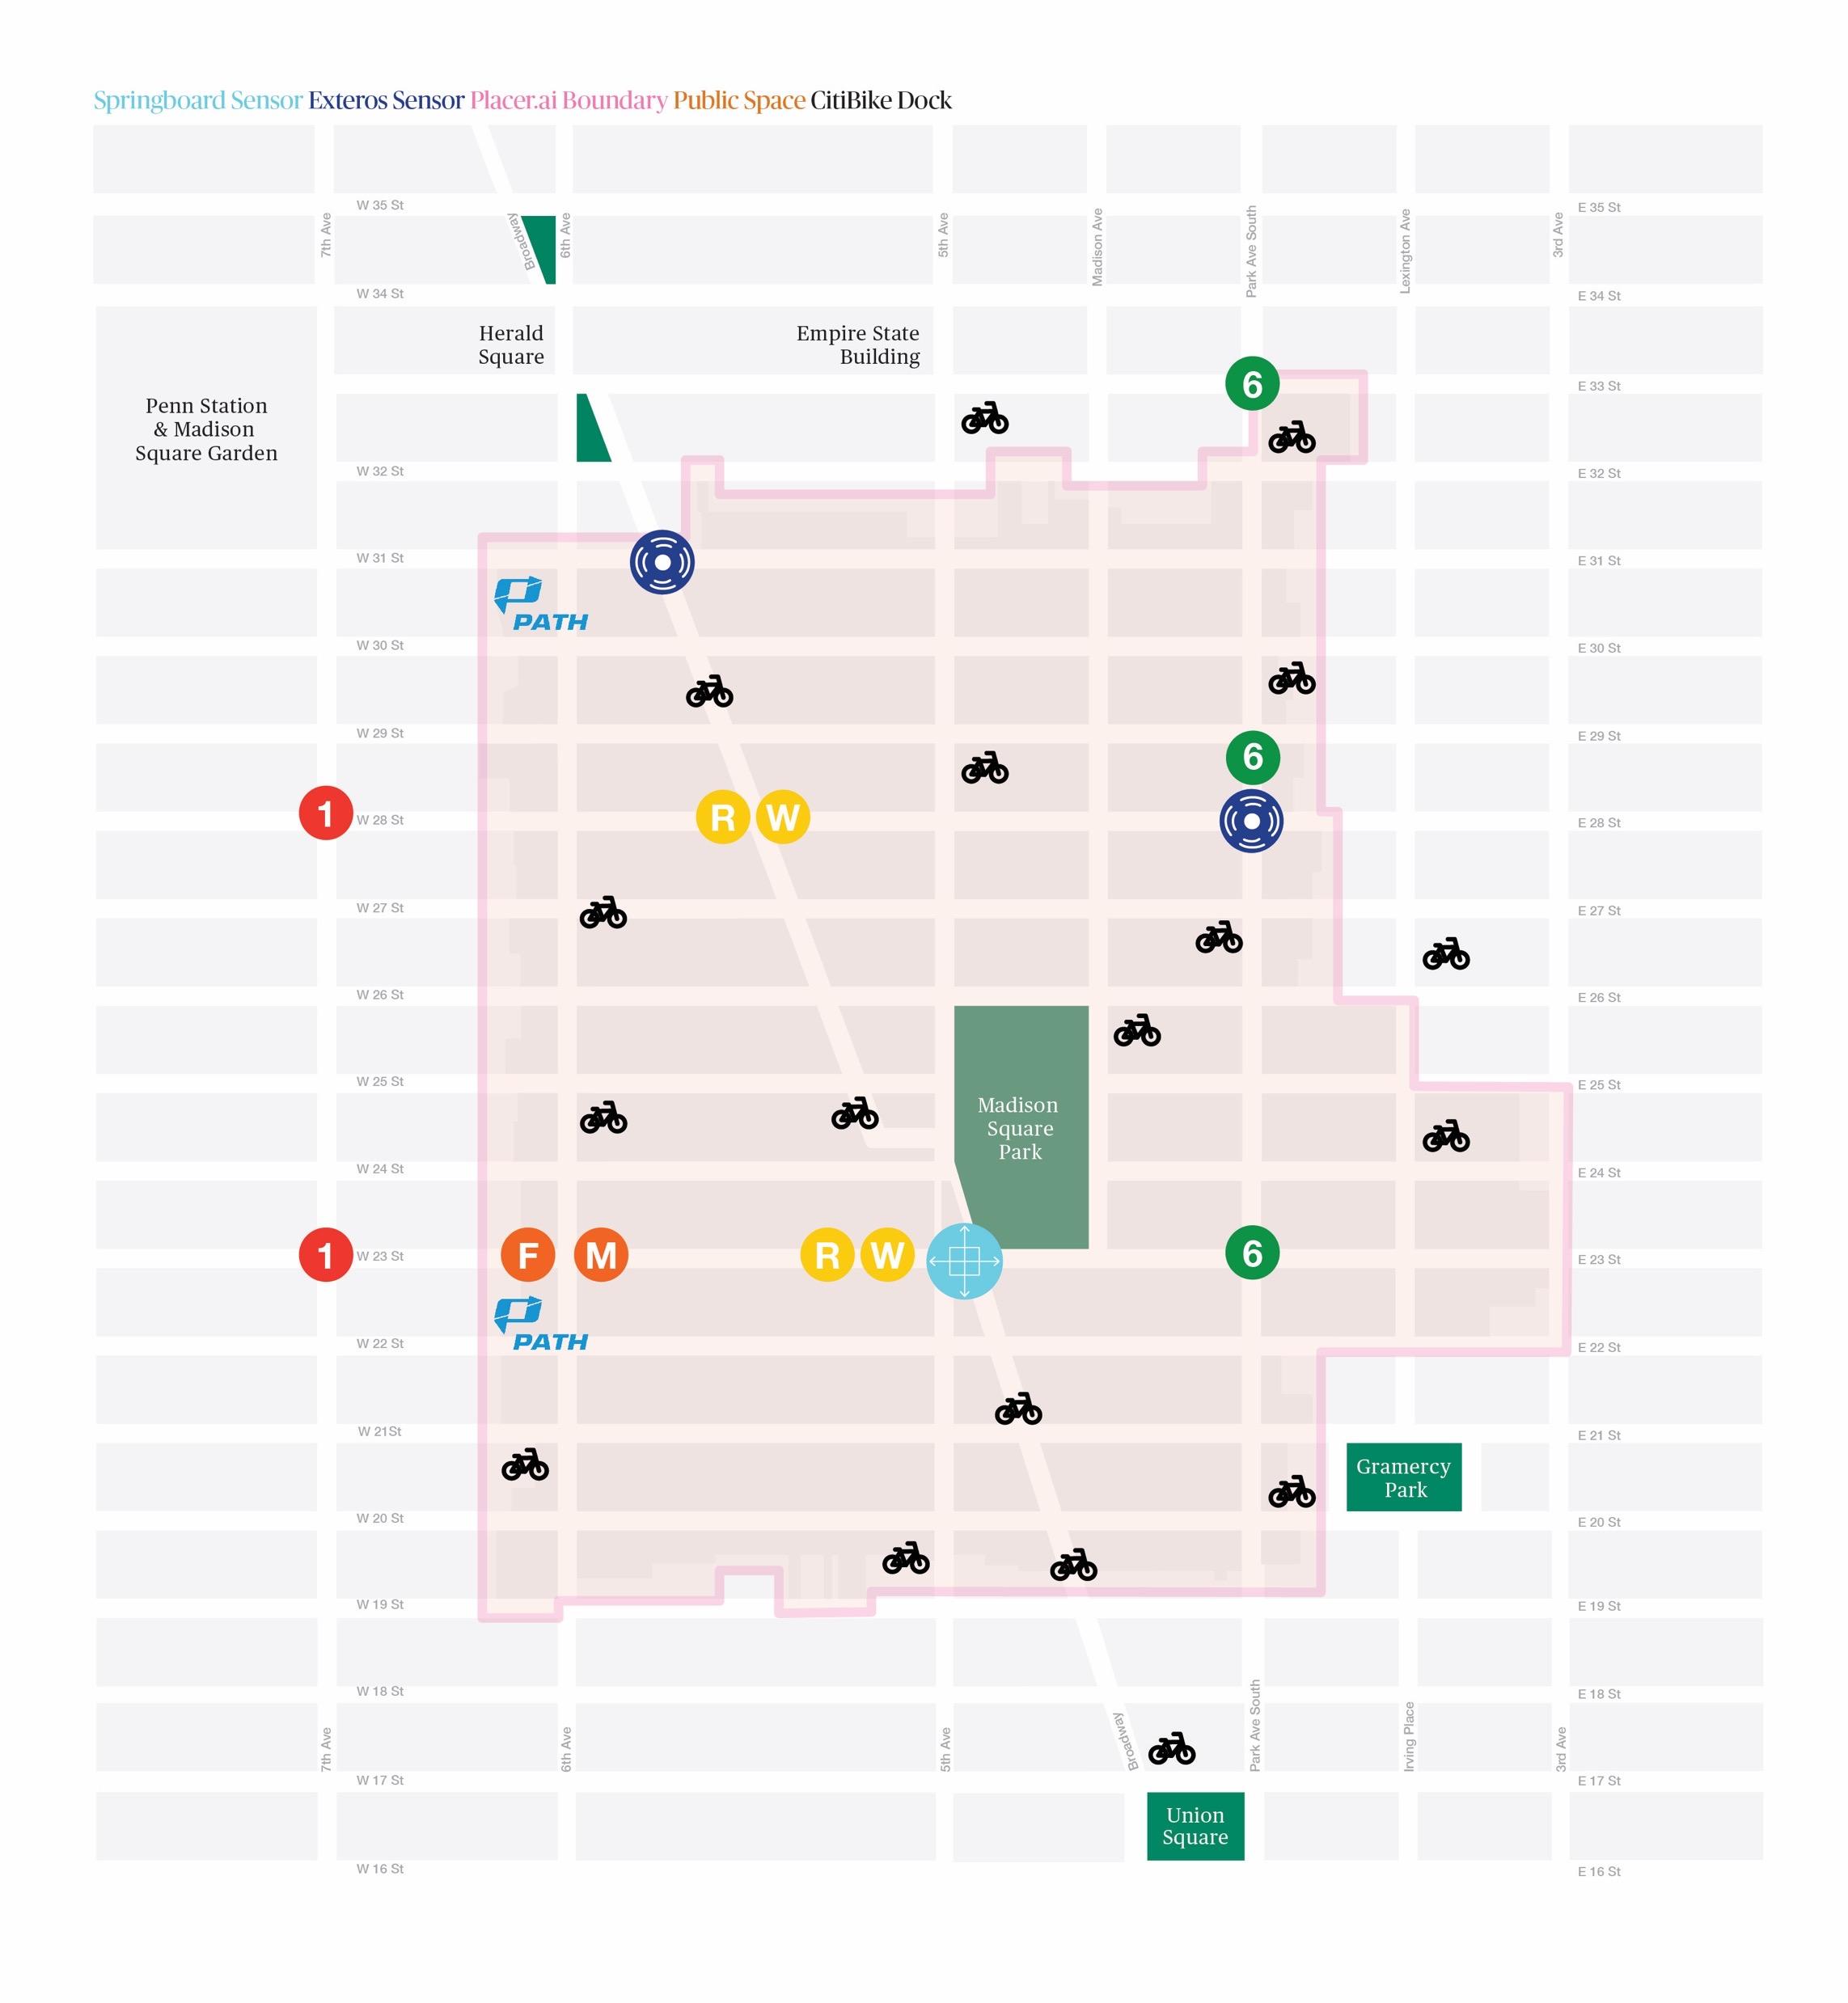
Plazas (Springboard) Park Avenue South/28th (Exteros) Broadway/31st (Exteros)

AVERAGE Plazas
*Exteros data began in October 2022
DAILY
(Springboard) Park Avenue South/28th (Exteros) Broadway/31st (Exteros)
35 42.3 43.2 40.1 43.7 47.3 49.8 49.5 49 38.6 45.6 41 42.4 46 52.9 56.2 59.7 62.3 54.2 58.8 57.7 52.6 55.6 58.1 56.9 57.9 48.4 30 35 40 45 50 55 60 65 Oct-22 Nov-22 Dec-22 Jan-23 Feb-23 Mar-23 Apr-23 May-23 Jun-23 Q4 2022 Q1 2023 Q2 2023 Thousands 44 48 49 43 68 66 50 47 59 74 72 89 79 48 49 47 52 49 63 54 49 25 35 45 55 65 75 85 95 Sunday Monday Tuesday Wednesday Thursday Friday Saturday Thousands June pedestrian counts peaked on THURSDAYS

Neighborhood Trends: Recovery Rates Stabilizing

TRENDS & RECOVERY (2019 – 2023)

106% recovery

80% recovery 64% recovery

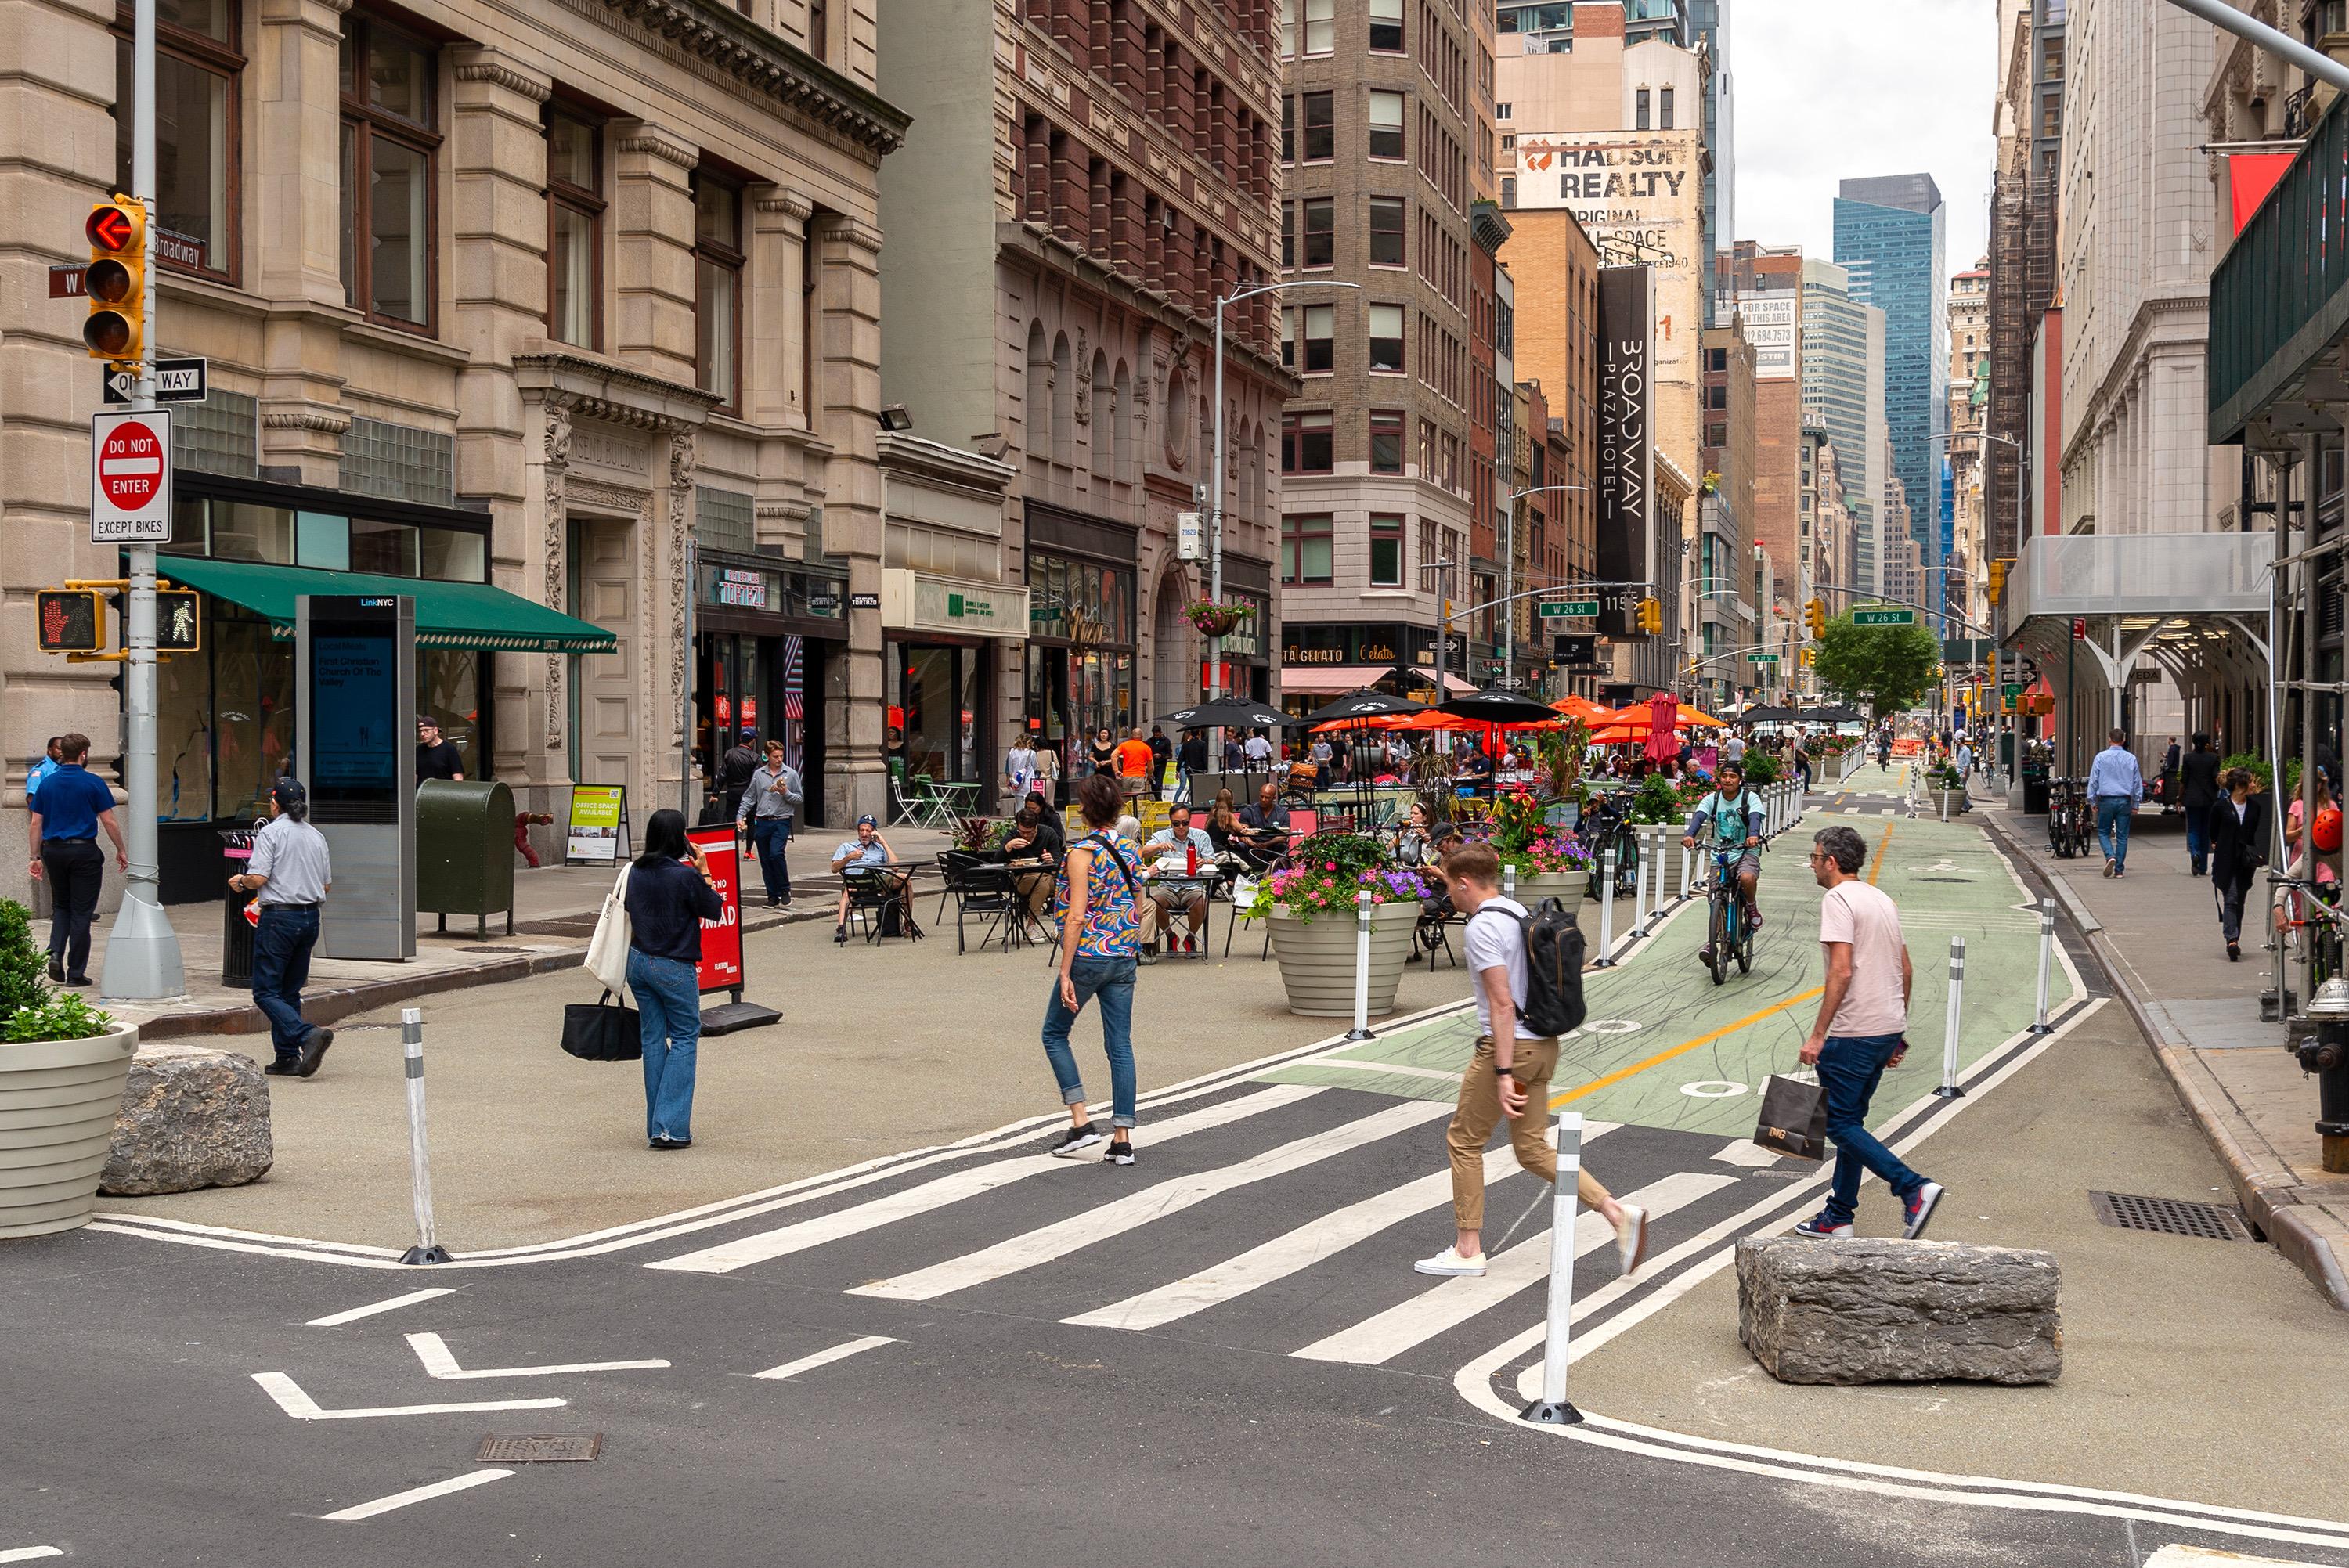
Visitation trends and 2019 recovery rates have stabilized since Q4 2022, averaging 105% for residential, 77% for visitors and shoppers, and 67% for employees This quarter, 14 7 million people visited Flatiron and NoMad, averaging 161,000+ people per day.

DAY-OF-WEEK VISITATION (2023)

January 2023 February 2023 March 2023 April 2023 May 2023 June 2023 Dashed: June 2019

Flatiron and NoMad’s weekly visit trends distribution curve is flattening as weekend visitation rises and mid-week visitation stabilizes. Weekday visit trends remain lower than pre-pandemic levels with return-to-office stabilizing at 67%. Tuesday through Thursday remain the busiest workdays in 2023, staying within a range of 11% change (+/- 19,000 visits per day) each month excluding January 2023 weekend visitation is on par with 2019 levels

75 95 115 135 155 175 195 215 235 255 275 Sunday Monday Tuesday Wednesday Thursday Friday Saturday Thousands
Shoppers
Employees (weekdays) Residents
Visitors /
Full–Time
*Source: Placer.ai
JUNE RECOVERY 0% 20% 40% 60% 80% 100% 120% Oct-19 Dec-19 Feb-20 Apr-20 Jun-20 Aug-20 Oct-20 Dec-20 Feb-21 Apr-21 Jun-21 Aug-21 Oct-21 Dec-21 Feb-22 Apr-22 Jun-22 Aug-22 Oct-22 Dec-22 Feb-23 Apr-23 Jun-23 Q4 2019 Q1 2020 Q2 2020 Q3 2020 Q4 2020 Q1 2021 Q2 2021 Q3 2021 Q4 2021 Q1 2022 Q2 2022 Q3 2022 Q4 2022 Q1 2023 Q2 2023

Corridor Highlight:

*Source: Placer.ai

Interested in Flatiron and NoMad retail space? Check out our Retail Opportunities Map or email nmandel@flatironnomad.nyc. 0% 20% 40% 60% 80% 100% 120% Oct-19 Dec-19 Feb-20 Apr-20 Jun-20 Aug-20 Oct-20 Dec-20 Feb-21 Apr-21 Jun-21 Aug-21 Oct-21 Dec-21 Feb-22 Apr-22 Jun-22 Aug-22 Oct-22 Dec-22 Feb-23 Apr-23 Jun-23 Q4 2019 Q1 2020 Q2 2020 Q3 2020 Q4 2020 Q1 2021 Q2 2021 Q3 2021 Q4 2021 Q1 2022 Q2 2022 Q3 2022 Q4 2022 Q1 2023 Q2 2023
80% recovery 101% recovery JUNE RECOVERY

Citi Bike

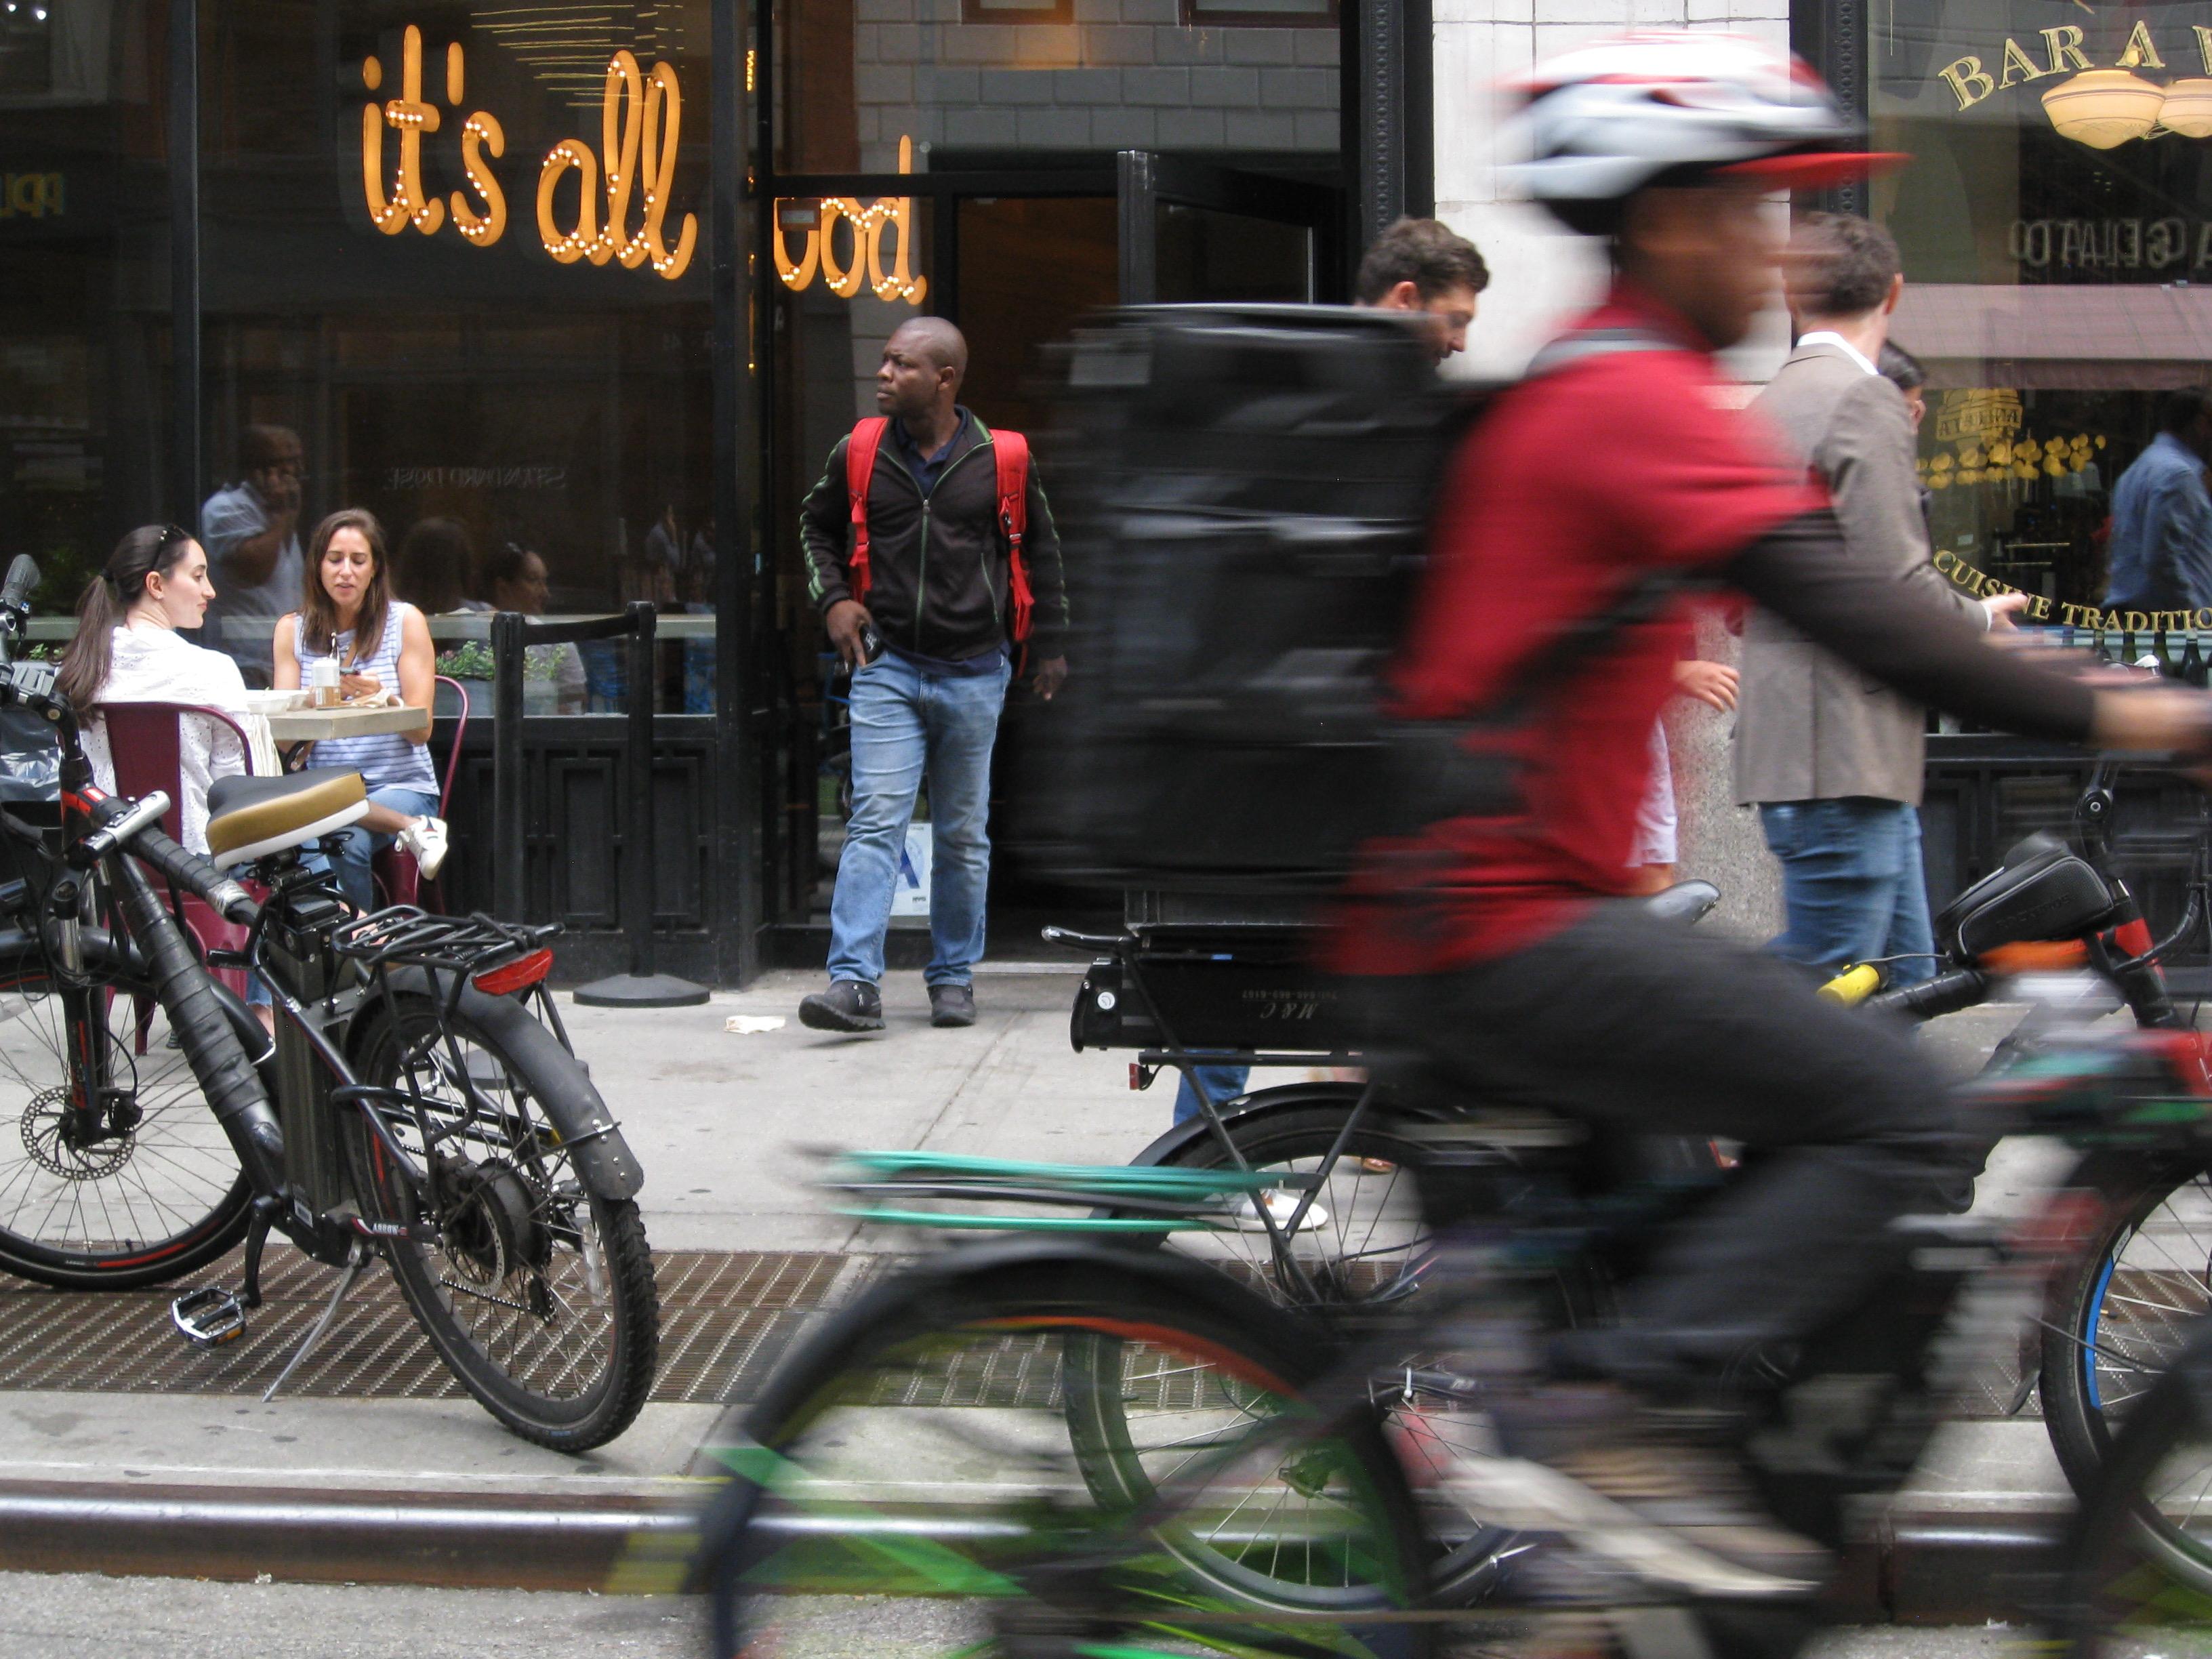
Citi Bike ridership outpaced 2019 levels for the second consecutive quarter, averaging 7,209 rides per day in Q2.

BUSIEST STATIONS IN Q2 2023 NEW & EXPANDED STATIONS

• 6th Avenue & 21st Street (806 rides / day)

• 6th Avenue & 33rd Street (636 rides / day)

• Broadway & 17th Street (633 rides / day)

• Broadway & 21st Street (631 rides / day)

• 6th Avenue & 18th Street (523 rides / day)

• 6th Avenue & 27th Street (Q2 2023)

• Broadway & 29th Street (Q2 2023) - EXPANDED

• 5th Avenue & 20th Street (Q1 2023)

• Broadway & 19th Street (Q2 2022)

7,209 4,699 5,436 7,609 6,474 3,497 4,080 5,331 4,522 2,257 3,553 4,418 1,805 3,376 6,090 8,530 6,869 4,547 Q4 Q3 Q2 Q1
CITI BIKE RIDERSHIP 2019 2020
2022 2023
2021
*Daily Averages
105% recovery compared to 2019
NICOLE MANDEL Economic Development & Research Manager nmandel@flatironnomad.nyc 212.741.2323 x 105 FLATIRON NOMAD PARTNERSHIP 230 Fifth Avenue, Suite 1511 New York, New York 10001 P (212) 741-2323 FlatironNoMad.nyc FOLLOW US @FlatironNY Twitter, Instagram, Facebook

Turn static files into dynamic content formats.

Create a flipbook
Issuu converts static files into: digital portfolios, online yearbooks, online catalogs, digital photo albums and more. Sign up and create your flipbook.
Flatiron NoMad Partnership - Q2 2023 Mobility Report by flatironnomadpartnership - Issuu