Reporting: Created Revenue


• • PARKS Week 12 Week 13 Week 14 Week 15 Week 16 Week 17 6 Week Average YTD Celebration Station - Baton Rouge 11 9 2 4 8 10 7 8 Celebration Station - Clearwater 19 30 24 17 14 12 19 20 Celebration Station - Greensboro 17 12 19 19 27 24 20 19 Celebration Station - Mesquite 28 30 18 28 52 24 30 26 Celebration Station - OKC 9 13 11 12 10 8 11 9 Craig's Cruiser 55 46 35 73 71 77 60 64 Five Star Parks at Pigeon Forge 5 13 6 5 5 6 7 6 Malibu Jacks - Ashland 28 24 11 18 10 19 18 24 Malibu Jacks - Lafayette 29 31 57 19 19 15 28 32 Malibu Jacks - Lexington 48 47 20 32 39 39 38 47 Malibu Jacks - Louisville 68 67 39 61 53 49 56 64 The Tracks - Branson 9 14 2 4 20 17 11 9 Grand Total 326 336 244 292 328 300 304 329 PARKS Week 12 Week 13 Week 14 Week 15 Week 16 Week 17 Average YTD Celebration Station - Baton Rouge $5,800 $2,964 $474 $3,454 $20,544 $5,393 $6,438 $5,872 Celebration Station - Clearwater $17,322 $36,296 $17,079 $9,863 $6,051 $6,949 $15,593 $14,552 Celebration Station - Greensboro $20,665 $7,647 $14,787 $32,280 $17,928 $20,028 $18,889 $14,846 Celebration Station - Mesquite $25,135 $46,871 $9,113 $14,411 $55,659 $20,286 $28,579 $22,679 Celebration Station - OKC $2,763 $6,736 $5,386 $3,938 $5,861 $4,698 $4,897 $4,404 Craig's Cruiser $71,192 $38,402 $40,067 $76,806 $62,939 $61,191 $58,433 $54,898 Five Star Parks at Pigeon Forge $2,970 $7,880 $4,279 $1,674 $1,974 $6,235 $4,169 $4,527 Malibu Jacks - Ashland $22,480 $14,451 $3,196 $5,052 $2,942 $3,934 $8,676 $13,176 Malibu Jacks - Lafayette $17,423 $19,653 $17,600 $6,067 $7,450 $2,740 $11,822 $15,144 Malibu Jacks - Lexington $27,193 $17,175 $7,533 $38,378 $26,032 $17,837 $22,358 $24,388 Malibu Jacks - Louisville $43,268 $38,961 $9,267 $30,888 $20,523 $16,263 $26,528 $28,700 The Tracks - Branson $8,000 $19,002 $1,045 $3,184 $16,684 $15,859 $10,629 $9,636 Grand Total $264,210 $256,038 $129,827 $225,995 $244,588 $181,414 $217,012 $212,821
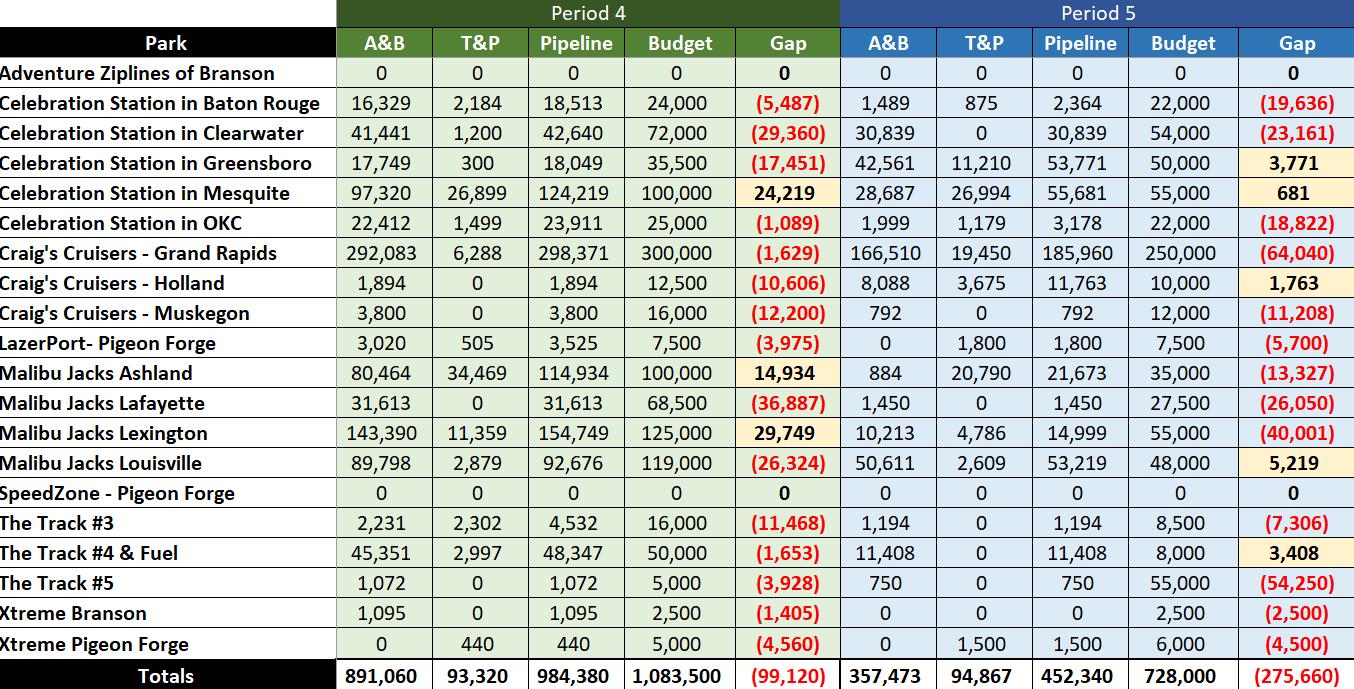
Reporting: Pipeline • • •
Reporting: Pipeline • • • . Period 5 Period 6 Total Events Total Revenue Row Labels Events Revenue Events Revenue Celebration Station - Baton Rouge 2 $2,184 1 $875 3 $3,059 Celebration Station - Clearwater 4 $1,200 4 $1,200 Celebration Station - Greensboro 1 $300 4 $11,210 5 $11,510 Celebration Station - Mesquite 3 $26,899 1 $26,994 4 $53,893 Celebration Station - OKC 2 $1,499 3 $1,179 5 $2,679 Craig's Cruisers Grand Rapids 4 $6,288 4 $19,450 8 $25,738 Craig's Cruisers Holland 1 $3,675 1 $3,675 Lazerport 2 $505 2 $1,800 4 $2,304 Malibu Jacks - Ashland 28 $34,469 8 $20,790 36 $55,259 Malibu Jacks - Lexington 11 $11,359 3 $4,786 14 $16,145 Malibu Jacks - Louisville 4 $2,879 3 $2,609 7 $5,487 The Tracks #3 2 $2,302 2 $2,302 The Tracks #4 4 $2,997 4 $2,997 Xtreme PF 1 $440 1 $1,500 2 $1,940 (blank) Grand Total 68 $93,320 31 $94,867 99 $188,187