2022 Fremont City Profile: Early Care and Education Data
Family and Child Demographics
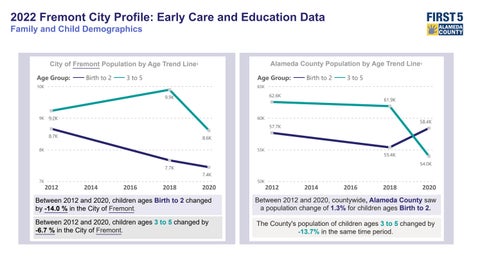
Between 2012 and 2020, children ages Birth to 2 changed by -14.0 % in the City of Fremont
Between 2012 and 2020, children ages 3 to 5 changed by -6.7 % in the City of Fremont.
Between 2012 and 2020, countywide,Alameda County saw a population change of 1.3% for children ages Birth to 2.
The County's population of children ages 3 to 5 changed by -13.7% in the same time period.
Power BI Desktop CITYPOPULATION Fremont
City of Fremont Population byAge Trend Line1 Alameda County Population byAge Trend Line1 7K 8K 9K 10K 2012 2014 2016 2018 2020 8.7K 7.4K 77K 9.2K 8.6K 99K Age Group: Birth to 2 3 to 5 50K 55K 60K 65K 2012 2014 2016 2018 2020 57.7K 58.4K 55.4K 62.6K 54.0K 61.9K Age Group: Birth to 2 3 to 5
Fremont City Profile: Early Care and Education Data
Family and Child Demographics2
Changing Racial Demographics of Children Birth to 5 Over Time (2006 - 2020)
2018 English Language Learners Preschool
Snapshot3
29%
of Fremont's preschoolers are English Language Learners.
Fremont's population of English Language Learners is 16% ofAlameda County's English Language Learner population
Between 2006 and 2020, the City of Fremont saw an increase in children birth to 5 that identify as Asian (9.8%) and Hispanic (4%). In the same time period, the City saw a decrease in the number of children birth to 5 that identify as White (-13.8%).
InAlameda County, 30% (18,294) of preschoolers are considered English Language Learners.
Note: English Language Leaner (ELL) is a California Department of Education (CDE) term that does not exactly match our Alameda County focus on Dual Language Learners. ELL is used here as that is how CDE collects and reports the data.
Power BI Desktop
Asian White Hispanic Two or More Races Black/African American Other Race Filipino Native American 44.0% 27.5% 17.0% 8.1% 2.7% 0.7% 53.8% 13.7% 21.0% 7.8% 1.0% 0.5% 1.2% 0.9% Year 2006 2020
*Filipino and NativeAmerican new for 2020 data collection (zero values not shown)
2022
2022 Fremont City Profile: Early Care and Education Data
Alameda County Early Care and Education NeedsAssessment
Family and Child Demographics
Fremont City Profile
Change in City's Median Income (2010-2018)4
Number of Children Birth to 5 living below the 2020 Federal Poverty Line - FPL($21,960)6 Number of Children under 85% of the 2020 State Median Income ($78,135)6
of age
28.1%
Number of Children Birth to 12 in Families
Receiving CalWORKs PublicAssistance (2018)5
556
17.0%
Power BI Desktop 2021
Median Income 2010 Median Income 2014 Median Income 2018 $96,287 $103,591 $127,374
2,093 Percent
1,461 Percent
Between 2010 and 2018, Fremont 's median income increased by 32.3 %. In comparison,Alameda County's median income increased by 33.4% Birth to 2 3 to 5
group
of age group
Birth to 2 3 to 5 211 Percent of age group 2.8% 492 Percent of age group 5.7%
Learn more about Federal Poverty Line (FPL) and State Median Income (SMI) on the sources page.
2022 Fremont City Profile: Early Care and Education Data
Power BI Desktop Number of Licensed Child Care Programs (2019-2021) 0 100 200 Year 2019 2021 91 83 230 166 Number of Centers Number of FCCs
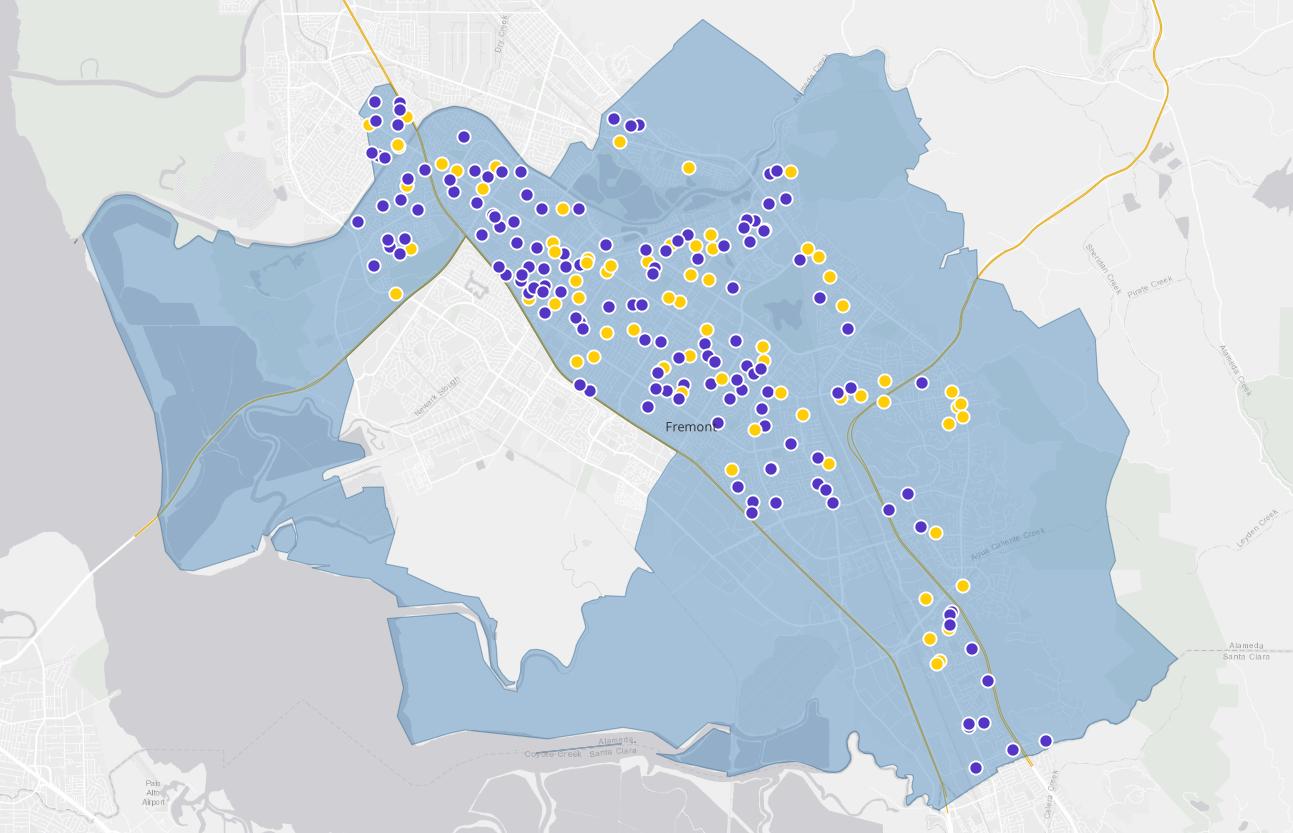
Licensed Child Care Sites7 From 2019 to 2021, the number of licensed centers in Fremont has changed by -8 From 2019 to 2021, the number of family child care sites in Fremont has changed by -64 Map of Centers and FCCs in Fremont (2021)
6
14 children.
*FCCs refers to licensed family child care programs, who care for children in their home. They are typically licensed for
to up to
Fremont City Profile: Early Care and Education Data
Change in Licensed Capacity
From 2019 to 2021, licensed center capacity for children birth to age 5 has changed by -4.7%. Since 2006, licensed center capacity for children birth to age 5 has changed by -2.3 %.
Infant/Toddler Unmet Need for Licensed Child Care Spaces Compared to Child Population (2020/2021)
8.7%
Unmet Need Need Met
91.3%
From 2019 to 2021, licensed family child care capacity for children birth to age 5 has changed by -29.4%. Since 2006, licensed family child care capacity for children birth to age 5 has changed by -36.4 %.
Preschool Unmet Need for Licensed Child Care Spaces Compared to Child Population (2020/2021)
40.9% Need Met
Unmet Need
59.1%
Power BI Desktop 2022
Licensed Capacity2,7 Licensed Capacity (2021) Compared to Child Population (2020) 0K 2K 4K 6K 8K Preschool Population Preschool Infant/Toddler Population Infant/Toddler 4.2K 8.6K 7.4K 0.9K 0.4K 8.6K 5.1K 7.4K 0.6K Center Child Population FCC
City Profile: Early Care and Education Data
Subsidized Child Care Sites
Centers (2021)
In Fremont, there are 83 licensed child care centers. 22 (27 %) of these sites serve children who are receiving subsidies. 7 8
Family Child Care (2021)
In Fremont, there are 166 family child care sites. 19 (11 %) of these sites serve children who are receiving subsidies. 7 8
% Subsidized Centers Out ofAll Licensed Centers
% Subsidized FCCs Out ofAll Licensed FCCs
Family, Friend, and Neighbor (2019)
In Fremont, there are 52 License Exempt Care Sites (which includes Family, Friend, and Neighbor Care)7 who care for 65 children who are receiving subsidies.
This includes family, friend and/or neighbor caregivers who serve children using Alameda CountyAlternative Payment vouchers from CalWORKs Stage 2 and 3 and the CaliforniaAlternative Payment Program (CAPP).
of Fremont centers serve children receiving subsidies.8
Subsidized centers receive alternative payment vouchers and/or state or federal contracts to serve children eligible for subsidies. Of these subsidized centers, there are 2 head start centers, 13 Title 5 centers (state contracted), and 18 centers receiving voucher payments. Some programs receive voucher payments and state/federal funding.8
11%
of Fremont FCCs serve children receiving subsidies 8
166
Subsidized FCCs receive alternative payment vouchers and/or participate in a Title 5 subcontract through Hayward Unified School District or City of Oakland EHS/HS subcontract through BANANAS to serve children eligible for subsidies.8
Power BI Desktop 2022 Fremont
19 0
22 0
83 27%
8
In Fremont, 1,996 infants/toddlers who are eligible for child care subsidies are not enrolled in subsidized care, meaning that there is 95.4 % unmet need for subsidized infant/toddler care.
1,108 eligible preschoolers are not enrolled in subsidized care. The unmet need for subsidized preschool care is 75.8 %
Power BI Desktop 2022
Care Subsidies Eligibility Income Standard Annual Standard 2020 CalWORKs CalWORKs Initial Eligibility Limit $17,520 Early Head Start / Head Start Federal Poverty Level $21,960 State Subsidized (CCTR, CSPP, CAPP) 85% of State Median Income $78,135 Income Eligibility for Subsidized Care, Family Size of 3 (2020)9 Voucher-Based Subsidies 20 CalWORKs Stage 2 323 Total Center-Based Subsidies 127 Total Voucher-Based Subsidies Number of Children Served by Subsidy Type for Children Birth-5 (2020)6 Unmet Need for Subsidized Care6 Infant/Toddler
Fremont City Profile: Early Care and Education Data Child
Preschool
Center-Based Subsidies 115 Early Head Start/Head Start 43 CA State Preschool Program (CSPP) Full Day 145 CA State Preschool Program (CSPP) Part Day 20 General Child Care and Development (CCTR) 73 California Alternative Payment Program (CAPP) 34 CalWORKs Stage 3 469 Transitional Kindergarten (TK)
All subsidy data reported is for children living in Oakland; it is not reported by provider location.
Fremont City Profile: Early Care and Education Data
Power BI Desktop 2022
Workforce10 Number of ECE Professionals (2020) 703 Center Workforce 654 FCC Workforce 1,357 Total ECE Professionals $19.45 Mean Hourly Wage $18.00 Median Hourly Wage ECE Professional Wage (2020) In Fremont, 35.4 % of ECE professionals are over 50 years old. Fremont ECE Professional Race/Ethnicity (2020) 0% 10% 20% 30% 40% Race Asian Hispanic or Latino White or Caucasian Other Black or African American Biracial or Multiracial Pacific Islander Native American orAlaskan Native 36.8% 22.7% 20.2% 9.0% 6.1% 2.9% 1.8% 0.4% Fremont ECE Professional Hourly Wage (2020) Hourly Wage Number of ECE Professionals 40 36 32 28 24 20 16 12 8 4 0 0 6 12 18 24 30 36 42 48
Fremont City Profile: Early Care and Education Data
Sources
(1) 2012, 2018 & 2020American Institutes for Research Early Learning NeedsAssessmentTool (ELNAT). Notes: Zip codes overlap city boundaries. Cities that make up at least 5% of the zip code were included in the city label. Data captured at different points in time may differ slightly due to changes in geographic boundaries and demographics
(2) 2018 & 2020American Institutes for Research Early Learning NeedsAssessmentTool (ELNAT). 2006Alameda County City Profiles. Note: Race/ethnicity categories are defined in a variety of ways depending upon the entity collecting the data. Categories are reported according to source categorization.
(3) 2018American Institutes for Research Early Learning NeedsAssessmentTool (ELNAT) Note: City data is calculated by combining proportional data from relevant zip codes Due to data limitations, data for unincorporated areas could not be calculated in this way and therefore, are not reflected as separate jurisdictions in this chart. English Language Leaner (ELL) is a California Department of Education (CDE) term that does not exactly match ourAlameda County focus on Dual Language Learners. ELLis used here as that is how CDE collects and reports the data.
(4) 2010-2018 HealthyAlameda County /American Community Survey (5-year estimates)
(5) October 2019,Alameda County Social ServicesAgency. Note: City data is calculated by combining proportional data from relevant zip codes. Due to data limitations, data for unincorporated areas could not be calculated in this way and therefore, are not reflected as separate jurisdictions in this chart.
(6) 2020American Institutes for Research Early Learning NeedsAssessmentTool (ELNAT). Note: City data is calculated by combining proportional data from relevant zip codes. Due to data limitations, data for unincorporated areas could not be calculated in this way and therefore, are not reflected as separate jurisdictions in this chart
(7) 2019 and 2021 CAR&R Resource and Referral Network, BANANAS, 4Cs ofAlameda County, and HivelyAlameda County Child Care Site data. Family, friend, and neighbor data fromAlameda County Alternative PaymentAgencies.
(8) First 5Alameda County analysis of subsidized child care sites from the 2021 CAR&R Resource and Referral Network, BANANAS, 4Cs ofAlameda County, and HivelyAlameda County Child Care Site data;Alameda CountyAlternative PaymentAgencies data (2019); and the Quality Counts Common Data File (2020-21).
(9) CalWORKS Eligibility Limit from 2021-22, California Department of Social Services, CalWORKs Cost of LivingAdjustment Increase to the Minimum Basic Standards ofAdequate Care (MBSAC) Levels Federal Poverty Level from the 2019 and 2021, U S Department of Health and Human Services Poverty Guidelines. 85% of SMI from 2021-22, California Department of Education, Management Bulletin 21-09, Schedule of Income Ceilings (85 percent SMI) for Recertification.
(10) Source: October 2020, CAECE Workforce Registry date. Note: Graph reflects self-reported data for 2,348 people registered in theAlameda County Workforce Registry as of October 2020.The Workforce Registry only represents a subset of the ECE workforce as it is a voluntary database.The Registry includes an overrepresentation of those working at child care centers andTitle 5 programs compared to other child care program types.
(11) Federal Poverty Line (FPL): https://aspe.hhs.gov/topics/poverty-economic-mobility/povertyguidelines/prior-hhs-poverty-guidelines-federal-register-references/2019-poverty-guidelines State Median Income (SMI): https://www.cde.ca.gov/sp/cd/ci/mb1803.asp
For a list of acronyms, please seeAppendixA(Section 12 1) of the 2021Alameda County ECE Needs Assessments at http://wwwfirst5alameda org/files/2021%20Alameda%20County%
20ECE%20Needs%20Assessment%20FINAL.pdf
Power BI Desktop 2022