
State of the MARKET Quarter
2 2024
Prepared by Find Wellington AccountingThe following pages contain extensive data and reporting from our own systems and, where permitted, from our partners. This data is provided as a guide to the market, but does not guarantee or reflect the possible outcomes of job listings. Information enclosed may not be redistributed, amended or reproduced without express permission from Find Recruitment.
FINDRECRUITMENT.CO.NZ
WELCOME HAERE MAI
WINTER IS COMING
It’s fair to say that with a change of government, coupled with the new coalition focusing on government cost cutting, the first quarter of Wellington’s accounting market was subdued!
January is typically a quiet month for recruitment in general, and it certainly was this year, February saw much more activity, and March was “back to normal” and busy, leading us to believe confidence was returning and the market was bottoming out somewhat.
However, April and May have remained lean months from a job volume perspective, backed up by SEEK data suggesting the number of advertised roles on SEEK is still low, and lower in fact than pre-Covid levels. Comparing this market to the post GFC market is probably a good way to gain some relativity though.
2009 – Unemployment in NZ rose to 6.5% and remained stubbornly high for 3 years before retreating slowly to reach 5% by 2016. Many of our experienced and qualified accountants were at home, looking for work. Contract recruitment was slow, and permanent recruitment volumes were extremely low. Wage inflation was close to zero, and confidence in changing roles was low.
2024 – Unemployment moved from 4% to 4.3%, still hugely better than the 2009 – 2013 period. We don’t have many professional accountants at home, even senior people are finding quality short to medium terms contracts and job seekers still have the confidence to move roles, something that is creating activity in Wellington’s smaller market. Wage inflation has topped 11% combining the last two years and is 4% as I write this in May 2024.
I suspect we are in a market that still has some consolidation to go, especially in government and service to government (including recruitment) and wouldn’t be surprised to see unemployment push towards 5% again. However, I believe we will see more of a balanced market post 30 June, one which hopefully provides a period of equilibrium between supply and demand as this will mean stable wage inflation, and the ability to attract good quality people to your teams and projects. It’s fair to say things were too one sided during 2021 and 2022 with unemployment dipping to 3.2% in the post-Covid boom.
On a final note, I believe that a robust recruitment process should involve a blend of non-active candidates, not just SEEK respondents to get a true quality of shortlisting, and our active referral scheme is invaluable for those candidates who are somewhat hidden away, but are the true high performers that every employer wants to reach.
Julian Greaves

State of the Market Quarter 2 Update 2024 MARKET REPORT | FIND

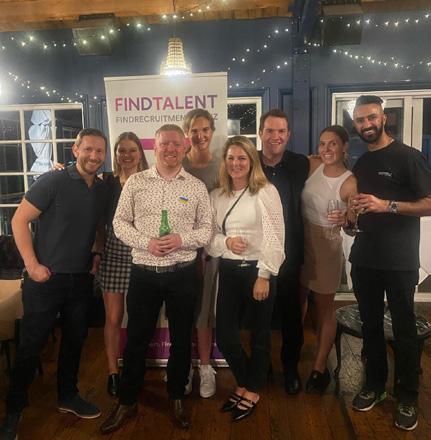
We
partner with organisations
that reflect our values & help us discover exceptional people.
He aha te mea nui o te ao? He tangata, he tangata, he tangata What is the most important thing in the world? It is the people, it is the people, it is the people

Our commitment to helping our rainbow community be seen & heard in the workplace.
Working with Martin King at the Pride Pledge, we have conducted a full audit of our business to assess our rainbow progression, and are actively implementing steps to make our workplace, and our recruitment cycles, more accessible to those in the LGBTTQIA+ community.
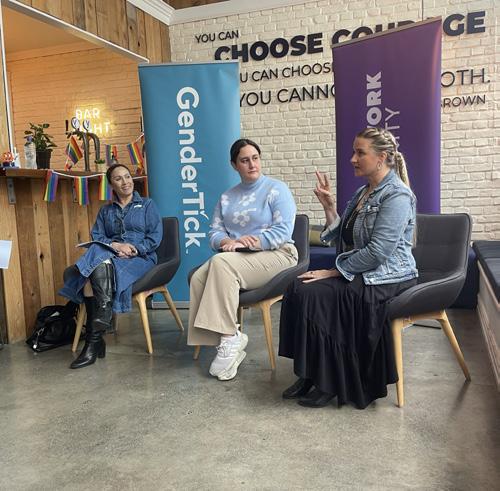
The GenderPledge is our commitment to equity & developing robust, useful policies for our people. As leading experts on inclusivity, the team from the Genderat-Work Community help our organisation drive change from within that not only improves our workplace culture but has a positive impact on social change.

Opening recruitment gateways for people in the community with neurodiverse minds.
We are in the process of adjusting our business processes and recruitment methods to ensure that we cater to people from all walks of life. Accommodations to interview styles, and enabling people to declare their neurodiverse status allow us to serve the wider NZ community.
Our positive impact is regularly recognised and celebrated.
2023 Second Place/Runner Up | SEEK SARA’s for Outstanding Progress in Diversity, Equity & Inclusivity.
2021/2022 Winner | SEEK SARA’s for Recruitment Leader of the Year - Rob Woodward.
2023 Silver Award | Southern Cross Health Awards The New Horizons category for transformative & innovative healthcare policies.
2023 Bronze Award | Southern Cross Health Awards Small Business category for businesses that promote the wellbeing of their people.
2022 Finalist | RCSA Awards for Recruitment Leader of the Year - Mark Harper.
2021 Winner | RCSA Awards for CEO Outstanding Contribution - Rob Woodward.
2021 Finalist | RCSA Awards afor Outstanding Large Recruitment Agency of the Year. afor Excellence in Safety & Wellbeing.


We’re committed to keeping Aotearoa green & beautiful. We have actively worked with eco-friendly partners for many years now to offset our carbon emissions and to help keep our country beautiful for generations to come. We are in the process of exploring new carbon-neutral solutions to increase the positive impact we can have on New Zealand. We welcome questions about our carbon-neutral commitments at any time.
State of the Market Quarter 2 Update 2024
DATA & ANALYTICS
Marketing Insights
Below we've highlighted some of our analytical data for you to give you insight into the New Zealand employment market as it stands. We've also highlighted data from polls we've conducted of our audience, to showcase what people are talking about and what's important to candidates in 2024.
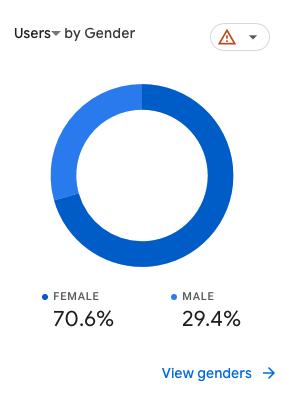
Website Activity | APRIL 1 2024 TO PRESENT
Our website visitor gender spread stands steady at 70.6% female and 29.4% male. This distribution reflects a balanced and diverse representation of job seekers actively participating in the job market. This contributes to an equitable and diverse recruitment landscape, highlighting the market's appeal to a wide range of candidates and employers. This data is based on freely expressed gender demographic information that is collated by Google, and currently only defined by male and female.
5. Add recruitment costs into your 24/25 budget! Here's why.
These articles have remained consistently high with, often, thousands of views each month. This is not unexpected given the current nature of the market. We’re seeing candidates looking for advice around how to navigate employment contracts, and businesses looking to recruitment agencies for potential costeffective methods for managing their hiring needs. These are closely followed by ‘The Must Have Skills of any Candidate in 2024’ and various ‘fun’ articles we have.
Ad
~4,680,000
~180,000 Visitors by Country | APRIL 1 TO PRESENT 1. New Zealand 83.% 2. United States of America 7% 3. Australia 5% 4. India 3% 5. United Kingdom 2%
Impressions
Website Visitors
Our Top
1. /jobs ~34,000 2. /home ~18,000 3. /work-with-find ~11,000 4. /team ~7,500 5. /contact ~3,400 Our
1. Risk & Compliance Guide 2.
Ranking Pages
Highest Ranking Articles
2024 Hiring Guide 3. Navigating & Negotiating Notice Periods 4. 7 Reasons to use a Recruiter
State of the Market Quarter 2 Update 2024
DATA & ANALYTICS
Placement Insights
We’re seeing continued momentum across both our offices with new job listings coming in frequently. Applications remain exceptionally high with the April to June period seeing some roles receive 100’s of applications. Whilst most businesses are keeping their cards close to their chest, we’re still seeing hiring across the board, and have received a larger volume of hiring requests from outside of Auckland and Wellington.
Job Listing Location
Applications by Source
Placement Location
* Sitting at 0% as no Fixed-Term or Part-Time roles were listed through Find Recruitment between April and June 2024, or they are still active in the market.
Apr
Jan
Mar
Oct
Dec
Wellington 46.07% 47.78% 52.63% Auckland 44.94% 47.78% 44.74% Wider New Zealand 8.99% 4.44% 2.63%
to Jun 2024
to
2024
to
2023
Apr
Jan to Mar 2024 Oct to Dec 2023 Find Recruitment Database 11% 13% 13% Find Recruitment Website 3% 3% 2% SEEK 79% 81% 79% TradeMe 7% 3% 6% Listing
Type Apr to Jun 2024 Jan to Mar 2024 Oct to Dec 2023 Permanent 47.13% 54.55% 49.37% Contract 47.77% 40.56% 40.93% Fixed-Term 3.82% 3.50% 8.02% Part-Time 1.28% 1.40% 1.27%
to Jun 2024
Work
Apr
Jan to Mar 2024 Oct
Dec
Wellington 50.00% 47.50% 61.33% Auckland 50.00% 52.50% 38.66% Placement Type Apr to Jun 2024 Jan to Mar 2024 Oct to Dec 2023 Permanent 35% 30.12% 32.69% Contract 65% 65.06% 62.18% Fixed-Term 0%* 4.82% 4.49% Part-Time 0%* 0.00% 0.64%
to Jun 2024
to
2023
State of the Market Quarter 2 Update 2024
DATA & ANALYTICS
Audience Insights
In partnership with our friends at the Gender-at-Work Community and The Pride Pledge, we are proudly taking steps to understand our candidates on a deeper level. All of this data is being collected freely, of the candidates' volition and is anonymous so can not be matched to specific candidates, to ensure we continue to combat bias in hiring processes.
We can collect demographical data for your specific roles going forward, so if you would like this done, please let your consultant know and once the job is filled we will survey all applicants to give you insight into who saw your role, and who applied! Please note below that the arrows used indicate a change in total dispersal of percentage from previous report and not a reduction in people or identities.
Candidate Ethnic Identity
Based on the willing responses of candidates across roles recruited through Find Recruitment.
Category
Respondees
Māori, Samoan or Tongan
Candidate Gender Identity
Based on the willing responses of candidates across roles recruited through Find Recruitment.
Identifying Gender
Cisgender Male (my sex assigned at birth and gender identity are the same)
Cisgender Female (my sex assigned at birth and gender identity are the same)
Prefer not to say
Respondees
Gender Queer, Intersex, Trans Woman & Takatāpui*
* Gender Queer, Intersex, Trans Woman & Takatāpui are all listed individually in our survey however are grouped here to accommodate space in this report.
% of
Indian 28.6% New Zealand European/Pākehā 28.1% Other, e.g. Japanese, Tokelauan 21.9% Chinese 12.8% European 8.7% Prefer not to say 4.6% Fijian 3.1% Māori 2.6% American 1.5% Cook
0.5%
Islands
%
of
53.1%
35.7%
6.1% Gender Diverse 2% Gender is not listed 1% Trans Man 1% Non-Binary 0.5%
0%
Candidate Location
Based
Location
Candidate Industry Based
of Respondees
Candidate Age Groups
Based on the willing responses of candidates across roles recruited through Find Recruitment.
Age Group
Auckland 43.9% Wellington 25.5% Other 21.9% Christchurch 1% Gisborne 1% Hamilton 1% Nelson 1% New Plymouth 1% Palmerston North 1% Prefer not to say 1% Tauranga/Bay of Plenty 1% Northland 1% Dunedin 0% Greymouth 0% Invercargill 0% Queenstown 0% Rotorua 0%
%
roles
on the willing responses of candidates across
recruited through Find Recruitment.
%
30 to 40 33.7% 40 to 50 24.5% 24 to 30 19.4% 50 to 64 14.3% 18 to 24 6.6% 65 or older 1.5% Prefer not to say 0%
of Respondees
Industry % of
Accounting & Finance 37.8% IT & Digital 30.6% Other 10.2% Professional Services 5.1% Technology 4.6% Sales & Marketing 4.1% Business Support 3.1% HR 3.1% Risk & Compliance 1% Prefer not to say 1%
Respondees
on the willing responses of candidates across roles recruited through Find Recruitment. State of the Market Quarter 2 Update 2024
Sexual Identity
Based on the willing responses of candidates across roles recruited through Find Recruitment.
Candidate Sexual Identity
of Respondees
Candidate Preferred Pronouns
Based on the willing responses of candidates across roles recruited through Find Recruitment.
Pronouns
he/him/his (masculine pronouns)
of Respondees
My pronouns are not listed
ia (Māori gender neutral pronouns)
they/them/theirs (neutral pronouns)
ze/zir/zirs (neutral pronouns)
Neurodiverse Status
Based on the willing responses of candidates across roles recruited through Find Recruitment.
Identifying Neurodiversity
of Respondees
%
Not Applicable 85.1% Prefer not to say 4.8% Other 3.7% ADHD 3.2% Autism 1.1% Bipolar 1.1% Dyslexia 0.5% Sensory Disorder 0.5% Borderline Personality Disorder 0% Dyscalculia 0% Dyspraxia 0% Epilepsy 0% OCD 0% Down Syndrome 0% Tourettes 0%
%
56.6% she/her/hers
38.3% Prefer not to
4.6%
(feminine pronouns)
say
0%
0%
0%
0%
%
Heterosexual 63.9%
not to say 23%
listed here 4.2% Bisexual 3.7% Gay 3.1% Asexual 1% Pansexual 1% Lesbian 0% Queer 0% Takatāpui 0%
Prefer
My sexuality is not
State of the Market Quarter 2 Update 2024
DATA FROM SEEK
Top industries by job ad volume
A review of industry data as provided to us from industry leaders.
Job Listings 2024
Job ad change by region
National Job Ads April Job Listings Month on Month -4% Job Listings Year on Year -3% Applications Month on Month 96% Hiring Demand Low Candidate Supply High Healthcare & Medical 11.2% Consulting & Strategy 11.1% Banking & Finance 8.1% Insurance & Superannuation 8.1% Engineering 6.1% Accounting 6.0% Trades & Services 5.3% ICT 5.1% Admin & Office Support 5.1% Customer Service 4.6% Sales 4.3% Government 4.1% Legal 3.5% Marketing & Comms 2.3% Location April 2024 (vs. March) January 2024 (vs. December) Nationwide -4% -6% NORTH ISLAND | TE IKA-A-MĀUI Northland 4% -7% Auckland -5% 1% Waikato 1% 3% Bay of Plenty -2% 2% Gisborne 21% 4% Taranaki -7% 5% Hawkes Bay -8% 8% Manawatu -5% 20% Wellington -8% 0% SOUTH ISLAND | TE WAIPOUNAMU Tasman -9% 4% Marlborough -23% -12% West Coast -36% 1% Canterbury -2% -5% Otago -6% 4% Southland 7% 7% Industry April 2024 January 2024 Trades & Services -4% 1% Manufacturing, Transport & Logistics -6% 2% Healthcare & Medical -3% 3% Information & Communication Technology -4% -5% Administration & Office Support -11% 5% Hospitality & Tourism -21% -2% Retail & Consumer Products -10% 10% Accounting -2% 7% Sales -7% 2% Insurance & Superannuation 17% -6%
Supply & Demand (vs. 5 year average). Salary Trends (Year on Year
April)
-
Eager for more data? Chat with your consultant at Find and ask for a custom report. State of the Market Quarter 2 Update 2024