Accurate Body Density Index BDIn to replace flawed BMI
Robert E (Robin) Miller III ©2021A
editors: Yehia Y Mishriki MD and G H Aykroyd BSEE
Abstract: Body Mass Index (BMI) distorts most individual’s adiposity, giving the same result for individuals having the same weight and height despite who is flabby and who is lean. A more correct measure of adiposity would improve clinicians’ assessment of health risks and guidance for weight control, while avoiding patient anxiety over self-image Should BMI be superseded? This paper proposes BDIn (“BDI-sub-n”), Body Density Index normalized within entrenched BMI categories, but optimized using a bioengineering model for body volume, and with an online calculator
History of BMI and its well-known issues
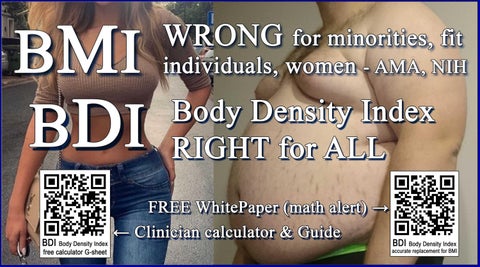
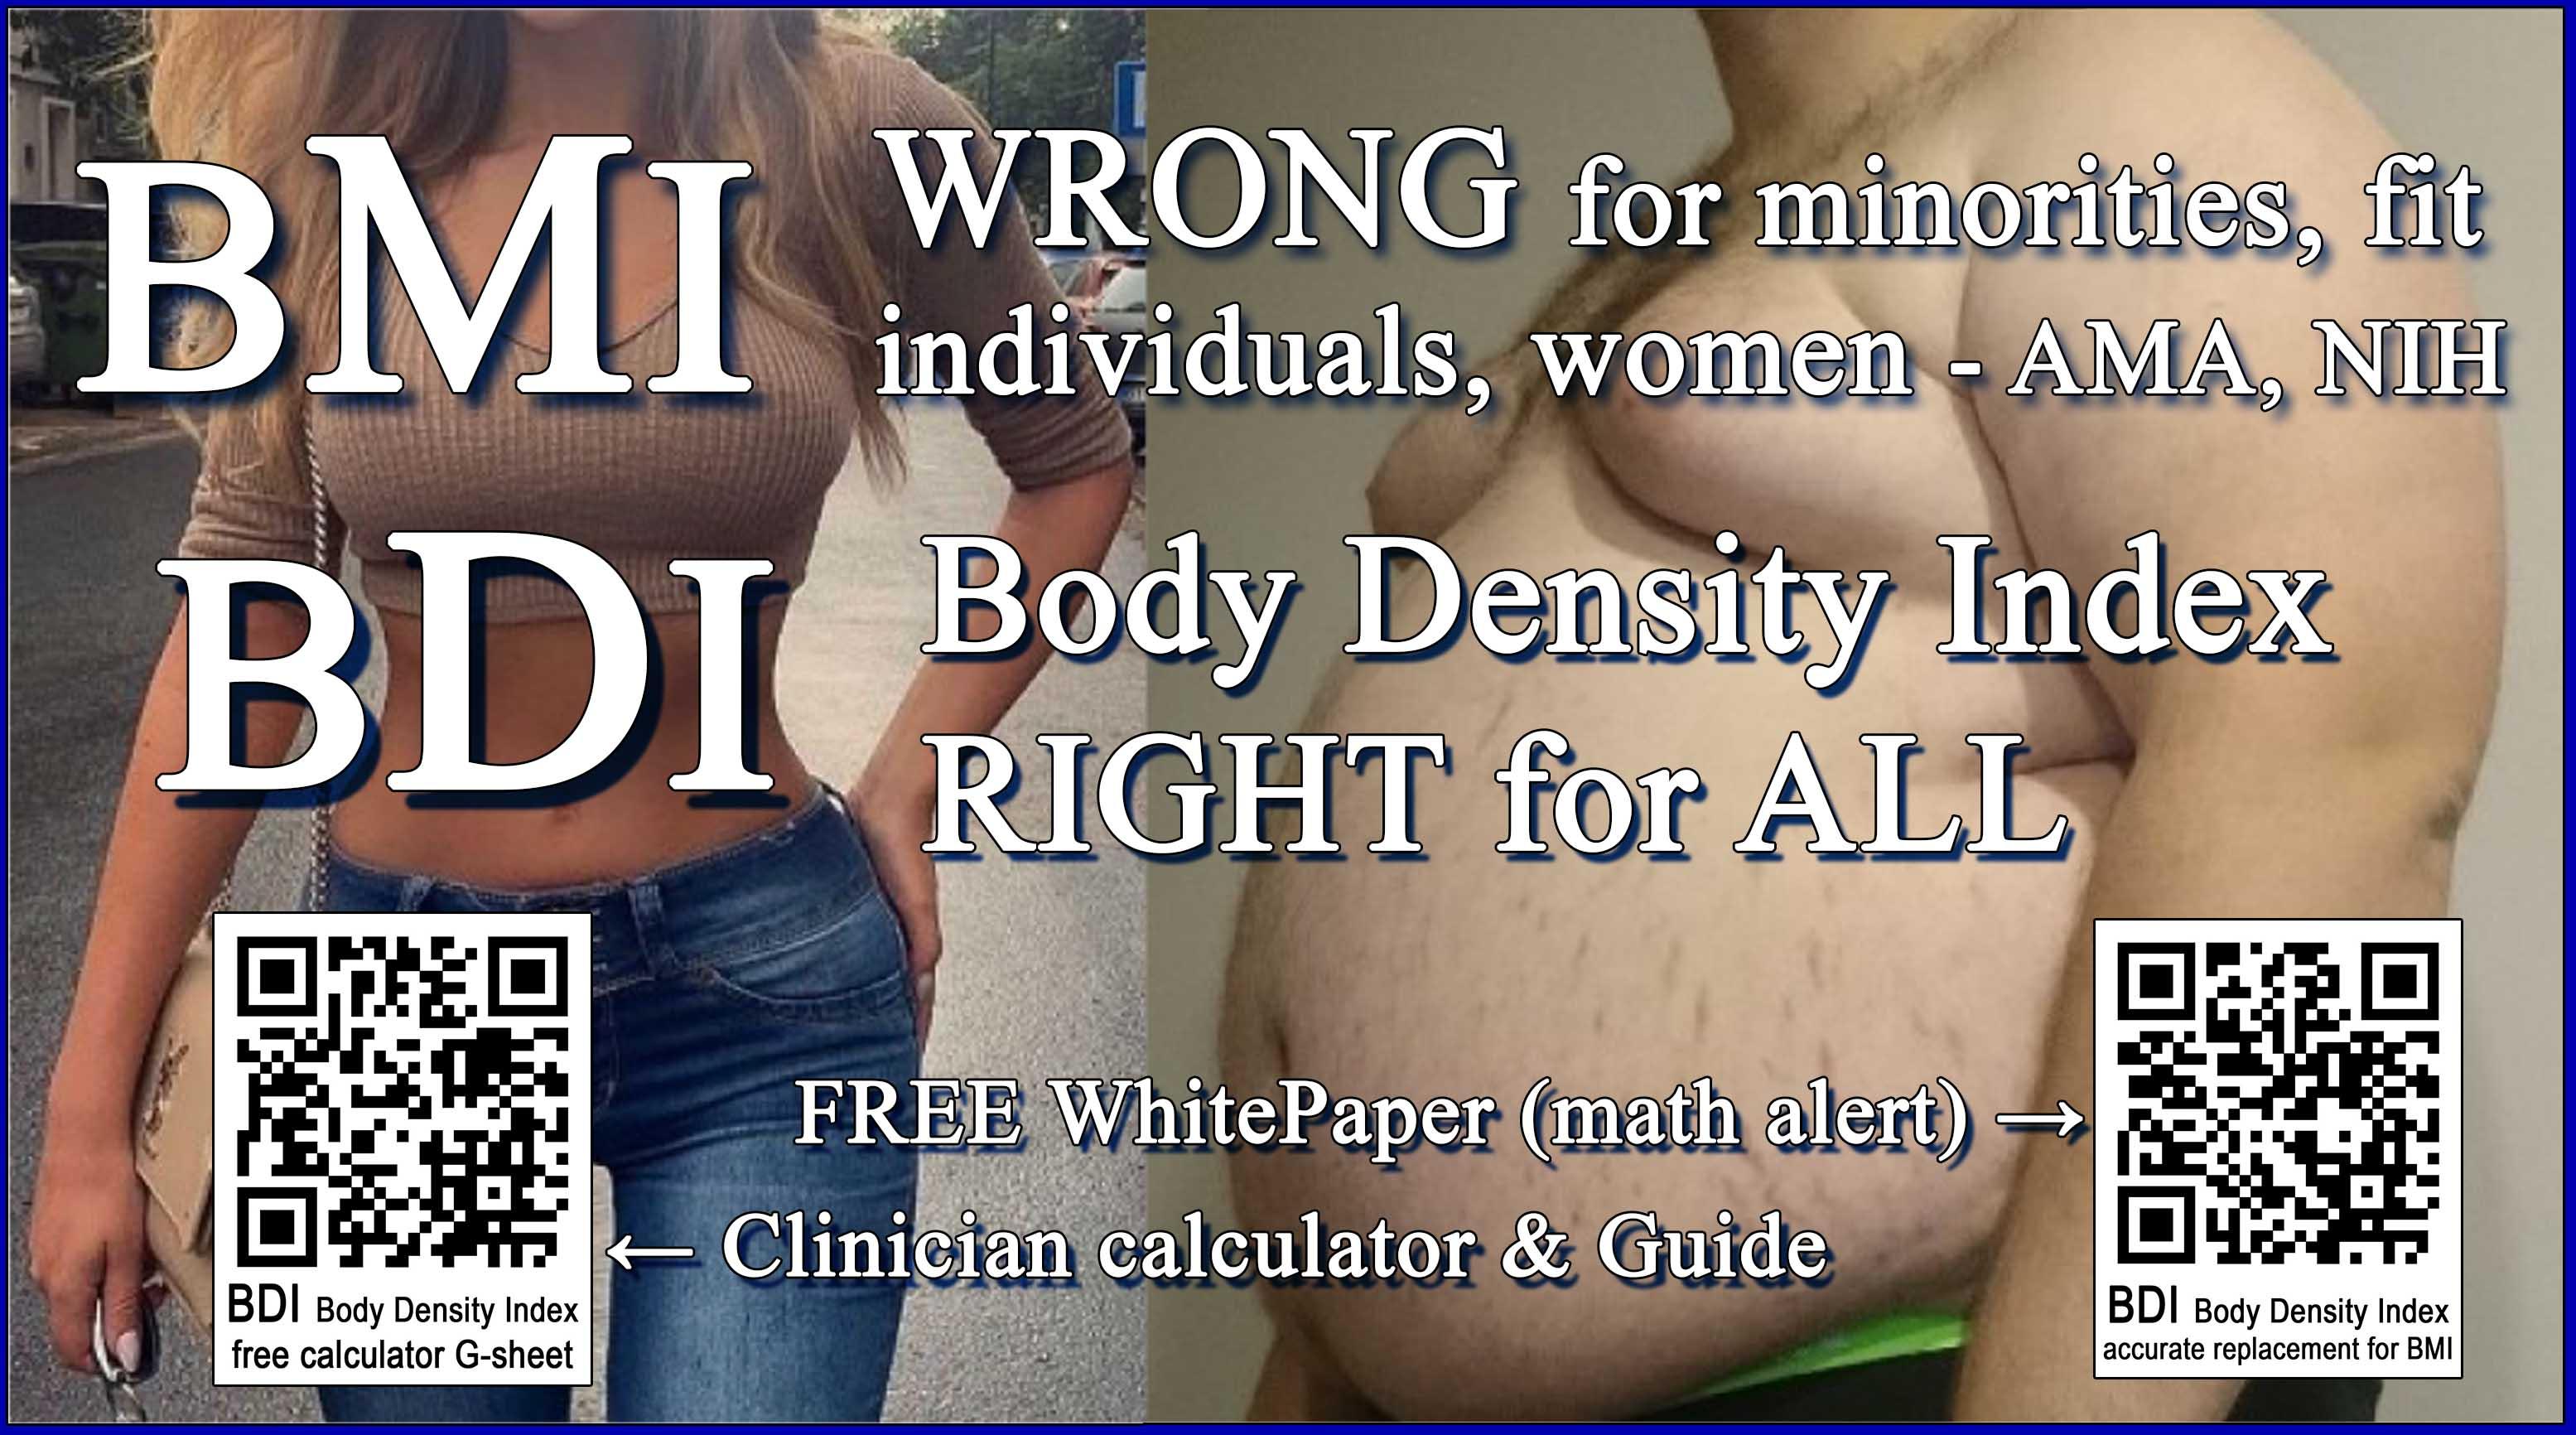
Two centuries from conception and decades in clinical practice, Body Mass Index (BMI) distorts individual body fat 1 2 3 4 5 It fails to register leanness, using only two measurements, weight w & height h: BMI = w/h2 [1]. Absent girths & body shape, BMI ignores the density proportions of fat, muscle, & bone 6 BMI is the same for people with the same weight & height despite which are flabby, and which are lean. The AMA advises “BMI can be inaccurate and misleading;” National Institutes of Health (NIH) concedes “BMI is a rather poor indicator of percent of body fat.” a 7 NPR calls BMI “bogus;” The NY Times calls it “a scam.”
A century after its invention for Belgium’s male population, but specifying it was not applicable to individuals,8 its formula was usurped as an individual metric named BMI Soon suspiciously round-numbered fatness categories were added to differentiate levels of leanness (muscle), but not women, race, or fat location (healthier pear v. dangerous apple.) b 9 Physicians using BMI may err in assessing a patient’s health risks, or in giving dietary advice.10 Being told one’s BMI can trigger anxiety re body selfimage that distracts patients from heeding doctors’ advice
Ancient scientists knew the health implications of the ratio of fat to muscle & bone, measured by body density, defined as mass (weight) divided by volume, w/V (not w/h2). Archimedes’ water displacement determined volume, cumbersome due to fasting to purge air in the digestive tract and exhaling fully under water. In 1832 Belgian statistician Adolphe Quetelet tracked the population of males’ w/h2, where inconsistencies average out with the large numbers. In 1972, Dr. Ancel Keys coined w/h2 as “BMI ” c Keys was criticized for 50+ years for omitting data that disagreed with his premise, and for cataloging only males. Soon MetLife adopted BMI to set progressive life insurance rates that inflated in time d 11
a NIH - https://www.ncbi.nlm.nih.gov/pmc/articles/PMC6738397/ ; AMA - https://www.amaassn.org/delivering-care/public-health/ama-use-bmi-alone-imperfect-clinical-measure b 2015 by NIH - https://www.ncbi.nlm.nih.gov/pmc/articles/PMC4890841/
c Ancel Keys-Seven Countries Study - https://pubmed.ncbi.nlm.nih.gov/31338844/; https://www.scienceofeds.org/wp-content/uploads/pekar-ims-bmi.pdf (but only of males).
BMI captured the world of medicine in 1973, first by the Royal College of Physicians Based largely on Garrow in 1981, in 1995 the WHO established its categories, only anecdotally observed, applying only to white males, and that became viewed in error as % body fat. Normal was designated as 18.5~24.9 (21.5 ±~3), but with varying bone & muscle densities, there has been no Normal for women, nor for the range of body shapes of different races.
Today the author introduces BDIn (BDI-sub-n), an accurate Body Density Index normalized to fit BMI’s familiar categories. In sum, BDIn measures adiposity by overall body density for all adults including women, Asians, and African Americans; BMI does not.
BMI as applied to individuals is mathematically disproved
Fat is less dense than muscle, bone, & water. So in water a fat person floats; a lean person sinks. If a person’s weight increase is due to fat, BMI rises But if a person’s weight increase is muscle, instead of falling BMI still rises, reporting lean athletes as “obese.” Improperly applied to individuals, Quetelet’s 1832 formula causes this reciprocity, magnifying BMI’s error randomly by individual
This paper quantifies BMI’s distortions that for most individuals, shown below as widely ranging, can be between -8.4 and +11.0 points off where they ought to be, closer to BMI’s own trendline in Fig.1. e Is it time to replace BMI? Many have recognized BMI’s flaws and male exclusivity, but an Oxford mathematician’s “New BMI” still uses only w an h f 12 And the Mayo Clinic’s body volume indicator, BVI, is too costly a scanner for routine clinical practice.

As shown in Fig.1, BMI was statistically brilliant for averaging a population (dashed orange trendline), but not for any individual 13 Nor for most Asians, African Americans, children, or women. Do we expect the ideal for any individual to conform to an average?
d Keys lobbied for MetLife to abandon its 1943 Weight for Height and adopt his “BMI” (Quetelet’s 1832 w/h2“) - http://www.assessmentpsychology.com/metlife.htm
e A 19.4-point spread; later the same point spread for BMI cf. BDIn of –6 to +13.4
f N Trefethen, Prof Numerical Analysis, Univ. of Oxford, “New BMI”=1.3*w/h^2.5; C Scamahorn “BFATI” [Old BDI”] 2006=W(w+b)/h^3 kg*mm/mm^3 [~kg/mm^2??]
BMI describes as “normal 21.5” the index of a healthy male, i.e an 1830’s Belgian of 57.73kg (127lb) and 1.638m (64.5in) Normal
BMI = w/h2 = 57.73 / 1.6382 = 21.52 ostensibly kg/m2 [2] or in inch-pound units common in North America and elsewhere
BMI = w/h2 = 703 x 127lb / 64.5in2 = 21.46 “kg/m2“ [3]
BMI in kg/m2 is not density, which would be kg/m3 Note that kg/m3 equals g/cm3. Body fat is tracked by density, mass per unit volume, ϱ =m /V, in earth’s gravity ϱ =w /V. Viewing V as a cube, V=hhh, ϱ =w/hhh. But BMI =w/hh Shy an h in its denominator biases what would be density by a rogue h in its numerator With the sole shape factor h2 , BMI cannot represent body leanness.g 14
In clinical examinations, BMI is expressed as a dimensionless number, an “index” clinicians look it up in a printed table, or have calculated using a computer form widget As an alternative, this paper proposes BDIn that is based on a model of actual body V that divided into easily measured weight w equals an accurate body density BD that defines leanness. BDIn is then “normalized” to familiar BMI categories, and thus retains the term index BDIn is a far more meaningful indicator of adiposity to supersede BMI.h
Fig.1 plots the small “population” in Table.1 spanning individual BMI or BDIn indices ranging 14 to 53 and body densities ranging 0.737 to 1.130 g/cm3 – Normal is 1.033 g/cm3. Shading delineates categories “severe underweight” <16.5 to “morbidly obese” >40.i Grouped nearer Normal 21.5 implies a healthy population with fewer people morbidly obese or dangerously underweight.
Individual BMI’s careen about their dashed orange trendline because each calculation uses only w and h2 , ignoring individual shape and leanness. BMI works statistically only when averaging a large number of people. However plotted by body density BD, BMI (solid orange line) errs widely between –8.4 and +11.0 points (vertically), swinging between –29% and +39% from to its own trendline Were it accurate for individuals, BMI’s datapoints would be linear, and fall on its dashed trendline This paper’s BDIn in blue is normalized to parallel BMI’s trendline, and to contain its Normal of 21.46. BDIn datapoints directly below or above corresponding BMI points differ by between –6 and +13.4 points, implying individual corrections between +17% and –90%
Derived from a truer body density BD, proposed BDIn for the same individuals are inherently linear, without distorting their adiposity
Do not expect BDIn to fall on BMI’s averaged trendline, which is altered with each added dataset Whether or not BMI’s arbitrary categories are to be retained or improved on an objective basis, individual BDIn‘s plot accurately within them. The key is a more accurate body density BD=w/Vbody from a truer body volume Vbody
g A Journal of the American Heart Association 2018 study finds girth measures a better indicator of heart attack risk than BMI Table 1 uses 0.78 ratio of waist:hips h BDIn when normalized to BMI, otherwise BDIx is extensible for any calibration.
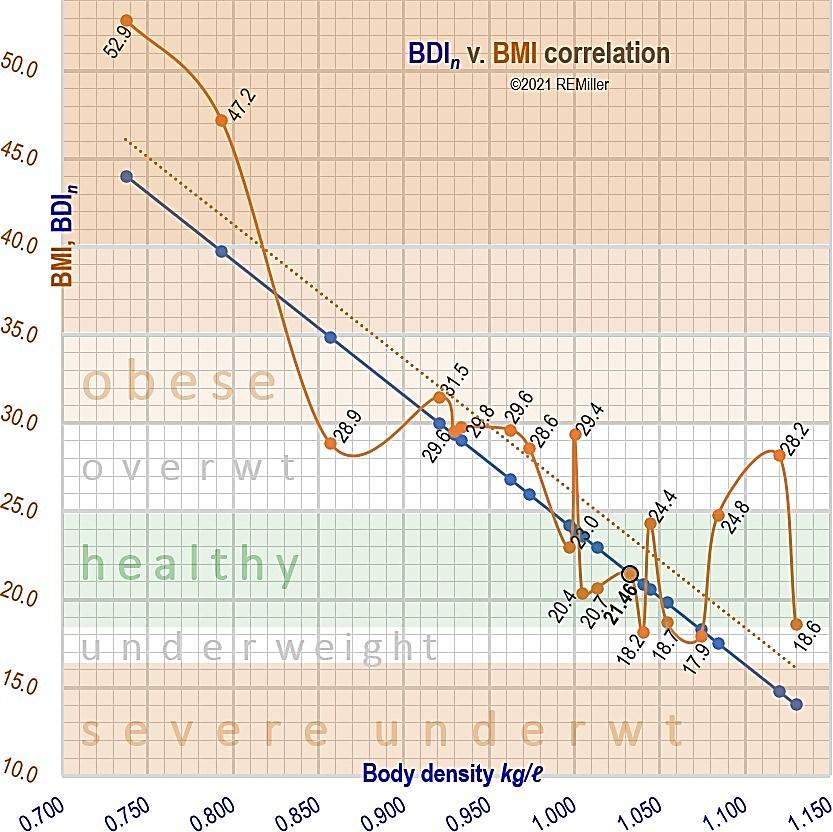
Fig.1 - BMI by individual • is often far from its own trendline …. . BDIn • based on body density is linear (undistorted) Normalized to BMI categories, BDIn is a truer individual fatness index. BMI’s error for any individual‘s pair of • and • above or below is calculated in Table.1 under “differ” & “differ%.”
A measure of adiposity relies on an accurate body volume Vbody
An index of body fat derives from density, ϱ=m/V In space, a mass m just sits there, but on earth, gravity gives m a force of w, weight. Then w/Vbody gives body density BD for any male, female, lean\athletic, or aged body shapes. j A measurement of adiposity depends on a Vbody that gives a more accurate result than BMI’s h2 . BDIn provides, for any individual, a truer index of adiposity.
We measure body volume Vbody not by dunking or an expensive scanner, but by a bio-engineering model. This model, in Fig.2 L, calculates Vbody from a minimum number of five (5) size measures: the usual overall height h, plus an additional four: sitting height hsit, waist depth d, and perimeters waist pw and hips ph that with practice take only one minute more to measure.
Simply put, the model is an elliptic cylinder for the trunk atop two truncated cones for legs. Vbody = Vtrunk + Vlegs(2) [4]. Fig.2L shows the cylindrical trunk, integrating the head, neck, & arms by envisioning clasped hands behind head and tucked elbows in and up, even with the crown. Arm volume is assumed proportional to the trunk. As brain density is higher than average BD, the head is in effect a larger volume, dealt with after a 1st approximation The mathematical derivation of Vbody modeled in Fig.2L is in Appx.C
i Table 1 does not represent the US pop , which per CDC is on average borderline obese, but shows how BMI wrongly categorizes both the unhealthy and healthy. j Density of water by definition equals 1.000 g/cm3 (1.000 kg/l), or ~0.036 lb/in3 .
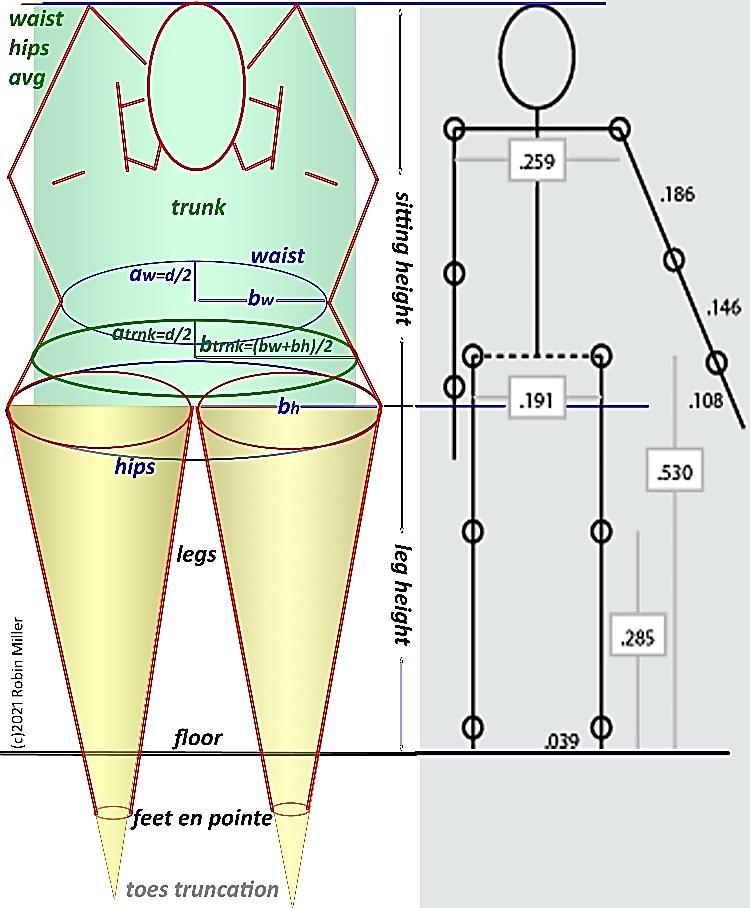
Fig.2 L – BDIn is based on a sufficiently accurate model of body volume Vbody, an elliptical cylinder + two cones, from five measurements, the math in Appx.C. R - Mean ratios of anthropometrics of Drillis & Contini, segmented by joints k 15
From 1970 to 2019, U.S. mean age rose from 28yr to 38yr Per Appx B, Americans today average 50lb heavier and 8 points higher in BMI. While 2in taller today, one can have a leaner look, yet we still use 1995 BMI fatness categories, with “normal” equivalent to a 1830s Belgian 127lb and 5ft 4½in BMI and its categories do not register fat v. muscle v. bone, gender, age, or waist to hips ratio.
Humans only 1/13 cubic meters in mean volume suggests that a body density BD in metric tons per cubic meter is hardly intuitive. A more understandable body density BD is in kg/liter l (=g/cm3):
BD ≈ Cw/Vbody kg/l (the complete Vbody from Appx C) [13 l ] for C =1000cm3/l for metric units or =27.68 in3lb/kgl (61in3/l ÷ 2.2046lb/kg) for Imperial inputs. The complete body density is
BD ≈ Cw/(Δhsitπd(0.1904ph + √(pw 2/(2π2) –(d/2)2))/4 + 0.0277ph2(h – hsit)) kg/l [14]
where w is weight in kg or lb, and p’s and h’s are in cm or inches. (For Imperial inputs in lb & in, BD is converted to metric kg/l )
Now to transform BD to an equally sensitive index BDIn that is as familiar to health providers & patients as BMI, but more accurate for more properly advising patients about adiposity’s health risks.
k Drillis & Contini 1966 Body segment parameters #1166.03, New York University
l To preserve math continuity, formulae numbers in [ ] continue after Appx C
Accurate Body Density Index BDIn normalized to BMI categories
After 50+yr, BMI is entrenched in the healthcare community, along with its round-number categories. Consider a new index based on accurate body density BD and as familiar as BMI We normalize BD to BMI’s trend line slope & intercept, y = Mx + N, and scale BD bounded by 0% muscle (impossible) and 0% fat (2% is possible). Fat is ~0.9 kg/l; muscle ~1.1 kg/l; bone up to 1.38 kg/l m Humans average ~15% bone; ~ 85% fat, muscle & watery fluids. 15 So body density BD falls below the weighted inequality
BD < 85%*1.1+15%*1.38 BD < 1.142 kg/l [15]
The narrow range of body density BD will be well below 1.142 BMI’s formula is an erratic poser for BD, amplified by ~76 times. With its trendline in Fig.1 sloping by M=76.42, the BD inequality limit of 1.142, and the Normal of 21.5=M*(1.142-BD)+N, we solve for N=13.12,n now as Body Density Index normalized (“BDI-sub-n”)
BDIn = 76.42* (1.142–BD) + 13.12 (kg/l normalized index) [16].
The complete expression for “Body Density Index, normalized” :
BDIn ≈ N + M * (1.142 – Cw/(Δhsitπd*(0.1904ph + √(pw 2/(2π2)(d/2)2)^0.5)/4 + 0.0277ph2(h – hsit))) (index normalized to BMI) [17].
Without slope constants N & M, the scalable & extensible form BDIx can fit any categories. Δ is a volume model error corrector. The total of six variable size measurements are: w is weight in kg or lb; in cm or in, p’s are waist & hips perimeters, d is trunk depth, the h’s are standing & sitting heights. BDIn‘s four measurements, added to w & h for BMI, take a minute more. Substituting units constant C and six variables in bold to calculate per Appx.A, BDIn =13.12+76.4*(1.142-C*w/((0.925*hsit*3.14*d*((0.1904*ph+(pw^2/(2*3.14^2)(d/2)^2)^0.5))/4)+0.0277*ph^2*(h-hsit))) (procedure in Appx.A) [18]
Examples of calculating BDIn per Appx.A in contrast to BMI
Ex1: In the appropriate measurement units, calculate using Appendix A BDIn for: weight 127lb, h 5ft4½in, hsit 29in, waist 30in, d 8.0in, hips 34in: 13.12+76.42*(1.142-27.68*127/((0.925*29*3.14*8.0*((0.1904*34+(30^2/(2*3.14^2)(8.0/2)^2)^0.5))/4)+0.0277*34^2*(64.5-29))) [copy&search, per Appx.A]
BMI 21.5 “normal” but BDIn ≈ 14.96 (anorexic)
Ex2: Find BDI: w57.6kg, h163.8cm, hsit86cm, pw86cm, d25cm, ph86cm: 13.12+76.42*(1.142-1000*57.6/((0.925*86*3.14*25*((0.1904*86+(86^2/(2*3.14^2)(25/2)^2)^0.5))/4)+0.0244*86^2*(163.8-86))) [copy&search, per Appx.A]
BMI 21.5 “normal” but BDIn ≈ 30.18 (obese)
Note: Ex1&2 are identical in weight & height for identical BMI, but different in BMI-ignored waist, d, & hips that BDIn includes.
Ex3: Try it. Your own measurements per Appx.A. Any surprises?
m~1.38 Zioupos et al Bone Density https://doi.org/10.1016/j.jbiomech.2008.03.025
n Anywhere a BMI datum is on its trendline is valid to find N=BMIn-M(1.142-BDn)
Results comparing BDIn vs. BMI for 20 “individuals”
Table 1 calculates BDIn v. BMI for 20 datasets, graphed in Fig.1, including 2021 US Centers for Disease Control & Prevention (CDC) data, and the widely accepted modern body density BD average of 0.985 Each row is an individual, sorted by BD For illustration, estimated data are rounded extrapolations in green
For normalizing to BMI’s familiar categories, we make BDIn’s trendline parallel to BMI’s and to contain its Normal 21.5, so data by individual fall on BDIn‘s trendline. Fig.1 shows BMI swinging erratically among individuals, as they vary from its own trendline “BMIvTL% ” by –8.4 to +11.0 points, between –29 and +39%. BMI
“differs” from BDIn between –6 lower to +13.4 points higher, as calculated under “differ” and “differ%” in Table.1 Not perfect, BDIn need only be far better by individual than BMI to cover its cost in practice – making four additional measurements that take only a minute more For better advice by physicians that helps fulfill their intenions of better health for their patients.
In App.D, two other contenders to replace for BMI are “New BMI” that still uses only w & h, and “BFATI” with sizes in mm that force results into the ballpark, shown. As with BMI, any index that is not based on body density often shows a healthy person as obese or underweight, a determination far less correct than BDIn.
- Calculated BD and BDIn v. BMI for 20 body datasets in yellow s columns (in Imperial units), sorted by increasing body density BD
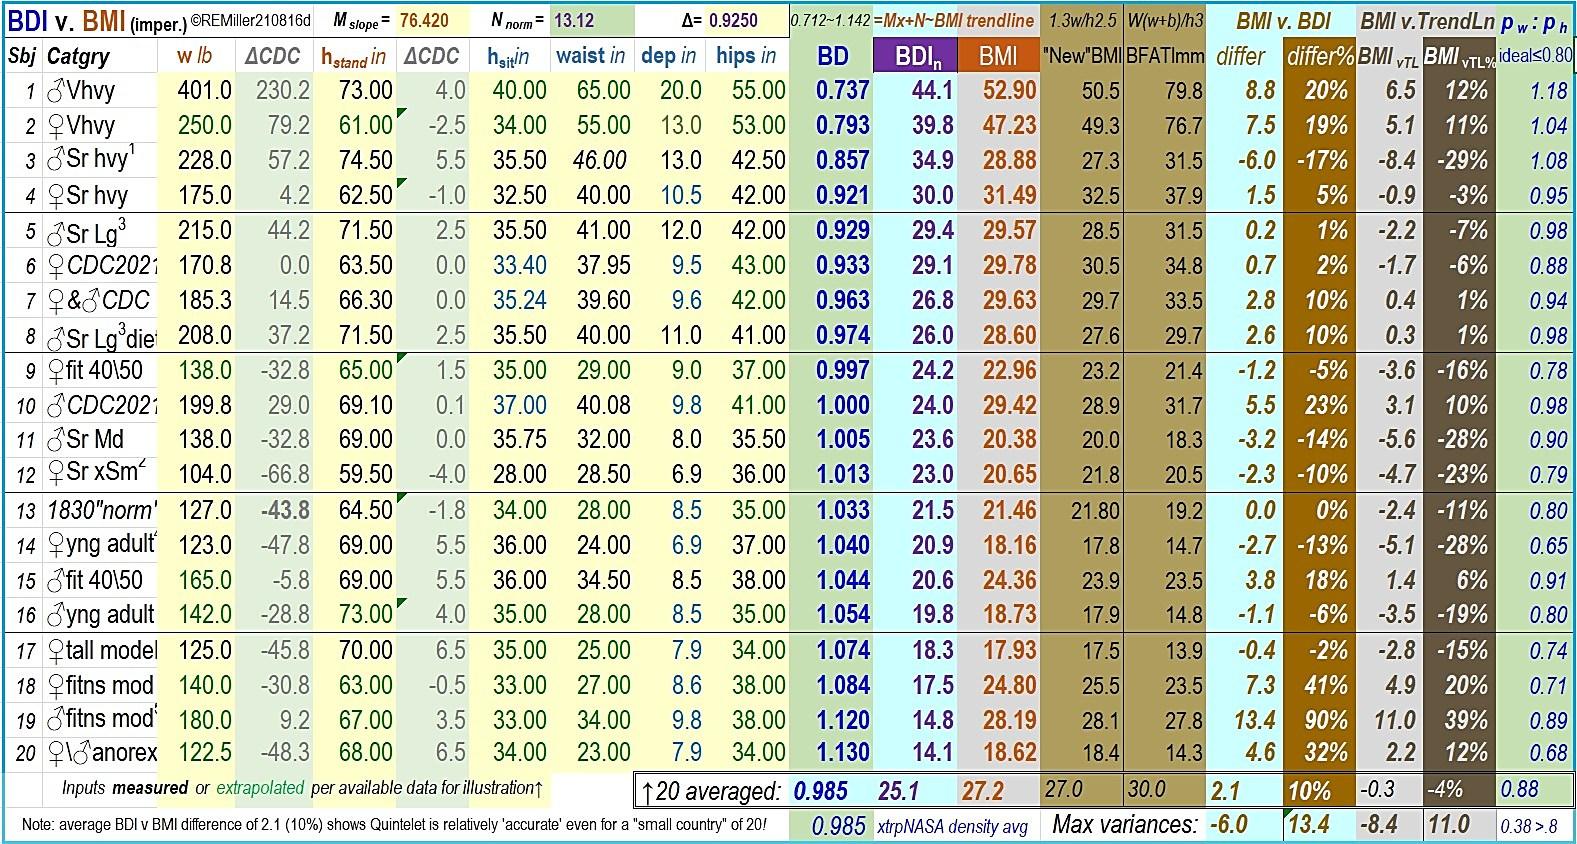
Illustrative data are in black or extrapolated in green. Reference CDC averages are in gray; waist:hips ratios at far right and Max variance >0.80. “New BMI”=1.3w/h2.5 is still based only on w & h. The BMI-BDIn “differ” and “BMIvTL” columns and, across the bottom, their averages or descended min\maxima compare performance of BDIn v. BMI in Fig.1. The BMI formula, invented in 1832, specified it was appropriate only averaging a population, but not for individuals; BDIn is more appropriate for individuals by accurately estimating body volume and density.
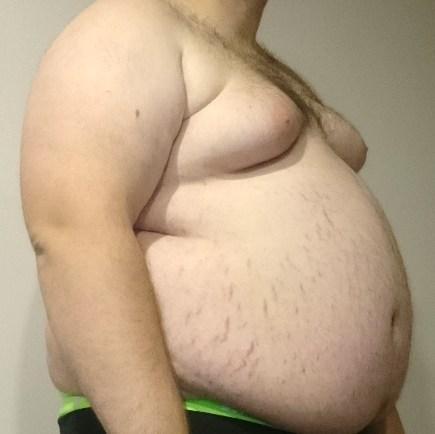
#1 (at right in images on p1) ~#4 are at risk due to obesity or morbid obesity
#3 is tall with a trunk maximum of 47.5in above his waist, but a minimum of 44.5in. Although not obese per a BMI of 28.9, he is at risk 6 points higher in BDIn
#5 & #8 is the author at 215lb and 208lb mid-diet, a 1-point drop in BMI, but 3+ points lower BDIn with an inch reduced waist, depth, & hips. Most loss is in his trunk, equal to 3.2 liters of H2O, equating to 7lb weight lost. (His goal is <200.)
#6, #7, & #10 are not individuals, but CDC-average American women & men for reference. Females remain borderline obese in BMI and BDIn while males in BDIn reclassify to just overweight.
#9 is Normal in both BMI & BDIn although as a fit 40\50yo she may classify as slightly underweight if normal for females were established higher than for males.
Superscript note 1 high
47.5in, low
44.5in 2 shows low bone density prior to DEXA scan
3 near obese but normal as #8 after losing 7lb
4 does she appear underweight in image on p1?
5 underweight in BDIn, not near obese in BMI
#11 is a medium-build senior male who registers underweight in BMI but normal in BDIn, so is ill-advised to put on weight.
#12‘s normal BMI is low for her weight & petite figure, her higher BDIn inviting suspicion of a bone deficiency prior to diagnosis by a DEXA-scan
#13 is Quetelet’s 1830 “normal.” #14 is the female on p1 is underweight in BMI, but is healthy in BDIn. #15 is near overweight by BMI, but is normal in BDIn.
Scoring less underweight in BDIn than in BMI, #16 is a typically slender young adult male, and #17 a runway model-like female. Fit athletes often score higher in BMI, yet female fitness model #18 is normal in BMI, but underweight in BDIn
#19 is borderline obese in BMI, but registers severely underweight in BDIn We deem #20 nearly OK in BMI, but is dangerously underweight in BDIn
Propagation of uncertainty, error compensation, other variables
Table 1’s column “BMIvTL” has erratic errors due to its formula For a different reason, BDIn could err by as much as 0.15l (~4.5oz of fat) due to sloppy measurements. Off by ½ inch (~1cm) in any three of the five size measurements could cause such an error. BDIn results are only as good as its inputs, prescribed in Appx.A
BDIn’s volume model relies on assumptions with errors deemed small cf. overall error. E.g. average head density is ~1.1g/cm3, its volume equivalent to ~10% larger o 16 Bodily features beyond the trunk in Fig.2L may not entirely fill voids above the shoulders. To compensate, Δ ≈ 0.925 brings the average BD to the accepted 0.985kg/l for an ~7.5% smaller Vtrunk to complete expression [18] for BDIn. Procedures in Appx.A assure results superior to BMI.
We carry math to at least three significant digits after rounding, four digits if a “1” is leading. In a few expressions we use “≈” for “approximately equal.” With only 20 subjects, Table.1 & Fig.1 are sensitive to each added dataset. Statistical analysis of variance (ANOVA) of a range of subjects (≥601) would settle variables M, N, & Δ as constants. Simple clinical trials could provide that data
Discussion & further work
In the 1830s, one 5ft 4in weighing 127 lb with >1.0 g/cm3 body density is petite & lean cf. Americans today, whose ~0.985 g/cm3 mean reveals fat has overtaken muscle. One need only visit an American mall to observe all sizes & shapes of women & men: wannabe runway models defying hsit ≈ Lleg vs. long-torsoe-shortlegged individuals. Ratios of waist-to-hips much higher than the desirable 0.7~0.9 for females to males varying by cultureal norms (calculated in Table.1 under column “pw:ph” from BDIn data).
Ignoring salient body differences, BMI misleads re individual adiposity. Fat weighs less than muscle: a fat person weighs less per liter than a lean. Yet as the proportion of muscle rises, BMI rises! p Note those individuals in Table 1 who are mis-categorized in BMI: five as borderline obese who are not, two as healthy who are severely underweight. q In Appx.D, other indices are plotted against the density BD that renders BDIn linear In Fig.3, more data for this paper’s Vbody may slightly re-slope (adjust sensisitivy) of BDIn’s trendline, but will not render other indices less erratic.
Several sets of arbitrary categories of adiposity for BMI have been proposed, standardized in 1995 by global health authorities: nine categories from “severely underweight” to three classes of obesity with thresholds of 30, 35, & 40. Suspiciously roundnumbered sets (except for two band-aid Asian categories) do not present adiposity credibly BDIn’s higher precision may warrant more nuanced categories by gender, race, & age (adding children
o Barber, Brockway, Higgins 1970-“The density of tissues in and about the head.” p “You’re Overweight. Or are you?” https://www.wsj.com/articles/youre-overweight-orare-you-11628847001?st=16n04rqqtkgnqqo&reflink=article_copyURL_share - WSJ
& seniors) that are easily implemented by check boxes in an app. An app could be agnostic to round numbers Should a consensus arise for more objective boundaries, the scalable form BDIx prior to normalizing needs only rescaling M & N. Changes in categories do not diminish BDIx or BDIn as the successor metric of adiposity.
Optimized categories or rescaling BDIn from the scalable form BDIx could include children or those short of stature from illness, dwarfism, or Down’s Syndrome for whom (arm-span + Lleg)/h = about 2.7 hsit that is about 10% lower than that ratio for adults of normal stature, or for those who have lost all or parts of limbs r
Several interviewees stressed that being told their BMI was emotionally devastating to their self-image. A truer BDIn could ameliorate these reactions, and allow patients to focus on heeding physicians’ advice about their health undistracted
Conclusions – should BDIn replace BMI?
To track the public health of Belgium, Quetelet in 1832 devised a brilliant statistical axiom w/h2 It worked because averaging large numbers smooths its errors. Quetelet ruled out use for individuals, as for each the proper indicator of individual fatness v. leanness is body density, weight divided by volume, w/V Yet in 1972, Ancel Keys hijacked Quetelet’s formula, re-naming it “BMI,” for an individual obesity index to escalate life insurance rates!
Soon BMI was adopted uncritically by the global healthcare community, who read a patient’s obesity from a chart. Imposing an arithmetic average on a person regardless of leanness has been criticized for 50+years as a gross miscarriage of medical science Finally BMI has been ill-advised by the AMA and NIH.
“Use of BMI as a measure of adiposity and predictor of health risks (cardiovascular, stroke, type 2 diabetes, cancer) requires understanding its limitations for an individual… BMI [exhibits] an appreciable variance (60–70%) in measured fatness in groups of adults… an unreliable indicator of the body composition of an individual.” 17 In general varying in bone & muscle, women, children, and non-white races have no “Normal” enshrined, imposing on them in error the Normal 21.5 of a white male.
Fig.1 illustrates 20 “individuals” in Table.1 whose BMIs careen erratically –8.4 points below to +11.0 above BMI’s own trendline, where they ought to lie Misused for indicating the adiposity of an individual, BMI ignores shape, age gender, and race. Ex.1 & 2 show that any two individuals identical in weight & height will have the same BMI despite who’s fat and who’s lean. Orange BMI data points in Fig.1 & Fig.3 whiplash by individual body density. BMI’s 11 round-numbered fatness categories are also suspect. As a replacement for BMI, this paper introduces BDIn in
q Scaled to 5'9” 110lbs, Barbie’s BMI is 16; adding waist 18in & hips 33, BDIn is 9!
r https://www.researchgate.net/publication/5462786_Auxology_Is_a_Valuable_Instrument_for_the_Clini cal_Diagnosis_of_SHOX_Haploinsufficiency_in_School-Age_Children_with_Unexplained_Short_Stature/
blue, Body Density Index normalized to current familiar BMI categories, as an accurate index of adiposity for any individual.
In this paper, BDIn by design is inclusive of all individuals. BDIn is based on a bio-engineering model of individual body volume using only four additional measurements that with practice take only one minute more to make. The model need not be perfect, only be better than BMI’s using only one measurement (height squared) for volume. From the more accurate volume we find body density BD, and a scalable body density in the form of BDIx to fit any categories. For mainstream acceptance, we normalize BDIx to BMI’s familiar categories and sensitivity slope as BDIn.
With data gathered per Appx.A and calculated online, BDIn translates as better clinical health assessment and advice re weight-related risks, and with fewer unintended mental health consequences for patients distracted from that advice by anxiety over body image. A full-featured online calculator app is free at https://docs.google.com/spreadsheets/d/1IWthOCmxGyL5mqL7epKoFLr uWMsySq_JjC_0Zlcq1oI/ after in-app request for permission to use
Precision of BDIn depends on this paper’s volume model from clinical measurements. Greater precision may be unnecessary, and entails more measurements that are awkward for patient and clinician, e.g. caliper measures of hip depth or leg breadth
For most individuals, BMI distorts body fatness between 13.4 points too high to –6 too low. However BDIn normalized to BMI categories is linear, undistorted, based on accurate body density for any individual body shape and leanness, as in Fig.1 & Table 1 Evaluated alongside BDIn confirms that BMI is unsuitable to continue in clinical use as a reliable measure of adiposity, and that this paper’s proposed BDIn is a suitable successor.
Appendix A – BDIn measurement method & calculation
This paper’s model in Fig.2 L calculates Vbody from five (5) size measures: the usual overall height h, plus sitting height hsit, waist depth d, and perimeters waist pw and hips ph that with practice take one minute more to measure. BDIn results are only as good as inputs to the nearest ¼in (½cm) and ½lb (¼kg). Do not use clothing sizes that are typically smaller than real sizes Have the subject to relax (no sucking-in). The six BDIn measurements are:
w weight (same as BMI) to the nearest ±0.5lb (0.25kg);
h standing height (same as BMI) to the nearest 0.25in (0.5cm);
hsit sitting height (“crown to rump” seated on a firm surface, with feet suspended for no pressure) to the nearest ±¼in or ½cm;
pw waist perimeter (around small of back, standing) ±0.25in (0.5cm); d depth of trunk (from small of the back, standing) ±0.25in (0.5cm); s ph hips perimeter (around rump's widest, standing) ±0.25in (0.5cm)
Enter data in the online calculator,t or copy & paste the BDIn expression (19) in any online search field, e.g. Google, or in a spreadsheet cell, substitute (select precisely & overtype, no spaces) the units constant C (1,000 for metric or 27.68 for Imperial) and all measured inputs in bold italics in the same units as C, and press Enter.u The calculated result is BDIn =
=13.12+76.4*(1.142-C*w/((0.925*hsit*3.14*d*((0.1904*ph+(pw^2/(2*3.14^2)(d/2)^2)^0.5))/4)+0.0277*ph^2*(h-hsit))) (index normalized to BMI) [19]
To compare indices, similarly paste in a search field or spreadsheet cell: BMImetric =w/h^2 or BMIImperial =703*w/h^2;
Appendix B – CDC 2021 average h, w, & pw of Americans ≥20yr v
Height h Men: 69.0 Women: 63.5 Overall: 66.25 in Weight w 199.8 170.8
*Prior 2015~18 ranges: US adult males BMI 24.2~30.1; females BMI 24.2~32.9 By 2021 males on average became 4% heavier and females 6%, all up a full point in BMI - https://www.cdc.gov/nchs/data/series/sr_03/sr03-046-508.pdf
Appendix C – critical body volume Vbody calculation as modeled w Vbody is modeled in Fig.2L as an elliptical cylinder and truncated cones for legs. Ellipses (or special case a circle of a rotund body) have semi-minor & semi-major axes a & b and area A =πab Then
(d/2)btrnkh
where atrnk = d/2, the measured trunk depth, hsit is sitting height, and btrunk calculated next from waist & hips perimeters pw & ph
NASA published data for 40yr-old Americans in 2000.x The 50th percentile ratio of hip breadth, 2*bh in Fig.2L, to generalized bust depth d is 0.6510 for men or 0.6083 for women,18 each within ~4% of their average of 0.630 The hips in typical cross-section are determined by hipbone geometry, modelled by an ellipse of ratio 0.630, ah : bh (ah not shown), dimensioned by hips perimeter ph We find bh from ph. Then 0.630bh substitutes for ah
For any ellipse the relationship between a & b and perimeter p involves integral calculus. Happily an estimate of p within 2% is the root mean square (RMS) p=2π√((a2+b2)/2)), then y
[6].
s By body caliper, or solid wire bent to an Ω-shape, tightened to graze the skin
thttps://docs.google.com/spreadsheets/d/1IWthOCmxGyL5mqL7 epKoFLruWMsySq_JjC_0Zlcq1oI/
u Scaling variables M, N, & Δ become constants with more datasets. v https://www.cdc.gov/nchs/fastats/body-measurements.htm – cf. Table.1.
w For continuity formulae numbers continue after [4] page 2 and resume page 3 x https://msis.jsc.nasa.gov/sections/section03.htm – The US mean age is 38yr Note NASA’s typo “Japanese female” titling the chart for American female. Other anthropometric data at - https://www.ncbi.nlm.nih.gov/pmc/articles/PMC2872302/ y p=2π√((a2+b2)/2)), p2=2π
Unlike the hips ellipse, the waist of perimeter pw is an ellipse where aw= atrnk = d/2 (half measured trunk depth), ranging from a flat tummy to an obese circle, or more The waist semi-major axis
bw ≈√(pw 2/2π2 – aw 2) ≈ √(pw 2/2π2 – (d/2)2) m [7].
Fig.2L shows a trunk volume of hsit times the area of an ellipse that we imagine by averaging waist & hips (either one larger). Substituting in [5] a trunk half-breadth average btrnk = (bh + bw)/2
Vtrunk1st ≈ π(d/2)btrnkhsit ≈ hsitπ(d/2)(bh+bw)/2
≈ ¼Δhsitπd(0.1904ph+√(pw 2/2π2 –(d/2)2)) m3 [8].z
We complete this 1st approximation of trunk volume in the Errors uncertainties section to correct by a factor Δ for voids not filled by other trunk features or the head’s equivalent volume.
With better nutrition and less disease, we’ve evolved longerlegged than da Vinci’s Vitruvian Man. We define leg height not by the joints in Fig.2R, but standing height h minus hsit that extends from below the hip joints.aa A first approximation of a leg volume is ⅓Lleg times the cone base area of radius bh/2, so rleg= 0.0952ph.
Vleg1st ≈ ⅓A*Lleg ≈ ⅓πr2(h–hsit) ≈ ⅓π(0.0952ph)2(h – hsit) m3 [9].
Then the 1st approximation of the volume of two legs simplifies to Vlegs(2)1st ≈ ⅔π0.00906ph2(h – hsit) ≈0.018981ph2(h – hsit) m3 [10].
Refining the model, in Fig.2L the dancer is en pointe, but unsquooshed, as in zero gravity. Foot length averages ~0.1515h, bb 19 or ~0.3030Lleg for Lleg~h/2 By Fig.2R, the ankle joint is above the floor at 0.039h, or ~0.078Lleg Lleg elongates toes to virtually below the floor by 0.3030–0.078 ≈ 0.225. 20 So the 1st of 3 adjustment coefficients applied to Lleg is 1.000+0.225 ≈1.225Lleg
By observation, the dancers’ toes do not come to a point, but truncate the leg cone visualized in a circle of diameter ~b/5 after extending Lleg further by ~1/5. The truncation area is a squared fraction of the base cone, or 12/52 =1/25; the truncation volume a cubed ratio ~13/53 =1/125 or a factor of ~0.992. The three leg cone refinements combine to 1.225*1.20*0.992 =1.458 as in
Vlegs(2) ≈ 0.01898ph2*Lleg*1.458 ≈ 0.0277ph2(h – hsit) m3 [11]
As said, the most critical in determining body density is volume. W, only that one’s body density be one’s weight divided by a volume more accurate than BMI’s using h2 . From [4] with inputs in bold, and Δ a volume model correction factor described later, the combined Vtrunk + Vlegs(2) = Vbody
≈Δhsitπd(0.1904ph+√(pw2/(2π2)-(d/2)2))/4+0.0277ph2(h–hsit) m3 [12]
This seemingly daunting expression is simple for a computer to determine individual Body Density BD, continuing on page 3.
z Vtrnk ≈ hsitπ(d/2)*(bh+bw)/2 ≈ ¼hsitπd*(bh+bw)
aa Sitting height hsit measured per Appx A; leg length (subischial) Lleg = h – hsit bb Univ RI Electrical, Computer & Biomed Eng; K T Davis, TX Tech Univ 1990 https://ttu-ir.tdl.org/bitstream/handle/2346/8468/31295005963201.pdf?sequence=1&isAllowed=y
Appendix D – other BMI replacements: “New BMI” and “BFATI”
Others have proposed improving upon BMI (“BFATI” or “New BMI” in Fig.3), or perfecting the measure of body density (Mayo Clinic’s body volume scanner. A viable argument by University of Rochester’s Holly Russell MD is not to measure at all, that the best evaluator of a patient’s “ideal weight” may be a physician’s expert observation. In the overline on p1, the author’s GP said: “Your BMI is borderline obese, but you don’t look obese!” After all, which of us does not form an opinion about another’s shape? Visible muscle definition in extremities & abdomen may in many cases be a more accurate indicator of adiposity than BMI! A worthy study would be to compare observations with BDIn

Fig.3 - Compared to this paper’s BDIn, “New BMI” and “BFATI” are as erratic by individual as BMI – all are based on similar formulae that miscalculate density.
The author, editors, & reviewers
Internationally recognized engineer, graduate school professor, and Peabody winning filmmaker Robin Miller has communicated health issues from cardiac catheterization methods to physical & mental disabilities cc He’s presented research to symposia in the US, Canada, Germany, Austria, The Netherlands, and Italy A protégé of an inventor of the ENIAC computer, as Filmaker Technology he works in systems design, integration, & publication at www.filmaker.com. With this paper he solves a biomedical engineering problem with an applied scientist’s sense of what we can economically model and implement. A
Editor Yehia Y Mishriki MD is a widely published clinician and educator specializing in internal medicine. Now Emeritus Professor of Medicine of the Lehigh Valley Health Network, his career spanned decades with Eastern Pennsylvania’s largest
cc Seminar for 200 cardiologists by Fayaz A Schall MD televised from Washington Adventist Hosp., Alzheimer’s therapies, occupational tool adaptations for persons with disabilities, and pioneering use of amniocentesis (aired on 200 PBS stations and winner of Corporation for Public Broadcasting “Outstanding Documentary”).
healthcare provider. He’s cited frequently having authored more than one hundred scholarly works on medical science, diagnosis, and treatment.
Editor Gilbert H Aykroyd BSEE has served PBS national committees, the Society of Motion Picture & Television Engineers (SMPTE), and Arizona Society of Broadcast Engineers (SBE). As CTO of #9 market KAET-TV8, he supervised construction and moving operations to a 6-story building in downtown Phoenix AZ, and converting both TV8 and WLVT-TV39, Allentown PA, to digital High Definition.
Peer reviewers: Terrill E Theman MD & bio-engineering prof, Lehigh Univ; thoracic surgeon, retired; James J Boylan MD, John S Kintzer MD St Lukes Univ. Health
Two upon whose shoulders we stand (quoting other researchers)… “A social sciences founder, Adolphe Quetelet’s (1796~1874) 1835 ‘Treatise of Man and the Development of his Faculties’ was hailed ‘one of the greatest books of the 19th century ’ A tireless promoter of statistical data collection and analysis,
Quetelet organized in 1853 the first International Statistical Congress.” 21 More than a century later in 1972, Quetelet’s brilliant 1832 analysis tracking of a nation’s health was renamed “BMI” by Ancel Keys, below Note in Table.1 that when averaged even over a ‘very small country’s’ population of 20, Quintelet’s Formula becomes accurate within 2.1 points (10%) of BDIn based on individual body density, a testiment to his statistical approach invoking ‘the law of large numbers.’
“Physiologist Ancel Keys’ (1904~2004, developer of K-rations) ‘Seven Countries Study’ culminated 20+ years’ effort to discredit MetLife’s weight-for-height ratio as a measure of obesity in its actuarial tables. In the study, Keys coined Quetelet’s formula “BMI,” universally used for 50+ years since, leading to fatness categories established in 1995 by the WHO, but today ill-advised by the AMA and the NIH Keys’ study drew criticism for including only males, deleting data that didn’t suit his hypothesis, and failing in its claim that BMI was a predictor of heart disease. 22
A This paper and its methods are the intellectual property of its author or his heirs or assigns. Dissemination of any of its content beyond a brief attributed quotation or review is prohibited without his expressed permission in writing. Development of its concepts by 3rd parties is encouraged with acknowledgement of the author under CC BY-NC. Incidental use of others’ intellectual property is deemed Fair Use for educational purposes under U.S. Copyright law. The author has no conflicts of interest. An abridged version for health professionals has been submitted to medical journals. This original paper contains full math derivations and link to an online calculator of BDIn FilmakerTechnology White Papers are educational, semi-technical on practical topics. Some differ from fully scientific ones in references and supplemental math handy in page footnotes and are only informally peer-reviewed. For general readers, they are intended as no less useful. Updates are posted at www.filmaker.com/papers.htm
Bibliography
1 Romero-Corral A, Somers VK, Sierra-Johnson J, Thomas RJ, Collazo-Clavell ML, Korinek J, Allison TG, Batsis JA, Sert-Kuniyoshi FH, Lopez-Jimenez F. Accuracy of body mass index in diagnosing obesity in the adult general population. Int J Obes (Lond). 2008Jun;32(6):959-66. doi:10.1038/ijo.2008.11. Epub 2008 Feb19. PMID: 18283284; PMCID:PMC2877506.
2 Wellens RI, Roche AF, Khamis HJ, Jackson AS, Pollock ML, Siervogel RM. Relationships between the Body Mass Index and body composition. Obes Res. 1996 Jan;4(1):35-44. doi: 10.1002/j.1550-8528.1996.tb00510.x. PMID: 8787936.
3 Frankenfield DC, Rowe WA, Cooney RN, Smith JS, Becker D. Limits of body mass index to detect obesity and predict body composition. Nutrition. 2001 Jan;17(1):26-30. doi: 10.1016/s0899-9007(00)00471-8. PMID: 11165884.
4 Gallagher D, Visser M, Sepúlveda D, Pierson RN, Harris T, Heymsfield SB. How useful is body mass index for comparison of body fatness across age, sex, and ethnic groups? Am J Epidemiol. 1996 Feb 1;143(3):228-39. doi: 10.1093/oxfordjournals.aje.a008733. PMID: 8561156.
5 Nuttall FQ. Body Mass Index: obesity, BMI, and health: A Critical Review. Nutr Today. 2015 May;50(3):117-128. doi: 10.1097/NT.0000000000000092. Epub 2015 Apr 7. PMID: 27340299; PMCID: PMC4890841.
6 Deurenberg P, Deurenberg-Yap M, Guricci S. Asians are different from Caucasians and from each other in their body mass index/body fat per cent relationship. Obes Rev. 2002 Aug;3(3):141-6. doi: 10.1046/j.1467- 789x.2002.00065.x. PMID: 12164465.
7 Trefethen, N. How to shed the fat. Economist [Internet]. 2013 Jan 5 [cited 2021 Oct 8];406(8817):12. Available from: https://search-ebscohostcom.ezalumni.libraries.psu.edu/login.aspx?direct=true&db=a2h&AN=84668245&site=ehost-live
8 Eknoyan G. Adolphe Quetelet - the average man and indices of obesity. Nephrol Dial Transplant. 2008 Jan;23(1):47-51. doi: 10.1093/ndt/gfm517. Epub 2007 Sep 22. PMID: 17890752.
9 New weight standards for men and women. Stat Bull Metrop Insur Co. 1959;40:1-4. [Weight-for-height only, not BMI.]
10 Humphreys S. “The unethical use of BMI in contemporary general practice” - https://pmc.ncbi.nlm.nih.gov/articles/PMC2930234/
11 Weir CB, Jan A. BMI classification percentile and cut off points. [Updated 2021 Jun 29]. In: StatPearls [Internet]. Treasure Island (FL): Stat Pearls Publishing; 2021 JanAvailable from: https://www.ncbi.nlm.nih.gov/books/NBK541070/
12 Oliveros E, Somers VK, Sochor O, Goel K, Lopez-Jimenez F. The concept of normal weight obesity. Prog Cardiovasc Dis. 2014 Jan-Feb;56(4):426-33. doi: 10.1016/j.pcad.2013.10.003. Epub 2013 Oct 5. PMID: 24438734.
13 Millett ERC, Peters SAE, Woodward M. Sex differences in risk factors for myocardial infarction: cohort study of UK Biobank participants. BMJ. 2018;363:k4247.
14 https://msis.jsc.nasa.gov/sections/section03.htm#Figure%203.3.1.3-1
15 Zioupos P, Cook RB, Hutchinson JR. Some basic relationships between density values in cancellous and cortical bone. J Biomech. 2008;41(9):1961-8. doi: 10.1016/j.jbiomech.2008.03.025. Epub 2008 May 23. PMID: 18501911.
16 Barber TW, Brockway JA, Higgins LS. The density of tissues in and about the head. Acta Neurol Scand. 1970;46(1):85-92. doi:10.1111/j.1600-0404.1970.tb05606.x
17 Henry C Lukaski - “Commentary: Body mass index persists as a sensible beginning to comprehensive risk assessment” - https://pubmed.ncbi.nlm.nih.gov/24691950/
18 Davis KT. The foot length to stature ratio: a study of racial variance. Thesis [Internet]. Luboch,TX: Texas Tech University; 1990. Available from: https://ttu-ir.tdl.org/handle/2346/8468
19 Drillis, R. and Contini, R. (1966) Body segment parameters.Tech. Rep. No. 1166.03, New York University, New York, N.Y.
20 Medeiros DM, Wildman REC. Advanced human nutrition. 4th ed. Burlington,MA: Jones & Bartlett Learning; 2018.
21 Garabed Eknoyan – “Adolphe Quetelet (1796-1874) the average man and indices of obesity - https://pubmed.ncbi.nlm.nih.gov/17890752/#article-details
22 Nicolas Rasmussen – “Downsizing obesity: On Ancel Keys, the origins of BMI, and the neglect of excess weight as a health hazard in the United States from the 1950s to 1970s” - https://pubmed.ncbi.nlm.nih.gov/31338844/