FLORIDA HOUSING FINANCE CORPORATION


ANNUAL REPORT 2022
FROM THE EXECUTIVE DIRECTOR
Under Governor DeSantis’ leadership, Florida’s economy is booming, we have record low unemployment, and freedoms that present opportunities around every corner. People want to live here, work here, raise families here, retire here and are excited about the promise and possibilities that await. As a result, Florida is experiencing tremendous growth with close to a thousand people moving here every day.
While we all celebrate the growth and opportunities for our state, we face the challenge of meeting the housing needs of all Floridians. Our mission is to ensure that quality and attainable housing is available for families, senior citizens, persons with special needs, and households of all incomes where they can live near their employment, advance their careers, easily access community resources, and live their fullest lives.
In 2023, we have witnessed and will be part of the most transformational affordable housing investment in a generation. We’re honored to have the overwhelming support of Governor DeSantis and our Legislature, who through the Live Local Act committed $711 million to affordable housing for this upcoming fiscal year. In addition to full funding for the State Housing Initiatives Partnerships (SHIP) and State Apartment Incentive Loan (SAIL) programs, Governor DeSantis’ incredibly successful Hometown Heroes Program will receive an additional $100 million to help more working households afford to buy a home. In tandem with the historic investment of state resources, the Live Local Act also incentivizes and promotes an efficient, innovative, and holistic approach to affordable and workforce housing.
We need to continue to effectively and efficiently administer our hallmark state-funded programs – SHIP and SAIL – but we must also lead with new and enhanced data driven strategies that innovatively meet the housing needs of our communities and its citizens. That is what our elected leaders also recognized and committed to do with the development and enactment of the Live Local Act.
This housing push will stimulate and refocus Florida’s affordable housing strategy by adding new incentives for private developers to accelerate and increase workforce housing through new tax exemptions. It also encourages local governments to find ways to redevelop areas that reinvigorate and revitalize communities across our state. It looks at strategies and approaches that build on our existing homeownership and rental efforts, but also emphasizes looking for ways to create new mixed-use developments, where people can work and “live local.”
Florida Housing has done much over the last 43 years to provide a range of quality, affordable housing opportunities, which are pillars of what makes Florida a wonderful place to live. As this annual report reflects, Florida Housing experienced major accomplishments despite 2022 being a very challenging year. Rising housing prices and rents, increased development costs and delays, construction material shortages, and major natural disasters were challenges that we, together with our partners, faced head on. These circumstances have helped us all to sharpen our focus, knowledge and resolve to meet the housing needs of our great state.
These are exciting times. The positivity and energy we are experiencing to collectively address the need for affordable and workforce housing is inspiring. I am incredibly excited to work with our Governor, Legislature, Board of Directors, staff and stakeholders to help meet the housing needs of Florida’s citizens. I am confident that the future is even brighter.
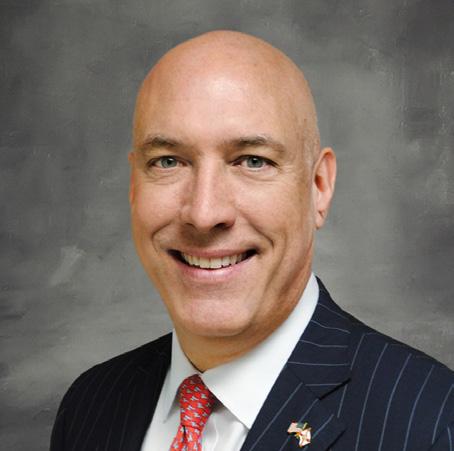
Michael DiNapoli Executive Director
1 2022 Annual Report
Letter from the Executive Director .......................................................................................................................................... 1 Programs-at-a-glance 4 Rental Units In-Service or In the Pipeline Financed by Florida Housing 5 Economic Stimulus Created by Florida Housing’s Programs 6 HOMEOWNERSHIP PROGRAMS .......................................................................................................... 9 Homebuyer Loan Programs ................................................................................................................................................... 9 Salute Our Soldiers Military Loan Program .......................................................................................................................... 9 Homeownership Pool Program .............................................................................................................................................. 9 Florida Hometown Heroes Housing Program 10 Florida Hometown Heroes Housing Testimonials 11 Down Payment Assistance Programs....................................................................................................................................12 Homeownership Assistance Program - Florida Assist (HAP) ..............................................................................................12 Homeownership Loan Program (HLP) Second Mortgage..................................................................................................12 HFA Preferred Plus Program 12 RENTAL HOUSING PROGRAMS ......................................................................................................... 15 Requests for Applications Receiving Awards 15 State Apartment Incentive Loan Program 16 Multifamily Mortgage Revenue Bonds ............................................................................................................................... 16 Low Income Housing Tax Credits ........................................................................................................................................ 17 Florida Affordable Housing Guarantee Program 17 HOME Investment Partnerships Program 18 Housing Stability for Homeless Schoolchildren Initiative 18 HOME-ARP (American Rescue Plan) .................................................................................................................................. 18 National Housing Trust Fund ................................................................................................................................................ 19 Construction Housing Inflation Response Program (CHIRP) 19 Link Strategy 20 Asset Management of Developments in Florida Housing’s Rental Portfolio 20 SPECIAL PROGRAMS .......................................................................................................................... 23 State Housing Initiatives Partnership ................................................................................................................................... 23 Hurricane Housing Recovery Program ............................................................................................................................... 23 Predevelopment Loan Program ............................................................................................................................................ 24 Training and Technical Assistance 24 Affordable Housing Catalyst Program 24 PLP Technical Assistance ....................................................................................................................................................... 24 Affordable Rental Housing Locator: FloridaHousingSearch.org ...................................................................................... 25
2 Florida Housing Finance Corporation
TABLE OF CONTENTS
DEMOGRAPHICS AND CHARTS SUMMARY OF PROGRAMS ............................................................. 26 HOMEOWNERSHIP PROGRAMS ........................................................................................................ 28 Homes Funded Through the Homebuyer Loan and Down Payment Assistance Programs ............................................. 28 Homebuyer Loan and Down Payment Assistance Program Demographics .................................................................... 32 Homeownership Pool Program (HOP) 33 Homeownership Pool Program (HOP) Demographics 33 Hometown Heroes Program ................................................................................................................................................ 34 Hometown Heroes Program Demographics ...................................................................................................................... 35 RENTAL PROGRAMS ........................................................................................................................... 36 State Apartment Incentive Loans 36 Low Income Housing Tax Credits (9%) 38 Low Income Housing Tax Credits (4%) ............................................................................................................................... 40 National Housing Trust Fund ................................................................................................................................................ 42 Homeless Schoolchildren Tenant-Based Rental Assistance (TBRA) .................................................................................. 42 Multifamily Mortgage Revenue Bonds 43 Community Development Block Grant - Disaster Recovery Viability Loans 43 HOME Investment Partnerships Program ............................................................................................................................ 44 HOME Investment Partnerships - American Rescue Plan .................................................................................................. 45 Construction Housing Inflation Response Program (CHIRP).............................................................................................. 46 Rental Properties Awarded Funding 48 SPECIAL PROGRAMS .......................................................................................................................... 64 Predevelopment Loan Program Homeownership Loans Approved for Funding .............................................................. 64 Predevelopment Loan Program Rental Loans Approved for Funding 64 Hurricane Housing Recovery Program (HHRP) .................................................................................................................. 65 State Housing Initiatives Partnership (SHIP) Distribution and Allocation of 2019-2020 Funds 66 RENTAL PORTFOLIO ............................................................................................................................ 74 Average Rents Charged at Rental Properties in Florida Housing’s Portfolio as of December 31, 2022 74 Demographic Characteristics of Renters Living in Properties Financed by Florida Housing 76 Guarantee Program Status of Loans for Multifamily Developments as of December 31, 2022 .................................... 76 Occupancy Rates for Active, Reporting Units in Florida Housing’s Portfolio ................................................................... 77 Predevelopment Loan Program Loan Summary as of December 31, 2022 78 State Apartment Incentive Loan Program Loans Outstanding as of December 31, 2022 .............................................. 80 Board of Directors 109 Attribution of Properties 111
3 2022 Annual Report
TABLE OF CONTENTS
PROGRAMS-AT-A-GLANCE1
Notes:
1 See the Demographics and Charts in the back of this report for more detailed information on this chart.
2 The number of units is equivalent to the number of households served. In order to serve lower income households, resources from more than one program are sometimes combined. Therefore, grand totals for rental and homeownership program areas are less than the sum of the individual programs due to program overlap. If financing was provided this year for units already funded in a recent, prior year, these units were not counted in this year's grand totals.
3 This program is typically funded by revenues from documentary stamp taxes. In some cases state funding is appropriated on a year by year basis for special programs.
4 Florida Housing Finance Corporation
Total Homeowners Served or Units Funded 2 .................................................................................. 7,966 Homebuyer Loan Programs ...................................................................................................................................... 5,533 Down Payment Assistance......................................................................................................................................... 5,502 Homeownership Assistance Program - Florida Assist 3 2,716 HFA Preferred PLUS Grants 188 Florida HLP Second Mortgage ............................................................................................................................. 102 Hometown Heroes ............................................................................................................................................ 2,362 Salute Our Soldiers 361 Homeownership Pool Program (HOP) 87 State Housing Initiatives Partnership (SHIP) 3 ......................................................................................................... 2,346 Predevelopment Loan Program (PLP) 3 ........................................................................................................................... 63 HOMEOWNERSHIP PROGRAMS Total Homeowners Assisted RENTAL PROGRAMS Total Units Set-Aside Units 11,280 ............................................ 10,579 4,707 ........................................................ 4,707 4,860 4,805 7,550 7,064 1,702 .............................................................. 117 1,241 .......................................................... 1,071 267 267 386 170 447 ............................................................... 447 126 126 1,247 1,247 7,074 .......................................................... 6,987 94 ..................................................................... 19 Total Units Funded in 2022 2 State Apartment Incentive Loans (SAIL)³ Low Income Housing Tax Credits (9%) Low Income Housing Tax Credits (4%) National Housing Trust Fund Multifamily Mortgage Revenue Bonds (MMRB) HOME Rental Program HOME Investment Partnerships - American Rescue Plan CDBG-Disaster Recovery Viability Loans Housing Stability for Homeless Schoolchildren State Housing Initiatives Partnership (SHIP)³ Construction Housing Inflation Response Program (CHIRP) Predevelopment Loan Program (PLP)³
RENTAL UNITS IN-SERVICE OR IN THE PIPELINE FINANCED BY FLORIDA HOUSING
This map is shaded to display a by-county count of the current active and pipeline rental units that have received an allocation of resources through Florida Housing's rental programs since 1982. These 244,092 units currently provide affordable housing or are in the construction pipeline. A majority of these units serve households earning 60% of the Area Median Income (AMI) or less.
5 2022 Annual Report
Number of Units 1,000 - 2,999 3,000 - 9,999 10,000 or More 200 - 999 0 -199 Escambia 2,475 Bay 2,693 Leon 3,907 Alachua 3,196 1,468St.Johns Marion 1,982 Hernando 1,940 Pasco 2,974 Hillsborough 19,537 Orange 29,484 Manatee 4,309 2,227Sarasota Indian River 2,420 St. Lucie 2,608 Charlotte 1,751 Lee 4,689 Palm Beach 11,711 Collier 4,618 Glades 50 1,974Monroe Santa Rosa 391 Okaloosa 797 Walton 375 Jackson 759 Gadsden 575 Suwannee 339 Columbia 501 Nassau 460 Clay 1,504 Putnam 651 Flagler 710 Levy 287 Citrus 754 447Sumter Volusia 6,371 Seminole 5,357 Polk 5,257 Osceola 8,211 4,737Brevard Lake3,499 Hardee 533 DeSoto 993 Highlands 1,020 Okeechobee 277 Martin 750 Hendry 389 Broward 17,217 Miami-Dade 49,516 Holmes 38 Washington 38 Calhoun 0 Gulf 127 Liberty 0 Franklin 206 Wakulla 121 Madison 300 Taylor 173 Hamilton 109 Jefferson 75 Gilchrist 60 Union 0 Bradford 341 Lafayette 0 Dixie 32 Duval 15,814 Baker 102 Pinellas 7,866
ECONOMIC STIMULUS CREATED BY FLORIDA HOUSING’S PROGRAMS¹
The most recent information available showing Florida Housing’s economic impact to the state is for program activity in 2021. Florida Housing leveraged funding sources totaling $1.73 billion to generate $5.94 billion in economic activity linked to the construction or rehabilitation of affordable housing units. Florida State University’s Center for Economic Forecasting and Analysis² estimated the total 2021 economic impact of Florida Housing’s programs and internal operations to be:
• $5.94 billion in economic output;
• $2.3 billion in income;
• $3.6 billion in value added; and
• 38,042 full- and part-time jobs created.
In addition, researchers at Florida State University analyzed the average ongoing economic impact created each year for the first 15 years of the rental properties funded based on the projected operations of the rental properties. The average economic impact over this period of operations is projected to be:
• $818 million in economic output annually (equal to $12.27 billion over 15 years);
• $545 million in personal income annually (equal to $8.17 billion over 15 years); and
• 3,481 full- and part-time jobs created.
1 https://www.floridahousing.org/press/publications#EconomicBenefitofFHFCPrograms
2 https://cefa.fsu.edu/
6 Florida Housing Finance Corporation
ECONOMIC STIMULUS CREATED BY FLORIDA HOUSING’S PROGRAMS
7 2022 Annual Report
8 Florida Housing Finance Corporation
HOMEOWNERSHIP PROGRAMS
Florida Housing promotes homeownership opportunities available to individuals and families across the state. Florida Housing has a number of programs that provide low interest rate first mortgage loans and down payment assistance. The following synopses present a high-level overview of active homeownership programs administered by Florida Housing and a summary of program results accomplished.
HOMEBUYER LOAN PROGRAMS
Florida Housing’s Homebuyer Loan Programs (HLP) offer 30-year, fixed-rate first mortgage loans originated by trained and approved lenders throughout the state of Florida. The programs are offered to eligible homebuyers who meet income, purchase price and other program criteria; can qualify for a loan; and successfully complete a homebuyer education course. Borrowers who qualify for this first mortgage program may access one of Florida Housing’s down payment assistance programs.
Florida Housing funds homebuyer loans through various transaction types. Key types of transactions used to settle loans purchased are: (1) the specified pool market, (2) tax-exempt bonds and (3) forward delivery/To Be Announced (TBA) market.
Program Summary
• 5,533 first-time homebuyers purchased homes using $1,381,551,060 in first mortgage funds through the HLP.
• $54,782 increase in the average HLP purchase price ($259,065 in 2022), compared to $204,283 in 2021.
• $249,693 was the average first mortgage loan amount.
SALUTE OUR SOLDIERS MILITARY LOAN PROGRAM
This program provides 30-year, fixed-rate first mortgage loans at a low interest rate coupled with down payment assistance options to eligible military service personnel and veterans who are purchasing a primary residence in Florida. Borrowers must meet income requirements, purchase price limits, and successfully complete a homebuyer education course.
Program Summary
• 361 households received a total of $99,735,838 in first mortgage assistance.
HOMEOWNERSHIP POOL PROGRAM
The Homeownership Pool (HOP) Program is a non-competitive program, with builders reserving funds for eligible homebuyers to provide down payment assistance on a first-come, first-served basis. The program is funded through the federal HOME Investment Partnerships Program (HOME).
Eligible homebuyers include those with adjusted income that does not exceed 80% of AMI. While program limits apply, homebuyers can receive a 0% deferred second mortgage loan for the amount necessary to meet underwriting criteria.
Program Summary
• 87 households were assisted, averaging $25,580 per homebuyer.
• $194,620 is the average purchase price of homes assisted through HOP.
• $2,225,438 in loans were closed.
9 2022 Annual Report
HOMEOWNERSHIP PROGRAMS
FLORIDA HOMETOWN HEROES HOUSING PROGRAM
The Florida Hometown Heroes Housing Program made homeownership affordable for eligible frontline community workers such as law enforcement officers, firefighters, educators, healthcare professionals, childcare employees, and active military or veterans. This program provides down payment and closing cost assistance to first-time, incomequalified homebuyers so they can purchase a primary residence in the community in which they work and serve. The Florida Hometown Heroes Loan Program also offers a lower first mortgage rate and additional special benefits to those who have served and continue to serve their country.
Borrowers can receive up to 5% of the first mortgage loan amount (maximum of $25,000) in down payment and closing cost assistance. DPA and closing cost assistance is available in the form of a 0%, non-amortizing, 30-year deferred second mortgage. This second mortgage becomes due and payable, in full, upon sale of the property, refinancing of the first mortgage, transfer of deed or if the homeowner no longer occupies the property as a primary residence.
Program Summary
• 2,362 households received a total of $694,014,901 in first mortgage assistance and $34,644,511 in Hometown Heroes Housing Program down payment assistance through the first six months of the program (June 1-December 31, 2022). There were an additional 793 loans in the pipeline, accounting for a total of $229,104,568 in first mortgage assistance and $11,492,399 in Hometown Heroes Housing Program down payment assistance.
10 Florida Housing Finance Corporation
FLORIDA HOMETOWN HEROES HOUSING TESTIMONIALS
“The Hometown Heroes program has changed our lives. We recently got married and have been searching for a home for more than two years, but in today’s market the finances have always been just out of reach. We heard about Florida’s Hometown Heroes program and were thrilled that Arielle qualified as a teacher. We connected with Jon Howard at the Home Loan Expert, one of Florida Housing’s participating loan officers, in early August and now just a few weeks later we are closing on our first home. It’s so nice to see that teachers and other heroes are being celebrated and we are so appreciative that the Hometown Heroes program has made our dream of homeownership a reality.”
– Arielle and Zac, first time homebuyers in Tampa, Florida
“As a loan officer that has done a lot of down payment assistance loans, Hometown Heroes is hands-down the best program I’ve come across. I feel fortunate to have qualified for it myself as a veteran, which allowed me to purchase a home even with the current challenges facing our economy. The program helped with 5% of the loan amount – a sum that I did not have readily available in my own accounts and, as such, allowed me to make this purchase happen. On behalf of veterans, first responders, and the qualified professions that have used over $80 million in state assistance to facilitate their primary home purchases, I would like to thank the Governor and our marvelous state employees for embarking on this project and making homeownership a possibility in Florida.”
“We’ve lived in many places throughout the state while Carolina worked as a nurse and have been saving for years but buying a home has always been just out of reach. Then we heard about Florida’s Hometown Heroes program and knew this could finally be our chance to set down roots. We connected with one of Florida Housing’s participating loan officers, and now just a few weeks later we are closing on our first home. We’re extremely grateful for this program and to everyone who has helped us along the way.”
– Carolina and Jordan, first time homebuyers in Clermont, Florida
11 2022 Annual Report
HOMEOWNERSHIP PROGRAMS
– Michael M., homebuyer and loan officer in Orange County, Florida
HOMEOWNERSHIP PROGRAMS
DOWN PAYMENT ASSISTANCE PROGRAMS
Down Payment Assistance (DPA) is an effective way to assist otherwise credit-qualified low-to-moderate income households achieve homeownership. Florida Housing provided DPA to borrowers through several options offered in conjunction with the Homebuyer Loan Programs. DPA is provided through the Homeownership Assistance Program –Florida Assist (HAP), the Homebuyer Loan Program (HLP) Second Mortgage, the HFA Preferred Plus Program, and the specialized Salute Our Soldiers Military Loan Program, as described below.
Homeownership Assistance Program - Florida Assist (HAP)
Up to $7,500 per household was available to eligible first-time homebuyers through the HAP to assist with DPA. These loans are 0% interest, non-amortizing second mortgage loans, which means the homebuyer does not make any monthly payments on them. Instead, the loan is repaid when the homebuyer sells the home, transfers ownership, satisfies or refinances the first mortgage, or ceases to occupy the home. These loans are for applicants whose incomes are at or below 120% of AMI, adjusted for family size.
Program Summary
• 2,850 households received a total of $27,762,601 in assistance through HAP.
Homeownership Loan Program (HLP) Second Mortgage
This second mortgage program provides up to $10,000 to assist first-time homebuyers with down payment and closing costs. The loans are 3% interest, fully amortizing second mortgage loans. The loan is amortized over 15 years which makes monthly payments more affordable to borrowers. The loan becomes due in full when the homebuyer sells the home, transfers ownership, satisfies or refinances the first mortgage, or ceases to occupy the home. Eligible applicants include households with incomes at or below 140% of AMI.
Program Summary
• 102 households received a total of $1,016,700 in HLP second mortgage funds.
HFA Preferred Plus Program
Borrowers may receive up to 3%, 4% or 5% of the loan amount of their new home in DPA through Florida Housing. This second mortgage is forgiven at 20% a year over its 5-year term when used with Florida Housing’s conventional HFA Preferred or HFA Advantage first mortgage products. Many borrowers also received lower mortgage insurance costs through the HFA Preferred Plus Program than standard conventional loans or comparable Federal Housing Administration loans, making monthly payments more affordable. The HFA Preferred Plus Program is for households with incomes at or below 140% of AMI.
Program Summary
• 188 households received a total of $1,873,566 in HFA Preferred Plus assistance.
12 Florida Housing Finance Corporation
13 2022 Annual Report
14 Florida Housing Finance Corporation
RENTAL HOUSING PROGRAMS
Florida Housing’s rental programs feature unique financing arrangements designed to maximize the development of affordable housing throughout Florida. Strategically combining federal and state resources helps incentivize local funding opportunities and foster creative public-private partnerships. This results in a shared commitment to provide affordable and economically viable rental developments serving broad population groups through a range of housing types across the state.
The following program summaries include funding and units of both new applicants and the Construction Housing Inflation Response Program (CHIRP).
Florida Housing uses a competitive Request for Applications (RFA) process to allocate available rental resources. The RFA process ensures transparency and accountability in meeting statutorily and legislatively directed commitments. Additionally, it provides Florida Housing with the flexibility to react to changing markets and needs.
Florida Housing’s Board of Directors establishes a timeline for when RFAs are issued each year. RFAs are independently drafted, beginning with multiple opportunities for stakeholder input, including at least one public workshop and a public comment period, before the final draft of the RFA is issued. Applications are scored by Florida Housing staff and recommendations are forwarded to Florida Housing’s Board, which makes final award decisions.
REQUESTS FOR APPLICATIONS RECEIVING AWARDS
The competitive RFA allocation process allows Florida Housing to best respond to the data-driven assessments generated by statewide affordable housing needs studies. The ability to target specific tenant groups and geographic regions results in a nuanced, comprehensive response to the affordable housing challenges across Florida. Listed below are the RFAs that contributed to the rental housing developments awarded funding and invited into credit underwriting by Florida Housing.
2021-201: Housing Credit Financing for Affordable Housing Developments Located in Medium and Small Counties
2021-202: Housing Credit Financing for Affordable Housing Developments Located in Broward, Duval, Hillsborough, Orange, Palm Beach, and Pinellas Counties
2021-203: Housing Credit Financing for Affordable Housing Developments Located in Miami-Dade County³
2021-204: Housing Credit Financing for The Preservation of Existing Affordable Multifamily Housing Developments
2021-205: SAIL Financing of Affordable Multifamily Housing Developments to be Used in Conjunction with TaxExempt Bonds and Non-Competitive Housing Credits
2021-206: HOME Financing for The Construction Of Small, Rural Developments
2022-102: SAIL Financing for Smaller Permanent Supportive Housing Developments for Persons with Special Needs
2022-103: Housing Credit and SAIL Financing to Develop Housing for Homeless Persons
2022-104: SAIL Financing Farmworker and Commercial Fishing Worker Housing
2022-109: SAIL and HOME-ARP Financing for Smaller Permanent Supportive Housing Developments for Persons with Special Needs
2022-208: SAIL Financing for the Construction of Workforce Housing in Monroe County
2022-210: Permanent Supportive Housing Focusing on Best Practices and Funding for Tenancy Supports and Resident Services Coordination for High Utilizers of Public Behavioral Health Systems
2022-301: Housing Credit Financing for Affordable Housing Developments Located in Duval County
3 For RFA 2021-203, three (3) Applicants were awarded funding; two (2) of these Applicants entered the credit underwriting process in 2021; the third Applicant entered credit underwriting in 2022.
15 2022 Annual Report
RENTAL HOUSING PROGRAMS
STATE APARTMENT INCENTIVE LOAN PROGRAM
The State Apartment Incentive Loan (SAIL) program provides low-interest loans on a competitive basis, most often as gap financing to leverage mortgage revenue bonds and Low Income Housing Tax Credits (Housing Credits). This allows a developer to obtain the full financing needed to construct or rehabilitate affordable rental units for very lowincome families. SAIL was also used to help finance smaller, specialty housing for people experiencing homelessness as well as persons with special needs. Additional SAIL funding was used as forgivable loans to finance construction of a portion of units in some properties to lower the debt on these units and thus, allow rents to be decreased to serve Extremely Low-Income (ELI) residents.
Program Summary
• $181,672,076 in SAIL funding was awarded for affordable rental housing.
• 4,707 total units were awarded funding (all 4,707 will be set aside as affordable).
MULTIFAMILY MORTGAGE REVENUE BONDS
The Multifamily Mortgage Revenue Bond program uses both taxable and tax-exempt bonds to provide below market rate loans to nonprofit and for-profit developers that set aside a certain percentage of their apartment units for lowincome households. Proceeds from the sale of these bonds are used to construct or acquire and rehabilitate multifamily rental properties. SAIL financing and/or non-competitive Housing Credits are often paired with these bonds to allow this federal resource to serve more low-income households than could be served with the bonds alone.
The annual volume of available state bond allocation to Florida Housing for the issuance of tax-exempt bonds is limited pursuant to state statute. Non-competitive applications for tax-exempt bonds are processed by Florida Housing on a first-come, first-serve basis. Due to the limited availability and high demand, last year Florida Housing paused its bond application process.
Program Summary
• $181,510,000 from the sale of bonds was provided for the development of affordable rental housing.
• 1,241 total units were awarded funding (1,071 will be set aside as affordable).
Florida Housing issued a single RFA that paired tax-exempt bonds with SAIL funds. The unit totals for this RFA are reported in the SAIL Program Summary above, so as not to be duplicative.
16 Florida Housing Finance Corporation
RENTAL HOUSING PROGRAMS
LOW INCOME HOUSING TAX CREDITS
The competitive (9%) and non-competitive (4%) Low-Income Housing Tax Credits (Housing Credits) program provides nonprofit and for-profit developers with federal tax credits. These credits are sold to investors to be used for a dollarfor-dollar reduction in their federal tax liability in exchange for equity to finance the acquisition, rehabilitation and/ or new construction of affordable rental housing. Special consideration is given to properties that target specific demographic groups, such as people who are elderly or households experiencing homelessness. Consideration is also given to properties that target certain geographic areas, such as the Florida Keys and developments in local revitalization areas.
Program Summary
• $71,890,999 in competitive (9%) Housing Credits was allocated.
• 4,860 units were funded (4,805 units will be set aside as affordable).
• $86,228,893 in non-competitive (4%) Housing Credits was allocated.
• 7,550 units were funded (7,064 units will be set aside as affordable).
FLORIDA AFFORDABLE HOUSING GUARANTEE PROGRAM
Authorized by the Legislature in 1992, the Guarantee Program was created to provide credit enhancement (i.e., mortgage repayment guarantees) primarily on bond-financed affordable rental housing developments at a time when such products for bond transactions were mostly unavailable in the private market. During its active phase, the program guaranteed 120 transactions, representing approximately $1.4 billion and over 28,000 rental units, the majority of which partnered with HUD’s Risk-Sharing Program (Section 542c), with HUD assuming 50% of the default risk. In March 2009, Florida Housing’s Board of Directors officially confirmed the suspension of new guarantees.
Capitalization of the Guarantee Fund occurred through the statutorily authorized issuance of debt, and the Guarantee Fund corpus is currently invested in the Florida Treasury. Documentary stamp taxes distributed to the State Housing Trust Fund are the essential element for maintaining the Guarantee Fund’s insurer financial strength (IFS) credit rating; currently A+/Stable by Standard & Poor’s and Fitch Ratings. In the event the Guarantee Fund is rated less than in the top three claims paying ratings by any of the rating agencies, the state would be required to use collections distributed to the State Housing Trust Fund to replenish the Guarantee Fund at the amount necessary to maintain the minimum IFS claims paying rating.
Capital not needed to support the outstanding Guarantees was made available to the SAIL program for use in 20162018 and 2019 competitive solicitations. Specifically, $40 million was made available to workforce housing and the remaining $78 million to SAIL.
Program Summary
• 229 units exist within the Guarantee Program portfolio.
• 1 multifamily rental property with an outstanding guarantee.
• $4,887,647 in total outstanding guarantees.
• 0 properties in the portfolio are in monetary default/foreclosure.
17 2022 Annual Report
RENTAL HOUSING PROGRAMS
HOME INVESTMENT PARTNERSHIPS PROGRAM
The HOME Program also provides non-amortizing, low-interest rate loans to developers of affordable housing to construct housing for low-income families. Loans are offered at the simple interest rate of 0% to nonprofit applicants and 1.5% to for-profit applicants.
Program Summary
• $29,339,000 in HOME funding was awarded for affordable rental housing.
• 267 total units were funded (all 267 units will be set aside as affordable).
HOME was also used to provide tenant-based rental assistance (TBRA) and fund rental developments in rural communities.
Housing Stability for Homeless Schoolchildren Initiative
Florida Housing began a pilot program in January 2018 to provide short- and medium-term HOME TBRA and housing stability services to families with school-aged children experiencing homelessness. The Initiative is targeted to counties with small and rural communities that tend to have fewer housing resources or options than larger more populated communities. Key partners in these collaborations include the county school district, the local Public Housing Authority, and a case management organization. Through this partnership the school district identifies families participating in the McKinney-Vento (Homeless Education) Program. The Public Housing Authority then works to house these families in rental units throughout the community, while the case management organization focuses on providing intensive support and services to participating families.
Florida Housing currently has five counties participating in this Initiative: Alachua County, Bay County, Charlotte County, Hernando County, and Santa Rosa County.
Program Summary
• $1,694,800 in HOME TBRA was provided.
• 126 households were assisted.
HOME-ARP (American Rescue Plan)
The HOME-ARP Program provides funding for rental assistance for qualifying populations as described by HUD. Eligible uses of the funding include the following activities: development and support of affordable housing, as currently permitted under the HOME program; tenant-based rental assistance; supportive services; and/or acquisition and development of non-congregate shelter units. Following a period of Consultation and Public Comment, Florida Housing focused its primary efforts on the development of affordable rental and permanent supportive housing.
Program Summary
• $31,798,600 in HOME-ARP was provided.
• 170 units will be set aside for HOME-ARP households.
18 Florida Housing Finance Corporation
RENTAL HOUSING PROGRAMS
NATIONAL HOUSING TRUST FUND
The National Housing Trust Fund (NHTF) is funded from a small portion of the revenue generated by the federally sponsored entities Freddie Mac and Fannie Mae and is awarded to states using a formula-based allocation method. NHTF resources are created to serve households at or below 30% of AMI. Florida Housing uses this resource in numerous RFAs to create long-term affordability for households at or below 30% of AMI, while also, targeting a small number of units across several properties that are set aside for residents with special needs with incomes at or below 22% of AMI, providing a much-needed resource for individuals living on Supplemental Security Income (SSI). The set aside units remain affordable for these households throughout each development’s full affordability period, ranging from 30-50 years. This funding approach follows the NHTF Allocation Plan developed by Florida Housing as part of the state’s Consolidated Plan (required and in place for multiple federal housing programs administered by the state).
Program Summary
• $31,306,800 in NHTF funding was provided for 18 rental developments.
• 117 units were set-aside as NHTF units.
CONSTRUCTION HOUSING INFLATION RESPONSE PROGRAM (CHIRP)
CHIRP funding provides gap financing for projects in the development pipeline experiencing cost increases related to market inflation. Developers with an active award of competitive Housing Credits or competitive SAIL funding had the opportunity to select NHTF, HOME funding from the American Rescue Plan Act (HOME-ARP), additional Competitive Housing Credits, or loan funding who were able to demonstrate verifiable cost increases. Resources were used to maintain the viability of projects in the development pipeline and ensure the investments made prior were able to deliver much-needed affordable housing units in communities in a timely manner.
Program Summary
• $125,296,788 in funding and resources was awarded for CHIRP eligible rental housing.
o $15,312,272 in competitive (9%) Housing Credits was allocated.
o $88,686,316 in SAIL was allocated.4
o $7,248,600 in HOME-ARP was provided.
o $14,049,600 in NHTF was allocated.
• 7,074 total units were awarded funding (6,987 will be set aside as affordable).
o Competitive (9%) housing credits were used to ensure developments representing 3,130 total units maintained viability through CHIRP.
o SAIL funds were used to ensure developments representing 3,418 total units maintained viability through CHIRP. 5
o HOME-ARP was used to ensure developments representing 114 total units maintained viability through CHIRP.
o NHTF was used to ensure developments representing 442 total units maintained viability through CHIRP.
4 Alto Tower received a total of $2,641,104 through a combination of SAIL and NHTF in CHIRP, funding 84 total units. The combination of these resources is accounted for here. 5 Alto Tower received a total of $2,641,104 through a combination of SAIL and NHTF in CHIRP, funding 84 total units. The combination of these resources is accounted for here.
19 2022 Annual Report
RENTAL HOUSING PROGRAMS
LINK STRATEGY
The Link Strategy enhances the ability of ELI households experiencing homelessness and/or that have special needs to access and retain affordable rental housing in their communities. Special needs populations include persons with disabilities, youth aging out of foster care, frail elders, and survivors of domestic violence. The Link Strategy targets those who require affordable permanent housing, plus short- or long-term community-based services to maintain optimal stability and self-sufficiency.
Through the Link Strategy, Florida Housing requires general occupancy properties to set aside a portion of a property’s ELI units for homeless and/or special needs households that are receiving community-based supportive services and are referred by a recognized supportive services agency in the community where the property is located. Each participating development executes a memorandum of understanding (MOU) with at least one of the designated services agencies in that community. The MOU provides the responsibilities of each party in partnering to serve these households.
Program Summary
• 465 new Link units were added.
ASSET MANAGEMENT OF DEVELOPMENTS IN FLORIDA HOUSING’S RENTAL PORTFOLIO
Florida Housing monitors multifamily developments for compliance throughout the required affordability period based on applicable federal and state statutes and rules. For developments that receive state funds, compliance monitoring reviews and physical inspections are conducted annually. Reviews of developments that were awarded Housing Credits are conducted at least once every three years for the first 15 years in accordance with federal regulations and annually thereafter. Compliance monitoring of mixed-income developments applies to the affordable units.
If problems are found, Florida Housing works with the development owners and property managers until the problems are addressed. Chronic noncompliance of a property may result in the suspension of an owner’s ability to apply for Florida Housing funding. Moreover, Florida Housing reports Housing Credit properties that are in noncompliance to the Internal Revenue Service, which places the development’s Housing Credits at risk of recapture.
• 1,124 properties were reviewed for compliance.
• 163,927 total units were reviewed for compliance (151,933 were affordable).
• 436 housing professionals attended training workshops, including property managers and compliance officers.
20 Florida Housing Finance Corporation
21 2022 Annual Report
22 Florida Housing Finance Corporation
SPECIAL PROGRAMS
STATE HOUSING INITIATIVES PARTNERSHIP
The State Housing Initiatives Partnership (SHIP) program provides funds to local governments on a populationbased formula to produce and preserve affordable housing for very low-, low-, and moderate-income households. SHIP funds are distributed on an entitlement basis to all 67 counties and 55 Community Development Block Grant entitlement cities in Florida. SHIP dollars may be used to fund emergency repairs, new construction, rehabilitation, down payment and closing cost assistance, foreclosure prevention, impact fees, construction and gap financing, mortgage buy-downs, acquisition of property for affordable housing, matching dollars for federal housing programs, and homeownership counseling. Each participating local government may use up to 10% of its SHIP allocation for administrative expenses. In addition to the state distribution, SHIP local governments expend program income that is generated through loan repayments from program applicants.
Local governments have three years to expend funds. The most recent closed out fiscal year is state fiscal year 20192020. The summary of expenditures below is higher than the allocated funds due to local governments’ use of SHIP program income and recaptured funds.
Program Summary
• $45,645,273 in SHIP funding from the identified state fiscal year was disbursed.
• $57,839,401 was expended or encumbered for homeownership activities, assisting 2,346 homeownership units.
• $12,037,955 was expended or encumbered for rental housing activities, assisting 1,247 rental housing units.
• $23,827,105 of these funds were expended or encumbered assisting 964 households with Special Needs.
HURRICANE HOUSING RECOVERY PROGRAM
In the 2019 Legislative Session, funding was appropriated for the Hurricane Housing Recovery Program (HHRP) for local governments affected by Hurricane Michael. HHRP resources may be used to fund emergency repairs, new construction, rehabilitation, and other activities to address recovery needs. Each participating local government may use up to 10% for administrative expenses.
The reported information below is based on the HHRP allocation from the state fiscal year 2019-2020.
Program Summary
• $65,000,000 in HHRP funding was disbursed to Hurricane Michael impacted counties.6
• $51,713,569 was expended or encumbered for homeownership activities, assisting 833 homeownership units.
• $5,524,868 was expended or encumbered for rental housing activities, assisting 216 rental housing units.
23 2022 Annual Report
6 Six local governments have been granted extensions for the encumbrance and expenditure of funds.
SPECIAL PROGRAMS
PREDEVELOPMENT LOAN PROGRAM
The Predevelopment Loan Program (PLP) assists nonprofit and community-based organizations, local governments, and public housing authorities with the predevelopment planning and financing of affordable housing. Eligible organizations may apply for a loan of up to $500,000 without site acquisition or up to $750,000 with site acquisition for predevelopment activities such as title searches, engineering fees, legal fees, impact fees, commitment fees, administrative costs, soil tests, appraisals, feasibility analyses, earnest money deposits, insurance fees, audit fees, and marketing expenses. Technical assistance is also provided at no charge to the applicant.
Program Summary
• $1,000,000 was awarded for predevelopment activities associated with two approved rental developments that will create 94 rental units (of these, at least 19 are required to be affordable).
• $1,803,000 was awarded for predevelopment activities associated with five approved homeownership developments that will create 63 homeownership units, all of which are required to be sold to income levels at 80% and 120% of AMI.
TRAINING AND TECHNICAL ASSISTANCE
Affordable Housing Catalyst Program
The Affordable Housing Catalyst Program provides on-site, email, and telephone technical assistance and training on affordable housing programs. Workshops are conducted throughout the year at locations around the state. This technical assistance is targeted toward nonprofits and government entities. The assistance includes training on topics such as: forming local and regional partnerships; working effectively with lending institutions; implementing regulatory reform; training for boards of directors; the development process; implementing rehabilitation and emergency repair programs; assisting with the design and establishment of fiscal and program tracking systems; and compliance requirements of state and federally funded housing programs.
Program Summary
• 40 workshops/stakeholder events;
• 54 webinars;
• 613 hours of direct technical assistance;
• 1,111 responses to emails; and
• 933 responses to phone calls.
PLP Technical Assistance
Technical Assistance is also provided to applicants with PLP. This technical assistance provides professional guidance for less experienced nonprofit organizations to help navigate the predevelopment process and build capacity required to construct or renovate affordable housing units.
Program Summary
• 43 PLP applicants were provided technical assistance at a cost of $109,613.7
7 This includes Applicants that were participating in PLP prior to 2022 that also received Technical Assistance during this reporting period, applicants that were accepted and received Technical Assistance during this reporting period, and applicants that received Technical Assistance at some point during the reporting period but have withdrawn from the program.
24 Florida Housing Finance Corporation
SPECIAL PROGRAMS
AFFORDABLE RENTAL HOUSING LOCATOR: FLORIDAHOUSINGSEARCH.ORG
Florida Housing provides a free, online affordable rental housing locator that helps citizens search for housing throughout Florida. FloridaHousingSearch.org allows users to search for and find available rental units by using several different search criteria such as rent amount, city, county, zip code and accessibility features for those who may be facing a disability-related challenge. Map links are offered to allow users to search for housing near schools, transportation, and employment. Properties listed on FloridaHousingSearch.org are affordable for people who earn at or below 120% of AMI. The website is available in English and Spanish and can be translated into 30-plus additional languages, including Haitian-Creole.
FloridaHousingSearch.org is free to utilize for all interested parties including those conducting searches as well as property owners and managers. Landlords can list information about their property such as number of bedrooms, move-in costs, amenities, accessibility options, voucher acceptance, and photographs. Owners of rental housing recently financed by Florida Housing are required to list their properties and available rental units. The system is continually updated to ensure that property listings are accurate and up to date.
The locator also provides a toll-free, bilingual call center. As needed, call center staff assist consumers in conducting housing searches, help owners/landlords with listing their properties, and ensure that rental listings are kept up to date and accurate.
Program Summary
• 22,954 listings, representing 217,568 units and 9,448 landlords were registered with FloridaHousingSearch.org.
• 1,099,303 affordable rental searches were conducted on FloridaHousingSearch.org.
• 16,379 calls were received through the support center assisting households with rental inquiries.
25 2022 Annual Report
DEMOGRAPHICS AND CHARTS SUMMARY OF PROGRAMS
26 Florida Housing Finance Corporation
Total Homeowners Served or Units Funded 1 .................................................................................. 7,966 Homebuyer Loan Programs 5,533 Down Payment Assistance......................................................................................................................................... 5,502 Homeownership Assistance Program - Florida Assist 3 .................................................................................... 2,850 HFA Preferred PLUS Grants 188 Florida HLP Second Mortgage 102 Hometown Heroes ............................................................................................................................................ 2,362 Salute Our Soldiers ............................................................................................................................................... 361 Homeownership Pool Program (HOP) 87 State Housing Initiatives Partnership (SHIP) 2,3 2,346 Predevelopment Loan Program (PLP) 2 ........................................................................................................................... 63 HOMEOWNERSHIP PROGRAMS Total Homeowners Assisted
RENTAL PROGRAMS
Notes:
1 The number of units is equivalent to the number of households served. In order to serve lower income households, resources from more than one program are sometimes combined. Therefore, grand totals for rental and homeownership program areas are less than the sum of the individual programs due to program overlap. If financing was provided this year for units already funded in a recent, prior year, these units were not counted in this year's grand totals.
2 This program is typically funded by revenues from documentary stamp taxes. In some cases state funding is appropriated on a year by year basis for special programs.
3 SHIP information is from the most recently closed year (2019-2020). Pursuant to Florida Law, local governments typically have three years to expend funds. On the rental side, local governments often use SHIP funds as local contribution for rental developments financed with Florida Housing's programs. We estimate that 624 (50%) of the SHIP rental units during this period overlap other rental programs in this summary.
4 In 2022, Florida Housing offered funding to assist competitive projects in the development pipeline experiencing cost increases related to market inflation. CHIRP funding was intended to fill the funding gap due to increased construction costs.
5 The breakdown for the 11,280 total rental units financed in 2022 is as follows:
• 6,993 units are new construction or redevelopment (demolition/replacement);
• 3,663 units are preservation (existing affordable units being rehabilitated and recapitalized to ensure they remain affordable and in good condition; some are 30+ year old properties originally funded through HUD and USDA); retrofits of existing smaller properties; or acquisition and rehabilitation of properties that become affordable as a result of receiving financing; and
• 624 (50%) of the SHIP rental units units (see footnote 3).
27 2022 Annual Report
DEMOGRAPHICS AND CHARTS SUMMARY OF PROGRAMS
Total Units Set-Aside Units 11,280 ............................................ 10,579 4,707 4,707 4,860 ........................................................ 4,805 7,550 ......................................................... 7,064 1,702 117 1,241 1,071 267 ................................................................ 267 386 ................................................................ 170 447 447 126 ................................................................. 126 1,247 .......................................................... 1,247 7,074 6,987 94 19 Total Units Funded in 2022 1,5 State Apartment Incentive Loans (SAIL)2 Low Income Housing Tax Credits (9%) Low Income Housing Tax Credits (4%) National Housing Trust Fund Multifamily Mortgage Revenue Bonds (MMRB) HOME Rental Program HOME Investment Partnerships - American Rescue Plan CDBG-Disaster Recovery Viability Loans Housing Stability for Homeless Schoolchildren State Housing Initiatives Partnership (SHIP)2,3 Construction Housing Inflation Response Program (CHIRP)4 Predevelopment Loan Program (PLP)2
HOMEOWNERSHIP PROGRAMS
28 Florida Housing Finance Corporation
HOMES FUNDED
HOMEBUYER
OVERALL PROGRAM PERFORMANCE 1, 2, 3 HAP - FLORIDA ASSIST FL HLP SECOND MORTGAGE COUNTY HOUSEHOLDS SERVED FIRST MORTGAGE DPA AVERAGE SALES PRICE HOUSEHOLDS SERVED FIRST MORTGAGE DPA HOUSEHOLDS SERVED FIRST MORTGAGE DPA Alachua 50 $10,433,914 $538,120 $217,372 26 $4,599,989 $255,000 0 $0 $0 Baker 12 $2,685,668 $122,676 $226,367 10 $2,182,162 $97,500 0 $0 $0 Bay 100 $23,844,597 $1,123,581 $249,517 60 $12,837,839 $573,240 0 $0 $0 Bradford 21 $3,867,049 $220,745 $188,062 13 $2,002,146 $127,500 0 $0 $0 Brevard 151 $37,414,451 $1,743,353 $255,769 82 $18,022,396 $791,750 1 $227,853 $10,000 Broward 182 $57,185,965 $2,740,607 $333,542 29 $6,929,798 $275,000 2 $669,300 $20,000 Calhoun 2 $294,066 $17,339 $150,000 1 $147,283 $10,000 0 $0 $0 Charlotte 38 $9,814,619 $452,346 $264,147 19 $4,425,237 $185,000 1 $242,500 $10,000 Citrus 69 $12,957,133 $709,380 $197,101 48 $8,073,026 $462,500 4 $746,533 $40,000 Clay 118 $31,372,153 $1,385,412 $274,270 61 $14,657,997 $595,000 2 $373,093 $20,000 Collier 31 $11,218,196 $504,483 $382,142 9 $2,924,876 $90,000 0 $0 $0 Columbia 24 $4,564,453 $250,762 $194,482 12 $1,849,212 $115,000 0 $0 $0 Desoto 24 $5,589,437 $248,122 $239,223 18 $4,227,004 $180,000 0 $0 $0 Dixie 8 $1,234,332 $49,776 $163,238 3 $513,422 $27,500 0 $0 $0 Duval 764 $182,445,435 $8,476,521 $245,487 462 $100,094,110 $4,528,144 20 $3,780,538 $200,000 Escambia 215 $43,814,693 $2,278,367 $210,059 123 $22,456,477 $1,215,081 3 $498,580 $27,500 Flagler 12 $3,261,939 $152,331 $281,793 5 $1,119,347 $50,000 0 $0 $0 Franklin 2 $384,899 $19,819 $196,000 1 $188,522 $10,000 0 $0 $0 Gadsden 27 $5,575,476 $279,186 $210,407 16 $2,912,815 $151,500 1 $308,925 $10,000 Gilchrist 2 $565,211 $23,110 $293,000 1 $303,011 $10,000 0 $0 $0 Glades 5 $883,836 $47,169 $181,400 2 $334,331 $20,000 1 $206,125 $10,000 Gulf 5 $954,024 $50,750 $197,900 4 $739,024 $40,000 0 $0 $0 Hamilton 4 $675,974 $42,050 $172,750 3 $434,974 $30,000 0 $0 $0 Hardee 4 $812,937 $40,000 $207,625 4 $812,937 $40,000 0 $0 $0 Hendry 14 $2,961,331 $140,207 $214,606 12 $2,557,192 $120,000 0 $0 $0 Hernando 134 $31,639,146 $1,466,801 $243,812 83 $18,508,654 $810,000 3 $547,953 $30,000 Highlands 42 $9,048,765 $459,003 $223,422 22 $4,261,606 $217,500 1 $157,140 $10,000 Hillsborough 282 $77,595,947 $3,539,408 $287,749 115 $27,591,930 $1,106,500 9 $2,300,408 $90,000 Holmes 5 $894,934 $50,936 $182,000 3 $476,214 $30,000 0 $0 $0 Indian River 48 $11,863,032 $546,585 $253,648 30 $6,855,532 $295,000 1 $175,841 $10,000 Jackson 9 $1,276,540 $84,480 $145,589 6 $746,958 $58,000 0 $0 $0 Jefferson 5 $784,369 $50,000 $159,300 5 $784,369 $50,000 0 $0 $0 Lafayette 2 $368,001 $21,420 $194,750 1 $139,601 $10,000 0 $0 $0 Lake 79 $20,868,607 $992,312 $272,790 32 $7,170,309 $314,960 0 $0 $0 Lee 197 $53,099,209 $2,468,877 $278,275 88 $20,057,169 $850,000 1 $189,150 $10,000 Leon 252 $48,069,978 $2,580,819 $196,028 176 $30,633,271 $1,714,300 2 $375,900 $20,000 Levy 9 $1,552,794 $90,237 $178,172 7 $1,098,050 $67,500 0 $0 $0
THROUGH THE
LOAN AND DOWN PAYMENT ASSISTANCE PROGRAMS
29 2022 Annual Report HOMEOWNERSHIP PROGRAMS HOMEOWNERSHIP PROGRAMS
NO DPA HOUSEHOLDS SERVED FIRST MORTGAGE DPA HOUSEHOLDS SERVED FIRST MORTGAGE DPA HOUSEHOLDS SERVED FIRST MORTGAGE DPA HOUSEHOLDS SERVED FIRST MORTGAGE DPA 0 $0 $0 23 $5,662,324 $283,120 3 $590,673 $30,000 1 $171,601 $0 0 $0 $0 2 $503,506 $25,176 3 $831,002 $30,000 0 $0 $0 0 $0 $0 40 $11,006,758 $550,341 16 $4,412,017 $157,500 0 $0 $0 0 $0 $0 8 $1,864,903 $93,245 0 $0 $0 0 $0 $0 5 $1,308,270 $60,856 61 $17,253,432 $862,672 6 $1,513,392 $58,075 0 $0 $0 10 $2,100,650 $88,433 139 $46,833,305 $2,334,510 6 $1,919,017 $60,164 0 $0 $0 0 $0 $0 1 $146,783 $7,339 0 $0 $0 0 $0 $0 2 $517,900 $25,896 16 $4,628,982 $231,450 2 $578,000 $20,000 0 $0 $0 1 $343,000 $17,150 16 $3,794,574 $189,730 4 $748,893 $40,000 0 $0 $0 4 $926,140 $44,222 47 $14,239,379 $709,524 23 $6,999,687 $186,666 0 $0 $0 0 $0 $0 22 $8,293,320 $414,483 0 $0 $0 0 $0 $0 0 $0 $0 12 $2,715,241 $135,762 0 $0 $0 0 $0 $0 0 $0 $0 6 $1,362,433 $68,122 0 $0 $0 0 $0 $0 1 $185,250 $7,410 2 $297,322 $14,866 0 $0 $0 2 $238,338 $0 36 $8,261,770 $347,332 235 $67,095,492 $3,345,454 103 $29,640,919 $934,591 0 $0 $0 6 $1,350,123 $60,307 83 $19,509,513 $975,479 10 $2,312,692 $97,678 0 $0 $0 1 $239,995 $7,200 6 $1,902,597 $95,131 0 $0 $0 0 $0 $0 0 $0 $0 1 $196,377 $9,819 0 $0 $0 0 $0 $0 0 $0 $0 10 $2,353,736 $117,686 1 $308,925 $10,000 0 $0 $0 0 $0 $0 1 $262,200 $13,110 0 $0 $0 0 $0 $0 1 $184,300 $9,215 1 $159,080 $7,954 0 $0 $0 0 $0 $0 0 $0 $0 1 $215,000 $10,750 0 $0 $0 0 $0 $0 0 $0 $0 1 $241,000 $12,050 0 $0 $0 0 $0 $0 0 $0 $0 0 $0 $0 0 $0 $0 0 $0 $0 0 $0 $0 2 $404,139 $20,207 2 $420,801 $20,000 0 $0 $0 3 $648,520 $30,098 45 $11,934,019 $596,703 6 $1,496,514 $60,000 0 $0 $0 0 $0 $0 19 $4,630,019 $231,503 1 $198,186 $10,000 0 $0 $0 21 $5,075,625 $231,831 134 $41,611,236 $2,080,575 13 $4,073,091 $129,502 0 $0 $0 0 $0 $0 2 $418,720 $20,936 0 $0 $0 0 $0 $0 0 $0 $0 17 $4,831,659 $241,585 3 $816,728 $30,000 0 $0 $0 0 $0 $0 3 $529,582 $26,480 0 $0 $0 0 $0 $0 0 $0 $0 0 $0 $0 1 $210,411 $10,000 0 $0 $0 0 $0 $0 1 $228,400 $11,420 0 $0 $0 0 $0 $0 4 $1,147,935 $49,832 43 $12,550,363 $627,520 2 $404,864 $20,000 0 $0 $0 8 $2,135,539 $90,190 98 $30,088,887 $1,504,450 6 $1,853,981 $44,237 0 $0 $0 4 $770,665 $32,006 70 $16,290,142 $814,513 4 $747,798 $40,000 0 $0 $0 0 $0 $0 2 $454,744 $22,737 0 $0 $0 0 $0 $0
HFA PREFERRED PLUS GRANTS HOMETOWN HEROES SALUTE OUR SOLDIERS4 LOANS WITH
HOMES FUNDED THROUGH THE HOMEBUYER LOAN AND DOWN PAYMENT ASSISTANCE PROGRAMS
Note:
1These four columns show the cumulative number of households served and first mortgage amounts for Homebuyer Loan Programs and downpayment assistance provided through five programs: the Homeownership Assistance Program (HAP) - Florida Assist), HFA Preferred PLUS Grants (3% and 4% HFA Preferred Grants), Florida Homeownership Loan Program (FL HLP) Second Mortgage, Hometown Heroes Loan Program and Salute Our Soldiers Military Loan Program. Each downpayment assistance program section of the table provides subtotals for each of the strategies complementing the Homebuyer Loan Programs.
2In many cases, the first mortgage and DPA totals for a county are higher than the average sales price, because buyers also receive some assistance with closing costs, a key barrier to entering homeownership for many.
30 Florida Housing Finance Corporation
OVERALL PROGRAM PERFORMANCE 1, 2, 3 HAP - FLORIDA ASSIST FL HLP SECOND MORTGAGE COUNTY HOUSEHOLDS SERVED FIRST MORTGAGE DPA AVERAGE SALES PRICE HOUSEHOLDS SERVED FIRST MORTGAGE DPA HOUSEHOLDS SERVED FIRST MORTGAGE DPA Liberty 4 $900,049 $48,824 $230,200 1 $123,575 $10,000 0 $0 $0 Madison 1 $283,765 $10,000 $289,000 1 $283,765 $10,000 0 $0 $0 Manatee 45 $12,116,594 $539,467 $282,450 21 $5,246,004 $202,500 1 $282,783 $10,000 Marion 168 $35,736,661 $1,785,495 $219,512 105 $21,035,159 $1,040,000 3 $391,630 $30,000 Martin 9 $2,031,223 $97,717 $246,278 4 $796,196 $40,000 0 $0 $0 Miami-Dade 177 $59,801,334 $2,904,954 $360,263 31 $7,153,202 $290,000 2 $322,750 $20,000 Monroe 1 $607,161 $25,000 $649,000 0 $0 $0 0 $0 $0 Nassau 32 $8,189,224 $359,272 $263,648 14 $3,247,490 $135,000 5 $1,348,442 $50,000 Okaloosa 205 $55,278,570 $2,490,516 $272,125 90 $22,829,075 $877,966 1 $239,580 $10,000 Okeechobee 10 $2,274,178 $115,463 $234,800 5 $964,917 $50,000 0 $0 $0 Orange 189 $50,451,538 $2,343,091 $278,953 78 $18,012,242 $748,708 6 $1,131,561 $60,000 Osceola 91 $26,912,658 $1,222,767 $308,226 38 $9,712,121 $375,000 0 $0 $0 Palm Beach 139 $39,293,646 $1,871,473 $300,712 39 $8,839,324 $372,500 4 $861,778 $40,000 Pasco 297 $71,007,319 $3,296,816 $248,695 183 $39,608,637 $1,767,500 10 $2,101,003 $100,000 Pinellas 180 $46,808,378 $2,222,765 $274,660 83 $17,243,932 $782,500 4 $1,101,614 $40,000 Polk 326 $77,543,390 $3,630,253 $246,260 199 $43,519,507 $1,955,000 6 $1,212,812 $59,200 Putnam 19 $3,342,090 $193,357 $178,734 16 $2,661,808 $159,342 0 $0 $0 St Johns 28 $7,317,145 $329,322 $268,124 14 $3,177,474 $135,345 2 $422,268 $20,000 St Lucie 107 $29,882,468 $1,373,762 $289,128 47 $11,379,293 $450,000 0 $0 $0 Santa Rosa 92 $24,205,006 $1,115,753 $268,201 44 $10,319,848 $428,800 0 $0 $0 Sarasota 48 $13,791,217 $618,361 $296,369 21 $5,424,009 $200,000 0 $0 $0 Seminole 106 $30,061,642 $1,429,051 $296,703 41 $9,412,620 $407,500 1 $73,600 $10,000 Sumter 15 $3,434,652 $173,692 $240,093 8 $1,560,819 $80,000 0 $0 $0 Suwannee 4 $968,756 $50,337 $248,250 1 $162,011 $10,000 0 $0 $0 Taylor 2 $260,524 $18,125 $131,500 2 $260,524 $18,125 0 $0 $0 Union 1 $268,026 $13,401 $268,000 0 $0 $0 0 $0 $0 Volusia 202 $50,200,814 $2,308,373 $256,538 111 $25,407,255 $1,095,700 4 $956,296 $40,000 Wakulla 61 $11,008,827 $624,602 $184,479 46 $7,577,771 $452,500 0 $0 $0 Walton 20 $4,713,474 $213,534 $239,917 9 $2,029,972 $87,640 1 $295,537 $10,000 Washington 6 $987,621 $57,500 $169,583 6 $987,621 $57,500 0 $0 $0 TOTALS 5,533 $1,381,551,060 $65,490,133 $259,065 2,850 $612,644,961 $27,762,601 102 $21,541,493 $1,016,700
HOMEOWNERSHIP PROGRAMS
3In order to serve a variety of households, resources from more than one downpayment program are sometimes combined. Therefore, the overall program performance totals are less than the sum of the individual programs due to program overlap.
4333 households received combined downpayment assistance from Salute Our Soldiers Military Loan Program and HAP-Florida Assist.
*As of December 31, 2022, the foreclosure rate for all Florida Housing homeowner loans was 0.67%. Of this, 0.14% of all Florida Housing loans were 1995 Indenture loans in foreclosure, 0.09% of all Florida Housing loans were New Issue Bond Program Indenture loans in foreclosure, and 0.44% of all Florida Housing loans were TBA loans in foreclosure. This is compared to a foreclosure rate of 0.56% for all Florida residential loans reported at the end of the fourth quarter of 2022 (the Florida conventional loan foreclosure rate was 0.50% and the Florida FHA foreclosure rate was 0.80%). Source: USBank and Mortgage Bankers Association
31 2022 Annual Report HOMEOWNERSHIP PROGRAMS HOMEOWNERSHIP PROGRAMS
NO DPA HOUSEHOLDS SERVED FIRST MORTGAGE DPA HOUSEHOLDS SERVED FIRST MORTGAGE DPA HOUSEHOLDS SERVED FIRST MORTGAGE DPA HOUSEHOLDS SERVED FIRST MORTGAGE DPA 0 $0 $0 3 $776,474 $38,824 0 $0 $0 0 $0 $0 0 $0 $0 0 $0 $0 0 $0 $0 0 $0 $0 2 $402,550 $17,703 21 $6,185,257 $309,264 2 $600,424 $17,500 0 $0 $0 0 $0 $0 60 $14,309,872 $715,495 6 $1,216,160 $60,000 0 $0 $0 1 $201,760 $6,053 4 $1,033,267 $51,664 0 $0 $0 0 $0 $0 3 $658,160 $25,852 141 $51,667,222 $2,569,102 0 $0 $0 0 $0 $0 0 $0 $0 1 $607,161 $25,000 0 $0 $0 0 $0 $0 1 $269,660 $8,090 12 $3,323,632 $166,182 7 $2,260,498 $70,000 0 $0 $0 4 $1,011,225 $42,608 110 $31,198,690 $1,559,942 52 $14,388,777 $500,616 0 $0 $0 0 $0 $0 5 $1,309,261 $65,463 0 $0 $0 0 $0 $0 9 $2,237,550 $87,506 96 $29,070,185 $1,446,877 2 $393,500 $20,000 0 $0 $0 2 $547,953 $18,767 51 $16,652,584 $829,000 5 $1,455,521 $50,000 0 $0 $0 6 $1,624,777 $67,804 89 $27,645,522 $1,381,502 3 $943,720 $29,667 0 $0 $0 13 $2,832,979 $109,155 91 $26,464,700 $1,320,161 12 $3,324,236 $120,000 0 $0 $0 5 $1,506,035 $54,553 88 $26,956,797 $1,345,712 8 $2,267,623 $80,000 0 $0 $0 12 $2,753,207 $117,458 108 $29,842,864 $1,492,145 10 $2,324,061 $96,450 0 $0 $0 0 $0 $0 3 $680,282 $34,015 2 $365,998 $20,000 0 $0 $0 2 $424,763 $14,643 9 $3,027,726 $151,387 2 $497,714 $17,947 0 $0 $0 4 $1,002,308 $50,116 56 $17,500,867 $873,646 0 $0 $0 0 $0 $0 1 $293,876 $14,694 46 $13,226,071 $661,303 18 $5,164,212 $179,756 0 $0 $0 0 $0 $0 27 $8,367,208 $418,361 3 $916,591 $30,000 0 $0 $0 6 $1,451,975 $55,874 58 $19,123,447 $955,677 0 $0 $0 0 $0 $0 0 $0 $0 7 $1,873,833 $93,692 0 $0 $0 0 $0 $0 0 $0 $0 3 $806,745 $40,337 0 $0 $0 0 $0 $0 0 $0 $0 0 $0 $0 0 $0 $0 0 $0 $0 0 $0 $0 1 $268,026 $13,401 0 $0 $0 0 $0 $0 8 $1,727,920 $67,200 79 $22,109,343 $1,105,473 9 $2,326,482 $88,200 0 $0 $0 1 $165,123 $8,256 14 $3,265,933 $163,846 0 $0 $0 0 $0 $0 1 $175,200 $5,256 9 $2,212,765 $110,638 4 $1,103,230 $37,640 0 $0 $0 0 $0 $0 0 $0 $0 1 $109,500 $10,000 0 $0 $0 188 $44,482,703 $1,873,566 2,362 $694,014,901 $34,644,511 361 $99,735,838 $3,416,189 3 $409,939 $0
HFA PREFERRED PLUS GRANTS HOMETOWN HEROES SALUTE OUR SOLDIERS4 LOANS WITH
HOMEOWNERSHIP PROGRAMS
HOMEBUYER LOAN AND DOWNPAYMENT ASSISTANCE PROGRAM DEMOGRAPHICS
HOMEBUYER LOAN AND DOWNPAYMENT ASSISTANCE PROGRAM DEMOGRAPHICS
Number of Loans Closed & Households Served in 2022 5,533 BY HOUSEHOLD SIZE 1-2 persons 3,879 3-4 persons 1,362 5+ persons 292 BY AGE 15-54 4,843 55-61 353 62+ 337 BY INCOME 0-30% Area Median Income (AMI) 32 30.01-50% AMI 706 50.01-80% AMI 3,158 80.01-100% AMI 1,633 Over 100% AMI 4 BY RACE Black/African American 1,033 American Indian/Alaska Native 30 Asian 78 White 3,702 White & Black/African American 38 Other 349 No Race Designated 303 BY ETHNICITY Hispanic/Latino 1,373 Non-Hispanic/Latino 3,684 No Ethnicity Designated 476 Average Sales Price $259,065 Average Downpayment Assistance Loan Amount $11,836 Average First Mortgage Amount $249,693 Number of Veterans Served 1,148 32 Florida Housing Finance Corporation
HOMEOWNERSHIP PROGRAMS
Note:
As of December 31, 2022, an additional $1,544,272 of HOP funding was reserved in the names of 62 homebuyers. These loans will be closed in 2023 when construction is completed.
HOMEOWNERSHIP
DEMOGRAPHICS NUMBER OF LOANS CLOSED & HOMEBUYERS SERVED IN 2022 87 BY HOUSEHOLD SIZE 1-2 persons 42 3-4 persons 37 5+ persons 8 BY INCOME 0-30% Area Median Income (AMI) 0 30.01-50% AMI 14 50.01-80% AMI 73 BY AGE 15-54 71 55-61 6 62+ 10 BY RACE Black/African American 49 White 30 Other 1 American Indian or Alaska Native 7 BY ETHNICITY Hispanic 16 Non-Hispanic 71 COUNTY CLOSED LOANS TOTAL OF ALL HOP LOANS NUMBER OF HOMEBUYERS SERVED AVERAGE SALES PRICE Alachua $320,000 12 $194,908 Citrus $255,000 9 $164,889 Duval $35,000 1 $210,994 Flagler $35,000 1 $249,500 Gadsden $89,733 4 $217,991 Hillsborough $567,000 24 $216,620 Leon $109,000 4 $157,050 Marion $294,000 11 $131,773 Okaloosa $25,000 1 $225,000 Orange $200,000 8 $180,375 Pasco $35,900 2 $169,800 Putnam $25,000 1 $190,895 Seminole $125,000 5 $245,200 St. Johns $74,805 3 $212,300 Walton $35,000 1 $152,000 TOTALS $2,225,438 87 $194,620 33 2022 Annual Report
POOL PROGRAM (HOP)
HOMEOWNERSHIP PROGRAMS
HOMEOWNERSHIP POOL PROGRAM (HOP) DEMOGRAPHICS
HOMEOWNERSHIP POOL PROGRAM (HOP)
HOMEOWNERSHIP PROGRAMS
HOMETOWN HEROES PROGRAM
Note : The Hometown Heroes Loan Program provides down payment and closing cost assistance to eligible frontline community workers. 2,362 homebuyers were served from June 1, 2022 through December 31, 2022.
34 Florida Housing Finance Corporation
COUNTY NUMBER OF HOMEBUYERS SERVED FIRST MORTGAGE DOWN PAYMENT ASSISTANCE AVERAGE SALES PRICE Alachua 23 $5,662,324 $283,120 $253,658 Baker 2 $503,506 $25,176 $250,000 Bay 40 $11,006,758 $550,341 $293,629 Bradford 8 $1,864,903 $93,245 $237,925 Brevard 61 $17,253,432 $862,672 $293,734 Broward 139 $46,833,305 $2,334,510 $357,906 Calhoun 1 $146,783 $7,339 $150,000 Charlotte 16 $4,628,982 $231,450 $295,993 Citrus 16 $3,794,574 $189,730 $251,727 Clay 47 $14,239,379 $709,524 $314,664 Collier 22 $8,293,320 $414,483 $402,159 Columbia 12 $2,715,241 $135,762 $230,992 Desoto 6 $1,362,433 $68,122 $230,150 Dixie 2 $297,322 $14,866 $157,450 Duval 235 $67,095,492 $3,345,454 $294,768 Escambia 83 $19,509,513 $975,479 $242,458 Flagler 6 $1,902,597 $95,131 $323,882 Franklin 1 $196,377 $9,819 $200,000 Gadsden 10 $2,353,736 $117,686 $241,140 Gilchrist 1 $262,200 $13,110 $276,000 Glades 1 $159,080 $7,954 $164,000 Gulf 1 $215,000 $10,750 $221,000 Hamilton 1 $241,000 $12,050 $248,000 Hendry 2 $404,139 $20,207 $207,950 Hernando 45 $11,934,019 $596,703 $275,316 Highlands 19 $4,630,019 $231,503 $254,327 Hillsborough 134 $41,611,236 $2,080,575 $326,596 Holmes 2 $418,720 $20,936 $212,500 Indian River 17 $4,831,659 $241,585 $292,382 Jackson 3 $529,582 $26,480 $177,333 Lafayette 1 $228,400 $11,420 $245,000 Lake 43 $12,550,363 $627,520 $301,851 Lee 98 $30,088,887 $1,504,450 $318,073 Leon 70 $16,290,142 $814,513 $237,937 Levy 2 $454,744 $22,737 $231,250 Liberty 3 $776,474 $38,824 $263,600 Manatee 21 $6,185,257 $309,264 $314,182 Marion 60 $14,309,872 $715,495 $246,376 Martin 4 $1,033,267 $51,664 $273,125 Miami-Dade 141 $51,667,222 $2,569,102 $388,920 Monroe 1 $607,161 $25,000 $649,000 Nassau 12 $3,323,632 $166,182 $287,174 Okaloosa 110 $31,198,690 $1,559,942 $287,532 COUNTY NUMBER OF HOMEBUYERS SERVED FIRST MORTGAGE DOWN PAYMENT ASSISTANCE AVERAGE SALES PRICE Okeechobee 5 $1,309,261 $65,463 $267,600 Orange 96 $29,070,185 $1,446,877 $317,607 Osceola 51 $16,652,584 $829,000 $342,426 Palm Beach 89 $27,645,522 $1,381,502 $331,279 Pasco 91 $26,464,700 $1,320,161 $302,839 Pinellas 88 $26,956,797 $1,345,712 $319,067 Polk 108 $29,842,864 $1,492,145 $288,898 Putnam 3 $680,282 $34,015 $229,500 St. Johns 9 $3,027,726 $151,387 $347,431 St. Lucie 56 $17,500,867 $873,646 $322,867 Santa Rosa 46 $13,226,071 $661,303 $295,672 Sarasota 27 $8,367,208 $418,361 $320,571 Seminole 58 $19,123,447 $955,677 $347,790 Sumter 7 $1,873,833 $93,692 $285,843 Suwannee 3 $806,745 $40,337 $276,000 Union 1 $268,026 $13,401 $268,000 Volusia 79 $22,109,343 $1,105,473 $290,220 Wakulla 14 $3,265,933 $163,846 $241,193 Walton 9 $2,212,765 $110,638 $250,274 Totals 2,362 $694,014,901 $34,644,511 $306,428
HOMETOWN HEROES PROGRAM DEMOGRAPHICS
35 2022 Annual Report HOMEOWNERSHIP PROGRAMS HOMEOWNERSHIP PROGRAMS NUMBER OF LOANS CLOSED & HOUSEHOLDS SERVED IN 2022 2,362 BY HOUSEHOLD SIZE 1-2 persons 1,669 3-4 persons 574 5+ persons 119 BY AGE 15-54 2,106 55-61 133 62+ 123 BY INCOME 0-30% Area Median Income (AMI) 8 30.01-50% AMI 340 50.01-80% AMI 1,342 80.01-100% AMI 672 Over 100% AMI 0 BY RACE Black/African American 418 American Indian/Alaska Native 8 Asian 52 White 1,598 White & Black/African American 16 Other 133 No Race Designated 137 BY ETHNICITY Hispanic/Latino 538 Non-Hispanic/Latino 1,606 No Ethnicity Designated 218
RENTAL PROGRAMS
Note:
1In 2022, Florida Housing offered funding to assist competitive projects in the development pipeline experiencing cost increases related to market inflation. This funding, the Construction Housing Inflation Response Program (CHIRP), was intended to fill the funding gap due to increased construction costs. Developments had the opportunity to select National Housing Trust Funds, HOME funds from the American Rescue Plan, additional Competitive Housing Credits, or SAIL loan funding. The Developments listed on this table chose SAIL for their funding type. The Funding Amount represents the total of the SAIL and/or extremely-low income (ELI) loans and/or CHIRP received in 2022.
36 Florida Housing Finance Corporation
COUNTY DEVELOPMENT FUNDING AMOUNT1 TOTAL UNITS SET-ASIDE UNITS EXTREMELY LOW INCOME UNITS 1 Bay Sovereign at North Bay $4,300,000 144 144 0 Brevard Orchid Lake $4,300,000 90 90 0 Space Coast Commons $2,950,000 30 30 0 Broward Captiva Cove III $8,080,000 106 106 16 Hillsboro Landing $4,300,000 75 75 0 Southwest Hammocks $4,300,000 100 100 0 University Station $4,300,000 216 216 0 Collier Cadenza at Hacienda Lakes $4,300,000 160 160 0 Duval Lofts at San Marco East $8,500,000 172 172 9 Gadsden Arbours at Quincy $2,711,957 80 80 0 Hillsborough Casa di Francesco $4,100,000 140 140 9 Fulham Terrace $3,510,696 116 116 0 Lake Franklin House $1,911,000 46 46 5 Lee St. Peter Claver Place I $3,787,649 136 136 0 Leon Ridge Road $9,800,000 250 250 41 Manatee Astoria on 9th $9,650,000 120 120 9 Miami-Dade Alto Tower $1,119,104 84 84 0 Culmer $4,300,000 239 239 0 Everglades Village 5.6 $4,300,000 20 20 2
STATE APARTMENT INCENTIVE LOANS (SAIL)
37 2022 Annual Report
RENTAL PROGRAMS COUNTY DEVELOPMENT FUNDING AMOUNT1 TOTAL UNITS SET-ASIDE UNITS EXTREMELY LOW INCOME UNITS 1 Miami-Dade Naranja Grand II $5,600,000 200 200 20 Residences at Park View $3,600,000 103 103 12 Vista Breeze $3,600,000 119 119 20 Windmill Farms $10,600,000 274 274 14 Monroe Coco Vista $3,000,000 109 109 0 Lofts at Bahama Village $5,520,000 98 98 10 Okaloosa Princeton Grove $9,150,000 107 107 8 Orange Fern Grove $2,999,999 138 138 0 Whispering Oaks $4,560,000 192 192 29 Osceola Falcon Trace II $10,900,000 354 354 36 Rosewood Pointe $4,300,000 192 192 0 Pinellas Bear Creek Commons $2,850,000 85 85 13 Founders Point $3,964,500 15 15 3 Vincentian Village $5,110,000 73 73 11 Whispering Pines $1,589,675 20 20 0 Polk Griffin Lofts $4,340,300 60 60 9 Putnam College Arms $5,521,960 108 108 11 Sarasota Arbor Park $3,945,236 136 136 0 TOTALS $181,672,076 4,707 4,707 287
RENTAL PROGRAMS
RENTAL PROGRAMS
LOW INCOME HOUSING TAX CREDITS (9%)
Note:
1In 2022, Florida Housing offered funding to assist competitive projects in the development pipeline experiencing cost increases related to market inflation. This funding, the Construction Housing Inflation Response Program (CHIRP), was intended to fill the funding gap due to increased construction costs. Developments had the opportunity to select National Housing Trust Funds, HOME funds from the American Rescue Plan, additional Competitive Housing Credits, or SAIL loan funding. The Developments listed on this table chose Competitive Housing Credits for their funding type. The Funding Amount represents the total of the Housing Credits and/or CHIRP received in 2022.
38 Florida Housing Finance Corporation
COUNTY DEVELOPMENT FUNDING AMOUNT1 TOTAL UNITS SET-ASIDE UNITS Alachua Dogwood Village $1,675,000 96 96 Sherwood Oaks $1,316,824 124 124 Bay Southview Estates $458,777 50 50 Brevard Apollo Gardens $1,848,000 84 84 Broward City Place - Broward $3,218,000 99 99 Mount Hermon $500,000 104 104 Pinnacle 441 $500,000 113 113 Pinnacle at La Cabaña $2,882,000 110 110 Charlotte Verandas of Punta Gorda III $1,523,000 72 72 DeSoto Arcadia Landings $1,710,519 56 56 Cypress Garden $500,000 60 60 Duval Lofts at Cathedral $2,368,000 120 84 Melissa Grove $1,868,000 90 90 Village at Cedar Hills $1,887,000 90 90 Wilson West $545,633 50 50 Escambia Harbour Place $737,280 68 68 Tranquility at Ferry Pass $311,324 36 36 Hillsborough Adderley $2,875,000 128 128 Andrew Landing $2,875,000 108 108 Baytown $421,150 30 30 Lee Hibiscus II $2,200,000 96 96 Leon Emery Cove $2,200,000 96 96 Magnolia Family II $500,000 160 160 Manatee Courtney $790,000 72 72 Riverview6 $500,000 80 80 Marion Madison Oaks West $2,200,000 96 96 Silver Pointe $500,000 90 90
39 2022 Annual Report
RENTAL PROGRAMS COUNTY DEVELOPMENT FUNDING AMOUNT1 TOTAL UNITS SET-ASIDE UNITS Miami-Dade Cordova Estates $500,000 190 190 Oasis at Aventura $2,266,000 95 95 Southpointe Vista $500,000 124 124 Tucker Tower $326,000 120 120 Monroe Lofts at Bahama Village $1,800,000 98 98 Okaloosa Arbours at Crestview $500,000 96 96 Orange Beacon at Creative Village $2,375,000 85 76 Enclave at Lake Shadow $254,378 96 96 Osceola Madison Grove $1,700,000 80 80 Palm Beach Autumn Ridge $2,875,000 106 96 Berkeley Landing $500,000 112 112 Pasco Tanager Square $500,000 88 88 Pinellas Heritage Oaks $1,868,000 80 80 Vincentian Village $2,375,000 73 73 Polk Florence Place $2,700,000 88 88 Griffin Lofts $1,700,000 60 60 Grove Manor $500,000 82 82 Jersey Commons $1,496,000 68 68 Polk Swan Landing $500,000 88 88 Santa Rosa Tranquility at Milton $500,000 72 72 Sarasota McCown Tower $464,672 100 100 Seminole Banyan East Town $2,200,000 92 92 St. Johns Villages of New Augustine $1,625,000 92 92 St. Lucie Blue Sky Landing II $155,452 82 82 Volusia Bristol Manor $1,699,990 80 80 Highlands Manor $600,000 63 63 Walton Rosemary Place $500,000 72 72 TOTALS $71,890,999 4,860 4,805
RENTAL PROGRAMS
RENTAL
40 Florida Housing Finance Corporation
COUNTY DEVELOPMENT FUNDING AMOUNT TOTAL UNITS SET-ASIDE UNITS Brevard Armstrong Glen $631,398 50 50 Canaveral Cove $678,575 68 68 Jupiter Ridge $936,449 96 96 Broward Captiva Cove III $1,857,779 106 106 Charlotte Hampton Point $2,653,285 284 284 Collier Brittany Bay $2,667,079 184 184 Duval Lofts at San Marco East $1,996,122 172 172 Sable Palms $2,542,478 200 200 Gadsden Flint Garden $675,489 88 88 Hillsborough Casa di Francesco $1,443,578 140 140 Lake Franklin House $428,409 46 46 Leon Ridge Road $3,815,664 250 250 Manatee Astoria on 9th $1,628,144 120 120 Miami-Dade Ambar Trail II $1,632,363 132 132 College Park Towers $1,583,724 210 210 Gallery at West Brickell $1,256,051 465 93 Haley Sofge Preservation $4,016,508 240 240 Meadowgreen $1,712,085 119 119 Merritt Place Estates $1,902,811 159 159 Naranja Grand II $2,300,000 200 200 Platform 3750 $1,163,219 191 77 Residences at Park View $1,240,123 103 103 Vista Breeze $1,073,658 119 119 Windmill Farms $3,773,235 274 274 Okaloosa Princeton Grove $894,520 107 107 Orange Kinneret $4,047,855 280 280 Sandpiper Glen $4,170,101 288 288 Whispering Oaks $2,080,000 192 192
PROGRAMS LOW INCOME HOUSING TAX CREDITS (4%)
41 2022 Annual Report
RENTAL PROGRAMS COUNTY DEVELOPMENT FUNDING AMOUNT TOTAL UNITS SET-ASIDE UNITS Osceola Falcon Trace II $4,739,942 354 354 Heritage Commons $646,574 68 68 Heron Ridge $4,355,906 331 331 Osprey Park $5,367,932 383 383 Palm Beach St. Andrews Residences $1,665,271 177 177 St. James Residences $2,319,371 148 148 Pinellas Bear Creek Commons $1,169,121 85 85 Jordan Park $3,666,949 266 266 Palmetto Park $1,610,931 179 179 Putnam College Arms $834,462 108 108 Seminole Stratford Point $2,979,906 384 384 St. Johns Victoria Crossing $1,076,285 96 96 Volusia Clyde Morris Landings Senior Living II $995,541 88 88 TOTALS $86,228,893 7,550 7,064
RENTAL PROGRAMS
RENTAL PROGRAMS
Note:
HOME funds are used to fund this program.This table represents rental assistance paid to all participating households from January 1, 2022 through December 31, 2022.
NATIONAL HOUSING TRUST FUND COUNTY DEVELOPMENT FUNDING AMOUNT TOTAL UNITS SET-ASIDE UNITS Alachua Arbours at Merrillwood $2,600,000 40 10 Brevard Apollo Gardens $1,780,200 84 9 Space Coast Commons $2,240,000 30 8 Duval Village at Cedar Hills $1,835,100 90 9 Hillsborough Casa di Francesco $1,090,000 140 5 Manatee Astoria on 9th $713,400 120 3 Miami-Dade Alto Tower $1,522,000 84 6 Cutler Manor II $3,700,000 113 10 Naranja Grand II $1,546,000 200 5 Quail Roost Transit Village I $3,700,000 200 10 Village of Casa Familia $2,950,000 59 10 Vista Breeze $1,301,500 119 5 Okaloosa Princeton Grove $654,000 107 3 Osceola Dillingham $1,099,600 30 5 Pinellas Bear Creek Commons $1,189,000 85 5 Vincentian Village $1,340,000 73 4 Polk Griffin Lofts $870,000 60 3 Jersey Commons $1,176,000 68 7 TOTALS $31,306,800 1,702 117 42 Florida Housing Finance Corporation
NATIONAL HOUSING TRUST FUND HOMELESS SCHOOLCHILDREN PROGRAM, TENANT-BASED RENTAL ASSISTANCE (TBRA) COUNTY HOUSEHOLDS SERVED IN 2022 TOTAL FUNDING PAID IN 2022 Alachua 25 $480,564 Bay 29 $391,937 Charlotte 17 $220,640 Hernando 11 $129,169 Santa Rosa 44 $472,490 TOTALS 126 $1,694,800 0-30% AMI 31-50% AMI 51-80% AMI 78 38 10
Note:
Viability Loans were used in 2022 to assist Applicants that received awards in recent years, but experienced a financing gap due to instability in the construction market. The CDBG-DR Viability Loans assisted Applicants that received program funding for areas impacted by Hurricane Irma and for Workforce Housing development funding in Monroe County.
43 2022 Annual Report
RENTAL PROGRAMS COUNTY DEVELOPMENT FUNDING AMOUNT TOTAL UNITS SET-ASIDE UNITS Charlotte Hampton Point $36,300,000 284 114 Collier Brittany Bay $36,600,000 184 184 Lake Franklin House $6,110,000 46 46 Manatee Astoria on 9th $19,000,000 120 120 Miami-Dade Naranja Grand II $36,000,000 200 200 Okaloosa Princeton Grove $14,500,000 107 107 Orange Whispering Oaks $23,000,000 192 192 Putnam College Arms $10,000,000 108 108 TOTALS $181,510,000 1,241 1,071 MULTIFAMILY MORTGAGE REVENUE BONDS
RENTAL PROGRAMS
COMMUNITY DEVELOPMENT BLOCK GRANT - DISASTER RECOVERY VIABILITY LOANS COUNTY DEVELOPMENT FUNDING AMOUNT TOTAL UNITS SET-ASIDE UNITS Lee Civitas of Cape Coral $4,335,000 96 96 Miami-Dade Brownsville Transit Village V $2,250,000 120 120 Northside Transit Village III $2,250,000 200 200 Monroe Avenues at Big Pine Key $192,962 5 5 Seahorse Cottages at Big Pine Key I $690,835 17 17 Seahorse Cottages at Big Pine Key II $487,028 9 9 TOTALS $10,205,825 447 447
Note:
RENTAL PROGRAMS
HOME INVESTMENT PARTNERSHIPS PROGRAM
HOME INVESTMENT PARTNERSHIPS PROGRAM
1 Florida Housing assisted these Developments with Viability Loans in 2022. Although receving awards in previous years, they experienced a financing gap due to instability in the construction market.
COUNTY DEVELOPMENT FUNDING AMOUNT TOTAL UNITS SET-ASIDE UNITS Baker Sandcastle Manor $5,544,000 22 22 Bay 1 Tupelo Park $1,125,000 47 47 Bradford 1 Sandcastle Pines $1,000,000 25 25 DeSoto 1 Meadow Park $1,270,000 23 23 Gadsden Cross Creek Gardens at Quincy $6,000,000 34 34 Hardee 1 Casa San Alfonso $1,010,000 21 21 Hendry Pollywog Creek Mews $5,690,000 28 28 Jackson 1 Thomas Pines $2,200,000 35 35 Tranquility at Hope School Phase II $5,500,000 32 32 TOTALS $39,555,528 205 205 44 Florida Housing Finance Corporation
Note:
1 In 2022, Florida Housing offered funding to assist competitive projects in the development pipeline experiencing cost increases related to market inflation. This funding, the Construction Housing Inflation Response Program (CHIRP), was intended to fill the funding gap due to increased construction costs. Developments had the opportunity to select National Housing Trust Funds, additional Competitive Housing Credits, HOME funds from the American Rescue Plan or SAIL loan funding. The Developments noted on this table chose HOME-ARP for their funding type. The Funding Amount represents the total of HOME-ARP allocations received and/or CHIRP received in 2022.
HOME INVESTMENT PARTNERSHIPS - AMERICAN RESCUE PLAN COUNTY DEVELOPMENT FUNDING AMOUNT TOTAL UNITS SET-ASIDE UNITS Brevard Apollo Gardens $7,200,000 84 38 Space Coast Commons $2,950,000 30 30 Duval Village at Cedar Hills $7,200,000 90 41 Hillsborough 1 Baytown $1,978,600 30 10 Miami-Dade 1 Heron $2,520,000 20 10 Pinellas 1 Valor Preserve at Lake Seminole $2,750,000 64 10 Polk Jersey Commons $7,200,000 68 31 TOTALS $31,798,600 386 170 45 2022 Annual Report
RENTAL PROGRAMS
RENTAL PROGRAMS
HOME INVESTMENT PARTNERSHIPS - AMERICAN RESCUE PLAN
RENTAL PROGRAMS
1 CONSTRUCTION HOUSING INFLATION RESPONSE PROGRAM (CHIRP)
46 Florida Housing Finance Corporation
COUNTY DEVELOPMENT FUNDING AMOUNT 2 CHIRP FUNDING TYPE TOTAL UNITS Alachua Arbours at Merillwood $2,600,000 NHTF 40 Bay Southview Estates $458,777 Competitive HC 50 Sovereign at North Bay $4,300,000 SAIL 144 Brevard Orchid Lake $4,300,000 SAIL 90 Broward Captiva Cove III $4,300,000 SAIL 106 City Place - Broward $500,000 Competitive HC 99 Hillsboro Landing $4,300,000 SAIL 75 Mount Hermon $500,000 Competitive HC 104 Pinnacle 441 $500,000 Competitive HC 113 Southwest Hammocks $4,300,000 SAIL 100 University Station $4,300,000 SAIL 216 Collier Cadenza at Hacienda Lakes $4,300,000 SAIL 160 DeSoto Arcadia Landings $420,519 Competitive HC 56 Cypress Garden $500,000 Competitive HC 60 Duval Lofts at Cathedral $500,000 Competitive HC 120 Duval Lofts at San Marco East $4,300,000 SAIL 172 Tranquility at Ferry Pass $311,324 Competitive HC 36 Gadsden Arbours at Quincy $2,711,957 SAIL 80 Hillsborough Adderley $500,000 Competitive HC 128 Andrew Landing $500,000 Competitive HC 108 Baytown $1,978,600 HOME-ARP 30 Baytown $421,150 Competitive HC 30 Fulham Terrace $3,510,696 SAIL 116 Lee Hibiscus II $500,000 Competitive HC 96 St. Peter Claver Place I $3,787,649 SAIL 136 Leon Emery Cove $500,000 Competitive HC 96 Magnolia Family II $500,000 Competitive HC 160 Ridge Road $4,300,000 SAIL 250 Manatee Astoria on 9th $4,300,000 SAIL 120 RIVERVIEW6 $500,000 Competitive HC 80 Marion Madison Oaks West $500,000 Competitive HC 96 Silver Pointe $500,000 Competitive HC 90 Miami-Dade Alto Tower $2,641,104 SAIL & NHTF 84 Cordova Estates $500,000 Competitive HC 190 Culmer $4,300,000 SAIL 239
Note:
1 In 2022, Florida Housing offered funding to assist competitive projects in the development pipeline experiencing cost increases related to market inflation. This funding, the Construction Housing Inflation Response Program (CHIRP), was intended to fill the funding gap due to increased construction costs. Developments had the opportunity to select the funding types from National Housing Trust Funds, HOME funds from the American Rescue Plan, additional Competitive Housing Credits, or SAIL loan funding.
47 2022 Annual Report
RENTAL PROGRAMS COUNTY DEVELOPMENT FUNDING AMOUNT 2 CHIRP FUNDING TYPE TOTAL UNITS Miami-Dade Cutler Manor II $3,700,000 NHTF 113 Heron $2,520,000 HOME-ARP 20 Quail Roost Transit Village I $3,700,000 NHTF 200 Southpointe Vista $500,000 Competitive HC 124 Tucker Tower $326,000 Competitive HC 120 Village of Casa Familia $2,950,000 NHTF 59 Windmill Farms $4,300,000 SAIL 274 Monroe Coco Vista $3,000,000 SAIL 109 Okaloosa Arbours at Crestview $500,000 Competitive HC 96 Princeton Grove $4,300,000 SAIL 107 Orange Enclave at Lake Shadow $254,378 Competitive HC 96 Fern Grove $2,999,999 SAIL 138 Osceola Dillingham $1,099,600 NHTF 30 Falcon Trace II $4,300,000 SAIL 354 Rosewood Pointe $4,300,000 SAIL 192 Palm Beach Autumn Ridge $500,000 Competitive HC 106 Berkeley Landing $500,000 Competitive HC 112 Pasco Tanager Square $500,000 Competitive HC 88 Pinellas Valor Preserve at Lake Seminole $2,750,000 HOME-ARP 64 Whispering Pines $1,589,675 SAIL 20 Polk Florence Place $500,000 Competitive HC 88 Grove Manor $500,000 Competitive HC 82 Swan Landing $500,000 Competitive HC 88 St. Lucie Blue Sky Landing II $155,452 Competitive HC 82 Santa Rosa Tranquility at Milton $500,000 Competitive HC 72 Sarasota Arbor Park $3,945,236 SAIL 136 McCown Tower $464,672 Competitive HC 100 Seminole Banyan East Town $500,000 Competitive HC 92 Walton Rosemary Place $500,000 Competitive HC 72 TOTALS $125,296,788 7,074
RENTAL PROGRAMS
RENTAL PROPERTIES AWARDED FUNDING
48 Florida Housing Finance Corporation
PROGRAMS COUNTY DEVELOPMENT REQUEST FOR APPLICATION NUMBER 1 SAIL HC 9% HC 4% HOME HOME-ARP MMRB GRANTS TO HOUSE PERSONS WITH DEVELOPMENTAL DISABILITIES NHTF COMMUNITY DEVELOPMENT BLOCK GRANT - DISASTER RECOVERY Alachua Arbours at Merillwood RFA 2019113 2020 Dogwood Village RFA 2021201 $1,675,000 Sherwood Oaks RFA 2021204 $1,316,824 Baker Sandcastle Manor RFA 2021206 $5,544,000 Bradford Sandcastle Pines N/A $1,000,000 Bay Southview Estates RFA 2020201 2021 Sovereign at North Bay RFA 2019111 2020 2020 2020 Tupelo Park N/A 2019 2019 Brevard Apollo Gardens RFA 2022210 $1,848,000 $7,200,000 $1,780,200 Armstrong Glen N/A $631,398 Canaveral Cove N/A $678,575 Jupiter Ridge N/A $936,449 Orchid Lake RFA 2021103 2021 2021 2021 Space Coast Commons RFA 2022109 $2,950,000 $2,950,000 $2,240,000 Broward Captiva Cove III RFA 2021205 $3,780,000 $1,857,779 City PlaceBroward RFA 2021202 $2,718,000 Hillsboro Landing RFA 2020205 2021 2021 2021 2021 Mount Hermon RFA 2020202 2021 Pinnacle 441 RFA 2020202 2021
RENTAL
49 2022 Annual Report
RENTAL PROGRAMS CHIRP 2 VIABILITY LOCAL BONDS 3 UNITS FUNDED INCOME RESTRICTIONS BY AMI TOTAL UNITS SET-ASIDE UNITS/ BEDS LINK UNITS 4 < 35% 36% - 50% 51% - 60% 61% - 120% DEMOGRAPHIC TARGET CONSTRUCTION CATEGORY 5 ESTIMATED TOTAL DEVELOPMENT COST 6 $2,600,000 40 40 10 30 Elderly NC $14,063,888 96 96 5 10 86 Family NC $22,848,350 124 124 7 25 99 Family A/R $18,735,093 22 22 5 17 Family NC $6,294,543 21 21 5 16 Family NC $7,222,606 $458,777 50 50 10 40 Elderly NC $15,145,431 $4,300,000 144 144 11 22 80 42 Family NC $52,704,785 47 47 10 37 Family NC $14,859,628 84 84 26 58 Homeless NC $27,119,507 $8,100,000 50 50 3 50 Family A/R $14,801,826 $9,540,000 68 68 68 Family A/R $15,876,789 $14,700,000 96 96 96 Family A/R $25,588,240 $4,300,000 90 90 7 17 73 Homeless NC $29,288,364 30 30 8 22 Homeless NC $9,468,458 $4,300,000 $195,000,000 106 106 8 16 43 47 Family NC $41,083,132 $500,000 $19,500,000 99 99 6 11 88 Family NC $46,377,570 $4,300,000 75 75 4 17 58 Elderly NC $38,333,602 $500,000 104 104 11 93 Elderly NC $43,808,702 $500,000 113 110 11 99 Family NC $44,939,514
RENTAL PROGRAMS
RENTAL PROPERTIES AWARDED FUNDING
50 Florida Housing Finance Corporation
COUNTY DEVELOPMENT REQUEST FOR APPLICATION NUMBER 1 SAIL HC 9% HC 4% HOME HOME-ARP MMRB GRANTS TO HOUSE PERSONS WITH DEVELOPMENTAL DISABILITIES NHTF COMMUNITY DEVELOPMENT BLOCK GRANT - DISASTER RECOVERY Broward Pinnacle at La Cabaña RFA 2021202 $2,882,000 Southwest Hammocks RFA 2021106 2021 2021 University Station RFA 2020205 2021 2021 2021 2021 Charlotte Hampton Point N/A $2,653,285 $36,300,000 Verandas of Punta Gorda III RFA 2021201 $1,523,000 Collier Brittany Bay N/A $2,667,079 2001 $36,600,000 Cadenza at Hacienda Lakes RFA 2020205 2021 2021 2021 DeSoto Arcadia Landings RFA 2021201 $1,290,000 Cypress Garden RFA 2020201 2021 Meadow Park N/A $1,270,000 Duval Lofts at Cathedral RFA 2021202 $1,868,000 Lofts at San Marco East RFA 2021205 $4,200,000 $1,996,122 Melissa Grove RFA 2022301 $1,868,000 Sable Palms N/A $2,542,478 Village at Cedar Hills RFA 2022210 $1,887,000 $7,200,000 $1,835,100 Wilson West RFA 2021204 $545,633 Escambia Harbour Place RFA 2021204 $737,280 Tranquility at Ferry Pass RFA 2020201 2021
RENTAL PROGRAMS
51 2022 Annual Report
RENTAL PROGRAMS CHIRP 2 VIABILITY LOCAL BONDS 3 UNITS FUNDED INCOME RESTRICTIONS BY AMI TOTAL UNITS SET-ASIDE UNITS/ BEDS LINK UNITS 4 < 35% 36% - 50% 51% - 60% 61% - 120% DEMOGRAPHIC TARGET CONSTRUCTION CATEGORY 5 ESTIMATED TOTAL DEVELOPMENT COST 6 110 110 6 11 99 Elderly NC $33,836,080 $4,300,000 100 100 3 15 85 Special Needs NC $37,290,892 $4,300,000 216 216 14 16 16 146 38 Family NC $99,921,059 284 114 114 Family A/R $71,658,575 72 72 4 8 64 Family NC $20,159,497 184 184 184 Family A/R $68,716,002 $4,300,000 160 160 8 16 144 Elderly NC $49,246,174 $420,519 56 56 3 6 50 Elderly NC $16,752,103 $500,000 60 60 Family NC $20,888,531 23 23 5 18 Family NC $6,316,025 $500,000 120 84 9 18 39 27 Family NC $39,884,124 $4,300,000 $20,000,000 172 172 5 9 163 Family NC $44,656,372 90 90 5 9 81 Elderly NC $22,680,875 $35,384,000 200 200 200 Family A/R $61,884,474 90 90 9 81 Homeless NC $24,313,921 50 50 3 10 40 Family A/R $8,306,657 68 68 4 14 54 Family A/R $10,666,174 $311,324 36 36 14 32 Family NC $11,236,622
RENTAL PROGRAMS
RENTAL PROPERTIES AWARDED FUNDING
52 Florida Housing Finance Corporation
PROGRAMS COUNTY DEVELOPMENT REQUEST FOR APPLICATION NUMBER 1 SAIL HC 9% HC 4% HOME HOME-ARP MMRB GRANTS TO HOUSE PERSONS WITH DEVELOPMENTAL DISABILITIES NHTF COMMUNITY DEVELOPMENT BLOCK GRANT - DISASTER RECOVERY Gadsden Arbours at Quincy RFA 2019116 2019 2019 2019 Cross Creek Gardens at Quincy RFA 2021206 $6,000,000 Flint Garden N/A $675,489 Hardee Casa San Alfonso N/A Hendry Pollywog Creek Mews RFA 2021206 $5,690,000 Hillsborough Adderley RFA 2021202 $2,375,000 Andrew Landing RFA 2021202 $2,375,000 Baytown RFA 2021108 2021 2021 2021 Casa di Francesco RFA 2021205 $4,100,000 $1,443,578 $1,090,000 Fulham Terrace RFA 2020205 2021 2021 2021 Jackson Thomas Pines N/A $2,200,000 Tranquility at Hope School Phase II RFA 2021206 $5,500,000 Lake Franklin House RFA 2021205 $1,911,000 $428,409 $6,110,000 Lee Civitas of Cape Coral N/A 2021 2020 $4,335,000 Hibiscus II RFA 2021201 $1,700,000 St. Peter Claver Place I RFA 2020205 2021 2021 2021 Leon Emery Cove RFA 2021201 $1,700,000
RENTAL
53 2022 Annual Report
RENTAL PROGRAMS CHIRP 2 VIABILITY LOCAL BONDS 3 UNITS FUNDED INCOME RESTRICTIONS BY AMI TOTAL UNITS SET-ASIDE UNITS/ BEDS LINK UNITS 4 < 35% 36% - 50% 51% - 60% 61% - 120% DEMOGRAPHIC TARGET CONSTRUCTION CATEGORY 5 ESTIMATED TOTAL DEVELOPMENT COST 6 $2,711,957 80 80 4 8 72 Family NC $26,441,767 34 34 7 27 Family NC $8,798,381 $14,050,000 88 88 88 Family A/R $18,286,369 21 21 4 17 Family NC $7,933,603 28 28 6 22 Family NC $6,456,999 $500,000 128 128 11 22 81 25 Family NC $39,423,258 $500,000 108 108 6 11 97 Family NC $35,687,627 $2,399,750 30 30 6 24 Special Needs NC $15,824,976 $19,000,000 140 140 7 19 121 Elderly NC $30,646,056 $3,510,696 $16,000,000 116 116 9 23 71 22 Elderly NC $38,333,153 35 35 7 28 Family NC $6,156,051 32 32 7 25 Family NC $7,398,103 46 46 3 5 41 Elderly A/P $9,932,313 96 96 20 49 27 Family NC $35,162,177 $500,000 96 96 5 10 86 Family NC $30,850,147 3787649 136 136 7 14 122 Family NC $41,637,624 $500,000 96 96 5 10 86 Family NC $27,760,477
RENTAL PROGRAMS
RENTAL PROPERTIES AWARDED FUNDING
54 Florida Housing Finance Corporation
COUNTY DEVELOPMENT REQUEST FOR APPLICATION NUMBER 1 SAIL HC 9% HC 4% HOME HOME-ARP MMRB GRANTS TO HOUSE PERSONS WITH DEVELOPMENTAL DISABILITIES NHTF COMMUNITY DEVELOPMENT BLOCK GRANT - DISASTER RECOVERY Leon Magnolia Family II RFA 2020201 2021 Ridge Road RFA 2021205 $5,500,000 $3,815,664 Manatee Astoria on 9th RFA 2021205 $5,350,000 $1,628,144 $19,000,000 $713,400 Courtney RFA 2021204 $790,000 RIVERVIEW6 RFA 2020201 2021 Marion Madison Oaks West RFA 2021201 $1,700,000 Silver Pointe RFA 2016110 2017 MiamiDade Alto Tower RFA 2021103 2021 2021 2021 Ambar Trail II N/A $1,632,363 Brownsville Transit Village V N/A 2020 2020 2021 $2,250,000 College Park Towers N/A $1,583,724 Cordova Estates RFA 2021203 2021 Culmer RFA 2019116 2020 2020 2020 2020 Cutler Manor II RFA 2020205 2021 2021 2021 Everglades Village 5.6 RFA 2022104 $4,300,000 Gallery at West Brickell N/A $1,256,051 Haley Sofge Preservation N/A $4,016,508 Heron RFA 2020102 2021
RENTAL PROGRAMS
55 2022 Annual Report
RENTAL PROGRAMS CHIRP 2 VIABILITY LOCAL BONDS 3 UNITS FUNDED INCOME RESTRICTIONS BY AMI TOTAL UNITS SET-ASIDE UNITS/ BEDS LINK UNITS 4 < 35% 36% - 50% 51% - 60% 61% - 120% DEMOGRAPHIC TARGET CONSTRUCTION CATEGORY 5 ESTIMATED TOTAL DEVELOPMENT COST 6 $500,000 160 128 16 112 Family NC $44,898,532 $4,300,000 $49,500,000 250 250 21 41 86 123 Family NC $78,901,214 $4,300,000 120 120 6 12 108 Elderly NC $37,738,724 72 72 4 15 57 Elderly A/R $12,573,175 $500,000 80 80 12 32 36 Family NC $33,857,873 $500,000 96 96 5 10 86 Family NC $23,981,163 $500,000 90 90 9 81 Family NC $21,592,721 $2,641,104 84 84 4 13 71 Homeless NC $35,024,308 $23,500,000 132 132 132 Family NC $33,594,982 120 120 20 70 30 Family NC $36,558,932 $41,500,000 210 210 210 Elderly A/R $63,599,946 $500,000 190 190 29 76 85 Family NC $53,571,838 $4,300,000 239 239 41 11 127 60 Family NC $121,524,811 $3,700,000 $16,221,839 113 113 10 29 39 10 35 Family NC $52,647,553 20 20 2 2 16 FW|FW NC $5,317,288 $101,000,000 465 93 93 Family NC $189,774,273 $47,000,000 240 240 240 Elderly A/R $95,368,368 $2,520,000 20 20 4 16 Special Needs NC $5,114,180
RENTAL PROGRAMS
RENTAL PROPERTIES AWARDED FUNDING
56 Florida Housing Finance Corporation
COUNTY DEVELOPMENT REQUEST FOR APPLICATION NUMBER 1 SAIL HC 9% HC 4% HOME HOME-ARP MMRB GRANTS TO HOUSE PERSONS WITH DEVELOPMENTAL DISABILITIES NHTF COMMUNITY DEVELOPMENT BLOCK GRANT - DISASTER RECOVERY MiamiDade Meadowgreen N/A $1,712,085 Merritt Place Estates N/A 2002 2002 $1,902,811 Naranja Grand II RFA 2021205 $5,600,000 $2,300,000 $36,000,000 $1,546,000 Northside Transit Village III N/A 2020 2020 $2,250,000 Oasis at Aventura RFA 2021203 $2,266,000 Platform 3750 N/A $1,163,219 Quail Roost Transit Village I RFA 2020208 2021 2021 2021 Residences at Park View N/A $3,600,000 $1,240,123 Southpointe Vista RFA 2020203 2021 Tucker Tower RFA 2020203 2021 Village of Casa Familia RFA 2019107 2019 2019 2019 Vista Breeze RFA 2021205 $3,600,000 $1,073,658 $1,301,500 Windmill Farms RFA 2021205 $6,300,000 $3,773,235 Monroe Avenues at Big Pine Key N/A $192,962 Coco Vista RFA 2021208 2021 2021 Lofts at Bahama Village RFA 2022208 $5,520,000 $1,800,000 Seahorse Cottages at Big Pine Key I N/A $690,835
RENTAL PROGRAMS
57 2022 Annual Report
RENTAL PROGRAMS CHIRP 2 VIABILITY LOCAL BONDS 3 UNITS FUNDED INCOME RESTRICTIONS BY AMI TOTAL UNITS SET-ASIDE UNITS/ BEDS LINK UNITS 4 < 35% 36% - 50% 51% - 60% 61% - 120% DEMOGRAPHIC TARGET CONSTRUCTION CATEGORY 5 ESTIMATED TOTAL DEVELOPMENT COST 6 $21,825,000 119 119 119 Family A/R $42,751,362 $23,267,000 159 159 90 69 Family A/R $48,351,964 200 200 5 15 30 90 65 Family NC $49,141,783 200 200 32 72 96 Family NC $61,461,163 95 95 8 15 35 45 Family NC $29,887,434 $43,000,000 191 77 77 Family NC $89,506,515 $3,700,000 $34,500,000 200 200 16 42 40 18 100 Family NC $83,086,271 $21,000,000 103 103 6 6 6 85 6 Family NC $28,102,512 $500,000 124 124 19 77 28 Family NC $49,980,966 $326,000 120 120 18 48 54 Elderly NC $43,783,643 $2,950,000 2019 59 51 25 19 32 Special Needs NC $19,019,942 $20,000,000 119 119 10 25 69 25 Elderly NC $27,047,789 $4,300,000 $44,100,000 274 274 7 14 260 Family NC $84,309,005 5 5 1 4 Family NC $2,677,584 $3,000,000 109 109 9 17 37 55 Family NC $46,203,088 98 98 5 10 39 49 Family NC $35,536,551 17 17 2 15 Family NC $8,425,952
RENTAL PROGRAMS
RENTAL PROPERTIES AWARDED FUNDING
58 Florida Housing Finance Corporation
RENTAL PROGRAMS
COUNTY DEVELOPMENT REQUEST FOR APPLICATION NUMBER 1 SAIL HC 9% HC 4% HOME HOME-ARP MMRB GRANTS TO HOUSE PERSONS WITH DEVELOPMENTAL DISABILITIES NHTF COMMUNITY DEVELOPMENT BLOCK GRANT - DISASTER RECOVERY Monroe Seahorse Cottages at Big Pine Key II N/A $487,028 Okaloosa Arbours at Crestview RFA 2020201 2021 Princeton Grove RFA 2021205 $4,850,000 $894,520 $14,500,000 $654,000 Orange Beacon at Creative Village RFA 2021202 $2,375,000 Enclave at Lake Shadow RFA 2020202 2021 Fern Grove RFA 2020205 2021 2021 2021 2021 Kinneret N/A $4,047,855 Sandpiper Glen N/A $4,170,101 Whispering Oaks RFA 2021205 $4,560,000 $2,080,000 $23,000,000 Osceola Dillingham RFA 2021102 2021 2021 Falcon Trace II RFA 2021205 $6,600,000 $4,739,942 Heritage Commons N/A $646,574 Heron Ridge N/A $4,355,906 Madison Grove RFA 2021201 $1,700,000 Osprey Park N/A $5,367,932 Rosewood Pointe RFA 2020205 2021 2021 2021 2021 Palm Beach Autumn Ridge RFA 2021202 $2,375,000 Berkeley Landing RFA 2020202 2021
59 2022 Annual Report
RENTAL PROGRAMS CHIRP 2 VIABILITY LOCAL BONDS 3 UNITS FUNDED INCOME RESTRICTIONS BY AMI TOTAL UNITS SET-ASIDE UNITS/ BEDS LINK UNITS 4 < 35% 36% - 50% 51% - 60% 61% - 120% DEMOGRAPHIC TARGET CONSTRUCTION CATEGORY 5 ESTIMATED TOTAL DEVELOPMENT COST 6 9 9 1 8 Family NC $4,474,486 $500,000 96 96 10 86 Family NC $30,460,844 $4,300,000 107 107 6 14 93 Elderly NC $27,869,707 85 76 7 13 45 18 Family NC $27,105,795 $254,378 96 96 15 59 22 Family NC $28,184,721 $2,999,999 138 138 11 26 54 58 Elderly NC $43,116,572 $53,300,000 280 280 280 Elderly A/R $99,769,120 $46,500,000 288 288 288 Elderly NC $89,314,460 192 192 15 29 19 78 66 Family NC $52,828,567 $1,099,600 30 30 6 24 Special Needs NC $7,234,640 $4,300,000 $47,125,826 354 354 18 36 318 Family NC $97,465,889 $7,000,000 68 68 13 6 21 28 Family NC $13,405,699 $52,800,000 331 331 331 Elderly NC $95,746,075 80 80 4 8 72 Elderly NC $20,421,370 $60,000,000 383 383 383 Elderly NC $116,382,968 $4,300,000 192 196 15 29 76 87 Family NC $56,274,680 $500,000 106 96 8 16 68 12 Elderly NC $41,836,498 $500,000 112 110 17 68 25 Family NC $39,598,258
RENTAL PROGRAMS
RENTAL PROPERTIES AWARDED FUNDING
60 Florida Housing Finance Corporation
RENTAL PROGRAMS
COUNTY DEVELOPMENT REQUEST FOR APPLICATION NUMBER 1 SAIL HC 9% HC 4% HOME HOME-ARP MMRB GRANTS TO HOUSE PERSONS WITH DEVELOPMENTAL DISABILITIES NHTF COMMUNITY DEVELOPMENT BLOCK GRANT - DISASTER RECOVERY Palm Beach St. Andrews Residences N/A $1,665,271 St. James Residences N/A $2,319,371 Pasco Tanager Square RFA 2020201 2021 Pinellas Bear Creek Commons RFA 2021205 $2,850,000 $1,169,121 $1,189,000 Founders Point RFA 2022102 $3,964,500 Heritage Oaks RFA 2021202 $1,868,000 Jordan Park N/A 2000 $3,666,949 Palmetto Park N/A $1,610,931 Valor Preserve at Lake Seminole RFA 2020106 2021 2020 2021 Vincentian Village RFA 2022103 $5,110,000 $2,375,000 $1,340,000 Whispering Pines RFA 2021102 2021 Polk Florence Place RFA 2021201 $1,700,000 Griffin Lofts RFA 2022103 $4,340,300 $1,700,000 $870,000 Grove Manor RFA 2020204 2021 Jersey Commons RFA 2022210 $1,496,000 $7,200,000 $1,176,000 Swan Landing RFA 2020201 2021 Putnam College Arms RFA 2021205 $5,521,960 $834,462 $10,000,000 Saint Lucie Blue Sky Landing II RFA 2020201 2021 Santa Rosa Tranquility at Milton RFA 2019113 2020
61 2022 Annual Report
RENTAL PROGRAMS CHIRP 2 VIABILITY LOCAL BONDS 3 UNITS FUNDED INCOME RESTRICTIONS BY AMI TOTAL UNITS SET-ASIDE UNITS/ BEDS LINK UNITS 4 < 35% 36% - 50% 51% - 60% 61% - 120% DEMOGRAPHIC TARGET CONSTRUCTION CATEGORY 5 ESTIMATED TOTAL DEVELOPMENT COST 6 $24,000,000 177 177 102 47 28 Elderly A/R $46,650,086 $35,000,000 148 148 148 Elderly A/R $63,078,282 $500,000 88 88 9 79 Family NC $28,465,986 $12,500,000 85 85 7 18 53 14 Elderly NC $24,966,967 15 15 3 12 Homeless NC $4,114,500 80 80 4 8 72 Elderly NC $22,348,487 $42,680,000 266 266 40 226 Family A/R $91,360,011 $20,000,000 179 179 179 Family A/R $40,146,654 $2,750,000 64 64 10 54 Special Needs NC $26,736,194 73 73 6 15 58 Homeless NC $28,032,005 $1,589,675 20 20 4 16 Special Needs NC $4,796,585 $500,000 88 88 7 61 13 Family NC $27,473,074 60 60 4 3 9 48 Homeless NC $20,300,349 $500,000 82 82 17 65 Elderly NC $27,308,729 68 68 7 61 Homeless NC $21,964,939 $500,000 88 88 14 58 16 Family NC $25,902,714 108 108 7 11 97 Family A/P $18,240,266 $155,452 82 82 9 73 Family NC $23,309,476 $500,000 72 72 8 64 Family NC $21,180,602
RENTAL PROGRAMS
RENTAL PROGRAMS
RENTAL PROPERTIES AWARDED FUNDING
Notes:
When a development has received funding in a prior year, that year is included in the appropriate program column. In order to serve lower income households, resources from more than one program are often combined to finance a development. Viability Loans were used in 2022 to assist Applicants that received awards in recent years, but experienced a financing gap due to instability in the construction market.
HC 9% = Low Income Housing Tax Credit (9%); HC 4% = Low Income Housing Tax Credit (4%); MMRB = Multifamily Mortgage Revenue Bonds; SAIL = State Apartment Incentive Loan Program; HOME = Home Investment Partnerships; HOME-ARP = HOME American Rescue Plan; NHTF = National Housing Trust Fund; CHIRP = Construction Housing Inflation Response Program;
CBDG-DR = Community Development Block Grant- Disaster Recovery; This table includes developments that have been awarded funding, but may have been subject to legal challenges as of December 31, 2022. As a result, the developments listed in this table may include those that received a preliminary award prior to conclusion of such litigation.
1 Developments described as "N/A" were funded through 4% HC/MMRB or additional Viabililty loans and did not have Request for Application numbers associated with their applications.
2 In 2022, Florida Housing offered funding to assist competitive projects in the development pipeline experiencing cost increases related to market inflation. This funding, the Construction Housing Inflation Response Program (CHIRP), was intended to fill the funding gap due to increased construction costs. Developments had the opportunity to select the funding types from National Housing Trust Funds, HOME funds from the American Rescue Plan, additional Competitive Housing Credits, or SAIL loan funding.
62 Florida Housing Finance Corporation
COUNTY DEVELOPMENT REQUEST FOR APPLICATION NUMBER 1 SAIL HC 9% HC 4% HOME HOME-ARP MMRB GRANTS TO HOUSE PERSONS WITH DEVELOPMENTAL DISABILITIES NHTF COMMUNITY DEVELOPMENT BLOCK GRANT - DISASTER RECOVERY Sarasota Arbor Park RFA 2020205 2021 2021 2021 2021 McCown Tower RFA 2020204 2021 Seminole Banyan East Town RFA 2021201 $1,700,000 Stratford Point N/A $2,979,906 2000 St. Johns Victoria Crossing N/A $1,076,285 Villages of New Augustine RFA 2021201 $1,625,000 Volusia Clyde Morris Landings Senior Living II N/A $995,541 Bristol Manor RFA 2021201 $1,699,990 Highlands Manor RFA 2021204 $600,000 Walton Rosemary Place RFA 2020201 2021 TOTALS $94,507,760 $56,078,727 $86,228,893 $27,204,000 $24,550,000 $181,510,000 $15,735,200 $10,205,825
3 Local Bond developments that also have received Florida Housing financing have been included on this chart because local housing finance authorities provide a major source of multifamily financing throughout the state by issuing mortgage revenue bonds. Developers often combine these Local Bonds with financing through Florida Housing programs.
4 The Link to Permanent Housing Initiative, or "Link," requires developers to set aside a portion of a development's extremely low-income units for special needs households that are referred and served by community-based supportive services providers. Link units serve persons with physical, mental and/ or developmental disabilities, youth aging out of foster care, homeless households, and survivors of domestic violence. Note that the Link unit counts are also included in the Set-Aside Units/Beds total for each property.
5 NC = New construction; Preservation = Preservation of existing affordable properties; A/R = Acquisition/Rehabilitation properties in which there is acquisition and where more than 50% of the units are rehabilitation and the rest may be new construction; R = Rehabilitation of an existing structure (with no acquisition) where less than 50 percent of the proposed construction work consists of new construction.
6 Total Development Cost (TDC) is estimated in the development application and is determined in credit underwriting.
63 2022 Annual Report RENTAL PROGRAMS RENTAL PROGRAMS
CHIRP 2 VIABILITY LOCAL BONDS 3 UNITS FUNDED INCOME RESTRICTIONS BY AMI TOTAL UNITS SET-ASIDE UNITS/ BEDS LINK UNITS 4 < 35% 36% - 50% 51% - 60% 61% - 120% DEMOGRAPHIC TARGET CONSTRUCTION CATEGORY 5 ESTIMATED TOTAL DEVELOPMENT COST 6 $3,945,236 136 136 12 27 109 Elderly NC $39,192,673 $464,672 100 100 20 80 Elderly A/P $24,346,073 $500,000 92 92 6 12 80 Family NC $31,144,583 $43,000,000 384 384 384 Family A/R $82,145,828 $15,000,000 96 96 10 86 Family NC $29,107,957 92 92 5 10 72 Family NC $23,400,125 $10,500,000 88 88 12 9 40 27 Family NC $20,203,257 80 80 6 12 50 18 Elderly NC $24,813,567 63 63 4 13 50 Elderly A/R $14,998,316 $500,000 72 72 8 64 Family NC $19,177,486 $125,296,788 $1,307,093,665 15,746 14,994 465 1,446 622 11,167 1,681 $4,985,012,791
SPECIAL PROGRAMS
PREDEVELOPMENT LOAN PROGRAM
LOANS APPROVED FOR FUNDING
PREDEVELOPMENT LOAN PROGRAM HOMEOWNERSHIP LOANS APPROVED FOR FUNDING
*Total Set-aside units is the minimum required for the program. The developments will be required to meet the set-aside requirements of the most restrictive financing program source.
COUNTY DEVELOPMENT LOAN AMOUNT TOTAL UNITS SET-ASIDE UNITS Lake Grove in Leesburg $278,000 6 6 Miami-Dade 34 Ways Homeownership $350,000 6 6 CCSD Goulds Homeownership $600,000 11 11 Gardner's Park $75,000 3 3 NANA City Homes $500,000 37 37 TOTALS $1,803,000 63 63 64 Florida Housing Finance Corporation
HOMEOWNERSHIP
PREDEVELOPMENT LOAN PROGRAM RENTAL LOANS APPROVED FOR FUNDING COUNTY DEVELOPMENT LOAN AMOUNT TOTAL UNITS SET-ASIDE UNITS* Gadsden Cross Creek Gardens at Quincy $500,000 34 7 Polk Griffin Lofts $500,000 60 12 TOTALS $1,000,000 94 19
SPECIAL PROGRAMS
HURRICANE HOUSING RECOVERY PROGRAM (HHRP)
HURRICANE HOUSING RECOVERY PROGRAM (HHRP)
*Local government has been granted an extension for the encumbrance and expenditure of funds.
Notes:
These HHRP funds are from the Fiscal Year 2019-2020. Local governments were required to report on funds expended and encumbered through June 30, 2022. Annual distribution amount does not include program income, recaptured funds, carry forward funds or other funds which local governments also use to fund housing through the SHIP program. The homeownership and rental expenditures, when taken together, may be higher for this reason.
All information was certified and provided by each local government participating in the HHRP Program. The accuracy of this information has not been verified by Florida Housing. In addition, all local governments are required to submit copies of their audited financial statements to Florida Housing and be in compliance with the Florida Single Audit Act.
Local governments are subject to periodic compliance monitoring in which a sample of the reported numbers are examined and verified for accuracy.
LOCAL GOVERNMENT STATE DISTRIBUTION HOMEOWNERSHIP AMOUNT HOMEOWNERSHIP UNITS RENTAL AMOUNT RENTAL UNITS Bay County* $28,228,200 $21,444,056 346 $4,940,591 131 Calhoun County* $5,135,000 $4,365,000 53 $0 0 Franklin County $1,235,000 $1,050,321 22 $0 0 Gadsden County $3,055,000 $2,884,669 45 $0 0 Gulf County* $5,915,000 $5,463,517 122 $0 0 Holmes County $585,000 $497,250 5 $0 0 Jackson County* $7,215,000 $4,406,004 26 $0 0 Leon County $351,000 $343,668 22 $0 0 Liberty County* $1,755,000 $1,520,602 21 $0 0 Panama City* $8,431,800 $7,025,889 136 $584,277 85 Tallahassee $429,000 $408,343 15 $0 0 Wakulla County $780,000 $702,000 6 $0 0 Washington County $1,885,000 $1,602,250 14 $0 0 TOTALS $65,000,000 $51,713,569 833 $5,524,868 216 65 2022 Annual Report
SPECIAL PROGRAMS
SPECIAL PROGRAMS
STATE HOUSING INITIATIVES PARTNERSHIP (SHIP) DISTRIBUTION AND ALLOCATION OF FUNDS FOR 2019-2020 1
66 Florida Housing Finance Corporation
LOCAL GOVERNMENT 2019-2020 STATE DISTRIBUTION HOMEOWNERSHIP RENTAL INCOME LEVEL OF HOUSEHOLD SERVED TOTAL EXPENDITURES TOTAL UNITS TOTAL EXPENDITURES TOTAL UNITS EXTREMELY LOW VERY LOW LOW MODERATE Alachua County $267,398 $407,666 25 $0 0 0 12 13 0 .....Gainesville $265,693 $273,405 8 $0 0 2 1 5 0 Baker County $350,000 $315,000 4 $0 0 2 0 2 0 Bay County $316,039 $460,576 14 $116,599 16 4 13 7 6 .....Panama City $81,645 $63,321 7 $40,460 23 2 18 9 1 Bradford County $350,000 $364,500 9 $0 0 3 4 1 1 Brevard County $587,062 $734,083 16 $0 0 4 5 7 0 .....Cocoa $35,096 $29,203 1 $0 0 1 0 0 0 .....Melbourne $149,531 $168,437 4 $0 0 1 2 1 0 .....Palm Bay $205,366 $199,452 4 $0 0 2 1 1 0 .....Titusville $86,464 $321,314 7 $0 0 1 3 3 0 Broward County $892,710 $1,318,987 30 $124,000 3 1 9 14 8 .....Coral Springs $219,137 $183,836 5 $179,563 37 21 16 5 0 .....Davie $175,827 $178,891 4 $0 0 0 2 1 1 .....Deerfield Beach $133,809 $148,091 5 $0 0 1 3 1 0 .....Fort Lauderdale $311,252 $415,702 7 $0 0 1 2 4 0 .....Hollywood $253,721 $434,994 9 $0 0 4 4 1 0 .....Lauderhill $122,174 $101,740 3 $0 0 0 1 2 0 .....Miramar $233,358 $332,813 7 $0 0 1 1 2 3 .....Pembroke Pines $281,517 $355,065 8 $0 0 2 2 4 0 .....Plantation $152,556 $128,372 2 $0 0 0 1 1 0 .....Pompano Beach $188,109 $287,440 10 $0 0 2 4 2 2 .....Sunrise $157,727 $170,752 11 $0 0 10 1 0 0 .....Tamarac $110,215 $148,292 5 $0 0 3 1 1 0 Calhoun County $350,000 $336,547 13 $0 0 0 7 1 5 Charlotte County $392,488 $265,952 12 $526,357 74 45 25 5 0 Citrus County $354,490 $470,234 31 $100,000 13 14 16 14 0 Clay County $449,014 $427,557 21 $58,839 5 5 4 14 2 Collier County/Naples $704,195 $1,038,892 22 $0 0 0 4 9 1 Columbia County $350,000 $330,600 27 $0 0 11 5 4 7 DeSoto County $350,000 $532,651 10 $0 0 2 4 1 3
67 2022 Annual Report
SPECIAL PROGRAMS FUNDING AMOUNT BY INCOME LEVEL PERSONS WITH SPECIAL NEEDS SERVED2 AGE OF HOUSEHOLDER RACE/ETHNICITY OF HOUSEHOLDER EXTREMELY LOW VERY LOW LOW MODERATE % OF DISTRIBUTION USED FOR POPULATION TOTAL UNITS 18 - 25 26 - 40 41 - 61 62 + AMERICAN INDIAN ASIAN BLACK/ AFRICAN AMERICAN HISPANIC WHITE OTHER $0 $266,737 $140,929 $0 104% 10 1 3 5 16 0 0 15 3 7 0 $59,184 $27,250 $186,971 $0 45% 3 0 1 4 3 0 0 6 0 2 0 $225,894 $0 $44,674 $0 90% 5 0 0 1 3 0 0 2 0 2 0 $74,479 $168,954 $161,606 $182,136 20% 5 2 17 10 1 0 0 14 0 15 1 $1,518 $52,164 $50,453 $1,195 25% 12 2 13 10 5 0 0 22 0 8 0 $154,000 $140,000 $35,000 $35,000 50% 5 0 0 2 7 0 0 4 0 5 0 $164,368 $286,216 $283,499 $0 44% 5 0 2 7 7 0 0 5 1 9 1 $29,203 $0 $0 $0 83% 1 0 0 0 1 0 0 1 0 0 0 $37,790 $111,293 $19,354 $0 69% 4 0 1 1 2 0 0 4 0 0 0 $95,630 $55,190 $48,632 $0 44% 2 0 0 1 3 0 0 0 0 3 1 $66,579 $177,092 $77,643 $0 158% 2 0 2 2 3 0 0 4 0 3 0 $44,650 $444,969 $548,451 $364,916 50% 8 1 1 14 17 0 1 20 3 9 0 $162,323 $176,860 $24,216 $0 30% 7 2 12 23 5 0 0 10 10 10 7 $25,873 $48,817 $49,498 $54,703 28% 2 0 0 3 1 0 0 0 0 4 0 $17,325 $82,571 $48,195 $0 22% 1 0 0 0 5 0 0 2 0 3 0 $59,957 $117,943 $237,802 $0 38% 2 0 1 1 5 0 0 5 0 2 0 $185,463 $224,747 $24,784 $0 104% 6 0 0 2 7 0 0 0 4 5 0 $0 $54,624 $47,116 $0 21% 1 0 0 2 1 0 0 2 0 0 1 $26,225 $110,564 $96,025 $100,000 21% 2 0 2 3 2 0 0 5 1 0 1 $15,860 $51,899 $116,746 58% 3 0 2 0 6 0 0 0 1 6 1 $0 $59,182 $69,190 $0 24% 1 0 0 2 0 0 0 1 0 1 0 $41,732 $145,708 $60,000 $40,000 38% 3 0 2 4 4 0 0 6 0 4 0 $159,837 $10,915 $0 $0 56% 5 0 0 1 10 0 0 1 6 3 1 $80,144 $34,343 $33,805 $0 31% 1 0 0 1 4 0 0 2 1 2 0 $0 $218,706 $8,700 $109,141 25% 4 0 1 5 7 0 0 7 0 6 0 $329,674 $347,102 $105,914 $0 51% 18 16 20 20 10 0 0 11 7 45 0 $190,089 $178,436 $201,710 $0 76% 21 1 10 12 21 0 0 3 3 38 0 $117,630 $133,716 $190,050 $30,000 34% 6 2 5 9 10 0 0 4 3 19 0 $0 $200,000 $414,500 $75,000 30% 5 0 7 6 1 0 0 3 9 2 0 $100,050 $76,305 $70,245 $84,000 30% 9 2 9 5 11 0 0 9 2 16 0 $153,500 $254,000 $90,000 $35,151 139% 6 0 2 4 4 0 0 3 3 4 0
SPECIAL PROGRAMS
STATE HOUSING INITIATIVES PARTNERSHIP (SHIP) DISTRIBUTION AND ALLOCATION OF FUNDS FOR 2019-2020 1
68 Florida Housing Finance Corporation
LOCAL GOVERNMENT 2019-2020 STATE DISTRIBUTION HOMEOWNERSHIP RENTAL INCOME LEVEL OF HOUSEHOLD SERVED TOTAL EXPENDITURES TOTAL UNITS TOTAL EXPENDITURES TOTAL UNITS EXTREMELY LOW VERY LOW LOW MODERATE Dixie County $350,000 $315,363 16 $0 0 5 5 2 4 Duval County/Jacksonville $1,672,813 $1,554,544 217 $0 0 41 73 75 27 Escambia County/Pensacola $625,330 $723,890 69 $0 0 7 7 29 26 Flagler County / Palm Coast $350,000 $336,350 19 $17,577 6 2 19 4 0 Franklin County $350,000 $334,503 20 $0 0 2 8 5 5 Gadsden County $350,000 $288,227 12 $0 0 3 4 4 1 Gilchrist County $350,000 $352,450 13 $0 0 2 3 4 4 Glades County $350,000 $369,277 7 $0 0 0 3 0 2 Gulf County $350,000 $394,526 9 $0 0 3 1 3 2 Hamilton County $350,000 $349,799 7 $0 0 1 2 3 1 Hardee County $350,000 $340,047 14 $0 0 3 5 2 4 Hendry County $350,000 $347,829 15 $0 0 3 3 5 4 Hernando County $405,874 $1,115,827 32 $75,000 0 0 6 18 0 Highlands County $350,000 $502,202 43 $0 0 10 7 17 9 Hillsborough County $1,773,359 $2,293,257 134 $910,871 30 4 22 70 61 .....Tampa $651,582 $1,032,458 48 $51,883 16 13 36 12 3 Holmes County $350,000 $316,310 4 $0 0 0 3 1 0 Indian River County $358,231 $615,905 24 $0 0 3 8 11 2 Jackson County $350,000 $328,714 14 $0 0 0 5 7 2 Jefferson County $350,000 $394,817 7 $0 0 2 3 1 1 Lafayette County $350,000 $331,220 13 $0 0 3 3 6 1 Lake County $666,252 $660,000 12 $165,313 38 11 24 10 1 Lee County $809,644 $550,186 31 $341,321 43 32 20 21 1 .....Cape Coral $322,885 $368,999 6 $52,397 9 7 3 5 0 .....Fort Myers $146,731 $234,419 7 $0 0 3 2 2 0 Leon County $199,051 $317,800 17 $0 0 1 3 9 4 .....Tallahassee $383,139 $357,638 41 $0 0 6 17 15 3 Levy County $350,000 $385,059 15 $0 0 3 2 7 3 Liberty County $350,000 $321,430 9 $0 0 0 3 4 2 Madison County $350,000 $322,010 27 $0 0 12 7 7 1
SPECIAL PROGRAMS
69 2022 Annual Report
SPECIAL PROGRAMS FUNDING AMOUNT BY INCOME LEVEL PERSONS WITH SPECIAL NEEDS SERVED2 AGE OF HOUSEHOLDER RACE/ETHNICITY OF HOUSEHOLDER EXTREMELY LOW VERY LOW LOW MODERATE % OF DISTRIBUTION USED FOR POPULATION TOTAL UNITS 18 - 25 26 - 40 41 - 61 62 + AMERICAN INDIAN ASIAN BLACK/ AFRICAN AMERICAN HISPANIC WHITE OTHER $103,649 $99,285 $35,613 $76,816 22% 4 1 0 8 7 0 0 4 0 12 0 $223,148 $508,680 $573,578 $240,418 21% 49 3 29 80 105 0 2 179 7 29 0 $128,975 $121,700 $278,215 $195,000 37% 12 15 25 16 13 0 0 13 6 45 0 $3,142 $293,210 $57,575 $0 64% 8 1 8 14 2 0 0 7 3 14 1 $32,501 $153,578 $98,424 $50,000 35% 6 0 5 7 8 0 0 7 0 13 0 $115,837 $56,690 $49,300 $66,400 54% 8 0 2 2 8 0 0 12 0 0 0 $64,380 $93,000 $116,000 $79,070 31% 4 4 1 5 3 0 0 2 0 11 0 $0 $202,650 $0 $38,720 87% 4 0 2 0 3 0 0 4 1 0 0 $132,081 $38,521 $183,924 $40,000 61% 5 0 2 4 3 0 0 4 0 5 0 $77,329 $129,527 $121,529 $21,414 22% 1 0 1 0 6 0 0 3 0 4 0 $51,402 $85,651 $142,995 $60,000 26% 5 2 3 4 5 0 0 3 6 5 0 $107,870 $81,124 $115,635 $43,200 90% 12 0 1 5 9 0 0 10 4 1 0 $0 $77,228 $328,599 $0 48% 8 3 9 8 4 0 0 1 2 21 0 $110,705 $62,399 $227,813 $101,285 42% 12 1 16 13 13 0 0 7 22 14 0 $404,092 $647,212 $1,249,871 $797,954 68% 42 18 63 59 24 0 0 27 1 26 110 $260,853 $579,196 $195,192 $49,100 94% 37 0 13 24 27 0 0 42 12 10 0 $266,310 $50,000 $0 90% 4 0 0 1 3 0 0 0 0 4 0 $78,641 $208,942 $314,837 $13,485 106% 12 1 5 8 10 0 0 13 1 10 0 $0 $134,327 $179,387 $15,000 38% 5 1 2 9 2 0 0 6 0 8 0 $164,982 $96,854 $112,981 $20,000 79% 3 0 2 2 3 0 0 6 0 1 0 $56,862 $87,195 $167,163 $20,000 29% 3 0 2 7 4 0 0 1 0 12 0 $48,611 $110,232 $206,470 $20,000 67% 5 4 16 20 6 0 0 22 7 17 0 $422,133 $198,582 $268,043 $2,750 51% 28 2 34 24 14 1 0 35 13 23 2 $42,017 $277,577 $101,801 $0 60% 3 1 4 8 2 0 0 4 6 5 0 $74,425 $49,024 $110,970 $0 160% 7 0 0 1 6 0 0 7 0 0 0 $119,011 $65,040 $105,590 $28,160 85% 3 2 6 3 6 0 0 11 0 6 0 $37,897 $117,575 $157,267 $44,900 60% 30 0 7 12 22 0 0 31 0 9 1 $90,000 $55,945 $167,430 $71,685 25% 3 1 4 4 6 0 0 4 0 10 1 $0 $94,118 $137,702 $89,610 34% 4 0 3 3 3 0 0 0 1 8 0 $133,681 $86,609 $86,720 $15,000 32% 10 0 3 8 16 0 0 20 0 7 0
SPECIAL PROGRAMS
STATE HOUSING INITIATIVES PARTNERSHIP (SHIP) DISTRIBUTION AND ALLOCATION OF FUNDS FOR 2019-2020 1
70 Florida Housing Finance Corporation
LOCAL GOVERNMENT 2019-2020 STATE DISTRIBUTION HOMEOWNERSHIP RENTAL INCOME LEVEL OF HOUSEHOLD SERVED TOTAL EXPENDITURES TOTAL UNITS TOTAL EXPENDITURES TOTAL UNITS EXTREMELY LOW VERY LOW LOW MODERATE Manatee County $615,386 $1,012,357 13 $0 0 3 5 4 1 .....Bradenton $107,407 $157,363 5 $0 0 2 1 2 0 Marion County $568,631 $1,137,940 39 $317,000 4 14 14 15 0 .....Ocala $116,219 $169,672 7 $0 0 2 2 2 1 Martin County $360,476 $495,825 14 $0 0 0 1 3 1 Miami-Dade County $1,905,883 $1,420,000 22 $2,933,640 485 380 88 32 7 .....Hialeah $254,631 $173,308 2 $111,594 24 0 23 0 1 .....Miami $512,815 $244,861 5 $0 0 2 1 2 0 .....Miami Beach $98,595 $185,296 2 $0 0 0 1 1 0 .....Miami Gardens $121,098 $91,620 3 $18,543 5 2 4 1 1 .....North Miami $67,803 $78,509 4 $0 0 0 4 0 0 Monroe County $350,000 $323,968 11 $0 0 0 7 2 2 Nassau County $350,000 $443,565 5 $0 0 0 0 2 2 Okaloosa County/Fort Walton Bch $426,703 $506,503 12 $0 0 1 2 1 1 Okeechobee County $350,000 $395,742 24 $0 0 1 8 12 3 Orange County $1,836,505 $1,987,315 82 $1,349,948 164 156 19 57 14 .....Orlando $491,721 $397,125 15 $136,356 9 6 10 5 1 Osceola County $540,704 $592,907 56 $0 0 15 17 17 7 .....Kissimmee $139,683 $165,761 8 $15,799 12 0 11 9 0 Palm Beach County $1,865,560 $3,344,319 84 $0 0 17 24 29 14 .....Boca Raton $160,871 $180,000 2 $0 0 0 1 1 0 .....Boynton Beach $132,003 $190,428 5 $0 0 1 3 1 0 .....Delray Beach $114,485 $102,800 2 $0 0 1 0 1 0 .....West Palm Beach $194,427 $213,876 2 $84,573 25 9 17 0 0 Pasco County $948,955 $1,150,047 37 $2,790,756 15 10 11 28 3 Pinellas County $886,355 $1,015,678 26 $902,098 82 51 27 29 1 .....Clearwater $202,776 $252,542 2 $300,000 7 7 0 2 0 .....Largo $146,591 $726,853 8 $0 0 0 0 4 2 .....St. Petersburg $466,844 $1,044,111 54 $3,364 0 10 10 27 7 Polk County $944,415 $1,296,050 53 $0 0 3 8 25 17
SPECIAL PROGRAMS
71 2022 Annual Report
SPECIAL PROGRAMS FUNDING AMOUNT BY INCOME LEVEL PERSONS WITH SPECIAL NEEDS SERVED2 AGE OF HOUSEHOLDER RACE/ETHNICITY OF HOUSEHOLDER EXTREMELY LOW VERY LOW LOW MODERATE % OF DISTRIBUTION USED FOR POPULATION TOTAL UNITS 18 - 25 26 - 40 41 - 61 62 + AMERICAN INDIAN ASIAN BLACK/ AFRICAN AMERICAN HISPANIC WHITE OTHER $352,500 $312,699 $324,625 $22,533 71% 6 1 1 7 4 0 0 10 1 2 0 $21,073 $53,645 $82,644 $0 68% 2 0 0 2 3 0 0 4 0 1 0 $369,273 $478,210 $607,457 $0 66% 15 0 10 17 16 0 0 10 6 25 2 $17,215 $102,930 $41,502 $8,025 28% 2 0 2 1 4 0 0 4 0 3 0 $0 $12,569 $69,694 $31,063 35% 5 0 1 3 1 0 0 2 1 2 0 $2,145,347 $753,190 $1,075,103 $380,000 40% 80 5 171 172 159 0 0 353 63 91 0 $0 $107,406 $0 $4,188 68% 3 6 10 7 1 0 0 12 0 12 0 $90,584 $31,353 $122,924 $0 24% 4 0 1 1 3 0 0 2 3 0 0 $0 $85,296 $100,000 $0 101% 1 0 1 1 0 0 0 2 0 0 0 $7,827 $33,265 $24,071 $20,000 21% 2 0 4 3 1 0 0 6 1 1 0 $0 $78,509 $0 $0 40% 1 0 0 1 3 0 0 3 1 0 0 $0 $143,968 $90,000 $90,000 44% 5 1 3 1 6 0 0 3 1 7 0 $0 $98,396 $71,451 $77,600 40% 2 0 2 2 0 0 0 1 0 3 0 $30,121 $95,988 $47,802 $22,189 27% 3 0 1 2 2 0 0 3 0 2 0 $12,350 $126,039 $219,553 $37,800 51% 11 0 7 6 11 0 0 9 6 9 0 $710,395 $1,028,997 $1,349,019 $248,852 23% 7 7 67 141 31 0 3 141 23 75 4 $54,946 $152,147 $172,079 $74,959 45% 7 0 7 8 9 0 0 17 2 3 2 $73,226 $90,577 $336,928 $92,176 29% 25 1 24 11 20 0 1 18 8 27 2 $0 $139,864 $41,695 $0 24% 2 1 6 9 4 0 0 7 1 12 0 $406,989 $865,706 $1,401,830 $669,794 39% 21 1 12 51 20 0 2 52 17 13 0 $0 $95,000 $85,000 $0 53% 1 0 0 2 0 0 0 1 1 0 0 $75,000 $97,428 $18,000 $0 131% 5 0 0 0 5 0 0 4 0 1 0 $39,485 $0 $63,314 $0 90% 2 0 0 1 1 0 0 2 0 0 0 $20,132 $164,441 $0 $0 22% 7 0 13 8 4 0 0 11 3 10 1 $253,680 $1,438,875 $2,220,552 $27,697 77% 19 0 4 11 15 0 1 9 2 31 0 $617,475 $345,277 $838,077 $116,947 54% 39 12 30 48 18 0 0 52 5 47 4 $300,000 $0 $252,542 $0 108% 3 0 1 3 5 1 0 2 1 5 0 $0 $0 $396,452 $70,390 260% 3 0 2 1 3 0 0 0 0 6 0 $180,638 $183,221 $555,452 $128,165 30% 7 1 14 13 26 0 1 34 3 15 1 $269,340 $232,385 $618,325 $176,000 62% 14 5 22 12 14 0 0 24 3 26 0
SPECIAL PROGRAMS
STATE HOUSING INITIATIVES PARTNERSHIP (SHIP) DISTRIBUTION AND ALLOCATION OF FUNDS FOR 2019-2020 1
Notes:
1These SHIP funds are from the Fiscal Year 2019-2020. Pursuant to Florida Law, for this fiscal year, local governments were required to report on funds expended and encumbered through June 30, 2022. Annual distribution amount does not include program income, recaptured funds, carry forward funds or other funds which local governments also use to fund housing through the SHIP program. The homeownership and rental expenditures, when taken together, are higher for this reason.
2The statute requires that local governments spend 20 percent of their SHIP distribution to serve Persons with Special Needs. On the Special Needs percentage of distribution column, a percentage may be over 100% because the percentage of funding for Special Needs Households is calculated based on the state distribution amount, as required by law. A local government may spend its entire distribution plus any portion of its program income for Special Needs households, thus the possibility that this percentage could be over 100 percent.
72 Florida Housing Finance Corporation
SPECIAL PROGRAMS
LOCAL GOVERNMENT 2019-2020 STATE DISTRIBUTION HOMEOWNERSHIP RENTAL INCOME LEVEL OF HOUSEHOLD SERVED TOTAL EXPENDITURES TOTAL UNITS TOTAL EXPENDITURES TOTAL UNITS EXTREMELY LOW VERY LOW LOW MODERATE .....Lakeland $190,094 $131,555 5 $159,226 77 55 15 11 1 .....Winter Haven $77,055 $54,000 3 $0 0 0 1 0 2 Putnam County $350,000 $365,443 9 $0 0 2 3 2 2 Santa Rosa County $388,760 $588,155 21 $0 0 7 4 5 5 Sarasota County/Sarasota $788,258 $2,651,336 45 $0 0 6 16 23 0 Seminole County $864,144 $1,009,324 22 $28,271 21 6 15 17 5 St. Johns County $493,651 $634,169 107 $0 0 1 84 21 1 St. Lucie County $144,789 $228,504 7 $0 0 1 4 1 0 .....Fort Pierce $85,666 $143,255 6 $0 0 4 1 1 0 .....Port St. Lucie $367,353 $626,941 17 $0 0 4 6 7 0 Sumter County $350,000 $691,974 9 $0 0 3 1 4 1 Suwannee County $350,000 $335,243 33 $0 0 13 9 6 5 Taylor County $350,000 $312,904 4 $0 0 2 0 2 0 Union County $350,000 $315,350 12 $0 0 3 2 3 4 Volusia County $687,245 $1,733,226 150 $126,608 4 90 29 35 0 .....Daytona Beach $121,864 $157,824 6 $0 0 0 2 3 1 .....Deltona $167,368 $239,746 10 $0 0 0 6 4 0 Wakulla County $350,000 $359,314 7 $0 0 4 1 1 1 Walton County $350,000 $279,985 17 $0 0 2 3 7 5 Washington County $350,000 $385,395 9 $0 0 1 1 1 1 TOTALS $45,645,273 $57,839,401 2,346 $12,037,955 1,247 1,224 1,000 962 334
SPECIAL PROGRAMS
Additional Notes:
*The above information was certified and provided by each local government participating in the SHIP Program. The accuracy of this information has not been verified by Florida Housing. In addition, all local governments are required to submit copies of their audited financial statements to Florida Housing and be in compliance with the Florida Single Audit Act.
**Local governments are subject to periodic compliance monitoring in which a sample of the reported numbers are examined and verified for accuracy.
73 2022 Annual Report
SPECIAL PROGRAMS
FUNDING AMOUNT BY INCOME LEVEL PERSONS WITH SPECIAL NEEDS SERVED2 AGE OF HOUSEHOLDER RACE/ETHNICITY OF HOUSEHOLDER EXTREMELY LOW VERY LOW LOW MODERATE % OF DISTRIBUTION USED FOR POPULATION TOTAL UNITS 18 - 25 26 - 40 41 - 61 62 + AMERICAN INDIAN ASIAN BLACK/ AFRICAN AMERICAN HISPANIC WHITE OTHER $129,806 $24,245 $124,729 $12,000 62% 13 7 37 34 4 1 0 47 9 21 4 $0 $24,000 $0 $30,000 31% 1 1 0 2 0 0 0 0 1 2 0 $55,443 $150,000 $100,000 $100,000 30% 3 0 1 5 2 0 0 6 0 2 0 $376,128 $73,516 $87,155 $51,356 54% 3 1 5 5 10 0 0 1 0 20 0 $225,410 $776,062 $1,649,864 $0 47% 9 3 3 14 25 0 0 1 4 40 0 $8,024 $344,476 $659,217 $25,878 30% 7 2 13 22 6 0 0 20 7 16 0 $3,859 $453,249 $176,905 $156 58% 22 9 43 42 13 0 0 39 7 61 0 $7,875 $123,733 $8,000 $0 67% 3 0 1 2 3 0 0 4 0 2 0 $119,575 $13,680 $10,000 $0 151% 5 0 0 1 5 0 0 5 1 0 0 $119,123 $221,982 $285,836 $0 96% 8 0 2 3 12 0 0 5 3 9 0 $329,139 $7,512 $345,324 $10,000 96% 3 0 1 4 4 0 0 1 3 5 0 $99,523 $71,385 $103,815 $60,520 27% 11 1 11 6 15 0 0 8 1 24 0 $154,370 $0 $158,534 $0 34% 1 0 0 2 2 0 0 3 0 1 0 $107,865 $34,890 $92,595 $80,000 26% 3 2 4 2 4 0 0 3 0 9 0 $486,631 $543,909 $829,295 $0 116% 48 2 56 61 35 0 1 44 17 88 4 $0 $50,000 $95,581 $12,243 74% 3 0 3 2 1 0 0 4 0 2 0 $0 $168,390 $71,356 $0 23% 1 0 1 4 5 0 0 2 7 1 0 $293,745 $35,569 $15,000 $15,000 90% 4 1 2 4 0 0 0 2 0 5 0 $60,000 $45,000 $119,985 $55,000 21% 3 1 9 6 1 0 0 0 3 14 0 $49,380 $36,015 $50,000 $10,000 96% 7 0 1 1 2 0 0 2 0 2 0 $14,376,695 $19,879,268 $25,635,613 $6,071,737 52% 964 160 990 1,286 1,063 3 12 1,651 364 1,316 153
AVERAGE RENTS CHARGED AT RENTAL PROPERTIES IN FLORIDA HOUSING'S
74 Florida Housing Finance Corporation
COUNTY EFFICIENCY 1 BR 2 BR 3 BR 4 BR 5 BR Alachua - $450 $550 $758 $554Baker - $347 $250 $751 $1,286Bay - $607 $786 $881 $949Bradford - $728 $822 $364 -Brevard $335 $562 $708 $925 $800 $666 Broward $520 $830 $1,117 $1,239 $965 $1,216 Charlotte - $548 $804 $973 $1,139Citrus $332 $571 $630 $815 $967Clay $644 $667 $878 $1,023 $1,037Collier $267 $636 $1,088 $1,261 $1,222Columbia $216 $548 $816 $937 -DeSoto - $446 $705 $842 $783Duval $285 $485 $712 $831 $736Escambia $237 $549 $719 $812 $655Flagler - $567 $844 $1,078 -Franklin - $436 $444 $708 -Gadsden - $393 $567 $465 $469Glades - $590 $684 - -Gulf - $313 $553 $803 $932Hamilton - $337 $426 $432 -Hardee - $687 $800 $830 $381Hendry - $435 $587 $797 $911Hernando - $656 $941 $1,123 $1,177Highland - $502 $768 $909 $1,002Hillsborough $291 $578 $885 $1,065 $1,186 $601 Indian River $542 $597 $820 $1,035 $1,067Jackson $281 $328 $426 $518 -Jefferson - $325 $412 - -Lake - $610 $904 $1,090 $1,205Lee - $597 $823 $923 $874 $230 Leon $302 $644 $797 $860 $331Levy - $387 $640 $864 - -
RENTAL PORTFOLIO
OF DECEMBER 31, 2022
PORTFOLIO AS
Notes:
Most properties are required to restrict the rents charged to those set by U.S. HUD. Beyond that, rents may then be based in part on the submarket in which they are located - that is, "what the market will bear." In some cases, rents may be set lower if a property has a mission to serve certain demographics, such as formerly homeless people, who cannot afford to pay much rent. As a result, in some cases, average rents for units with more bedrooms in a county may be lower than rents charged for smaller units.
75 2022 Annual Report RENTAL PORTFOLIO RENTAL PORTFOLIO COUNTY EFFICIENCY 1 BR 2 BR 3 BR 4 BR 5 BR Madison - $277 $432 $511 $377Manatee $467 $728 $962 $1,089 $1,151 $528 Marion - $484 $521 $691 $750Martin - $756 $891 $1,088 $655Miami-Dade $387 $624 $1,060 $1,263 $1,253Monroe - $967 $1,309 $1,406 $1,273Nassau - $528 $683 $726 $1,187Okaloosa - $653 $884 $1,044 $1,219Okeechobee - $528 $658 $795 -Orange $450 $742 $973 $1,149 $1,263Osceola - $749 $986 $1,136 $1,281Palm Beach $331 $668 $995 $1,231 $1,172Pasco - $681 $909 $1,107 -Pinellas $368 $477 $792 $944 $1,184 $1,044 Polk $420 $503 $630 $768 $778 $487 Putnam - $492 $674 $850 $767Santa Rosa $628 $716 $800 $793 -Sarasota - $599 $880 $1,093 $1,127Seminole - $684 $906 $1,093 $1,291St. Johns - $711 $937 $984 $1,219St. Lucie - $676 $918 $1,067 $1,233Sumter - $540 $786 $1,150 $1,265Suwannee - $668 $783 $952 -Taylor - $251 $257 $270 $350Volusia - $503 $692 $885 $975Wakulla - $408 $289 - -Walton - $377 $544 $549 -Washington - $583 - - - -
RENTAL PORTFOLIO
DEMOGRAPHIC CHARACTERISTICS OF RENTERS LIVING IN PROPERTIES FINANCED BY FLORIDA HOUSING *
This table shows demographic information about the renters living in properties financed by Florida Housing. Residents are not required to report demographic information about themselves. It is their choice. This is the reason for the disparity between total numbers in the various categories below.
Note:
*Resident information is for individuals, not households.
GUARANTEE PROGRAM - STATUS OF LOANS FOR MULTIFAMILY DEVELOPMENTS
AS OF DECEMBER 31, 2022
76 Florida Housing Finance Corporation
RESIDENTS SERVED BY AGE 0-17 146,395 18-54 170,150 55-61 23,170 62+ 60,829 RESIDENTS SERVED BY ETHNICITY Hispanic 96,820 Non-Hispanic 223,418 RESIDENTS SERVED BY RACE Black/African American 106,929 American Indian or Alaskan Native 1,244 Asian 1,245 White 154,124 White and Black/African American 3,121 Other 53,575 ACTIVE TOTAL UNITS BY DEMOGRAPHIC TARGET Elderly 28,663 Farmworker or Commercial Fishing Worker 1,856 Homeless 2,653 Special Needs 1,612 Family 167,843 ACTIVE TOTAL UNITS BY AMI < 35% AMI 12,759 36-50% AMI 18,101 51-60% AMI 166,782 61-80% AMI 4,172 > 80% AMI 813 ELI UNITS 19,825 AVERAGE HOUSEHOLD SIZE 2.2 AVERAGE HOUSEHOLD INCOME $27,579 GEOGRAPHIC DISTRIBUTION Large Medium Small NUMBER OF UNITS BY COUNTY SIZE 131,637 71,047 8,700 PERCENTAGE BY COUNTY SIZE 62.3% 33.6% 4.1%
DEVELOPMENT CITY COUNTY OWNER TOTAL UNITS ORIGINAL ISSUER/ LENDER MORTGAGE MATURITY DATE ORIGINAL MORTGAGE AMOUNT GUARANTEED PARTICIPATION IN HUD FHA RISK SHARING PROGRAM AMOUNT Vista Palms Lehigh Acres Lee Creative Choice Homes 229 Lee County 06/01/41 $10,700,000 No $4,887,647 TOTAL 229 $10,700,000 $4,887,647
OCCUPANCY RATES FOR ACTIVE, REPORTING UNITS IN FLORIDA HOUSING'S PORTFOLIO, FOURTH QUARTER OF 2021 AND 2022
Out of a total of 244,092 active, leasing-up and pipeline units, 196,420 are actively operating and reported information for this survey covering October through December of 2022. For comparison, the occupancy rate is provided for the fourth quarter of 2021. The occupancy rate is a weighted average (by unit).
Note :
For comparison, the rental vacancy rate reported by the US Census was 5.8 percent for Florida and 6.8 percent for the US during the fourth quarter of 2022. This equals a 94.2 percent occupancy rate for the US and a 93.2 occupancy rate for Florida. Note that this is for all residential rental units serving all income levels, not just affordable apartments.
In comparison, the overall occupancy rate for Florida Housing's rental portfolio was 97.1 percent at the end of 2022, higher than the state occupancy rate for all rental properties in Florida noted above. While 6.0 percent of all Florida Housing properties had an occupancy rate of less than 90 percent, only 5.0 percent of the total units are in properties that had an occupancy rate of less than 90 percent. The average size of properties reporting is 132 units. Although properties with less than 75 units account for 45 percent of those properties with an occupancy rate below 90 percent, they only represent 0.7 percent of all units in the Florida Housing portfolio. Therefore, when looking at this measure strictly from the property level, the smaller properties skew the results negatively.
77 2022 Annual Report RENTAL PORTFOLIO RENTAL PORTFOLIO COUNTY 2022 2021 TOTAL ACTIVE AND REPORTING UNITS OCCUPANCY RATE OCCUPANCY RATE Alachua 2,292 92.8% 96.1% Baker 80 95.4% 96.7% Bay 1,760 96.5% 95.1% Bradford 30 98.9% 96.2% Brevard 4,309 96.9% 97.7% Broward 14,673 98.5% 98.4% Charlotte 1,591 96.6% 97.9% Citrus 690 97.4% 96.9% Clay 1,126 95.9% 98.0% Collier 3,999 97.5% 97.7% Columbia 465 90.1% 93.5% DeSoto 651 94.2% 96.7% Duval 13,383 94.1% 95.1% Escambia 1,977 93.5% 91.4% Flagler 704 97.8% 98.6% Franklin 124 88.5% 94.3% Gadsden 351 93.8% 96.1% Glades 50 88.7% 92.0% Gulf 101 80.2% 84.3% Hamilton 109 89.6% 82.6% Hardee 395 90.5% 96.3% Hendry 329 94.2% 95.3% Hernando 1,856 98.0% 98.3% Highlands 847 95.9% 96.0% Hillsborough 15,605 97.3% 96.9% Holmes - 0.0% 78.7% Indian River 2,355 97.2% 97.8% Jackson 522 94.3% 92.1% Jefferson 75 95.6% 89.3% Lake 3,229 97.3% 97.9% Lee 3,835 94.3% 93.9% Leon 2,120 92.3% 96.0% Levy 209 96.5% 97.0% Madison 264 94.3% 88.6% Manatee 3,189 97.0% 96.5% Marion 1,603 96.8% 95.6% Martin 690 97.0% 96.8% Miami-Dade 37,446 98.3% 97.4% COUNTY 2022 2021 TOTAL ACTIVE AND REPORTING UNITS OCCUPANCY RATE OCCUPANCY RATE Monroe 1,474 99.3% 98.8% Nassau 357 94.9% 90.8% Okaloosa 582 96.9% 97.4% Okeechobee 243 99.0% 99.0% Orange 24,898 98.0% 98.2% Osceola 6,149 97.0% 98.3% Palm Beach 10,164 97.6% 97.3% Pasco 2,817 97.9% 97.8% Pinellas 5,661 96.2% 96.6% Polk 4,139 97.9% 97.4% Putnam 514 96.2% 94.5% Santa Rosa 319 96.6% 97.0% Sarasota 1,553 95.8% 98.7% Seminole 5,083 97.7% 98.0% St. Johns 1,140 96.1% 97.0% St. Lucie 2,216 98.0% 97.6% Sumter 405 95.6% 96.2% Suwannee 152 98.2% 93.4% Taylor 100 95.0% 97.6% Volusia 5,197 97.3% 97.8% Wakulla 64 99.5% 99.0% Walton 154 94.2% 96.4% Washington 5 100.0% 84.6% Statewide 196,420 97.1% 97.2%
Notes:
PREDEVELOPMENT LOAN PROGRAM LOAN SUMMARY AS OF DECEMBER 31, 2022
CDBG = Community Development Block Grant; FCLF = Florida Community Loan Fund; FHLB = Federal Home Loan Bank; HOME = Home Investment Partnerships Program; HUD = U.S. Housing and Urban Development; LIHTC = Low Income Housing Tax Credits; SAIL = State Apartment Incentive Loans; SHIP = State
Partnership; USDA = U.S. Dept of Agriculture.
78 Florida Housing Finance Corporation RENTAL PORTFOLIO
Housing Initiatives
DEVELOPMENT DEVELOPER COUNTY HOMEOWNERSHIP/ RENTAL NUMBER OF UNITS DEMOGRAPHIC TARGET ACTIVE LOANS 350 East Sixth Hannibal Square CLT, Inc. Orange Homeownership 24 Family Boulevard Art Lofts MFK/REVA Development LLC Broward Rental 45 Workforce Casa Familia Casa Familia, Inc. Miami-Dade Rental 50 Persons with Disabilities Hope Hammock Community of Hope Brevard Rental 9 Family The Promenade at Westlake Hannibal Square CLT, Inc. Orange Rental 28 Family The Townhomes at Westlake Hannibal Square CLT, Inc. Orange Homeownership 30 Family CM II POAH Miami-Dade Rental 120 Family Phoenix Crossings Abundant Life Ministries-Hope House, Inc. Flagler Rental 30 Youth Coleman Park Renaissance CP Renaissance, LLC Palm Beach Rental 30 Family Quiet Meadows McCurdy Senior Housing Corporation Palm Beach Rental 120 Elderly Liberty City Homes Neighborhood Housing Foundation Miami-Dade Homeownership 48 Family Saving Mercy Saving Mercy Corporation Marion Rental 70 Homeless Sweetwater Apartments Greater Lake City CDC Columbia Rental 56 Family Villages of New Augustine West Augustine Historical CDC St. Johns Rental 60 Family Independence Place Community Assisted and Supported Living, Inc. Pinellas Rental 32 Persons with Disabilities Clermont Ridge II Provident Housing Solutions, Inc. Orange Rental 93 Elderly Daytona Brentwood Provident Housing Solutions, Inc. Volusia Rental 84 Homeless Civitas of Cape Coral Catalyst Southwest Florida, LLC Lee Rental 96 Family Gardens at Diana Point II CDC of Tampa Hillsborough Rental 24 Family Villa of Solana Riviera Beach CDC Palm Beach Homeownership 28 Family Little Haiti Towers NANA, Inc. Miami-Dade Rental 73 Family Oaks at Moore Creek II East to West Development Corporation St. Lucie Homeownership 15 Family AmStrong Building EcoTech Visions Foundation Miami-Dade Homeownership 52 Family NANA City Homes NANA, Inc. Miami-Dade Homeownership 37 Family CCSD Goulds Homeownership Community Coalition of South Dade, Inc. Miami-Dade Homeownership 11 Family Gardner's Park Struggle for Miami's Affordable and Sustainable Housing Miami-Dade Homeownership 3 Family Aquarius Landing Volusia Initiative for Church and Community, Inc. Volusia Rental 47 Elderly Greater Heights II Neighbor Up Brevard Brevard Rental 6 PWDD Grove in Leesburg MLJ Land Trust Lake Homeownership 6 Family 34 Ways Homeownership Thirty Four Ways Foundation, Inc. Miami-Dade Homeownership 6 Family Cross Creek Gardens at Quincy Neighborhood Renaissance, Inc. Gadsden Rental 34 Family Griffin Lofts Allegre Pointe, LLC Polk Rental 60 Homeless LOANS REPAID IN 2022 Carr Landing Contemporary Housing Alternatives of Florida, Inc. Manatee Rental 88 Family Independence Landing Independence Landing, LLC Leon Rental 50 Persons with Disabilities Cypress Street Senior Housing Arcadia Housing Authority/Judd K. Roth DeSoto Rental 50 Elderly View 29 2901 Wynwood, LLC Miami-Dade Rental 116 Family Greyes Place II Affordable Housing Solutions for Florida, Inc. Wakulla Rental 30 Family Clermont Vue Provident Housing Solutions, Inc. Lake Rental 72 Family PAST DUE LOANS Grace Manor Apartments Grace & Truth Community Development Corporation Duval Rental 80 Elderly Ridgewood Apartments Ridgewood Apartments of Winter Haven, LLC. Polk Rental 33 Family
Notes Continued:
1Known construction funding sources, which may or may not include private financing, secured as of December 31, 2022
79 2022 Annual Report
RENTAL PORTFOLIO
RENTAL PORTFOLIO
PLP LOAN AMOUNT BOARD APPROVAL DATE CONSTRUCTION FINANCING STATUS 1 FUNDING SOURCE 2 CONSTRUCTION AMOUNT OUTSTANDING PLP LOAN BALANCE $614,000 11/2/2018 Seeking Funding County funds $6,933,150 $608,324 $500,000 9/19/2014 Seeking Funding To Be Determined $12,049,071 $360,315 $500,000 1/26/2018 Funding Awarded RFA 2019-107 $13,950,000 $500,000 $163,000 5/10/2019 Seeking Funding FHLB, CDBG, SAIL, HOME $1,331,500 $80,506 $750,000 12/13/2019 Seeking Funding FHLB, Local funds $5,543,983 $194,189 $750,000 12/13/2019 Seeking Funding FHLB, Local funds $7,394,644 $750,000 $750,000 5/10/2019 Funding Awarded RFA 2020-205 $29,900,000 $750,000 $464,500 10/31/2019 Seeking Funding SAIL $5,102,000 $71,387 $750,000 10/31/2019 Seeking Funding SAIL, LIHTC $8,160,778 $683,973 $650,000 7/27/2018 Funding Awarded RFA 2020-205 $35,469,478 $154,723 $664,390 4/30/2021 Seeking Funding CDBG, Miami-Dade Surtax $9,887,000 $438,549 $500,000 7/27/2018 Seeking Funding To Be Determined $5,800,000 $174,504 $500,000 5/10/2019 Funding Awarded RFA 2020-205 $9,134,782 $59,507 $750,000 9/22/2017 Funding Awarded RFA 2020-201 $14,432,733 $724,350 $628,000 9/4/2020 Seeking Funding To Be Determined $4,134,000 $502,845 $750,000 4/17/2020 Seeking Funding To Be Determined $19,853,000 $533,096 $750,000 9/4/2020 Funding Awarded RFA 2021-103 $19,000,000 $489,218 $424,667 1/29/2021 Seeking Funding To Be Determined $22,578,934 $409,486 $433,000 6/18/2021 Seeking Funding County Funds, FCLF $7,042,154 $3,619 $250,000 6/18/2021 Seeking Funding HOME $7,623,128 $29,603 $500,000 10/22/2021 Seeking Funding Miami-Dade Surtax $16,050,000 $124,310 $500,000 12/10/2021 Seeking Funding Local funds $4,900,000 $63,954 $500,000 10/22/2021 Seeking Funding Miami-Dade Surtax $14,326,700 $181,821 $500,000 1/21/2022 Seeking Funding LISC, Miami-Dade Surtax $7,714,035 $129,900 $600,000 4/29/2022 Seeking Funding Miami-Dade Surtax, NLP $2,500,000 $193,814 $75,000 5/10/2019 Seeking Funding To Be Determined $455,500 Not Closed $500,000 6/18/2021 Seeking Funding SHIP, Tax Credits $16,140,000 Not Closed $215,000 9/10/2021 Seeking Funding SAIL, Tax Credits $1,993,226 Not Closed $278,000 8/5/2022 Seeking Funding SAIL, LIHTC, SHIP $21,838,046 Not Closed $350,000 4/29/2022 Seeking Funding Miami-Dade Surtax $1,400,000 Not Closed $500,000 6/17/2022 Seeking Funding RFA 2021-206 $8,798,381 Not Closed $500,000 10/28/2022 Funding Awarded RFA 2022-103 LIHTC, SAIL $20,673,118 Not Closed $468,076 12/14/2018 Seeking Funding HUD 221 Loan $11,027,250 Repaid $500,000 12/14/2018 Funding Awarded RFA 2020-106 $14,800,000 Repaid $350,000 12/9/2005 Funding Awarded RFA 2020-201 $15,226,007 Repaid $500,000 10/16/2020 Funding Awarded Miami-Dade Surtax, Bonds $37,948,810 Repaid $560,000 4/17/2020 Funding Awarded RFA 2020-206 $6,495,411 Repaid $750,000 7/30/2021 Seeking Funding RFA 2021-2022 $20,532,000 Repaid $750,000 8/8/2008 No Construction No Construction N/A $649,989 $131,075 8/8/2008 No Construction No Construction N/A $76,359
STATE APARTMENT INCENTIVE
80 Florida Housing Finance Corporation RENTAL PORTFOLIO COUNTY DEVELOPMENT NAME CITY OWNER TOTAL UNITS SETASIDE UNITS DEMOGRAPHIC POPULATION SERVED 1 Alachua Eden Park at Ironwood Gainesville Ironwood Associates Ltd. 104 102 Family Grove at Sweetwater Preserve Gainesville Pinnacle Housing Group LLC 96 96 Family Horizon House Sunset Gainesville JE Properties LLC 80 80 Family Pine Grove Apartments Gainesville Volunteers of America National Services Corporation 97 97 Elderly Royal Park Apartments Gainesville Banyan Development Group, LLC 192 184 Family Royal Park Apartments Gainesville Banyan Development Group, LLC 192 8 Family Bay Independence Village Panama City Big Bend Community Based Care, Inc. 24 24 Special Needs Panama Commons Panama City Paces Foundation, Inc. 92 92 Family Pelican Pointe Panama City Royal American Development Inc. 78 70 Family Pelican Pointe Panama City Royal American Development Inc. 78 8 Family Pinnacle at Hammock Crossings Lynn Haven Pinnacle Housing Group LLC 92 92 Family Stone Harbor Panama City Lakeside Capital Advisors LP 160 160 Family Brevard Clear Pond Estates Cocoa Evergreen Partners LLC 100 90 Family Clear Pond Estates Cocoa Evergreen Partners LLC 100 10 Family Malabar Cove I Palm Bay Atlantic Housing Partners, LLLP 76 46 Family Malabar Cove I Palm Bay Atlantic Housing Partners, LLLP 76 8 Family Malabar Cove II Palm Bay Atlantic Housing Partners, LLLP 72 50 Family Manatee Cove Melbourne Richman Group 192 192 Family Orchid Lake Cocoa Housing for Homeless, Inc. 90 76 Homeless|Special Needs Orchid Lake Cocoa Housing for Homeless, Inc. 90 14 Homeless|Special Needs Promise in Brevard West Melbourne Promise Inc. 117 115 Special Needs Timber Trace Titusville Richman Group 204 204 Family Timber Trace Titusville Richman Group 204 204 Family Trinity Towers East Melbourne Preservation of Affordable Housing Inc. 156 32 Elderly Trinity Towers East Melbourne Preservation of Affordable Housing Inc. 156 117 Elderly Trinity Towers East Melbourne Preservation of Affordable Housing Inc. 156 16 Elderly Trinity Towers South Melbourne Preservation of Affordable Housing Inc. 162 162 Elderly Wickham Club Melbourne CED Companies 132 132 Family Willow Brook Village Melbourne Community Housing Initiative, Inc. 56 56 Family Broward Caravel Arms Lauderdale Lakes Southport Financial Services, Inc 110 11 Family Caravel Arms Lauderdale Lakes Southport Financial Services, Inc 110 99 Family Chaves Lake Hallandale RS Development Corporation 238 238 Family Colonial Park Margate Related Companies of New York 160 159 Elderly Dixie Court Ft. Lauderdale Fort Lauderdale Housing Authority 122 122 Family Dixie Court III Ft. Lauderdale Fort Lauderdale Housing Authority 100 10 Family Douglas Gardens V Pembroke Pines Douglas Gardens V, Ltd. 110 99 Elderly Douglas Gardens V Pembroke Pines Douglas Gardens V, Ltd. 110 11 Elderly Emerald Palms Ft. Lauderdale MRK Partners Inc. 318 318 Family Golf View Gardens Sunrise Carlisle Development Group LLC 160 160 Elderly
LOAN PROGRAM LOANS OUTSTANDING AS OF DECEMBER 31, 2022
81 2022 Annual Report
RENTAL PORTFOLIO ORIGINAL LOAN AMOUNT MATURITY DATE INTEREST RATE LOAN BALANCE AS OF 12/31/2022 INTEREST PAID IN 2022 AFFORDABILITY PERIOD LOAN STATUS 2 FUNDING TYPE3 $1,025,000 9/2/2045 9.00% $1,025,000 $0 50 Past Due SAIL $3,840,000 4/30/2037 1.00% $3,840,000 $0 50 Current SAIL $2,000,000 12/31/2056 1.00% $975,996 $10,000 53 Current SAIL $750,000 2/25/2047 1.00% $0 $0 15 Current EHCL $5,242,500 4/17/2040 1.00% $596,375 $0 50 Current SAIL $600,000 4/17/2040 0.00% $66,264 $0 15 Current ELI $1,691,745 8/3/2026 1.00% $1,486,930 $0 50 Past Due SAIL $1,892,544 2/1/2051 1.00% $1,743,105 $69,724 55 Current SAIL $4,047,210 9/21/2038 1.00% $4,047,210 $18,710 50 Current SAIL $408,200 9/21/2038 0.00% $408,200 $0 15 Current ELI $3,003,800 6/20/2034 1.00% $2,290,000 $22,900 50 Current SAIL $1,225,000 7/21/2036 3.00% $0 $0 50 Current SAIL $3,329,900 8/1/2058 1.00% $3,329,900 $0 50 Current SAIL $652,000 8/1/2058 0.00% $652,000 $0 15 Current ELI $4,000,000 11/1/2048 1.00% $4,000,000 $40,000 50 Current SAIL $680,000 9/29/2024 0.00% $680,000 $0 15 Current SAIL $2,000,000 11/1/2048 1.00% $2,000,000 $20,000 50 Current SAIL $4,000,000 11/15/2037 3.00% $4,000,000 $27,661 50 Current SAIL $9,051,050 6/13/2040 0.50% $160,052 $0 50 Current SAIL $380,000 6/13/2040 0.00% $6,720 $0 15 Current ELI $2,000,000 3/31/2046 0.00% $1,978,315 $0 50 Current SAIL $4,000,000 3/15/2045 3.00% $4,000,000 $118 50 Current SAIL $1,000,000 3/15/2045 1.00% $1,000,000 $0 15 Current SAIL $750,000 11/29/2048 1.00% $750,000 $0 15 Current EHCL $4,018,404 11/29/2048 1.00% $4,018,404 $89,593 50 Current SAIL $889,600 11/29/2048 0.00% $889,600 $0 15 Current ELI $750,000 12/9/2048 1.00% $750,000 $0 15 Current EHCL $3,000,000 8/15/2037 3.00% $0 $179,753 50 Current SAIL $4,348,848 4/1/2057 1.00% $4,236,443 $60,508 50 Current SAIL $825,000 9/22/2029 0.00% $825,000 $0 35 Current ELI $250,000 10/1/2049 1.00% $249,798 $2,498 15 Current SAIL $2,000,000 5/1/2050 3.00% $1,056,466 $31,694 60 Current SAIL $2,000,000 6/1/2044 3.00% $1,887,123 $89,251 50 Current SAIL $1,025,000 12/1/2024 3.00% $0 $79,444 50 Current SAIL $850,000 12/31/2023 0.00% $0 $0 15 Current SAIL $5,000,000 7/22/2036 1.00% $5,000,000 $33,868 50 Current SAIL $781,900 7/22/2036 0.00% $781,900 $0 15 Current ELI $2,500,000 4/1/2035 3.00% $1,250,000 $0 50 Current SAIL $2,000,000 11/1/2043 3.00% $2,000,000 $101,287 50 Current SAIL
RENTAL PORTFOLIO
STATE APARTMENT INCENTIVE LOAN PROGRAM LOANS OUTSTANDING AS OF DECEMBER 31, 2022
82 Florida Housing Finance Corporation RENTAL PORTFOLIO COUNTY DEVELOPMENT NAME CITY OWNER TOTAL UNITS SETASIDE UNITS DEMOGRAPHIC POPULATION SERVED 1 Broward Heritage Park at Crane Creek Melbourne Carrfour Supportive Housing Inc 108 91 Homeless|Special Needs Heritage Park at Crane Creek Melbourne Carrfour Supportive Housing Inc 108 17 Homeless|Special Needs Heron Pointe Miramar Blackstone Inc. 200 200 Family Marquis Apartments Pompano Beach Cornerstone Group Development LLC 100 85 Family Marquis Apartments Pompano Beach Cornerstone Group Development LLC 100 15 Family Meridian - Hollywood Hollywood Related Companies of New York 160 159 Elderly Northwest Gardens V Ft. Lauderdale Fort Lauderdale Housing Authority 200 180 Elderly Northwest Gardens V Ft. Lauderdale Fort Lauderdale Housing Authority 200 20 Elderly Pembroke Tower Apartments Pembroke Pines Southport Financial Services, Inc 100 90 Elderly Pembroke Tower Apartments Pembroke Pines Southport Financial Services, Inc 100 10 Elderly Residences at Crystal Lake Pompano Beach Crystal Lakes Housing Partners, LP 92 87 Family Residences at Crystal Lake Pompano Beach Crystal Lakes Housing Partners, LP 92 8 Family Rock Island Ft. Lauderdale Fort Lauderdale Housing Authority 116 104 Family Rock Island Ft. Lauderdale Fort Lauderdale Housing Authority 116 12 Family Seven on Seventh Ft. Lauderdale Green Mills Group, LLC 72 61 Homeless|Special Needs Seven on Seventh Ft. Lauderdale Green Mills Group, LLC 72 11 Homeless|Special Needs Southwest Hammocks Pembroke Pines Carrfour Supportive Housing Inc 100 85 Special Needs Southwest Hammocks Pembroke Pines Carrfour Supportive Housing Inc 100 15 Special Needs St Croix Lauderdale Lakes Peak Capital Partners LLC 246 196 Family Water's Edge Apartments Sunrise Cornerstone Group Development LLC 128 115 Family Water's Edge Apartments Sunrise Cornerstone Group Development LLC 128 13 Family Charlotte Hampton Point Apts. Port Charlotte Lincoln Avenue Capital LLC 284 15 Family Hampton Point Apts. Port Charlotte Lincoln Avenue Capital LLC 284 35 Family Jacaranda Place Port Charlotte Blue Sky Communities LLC 88 88 Homeless|Special Needs Citrus Marina Del Ray Beverly Hills Creative Choice Homes, Inc. 100 100 Elderly Clay Briarwood Middleburg Dimension One Associates, Inc. 102 102 Family Nathan Ridge Middleburg Nathan Ridge, Ltd. 192 192 Family Collier Allegro at Hacienda Lakes Naples Collier County Community Land Trust Inc. 160 144 Elderly Allegro at Hacienda Lakes Naples Collier County Community Land Trust Inc. 160 16 Elderly Cadenza at Hacienda Lakes Naples Collier County Community Land Trust Inc. 160 144 Elderly Cadenza at Hacienda Lakes Naples Collier County Community Land Trust Inc. 160 16 Elderly Casa Amigos Immokalee Everglades Housing Group Inc. 24 24 FW | FW Eden Gardens II Immokalee Eden Gardens II, LLC 37 26 FW | FW Esperanza Place Immokalee Florida Nonprofit Services, Inc. 48 48 FW | FW Noahs Landing Naples Starwood Capital Group 264 66 Family Noahs Landing Naples Starwood Capital Group 264 16 Family Summer Lakes Naples Richman Group 140 140 Family Summer Lakes II Naples Richman Group 276 276 Family
83 2022 Annual Report
RENTAL PORTFOLIO ORIGINAL LOAN AMOUNT MATURITY DATE INTEREST RATE LOAN BALANCE AS OF 12/31/2022 INTEREST PAID IN 2022 AFFORDABILITY PERIOD LOAN STATUS 2 FUNDING TYPE3 $4,228,900 5/26/2037 0.48% $4,205,900 $13,571 50 Current SAIL $240,600 5/26/2037 0.00% $240,600 $0 15 Current ELI $2,000,000 11/30/2029 9.00% $0 $72,493 50 Current SAIL $3,040,000 4/30/2053 1.00% $3,040,000 $27,638 50 Current SAIL $600,000 4/30/2053 0.00% $600,000 $0 50 Current ELI $2,000,000 4/1/2044 3.00% $1,668,160 $0 50 Current SAIL $4,960,000 8/8/2033 1.00% $4,960,000 $0 30 Current SAIL $1,500,000 8/8/2033 0.00% $1,500,000 $0 15 Current ELI $3,200,000 10/1/2054 1.00% $3,200,000 $0 50 Current SAIL $600,000 10/1/2054 0.00% $600,000 $0 15 Current ELI $5,000,000 11/7/2036 1.00% $5,000,000 $95,245 50 Current SAIL $457,600 11/7/2036 0.00% $457,600 $0 15 Current ELI $6,500,000 6/1/2052 1.00% $6,500,000 $0 50 Current SAIL $600,000 6/1/2052 0.00% $600,000 $0 15 Current ELI $5,040,000 6/25/2051 0.50% $2,349,108 $0 50 Current SAIL $370,800 6/25/2051 0.00% $224,595 $0 15 Current ELI $7,702,400 10/4/2040 0.50% $0 $0 50 Current SAIL $597,600 10/4/2040 0.00% $0 $0 15 Current ELI $2,000,000 4/1/2049 3.00% $1,600,451 $63,985 56 Current SAIL $3,000,000 6/13/2037 1.00% $3,000,000 $0 50 Current SAIL $600,000 6/13/2037 0.00% $600,000 $0 15 Current ELI $1,125,000 5/1/2049 0.00% $299,588 $0 15 Current ELI $2,500,000 5/1/2049 0.00% $999,250 $0 15 Current ELI $4,000,000 7/20/2038 0.50% $2,912,496 $0 50 Current SAIL $1,100,000 6/11/2024 3.00% $1,100,000 $0 50 Past Due SAIL $3,100,000 4/30/2042 3.00% $3,100,000 $0 50 Current SAIL $5,675,000 10/12/2042 1.00% $1,547,596 $0 50 Current SAIL $6,000,000 8/1/2040 1.00% $3,009,435 $0 50 Current SAIL $600,000 8/1/2040 0.00% $300,892 $0 15 Current ELI $10,300,000 8/30/2040 1.00% $634,859 $0 50 Current SAIL $600,000 8/30/2040 0.00% $32,058 $0 15 Current ELI $5,150,000 5/26/2038 0.60% $2,759,831 $0 50 Current SAIL $3,500,000 1/1/2040 1.00% $3,500,000 $33,720 50 Current SAIL $3,187,764 2/11/2043 0.00% $3,187,764 $0 50 Current SAIL $4,950,000 4/25/2027 0.00% $1,648,350 $0 15 Current ELI $2,490,000 12/11/2027 0.00% $829,170 $0 15 Current ELI $1,500,000 2/15/2036 3.00% $1,500,000 $23,600 50 Current SAIL $3,000,000 7/15/2038 3.00% $0 $1,313,573 50 Current SAIL
RENTAL PORTFOLIO
STATE APARTMENT INCENTIVE LOAN PROGRAM LOANS OUTSTANDING AS OF DECEMBER 31, 2022
84 Florida Housing Finance Corporation RENTAL PORTFOLIO COUNTY DEVELOPMENT NAME CITY OWNER TOTAL UNITS SETASIDE UNITS DEMOGRAPHIC POPULATION SERVED 1 Collier Timber Ridge at Sanders Pines Immokalee Everglades Housing Group Inc. 34 27 FW | FW Timber Ridge at Sanders Pines Immokalee Everglades Housing Group Inc. 34 34 FW | FW Tuscan Isle Naples Starwood Capital Group 298 53 Family Columbia Cedar Park Lake City Southport Financial Services, Inc 72 50 Family Cedar Park Lake City Southport Financial Services, Inc 72 22 Family Lake City Cabins for Veterans Lake City Volunteers of America of Florida Inc. 32 32 Homeless Thornwood Terrace Lake City Hallmark Companies, Inc. 29 29 Elderly DeSoto McPines Arcadia Hallmark Companies, Inc. 64 64 Family Duval Arc Village Jacksonville Arc of Jacksonville Inc. 122 91 Special Needs Arc Village Jacksonville Arc of Jacksonville Inc. 122 31 Special Needs Ashley Square Jacksonville Blue Sky Communities LLC 120 108 Elderly Ashley Square Jacksonville Blue Sky Communities LLC 120 12 Elderly Campus Towers Apartments Jacksonville Campus Towers Apartments, LLLP 192 188 Elderly Caroline Oaks Jacksonville Vestcor Development Corporation, Inc. 82 73 Elderly Caroline Oaks Jacksonville Vestcor Development Corporation, Inc. 82 9 Elderly Cathedral Terrace Jacksonville Cathedral Foundation of Jacksonville, Inc. 240 228 Elderly Cathedral Terrace Jacksonville Cathedral Foundation of Jacksonville, Inc. 240 12 Elderly Christine Cove Jacksonville Urban Core Enterprises Inc. 96 96 Elderly Edge at Town Center Jacksonville Blackstone Inc. 248 25 Family Edge at Town Center Jacksonville Blackstone Inc. 248 12 Family Hampton Villa Jacksonville Southport Financial Services, Inc 60 54 Family Hampton Villa Jacksonville Southport Financial Services, Inc 60 6 Family Hilltop Village Jacksonville Southport Financial Services, Inc 200 200 Family Leigh Meadows Jacksonville Starwood Capital Group 304 44 Family Liberty Center Jacksonville Harris Group, Inc. 100 100 Homeless Liberty Center II Jacksonville Harris Group, Inc. 134 134 Homeless Liberty Center IV Jacksonville Liberty Center IV, Ltd. 100 100 Homeless Lindsey Terrace Jacksonville Starwood Capital Group 336 317 Family Mount Carmel Gardens Jacksonville East Lake Community Development, Inc. 207 175 Elderly Mount Carmel Gardens Jacksonville East Lake Community Development, Inc. 207 32 Elderly San Juan Village Jacksonville R&R Loving Hands, Inc. dba Genesis Horizon 22 17 Special Needs San Juan Village Jacksonville R&R Loving Hands, Inc. dba Genesis Horizon 22 5 Special Needs Savannah Springs Jacksonville Richman Group 234 234 Family Savannah Springs Jacksonville Richman Group 234 234 Family Stevens Duval Jacksonville Southport Financial Services, Inc 52 49 Elderly Stevens Duval Jacksonville Southport Financial Services, Inc 52 3 Elderly Sulzbacher Village Jacksonville Sulzbacher Center for Women and Children, Ltd. 97 70 Homeless Sundance Pointe Jacksonville Peak Capital Partners LLC 288 58 Family Sundance Pointe Jacksonville Peak Capital Partners LLC 288 28 Family Village at Hyde Park Jacksonville Ability Housing Inc. 80 80 Homeless|Special Needs
85 2022 Annual Report
RENTAL PORTFOLIO ORIGINAL LOAN AMOUNT MATURITY DATE INTEREST RATE LOAN BALANCE AS OF 12/31/2022 INTEREST PAID IN 2022 AFFORDABILITY PERIOD LOAN STATUS 2 FUNDING TYPE3 $526,648 10/25/2033 1.00% $526,648 $9,491 50 Current SAIL $2,215,000 10/25/2033 1.00% $2,215,000 $47,731 50 Current SAIL $3,975,000 11/6/2029 0.00% $1,853,940 $0 15 Current ELI $3,200,000 6/19/2034 1.00% $3,200,000 $0 50 Current SAIL $272,300 6/19/2034 0.00% $272,300 $0 15 Current ELI $1,600,000 10/29/2024 0.00% $1,600,000 $0 50 Current SAIL $455,000 12/1/2048 1.00% $404,176 $29,931 81 Current SAIL $1,000,000 6/1/2033 3.00% $1,000,000 $0 50 Current SAIL $1,230,000 4/28/2045 0.00% $1,230,000 $0 50 Current SAIL $1,790,000 4/28/2065 0.00% $1,790,000 $0 50 Current ELI $6,500,000 11/23/2042 1.00% $4,150,237 $0 50 Current SAIL $600,000 11/23/2042 0.00% $370,269 $0 15 Current ELI $750,000 7/1/2039 1.00% $750,000 $0 21 Current EHCL $1,200,000 4/22/2045 1.00% $1,200,000 $3,487 30 Current SAIL $600,000 4/22/2045 0.00% $600,000 $0 15 Current ELI $3,200,000 1/22/2033 1.00% $3,200,000 $32,000 50 Current SAIL $734,400 1/22/2033 0.00% $734,400 $0 15 Current ELI $4,000,000 9/15/2038 3.00% $4,000,000 $0 50 Current SAIL $1,875,000 3/1/2048 0.00% $499,313 $0 15 Current ELI $900,000 3/1/2048 0.00% $299,700 $0 15 Current ELI $2,000,000 4/1/2033 1.00% $2,000,000 $0 50 Current SAIL $340,800 4/1/2033 0.00% $340,800 $0 15 Current ELI $1,503,237 7/1/2042 3.00% $1,503,237 $0 65 Current SAIL $3,300,000 3/28/2026 0.00% $878,790 $0 15 Current ELI $1,800,000 5/31/2037 0.00% $860,000 $0 75 Current SAIL $1,429,329 7/1/2038 0.00% $764,451 $0 65 Current SAIL $2,000,000 6/4/2034 1.00% $2,000,000 $20,000 50 Current SAIL $2,500,000 1/1/2034 3.00% $923,000 $27,690 50 Current SAIL $4,010,087 1/1/2058 0.80% $4,010,087 $32,081 50 Current SAIL $1,968,900 1/1/2058 0.00% $1,968,900 $0 50 Current ELI $4,397,490 8/29/2035 0.00% $4,397,490 $0 30 Current SAIL $312,500 8/29/2035 0.00% $311,965 $0 15 Current ELI $4,000,000 12/15/2044 3.00% $4,000,000 $0 50 Current SAIL $1,000,000 12/15/2044 1.00% $1,000,000 $0 15 Current SAIL $1,800,000 3/15/2032 1.00% $1,800,000 $10,812 50 Current SAIL $183,600 3/15/2032 0.00% $183,600 $0 15 Current ELI $3,500,000 5/5/2057 0.00% $3,500,000 $0 50 Current SAIL $4,200,000 3/28/2026 0.00% $1,118,460 $0 15 Current ELI $2,100,000 6/19/2028 0.00% $839,370 $0 15 Current ELI $2,865,000 11/20/2048 1.00% $460,000 $9,790 50 Current SAIL
RENTAL PORTFOLIO
STATE APARTMENT INCENTIVE LOAN PROGRAM LOANS OUTSTANDING
86 Florida Housing Finance Corporation RENTAL PORTFOLIO COUNTY DEVELOPMENT NAME CITY OWNER TOTAL UNITS SETASIDE UNITS DEMOGRAPHIC POPULATION SERVED 1 Duval Village on Wiley Jacksonville Ability Housing Inc. 43 43 Homeless Waves Jacksonville Beach Jacksonville Housing Authority 127 114 Family Waves Jacksonville Beach Jacksonville Housing Authority 127 13 Family Escambia Alabaster Gardens Pensacola Circle, Inc. 147 147 Elderly Belmont Duplexes Pensacola AMR at Pensacola, Inc. 26 8 Family Pensacola Veteran Housing Pensacola Volunteers of America of Florida Inc. 31 31 Homeless Vista 17 at Cervantes Pensacola Southport Financial Services, Inc 72 64 Family Vista 17 at Cervantes Pensacola Southport Financial Services, Inc 72 8 Family Flagler Palms at Town Center Palm Coast HTG Palms, LLC 88 88 Family Gadsden Arbours at Quincy Quincy Arbour Valley Communities 80 72 Family Arbours at Quincy Quincy Arbour Valley Communities 80 8 Family Lanier Oaks Gretna North Florida Educational Development Corporation 22 22 Family Omega Villas Quincy CEDO Housing Development Corp. (CEDO-HDC) 56 56 Family Hardee Hannah House Wauchula Alpha and Omega Freedom Ministries Inc. 17 17 Homeless Hendry Pollywog Creek Commons I Labelle Everglades Housing Group Inc. 40 40 FW | FW Pollywog Creek Commons II Labelle Everglades Housing Group Inc. 24 24 FW | FW Tall Pines Labelle National Development Foundation, Inc. 39 39 FW | FW Hernando Brook Haven Brooksville Richman Group 160 160 Family Freedom Gardens II Brooksville Housing Trust Group LLC 94 84 Family Freedom Gardens II Brooksville Housing Trust Group LLC 94 10 Family Madison Reserve Spring Hill American Realty Development LLC 90 90 Elderly Mariners Cay Spring Hill Richman Group 160 144 Family Mariners Cay Spring Hill Richman Group 160 16 Family Spring Haven Spring Hill Richman Group 176 176 Family Spring Haven II Spring Hill Richman Group 88 88 Family Highlands Highland Palms Avon Park Southport Financial Services, Inc 52 41 FW | FW Highland Palms Avon Park Southport Financial Services, Inc 52 11 FW | FW Lakeside Park I Avon Park Avon Park Housing Authority 16 16 Homeless Hillsborough Arbor Place Tampa Volunteers of America of Florida Inc. 32 32 Special Needs Autumn Place Tampa Richman Group 120 108 Family Autumn Place Tampa Richman Group 120 12 Family Boulevard Tower 2 Tampa Tampa Housing Authority 119 119 Family Brandywine Tampa Richman Group 144 144 Family Bristol Bay Tampa Bristol Bay Associates, Ltd. 300 15 Family Claymore Crossings Tampa Richman Group 260 260 Family Clipper Bay Tampa Cornerstone Group Development LLC 276 14 Family Columbus Court Tampa Southport Financial Services, Inc 160 144 Family Columbus Court Tampa Southport Financial Services, Inc 160 16 Family Fairview Cove I Tampa Charles E. Lakin Foundation, Inc. 88 56 Family Fairview Cove I Tampa Charles E. Lakin Foundation, Inc. 88 6 Family
OF
AS
DECEMBER 31, 2022
87 2022 Annual Report
RENTAL PORTFOLIO ORIGINAL LOAN AMOUNT MATURITY DATE INTEREST RATE LOAN BALANCE AS OF 12/31/2022 INTEREST PAID IN 2022 AFFORDABILITY PERIOD LOAN STATUS 2 FUNDING TYPE3 $975,000 12/18/2034 0.00% $553,074 $0 20 Current ELI $7,000,000 9/26/2061 1.00% $6,620,000 $0 50 Current SAIL $600,000 9/26/2061 0.00% $600,000 $0 15 Current ELI $4,000,000 11/15/2038 3.00% $4,000,000 $0 50 Current SAIL $328,500 11/10/2036 1.00% $235,436 $2,515 70 Current SAIL $850,000 12/30/2030 0.00% $850,000 $0 50 Current SAIL $4,180,000 6/1/2051 1.00% $4,180,000 $0 50 Current SAIL $400,000 6/1/2051 0.00% $400,000 $0 15 Current ELI $8,500,000 3/27/2049 1.00% $8,500,000 $0 50 Current SAIL $7,023,957 12/1/2064 1.00% $0 $0 50 Current SAIL $600,000 12/1/2064 0.00% $0 $0 15 Current ELI $1,430,000 12/15/2015 9.00% $1,430,000 $0 50 Matured SAIL $2,490,000 12/31/2023 9.00% $2,490,000 $0 50 Current SAIL $1,577,186 4/28/2026 0.00% $1,577,186 $0 50 Past Due SAIL $3,855,304 1/1/2042 1.00% $3,855,304 $0 50 Current SAIL $1,140,282 1/1/2042 0.00% $1,140,282 $0 50 Current SAIL $2,535,000 10/31/2033 3.00% $2,535,000 $0 50 Current SAIL $2,900,000 7/21/2039 3.00% $2,900,000 $0 50 Current SAIL $5,500,000 5/22/2051 1.00% $5,500,000 $42,087 50 Current SAIL $493,400 5/22/2051 0.00% $493,400 $0 15 Current ELI $2,603,198 7/1/2028 1.00% $2,603,198 $26,032 50 Current SAIL $4,700,000 12/15/2041 1.00% $4,700,000 $10,512 50 Current SAIL $1,360,000 11/14/2023 0.00% $1,360,000 $0 15 Current SAIL $1,500,000 3/21/2037 3.00% $1,500,000 $26,281 50 Current SAIL $2,750,000 6/15/2039 3.00% $2,750,000 $8,700 50 Current SAIL $2,640,000 6/11/2026 1.00% $2,640,000 $79,265 50 Current SAIL $425,000 6/11/2026 0.00% $425,000 $0 15 Current SAIL $760,000 8/29/2026 0.00% $342,000 $0 50 Current SAIL $185,000 6/1/2044 1.00% $137,126 $1,402 68 Current SAIL $5,000,000 7/15/2041 1.00% $5,000,000 $59,173 50 Current SAIL $1,020,000 7/31/2023 0.00% $1,020,000 $0 15 Current SAIL $4,720,000 8/1/2039 1.00% $4,720,000 $0 50 Current SAIL $4,000,000 6/15/2039 3.00% $4,000,000 $0 50 Current SAIL $1,125,000 4/1/2050 0.00% $524,700 $0 15 Current ELI $4,000,000 11/15/2038 3.00% $4,000,000 $389,065 50 Current SAIL $1,050,000 3/1/2050 0.00% $489,720 $0 15 Current ELI $3,175,000 12/29/2032 1.00% $3,175,000 $0 50 Current SAIL $789,900 12/29/2032 0.00% $789,900 $0 15 Current ELI $5,000,000 6/1/2043 1.00% $0 $88,356 50 Current SAIL $510,000 12/18/2023 0.00% $0 $0 15 Current SAIL
RENTAL PORTFOLIO
88 Florida Housing Finance Corporation RENTAL PORTFOLIO COUNTY DEVELOPMENT NAME CITY OWNER TOTAL UNITS SETASIDE UNITS DEMOGRAPHIC POPULATION SERVED 1 Hillsborough Graham at Gracepoint Tampa The Graham at Gracepoint, LLC 90 90 Homeless Grande Oaks Tampa Richman Group 168 168 Family Grande Oaks Tampa Richman Group 168 168 Family Grove Pointe Ruskin Cornerstone Group Development LLC 80 80 FW | FW Grove Pointe Ruskin Cornerstone Group Development LLC 80 80 FW | FW Haley Park Tampa Wendover Housing Partners, LLC 80 72 Elderly Haley Park Tampa Wendover Housing Partners, LLC 80 8 Elderly Heights at Gracepoint Tampa DDA Development Company, Inc 64 54 Homeless|Special Needs Heights at Gracepoint Tampa DDA Development Company, Inc 64 10 Homeless|Special Needs Hunt Club Tampa Richman Group 96 96 Family Hunters Run I Tampa CED Companies 216 216 Family Hunters Run II Tampa CED Companies 192 191 Family La Estancia Wimauma Titan Land Company 84 84 FW | FW La Estancia Wimauma Titan Land Company 84 84 FW | FW La Vista Oaks Tampa Southport Financial Services, Inc 126 113 Family La Vista Oaks Tampa Southport Financial Services, Inc 126 13 Family Lake Kathy Brandon Richman Group 360 360 Family Lakewood Shores Brandon CED Companies 184 184 Family Landon Preserve Brandon Vestcor Development Corporation, Inc. 230 230 Family Manatee Village IV Ruskin Little Manatee Housing Corporation 27 6 FW | FW Mango Terrace Seffner Southport Financial Services, Inc 104 82 Family Mango Terrace Seffner Southport Financial Services, Inc 104 11 Family Mariners Cove - Tampa Tampa Mariner's Associates, Ltd. 208 33 Family Mariners Cove - Tampa Tampa Mariner's Associates, Ltd. 208 12 Family Meridian Pointe Tampa Richman Group 360 360 Family Morgan Creek Tampa Richman Group 336 336 Family Renaissance at West River Tampa Tampa Housing Authority 160 144 Elderly Renaissance at West River Tampa Tampa Housing Authority 160 16 Elderly SabalPlace Brandon Blue Broadway 2, LLC 112 95 Homeless|Special Needs SabalPlace Brandon Blue Broadway 2, LLC 112 17 Homeless|Special Needs Spanish Trace Tampa Richman Group 120 120 Family Wexford Tampa Starwood Capital Group 324 324 Family Woodbridge Plant City Starwood Capital Group 236 24 Family Indian River Heritage Villas Vero Beach Dimension One Associates, Inc. 116 116 Family Orange Blossom Village Vero Beach ReBuild America, Inc. 80 12 Elderly Orange Blossom Village Vero Beach ReBuild America, Inc. 80 68 Elderly Preserve at Oslo Vero Beach NB Holdings Management LLC 176 9 Family Sunset Vero Beach Flynn Development Corporation 36 25 Elderly
STATE APARTMENT INCENTIVE LOAN PROGRAM LOANS OUTSTANDING AS OF DECEMBER 31, 2022
89 2022 Annual Report
RENTAL PORTFOLIO ORIGINAL LOAN AMOUNT MATURITY DATE INTEREST RATE LOAN BALANCE AS OF 12/31/2022 INTEREST PAID IN 2022 AFFORDABILITY PERIOD LOAN STATUS 2 FUNDING TYPE3 $4,500,000 1/26/2033 0.50% $4,500,000 $22,500 50 Current SAIL $2,000,000 6/15/2037 3.00% $2,000,000 $0 50 Current SAIL $1,000,000 6/15/2037 3.00% $1,000,000 $0 50 Current SAIL $1,438,936 6/29/2033 1.00% $0 $43,957 34 Current SAIL $2,250,000 6/29/2033 1.00% $0 $65,701 34 Current SAIL $2,300,000 5/13/2045 1.00% $2,300,000 $23,000 30 Current SAIL $600,000 5/13/2045 0.00% $600,000 $0 15 Current ELI $3,243,000 6/27/2037 0.30% $3,243,000 $9,554 50 Current SAIL $135,000 6/27/2037 0.00% $135,000 $0 15 Current ELI $5,000,000 8/15/2041 1.00% $5,000,000 $179 50 Current SAIL $2,000,000 12/15/2035 3.00% $0 $59,836 50 Current SAIL $2,000,000 6/20/2036 3.00% $0 $59,836 50 Current SAIL $1,092,207 2/1/2039 0.00% $1,092,207 $0 30 Current SAIL $4,200,000 2/25/2039 0.00% $1,475,354 $0 30 Current SAIL $5,000,000 5/8/2038 1.00% $5,000,000 $0 50 Current SAIL $1,105,000 5/8/2023 0.00% $1,105,000 $0 15 Current SAIL $4,000,000 12/15/2039 3.00% $4,000,000 $0 50 Current SAIL $1,900,000 6/1/2027 1.00% $0 $6,586 61 Current SAIL $6,500,000 2/1/2063 1.00% $6,500,000 $0 50 Current SAIL $1,250,000 11/30/2042 1.00% $1,250,000 $2,222 50 Current SAIL $5,000,000 1/1/2039 1.00% $4,474,588 $0 50 Current SAIL $600,000 1/1/2039 0.00% $224,570 $0 15 Current ELI $900,000 5/1/2049 0.00% $359,730 $0 15 Current ELI $2,475,000 5/1/2049 0.00% $989,258 $0 15 Current ELI $4,000,000 8/15/2037 3.00% $0 $1,459,610 50 Current SAIL $2,000,000 6/15/2036 3.00% $2,000,000 $106,018 50 Current SAIL $7,000,000 11/8/2048 1.00% $7,000,000 $0 50 Current SAIL $600,000 11/8/2048 0.00% $600,000 $0 15 Current ELI $4,214,500 9/11/2036 0.30% $4,214,500 $10,973 50 Current SAIL $285,500 9/11/2036 0.00% $285,500 $0 15 Current ELI $4,000,000 1/15/2041 3.00% $4,000,000 $120,927 50 Current SAIL $2,000,000 8/1/2035 3.00% $1,533,945 $0 50 Current SAIL $1,800,000 1/1/2047 0.00% $479,340 $0 15 Current ELI $4,000,000 10/30/2037 3.00% $4,000,000 $0 50 Current SAIL $4,500,000 8/30/2039 1.00% $2,503,574 $0 50 Current SAIL $463,200 8/30/2039 0.00% $0 $0 50 Current ELI $675,000 2/1/2057 0.00% $179,753 $0 15 Current ELI $315,000 4/9/2033 1.00% $154,959 $1,663 60 Current SAIL
RENTAL PORTFOLIO
STATE
APARTMENT
INCENTIVE LOAN
PROGRAM LOANS OUTSTANDING AS OF DECEMBER 31, 2022
90 Florida Housing Finance Corporation RENTAL PORTFOLIO COUNTY DEVELOPMENT NAME CITY OWNER TOTAL UNITS SETASIDE UNITS DEMOGRAPHIC POPULATION SERVED 1 Jackson Holly Hill Marianna Sanchez Planning Development Inc. 53 53 Family Three Rivers Marianna Marianna Gardens Preservation LP 100 90 Family Three Rivers Marianna Marianna Gardens Preservation LP 100 10 Family Lake Cove at Lady Lake Lady Lake CED Companies 176 176 Family Cove at Lady Lake Lady Lake CED Companies 176 176 Family Lake Harris Cove Leesburg CED Companies 152 107 Family Lakeside Pointe Leesburg CED Companies 128 128 Family Lakeside Pointe Leesburg CED Companies 128 128 Family Laurel Oaks Leesburg Richman Group 144 144 Family Osprey Ridge Clermont Starwood Capital Group 176 174 Family Rolling Acres I Lady Lake Atlantic Housing Partners, LLLP 104 73 Family Rolling Acres II Lady Lake Atlantic Housing Partners, LLLP 35 21 Elderly Rolling Acres II Lady Lake Atlantic Housing Partners, LLLP 35 4 Elderly Southwinds Cove Leesburg Atlantic Housing Partners, LLLP 112 73 Family Southwinds Cove Leesburg Atlantic Housing Partners, LLLP 112 6 Family Spring Harbor Apartments Mount Dora Starwood Capital Group 248 13 Family Spring Harbor Apartments Mount Dora Starwood Capital Group 248 25 Family Spring Lake Cove I Fruitland Park Atlantic Housing Partners, LLLP 96 68 Family Valencia Grove Eustis Housing Trust Group LLC 144 136 Family Valencia Grove Eustis Housing Trust Group LLC 144 8 Family Valencia Grove II Eustis Housing Trust Group LLC 110 99 Elderly Valencia Grove II Eustis Housing Trust Group LLC 110 11 Elderly Woodwinds Clermont Blue Sky Communities LLC 96 96 Homeless Lee Bernwood Trace Ft. Myers Blackstone Inc. 340 51 Family Brisas del Sur Ft. Myers Banyan Realty Advisors LLC 96 84 Family Brisas del Sur Ft. Myers Banyan Realty Advisors LLC 96 12 Family Brookside Village Ft. Myers Southport Financial Services, Inc 50 35 Family Brookside Village Ft. Myers Southport Financial Services, Inc 50 15 Family Cypress Village Ft. Myers Blue Sky Communities LLC 95 80 Homeless|Special Needs Cypress Village Ft. Myers Blue Sky Communities LLC 95 15 Homeless|Special Needs Heron Pond Lehigh Acres Affordable Housing Institute, Inc. 156 156 Elderly Mariners Landing Ft. Myers Creative Choice Homes, Inc. 112 112 Elderly Palm City Gardens Ft. Myers Dunbar Improvement Association, Inc. 100 100 Elderly Palm City Gardens Ft. Myers Dunbar Improvement Association, Inc. 100 100 Elderly Pueblo Bonito Bonita Springs Partnership in Housing, Inc 80 80 FW | FW Renaissance Preserve Senior Ft. Myers Housing Authority City of Fort Myers 120 108 Elderly Renaissance Preserve Senior Ft. Myers Housing Authority City of Fort Myers 120 12 Elderly St. Peter Claver Place Phase I Ft. Myers National Development of America, Inc. 136 122 Family St. Peter Claver Place Phase I Ft. Myers National Development of America, Inc. 136 14 Family Vista Palms Lehigh Acres Creative Choice Homes, Inc. 229 229 Family
91 2022 Annual Report
RENTAL PORTFOLIO ORIGINAL LOAN AMOUNT MATURITY DATE INTEREST RATE LOAN BALANCE AS OF 12/31/2022 INTEREST PAID IN 2022 AFFORDABILITY PERIOD LOAN STATUS 2 FUNDING TYPE3 $1,087,000 5/31/2033 9.00% $1,087,000 $38,443 50 Current SAIL $350,000 3/6/2045 1.00% $350,000 $0 30 Current SAIL $750,000 3/6/2045 0.00% $750,000 $0 15 Current ELI $1,500,000 8/15/2038 3.00% $0 $44,877 50 Current SAIL $1,500,000 8/15/2038 3.00% $0 $44,877 50 Current SAIL $4,000,000 10/1/2038 3.00% $0 $0 50 Current SAIL $1,500,000 8/15/2038 0.00% $0 $0 50 Current SAIL $1,500,000 8/15/2038 0.00% $0 $0 50 Current SAIL $5,000,000 8/15/2042 1.00% $5,000,000 $50,000 50 Current SAIL $1,808,000 6/30/2032 3.00% $0 $0 50 Current SAIL $5,000,000 11/1/2042 1.00% $5,000,000 $69,253 50 Current SAIL $2,289,000 11/1/2042 1.00% $2,289,000 $22,890 35 Current SAIL $340,000 12/1/2023 0.00% $340,000 $0 15 Current SAIL $5,000,000 12/1/2042 1.00% $5,000,000 $50,000 50 Current SAIL $510,000 12/1/2023 0.00% $510,000 $0 15 Current SAIL $975,000 5/1/2028 0.00% $975,000 $0 15 Current ELI $1,875,000 5/1/2028 0.00% $624,375 $0 15 Current ELI $5,000,000 12/15/2042 1.00% $5,000,000 $50,000 50 Current SAIL $5,000,000 11/20/2032 1.00% $5,000,000 $50,000 50 Current SAIL $383,600 11/20/2032 0.00% $383,600 $0 15 Current ELI $5,750,000 6/1/2038 1.00% $5,750,000 $0 50 Current SAIL $600,000 6/1/2038 0.00% $600,000 $0 15 Current ELI $4,000,000 12/27/2033 1.00% $4,000,000 $40,000 50 Current SAIL $4,875,000 2/1/2048 0.00% $1,298,213 $0 15 Current ELI $5,125,000 10/23/2037 1.00% $5,125,000 $0 50 Current SAIL $510,800 10/23/2037 0.00% $510,800 $0 15 Current ELI $1,989,000 1/25/2032 1.00% $1,989,000 $0 50 Current SAIL $145,300 1/25/2032 0.00% $145,300 $0 15 Current ELI $5,000,000 2/12/2037 0.50% $4,999,915 $0 50 Current SAIL $286,000 2/12/2037 0.00% $285,986 $0 15 Current ELI $1,500,000 12/1/2043 3.00% $0 $79,790 50 Current SAIL $860,000 11/12/2024 3.00% $817,225 $0 50 Current SAIL $750,000 4/29/2041 1.00% $750,000 $0 22.5 Current EHCL $750,000 4/29/2041 1.00% $750,000 $0 22.5 Current EHCL $4,000,000 10/19/2037 0.00% $3,249,000 $0 30 Current SAIL $6,150,000 4/10/2058 1.00% $6,150,000 $61,500 50 Current SAIL $1,020,000 4/10/2023 0.00% $1,020,000 $0 15 Current SAIL $7,862,649 4/6/2043 1.00% $1,193,948 $0 50 Current SAIL $600,000 4/6/2043 0.00% $91,198 $0 15 Current ELI $2,000,000 12/18/2018 9.00% $2,000,000 $148,831 50 Matured SAIL
RENTAL PORTFOLIO
92 Florida Housing Finance Corporation RENTAL PORTFOLIO COUNTY DEVELOPMENT NAME CITY OWNER TOTAL UNITS SETASIDE UNITS DEMOGRAPHIC POPULATION SERVED 1 Lee Vista Palms Lehigh Acres Creative Choice Homes, Inc. 229 46 Family Westwood Ft. Myers Starwood Capital Group 288 72 Family Leon Brookestone Senior Residences Tallahassee Southport Financial Services, Inc 108 97 Elderly Brookestone Senior Residences Tallahassee Southport Financial Services, Inc 108 11 Elderly Casanas Village at Frenchtown Square Tallahassee Frenchtown Square Partners, LLC 88 80 Family Jackson Forest Tallahassee Southport Financial Services, Inc 105 94 Family Jackson Forest Tallahassee Southport Financial Services, Inc 105 11 Family Magnolia Family Tallahassee New Affordable Housing Partners, LLC 130 117 Family Magnolia Family Tallahassee New Affordable Housing Partners, LLC 130 13 Family Sunrise Place Tallahassee Southport Financial Services, Inc 99 99 Family Madison Springhill Apartments Madison AMCS Development, LLC 76 68 Family Springhill Apartments Madison AMCS Development, LLC 76 8 Family Manatee Addison Bradenton Housing Trust Group LLC 90 90 Family Parrish Oaks Parrish SP Oaks LLC 120 108 Family Parrish Oaks Parrish SP Oaks LLC 120 12 Family Parrish Oaks II Parrish Southport Financial Services, Inc 48 43 Family Parrish Oaks II Parrish Southport Financial Services, Inc 48 5 Family Marion Berkeley Pointe Ocala Southport Financial Services, Inc 160 112 Family Berkeley Pointe Ocala Southport Financial Services, Inc 160 48 Family Hickory Knoll Ocala Southport Financial Services, Inc 96 84 Family Hickory Knoll Ocala Southport Financial Services, Inc 96 10 Family Magnolia Walk Phase II Ocala Ocala Leased Housing Corporation, Inc. 144 144 Elderly Ritz Reserve II Ocala Volunteers of America of Florida Inc. 27 21 Special Needs Ritz Reserve II Ocala Volunteers of America of Florida Inc. 27 6 Special Needs Martin Crossings at Indian Run Stuart Southport Financial Services, Inc 344 344 Family Crossings at Indian Run Stuart Southport Financial Services, Inc 344 344 Family Miami-Dade Allen Apartments Miami Beach Miami Beach Community Development Corporation 39 39 Elderly Ambar Key Florida City Vestcor Development Corporation, Inc. 94 94 Family Ambar Key Homes Florida City Vestcor Development Corporation, Inc. 155 155 Family Ambar Trail Homestead Vestcor Development Corporation, Inc. 210 210 Family Aswan Village Opa Locka Opa Locka Community Development Corp 216 216 Family Biscayne Court Miami Royal American Development Inc. 60 6 Elderly Brisas del Este II Miami Related Group of Florida 120 120 Family Brisas Del Rio Miami Related Group of Florida 168 151 Elderly Brisas Del Rio Miami Related Group of Florida 168 17 Elderly Calusa Cove Miami Banyan Realty Advisors LLC 144 144 Family Caribbean Village Miami Pinnacle Housing Group LLC 123 116 Elderly Caribbean Village Miami Pinnacle Housing Group LLC 123 7 Elderly Casa OMICA Florida City Casa Juarez, LLC 32 27 FW | FW Casa OMICA Florida City Casa Juarez, LLC 32 5 FW | FW Coalition Lift Miami Coalition Lift, LLC 34 34 Homeless
31,
STATE APARTMENT INCENTIVE LOAN PROGRAM LOANS OUTSTANDING AS OF DECEMBER
2022
93 2022 Annual Report
RENTAL PORTFOLIO ORIGINAL LOAN AMOUNT MATURITY DATE INTEREST RATE LOAN BALANCE AS OF 12/31/2022 INTEREST PAID IN 2022 AFFORDABILITY PERIOD LOAN STATUS 2 FUNDING TYPE3 $3,450,000 10/26/2026 0.00% $918,735 $0 15 Current ELI $5,400,000 4/30/2027 0.00% $1,798,200 $0 15 Current ELI $3,050,000 10/14/2034 1.00% $3,050,000 $0 30 Current SAIL $750,000 10/14/2034 0.00% $750,000 $0 15 Current ELI $2,000,000 5/10/2034 1.00% $2,000,000 $20,000 50 Current SAIL $5,850,000 9/30/2040 1.00% $1,265,532 $0 50 Current SAIL $600,000 9/30/2040 0.00% $121,968 $0 15 Current ELI $5,611,577 10/1/2040 1.00% $372,326 $0 50 Current SAIL $600,000 10/1/2040 0.00% $40,459 $0 15 Current ELI $900,000 10/1/2029 3.00% $883,203 $0 50 Current SAIL $3,064,400 7/1/2061 1.00% $2,990,922 $0 50 Current SAIL $251,600 7/1/2061 0.00% $251,600 $0 15 Current ELI $2,000,000 11/16/2035 1.00% $2,000,000 $56,390 50 Current SAIL $6,000,000 11/1/2061 1.00% $5,996,548 $0 50 Current SAIL $600,000 11/1/2061 0.00% $599,278 $0 15 Current ELI $2,248,000 5/20/2041 1.00% $2,138,753 $0 50 Current SAIL $419,100 5/20/2041 0.00% $339,838 $0 15 Current ELI $4,398,240 11/20/2031 1.00% $4,398,240 $0 50 Current SAIL $233,600 11/20/2031 0.00% $233,600 $0 15 Current ELI $3,150,000 5/1/2033 1.00% $3,150,000 $31,500 50 Current SAIL $304,800 5/1/2033 0.00% $304,800 $0 15 Current ELI $1,000,000 7/28/2031 1.00% $1,406,692 $15,484 50 Current SAIL $3,649,554 5/14/2036 0.00% $3,649,554 $0 30 Current SAIL $177,400 5/14/2036 0.00% $167,320 $0 15 Current ELI $4,947,342 6/1/2031 3.00% $4,947,342 $47,374 55 Current SAIL $5,123,238 6/1/2031 0.00% $5,123,238 $0 55 Current SAIL $750,000 11/10/2039 1.00% $750,000 $0 15 Current EHCL $8,465,000 1/12/2036 1.00% $8,465,000 $0 50 Current SAIL $8,500,000 12/12/2060 1.00% $8,500,000 $0 50 Current SAIL $5,000,000 9/1/2063 1.00% $4,204,000 $0 50 Current SAIL $2,000,000 7/1/2036 3.00% $0 $105,863 50 Current SAIL $510,000 7/31/2024 0.00% $510,000 $0 15 Current SAIL $4,260,000 2/11/2039 1.00% $3,297,664 $0 50 Current SAIL $4,346,770 1/31/2039 1.00% $4,021,769 $0 50 Current SAIL $600,000 1/31/2039 0.00% $600,000 $0 15 Current ELI $1,449,387 1/31/2033 1.00% $1,079,202 $11,337 61 Current SAIL $5,000,000 7/27/2036 1.00% $5,000,000 $109,661 50 Current SAIL $362,400 7/27/2036 0.00% $362,400 $0 15 Current ELI $5,992,000 1/21/2035 1.00% $5,681,931 $0 30 Current SAIL $508,000 1/21/2035 0.00% $482,013 $0 15 Current ELI $825,000 5/25/2036 0.00% $618,750 $0 20 Current ELI
RENTAL PORTFOLIO
94 Florida Housing Finance Corporation RENTAL PORTFOLIO COUNTY DEVELOPMENT NAME CITY OWNER TOTAL UNITS SETASIDE UNITS DEMOGRAPHIC POPULATION SERVED 1 Miami-Dade Coquina Place Miami Cornerstone Group Development LLC 96 86 Family Coquina Place Miami Cornerstone Group Development LLC 96 10 Family Coral Bay Cove Miami Landmark Companies Inc. 224 201 Family Coral Bay Cove Miami Landmark Companies Inc. 224 23 Family Cutler Manor Miami Preservation of Affordable Housing Inc. 219 219 Family Cutler Vista Miami Related Companies of New York 216 55 Elderly Dr. Barbara Carey-Shuler Manor Miami Carrfour Supportive Housing Inc 100 100 Homeless Dr. Barbara Carey-Shuler Manor Miami Carrfour Supportive Housing Inc 100 20 Homeless Dr. Barbara Carey-Shuler Manor Miami Carrfour Supportive Housing Inc 100 100 Homeless Edison Place Miami Tacolcy Economic Development Corporation 200 200 Family Everett Stewart Senior Village Miami Lincoln Avenue Capital LLC 96 96 Family Garden Walk Cutler Bay Garden Walk Associates, Ltd. 228 228 Family Hainlin Mills Miami Hainlin Mills Preservation, LP 144 144 Elderly Hamlet at Walden Pond Miami Related Group of Florida 312 312 Elderly Harding Village Miami Beach Carrfour Supportive Housing Inc 92 92 Homeless Hidden Grove Homestead Related Companies of New York 222 222 Family Karis Village Miami Carrfour Supportive Housing Inc 88 88 Homeless Keys III Homestead Brannon Group, L.C. and Co. 48 48 Family Labre Place Miami Camillus House Inc. 90 90 Homeless Le Jeune Gardens Hialeah Spinal Cord Living-Assistance Development, Inc. 18 13 Special Needs Le Jeune Gardens Hialeah Spinal Cord Living-Assistance Development, Inc. 18 5 Special Needs Liberty Square III Miami Liberty Square Phase Three, LLC 192 192 Family Liberty Village Miami Carrfour Supportive Housing Inc 60 45 Homeless|Special Needs Liberty Village Miami Carrfour Supportive Housing Inc 60 15 Homeless|Special Needs Little Haiti Gateway Miami Carrfour Supportive Housing Inc 80 80 Family M & M Maison II Miami Urban League of Greater Miami Inc. 21 21 Family Northside Commons Miami Carrfour Supportive Housing Inc 80 60 Homeless|Special Needs Northside Commons Miami Carrfour Supportive Housing Inc 80 12 Homeless|Special Needs Northside Transit Village II Miami Atlantic Pacific Communities LLC 180 162 Elderly Northside Transit Village II Miami Atlantic Pacific Communities LLC 180 18 Elderly Orchid Estates Naranja RS Development Corporation 74 66 Family Orchid Estates Naranja RS Development Corporation 74 8 Family Pinnacle Park Miami Pinnacle Housing Group LLC 135 128 Family Redland Crossings Miami RS Development Corporation 134 134 Family Regatta Place Miami Cornerstone Group Development LLC 108 97 Family Regatta Place Miami Cornerstone Group Development LLC 108 11 Family Rio Towers Miami East Little Havana Community Dev. Corp. 82 82 Elderly
STATE APARTMENT INCENTIVE LOAN PROGRAM LOANS OUTSTANDING AS OF DECEMBER 31, 2022
95 2022 Annual Report
RENTAL PORTFOLIO ORIGINAL LOAN AMOUNT MATURITY DATE INTEREST RATE LOAN BALANCE AS OF 12/31/2022 INTEREST PAID IN 2022 AFFORDABILITY PERIOD LOAN STATUS 2 FUNDING TYPE3 $2,592,000 10/30/2045 1.00% $2,592,000 $25,920 30 Current SAIL $750,000 10/30/2045 0.00% $750,000 $0 15 Current ELI $6,500,000 9/21/2048 1.00% $6,500,000 $148,844 50 Current SAIL $600,000 9/21/2048 0.00% $600,000 $0 15 Current ELI $2,661,095 12/31/2026 1.00% $2,661,095 $0 50 Current SAIL $2,500,000 10/1/2042 3.00% $1,685,336 $55,950 52 Current SAIL $1,267,637 4/23/2025 1.00% $1,267,637 $12,676 50 Current SAIL $765,000 4/23/2025 0.00% $765,000 $0 15 Current SAIL $1,267,637 4/23/2025 0.00% $1,267,637 $0 50 Current SAIL $8,500,000 3/25/2038 1.00% $6,973,141 $0 50 Current SAIL $765,000 5/21/2025 0.00% $765,000 $0 15 Current SAIL $3,110,901 6/1/2051 3.00% $2,110,901 $0 74 Current SAIL $1,564,000 5/1/2042 3.00% $1,564,000 $46,920 46 Current SAIL $3,740,200 4/1/2030 3.00% $3,740,200 $112,206 68 Current SAIL $2,000,000 5/18/2023 1.00% $2,000,000 $20,000 50 Current SAIL $2,239,000 9/30/2042 3.00% $1,399,375 $59,531 50 Current SAIL $4,300,000 11/1/2046 0.50% $2,323,761 $11,619 50 Current SAIL $1,481,200 1/15/2037 9.00% $1,481,200 $4,659 69 Past Due SAIL $4,000,000 7/30/2025 0.44% $4,000,000 $17,600 50 Current SAIL $3,420,000 5/27/2035 0.00% $3,420,000 $0 30 Current SAIL $352,600 5/27/2035 0.00% $352,600 $0 15 Current ELI $6,450,000 11/29/2038 1.00% $6,358,468 $0 50 Current SAIL $1,100,000 9/29/2046 1.00% $1,100,000 $9,494 50 Current SAIL $225,000 9/29/2046 0.00% $225,000 $0 15 Current ELI $495,000 11/14/2028 3.00% $427,083 $3,320 61 Current SAIL $160,000 8/1/2025 1.00% $43,435 $670 50 Current SAIL $3,638,600 12/11/2036 0.30% $3,638,600 $12,298 50 Current SAIL $361,400 12/11/2036 0.00% $361,400 $0 15 Current ELI $7,000,000 6/19/2045 1.00% $7,000,000 $0 50 Current SAIL $600,000 6/19/2050 0.00% $600,000 $0 15 Current ELI $4,250,000 8/31/2033 1.00% $4,250,000 $0 50 Current SAIL $296,400 8/31/2033 0.00% $296,400 $0 15 Current ELI $1,040,000 8/31/2023 3.00% $1,040,000 $31,200 50 Current SAIL $7,488,000 6/5/2036 1.00% $7,488,000 $89,973 50 Current SAIL $3,000,000 2/23/2036 1.00% $3,000,000 $0 50 Current SAIL $600,000 2/23/2036 0.00% $600,000 $0 15 Current ELI $800,000 7/23/2037 1.00% $418,838 $4,705 66 Current SAIL
RENTAL PORTFOLIO
STATE
INCENTIVE
96 Florida Housing Finance Corporation RENTAL PORTFOLIO COUNTY DEVELOPMENT NAME CITY OWNER TOTAL UNITS SETASIDE UNITS DEMOGRAPHIC POPULATION SERVED 1 Miami-Dade Royalton Miami Carrfour Supportive Housing Inc 100 100 Homeless San Sherri Villas Homestead Richman Group 80 80 Family Smathers II Miami Related Group of Florida 133 119 Elderly Smathers II Miami Related Group of Florida 133 14 Elderly Solimar Florida City Cornerstone Group Development LLC 180 180 Family Southpoint Crossing Florida City Preservation of Affordable Housing Inc. 123 123 Family Stadium Towers Miami Stadium Tower Apartments LLC 149 126 Family Stadium Towers Miami Stadium Tower Apartments LLC 149 23 Family Sunrise Commons Homestead Landmark Companies Inc. 106 21 Family Sunset Pointe II Miami Sunset Pointe II Associates, Ltd. 96 81 Family Sunset Pointe II Miami Sunset Pointe II Associates, Ltd. 96 15 Family Superior Manor II Miami New Urban Development, LLC 76 68 Family Superior Manor II Miami New Urban Development, LLC 76 8 Family The Keys I & II Homestead Brannon Group, L.C. and Co. 80 80 Family Tuscany Cove I Miami Tacolcy Economic Development Corporation 160 144 Elderly Tuscany Cove I Miami Tacolcy Economic Development Corporation 160 16 Elderly Villa Aurora Miami Carrfour Supportive Housing Inc 76 76 Homeless Village Carver II Miami Biscayne Housing Group, LLC 100 10 Elderly Villages I Miami Cornerstone Group Development LLC 150 142 Family Villages I Miami Cornerstone Group Development LLC 150 8 Family Woodland Grove Miami RS Development Corporation 190 171 Family Woodland Grove Miami RS Development Corporation 190 19 Family Monroe Atlantic Pines Big Pine Key Banyan Realty Advisors LLC 14 14 FW | FW Boatworks Residences Marathon Banyan Realty Advisors LLC 52 52 Family Caya Place Marathon Tri-Star Affordable Development, LLC 42 42 Family Cayo Del Mar Key West Creative Choice Homes, Inc. 130 130 Family Coco Vista Marathon TVC Development, Inc. 109 109 Family Douglass Square Key West NB Holdings Management LLC 52 18 Family Marty's Place Key West AH of Monroe County Inc. 47 47 Family Poinciana Royale Key West AH of Monroe County Inc. 50 40 Family Poinciana Royale Key West AH of Monroe County Inc. 50 10 Family Quarry Big Coppitt Key Vestcor Development Corporation, Inc. 96 96 Family Quarry II Big Coppitt Island Vestcor Development Corporation, Inc. 112 112 Family Quarry III Key West Vestcor Development Corporation, Inc. 57 57 Family Residences at Crystal Cove Marathon NuRock Development Partners, Inc. 46 46 Family Residences at Marathon Key Marathon NuRock Development Partners, Inc. 55 55 Family Sea Grape I Marathon Atlantic Pacific Communities LLC 56 56 Family Sea Grape II Marathon Atlantic Pacific Communities LLC 28 28 Family Sea Grape II Marathon Atlantic Pacific Communities LLC 28 6 Family Okaloosa Choctaw Village Ft. Walton Beach Southport Financial Services, Inc 48 43 Family Choctaw Village Ft. Walton Beach Southport Financial Services, Inc 48 5 Family
APARTMENT
LOAN PROGRAM LOANS OUTSTANDING AS OF DECEMBER 31, 2022
97 2022 Annual Report
RENTAL PORTFOLIO ORIGINAL LOAN AMOUNT MATURITY DATE INTEREST RATE LOAN BALANCE AS OF 12/31/2022 INTEREST PAID IN 2022 AFFORDABILITY PERIOD LOAN STATUS 2 FUNDING TYPE3 $3,000,000 10/11/2023 1.00% $3,000,000 $30,000 50 Current SAIL $2,373,200 10/27/2021 3.00% $0 $0 59 Current SAIL $1,138,150 5/19/2045 1.00% $1,138,150 $11,382 30 Current SAIL $975,000 5/19/2045 0.00% $975,000 $0 15 Current ELI $8,075,000 12/14/2038 1.00% $7,972,000 $0 50 Current SAIL $3,850,025 5/31/2040 1.00% $3,850,025 $38,500 65 Current SAIL $4,321,000 1/1/2040 1.00% $0 $0 50 Current SAIL $600,000 1/1/2040 0.00% $0 $0 50 Current ELI $935,000 11/25/2023 0.00% $935,000 $0 15 Current SAIL $3,000,000 4/29/2038 1.00% $3,000,000 $0 50 Current SAIL $600,000 4/29/2038 0.00% $600,000 $0 50 Current ELI $3,000,000 12/17/2038 1.00% $370,384 $0 50 Current SAIL $600,000 12/17/2038 0.00% $40,000 $0 15 Current ELI $1,481,200 1/15/2037 9.00% $1,481,200 $8,101 69 Past Due SAIL $2,524,999 12/29/2046 1.00% $2,524,999 $10,828 30 Current SAIL $1,200,000 12/29/2046 0.00% $1,200,000 $0 15 Current ELI $3,000,000 12/4/2037 0.50% $3,000,000 $15,000 50 Current SAIL $765,000 12/8/2025 0.00% $765,000 $0 15 Current SAIL $5,000,000 12/21/2045 1.00% $5,000,000 $74,830 50 Current SAIL $636,500 12/21/2045 0.00% $636,500 $0 15 Current ELI $7,000,000 6/1/2040 1.00% $3,191,929 $0 50 Current SAIL $600,000 6/1/2040 0.00% $600,000 $0 15 Current ELI $612,882 5/1/2039 0.00% $333,680 $0 65 Current SAIL $5,000,000 12/29/2037 1.00% $5,000,000 $0 50 Current SAIL $3,500,000 1/30/2047 1.00% $3,500,000 $1,596 50 Current SAIL $2,000,000 10/1/2025 3.00% $1,875,918 $56,278 50 Current SAIL $5,250,000 1/1/2041 1.00% $1,017,998 $0 50 Current SAIL $1,290,000 2/28/2018 9.00% $0 $1,135,284 25 Current SAIL $2,200,000 5/29/2036 1.00% $2,200,000 $0 50 Current SAIL $2,078,686 4/22/2025 1.00% $1,726,827 $17,268 50 Current SAIL $425,000 4/22/2025 0.00% $425,000 $0 15 Current SAIL $3,000,000 7/20/2036 1.00% $3,000,000 $0 50 Current SAIL $6,608,000 7/20/2036 1.00% $6,608,000 $0 50 Current SAIL $3,740,000 2/19/2038 1.00% $3,740,000 $0 50 Current SAIL $4,600,000 11/30/2037 1.00% $4,600,000 $0 50 Current SAIL $5,400,000 11/30/2037 1.00% $5,379,890 $0 50 Current SAIL $1,854,549 12/18/2038 3.00% $1,854,549 $39,406 50 Current SAIL $991,033 2/4/2039 1.00% $664,782 $6,648 30 Current SAIL $255,000 2/4/2024 0.00% $254,788 $0 15 Current SAIL $2,500,000 9/28/2035 1.00% $2,500,000 $0 50 Current SAIL $396,300 9/28/2035 0.00% $396,300 $0 15 Current ELI
RENTAL PORTFOLIO
STATE
APARTMENT
INCENTIVE LOAN
PROGRAM LOANS OUTSTANDING AS OF DECEMBER 31, 2022
98 Florida Housing Finance Corporation RENTAL PORTFOLIO COUNTY DEVELOPMENT NAME CITY OWNER TOTAL UNITS SETASIDE UNITS DEMOGRAPHIC POPULATION SERVED 1 Orange Concord Court at Creative Village Orlando Southern Affordable Services, Inc. 116 93 Family Crescent Club Orlando WNC & Associates, Inc. 215 215 Elderly Durham Place Orlando Wendover Housing Partners, LLC 102 86 Homeless Durham Place Orlando Wendover Housing Partners, LLC 102 16 Homeless Fairlawn Village Orlando Blue CASL Orlando, LLC 116 104 Family Fairlawn Village Orlando Blue CASL Orlando, LLC 116 12 Family Fern Grove Orlando Banyan Realty Advisors LLC 138 117 Elderly Fern Grove Orlando Banyan Realty Advisors LLC 138 21 Elderly Fountains at Millenia III Orlando Atlantic Housing Partners, LLLP 82 49 Family Fountains at Millenia III Orlando Atlantic Housing Partners, LLLP 82 9 Family Fountains at Millenia IV Orlando Atlantic Housing Partners, LLLP 100 100 Family Glenn on Millenia Orlando CED Companies 192 173 Family Kinneret I Orlando Affordable Housing Institute, Inc. 280 34 Elderly Landings on Millenia Orlando CED Companies 336 252 Family Lee Vista Club Orlando CED Companies 312 312 Family Marbella Cove Orlando Atlantic Housing Partners, LLLP 104 104 Family Marbella Pointe Orlando Atlantic Housing Partners, LLLP 120 84 Family Nassau Bay I Orlando TPI Comunities LLC 252 51 Family Nassau Bay II Orlando TPI Comunities LLC 240 48 Family Oak Harbor Orlando DRL Development LLC 176 176 Family Pendana at West Lakes Orlando West Lakes Phase I, LP 200 200 Family Plymouth Apartments Winter Park Winter Park Housing Authority 196 40 Elderly Preserve at Emerald Villas Pine Hills Related Group of Florida 96 86 Elderly Preserve at Emerald Villas Pine Hills Related Group of Florida 96 10 Elderly Quest Village Orlando Life Concepts, Inc. dba Quest, Inc. 48 48 Special Needs Sumerset Housing Orlando Sumerset Apartments LLC 148 30 Family Village on Mercy Orlando Ability Housing Inc. 166 166 Homeless Wentworth II Orlando Starwood Capital Group 264 50 Family Willow Lake Apopka Starwood Capital Group 428 65 Family Osceola Cameron Preserves Apartments Kissimmee Grand Avenue Economic Community Development Corporation (GAECDC) 100 100 Homeless Dillingham Kissimmee Park Place Behavioral Healthcare, a dba 30 24 Special Needs Dillingham Kissimmee Park Place Behavioral Healthcare, a dba 30 6 Special Needs Gannet Pointe Kissimmee Gannet Pointe, Ltd. 80 68 Homeless|Special Needs Gannet Pointe Kissimmee Gannet Pointe, Ltd. 80 12 Homeless|Special Needs Palos Verdes Kissimmee Titan Land Company 120 108 Elderly Palos Verdes Kissimmee Titan Land Company 120 12 Elderly Rosewood Pointe Kissimmee Banyan Development Group, LLC 192 163 Family Rosewood Pointe Kissimmee Banyan Development Group, LLC 192 29 Family Walden Park Kissimmee Starwood Capital Group 300 8 Family
99 2022 Annual Report
RENTAL PORTFOLIO ORIGINAL LOAN AMOUNT MATURITY DATE INTEREST RATE LOAN BALANCE AS OF 12/31/2022 INTEREST PAID IN 2022 AFFORDABILITY PERIOD LOAN STATUS 2 FUNDING TYPE3 $2,000,000 9/24/2050 1.00% $2,000,000 $20,000 50 Current SAIL $2,000,000 5/13/2034 3.00% $0 $0 50 Current SAIL $4,771,550 6/30/2040 0.00% $1,498,469 $0 50 Current SAIL $359,500 6/30/2040 0.00% $113,610 $0 15 Current ELI $6,250,000 9/30/2041 1.00% $4,893,567 $0 50 Current SAIL $600,000 9/30/2041 0.00% $464,001 $0 15 Current ELI $8,399,999 9/29/2044 1.00% $686,884 $0 50 Current SAIL $600,000 9/29/2044 0.00% $47,857 $0 50 Current ELI $5,000,000 12/1/2042 1.00% $5,000,000 $50,000 50 Current SAIL $765,000 12/1/2023 0.00% $765,000 $0 15 Current SAIL $4,414,365 12/1/2042 1.00% $4,414,365 $44,144 50 Current SAIL $1,798,000 7/15/2034 3.00% $0 $53,792 50 Current SAIL $661,500 3/18/2024 1.00% $0 $86,877 15 Current EHCL $2,000,000 11/13/2035 3.00% $0 $59,836 50 Current SAIL $2,000,000 8/13/2037 3.00% $0 $59,836 50 Current SAIL $4,500,000 6/15/2042 1.00% $4,500,000 $45,000 50 Current SAIL $4,000,000 8/25/2023 3.00% $4,000,000 $120,000 15 Current SAIL $3,825,000 3/10/2030 0.00% $1,018,598 $0 30 Current ELI $3,600,000 3/10/2030 0.00% $958,680 $0 30 Current ELI $1,835,000 11/1/2044 3.00% $1,835,000 $55,050 50 Current SAIL $2,000,000 3/7/2047 1.00% $1,456,649 $0 50 Past Due SAIL $597,384 7/10/2023 1.00% $597,384 $0 15 Current EHCL $4,950,000 8/28/2036 1.00% $4,950,000 $0 50 Current SAIL $426,200 8/28/2036 0.00% $426,200 $0 15 Current ELI $1,000,000 1/1/2047 0.00% $1,000,000 $0 50 Current SAIL $2,000,000 6/1/2036 3.00% $2,000,000 $191,858 50 Current SAIL $5,000,000 4/10/2050 1.00% $4,999,990 $0 50 Current SAIL $3,750,000 12/1/2047 0.00% $1,248,750 $0 15 Current ELI $4,875,000 6/1/2047 0.00% $1,298,213 $0 15 Current ELI $4,000,000 8/1/2037 1.00% $3,098,862 $57,812 50 Current SAIL $4,875,000 12/21/2039 0.00% $0 $0 30 Current SAIL $434,500 12/21/2039 0.00% $0 $0 30 Current ELI $4,318,000 3/1/2040 0.30% $4,318,000 $0 50 Current SAIL $182,000 3/1/2040 0.00% $182,000 $0 15 Current ELI $5,200,000 4/15/2036 1.00% $5,200,000 $0 50 Current SAIL $552,300 4/15/2036 0.00% $552,300 $0 15 Current ELI $10,300,000 6/16/2040 1.00% $0 $0 50 Current SAIL $600,000 6/16/2040 0.00% $0 $0 15 Current ELI $535,000 11/1/2048 0.00% $213,840 $0 15 Current ELI
RENTAL PORTFOLIO
100 Florida Housing Finance Corporation RENTAL PORTFOLIO COUNTY DEVELOPMENT NAME CITY OWNER TOTAL UNITS SETASIDE UNITS DEMOGRAPHIC POPULATION SERVED 1 Palm Beach Banyan Court Lake Worth Banyan Realty Advisors LLC 85 76 Family Banyan Court Lake Worth Banyan Realty Advisors LLC 85 9 Family Christian Manor West Palm Beach Partnership Housing Affordable to Society Everywhere, Inc. 200 180 Elderly Christian Manor West Palm Beach Partnership Housing Affordable to Society Everywhere, Inc. 200 20 Elderly Colony Park West Palm Beach Starwood Capital Group 130 130 Family Groves of Delray Delray Beach Dominium LLC 158 158 Elderly Heron Estates Family Riviera Beach Housing Trust Group LLC 79 67 Family Heron Estates Family Riviera Beach Housing Trust Group LLC 79 12 Family Heron Estates Senior Riviera Beach Housing Trust Group LLC 101 90 Elderly Heron Estates Senior Riviera Beach Housing Trust Group LLC 101 11 Elderly In the Pines South Delray Beach In the Pines, Inc. 40 40 FW | FW Indian Trace Riviera Beach Indian Trace Associates, Ltd. 330 33 Family Island Cove Delray Beach Island Cove, LLC 60 35 Family Island Cove Delray Beach Island Cove, LLC 60 25 Family Lake Shore West Palm Beach Richman Group 192 192 Family Merry Place West Palm Beach West Palm Beach Housing Authority 130 130 Family Palm Park Boynton Beach Blackstone Inc. 160 160 Family Paul Laurence Dunbar Senior Complex West Palm Beach West Palm Beach Housing Authority 99 69 Elderly Paul Laurence Dunbar Senior Complex West Palm Beach West Palm Beach Housing Authority 99 30 Elderly Pinnacle Palms West Palm Beach Pinnacle Housing Group LLC 152 152 Elderly Portofino Palm Springs Portofino Associates, Ltd. 270 33 Family Portofino Palm Springs Portofino Associates, Ltd. 270 15 Family Quiet Waters Belle Glade McCurdy Senior Housing Corporation 93 93 Homeless Riverview House Lake Worth Richman Group 160 160 Elderly Royal Palm Place Palm Beach Landmark Companies Inc. 125 87 Family Royal Palm Place Palm Beach Landmark Companies Inc. 125 38 Family San Marco Villas II Lake Park Starwood Capital Group 112 112 Family Waverly West Palm Beach Starwood Capital Group 260 33 Family Windsor Park West Palm Beach Starwood Capital Group 240 24 Elderly Woodlake West Palm Beach Related Group of Florida 224 224 Family Pasco Banyan Senior Port Richey Beneficial Communities LLC 96 10 Elderly Hudson Ridge Port Richey Richman Group 168 151 Family Hudson Ridge Port Richey Richman Group 168 17 Family Landings at Sea Forest New Port Richey Affordable Housing Institute, Inc. 200 200 Elderly Landings of Saint Andrew New Port Richey National Church Residences 196 186 Elderly Landings of Saint Andrew New Port Richey National Church Residences 196 187 Elderly Osprey Pointe Dade City Housing Trust Group LLC 110 99 Family Osprey Pointe Dade City Housing Trust Group LLC 110 11 Family Ozanam Village New Port Richey Society of St. Vincent dePaul of South Pinellas, Inc. 30 22 Special Needs Ozanam Village New Port Richey Society of St. Vincent dePaul of South Pinellas, Inc. 30 8 Special Needs
AS OF DECEMBER 31, 2022
STATE APARTMENT INCENTIVE LOAN PROGRAM LOANS OUTSTANDING
101 2022 Annual Report
RENTAL PORTFOLIO ORIGINAL LOAN AMOUNT MATURITY DATE INTEREST RATE LOAN BALANCE AS OF 12/31/2022 INTEREST PAID IN 2022 AFFORDABILITY PERIOD LOAN STATUS 2 FUNDING TYPE3 $5,400,000 11/9/2035 1.00% $5,400,000 $0 50 Current SAIL $600,000 11/9/2035 0.00% $600,000 $0 15 Current ELI $5,000,000 8/1/2063 1.00% $855,189 $0 50 Current SAIL $600,000 8/1/2063 0.00% $110,000 $0 15 Current ELI $1,340,000 12/1/2050 3.00% $0 $0 59 Current SAIL $1,502,000 12/31/2026 3.00% $1,502,000 $45,060 50 Current SAIL $5,500,000 4/7/2038 1.00% $4,979,778 $0 50 Current SAIL $600,000 4/7/2038 0.00% $502,823 $0 15 Current ELI $4,971,218 4/20/2035 1.00% $4,971,218 $0 50 Current SAIL $720,500 4/20/2035 0.00% $720,500 $0 15 Current ELI $1,346,710 10/31/2031 0.00% $1,302,034 $0 65 Current SAIL $2,475,000 6/24/2056 0.00% $824,175 $0 15 Current ELI $3,000,000 6/23/2040 1.00% $0 $0 50 Current SAIL $600,000 6/23/2040 0.00% $0 $0 50 Current ELI $2,000,000 6/15/2037 3.00% $2,000,000 $252,451 50 Current SAIL $1,024,000 8/16/2027 3.00% $1,024,000 $79,309 50 Current SAIL $5,000,000 3/1/2049 1.00% $0 $207,695 50 Current SAIL $2,474,000 8/1/2061 1.00% $2,457,848 $0 46 Current SAIL $750,000 8/1/2061 0.00% $750,000 $0 15 Current ELI $1,579,000 6/1/2042 3.00% $1,300,566 $39,017 50 Current SAIL $1,125,000 6/1/2049 0.00% $449,663 $0 15 Current ELI $2,475,000 6/1/2049 0.00% $989,258 $0 15 Current ELI $1,750,000 6/11/2038 3.00% $1,750,000 $52,500 50 Current SAIL $1,662,960 2/1/2054 3.00% $722,960 $0 68 Current SAIL $4,750,000 8/4/2050 1.00% $4,750,000 $89,866 50 Current SAIL $495,900 8/4/2050 0.00% $495,900 $0 15 Current ELI $905,350 12/15/2043 3.00% $0 $0 50 Current SAIL $2,475,000 1/1/2049 0.00% $989,258 $0 15 Current ELI $1,800,000 6/1/2048 0.00% $479,340 $0 15 Current ELI $2,350,000 3/1/2030 3.00% $2,350,000 $70,500 50 Current SAIL $850,000 2/13/2023 0.00% $850,000 $0 15 Current SAIL $4,700,000 8/15/2041 1.00% $4,700,000 $3,063 50 Current SAIL $1,445,000 8/19/2023 0.00% $1,445,000 $0 15 Current SAIL $3,240,000 12/9/2046 1.00% $2,771,738 $28,531 60 Current SAIL $1,990,000 2/27/2035 1.00% $1,990,000 $96,392 55 Current SAIL $2,000,000 2/27/2035 0.80% $2,000,000 $53,708 55 Current SAIL $6,000,000 2/8/2037 1.00% $6,000,000 $0 50 Current SAIL $556,900 2/8/2037 0.00% $556,900 $0 15 Current ELI $4,683,000 6/22/2032 0.00% $4,512,414 $0 30 Current SAIL $309,360 6/22/2032 0.00% $298,219 $0 15 Current ELI
RENTAL PORTFOLIO
102 Florida Housing Finance Corporation RENTAL PORTFOLIO COUNTY DEVELOPMENT NAME CITY OWNER TOTAL UNITS SETASIDE UNITS DEMOGRAPHIC POPULATION SERVED 1 Pasco Ozanam Village II New Port Richey Society of St. Vincent dePaul of South Pinellas, Inc. 30 22 Special Needs Ozanam Village II New Port Richey Society of St. Vincent dePaul of South Pinellas, Inc. 30 8 Special Needs Ozanam Village III New Port Richey Society of St. Vincent dePaul of South Pinellas, Inc. 30 30 Special Needs Park at Wellington II Holiday HTG Wellington II, LLC 110 99 Family Park at Wellington II Holiday HTG Wellington II, LLC 110 11 Family Regency Palms Port Richey Port Richey Leased Housing Assoc II LLLP 200 198 Family Pinellas Brookside Square St. Petersburg Gulfcoast Housing Foundation Inc. 142 134 Family Brookside Square St. Petersburg Gulfcoast Housing Foundation Inc. 142 8 Family Butterfly Grove Apartments St. Petersburg Boley Centers, Inc. 20 16 Special Needs Butterfly Grove Apartments St. Petersburg Boley Centers, Inc. 20 4 Special Needs Clear Bay Terrace Clearwater Volunteers of America National Services Corporation 101 101 Elderly Clear Harbor Clearwater Richman Group 84 79 Family Clear Harbor Clearwater Richman Group 84 5 Family Delmar Terrace St. Petersburg McCormack Baron Salazar, Inc. 65 65 Homeless Duval Park St. Petersburg Duval Park, Ltd. 88 88 Special Needs Duval Park St. Petersburg Duval Park, Ltd. 88 22 Special Needs Evergreen Village Pinellas Park Boley Centers, Inc. 21 16 Homeless|Special Needs Evergreen Village Pinellas Park Boley Centers, Inc. 21 5 Homeless|Special Needs Garden Trail Clearwater Southport Financial Services, Inc 76 72 Family Garden Trail Clearwater Southport Financial Services, Inc 76 4 Family Innovare St. Petersburg Volunteers of America of Florida Inc. 51 43 Homeless Innovare St. Petersburg Volunteers of America of Florida Inc. 51 8 Homeless Palmetto Pointe Pinellas Park Southport Financial Services, Inc 82 73 Family Palmetto Pointe Pinellas Park Southport Financial Services, Inc 82 9 Family Peterborough Apartments St. Petersburg Peterborough Apartments Inc. 150 105 Elderly Peterborough Apartments St. Petersburg Peterborough Apartments Inc. 150 45 Elderly Pinellas Hope II Clearwater Catholic Charities Housing Inc. 80 80 Homeless Pinellas Hope V Clearwater Catholic Charities Housing Inc. 45 45 Homeless Ranch at Pinellas Park Pinellas Park Boley Centers, Inc. 25 20 Special Needs Ranch at Pinellas Park Pinellas Park Boley Centers, Inc. 25 5 Special Needs Salt Creek St. Petersburg Boley Centers, Inc. 18 18 Homeless Viridian St. Petersburg Sage Partners LLC 188 169 Elderly Viridian St. Petersburg Sage Partners LLC 188 19 Elderly Woodlawn Trail Clearwater Southport Financial Services, Inc 80 72 Family Woodlawn Trail Clearwater Southport Financial Services, Inc 80 8 Family Polk Banyan Reserve Senior Lakeland Banyan Realty Advisors LLC 139 125 Elderly Banyan Reserve Senior Lakeland Banyan Realty Advisors LLC 139 14 Elderly Harbour Court Haines City Southport Financial Services, Inc 64 57 Family Harbour Court Haines City Southport Financial Services, Inc 64 7 Family
STATE APARTMENT INCENTIVE LOAN PROGRAM LOANS OUTSTANDING AS OF DECEMBER 31, 2022
103 2022 Annual Report
RENTAL PORTFOLIO ORIGINAL LOAN AMOUNT MATURITY DATE INTEREST RATE LOAN BALANCE AS OF 12/31/2022 INTEREST PAID IN 2022 AFFORDABILITY PERIOD LOAN STATUS 2 FUNDING TYPE3 $4,900,000 8/13/2035 0.00% $4,900,000 $0 30 Current SAIL $100,000 8/13/2035 0.00% $100,000 $0 15 Current ELI $5,000,000 2/27/2035 0.00% $4,844,950 $0 30 Current SAIL $4,899,714 12/1/2033 1.00% $4,899,714 $48,997 50 Current SAIL $549,600 12/1/2033 0.00% $549,600 $0 15 Current ELI $2,000,000 12/1/2033 3.00% $2,000,000 $47,170 52 Current SAIL $4,400,000 12/14/2032 1.00% $4,400,000 $0 50 Current SAIL $383,600 12/14/2032 0.00% $383,600 $0 15 Current ELI $4,079,394 4/30/2037 0.00% $3,807,598 $0 30 Current SAIL $229,600 4/30/2037 0.00% $214,318 $0 15 Current ELI $750,000 6/30/2047 1.00% $0 $0 15 Current EHCL $3,000,000 6/15/2042 3.00% $3,000,000 $25,190 50 Current SAIL $413,841 6/15/2042 1.00% $413,841 $0 15 Current SAIL $3,250,000 4/26/2050 0.49% $3,250,000 $0 50 Past Due SAIL $2,976,377 10/2/2031 0.00% $2,976,377 $0 50 Current SAIL $300,000 10/2/2029 0.00% $300,000 $0 50 Current ELI $4,305,000 11/14/2035 0.00% $4,241,170 $0 30 Current SAIL $235,300 11/14/2035 0.00% $235,300 $0 15 Current ELI $4,100,000 1/1/2034 1.00% $4,100,000 $0 50 Current SAIL $185,700 1/1/2034 0.00% $185,700 $0 15 Current ELI $3,500,000 10/19/2038 0.50% $266,841 $0 50 Current SAIL $205,600 10/19/2038 0.00% $15,675 $0 15 Current ELI $5,400,000 3/30/2038 1.00% $5,400,000 $0 50 Current SAIL $463,900 3/30/2038 0.00% $463,900 $0 15 Current ELI $3,939,840 1/27/2033 1.00% $3,939,840 $39,398 30 Current SAIL $1,125,000 1/27/2033 0.00% $1,125,000 $0 15 Current ELI $3,000,000 8/10/2024 0.00% $3,000,000 $0 50 Current SAIL $1,050,000 3/31/2035 0.00% $735,000 $0 20 Current ELI $3,890,189 7/16/2035 0.00% $3,766,273 $0 30 Current SAIL $226,600 7/16/2035 0.00% $211,887 $0 30 Current ELI $245,583 9/1/2039 0.00% $166,996 $491 50 Current SAIL $4,320,000 12/10/2041 1.00% $4,320,000 $43,200 50 Current SAIL $1,615,000 6/30/2024 0.00% $1,615,000 $0 15 Current SAIL $4,100,000 11/24/2050 1.00% $4,100,000 $0 50 Current SAIL $410,400 11/24/2050 0.00% $410,400 $0 15 Current ELI $6,000,000 6/1/2037 1.00% $6,000,000 $0 50 Current SAIL $429,800 6/1/2037 0.00% $429,800 $0 15 Current ELI $1,750,000 1/21/2032 1.00% $1,750,000 $17,500 30 Current SAIL $525,000 7/21/2030 0.00% $525,000 $0 15 Current ELI
RENTAL PORTFOLIO
STATE
104 Florida Housing Finance Corporation RENTAL PORTFOLIO COUNTY DEVELOPMENT NAME CITY OWNER TOTAL UNITS SETASIDE UNITS DEMOGRAPHIC POPULATION SERVED 1 Polk Lake Wales Gardens Lake Wales Southport Financial Services, Inc 96 86 Family Lake Wales Gardens Lake Wales Southport Financial Services, Inc 96 10 Family Manor at West Bartow Bartow Lakeland Housing Authority 100 10 Elderly Plateau Village Lakeland Turnstone Development Corporation 72 61 Homeless|Special Needs Plateau Village Lakeland Turnstone Development Corporation 72 11 Homeless|Special Needs Swan Lake Village Lakeland Blue Sky Communities LLC 84 71 Homeless|Special Needs Swan Lake Village Lakeland Blue Sky Communities LLC 84 13 Homeless|Special Needs Twin Lakes Estates - Phase I Lakeland West Lake I, Ltd. 100 90 Elderly Twin Lakes Estates - Phase I Lakeland West Lake I, Ltd. 100 10 Elderly Twin Lakes Estates II Lakeland Housing Trust Group LLC 132 118 Family Twin Lakes Estates II Lakeland Housing Trust Group LLC 132 14 Family Villages at Noah's Landing Lakeland Noah’s Ark of Central Florida, Inc. 126 94 Special Needs Villages at Noah's Landing Lakeland Noah’s Ark of Central Florida, Inc. 126 32 Special Needs Villas at Lake Smart Winter Haven Lincoln Avenue Capital LLC 220 55 Family Whispering Pines Bartow Hallmark Companies, Inc. 64 64 FW | FW Wilmington Lakeland Starwood Capital Group 200 33 Family Winter Haven Baptist Manor Winter Haven Winter Haven Baptist Manor, Inc. 125 32 Elderly Putnam Grand Pines Palatka Grey Rock Group LLC 78 78 Elderly Kay Larkin Apartments Palatka Grey Rock Group LLC 60 60 Family St. Johns Whispering Woods St. Augustine Starwood Capital Group 200 33 Family Woodcrest St. Augustine Starwood Capital Group 90 90 Family St. Lucie Grove Park Port St. Lucie Southern Affordable Services, Inc. 210 147 Special Needs Grove Park Port St. Lucie Southern Affordable Services, Inc. 210 21 Special Needs Orangewood Village Ft. Pierce Southport Financial Services, Inc 60 42 Family Orangewood Village Ft. Pierce Southport Financial Services, Inc 60 18 Family Peacock Run Port St. Lucie NB Holdings Management LLC 264 14 Family Sabal Chase Ft. Pierce Harmony Housing Advisors, Inc. 340 63 Family Saint Andrews Pointe Port St. Lucie Cove at St. Andrews Partners, Ltd. 184 183 Family Sarasota Arbor Park North Port McDowell Housing Partners LLC 136 122 Elderly Arbor Park North Port McDowell Housing Partners LLC 136 14 Elderly Arbor Village Sarasota Blue Sky Communities LLC 80 80 Homeless|Special Needs Janies Garden I Sarasota Michaels Development Company, Inc. 86 9 Family Loveland Village Venice Loveland Center, Inc. 60 48 Special Needs Loveland Village Venice Loveland Center, Inc. 60 15 Special Needs Palm Port North Port Southport Financial Services, Inc 126 113 Family Palm Port North Port Southport Financial Services, Inc 126 13 Family University Club Sarasota CED Companies 192 192 Family Venetian Walk II Venice Norstar Development USA, LP 52 46 Family
APARTMENT INCENTIVE LOAN PROGRAM LOANS OUTSTANDING AS OF DECEMBER 31, 2022
105 2022 Annual Report
RENTAL PORTFOLIO ORIGINAL LOAN AMOUNT MATURITY DATE INTEREST RATE LOAN BALANCE AS OF 12/31/2022 INTEREST PAID IN 2022 AFFORDABILITY PERIOD LOAN STATUS 2 FUNDING TYPE3 $3,860,000 6/18/2036 1.00% $3,860,000 $0 50 Current SAIL $436,100 6/18/2036 0.00% $436,100 $0 15 Current ELI $850,000 8/22/2023 0.00% $850,000 $0 15 Current SAIL $3,820,000 2/28/2039 0.50% $1,795,695 $0 50 Current SAIL $194,700 2/28/2039 0.00% $91,524 $0 15 Current ELI $3,800,000 10/20/2037 0.50% $2,511,746 $0 50 Current SAIL $198,600 10/20/2037 0.00% $138,251 $0 15 Current ELI $5,000,000 3/21/2048 1.00% $5,000,000 $50,000 50 Current SAIL $294,000 3/21/2047 0.00% $294,000 $0 15 Current ELI $6,000,000 4/30/2037 1.00% $6,000,000 $0 50 Current SAIL $600,000 4/30/2037 0.00% $600,000 $0 15 Current ELI $1,320,000 4/16/2045 0.00% $1,320,000 $0 50 Current SAIL $1,000,000 4/16/2065 0.00% $1,000,000 $0 50 Current ELI $4,125,000 9/1/2049 0.00% $1,373,625 $0 15 Current ELI $1,282,000 6/1/2033 3.00% $1,282,000 $0 50 Current SAIL $2,475,000 8/21/2028 0.00% $989,258 $0 15 Current ELI $265,306 9/30/2024 0.00% $63,472 $0 34 Current EHCL $810,000 4/22/2027 3.00% $810,000 $298,465 50 Current SAIL $1,175,000 4/22/2027 3.00% $1,175,000 $653,406 50 Current SAIL $2,475,000 4/17/2028 0.00% $989,258 $0 15 Current ELI $1,061,605 1/1/2049 3.00% $0 $0 67 Current SAIL $4,200,000 9/28/2046 1.00% $4,200,000 $42,000 30 Current SAIL $1,575,000 9/28/2046 0.00% $1,575,000 $0 15 Current ELI $1,739,000 5/20/2032 1.00% $1,739,000 $2,701 50 Current SAIL $143,400 5/20/2032 0.00% $143,400 $0 15 Current ELI $1,050,000 3/28/2026 0.00% $279,615 $0 15 Current ELI $4,725,000 5/1/2051 0.00% $1,258,268 $0 15 Current ELI $1,500,000 6/21/2036 3.00% $0 $44,877 50 Current SAIL $9,755,950 9/30/2040 1.00% $974,923 $0 50 Current SAIL $600,000 9/30/2040 0.00% $38,541 $0 15 Current ELI $3,500,000 9/12/2035 1.00% $3,285,729 $32,860 50 Current SAIL $765,000 8/22/2023 0.00% $765,000 $0 15 Current SAIL $940,000 3/13/2030 0.00% $940,000 $0 30 Current SAIL $835,000 3/13/2045 0.00% $835,000 $0 30 Current ELI $5,560,000 9/29/2040 1.00% $5,535,518 $0 50 Current SAIL $600,000 9/29/2040 0.00% $570,843 $0 15 Current ELI $1,500,000 11/13/2035 3.00% $0 $44,877 50 Current SAIL $2,290,000 2/15/2040 1.00% $2,290,000 $0 50 Current SAIL
RENTAL PORTFOLIO
STATE APARTMENT INCENTIVE LOAN PROGRAM LOANS OUTSTANDING AS OF DECEMBER 31, 2022
Notes:
1"FW/FW" refers to properties targeting farmworkers and/or fishing workers.
2Past due amounts may include matured loans, loan interest, replacement reserves, and other payments required by the loan documents.
106 Florida Housing Finance Corporation
COUNTY DEVELOPMENT NAME CITY OWNER TOTAL UNITS SETASIDE UNITS DEMOGRAPHIC POPULATION SERVED 1 Sarasota Venetian Walk II Venice Norstar Development USA, LP 52 6 Family Seminole Georgia Arms Sanford Southport Financial Services, Inc 90 63 Family Georgia Arms Sanford Southport Financial Services, Inc 90 27 Family Mystic Cove Oviedo CED Companies 184 184 Family Oviedo Town Centre I Oviedo Atlantic Housing Partners, LLLP 106 75 Family Oviedo Town Centre II Oviedo Atlantic Housing Partners, LLLP 34 21 Family Oviedo Town Centre II Oviedo Atlantic Housing Partners, LLLP 34 4 Family Oviedo Town Centre III Oviedo Atlantic Housing Partners, LLLP 72 43 Family Oviedo Town Centre III Oviedo Atlantic Housing Partners, LLLP 72 8 Family Seminole Gardens Sanford Southport Financial Services, Inc 108 97 Family Seminole Gardens Sanford Southport Financial Services, Inc 108 11 Family Somerset Landings Sanford Wendover Housing Partners, LLC 84 71 Family Somerset Landings Sanford Wendover Housing Partners, LLC 84 13 Family Stratford Point Apts. Sanford Lincoln Avenue Capital LLC 384 20 Family Stratford Point Apts. Sanford Lincoln Avenue Capital LLC 384 76 Family Warley Park Sanford Warley Park, Ltd. 81 81 Homeless|Special Needs Windchase Sanford Starwood Capital Group 352 65 Family Wyndham Place Sanford Starwood Capital Group 260 26 Family Wyndham Place Sanford Starwood Capital Group 260 39 Family Taylor Perrytown Apartments Perry AMCS Development, LLC 100 90 Family Perrytown Apartments Perry AMCS Development, LLC 100 10 Family Volusia Cape Morris Cove I Daytona Beach Atlantic Housing Partners, LLLP 130 78 Family Cape Morris Cove I Daytona Beach Atlantic Housing Partners, LLLP 130 13 Family Cape Morris Cove II Daytona Beach Atlantic Housing Partners, LLLP 47 29 Family Cape Morris Cove II Daytona Beach Atlantic Housing Partners, LLLP 47 5 Family Carolina Club Daytona Beach Cornerstone Group Development LLC 224 33 Family New Hope Villas of Seville Seville Seville Farm Family Housing Association, Inc. 61 61 FW | FW San Marco Ormond Beach Cornerstone Group Development LLC 260 28 Family Walton Arbours at Shoemaker Place DeFuniak Springs Arbour Valley Development, LLC 80 80 Family
RENTAL PORTFOLIO
Notes continued: 3"SAIL" = State Apartment Incentive Loan. "ELI" refers to forgivable loans to finance units affordable to extremely low income households. These loans are typically provided in addition to other primary financing, such as SAIL and Low Income Housing Tax Credits. "EHCL" refers to the Elderly Housing Community Loan Program, a small program funded out of the SAIL program.
107 2022 Annual Report
RENTAL PORTFOLIO ORIGINAL LOAN AMOUNT MATURITY DATE INTEREST RATE LOAN BALANCE AS OF 12/31/2022 INTEREST PAID IN 2022 AFFORDABILITY PERIOD LOAN STATUS 2 FUNDING TYPE3 $464,200 2/15/2040 0.00% $464,200 $0 50 Current ELI $1,850,000 10/30/2031 1.00% $1,850,000 $0 30 Current SAIL $675,000 4/30/2030 0.00% $675,000 $0 15 Current ELI $1,500,000 8/15/2035 3.00% $0 $44,877 50 Current SAIL $2,650,000 9/1/2042 3.00% $2,650,000 $79,500 50 Current SAIL $1,200,000 9/1/2042 1.00% $1,200,000 $12,000 50 Current SAIL $340,000 12/1/2023 0.00% $340,000 $0 15 Current SAIL $4,630,000 9/1/2042 1.00% $4,630,000 $46,300 50 Current SAIL $680,000 12/1/2023 0.00% $680,000 $0 15 Current SAIL $2,800,000 4/3/2033 1.00% $2,800,000 $0 50 Current SAIL $536,500 4/3/2033 0.00% $536,500 $0 15 Current ELI $2,800,000 12/15/2040 1.00% $357,959 $0 50 Current SAIL $600,000 12/15/2040 0.00% $76,703 $0 50 Current ELI $1,500,000 12/1/2056 0.00% $399,450 $0 15 Current ELI $5,700,000 12/1/2056 0.00% $1,898,100 $0 15 Current ELI $2,825,000 10/16/2051 1.00% $2,825,000 $28,250 50 Current SAIL $4,875,000 3/28/2026 0.00% $1,298,213 $0 15 Current ELI $1,950,000 1/1/2048 0.00% $519,285 $0 15 Current ELI $2,925,000 1/1/2048 0.00% $974,025 $0 15 Current ELI $2,670,400 12/13/2059 1.00% $2,670,400 $13,462 50 Current SAIL $194,600 12/13/2059 0.00% $194,600 $0 15 Current ELI $5,000,000 10/15/2042 1.00% $5,000,000 $50,000 50 Current SAIL $1,105,000 12/1/2023 0.00% $1,105,000 $0 15 Current SAIL $1,500,000 10/15/2042 1.00% $1,500,000 $15,000 50 Current SAIL $425,000 12/1/2023 0.00% $425,000 $0 15 Current SAIL $2,475,000 9/22/2030 0.00% $1,319,423 $0 59 Current ELI $2,877,785 6/1/2033 3.00% $2,877,785 $2,688 66 Current SAIL $2,100,000 10/1/2048 0.00% $699,300 $0 15 Current ELI $680,000 7/30/2025 0.00% $680,000 $0 15 Current SAIL
RENTAL PORTFOLIO
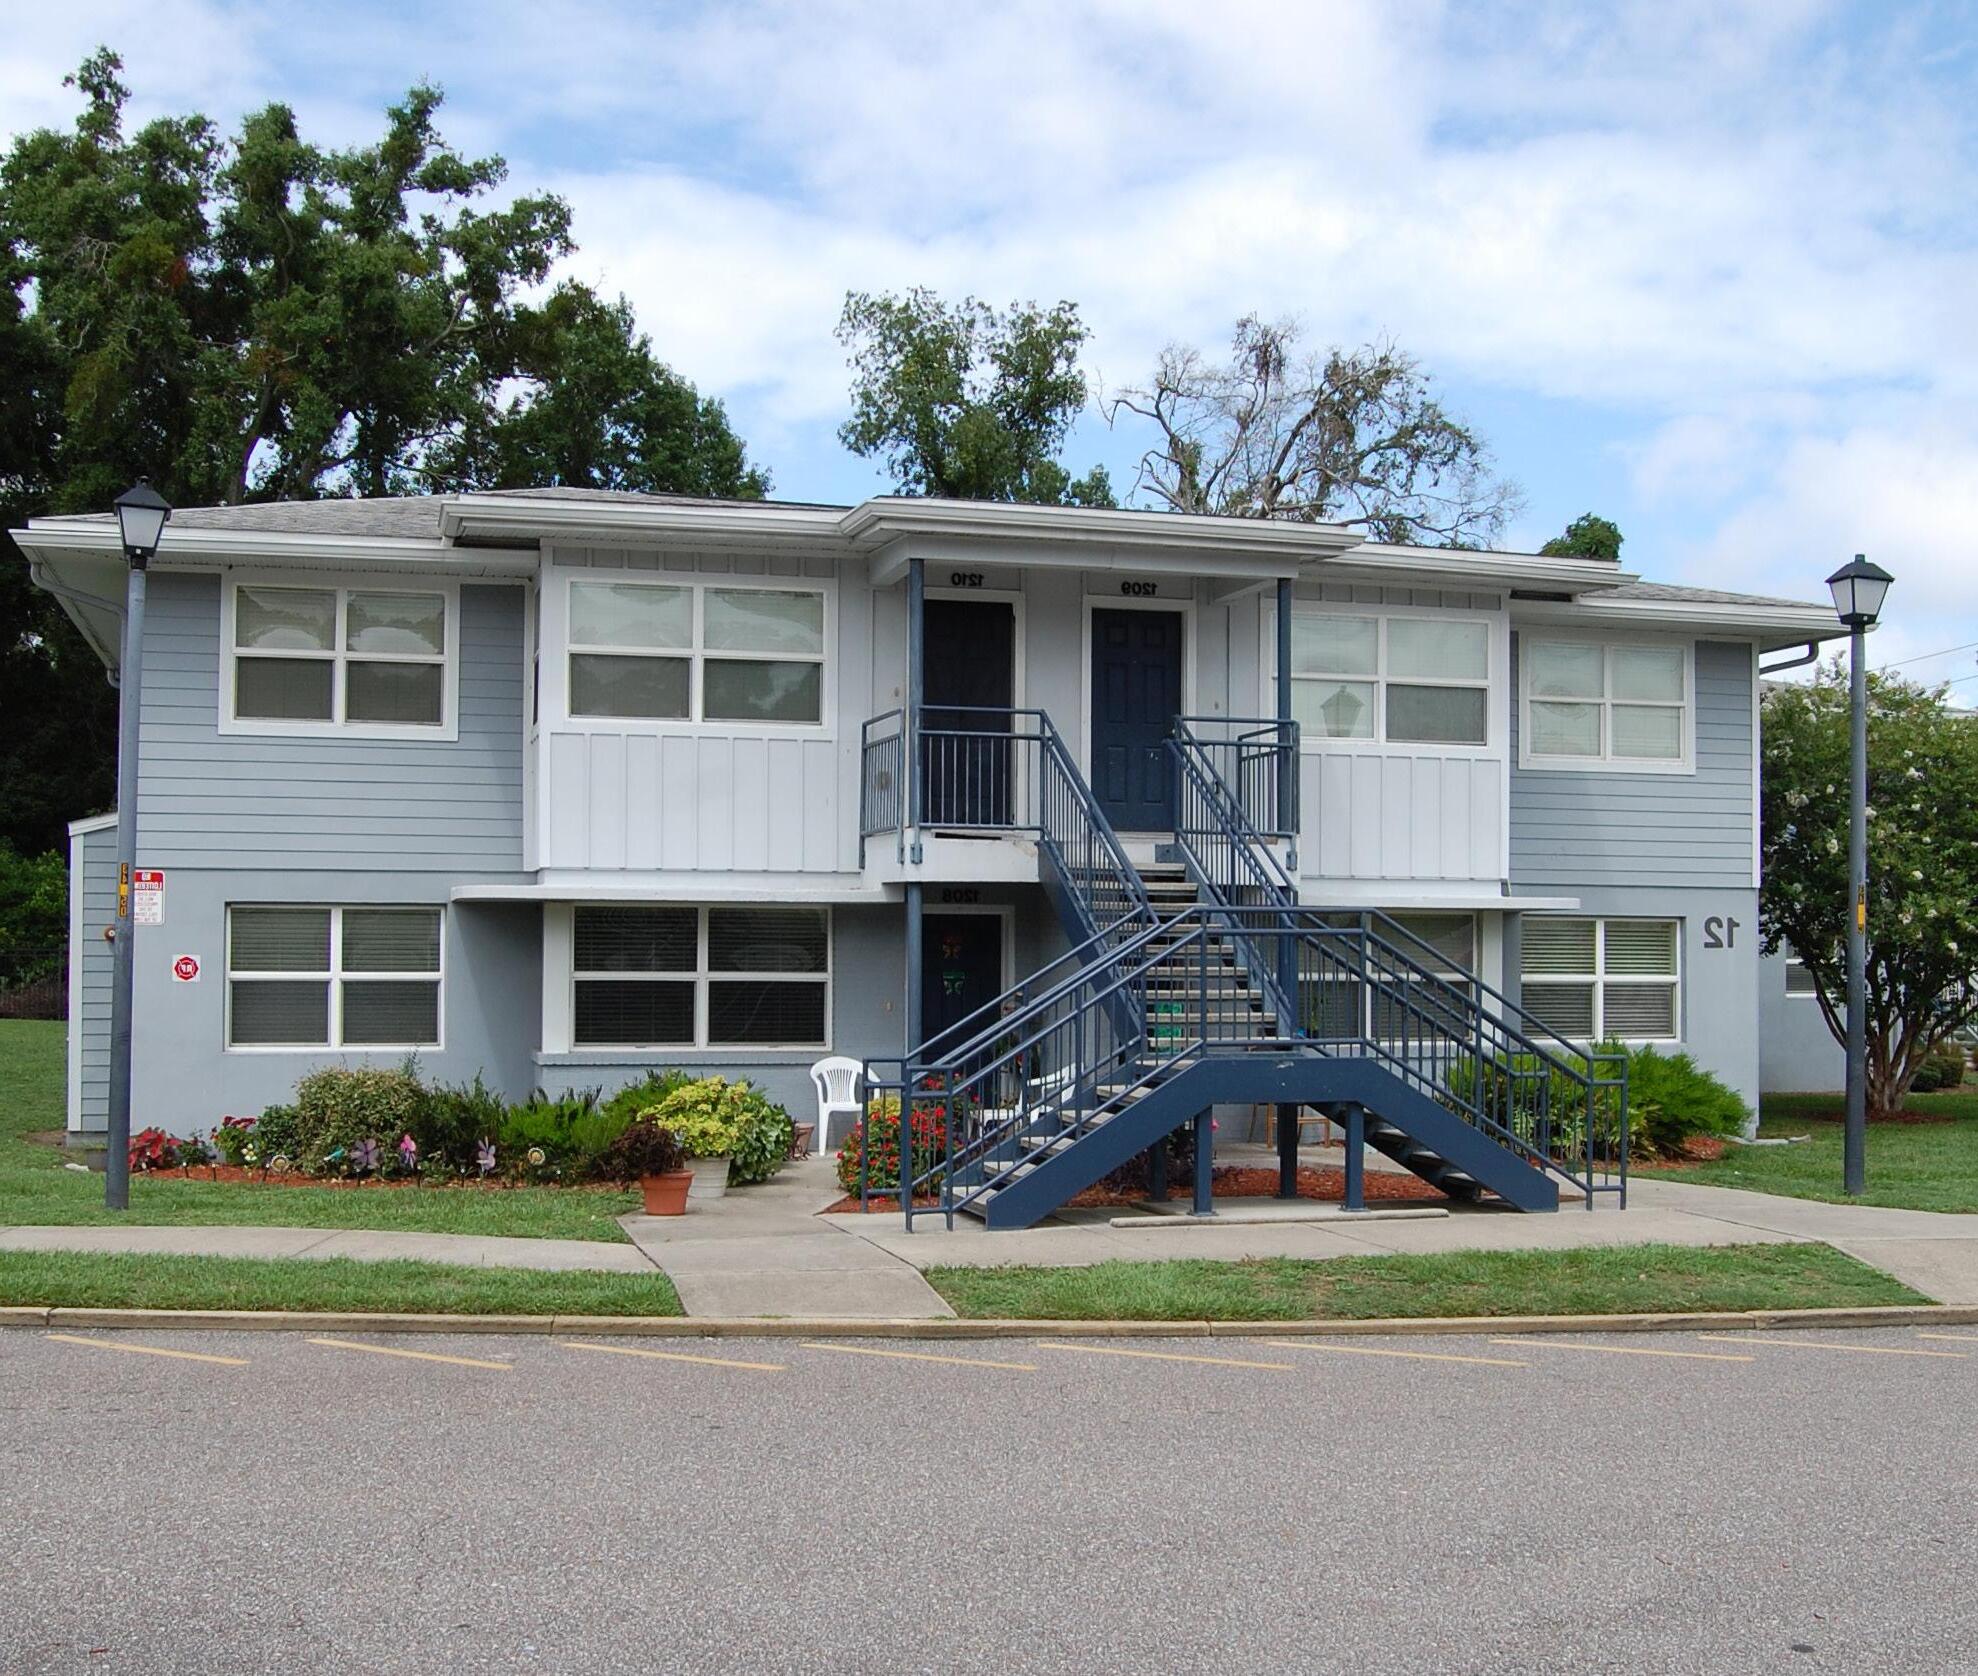
108 Florida Housing Finance Corporation
CURRENT BOARD OF DIRECTORS
Mario Facella
Chair
Banking/mortgage banking industry representative
Ryan Benson
Vice Chair
Representative of those areas of labor engaged in home building
David Hall
Low income advocate
Dev Motwani
Commercial building representative
Sandra Einhorn
One of two citizen representatives
Alex Kelly
Secretary, Florida Department of Commerce, Ex-Officio
Ron Lieberman
Residential builder
Olivia Hoblit
One of two citizen representatives
Larry Cretul
Former local government elected official
Michael DiNapoli
Executive Director
Florida Housing Finance Corporation
109 2022 Annual Report
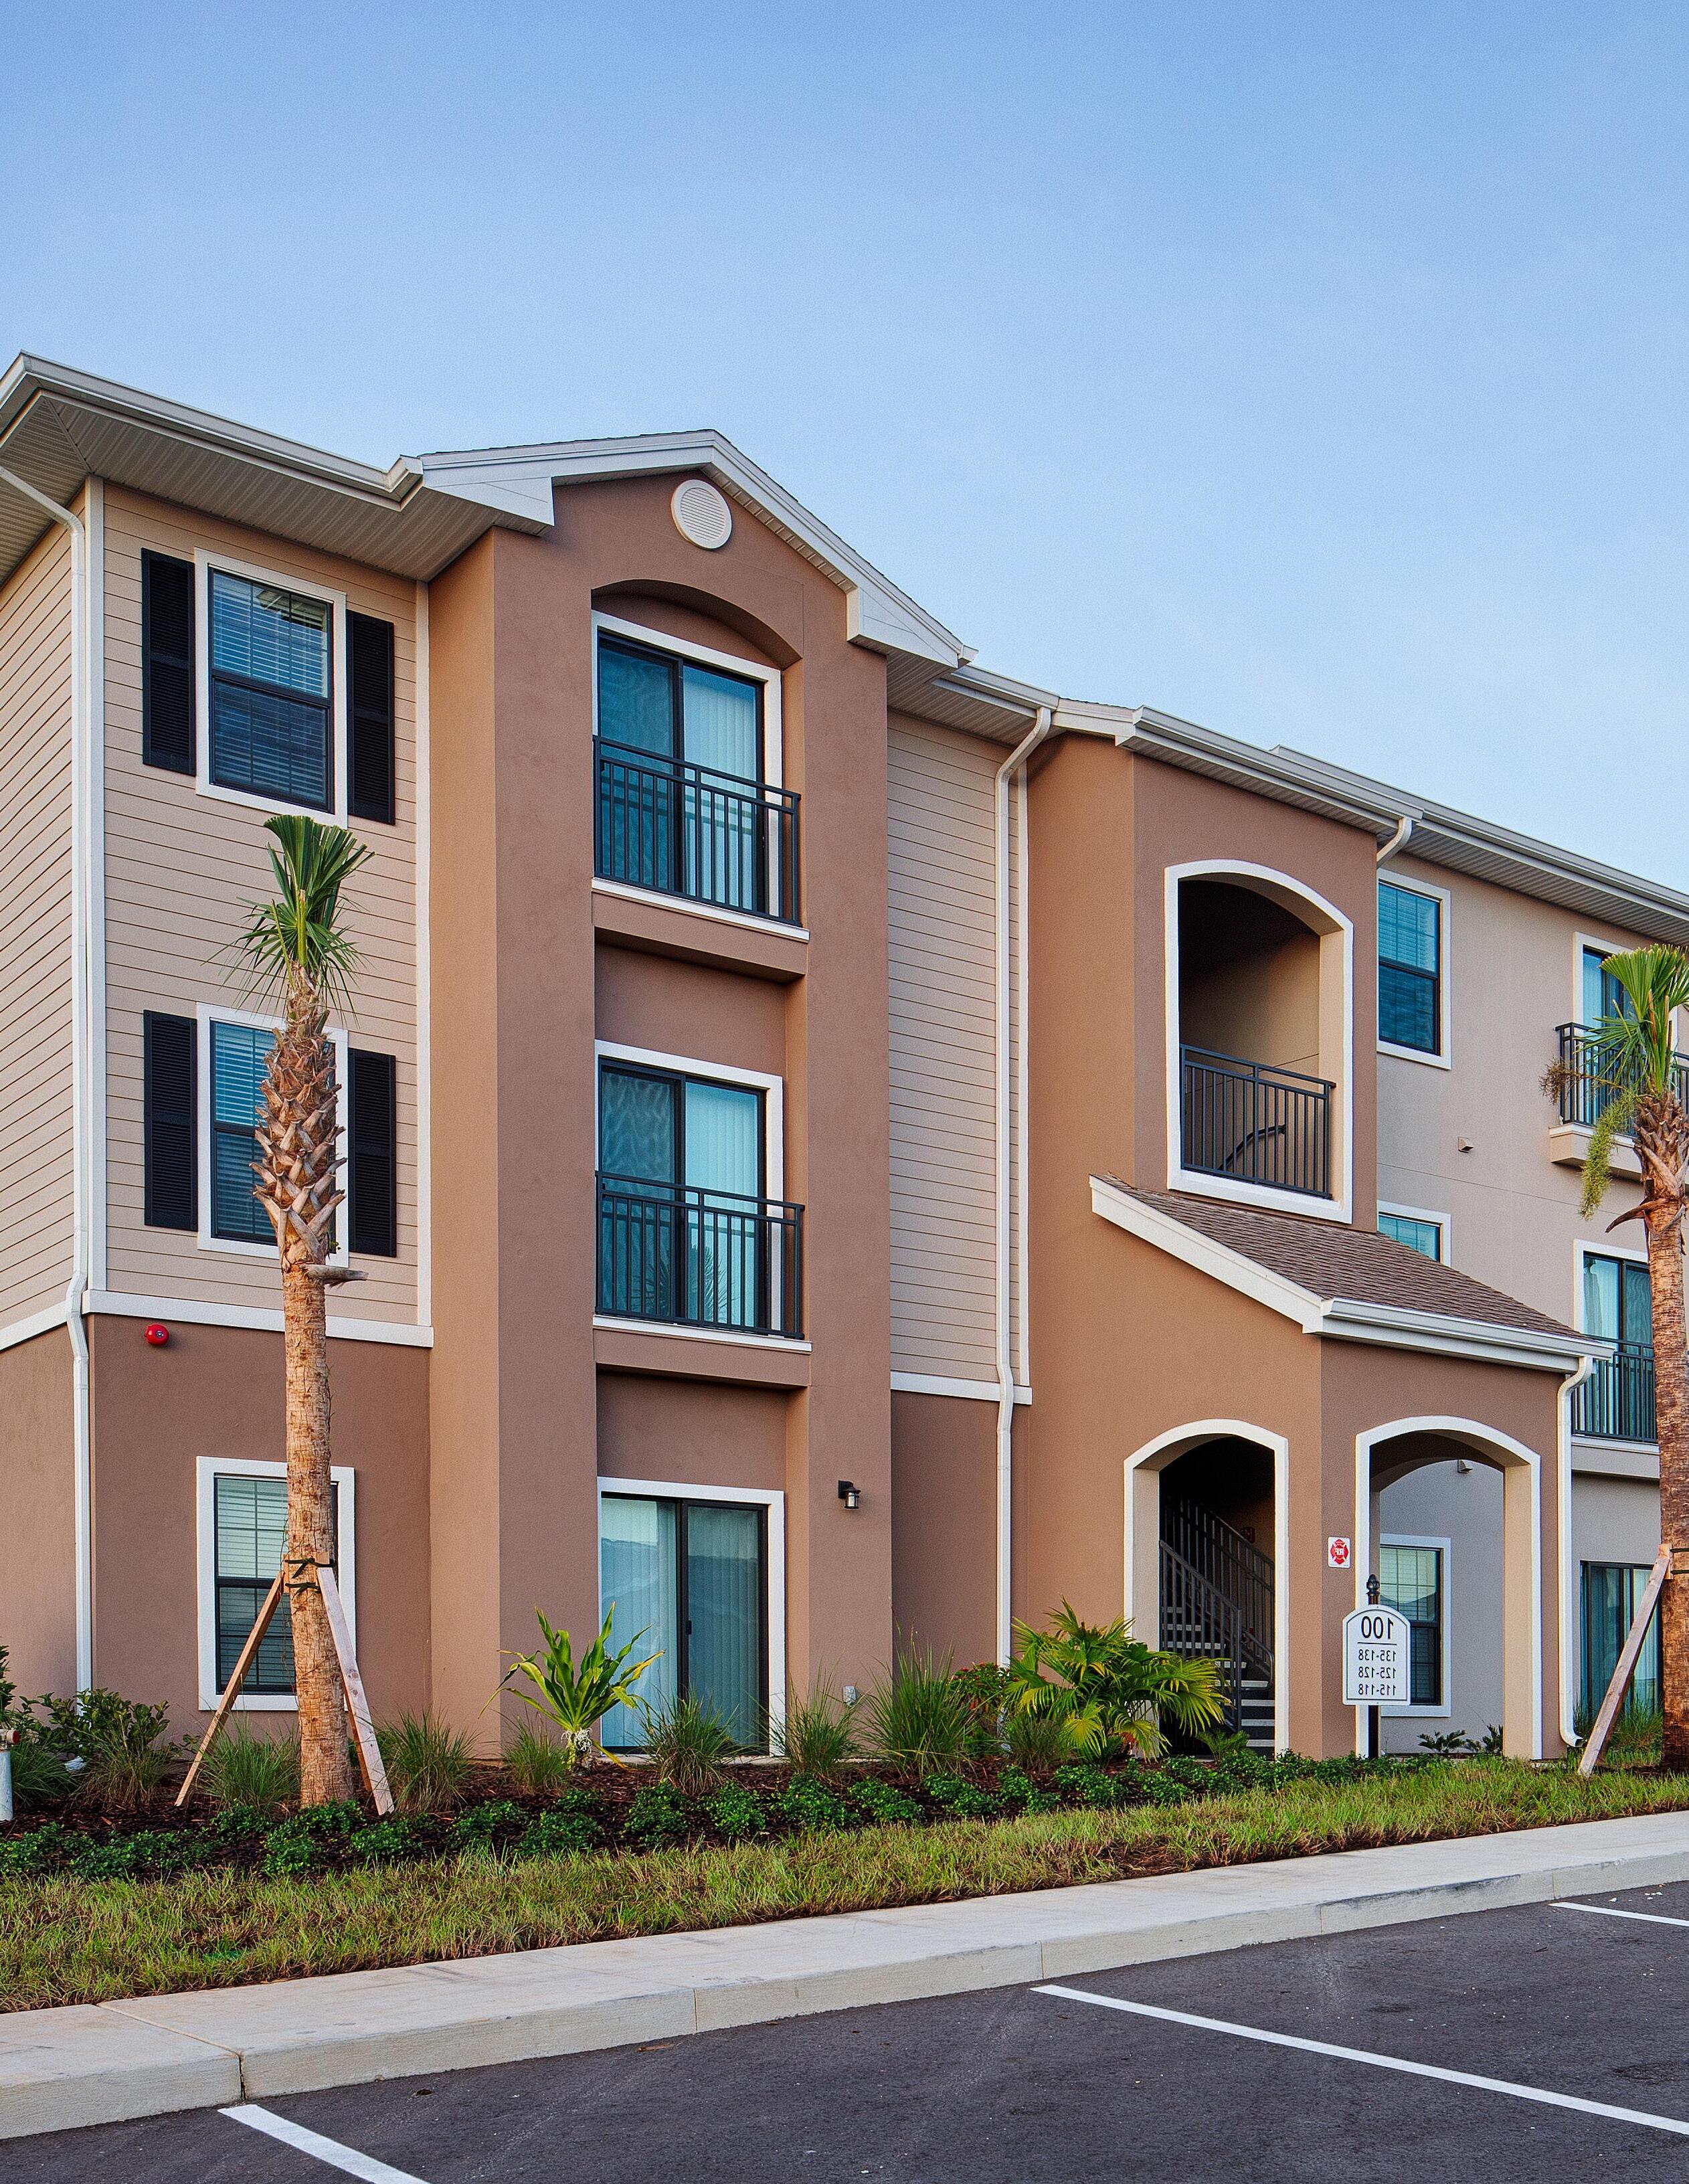
ATTRIBUTION LIST OF PROPERTIES
KENWOOD PLACE COVER
MADISON CROSSING COVER
SABAL PLACE COVER
SAN MARCOS HEIGHTS COVER
ASHLEY SQUARE APARTMENTS COVER
PRESERVE AT EMERALD VILLAS COVER
SABAL PLACE
Page 7
VILLAGE ON WILEY
Page 8
PRIVATE RESIDENCE
Page 13
CITY VISTA APARTMENTS
Page 14
SWEETWATER VILLAS
Page 21
GANNET POINTE
Page 22
KENWOOD PLACE
Page 25
MARY EAVES
Page 26
MAYFAIR VILLAGE
Page 108
SAN MARCOS HEIGHTS
Page 108
BANYAN GROVE RESIDENCES
Page 110
227 North Bronough Street, Suite 5000 Tallahassee, Florida 32301 (850) 488-4197 www.FloridaHousing.org
