In 2021, The Fund for Santa Barbara teamed up with UCSB’s Blum Center on Poverty, Inequality, and Democracy and the USC Equity Research Institute to issue Towards a Just and Equitable Central Coast, a wideranging report on the state of equity in the Central Coast counties of Santa Barbara and Ventura, based on select indicators of economic, social, environmental, and civic well-being. Part of the Central Coast Regional Equity Initiative (CCREI), it draws on US Census and related data to illuminate the challenges faced by low-income communities and people of color in our region, and to guide efforts to achieve a more equitable future.
With this release of Equity Matters 2024, we are expanding the geographic scope of our original analysis to include San Luis Obispo County, providing a fuller picture of trends that span the tri-county region. We also offer the first of what will be periodic updates to the baseline study based on more recently available data. These and related data for the tri-county region will be available on the CCREI website beginning in mid-2025.
In Equity Matters 2024 you’ll find a data-driven narrative that highlights the persistent divide between the “haves” and the “have-nots” in our increasingly diverse region. The working class and BIPOC communities, despite their crucial roles in our tourism and agriculture industries, still contend with lower wages. Housing remains a critical issue, disproportionately affecting low-income communities, while immigrant communities face significant barriers to naturalization.
The FUND for Santa Barbara is honored to support many of the grassroots movements that have shaped the social, economic, racial, and environmental justice landscape in our region. Through grants, capacitybuilding assistance, and coalition building, we are proud to continue fostering collective efforts toward equity.
Equity Matters 2024
Prepared by the UCSB Blum Center on Poverty, Inequality, and Democracy, the Fund for Santa Barbara, and the USC Equity Research Institute.
Foreword
Our goal is not to create division but to provide a broader perspective on our local communities. We aim to foster understanding and promote constructive dialogue. We also recognize that this publication is not exhaustive, and does not include data on the full range of inequities experienced in our region. This is not meant to narrow the scope of the broader initiative. Our aim is to work with the data resources we now have at hand to open the door to a conversation that, with additional inquiry including community-generated sources of data collection, can be the basis of inter-sectoral organizing and collaboration now and in the future.
We are deeply grateful for the generous support of our institutional partners, foundations, and community organizations. Without their commitment and investment, this crucial work would not be possible. A special thank you goes to the UCSB Blum Center on Poverty, Inequality, and Democracy and the USC Equity Research Institute for their invaluable partnership in developing this regional equity study. Their collaboration has enriched this report with rigorous analysis and thoughtful insights.
We look forward to making these data accessible for use in grassroots efforts and policymaking. We hope this report will serve as a benchmark for progress and help advance a shared vision that acknowledges the unique struggles and aspirations of the Central Coast’s communities.
In Community,
Eder Gaona-Macedo Executive Director
The Fund for Santa Barbara
Land Acknowledgement
We acknowledge that the tri-county region of Ventura, Santa Barbara, and San Luis Obispo Counties rests upon the original unceded territory of the Chumash people. We support their efforts to protect the lands and waters that surround us, to sustain ancestral ecological and cultural practices, and to dismantle the legacies of settler colonialism in our region.
Project Acknowledgments
Foundation Support
The Community Foundation San Luis Obispo County
The Gretler Foundation
UCSB Office of the Dean of Social Sciences
The Fund for Santa Barbara
The County of Santa Barbara - County Executive Office
The California Wellness Foundation
Allan Hancock College
Weingart Foundation
Project Members
Principal Author
Alice O’Connor, UCSB Blum Center on Poverty, Inequality & Democracy
Project Contributors
Kashia Arnold, UCSB Blum Center on Poverty, Inequality & Democracy
Alexander Balcazar, USC Equity Research Institute
Becky Chen, UCSB Blum Center on Poverty, Inequality & Democracy
Eder Gaona Macedo, The Fund for Santa Barbara
Jennifer Ito, USC Equity Research Institute
Kathleen Knight, The Fund for Santa Barbara
Joanna Lee, USC Equity Research Institute
Lindsay Miller, UCSB Blum Center on Poverty, Inequality & Democracy
Manuel Pastor, USC Equity Research Institute
Hari Priya Chipiri, UCSB Blum Center on Poverty, Inequality & Democracy
Arpita Sharma, USC Equity Research Institute
Marcos Vargas, The Fund for Santa Barbara
Brenda Vuong, UCSB Blum Center on Poverty, Inequality & Democracy
Table of Contents
Maps
FIGURE 1. MAP OF THE TRI-COUNTY CENTRAL COAST REGION 11
FIGURE 2. MAP OF THE TRI-COUNTY CENTRAL COAST REGION PERCENT PEOPLE OF COLOR BY CENSUS TRACT 12
FIGURE 39. MAP OF ECONOMIC HARDSHIP BELOW 200% BY CENSUS TRACT, CENTRAL COAST 41
FIGURE 43. MAP OF PERCENT OF HOUSEHOLDS RENT BURDENED BY CENSUS TRACT, CENTRAL COAST 45
FIGURE 44. MAP OF POLLUTION BURDEN BY CALENVIROSCREEN 4.0 CUMULATIVE IMPACT SCORE, CENTRAL COAST 46
FIGURE 46 MAP OF PERCENT LINGUISTICALLY ISOLATED HOUSEHOLDS BY CENSUS TRACT, CENTRAL COAST 48
Equity Indicators
FIGURE 3. CHART OF CENTRAL COAST POPULATION BY RACE & ETHNICITY 17
FIGURE 4. CHART OF POPULATION GROWTH BY DECADE, CENTRAL COAST 17
FIGURE 5. CHART OF POPULATION BY RACE/ETHNICITY, VENTURA COUNTY 18
FIGURE 6. CHART OF POPULATION GROWTH OVER TIME, VENTURA COUNTY 18
FIGURE 7. CHART OF POPULATION BY RACE/ETHNICITY, SANTA BARBARA COUNTY 19
FIGURE 8. CHART OF POPULATION GROWTH OVER TIME, SANTA BARBARA COUNTY 19
FIGURE 9. CHART OF POPULATION BY RACE/ETHNICITY, SAN LUIS OBISPO COUNTY 20
FIGURE 10. CHART OF POPULATION GROWTH OVER TIME, SAN LUIS OBISPO COUNTY 20
FIGURE 11. TABLE OF ASIAN AMERICAN OR PACIFIC ISLANDER (AAPI), CENTRAL COAST 21
FIGURE 12. CHART OF NATIVE AMERICAN POPULATION (MULTIRACIAL), CENTRAL COAST 22
FIGURE 13. CHART OF RACE BY NATIVITY, CENTRAL COAST 23
FIGURES 14-16. TABLES OF TOP NON-ENGLISH LANGUAGES SPOKEN BY ENGLISH LEARNER AND FLUENT ENGLISH PROFICIENT STUDENTS, CENTRAL COAST 24
FIGURES 17-19. CHARTS OF RECENCY OF ARRIVAL FOR LPRS & UNDOCUMENTED IMMIGRANTS FOR THE CENTRAL COAST 25
FIGURE 20. CHART OF CHILDREN LIVING W/ UNDOCUMENTED PARENT(S) BY RACE/ETHNICITY, CENTRAL COAST 26
FIGURES 21-23. CHARTS OF MEDIAN AGE BY RACE/ETHNICITY, CENTRAL COAST 27
Equity Indicators
FIGURE 24. CHART OF REAL EARNED INCOME GROWTH, CENTRAL COAST 29
FIGURE 25. CHART OF FRONTLINE OCCUPATIONS BY RACE/ETHNICITY, CENTRAL COAST 30
FIGURE 26. CHART OF FRONTLINE OCCUPATIONS BY GENDER, CENTRAL COAST 31
FIGURE 27. CHARTS OF EDUCATIONAL ATTAINMENT BY RACE/ETHNICITY, VENTURA COUNTY 32
FIGURES 28-29. CHARTS OF EDUCATIONAL ATTAINMENT BY RACE/ETHNICITY, SANTA BARBARA & SAN LUIS OBISPO COUNTIES 33
FIGURES 30-32. CHARTS OF MEDIAN WAGE BY EDUCATIONAL ATTAINMENT & RACE/ETHNICITY & GENDER, CENTRAL COAST 34
FIGURE 33. CHART OF MEDIAN HOURLY WAGE BY IMMIGRATION STATUS, CENTRAL COAST 35
FIGURE 34. CHART OF HOMEOWNERSHIP BY RACE/ETHNICITY, VENTURA COUNTY 36
FIGURES 35-36. CHARTS OF HOMEOWNERSHIP BY RACE/ETHNICITY, SANTA BARBARA & SAN LUIS OBISPO COUNTIES 37
FIGURE 37. CHART OF ECONOMIC HARDSHIP BELOW 200% FPL, CENTRAL COAST 39
FIGURE 38. CHART OF ECONOMIC HARDSHIP BELOW 200% BY RACE, CENTRAL COAST 40
FIGURE 40. CHART OF RENT BURDEN (30%) BY RACE/ETHNICITY, CENTRAL COAST 42
FIGURE 41. CHART OF RENT BURDEN (30%) BY IMMIGRATION STATUS, CENTRAL COAST 43
FIGURE 42. CHART OF PEOPLE IN OVERCROWDED HOUSEHOLDS BY RACE/ETHNICITY AND NATIVITY, CENTRAL COAST 44
FIGURE 45. CHART OF HOUSEHOLDS W/O A HIGH-SPEED INTERNET CONNECTION, A COMPUTER, OR BOTH, CENTRAL COAST 47
FIGURE 47. CHART OF ACTUAL GDP & ESTIMATED GDP W/ RACIAL EQUITY IN THE WORKFORCE (BILLIONS), VENTURA COUNTY 50
FIGURES 48-49. CHART OF ACTUAL GDP & ESTIMATED GDP W/ RACIAL EQUITY IN THE WORKFORCE (BILLIONS), SANTA BARBARA AND SAN LUIS OBISPO COUNTIES 51
FIGURES 50-52. CHARTS OF INCOME GAINS W/ RACIAL EQUITY IN THE WORKFORCE, CENTRAL COAST 52
FIGURES 53-55. CHARTS OF REGISTERED VOTERS; ELIGIBLE VOTER TURNOUT; CITIZEN-VOTING AGE POPULATION, CENTRAL COAST 53
FIGURE 56. CHART OF ELIGIBLE-TO-NATURALIZE IMMIGRANT ADULTS BY RACE, CENTRAL COAST 54
Situated on the southern Central Coast of California, the tri-county region that encompasses Ventura, Santa Barbara, and San Luis Obispo Counties is home to a growing, increasingly racially and ethnically diverse population; a diversified economy rooted in agriculture, tourism, services, aerospace/technology, and energy production that is gradually moving from fossil-fuel to renewable sources; and an extensive network of post-secondary educational institutions.
It is also marked by stark, intersecting inequities that leave large segments of the population struggling to make ends meet including many in the heavily immigrant and Black, Indigenous and People of Color (BIPOC)* working class that sustains the economy. These inequities were brought to the surface in 202021 during the COVID-19 pandemic, which took an especially heavy toll in working class communities of color. But they have origins in structural trends, policies, and practices that have been shaping the region for decades.
A just and equitable region provides all residents with: A standard of living adequate for health, well-being, & human development. Opportunities to contribute to and share in regional prosperity.
Access to a fair and nondiscriminatory system of justice. Equal voice in governance.
*The terms BIPOC (Black, Indigenous and People of Color) and POC (People of Color) are used interchangeably in this Report. For a fuller explanation of these terms, see "Selected Terms and General Notes" in the Appendix.
Equity Matters 2024
Empowering Communities
Documenting, understanding, and empowering communities to take action against these inequities is the central purpose of the Central Coast Regional Equity Initiative (CCREI), a broadly encompassing program of research, policy analysis and advocacy, coalition-building, and community action to advance social, economic, political, and environmental equity in the tri-county region.
Launched in 2019 by the Fund for Santa Barbara and the UCSB Blum Center on Poverty, Inequality, and Democracy, the CCREI is the outgrowth of many years of social and economic justice organizing, activism, and learning in the tri-county area. It recognizes the regional nature of the macroeconomic and labor market, housing, transportation, environmental, and institutional dynamics that shape people’s lives and opportunities in our respective communities and that now call upon us to take a regional approach to advance structurally transformative change.
The initiative is guided by a forward-looking vision that defines a just and equitable region as one in which all residents experience a standard of living adequate for health, well-being, and human development; have opportunities to contribute to and share in regional prosperity; have access to a fair and nondiscriminatory system of justice; and exercise equal voice in governance. It is also motivated by a shared commitment among a broader array of community-based and countylevel organizations to pursuing equity as an achievable set of conditions here on the Central Coast. The CCREI is motivated by a shared commitment to pursuing equity as an achievable set of conditions on the Central Coast.
Equity Matters 2024
In 2020-21 we teamed up with the University of Southern California’s Equity Research Institute (ERI) to produce our first major report, entitled Towards a Just and Equitable Central Coast, released in December 2021. Focused on Ventura and Santa Barbara Counties, it features equity-centered data indicators drawn from a variety of public and private sources, including 5-year averages (2014-18) from the U.S. Census American Community Survey, among others.
Conducted at the height of the COVID-19 pandemic, it also reflects the concerns and priorities expressed by the more than 130 people who participated in one of sixteen community consultations we conducted in preparation for the study, including diverse groups of Central Coast residents, as well as participants reflecting their perspectives and experiences as service providers, educators, leaders of community-based organizations, local government officials, business owners, and social justice grant makers.
The report tracks the structural inequities—in wages and income, housing, access to health and related social protections, and civic access—that made working-class communities of color disproportionately vulnerable to the impact of the COVID-19 pandemic and that otherwise undermine the economic vitality and democratic prospects of our region.
With these baseline indicators of the challenges ahead, we conclude with a framework for ongoing research and action that emphasizes the economic, social, and civic benefits of achieving equity, and outlines a set of principles and priorities to guide our collective work.
Equity Matters 2024
Equity Matters 2024 is a supplement and update to that initial CCREI study in two significant ways. First, it broadens the geographic scope of analysis to include San Luis Obispo as well as Ventura and Santa Barbara counties. For this, we draw on U.S. Census-based and other equity indicator data as well as insights from additional, SLO-based community consultations conducted in the summer of 2023 to present a more comprehensive picture of the tri-county region. Second, it uses data indicators for each of the three counties and for the tri-county region that have been updated from the original study to reflect the latest available data.
The indicators featured in this report are principally based on five-year averages (2017-21) from the U.S. Census American Community Survey, as calculated by ERI, providing a more up-to-date baseline to inform broader efforts to achieve justice and equity region-wide.
Although significant as leading indicators of opportunity and collective well-being, the data points featured in these reports are by no means reflective of the full range of equity concerns in the tri-county region. A number of issues came up in our research and community consultations that call for further exploration—including disparities in financing for K-12 education, the experience of youth in the carceral system, the gaping and racialized wealth gaps that we touch on briefly with respect to homeownership, and ongoing struggles to protect and advance the rights of LGBTQ+ communities, among many others.
By emphasizing a set of structural issues that lend themselves to regional analysis and collaborative action, our aim in these reports has been to lay out the broad parameters of a framework within which these and other issues can be more fully addressed.
Equity Matters 2024 California’s Central Coast: The Tri-County Region
Ventura, Santa Barbara and San Luis Obispo Counties together span more than 7,800 square miles and have a population of more than 1.5 million residents. The region is well-known for its varied topography, featuring mountain ranges, coastal beaches, plains, and hilly terrain, and an abundance of land devoted to agricultural production. Significant portions of the tri-county region are designated as public land, including parks and forests, protected coastal areas, and military bases. The region features a varied social geography as well, including lightly populated rural communities, smaller to mid-size cities, and
unincorporated areas with widely varied resource bases, ranging from some of the lowest to the highest income communities in the state.
Source Figure 1: USC Equity Research Institute analysis of U.S. Census Bureau, 2010 TIGER/Line Shapefiles (machine-readable data files) / prepared by the U.S. Census Bureau, 2023; California Department of Forestry and Fire Protection (2021).
FIGURE 1. MAP OF THE TRI-COUNTY CENTRAL COAST REGION
California’s Central Coast: The Tri-County Region
People of color make up a large and growing proportion of the Central Coast population, reflecting decades of demographic change that have significantly increased the racial and ethnic diversity of the region. Censustract level data show patterns of racial residential segregation throughout the region, with especially high concentrations of POC in or near Oxnard, Santa Paula, and Fillmore in Ventura County; Guadalupe and Santa Maria in northern Santa Barbara County; and in or near Nipomo, Oceano, San Luis Obispo City, and Paso Robles in SLO County (where the overall percentage of POC is smaller).
Notably, census tracts with higher concentrations of POC are also more likely to experience economic hardship and exposure to environmental hazards throughout the region. The most affluent census tracts in the region, by contrast, are predominantly non-Latinx white.
Source Figure 2: USC Equity Research Institute analysis of 2021 5-year American Community Survey summary file from the U.S. Census Bureau and 2010 TIGER/Line Shapefiles (machine readable data files) / prepared by the U.S. Census Bureau, 2023. Note: Data represent a 2017 through 2021 average. Channel Islands (Santa Cruz, Santa Rosa, San Miguel, San Nicolas, Anacapa, and Santa Barbara islands) were not included in the maps because the population sizes of residents living on the islands were too small to provide accurate estimates Maps are based on 2020 census tracts which are different from the maps in the previous report which were based on 2010 tracts.
FIGURE 2. MAP OF THE TRI-COUNTY CENTRAL COAST REGION PERCENT PEOPLE OF COLOR BY CENSUS TRACT
California’s Central Coast: The Tri-County Region
Across this varied geographic and social landscape, there are elements of a cohesive regional experience that also create openings for cross-county organizing and change.
The region occupies the unceded ancestral lands of the Native Chumash people, whose presence dates back more than 13,000 years. As the original human inhabitants of lands that long predate European settlement, the Chumash bring centuries of ancestral knowledge and ecological practice to contemporary environmental protection, and to advancing Indigenous people’s rights.
The tri-counties share political representation in California’s 24th U.S. Congressional district, which encompasses all of Santa Barbara County and significant parts of San Luis Obispo and Ventura counties. The region is represented at the state level as part of the California State Assembly’s recently inaugurated Central Coast Legislative Caucus.
The essential integrity of the tri-county economy has been recognized in initiatives such as Uplift Central Coast, a broad-based coalition convened by economic planning agencies to promote equitable and sustainable development opportunities throughout the region.
Especially significant for the CCREI, the tricounty region faces a number of structural and political challenges. Such challenges have led to growing recognition of the need for what one participant in our SLO consultation referred to as “regionalism by necessity,” as addressing inequities in one county is not enough to respond to the challenges of work, housing, transportation, social services, and political representation that extend throughout the region.
California’s Central Coast: The Tri-County Region
Participants in our community consultations singled out a number challenges that call out for region-wide action, including:
A wage and compensation structure that systematically undervalues the labor of workers who make the region’s prosperity and well-being possible, generating widespread economic hardship among working-class households;
A crisis of housing affordability that is experienced most acutely by low-wage earners but affects younger and middle-class households as well, leading to increased economic stress, overcrowding, ever lengthening commutes, and rising vulnerability to houselessness;
A lack of adequate social and legal supports for the region’s immigrant communities, especially those facing barriers related to language and/or legal status that deny them access to adequate compensation, services, and political representation required to secure their essential rights and needs;
Vulnerabilities to environmental hazards, related to industry practices as well as climate change, that are disproportionately experienced by working class communities of color and that call for a just transition to a sustainable economic and energy future;
Racial and ethnic disparities in political representation and participation that deny communities of color a fully empowered voice in shaping local, state, and federal policy priorities.
California’s Central Coast: The Tri-County Region
Regional Organizing
Organizing in the region is supported by a robust ecosystem of community, labor, environmental, BIPOC, immigrant rights, and LGBTQ+ organizations, and by social justice funders committed to building capacity for coalitional advocacy and power-building within and across county lines.
Among frequently-cited examples of cross-county learning and coalition building is the creation of the Ventura and Santa Barbara-based 805UndocuFund in 2018 by the Central Coast Alliance United for a Sustainable Economy (CAUSE), Future Leaders of America (FLA), and Mixteco Indigenous Community Organizing Project (MICOP), and subsequently of SLO County UndocuSupport in 2020. Together, they provide vital assistance to local undocumented immigrants suffering losses due to the disasters of wildfires, mudslides, and the COVID-19 pandemic but excluded from federally funded safety-net and disaster-relief programs. While recognizing its importance and growing potential, participants in our consultations acknowledged that creating the infrastructure for tri-county regional collaboration and coalition-building remains a work in progress.
Demographics
The tri-county region is a racially and ethnically diversifying region, and will be for decades to come.
The region’s BIPOC population is expected to rise from 52 percent in 2021 to just over 70 percent of the total population by 2060.
San Luis Obispo County remains majority non-Latinx white (67 percent) but has seen a significant rise in racial and ethnic diversity in recent decades, due principally to its growing Latinx population.
Nearly one in five tri-county residents are immigrants.
Fourteen percent of the tri-county region’s residents are either immigrants with undocumented status or live in a household with someone of undocumented status.
Demographics A Diverse and
Diversifying
Region
The tri-county region has experienced a major demographic transformation in recent decades, shifting from a majority non-Latinx white to a majority BIPOC population since 1980. In 2021, 52 percent of the region’s total population was BIPOC, a proportion that is projected to exceed 70 percent by 2060. The region’s population growth has been driven by an increase in the BIPOC population, which has grown by more than 575,000 since 1980, while the non-Latinx white population has gradually declined since 1990.
Source Figure 3, Top: USC Equity Research Institute analysis of U.S. Census Bureau, 1980, 1990, 2000, 2010, and 2020 Decennial Census summary files, 2017 National Population Projections; Woods & Poole Economics Inc., 2010 Complete Economic and Demographic Data Source; and 2010, and 2017-2021 American Community Survey 5-year samples. Note: Much of the increase in the mixed/other population between 1990 and 2000 is due to a change in the survey question on race
Source Figure 4, Bottom: USC Equity Research Institute analysis of 1980, 1990, and 2000 Decennial Census summary files and the 2021 American Community Survey 5-year summary file from the U.S. Census Bureau. Note: Data for 2021 represent a 2017 through 2021 average.
FIGURE 3. CHART OF CENTRAL COAST POPULATION BY RACE & ETHNICITY
FIGURE 4. CHART OF POPULATION GROWTH BY DECADE, CENTRAL COAST
Demographics
Population Trends: Ventura County
The region’s racial and ethnic diversification has been more pronounced in Ventura and Santa Barbara counties, which became majority BIPOC in the first decade of the 21st century, aligning with trends in California and anticipating a broader shift in the overall U.S. population projected for 2050.
The BIPOC population in Ventura County increased from 43 percent to 56 percent between 2000 and 2021 and from 43 to 57 percent in Santa Barbara County, mainly due to the growth in the number of Latinx and Asian American or Pacific Islander residents.
FIGURE 5. LEFT: CHART OF POPULATION BY RACE/ETHNICITY, VENTURA COUNTY;
FIGURE 6. RIGHT: CHART OF POPULATION GROWTH OVER TIME, VENTURA COUNTY
Source Figure 5, Left: USC Equity Research Institute analysis of 1980, 1990, 2000 and 2010 Decennial Census summary files and the 2021 American Community Survey 5-year summary file from the U S Census Bureau. Note: Data for 2021 represent a 2017 through 2021 average
Source Figure 6, Right: USC Equity Research Institute analysis of 2000 Decennial Census summary files and the 2021 American Community Survey 5-year summary file from the U S Census Bureau Note: Data for 2021 represent a 2017 through 2021 average
Demographics
Population Trends: Santa Barbara County
SANTA BARBARA COUNTY
FIGURE 7. CHART OF POPULATION BY RACE/ETHNICITY,
Source Figure 7: Source: USC Equity Research Institute analysis of 1980, 1990, 2000 and 2010 Decennial Census summary files and the 2021 American Community Survey 5-year summary file from the U.S. Census Bureau. Note: Data for 2021 represent a 2017 through 2021 average
FIGURE 8. CHART OF POPULATION GROWTH OVER TIME, SANTA
BARBARA COUNTY
Source Figure 8: USC Equity Research Institute analysis of 2000 Decennial Census summary files and the 2021 American Community Survey 5-year summary file from the U.S. Census Bureau. Note: Data for 2021 represent a 2017 through 2021 average
Demographics
Population Trends: San Luis Obispo County
Demographic shifts have been more gradual in San Luis Obispo County, which remains majority (67%) non-Latinx white but has seen a significant increase in its BIPOC population. One in three San Luis Obispo County residents were BIPOC in 2021, compared to about one in four residents in 2000. This growth has been especially significant in the county’s Latinx community, which increased from 10 percent in 1980 to 23 percent in 2021. The Asian American or Pacific Islander population has represented a comparatively smaller proportion of the county’s population, but the number of AAPI residents has grown by 50 percent since 2000.
FIGURE 9. LEFT: CHART OF POPULATION BY RACE/ETHNICITY, SAN LUIS
OBISPO COUNTY;
FIGURE 10. RIGHT: CHART OF POPULATION GROWTH OVER TIME, SAN LUIS OBISPO COUNTY
Source Figure 9 Left: USC Equity Research Institute analysis of 1980, 1990, 2000 and 2010 Decennial Census summary files and the 2021 American Community Survey 5year summary file from the U.S. Census Bureau Note: Data for 2021 represent a 2017 through 2021 average.
Source Figure 10 Right: USC Equity Research Institute analysis of 2000 Decennial Census summary file and the 2021 American Community Survey 5-year summary file from the U.S. Census Bureau. Note: Data for 2021 represent a 2017 through 2021 average. The non-Hispanic Black population in San Luis Obispo is small, leading to significant changes in the percentage over time
Demographics
It is important to note that there is considerable diversity within these U.S. Census racial and ethnic designations. The majority of the region’s Latinx population is of Mexican descent, but large numbers of migrants from Mexico are from indigenous communities in Oaxaca, Guerrero, and Michoacán. The Asian American or Pacific Islander category encompasses an extraordinarily diverse array of sub-groups, with heaviest representation from people of Filipino (23%), Chinese (18%), and South Asian Indian (14%) descent, but substantial numbers from other AAPI groups as well.
It is also worth taking note of the striking increases in numbers of residents identifying as being of mixed race across the region, which grew by 59 percent, 75 percent, and 108 percent in Santa Barbara, Ventura, and San Luis Obispo Counties, respectively, between 2000 and 2021. Though picking up on an important element of the region’s demographic diversification, these large increases are more likely attributable to recent changes in the way the U.S. Census Bureau surveys and measures mixed race status than to growth in the numbers of new mixed-race residents entering the tri-county area. As discussed below, these changes must also be considered when interpreting reported declines in the Native American population across the region.
FIGURE 11. TABLE OF ASIAN AMERICAN OR PACIFIC ISLANDER (AAPI), CENTRAL COAST
Demographics
Population Trends: Native Americans
Estimating the region’s Native American population with U.S. Census data can be challenging, due to measurement protocols that, left unexamined, can lead to serious undercounts.* Thus, the number of people who reported being Native American as their single racial identity declined across the tricounty region between 1980 and 2021 from 7,000 residents to 4,000 residents, representing declines ranging from 28 percent to 42 percent in each of the three counties as indicated in figures 6, 8, and 10.
However, across the tri-county region—as in California and the U.S. more widely considerably larger numbers of Native Americans identify as multiracial compared to those reporting a single race.
There are nearly 39,700 Native American residents reporting either multiracial or single race identity in the Central Coast. Overall, the tri-county region is home to 4 percent of the state’s multiracial Native American population.
*For more on this and related issues of measurement, see https://www.brookings.edu/articles/why-the-federal-government-needs-to-change-how-itcollects-data-on-native-americans/.
FIGURE 12. CHART OF NATIVE AMERICAN POPULATION (MULTIRACIAL), CENTRAL COAST
Source Figure 12: USC Equity Research Institute analysis of 2021 5-year American Community Survey microdata from IPUMS USA Note: The term multiracial includes individuals who reported a single race alone (e.g., American Indian and Alaska Native) and people who reported that race in combination with one or more of the other major race groups (e.g., white, Black or African American, Asian, Native Hawaiian and Other Pacific Islander, and Some Other Race). For example, this could include someone with a Native American mother and a Black father. This definition captures the maximum number of people who identified as part of a given racial group whether alone or in combination with other races
Demographics
Population Trends: Immigrant Communities
Demographic breakdowns by race and nativity indicate that immigrants make up just under 20 percent of the tri-county region’s population. Latinx immigrants constitute the largest foreign-born group (13 percent of the total population), followed by Asian American immigrants and white immigrants at three percent each. Approximately 68 percent of the region’s Latinx residents were born in the U.S. The U.S.-born Latinx population comprises 28 percent of the overall population. The region’s Asian immigrant population is slightly larger than the U.S.-born Asian population (3 percent and 2 percent of the total, respectively).
Source Figure 13: USC Equity Research Institute analysis of 2021 5-year American Community Survey microdata from IPUMS USA.
Note: Data represent a 2017 through 2021 average.
FIGURE 13. CHART OF RACE BY NATIVITY, CENTRAL COAST
Demographics
Population Trends: Language and Immigration
FIGURES
14-16.
TABLES OF TOP NON-ENGLISH LANGUAGES SPOKEN BY ENGLISH LEARNER AND FLUENT ENGLISH PROFICIENT STUDENTS, CENTRAL COAST
The immigrant community’s internal diversity is reflected in the variety of primary languages spoken in tricounty households, including Spanish, Mixteco, Tagalog, Vietnamese, Mandarin, and Arabic, among many others. Data from the California Department of Education show that Spanish and Mixteco are the principal non-English languages spoken by the nearly 95,000 English learner and fluent English proficient K-12 students in the region.
Source Figures 14-16: USC Equity Research Institute analysis of the California Department of Education, Educational Demographics Office, 2022-2023 Universe includes all English Learners and Fluent English Proficient Students enrolled in school. An English Learner student is defined as a student in grades K-12 for whom there is a report of a language other than English on the Home Language Survey (HLS) and who, upon assessment and from additional information when appropriate, is determined to lack the clearly defined English language skills of listening, speaking, reading, and/or writing necessary to succeed in the school’s regular instructional programs. English Learner students can then be reclassified later along during their academic career when they demonstrate the necessary criteria for Fluent English Proficient status.
Demographics
Population Trends: Immigrant Communities
The tri-county region’s immigrant community includes naturalized citizens, lawful permanent residents (LPRs), and people with undocumented status. It is also common for households to include members of varied immigration status, both in the region and statewide. Approximately 219,800 (14 percent) of the Central Coast region’s residents are undocumented or living with an undocumented family member, with higher percentages in Ventura (14%) and Santa Barbara (18%) counties than in San Luis Obispo County (6%). The vast majority of the region’s undocumented residents—between 70 and 78 percent in each county have been living, working, and raising families in the U.S. for more than a decade.
FIGURES 17-19. CHARTS OF RECENCY OF ARRIVAL FOR LPRS & UNDOCUMENTED IMMIGRANTS FOR THE CENTRAL COAST
Sources Figures 17-19: USC Equity Research Institute analysis of 2021 5-year American Community Survey microdata from IPUMS USA and the 2014 Survey of Income and Program Participation from the US Census Bureau. Note: Data represent a 2017 through 2021 average. See for details on estimates of the undocumented LPR population here: https://dornsife usc edu/eri/wp-content/uploads/sites/41/2023/10/Estimating Immigrants by Status in the ACS Microdata pdf
Demographics
Population Trends: Children and Undocumented Parents
Data on mixed-status among families show that many Latinx and Asian American youth under the age of 18 live with one or more undocumented parent. Within the region, Santa Barbara County has the highest percentage of children living with one or more undocumented parent (28 percent), followed by Ventura (19 percent) and San Luis Obispo (11 percent).
FIGURE 20. CHART OF CHILDREN LIVING W/ UNDOCUMENTED PARENT(S) BY RACE/ETHNICITY, CENTRAL COAST
Source Figure 20: USC Equity Research Institute analysis of 2021 5-year American Community Survey microdata from IPUMS USA and the 2014 Survey of Income and Program Participation from the US Census Bureau Note: Data represent a 2017 through 2021 average See for details on estimates of the undocumented LPR population here: https://dornsife usc edu/eri/wpcontent/uploads/sites/41/2023/10/Estimating Immigrants by Status in the ACS Microdata.pdf. Universe: Children under 18 in grades K-12.
Demographics
Population Trends: Median Age
Median age varies somewhat across the tri-county region, with Ventura (39) and San Luis Obispo (40) averaging somewhat above California’s median age (37) and Santa Barbara (34) falling below. Especially notable in all three counties is the median age gap between whites and nonwhite groups. White median ages are at or approaching ten years older than those for Latinx residents, the largest and fastest-growing population group in the region. This only reinforces the importance of closing racial and ethnic equity gaps--in education, jobs and wages, civic engagement, and overall well-being--as matter of justice, and an investment in the region’s collective prosperity.
FIGURES 21-23. CHARTS OF MEDIAN AGE BY RACE/ETHNICITY, CENTRAL COAST
Economic Opportunity Highlights
The region’s demographic transformations have emerged in the context of steadily rising economic inequality in the U.S., California, and the Central Coast since 1980, which has left people in the bottom half of the income distribution with stagnant or declining wages and increasingly limited opportunities.
Workers of color, immigrants, and women of all races are concentrated in lower-paid “frontline” occupations in the agricultural, hospitality, and service sectors that have been essential to sustaining regional prosperity and wellbeing, even as these jobs pay below living wages.
Differences in educational attainment contribute to economic disparities in the region, but race- and gender- based wage differentials persist at the same levels of educational achievement.
Economic Opportunity
Widening Divides
The region’s escalating inequality is rooted in an increasingly polarized economy marked by large gains for those at the very top of the income and wage distribution and slower growth or outright declines for those in the 50th percentile of earners and below. The disparities are especially sharp in Santa Barbara County, where the highest-income earners saw income gains (38 percent) that exceeded those for top earners in the U.S. as a whole (26 percent), while the lowest earners saw their incomes shrink by 12 percent, exceeding nation-wide declines. San Luis Obispo County earners realized real wage gains at all income levels, while also witnessing widening disparities, with top earnings gains that far exceeded national rates.
Source Figure 24: USC Equity Research Institute analysis of 1980, 1990 and 2000 Decennial Census (5 percent sample) and the 2021 American Community Survey 5-year microdata from IPUMS USA Note: Universe includes civilian noninstitutional full-time wage and salary workers ages 25 through 64. Data for 2021 represent a 2017 through 2021 average. The income data from the 1980 Decennial Census reflects the preceding year.
FIGURE 24. CHART OF REAL EARNED INCOME GROWTH, CENTRAL COAST
Economic Opportunity
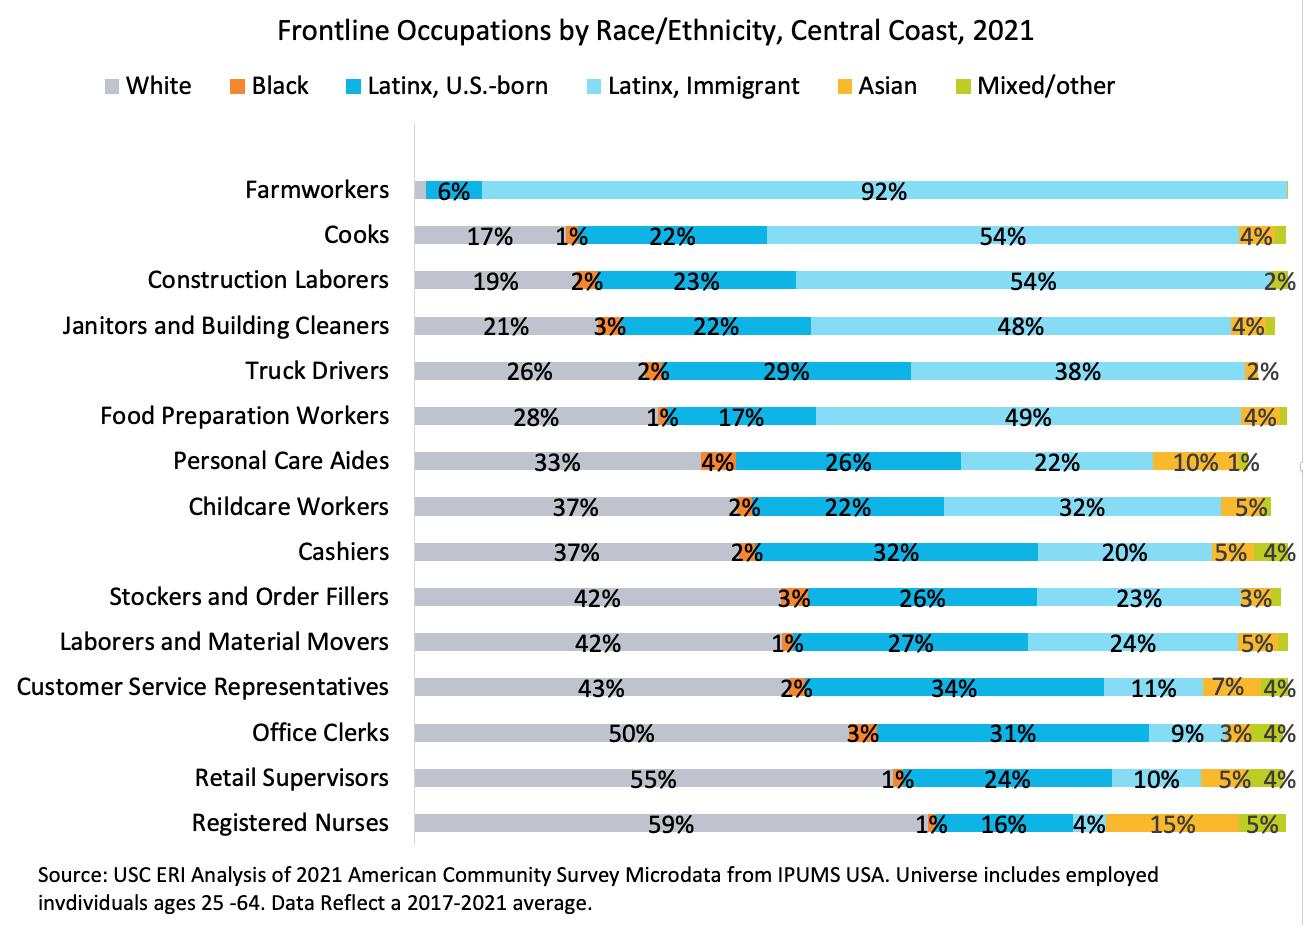
Frontline Occupations: Race and Ethnicity
Workers of color in the tri-county region are concentrated in low-wage frontline occupations that generally offer few if any benefits and limited opportunities for advance. This took on special relevance during the COVID-19 pandemic, when workers in these occupations faced added risk of either job loss or designation as “essential” workers with inadequate protection against exposure, but it is a matter of longstanding concern for labor and economic justice advocates in the region. Workers of color make up large majorities of farmworkers (99 percent), cooks (83 percent), construction workers (81 percent), janitors and building cleaners (79 percent), and food preparation workers (72 percent), with Latinx workers comprising the largest percentages for each of these occupations.
FRONTLINE OCCUPATIONS BY RACE/ETHNICITY, CENTRAL COAST
Source Figure 25: USC Equity Research Institute Analysis of 2021 American Community Survey Microdata from IPUMS USA Universe includes employed individuals aged 25-64. Data reflect a 2017-2021 average
FIGURE 25. CHART OF
Economic Opportunity
Frontline Occupations: Gender
Frontline occupations in the tri-county region are stratified by gender as well as race. Women make up the majority of workers in select frontline occupations in the care economy, accounting for 94 percent of child care workers, 86 percent of registered nurses, and 85 percent of personal care aides. Men hold the majority of what are considered frontline jobs related to logistics or construction. For example, they make up 99 percent of construction laborers, 95 percent of truck drivers, and 79 percent of laborers and material movers.
BY GENDER, CENTRAL COAST
Source Figure 26: USC Equity Research Institute Analysis of 2021 American Community Survey Microdata from IPUMS USA Universe includes employed individuals aged 25-64. Data reflect a 2017-2021 average
FIGURE 26. CHART OF FRONTLINE OCCUPATIONS
Economic Opportunity
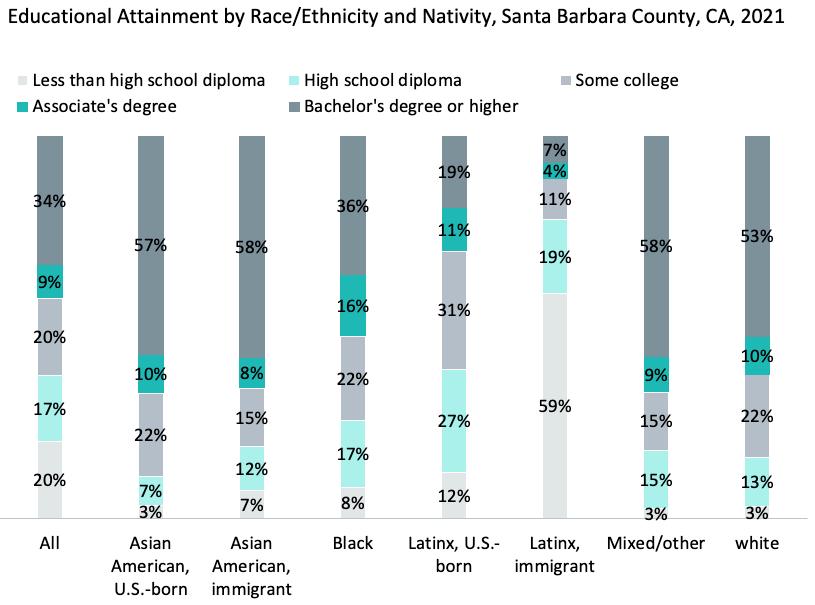
Educational Attainment
Educational attainment in the tri-county region varies widely by race and nativity. Latinx immigrants are more likely than average to have less than a high school degree, and U.S.-born Latinx and Black residents are generally less likely to hold a bachelor’s degree or higher. There are notable disparities among Asian American subgroups as well, with Filipino and Vietnamese residents experiencing lower rates of educational attainment than overall Asian American averages.
FIGURE 27. CHARTS OF EDUCATIONAL ATTAINMENT BY RACE/ETHNICITY, VENTURA COUNTY
Source Figure 27: USC Equity Research Institute analysis of 2021 5-year American Community Survey microdata from IPUMS USA. Note: Universe includes all persons ages 25 through 64. Data represent a 2017 through 2021 average.
Economic Opportunity
Education and Race and Ethnicity
FIGURES 28-29. CHARTS OF EDUCATIONAL ATTAINMENT BY RACE/ETHNICITY, SANTA BARBARA & SAN LUIS OBISPO COUNTIES
Source Figures 28-29: USC Equity Research Institute analysis of 2021 5-year American Community Survey microdata from IPUMS USA Note: Universe includes all persons ages 25 through 64. Data represent a 2017 through 2021 average.
Economic Opportunity
Education & Wages
FIGURES 30-32. CHARTS OF MEDIAN WAGE BY EDUCATIONAL ATTAINMENT & RACE/ETHNICITY & GENDER, CENTRAL COAST
Educational differentials are not enough to explain race and gender gaps in wages in the tri-county region, which persist at the same levels of educational attainment. Women of color consistently earn less than their white and/or male counterparts with the same educational background, while the wage advantages are far higher for white men than for women and for men of color at each level of educational attainment.
Source Figures 30-32: USC Equity Research Institute analysis of the 2021 5-year American Community Survey microdata from IPUMS USA Note: Universe includes civilian noninstitutional full-time wage and salary workers ages 25-64. Values are in 2021 dollars. Data reflect a 2017 through 2021 average Missing data is due to insufficient sample size
Economic Opportunity
Immigration and Wages
Wages vary widely by immigration status in the tri-county region. Median hourly wage gaps range from $7 to $10 dollars for all immigrant workers, while undocumented immigrant workers experience wage deficits of $12 to $13 dollars per hour on average. Median wages for U.S.-born and naturalized U.S. citizens are considerably higher than for all non-citizen immigrants.
FIGURE 33. CHART OF MEDIAN HOURLY WAGE BY IMMIGRATION STATUS, CENTRAL COAST
Source Figure 33: USC Equity Research Institute analysis of the 2021 5-year American Community Survey microdata from IPUMS USA. Note: Universe includes civilian non-institutionalized full-time wage and salary workers ages 25 through 64. Values are in 2021 dollars Data reflect a 2017-2021 average. Technical Appendix for details on estimates of the undocumented and LPR population See for details on estimates of the undocumented LPR population here: https://dornsife.usc.edu/eri/wpcontent/uploads/sites/41/2023/10/Estimat ing Immigrants by Status in the ACS Mi crodata.pdf. Missing data is due to insufficient sample size.
Economic Opportunity
Homeownership
Overall homeownership rates are generally at or somewhat higher in the tri-county region than statewide, particularly for white and Asian American households in Ventura and San Luis Obispo counties. But racial disparities are considerable, with Latinx and Black households showing rates of homeownership that are far lower than white and Asian American households, and below state and national averages.
These disparities are longstanding and have persisted throughout the decades, leaving these communities of color at a structural disadvantage with regard to ownership and the comparative economic stability and generational wealth-building opportunities it presents.
FIGURE 34. CHART OF HOMEOWNERSHIP BY RACE/ETHNICITY, VENTURA COUNTY
Source Figure 34: USC Equity Research Institute analysis of 1980, 1990 and 2000 Decennial Census (5 percent sample) and the 2010 and 2021 American Community Survey 5-year microdata from IPUMS USA.
Note: Universe includes all owner-occupied households. Data for 2010 represents 2006-2010 and 2021 represents a 20172021 average. Missing data is due to insufficient sample size
Economic Opportunity
Homeownership
FIGURES 35-36. CHARTS OF HOMEOWNERSHIP BY RACE/ETHNICITY, SANTA BARBARA & SAN LUIS OBISPO COUNTIES
Source Figures 35-36: USC Equity Research Institute analysis of 1980, 1990 and 2000 Decennial Census (5 percent sample) and the 2010 and 2021 American Community Survey 5-year microdata from IPUMS USA. Note: Universe includes all owner-occupied households. Data for 2010 represents 2006-2010 and 2021 represents a 2017-2021 average Missing data is due to insufficient sample size.
Vulnerable Households
The region’s structural inequities have contributed to racial and ethnic disparities in a number of socioeconomic outcomes that have left communities of color struggling to meet essential needs.
More than half of all renter households are rent-burdened in the tricounty region, paying more than 30 percent of monthly earnings in rent. 28 percent of renter households are severely rent burdened, paying more than 50 percent of earnings in rent--a burden that weighs most heavily on communities of color.
The region’s Black and Latinx households are disproportionately disadvantaged by the digital divide, contributing to racial disparities in access to services, educational resources, and civic participation.
Vulnerable Households
Economic Hardship
Between one-quarter and one-third of households in the tri-county region are living in economic hardship, meaning that they are struggling to meet essential needs with incomes at or below 200% of the federallydefined Federal Poverty Line (FPL). To grasp the extent of hardship that is being captured in this measure, consider that 200% of the FPL was just under $53,000 annually for a family of four in 2021. In contrast, the United Ways of California have calculated the Real Cost Measure for meeting basic needs in the Central Coast region at $100,400 annually for a family of four, based on the actual costs of housing, food, health care, child care, and transportation, among other basic needs.
FIGURE 37. CHART OF ECONOMIC HARDSHIP BELOW 200% FPL, CENTRAL COAST
Source Figure 37: USC Equity Research Institute analysis of 1980, 1990 and 2000 Decennial Census (5 percent sample) and the 2010 and 2021 American Community Survey 5-year microdata from IPUMS USA. Note: Universe includes all people for whom poverty is determined. Data for 2010 represents a 2006 through 2010 average and 2021 represents a 2017 through 2021 average. We defined economic hardship as those with family incomes at or below 200 percent of the federal poverty level. The federal poverty threshold in 2021 for a family of four with two children was about $26,500 (thus, 200 percent of the federal poverty threshold was about $53,000). Poverty Guidelines provided by the U.S. Department of Health and Human Services, see here for further details: https://aspe hhs gov/2021-povertyguidelines.
Vulnerable Households
Economic Hardship
Although all racial groups experience high levels of economic hardship in the region, rates for Latinx households are considerably higher than average in each of the three counties.
FIGURE 38. CHART OF ECONOMIC HARDSHIP BELOW 200% BY RACE, CENTRAL COAST
Source Figure 38: USC Equity Research Institute analysis of 2021 5-year American Community Survey microdata from IPUMS USA Note: Universe includes all people for whom poverty is determined. Data represent a 2017 through 2021 average.We defined economic hardship as those with family incomes at or below 200 percent of the federal poverty level. The federal poverty threshold in 2021 for a family of four with two children was about $26,500 (thus, 200 percent of the federal poverty threshold was about $53,000). Poverty Guidelines provided by the U.S. Department of Health and Human Services, see here for further details: https://aspe.hhs.gov/2021-poverty-guidelines. Missing data is due to insufficient sample size.
Vulnerable Households
Economic Hardship
Economic hardship is also geographically concentrated in the region. In Ventura County, 39 percent of Santa Paula residents experience economic hardship, as do 36 percent of residents in Port Hueneme and Oxnard, and 30 percent of residents in Piru. In Santa Barbara County, Isla Vista (87 percent) New Cuyama (50 percent), Guadalupe (50 percent), Santa Maria (44 percent), and Lompoc (39 percent) experience the highest rates of economic hardship. In San Luis Obispo County, the cities of San Miguel, San Luis Obispo, and Santa Margarita experience economic hardship levels higher than the county rate at 48, 43, 37 percent respectively.
FIGURE 39. MAP OF ECONOMIC HARDSHIP BELOW 200% BY CENSUS TRACT, CENTRAL COAST
Source Figure 39: USC Equity Research Institute analysis of the 2021 5-year American Community Survey microdata from IPUMS USA and 2010 Tiger/Line Shapefiles (machine readable data files) / prepared by the U.S. Census Bureau, 2023. Note: Universe includes all people for whom poverty is determined. Data for 2017 represent a 2017 through 2021 average Santa Cruz, Santa Rosa, San Miguel, San Nicolas, and Santa Barbara islands estimates were not included because the population sizes of residents living on the islands were too small to provide accurate estimates. Poverty Guidelines provided by the U.S. Department of Health and Human Services, see here for further details: https://aspe hhs gov/2021-poverty-guidelines
Vulnerable Households
Unaffordable Housing
The high cost of housing in an exceptional challenge for renter households in the tri-county region. More than half of renter households in all three counties are rent burdened--56 percent in San Luis Obispo and Santa Barbara and 58 percent in Ventura Counties—meaning that they spend more than 30 percent of their income on rent. High rent burdens are experienced by all racial and ethnic subgroups in the region.
FIGURE 40. CHART OF RENT BURDEN (30%) BY RACE/ETHNICITY, CENTRAL COAST
Source Figure 40: 2021 5-year American Community Survey summary file data from the U.S. Census Bureau. Universe includes renteroccupied households paying cash rent (excludes group quarters) Data represent a 2017-2021 average. Missing data is due to insufficient sample size.
Vulnerable Households
Unaffordable Housing
Comparing the experience of high rent burden (more than 30 percent of income on rent) by immigration status underscores the extreme vulnerability of undocumented immigrant households in regional rental markets. 73 percent and 62 percent of undocumented renter households are rent burdened in Ventura and Santa Barbara counties, respectively. A separate analysis indicates that large proportions of all renter households in the region experience severe rent burden (spending more than 50 percent of income on rent). Available data indicate that 27 to 28 percent of all renter households pay more than half their income on rent, while 38 percent of undocumented renter households experience severe rent burden in Ventura County.
FIGURE 41. CHART OF RENT BURDEN (30%) BY IMMIGRATION STATUS, CENTRAL COAST
Source Figure 41: USC Equity Research Institute analysis of 2021 5-year American Community Survey summary file from the U.S. Census Bureau and the 2014 Survey of Income and Program Participation. Data represent a 2017 through 2021 average Note: Universe includes renter-occupied households paying cash rent (excludes group quarters). See for details on estimates of the undocumented LPR population: https://dornsife.usc.edu/eri/wpcontent/uploads/sites/41/2023/10/ Estimating Immigrants by Status i n the ACS Microdata pdf Missing data is due to insufficient sample size.
Vulnerable Households
Unaffordable Housing
The disparate racial impacts of high rent burden are more fully reflected in the experience of overcrowded housing. Latinx residents, both U.S. born and immigrant, are most likely to live in overcrowded households (households with more than one person per room) across the three counties. While the rate of overcrowding is exceptionally high for all groups in Santa Barbara County, it is exceedingly prevalent for Latinx immigrants (45 percent) and U.S. born Latinx residents (35 percent).
FIGURE 42. CHART OF PEOPLE IN OVERCROWDED HOUSEHOLDS BY RACE/ETHNICITY AND NATIVITY, CENTRAL COAST
Source Figure 42: USC Equity Research Institute analysis of 2021 5-year American Community Survey microdata from IPUMS USA. Note: Overcrowding is defined as having more than one person per room. Data reflect a 20172021 average. Missing data is due to insufficient sample size.
Vulnerable Households
Unaffordable Housing
Census-tract level data indicate that the incidence of rent burden is spread throughout most of the tricounty region, but is more concentrated in census tracts with higher percentages of households of color. The incidence of extreme rent burden is concentrated as well, reaching levels upwards of 40 percent in select census tracts in the cities of San Luis Obispo, Guadalupe, Santa Maria, Isla Vista, Santa Paula, and Oxnard. With average rents rising even in areas once considered comparatively affordable, the prospect of finding affordable housing anywhere in the tri-county region is elusive for most low-to-moderate income households.
FIGURE 43. MAP OF PERCENT OF HOUSEHOLDS RENT BURDENED BY CENSUS TRACT, CENTRAL COAST
Source Figure 43: 2021 5-year American Community Survey summary file data from the U S Census Bureau and 2010 TIGER/Line Shapefiles (machine readable data files) / prepared by the U S Census Bureau, 2023 Universe includes renter-occupied households paying cash rent (excludes group quarters).
Note: Rent burden is defined as paying more than 30 percent of gross income on rent. Data represent a 2017-2021 average
Vulnerable Households
Environmental Exposure
The most recently available CalEnviroScreen 4.0 (CES) data indicate that many communities in the tri-county region bear a high pollution burden, based on measures of exposure to environmental hazards and related health and socioeconomic vulnerabilities, with Ventura and Santa Barbara Counties showing the highest numbers of census tracts with the top (above 60 percent) cumulative impact scores.
Throughout the region, the highest levels of pollution burden (above 80 percent) fall disproportionately in communities with higher numbers of people of color, including Oxnard, Santa Paula, and Piru in Ventura County, Guadalupe, Santa Maria, Lompoc, and unincorporated parts of Santa Barbara County, and Nipomo, Oceano, and census tracts in the city of San Luis Obispo.
FIGURE
44. MAP OF
POLLUTION BURDEN BY CALENVIROSCREEN 4.0 CUMULATIVE IMPACT SCORE, CENTRAL COAST
Source Figure 44: USC Equity Research Institute analysis of Cal EnviroScreen 4.0 scores and 2010 TIGER/Line Shapefiles (machine readable data files) / prepared by the U.S. Census Bureau, 2023. Note: Population data used is based on US population data from the 2019 American Community Survey summary file. For the purposes of this analysis, we have taken the CES 4 0 scores for all tracts within San Luis Obispo, Santa Barbara, and Ventura Counties and sorted them into quintiles. Therefore, this map is not reflective of the true CES 4.0 rankings and therefore not indicative of the California Environmental Protection Agency’s Disadvantaged Community status Santa Cruz, Santa Rosa, San Miguel, San Nicolas, and Santa Barbara islands estimates were not included because the population sizes of residents living on the islands were too small to provide accurate estimates. The Disadvantaged Communities designation details are listed here: https://oehha.ca.gov/calenviroscreen/sb535
Vulnerable Households
Digital Access
Household data reveal both significant deficits and racial disparities in tri-county residents’ access to a high-speed internet connection, a computer, or both —otherwise known as the digital divide. Although digital access is now recognized as a basic necessity for connecting to vital services, educational resources, news media, election-related and other dimensions of civic participation,
one-quarter of all households and 35-40 percent of Latinx households in the region are without it. Latinx students are also digitally disadvantaged in comparison to white and Asian American students in grades K-12, with 37 percent of Latinx youth in San Luis Obispo County 35 percent in Santa Barbara County and 30 percent in Ventura County without adequate access.
FIGURE 45. CHART OF HOUSEHOLDS W/O A HIGH-SPEED INTERNET CONNECTION, A COMPUTER, OR BOTH, CENTRAL COAST
Source Figure 45: USC Equity Research Institute analysis of the 2021 5-year American Community Survey microdata from IPUMS USA. Data reflect a 20172021 average.
Vulnerable Households
Linguistic Isolation
Limited English proficiency is another barrier to services, education, and civic participation in the tri-county region. Significant numbers of immigrant households are linguistically isolated, meaning that there is no person over 14 who can speak English at a high level of proficiency. While Spanish is the most frequently-spoken non-English primary language in the region, many of these households primarily speak Mixtec, Zapoteco, Purepecha, or another Mexican indigenous language. Communities with high levels of linguistic isolation include Oxnard, Port Hueneme, Santa Paula, and Piru Ventura County; Santa Maria and Guadalupe in Santa Barbara County; and San Simeon, San Miguel, and parts of Paso Robles in San Luis Obispo County.
FIGURE 46. MAP OF PERCENT LINGUISTICALLY ISOLATED HOUSEHOLDS BY CENSUS TRACT, CENTRAL COAST
Source Figure 46: USC Equity Research Institute analysis of 2021 5-year American Community Survey summary file from the U.S. Census Bureau and 2010 TIGER/Line Shapefiles (machine readable data files) / prepared by the U.S. Census Bureau, 2023. Note: A linguistically isolated household is defined as one in which no member age 14 or older speaks English at least “very well.” Data reflect a 2017 through 2021 average. The universe for this map is non-group quarters, non-vacant units. Santa Cruz, Santa Rosa, San Miguel, San Nicolas, and Santa Barbara islands estimates were not included because the population sizes of residents were too small to provide accurate estimates
Building for Equity and Justice Highlights
Achieving racial equity would generate substantial economic gains, for households and communities of color and for the regional economy as a whole.
People of color would see average income growth of as much as $35,000 annually from racial equity in the workforce.
There is far more potential than is currently being realized for people of color to exercise political voice.
Building for Equity and Justice
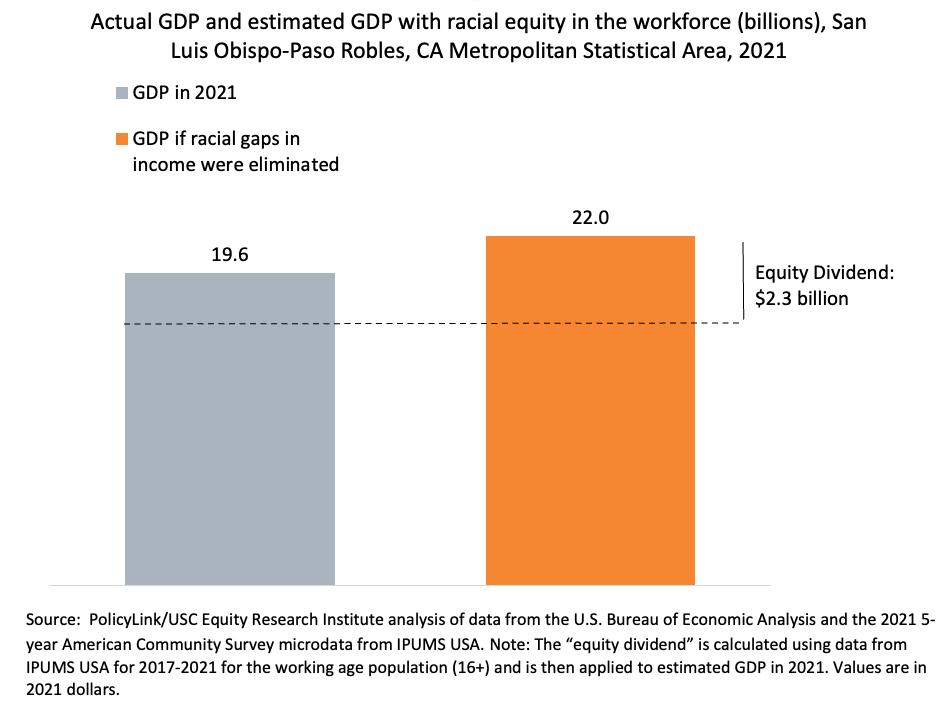
Economic Benefits of Equity
The tri-county area stands to gain a great deal from addressing racial income gaps, with projected increases totaling some $31 billion in GDP growth across the region.
County-level analyses of the impact of closing the racial gaps in wages and employment between whites and workers of color (controlling for age) show projected GDP growth of $17 billion in Ventura County, $11.8 billion in Santa Barbara County, and $2.3 billion in San Luis Obispo County.
OF ACTUAL GDP & ESTIMATED GDP W/ RACIAL EQUITY IN THE WORKFORCE (BILLIONS), VENTURA COUNTY
Source Figure 47: PolicyLink/USC Equity Research Institute analysis of data from the U.S. Bureau of Economic Analysis and the 2021 5-year American Community Survey microdata from IPUMS USA. Note: The “equity dividend” is calculated using data from IPUMS USA for 2017-2021 for the working age population (16+) and is then applied to estimated GDP in 2021. Values are in 2021 dollars
FIGURE 47. CHART
Building for Equity and Justice
Economic Benefits of Equity
FIGURES 48-49. CHART OF ACTUAL GDP & ESTIMATED GDP W/ RACIAL EQUITY IN THE WORKFORCE (BILLIONS), SANTA BARBARA AND SAN LUIS
OBISPO COUNTIES
Source Figures 48-49: PolicyLink/USC Equity Research Institute analysis of data from the U S Bureau of Economic Analysis and the 2021 5-year American Community Survey microdata from IPUMS USA. Note: The “equity dividend” is calculated using data from IPUMS USA for 2017-2021 for the working age population (16+) and is then applied to estimated GDP in 2021. Values are in 2021 dollars
Building for Equity and Justice
Economic Benefits of Equity
Racial equity in the workforce would produce substantial household income games for all people of color in the tri-county region, with Black and Latinx workers seeing the largest gains in all three counties. Latinx workers in Ventura and Santa Barbara Counties would see the highest average income growth more than doubling their annual earnings with gains of $34,000 and $37,000 on average.
FIGURES 50-52. CHARTS OF INCOME GAINS W/ RACIAL EQUITY IN THE WORKFORCE, CENTRAL COAST
Source Figures 50-52: PolicyLink/USC Equity Research Institute analysis of the 2021 5-year American Community Survey microdata from IPUMS USA. Note: Universe includes all people ages 16+. Data reflect a 2017-2021 averages. Values are in 2021 dollars.
Building for Equity and Justice
Civic Engagement and Political Voice
Analysis of recent trends in voter eligibility, registration, and turnout indicate that there is also much to be gained from mobilizing people of color in the region to exercise political voice. While representing more than 40 percent of eligible and registered voters in the tri-county region, people of color made up less than one-third (32 percent) of actual voters in the 2020 Presidential race, while Whites accounted for more than 2/3rds (68 percent) of the ballots cast despite representing 59 percent of the electorate. Closing this disparity is among the objectives of Unidos 805, a coalition of regional social justice organizations organizing to achieve more racially and ethnically inclusive political representation.
FIGURES 53-55. CHARTS
OF
REGISTERED VOTERS; ELIGIBLE VOTER TURNOUT; CITIZEN-VOTING AGE POPULATION, CENTRAL COAST
Source Figures 53 & 55: USC ERI analysis of voter data provided by Political Data, Inc Voter data include all registered voters who votered in the 2020 election and were present in the voter files in 2020; Source Figure 54: USC Equity Research Institute analysis of 2021 5-year American Community Survey summary file from the U.S. Census Bureau.
Building for Equity and Justice
Civic Engagement and Political Voice
Another way to build more fully representative political and civic engagement in the tricounty region is by opening access to the opportunity for resident immigrants to become citizens. Across the region, about 65,400 immigrant adults are eligible to naturalize, including some 48,500 Latinx immigrants, 9,000 Asian immigrants, and 6,700 white immigrants.
FIGURE
56.
CHART OF ELIGIBLE-TO-NATURALIZE IMMIGRANT ADULTS BY RACE, CENTRAL COAST
Source Figure 56: USC Equity Research Institute analysis of 2021 5-year American Community Survey microdata from IPUMS USA and the 2014 Survey of Income and Program Participation. Note: Data represent a 2017 through 2021 average. See https://dornsife.usc.edu/assets/sites/731/docs/Methodology Final updated ETN 2017.pdf for details on estimates of the eligible-to-naturalize population.
Equity Matters 2024 Conclusion
Achieving a just and equitable Central Coast calls for action on multiple fronts: living wages for our vital workforce; safe and affordable housing for all; fully inclusive and accessible systems of social support; equal rights and opportunities for all residents, regardless of race, ethnicity, or citizenship status. More than anything, it calls for sustained collaboration among a diverse array of organizers, advocates, service providers, policymakers and all others committed to making ours a region where everyone can thrive.
The data featured in this report provide empirically-grounded indicators of the challenges ahead. We see inequities happening at the intersections of class, race, ethnicity, gender, and citizenship status as well in employment and wages, housing, and access to opportunity. We find palpable expression of the costs of leaving these inequities unaddressed—to the health and wellbeing of economically struggling households and to regional prosperity on the whole. But these indicators also help us to identify critical levers for organizing and action on a region-wide scale—where mobilizing resources across the tri-counties can lay the groundwork for transformative change. We hope this report can itself be an essential resource in making regional equity a reality.
Data and Methodology
Unless otherwise noted, all the data and analyses presented in these charts are the product of the USC Equity Research Institute (ERI) and reflect the Central Coast region of California, which includes Ventura, Santa Barbara, and San Luis Obispo counties. Readers should bear in mind that many of the analytical choices in generating the underlying regional equity indicators database were made with an eye toward replicating the analyses in multiple regions and the ability to update them over time.
Summary measures from IPUMS microdata
Although a variety of data sources were used, much of our analysis is based on a unique dataset created using microdata samples (i.e., “individual-level” data) from the Integrated Public Use Microdata Series (IPUMS), for five points in time, 1980, 1990, 2000, 2006-2010 pooled together, and 2017-2021 pooled together. While the 2000 file is based on the decennial census and covers about 5 percent of the US population, the 2006-2010 and 2017-2021 files are from the American Community Study (ACS)and cover only about 1 percent of the US population each. The five-year pooled ACS file was used to improve the statistical reliability and to achieve a sample size that is comparable to the above in previous years.
Compared with the most commonly used census “summary files,” which include a limited set of summary tabulations of population and housing characteristics, use of the microdata samples allows for the flexibility to create more illuminating metrics of equity and inclusion, and a more nuanced view of groups defined by age, race/ethnicity, and nativity for various geographies in the United States.
A note on sample size
The IPUMS microdata allows for the tabulation of detailed population characteristics, but because such tabulations are based on samples, they are subject to a margin of error and should be regarded as estimates - particularly in smaller regions and for smaller demographic subgroups. In an effort to avoid reporting highly unreliable estimates, we do not report any estimates that are based on a universe of fewer than 100 individual survey respondents.
Appendix
Adjustments made to demographic projections
National projections of the non-Hispanic white share of the population are based on the U.S. Census Bureau’s 2017 National Population Projections. However, because these projections follow the OMB 1997 guidelines on racial classification and essentially distribute the other single-race alone group across the other defined racial/ethnic categories, adjustments were made to be consistent with the six broad racial/ethnic groups used in our analysis.
Census Tract Boundaries
Maps created here are not easily comparable to census tract maps in the 2021 Central Coast Regional Equity Profile. Starting in 2020, U.S. Census updated the census tract boundaries for all census tracts in the United States. All maps listed here, excluding the pollution burden map, use the 2020 census tract boundaries. These 2020 census tracts vary significantly from the 2010 census tract boundaries which were used to produce the previous maps.
Selected Terms and General Notes
Broad racial ethnic origin
Unless otherwise noted, all categorization of people by race/ethnicity and nativity is based on individual responses to various census surveys. All people included in our analysis were first assigned to one of six mutually exclusive racial/ethnic categories, depending on their response to two separate questions in the U.S. census on race and Hispanic origin as follows:
“white” and “non-Hispanic white” are used to refer to all people who identify as white alone and do not identify in census surveys as being of Hispanic origin.
The term “Latinx” is a gender neutral term for people of Latin American descent. It is used in this report to refer to all people who identify in census surveys as being of Hispanic origin, regardless of racial identification. Latinx is preferable as a way of referring to ethnic identity in comparison to the term “Hispanic,” which refers to people in the Americas and Spain who speak Spanish or are descended from Spanish-speaking countries.
“Black” and “African American” are used to refer to all people who identify as Black or African American alone and do not identify in census surveys as being of Hispanic origin.
Asian American refers to all people who identify as Asian American alone and do not identify as being of Hispanic origin.
“Pacific Islander” or “Native Hawaiian or Pacific Islander”, refers to all people who identify as Native Hawaiian or Pacific Islander alone and do not identify as being of Hispanic origin.
“Asian American and Pacific Islander,” “Asian American or Pacific Islander,” and “API” are used to refer to all people who identify as Asian American or Pacific Islander alone and do not identify as being of Hispanic origin.
“Native American” and “Native American and Alaska Native” are used to refer to all people who identify as Native American or Alaskan Native alone and do not identify as being of Hispanic origin.
“Native American Alone or In Combination” are used to refer to all people who reported a single race alone (e.g., Native American) and people who reported that race in combination with one or more of the other major racial groups (e.g., white, Black, Asian American, and Some Other Race). The concept “Native American (multiracial)” represents the maximum number of people who reported as that race group, either alone or in combination with one or more additional race(s).
“Mixed/other” and “Other or mixed race” are used to refer to all people who identify with a single racial category not included above, or identify with multiple racial categories, and do not identify in census surveys as being of Hispanic origin.
“People of Color” or “POC” is used to refer to all people who do not identify in census surveys as non-Hispanic white.
"Black, Indigenous, and other People of Color" (BIPOC) is used to refer to all people who do not identify in census surveys as non-Hispanic white, while centering the impact of slavery and genocide experienced by Black and indigenous people.
Nativity
The term “U.S. born” refers to all people who identify as being born in the United States (including US territories and outlying areas), or born abroad to American parents. The term “immigrant” refers to all people who identify as being born abroad, outside of the United States, to non-American parents.
Immigration Status
The term "naturalized citizen" refers to immigrants who have become U.S. citizens through the process of naturalization, while "non-citizen" refers to immigrants who have not. "Lawful permanent resident" (or "LPR") refers to non-citizen immigrants who have lawful permanent resident status in the U.S. and those with temporary visas, while the term "undocumented" refers to those who do not have legal authorization for residence in the U.S.
Appendix
Other selected terms
The term “communities of color” generally refers to distinct nonwhite groups defined by race/ethnicity among people of color.
The term “high school diploma” refers to both an actual high school diploma as well as a high school equivalency or a General Education Development (GED) certificate.
The term “full-time” workers refers to all persons in the IPUMS microdata who reported working at least 45 or 50 hours per week (depending on the year of the data) and who usually work at least 35 hours per week during the year prior to the survey.
The term “overcrowded households” refers to households where there is more than one person per room.
The term “rent-burdened” refers to households paying more than 30% of gross income in rent. The term “severe rentburdened” refers to households paying more than 50% of gross income in rent.
Estimating Immigration Status and those Eligible to Naturalize
Several indicators that rely on the American Community Survey microdata from IPUMS USA report data by immigration status, including undocumented, lawful permanent residents (LPRS), and naturalized U.S. citizens, while the Naturalization indicator reports data for eligible-to-naturalize adults. Among these different statuses, only naturalized U.S citizenship is self-reported while all the others are estimated following an approach developed by Professor Manuel Pastor at the USC Equity Research Institute.
For a more detailed explanation of our process, please refer to this document: https://dornsife.usc.edu/eri/wpcontent/uploads/sites/41/2023/10/Estimating_Immigrants_by_Status_in_the_ACS_Microdata.pdf.
Estimates of GDP without racial gaps in income
Estimates of the gains in average annual income and GDP under a hypothetical scenario in which there is no income inequality by race/ethnicity are based on the 2021 5-Year IPUMS ACS microdata. We applied a methodology similar to that used by Robert Lynch and Patrick Oakford in chapter two of All-In Nation: An America that Works for All, with some modification to include income gains from increased employment (rather than only those from increased wages). As in the Lynch and Oakford analysis, once the percentage increase in overall average annual income was estimated, 2021 GDP was assumed to rise by the same percentage. For further discussion of this methodology, see “All-In Nation: An America that Works for All by Robert Lynch and Patrick Oakford, Policylink and the Center for American Progress at https://www.policylink.org/sites/default/files/AllInNation-book.pdf.
For access to additional equity indicators, research, reports, and resources germane to the Central Coast, please visit our website at: https://centralcoastequity.org