
Federation Council Stormwater Servicing Plans: Concept Design Report

An initiative funded by the NSW Government through the NSW Regional Housing Strategic Planning Fund

Alluvium recognises and acknowledges the unique relationship and deep connection to Country shared by Aboriginal and Torres Strait Islander people, as First Peoples and Traditional Owners of Australia. We pay our respects to their Cultures, Country and Elders past and present.
Artwork by Melissa Barton. This piece was commissioned by Alluvium and tells our story of caring for Country, through different forms of waterbodies, from creeklines to coastlines. The artwork depicts people linked by journey lines, sharing stories, understanding and learning to care for Country and the waterways within.
This report has been prepared by Alluvium Consulting Australia Pty Ltd for Federation Council under the contract titled ‘Stormwater Servicing Plans’.
Authors: Ha Nguyen, Alexandra Nero, Angelina Newton, Katherin Angelin, Prawi Woods
Review: Oliver Light, Suresh Hettiarachchi, Katherin Angelin
Approved: Katherin Angelin
Version: 3 - FINAL
Date issued: 5/01/2026
Issued to: Federation Council
Citation: Alluvium, 2025, Federation Council Stormwater Servicing Plans: Concept Design Report, report prepared by Alluvium Consulting Australia for Federation Council, NSW

Cover image: Skehan’s Lane Drain, New South Wales, Alluvium, 2024

Figure 10. Mulwala 1% AEP Flood Depths (with the Murray River flood extent)
Figure 11. Distribution of Sloane's Froglet (Crinia Sloanei) in Australia from the Australian Frog Atlas (Cutajar et al. 2022)
Figure 12. Distribution of Groundwater Dependent Ecosystems and sightings of the Sloane’s Froglet in Corowa
Figure 13. Distribution of Groundwater Dependent Ecosystems and sightings of the Sloane’s Froglet in Howlong
Figure 14. Aboriginal sites around Corowa. Sourced from AHIMS.
Figure 15. Aboriginal sites around Mulwala. Sourced from AHIMS.
Figure 16. Aboriginal site around Oaklands. Sourced from AHIMS.
Figure 17. Aboriginal sites around Urana. Sourced from AHIMS.
Figure 18. Key project themes and desired outcomes
Figure 19. Hydrological approach overview
Figure 20. Pre-development model updates from the existing hydrological model for Corowa 43
Figure 21. Pre-development model updates from the existing hydrological model for Howlong 44
Figure 22. Pre-development model updates from the existing hydrological model for Mulwala 45
Figure 23. Corowa centralised basin and chain of ponds option post-development land use and flow direction 50
Figure 24. Howlong centralised basin and chain of ponds option post-development land use and flow direction 51
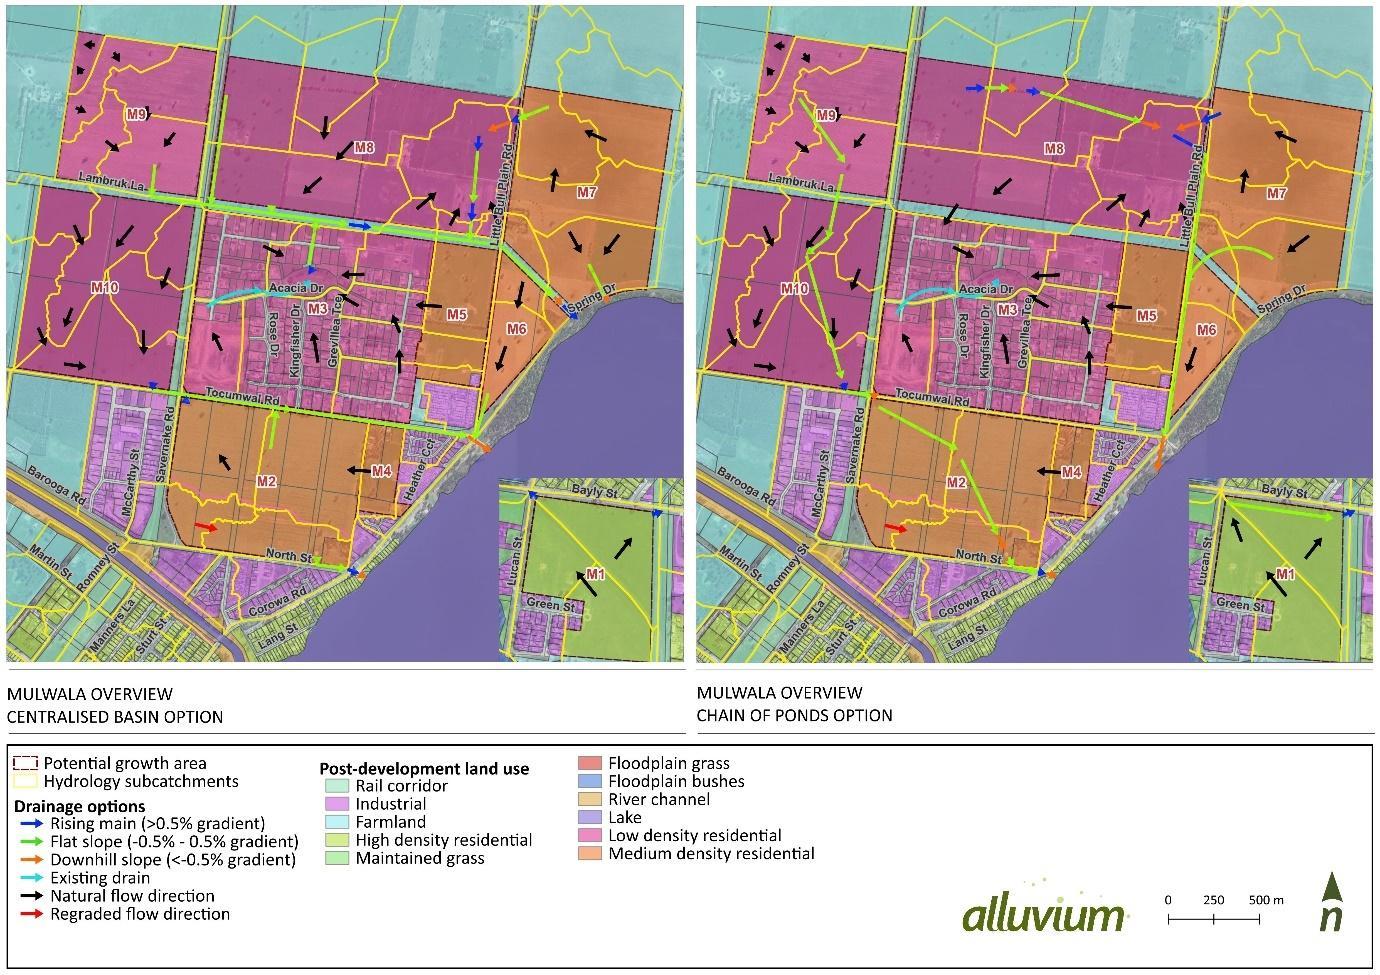
Figure 25. Mulwala centralised basin and chain of ponds option post-development land use and flow direction 52
Figure 26. Storage footprints conceptualisation for the two options 53
Figure 27. Example of the flood hydrographs for development area M9 for pre-development, postdevelopment, and with centralised basin mitigation 54
Figure 28. Centralised basin unit base case in Mulwala including M9, M10 and part of M8 (catchment MA_1) 56
Figure 29. Chain of ponds unit base case in Mulwala including M9, M10 and M2 57
Figure 30. Chain of ponds unit base case in Howlong including H3, H2, H1 and H7 58
Figure 31. Projected temperature increases associated with AR6 socioeconomic pathways relative to 19611990 and their associated uncertainty (IPCC, 2021) 62
Figure 32. Example of a linear channel and non-linear chain of ponds at Merri Creek & Kalkallo Creek 66
Figure 33. Chain of ponds in-line pools schematic (Alluvium & Mosaic, 2024)
Figure 34. Chain of ponds offline wetlands schematic (Alluvium & Mosaic, 2024)
Figure 35. Typical schematic plan showing the chain of ponds stormwater servicing strategy schematic for Corowa, Howlong, Mulwala
Figure 36. WLRB cross-section
Figure 37. Typical cross-section - vegetated swale
Figure 38. Typical cross-section - compound waterway
Figure 39. Sliding scale for constructed waterway corridor widths (Melbourne Water, 2019)
Figure 40. Linear pools long section in chain of ponds
Table
Table
Table
Table
Table
Table
(EIA)
Table 8. Stream lag factors used for updated WBNM hydrological models
Table 9. WBNM model
Table
Table
Table
Table
Table 14. Design criteria for the two options in consideration to froglet
Table 15. Centralised basin unit base case key assumptions and results
Table 16. Pre-development, post-development, and mitigation set up for the chain of pond basin sizing
Table 17. Basin sizing requirements for each growth area in the chain of ponds unit base case
Table 18. Chain of ponds unit base case key assumptions and results
Table 19. Scaling factors for the chain of ponds unit base case
Table
Table 22. Water quality unit-base case areas
Table 23. Chain of ponds elements and their functions
Table 24. Minor drainage swale types with estimated required dimensions, assuming a longitudinal grade of 0.5%
Table 25. Modelled minor flows by subcatchment
Table 26. Modelled major flows and waterway/ outfall types
Table 27. Channel cross sectional geometry and design parameters
Table
Table
Table
Table 33. Flood level reduction (m) at reporting locations in Corowa
Table 34. Flood level reduction (m) at reporting locations in Howlong
Table 35. Flood level reduction (m) at reporting locations in Mulwala
Table
Table
Table
Table
Table 41. Proportion of stormwater system area to developable area (per system)
Table 42. Indicative staging plan example for a section of waterway
Table 43. 1% AEP pre-development and post-development flows for Mulwala.
Table 44. 1% AEP pre-development and post-development flows for Howlong.
Table 45. 1% AEP pre-development and post-development flows for Corowa.
Table 46. 2% AEP pre-development and post-development flows for Mulwala
Table 47. 2% AEP pre-development and post-development flows for Howlong
Table 48. 2% AEP pre-development and post-development flows for Corowa
Table 49. 20% AEP pre-development and post-development flows for Mulwala
Table 50. 20% AEP pre-development and post-development flows for Howlong
Table 51. 20% AEP pre-development and post-development flows for Corowa
Acronyms
ACC Albury City Council
AEP Annual Exceedance Probability
ANZG Australian and New Zealand Guidelines for Fresh and Marine Water Quality
BDAR Biodiversity Development Assessment Report
BOM Bureau of Meteorology
DCEEW Department of Climate Change, Energy, the Environment and Water
DCP Development Control Plan
DGV Default Guideline Values
DPIE Department of Planning, Industry and Environment
EDD Extended Detention Depth
EIA Environmental Impact Assessment
EPBC Environment Protection and Biodiversity Conservation
FRMS&P Floodplain Risk Management Study and Plan
GGF Growling Grass Frog
GP Gross Pollutants
HDR High-Density Residential
IDF Intensity-Duration-Frequency
IFD Intensity-Frequency-Duration
IL Invert Level
IPCC Intergovernmental Panel on Climate Change
LAMP Local Area Management Plan
LDR Low-Density Residential
LGA Local Government Area
LiDAR Light Detection and Ranging
mAHD Metres above Australian Height Datum
MCA Multi-Criteria Analysis
MDBA Murray-Darling Basin Authority
MDR Medium-Density Residential
MNES Matters of National Environmental Significance
MUSIC Model for Urban Stormwater Improvement Conceptualisation
NSW New South Wales
NWQMS National Water Quality Management Strategy
OEH NSW Office of Environment and Heritage
PEAR Prescribed Ecological Actions Report
PMF Probable Maximum Flood
QGIS Quantum Geographic Information System
SSP Stormwater Servicing Plan
TCAR Treatment to Catchment Area Ratio
TED Top of Extended Detention
TIA Total Impervious Area
TN Total Nitrogen
TP Total Phosphorus
TSS Total Suspended Solids
TUFLOW Two-dimensional Unsteady Flow
USCS Universal Soil Classification System
WAE Work As Executed
WBNM Watershed Bounded Network Model
WLRB Wetland Retarding Basin
WSUD Water Sensitive Urban Design
1 Introduction
1.1 Project background
Alluvium has been engaged by Federation Council (Council) to develop the Stormwater Servicing Plans (SSP) for the townships of Corowa, Howlong, Mulwala, Oaklands, and Urana (Figure 1). The primary aim of the SSP is to outline the necessary stormwater infrastructure to accommodate an estimated 5,600 new lots within the Local Government Area (LGA) over the next 40 years. The SSP will serve as a blueprint for future stormwater infrastructure requirements, effectively acting as a stormwater master plan to meet the demands of urban growth in the study areas.
The SSP will provide a robust framework to effectively manage stormwater generated by anticipated urban growth areas, ensuring sustainable development, protection of the local environment and safeguarding of communities from flooding risks. The main objectives of the SSP (per Council’s initial project brief) are:
• Identify new infrastructure:
Conduct an assessment to identify stormwater infrastructure that will be required to service the future growth areas.
• Identify the need for upgrades to existing infrastructure:
Identify any necessary upgrades to existing downstream infrastructure where stormwater from the future growth areas will be conveyed on route to the receiving waters.
• Address stormwater quantity and quality:
Consider provision for both stormwater quantity/ conveyance and stormwater quality treatment to meet regulatory requirements for the discharge of stormwater runoff to the receiving waterways.
• Mitigate impacts on existing flooding conditions:
Assess what is required to ensure that future development within the proposed urban growth areas does not have a negative impact on existing flooding conditions.
Design objectives are further discussed in Section 3
Most of the urban growth and infill development within the Federation Council LGA is expected to continue to occur within the three townships of Corowa, Howlong and Mulwala. For this reason, the Stormwater Servicing Plan focuses on servicing the future urban growth areas earmarked in these three towns. Minimal growth is expected to continue to occur within the northern townships of Urana and Oaklands over the next 40 years Stormwater infrastructure improvement opportunities for Urana and Oaklands are documented in Appendix E of the report.
The report also includes an assessment of existing stormwater flooding problems and improvement measures in the vicinity of Sophia Close, Corowa. This work is documented in Appendix F.
1.2 Project stages
A summary of the project stages and outcomes has been provided in Table 1
Table 1. Project stages
Project Stage
Stage 1: Preliminary activities
Outcomes
• Data review, GIS investigation, and confirmation of design approach and objectives.
• Design Objectives and Approach Report (Alluvium, 2024) was prepared as an outcome of this stage with the objectives summarised within Table 5
Stage 2: Options development and assessment
Stage 3: Documentation of preferred options
• Review of existing targeted stormwater issues within the Riverland Gardens Estate (Mulwala urban growth area M3) and the Sophia Pinot Basin (Corowa).
• Identification of two overarching stormwater typologies as the options for servicing the urban growth areas. The two approaches included the centralised basin approach, and the chain of ponds approach. These are summarised further within Section 4
• Assessment of available options including a cost analysis and multi-criteria analysis and the selection of a preferred stormwater servicing plan.
• Options Development and Assessment Report (Alluvium, 2025) was prepared as an outcome of this stage.
• Development of the concept design documentation of the stormwater servicing plans. The concept design is detailed within Sections 6 and onwards of this report.
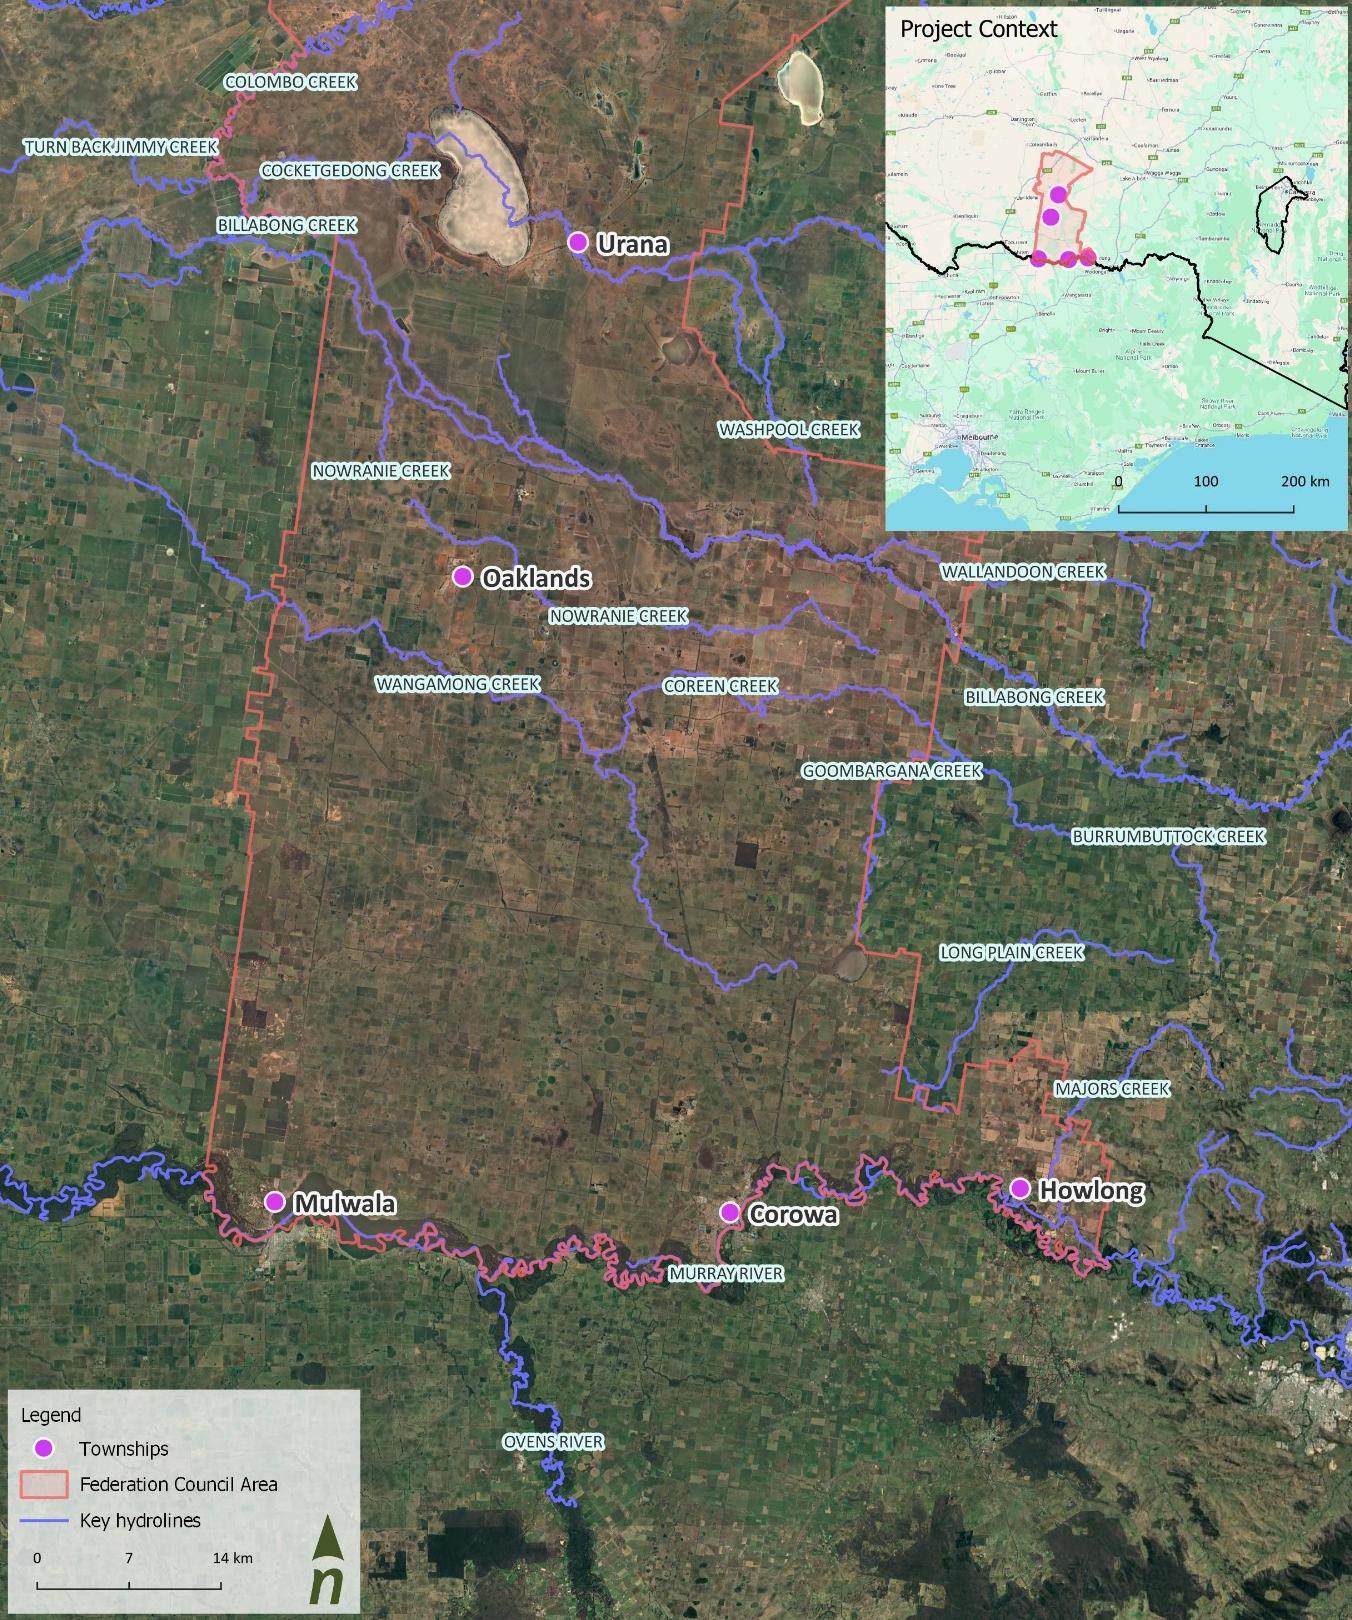
Figure 1 Project context
1.3 Report structure
This report provides the results of a detailed assessment and concept design for stormwater management across the townships of Corowa, Howlong, and Mulwala, and an assessment of stormwater improvement options for Urana and Oaklands. The report is structured as follows:
• Section 1: Introduction
Introduces the project, outlines the report structure, and provides a summary of the townships involved.
• Section 2: Existing conditions
Describes the current environmental, geological, infrastructural, and cultural conditions relevant to stormwater management.
• Section 3: Summary of design objectives
Presents the overarching goals guiding the stormwater management strategy.
• Section 4: Summary of options analysis
Presents a summary of the options analysed during Stage 2 of the project.
• Section 5: Review of existing stormwater issues
Identifies and evaluates current stormwater challenges in specific locations within the townships.
• Section 6: Hydrological modelling
Details the modelling of pre- and post-development hydrological conditions, including flood storage and climate change considerations.
• Section 7: Water quality modelling
Assesses water quality impacts and outlines modelling approaches for the proposed designs.
• Section 8: Concept design overview
Provides an overview of the proposed stormwater infrastructure approach.
• Section 9: Concept design descriptions
Provides the details of the proposed stormwater infrastructure designs, including drainage systems, sediment basins, wetlands, and hydraulic modelling.
• Section 10: Operations and maintenance
Discusses access, maintenance requirements, and sediment management strategies.
• Section 11: Estimate of probable costs
Estimates the financial implications of the proposed stormwater infrastructure.
• Section 12: Land use
Brief comparison of land use for stormwater servicing across the growth areas.
• Section 13: Staging strategy
Outlines the principles and indicative plans for phased implementation of the stormwater improvements.
• Section 14: Safety in Design
Evaluates safety considerations related to flooding, batters, and utility impacts.
• Section 15: Next steps
Summarises recommended actions and future directions for the project.
• References and Appendices
Includes supporting documentation, detailed design drawings, cost assessments, safety evaluations, and modelling results and schematics.
1.4 Township summary
Below is a summary of the townships of Corowa, Howlong and Mulwala. A summary of Urana and Oaklands has been provided within Appendix E.
Corowa
Corowa (Figure 2), the largest town in the Federation Council, is set for significant urban growth across an area of approximately 225 hectares. Notably, these future growth areas are not affected by riverine flooding, offering a promising landscape for urban development. An existing part of the town, referred to as Site C9, however, is designated for infill development and the existing developed areas adjacent to this infill growth area were heavily impacted by flooding in January 2022. This prompted a need for a localised assessment of existing stormwater infrastructure capacity prior to identifying options for the servicing of the adjacent infill growth area
(C9). This project will include an assessment of downstream infrastructure to ensure it can adequately support growth areas C1 to C11
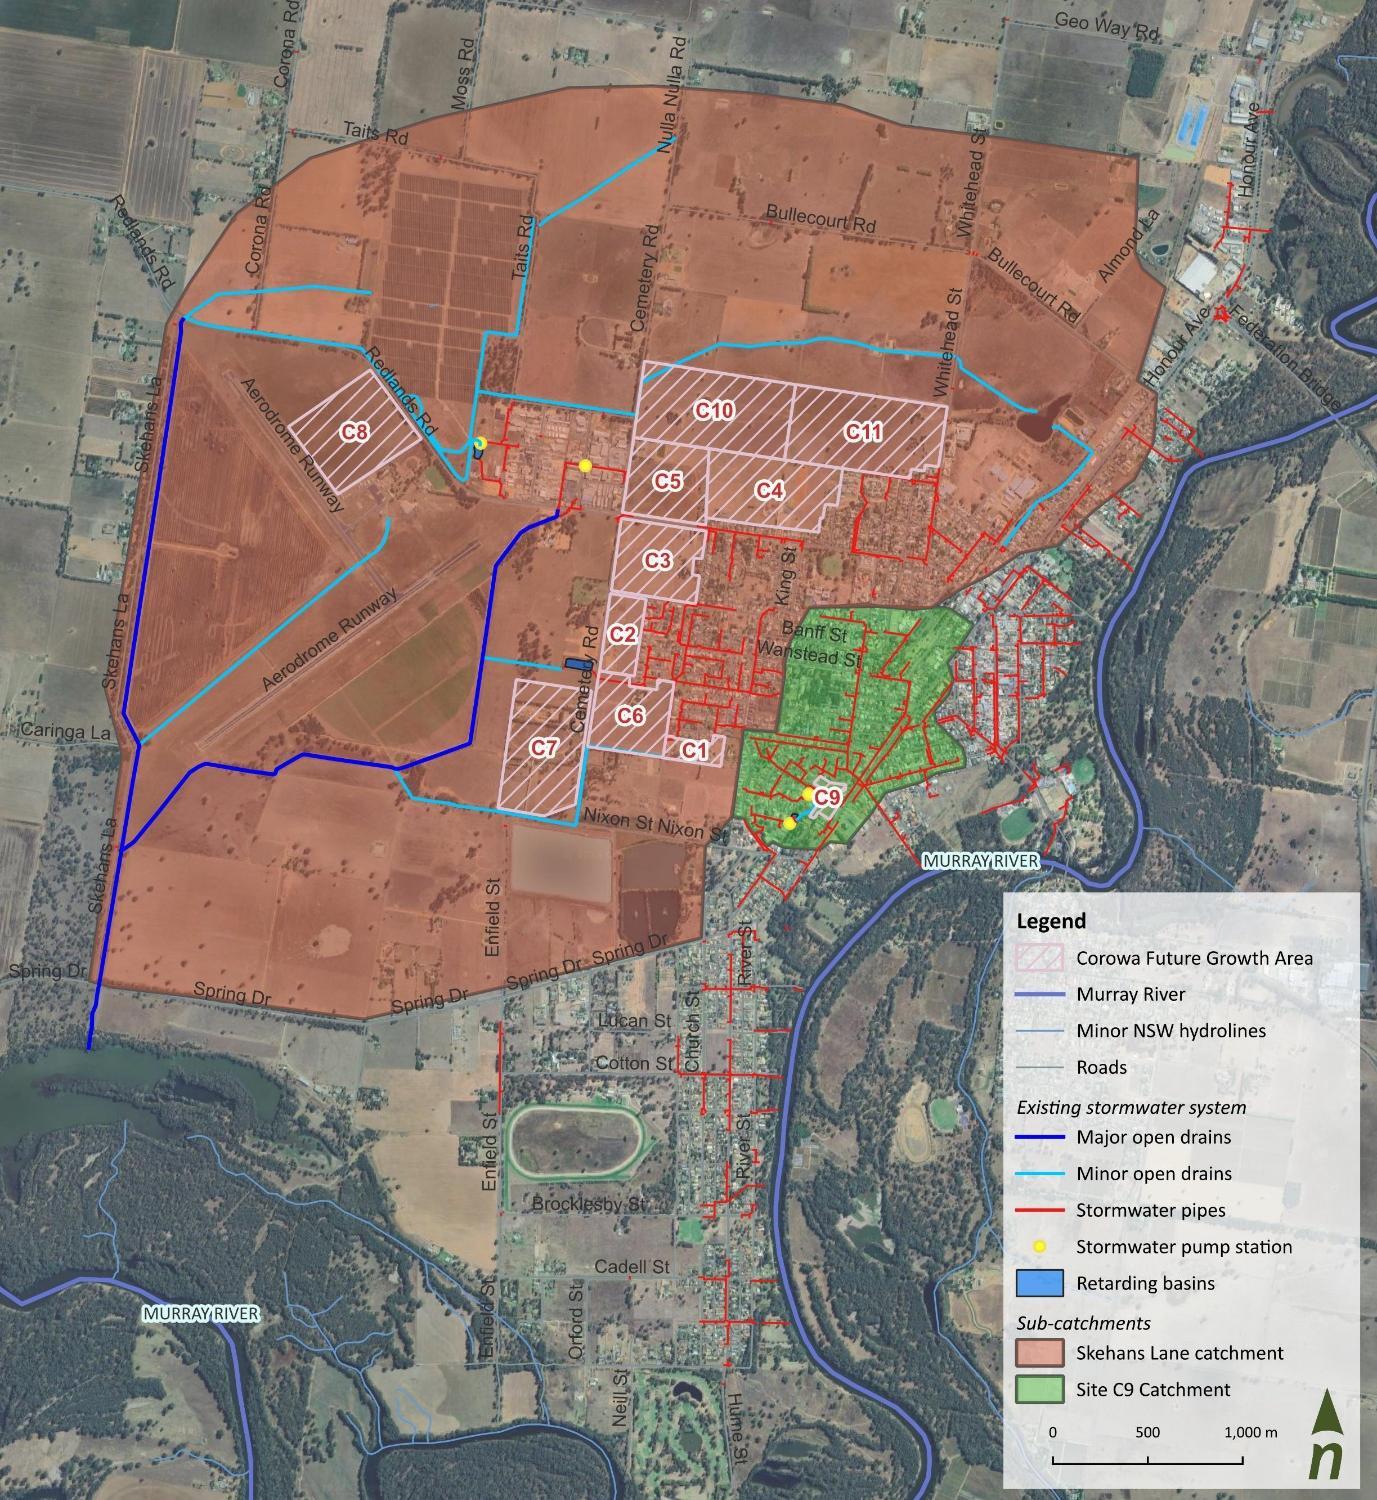
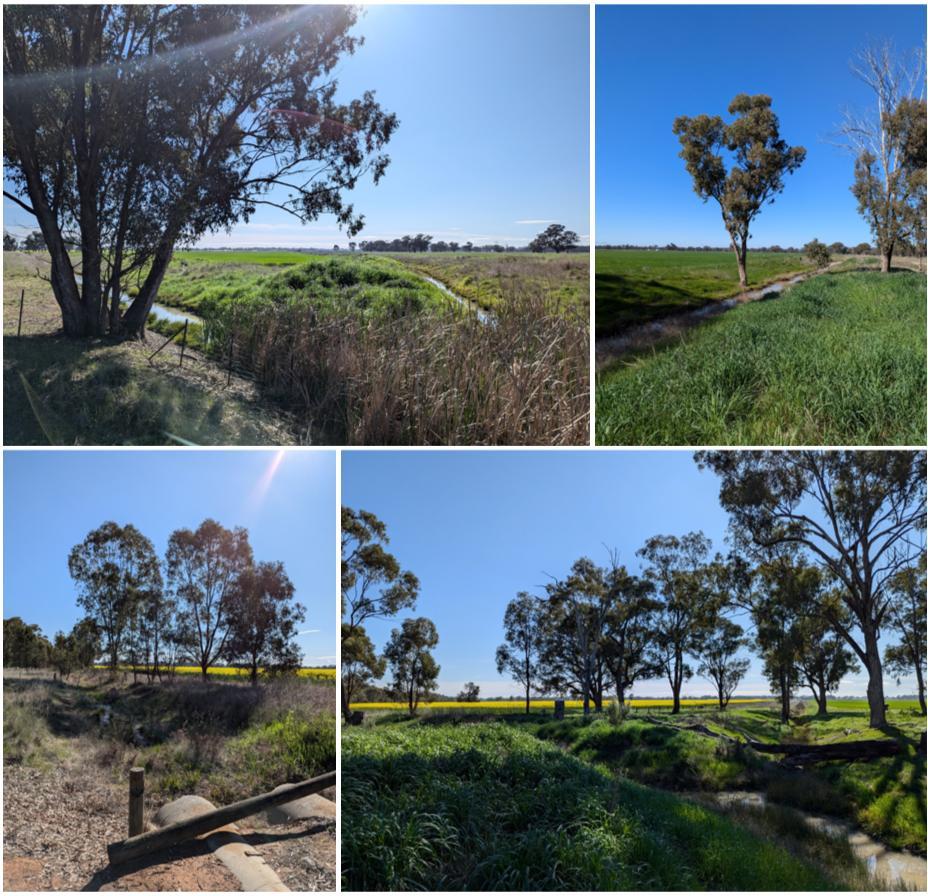
The urban growth areas are predominately located within the Skehans Lane catchment. Key stormwater infrastructure in this catchment includes a series of open, linear channels draining to the Dairy Lagoon, which is an anabranch of the Murray River. The major open drains and channels for the Skehans Lane catchment are shown in Figure 3
Figure 2 Corowa – overview of stormwater features and urban growth areas
Howlong
Howlong, with a population of 3,000, is earmarked for development across approximately 285 hectares, predominantly on the northern and eastern perimeters of the existing township (see Figure 4). Notably, the identified future urban growth areas are unaffected by Murray River flooding, owing to their naturally elevated terrain.
Nonetheless, the town is not entirely immune to flood risks, with Majors Creek breakaway flows impacting certain parts of Howlong, including the identified future growth areas. In the location of most urban growth areas, the terrain features a mix of relatively flat expanses and undulating landscapes with a notable floodplain depression.
Key components of the existing stormwater infrastructure, the most significant of which are the three pipe drains, direct stormwater from remnant floodplain depressions to the Murray River and the Black Swan anabranch.
Development of industrial areas to the north and south of urban growth area H9 is underway. As such, the growth planning will need to consider recently constructed stormwater infrastructure.
Figure 3 Skehans Lane major stormwater channels (Photos taken 11/09/2024)
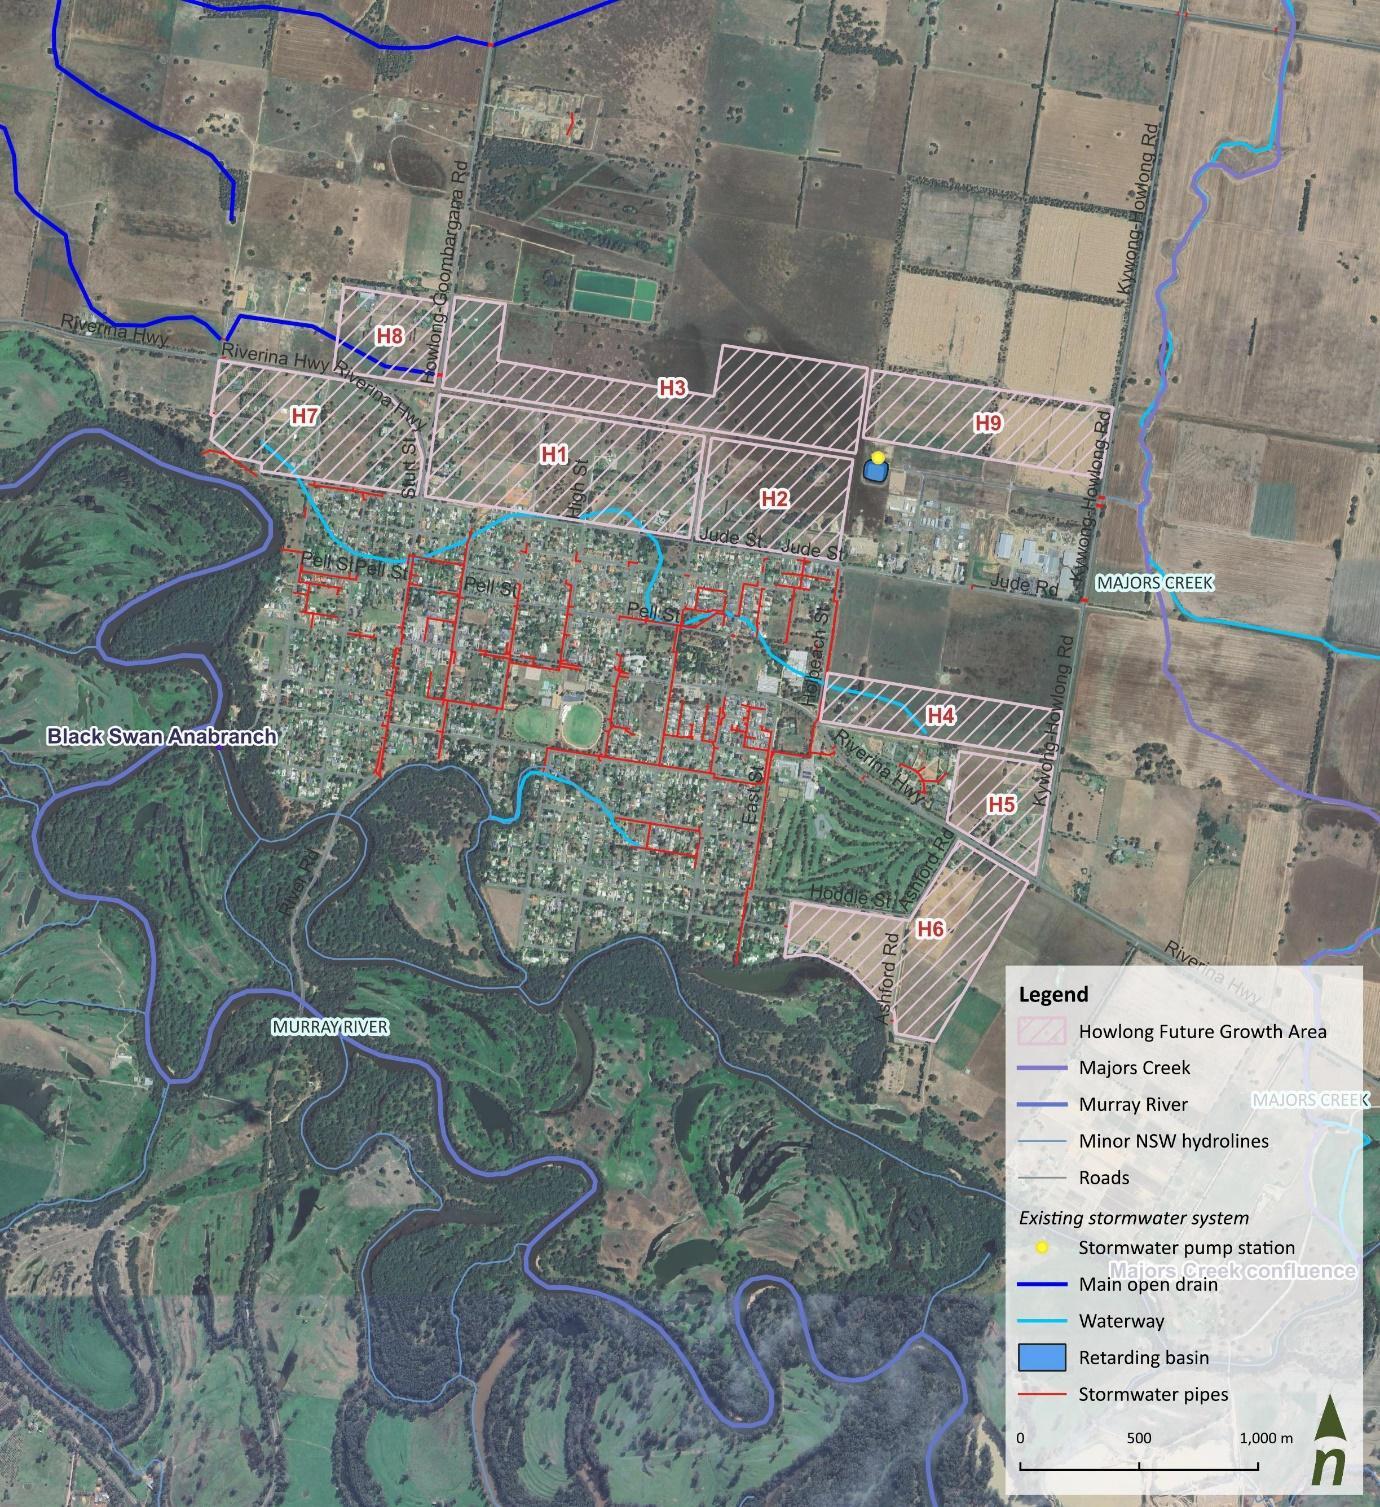
Figure 4. Howlong: overview of stormwater features and urban growth areas
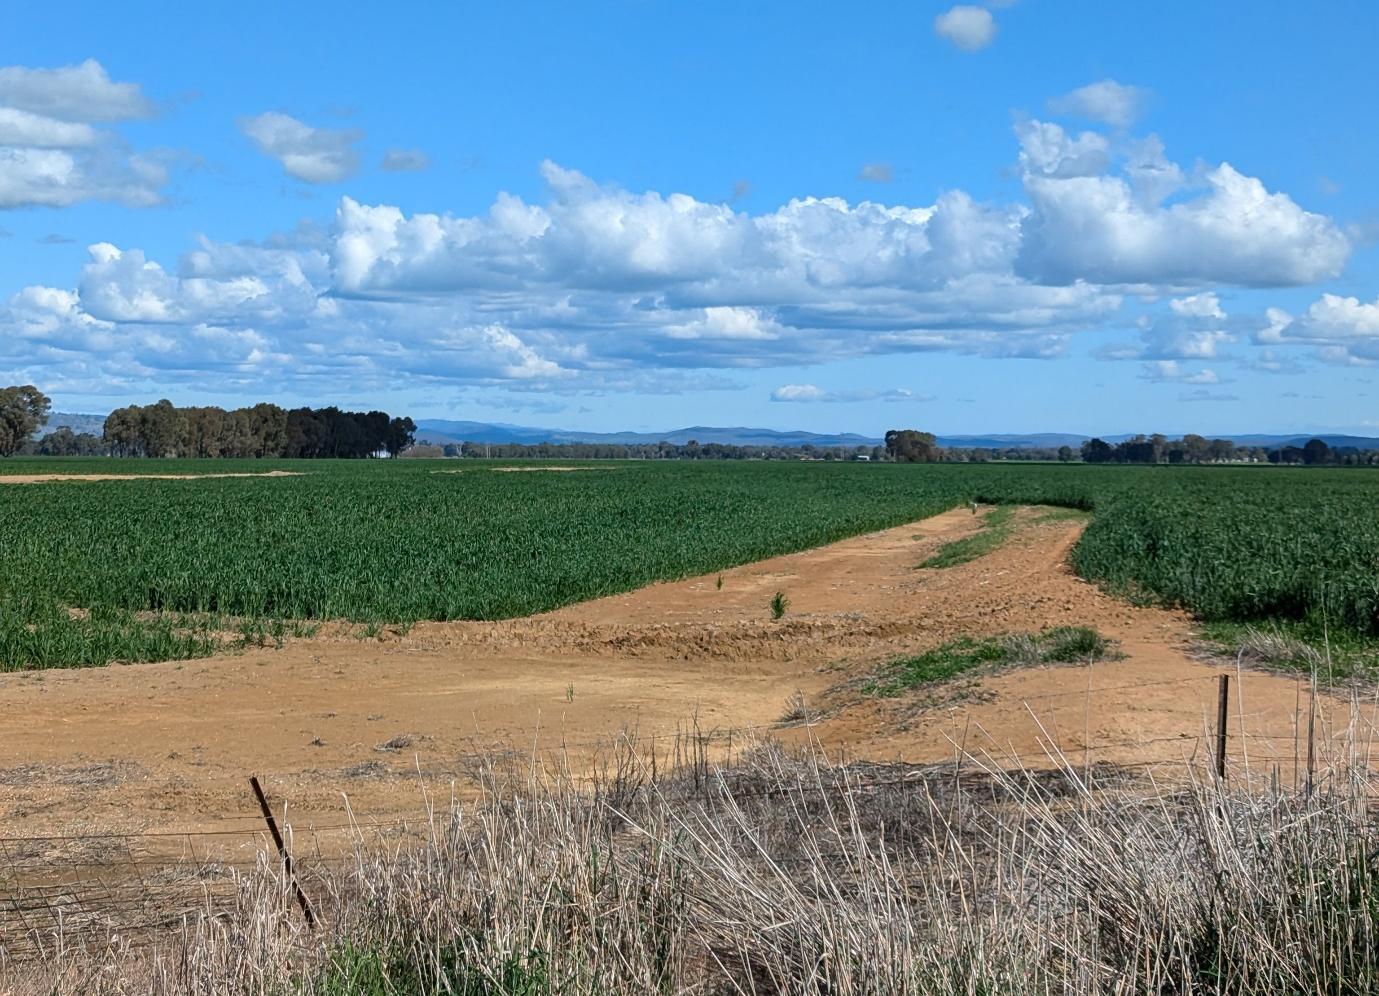
Figure 5. Majors Creek (photo taken 12/09/2024)
Mulwala
Mulwala, with a population of 2,500, sits on the floodplain shores of Lake Mulwala. Lake Mulwala is an integral part of the Murray River irrigation distribution network. Mulwala is characterised by predominantly flat terrain with drainage of the northern growth areas being particularly challenging due to the limited natural fall towards the lake The township is divided by the Mulwala Canal which is an irrigation canal diverting water from the Murray River to the Edward River in Deniliquin. The canal was constructed between 1935 and 1942.
Approximately 639 hectares across the township are designated for development (see Figure 7Figure 6). Of the nine urban growth sites, one site (M1) is south of the canal, with the remaining sites (M2 to M9) on the north side of the canal.
Parts of Mulwala, including future growth areas, face impacts from Murray River flooding The stormwater servicing plans will consider flood conditions in the design of stormwater infrastructure, but the intent is to focus more on managing local and pluvial flooding, as opposed to considering riverine flood mitigation measures such as levees
Council have noted the presence of a natural depression approximately 1.5km north of the urban growth areas The presence of this natural depression has been confirmed via analysis of LiDAR and historical imagery. It is possible that this is an ephemeral flood runner that once connected to the Murray River via surface water and groundwater systems. The hydrology of Mulwala may have been impacted by the construction of the Mulwala Canal. While the depression is too far removed from the Mulwala growth areas to be used as a formal point of discharge, it is important to understand the potential hydrogeological conditions of the township that will impact the stormwater servicing options.
These hydrogeological conditions, including the influence of the Mulwala Canal and the presence of the natural depression, have directly impacted the way stormwater is managed in Mulwala. As a result, the design of stormwater servicing options must carefully consider both surface and subsurface water movement to ensure effective drainage and flood mitigation.
Urban growth area M3 (referred to as the Riverland Gardens Estate) has been partially developed with stormwater infrastructure built to service the growth. Existing stormwater infrastructure at the site comprises of limited pit and pipe infrastructure, a central infiltration basin north of Acacia Drive, and a retarding basin bounded by Acacia Drive, Damian Crescent, and Savernake Road (see Figure 7Figure 7) The performance and design of this infrastructure have been directly impacted by the local hydrogeological conditions, including the flat terrain, variable soil permeability, and shallow groundwater table. These factors influence both the effectiveness of infiltration and the risk of surface ponding during storm events. This infrastructure is a key element of the stormwater management approach at the site, though its efficacy in less frequent storm events is not well understood. This study will include a review of the stormwater infrastructure at the site to ensure it has capacity to service the development currently occurring.
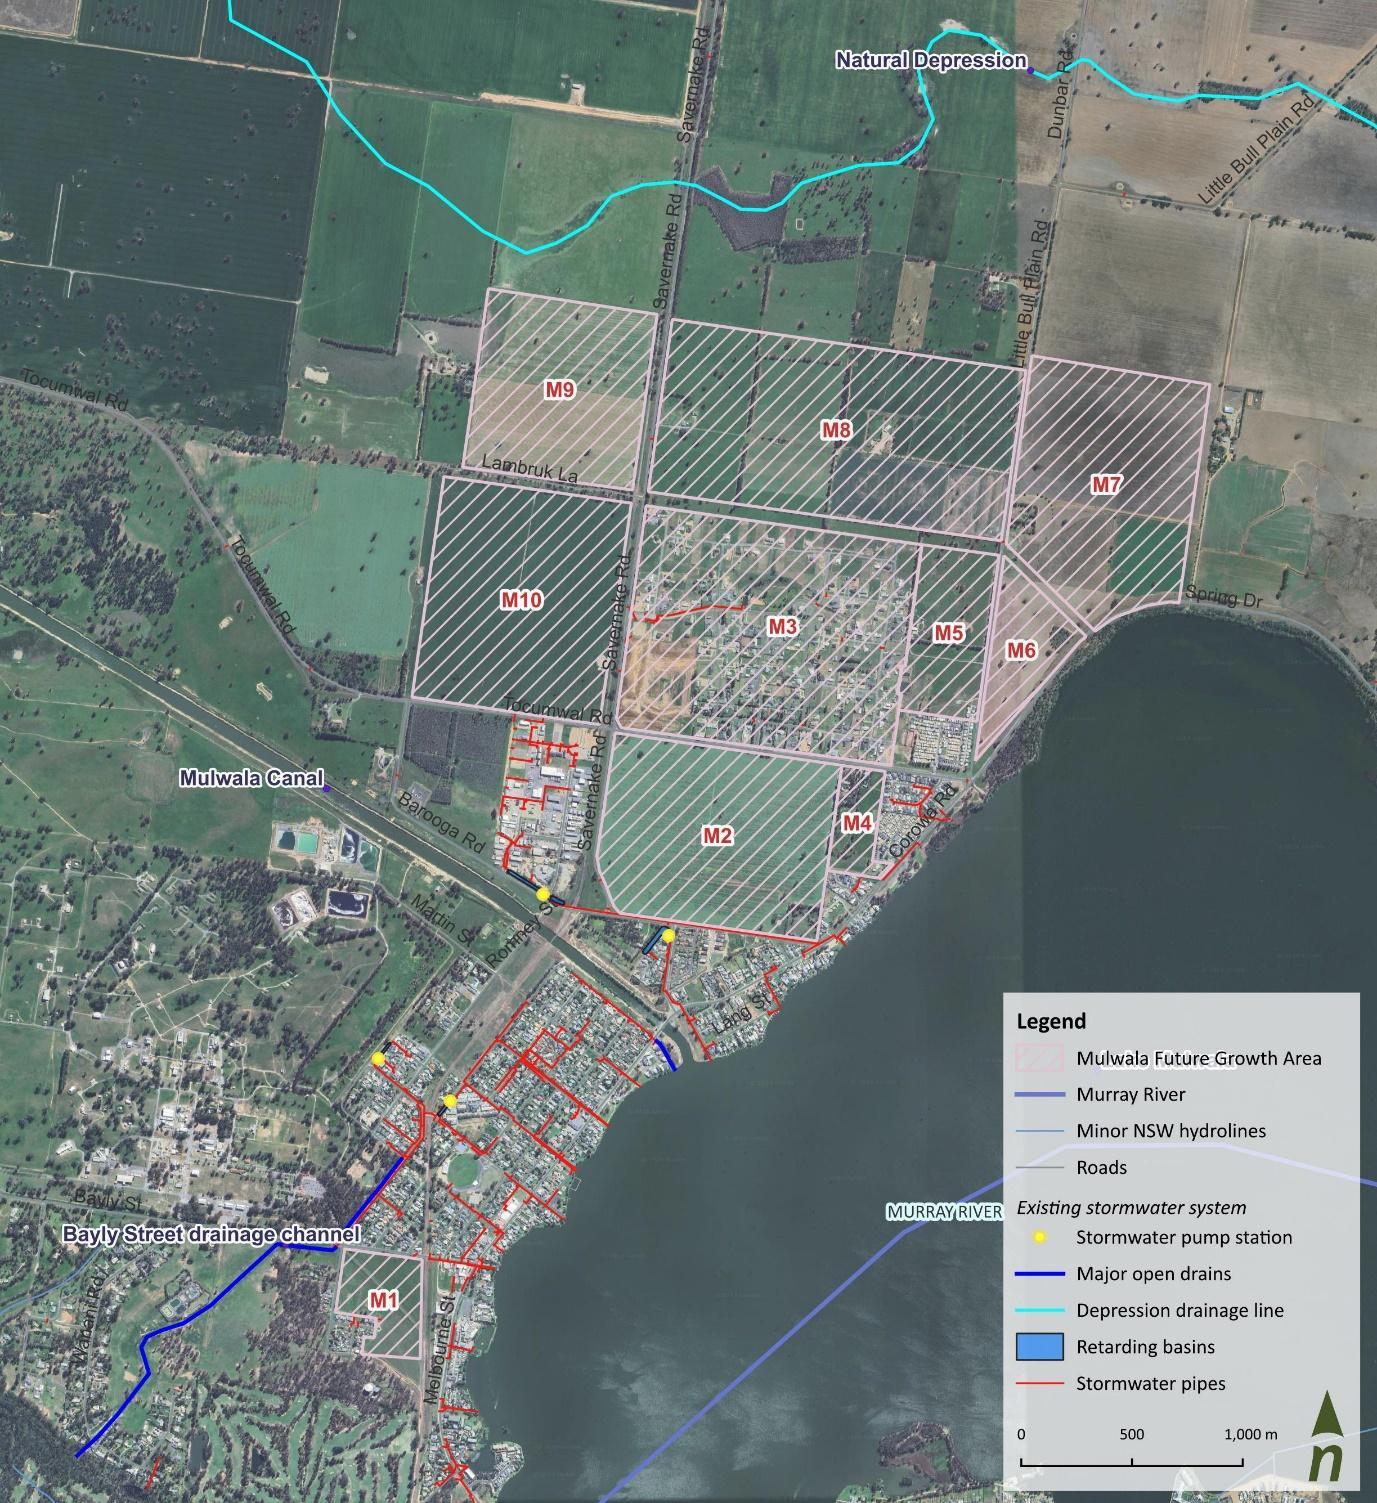
Figure 6 Mulwala – overview of stormwater features and urban growth areas
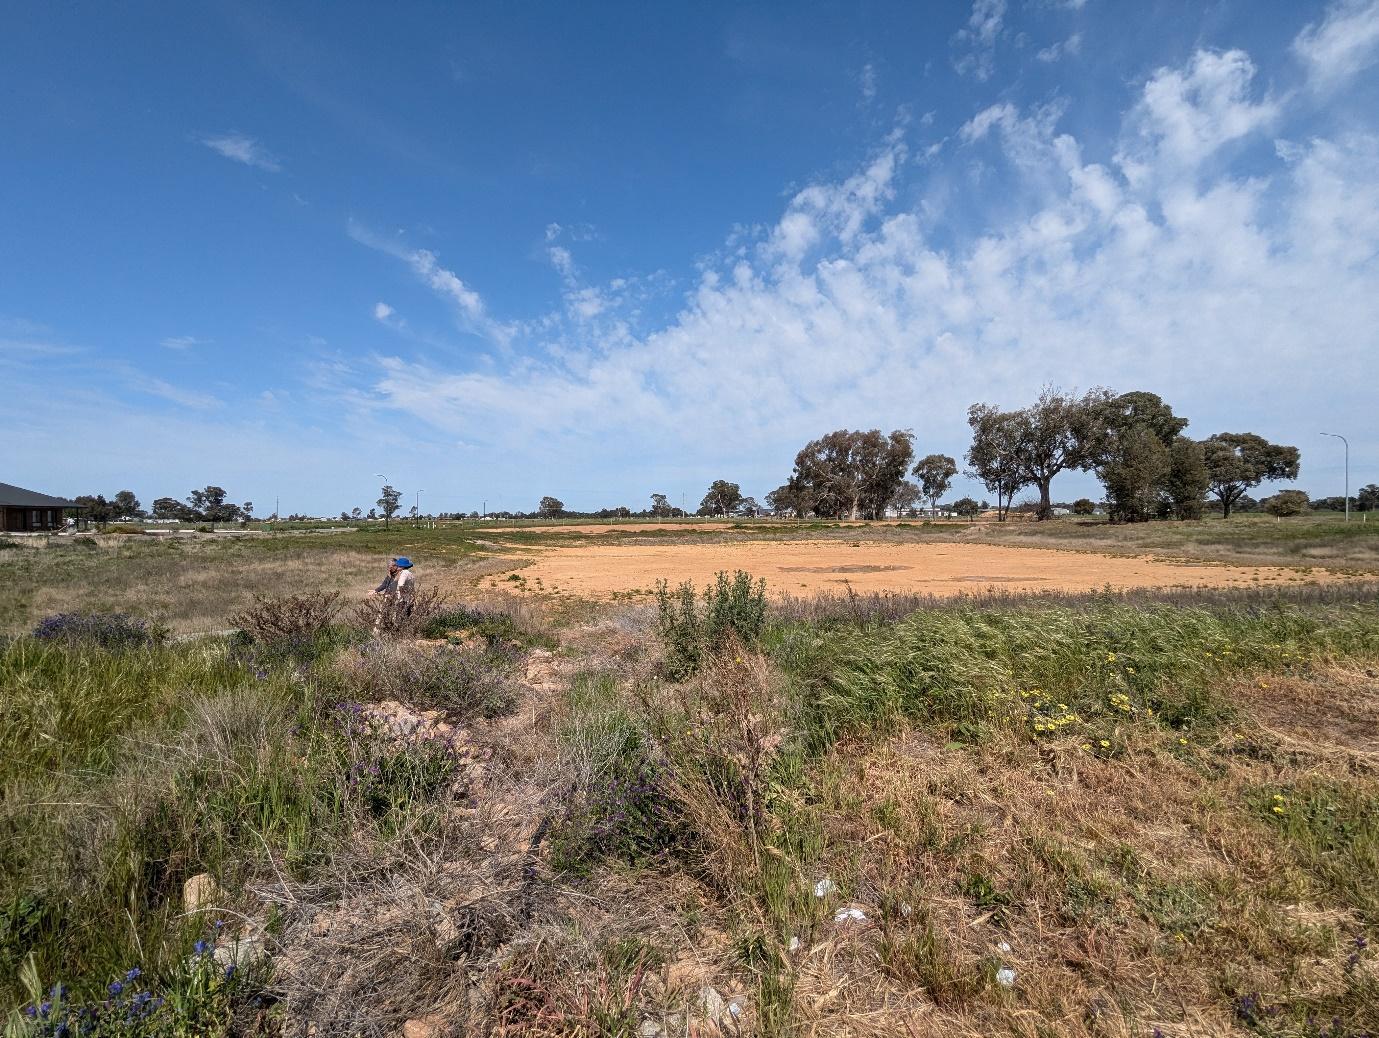
Figure 7 Riverland Gardens existing stormwater retention basin (photo taken 11/09/2024)
2 Existing conditions
The Alluvium team attended a site visit between the 11th and 13th September 2024, accompanied by Council staff. The visit allowed the team to view and appreciate the major constraints at each of the townships. The background data has been summarised under key categories in the following sections, as relevant to the SSP.
2.1 Topography
Topographic information is important for understanding the physical landscapes and potential stormwater management challenges or advantages for each area. Table 2 summarises key topographic aspects for each town including elevation, terrain types, and notable geographic features.
Corowa
Howlong
Mulwala
Urana
Oaklands
The town sits on a small hill with three distinct terraces that step down towards the Murray River. The lowest terrace, located about 3-5 meters above the typical river level (132-134 mAHD), is home to the Ball Park Caravan Park, Corowa Civic Bowls Club, the Council office, Corowa Caravan Park, and various sporting facilities. The second terrace, at 137-138 mAHD, includes parts of the residential area near lower Federation Avenue and south of Brocklesby Street. The highest terrace, at 140-141 mAHD, covers the area between Nixon Street and Lawrence Street. Beyond this, the town rises steeply towards its highest point near Corowa High School.
Howlong’s terrain features terraced levels, with a lower, flat terrace adjacent to the Murray River floodplain and more elevated, gently undulating areas to the north and west. The flat, lower section sits around 145-145.3 mAHD and includes a flow path, known as the Victoria Street flow path, which drains towards the Murray River floodplain near Hume Street. The upper areas, while slightly more undulating than the lower terrace, are still relatively flat. A former flow path now forms a low point near Jude Street on the town’s northern side.
Mulwala is characterised by its flat terrain, with the town's elevation consistently between 126 and 126.5 mAHD.
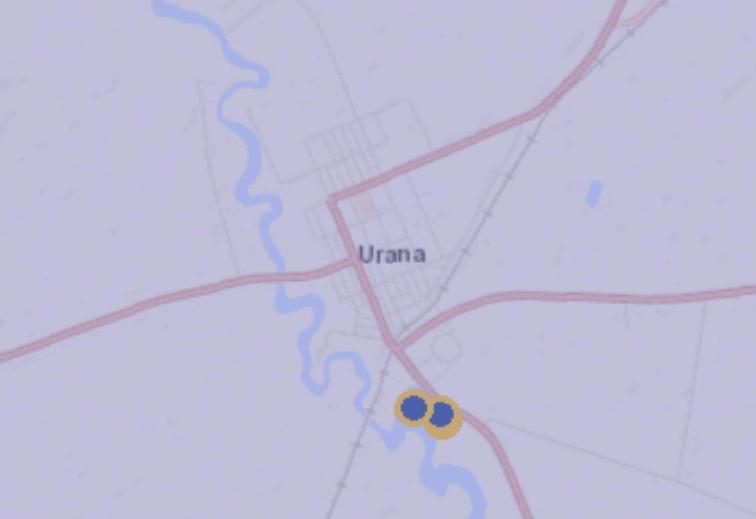
Urana’s landscape is generally flat, with elevations ranging from approximately 118 mAHD to 115 mAHD, sloping gradually from east to west towards Urangeline Creek.
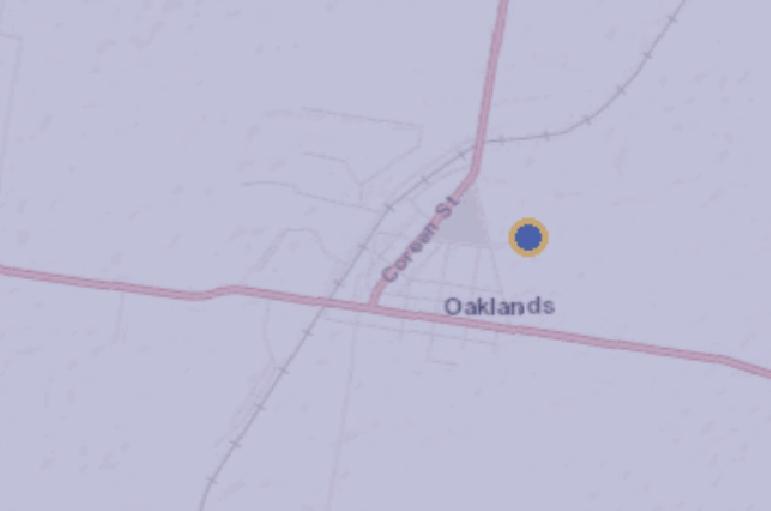
The village of Oaklands is situated approximately 2 km south of Nowranie Creek, on a small hill within the floodplain. Its peak elevation reaches around 150 mAHD, sloping down to 140 mAHD at the town's outskirts, while Nowranie Creek lies at roughly 124 mAHD. The town is divided into two main subcatchments: one drains northward through the area where the silo sheds are located, and the other drains eastward through the main township and past the football field
Table 2 Summary of topographic features of each township
Township
2.2 Flooding
Flooding in each of the towns occurs via one or both of two mechanisms, riverine flooding or pluvial flooding. A desktop review of both mechanisms has been undertaken for the respective growth areas and is summarised in this section.
The following flood studies and Floodplain Risk Management Studies and Plans (FRMS&P) were the key sources of information for this analysis:
• Flood Study for the Towns of Urana, Morundah, Boree Creek, Oaklands and Rand (Jacobs 2017)
• Federation Villages Floodplain Risk Management Study and Plan (WMAwater 2022)
o Final Report
o Appendix C – Oaklands
o Appendix E – Urana
• Corowa, Howlong and Mulwala Flood Study (WMAwater 2024)
Table 3Table 3 describes whether each township is affected by riverine flooding based on the results of each township’s respective flood study.
Table 3. Summary of Riverine flooding for each township
Township Riverine flooding characteristics
Corowa
The urban growth areas are not affected by riverine flooding (Murray River); however, some parts of Corowa, including the lower terrace near the Corowa Civil Centre, are affected.
Howlong Not affected by riverine flooding (Murray River). Affected by Majors Creek breakaway flows
Mulwala Affected by Murray River flooding
Urana
A levee is currently proposed as a mitigation measure for riverine flooding from Urangeline Creek
Oaklands Not affected by flooding from Nowranie Creek
In summary, the proposed growth areas in Oaklands and Corowa are not affected by riverine flooding. Howlong is affected by breakaway flows from Majors Creek, which is a tributary of the Murray River and flows across a wide floodplain primarily to the east of the town (see Figure 4 and Figure 5Figure 9). Riverine flooding in Urana is predominantly driven by flows in Urangeline Creek, however, it is also subject to the influence of flood runners from Billabong Creek, which interact with Urangeline Creek upstream of Urana. Running along the south-western edge of the town, Urangeline Creek is the main source of mainstream flood risk in Urana. Out-ofbank flow occurs in events as frequent as the 20% Annual Exceedance Probability (AEP) event, and four buildings are estimated to be flooded above floor level in events as frequent as the 10% AEP event, as out-ofbank flow comes around the inside of the informal levee. Urana currently has a temporary levee in place to protect the township from Urangeline Creek flooding; however, Council is currently working on a more permanent solution.
Corowa
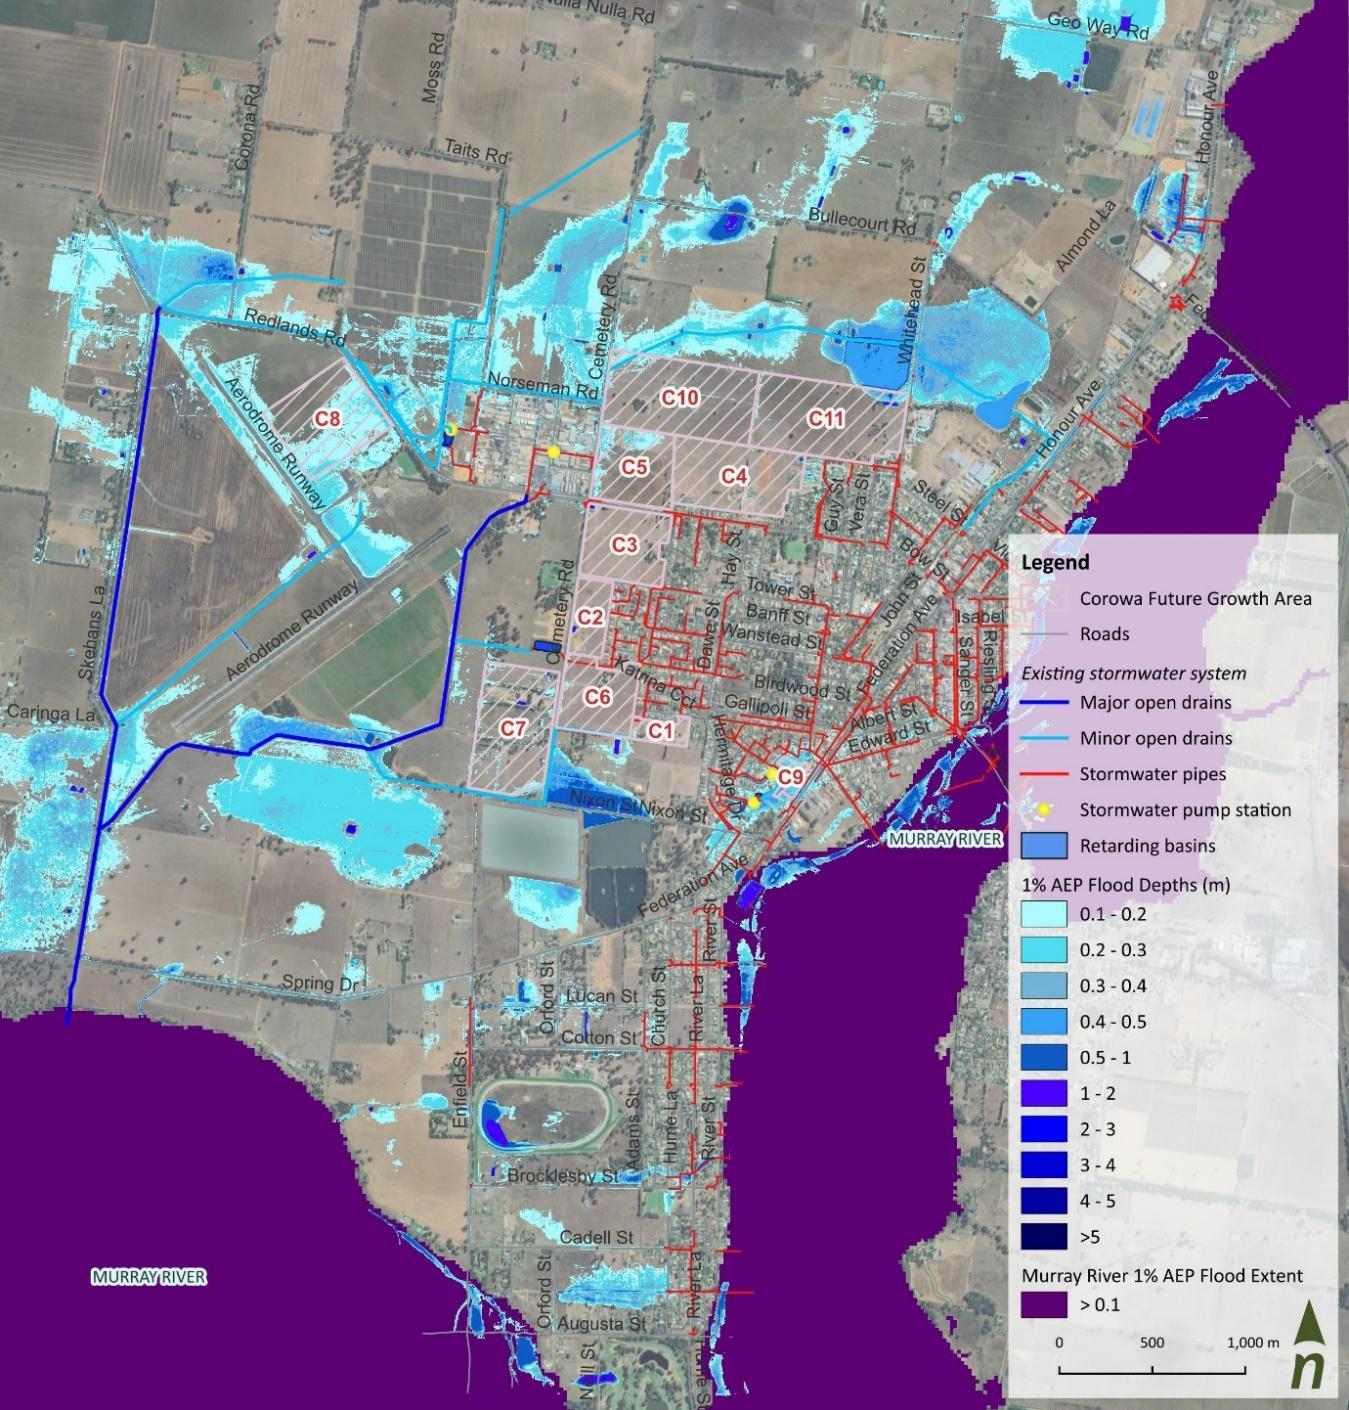
Corowa’s stormwater system is mostly made of kerb and gutter infrastructure, complemented by an underground stormwater network. In general, stormwater discharges to the Murray River On the western side of the hill, where most of the growth precincts are located, stormwater drains to the west. Here, piped and overland flows lead to an open channel that runs along the western, eastern, and southern edges of Corowa Airport before eventually discharging into Croppers Lagoon, adjacent to the Murray River. Sections of the open channel have a very low gradient and reduced efficiency due to frequent sharp bends and dense vegetation
Growth Areas C4, C5, C8, C10, and C11 currently rely on Skehans Drain and are largely unaffected by localised runoff, except for C8, which experiences occasional nuisance flooding. Precincts C1, C2, C3, C6, and C7 drain towards the Aerodrome Drain and are also not impacted by local overland flooding. Conversely, Precinct C9 is significantly affected by flooding due to trapped low points at Sophia Close and Pinot Crescent. This area relies on a 1650 mm diameter pipe that serves much of the C9 catchment. This drainage system flows south and ultimately discharges into the Murray River.
Figure 8 presents the peak flood depths during the 1% AEP flood event in Corowa, with the Murray River flood extent, existing drainage infrastructure, and proposed future growth areas. These flood results were produced for the Corowa, Howlong and Mulwala Flood Study (WMAwater 2024)
Howlong
In Howlong, low-lying areas and a significant portion of the Majors Creek floodplain are inundated during local overland flooding events, including those involving Majors Creek Figure 9Figure 9 presents the peak flood depths during the 1% AEP flood event in Howlong, also showing the Murray River flood extent, existing drainage infrastructure, and proposed future growth areas. Flood results were produced for the Corowa, Howlong and Mulwala Flood Study (WMAwater 2024)
Figure 8 Corowa 1% AEP Flood Depths (with Murray River flood extents)
During a 20% AEP event, Majors Creek flows south, crossing Howlong-Burrumbuttock Road, and west, crossing Kywong-Howlong Road, without impacting the main township. However, within the town, water begins to pond along the remnant creek line in the north, between Pell Street and Jude Street, and in low-lying areas within and west of the Howlong Recreation Reserve. In the southern part of town, near and south of Victoria Street, local flow paths overtop roads, and other low-lying areas on the western side of town also experience ponding during the 20% AEP event.
As event magnitude increases, the extent and depth of ponding throughout the town become more severe. In a 2% AEP event, Majors Creek begins to directly affect the town. In a 1% AEP event, flood depths can reach up to 0.5 metres in low-lying properties. During the PMF (Probable Maximum Flood) event, a large portion of the town is inundated, with flood depths exceeding one metre in certain areas. The Howlong urban growth areas, particularly H2 and H3, have a very large external catchment area.
Several urban growth areas intersect with these flood-prone areas Growth areas H7 (southwest), H1 (south), and H4 (central/east) are impacted by ponding along the remnant creek line, while H8 is affected by a local drainage channel. H9 is partially impacted by Majors Creek flooding on its eastern side; however, it has been zoned for industrial usage.
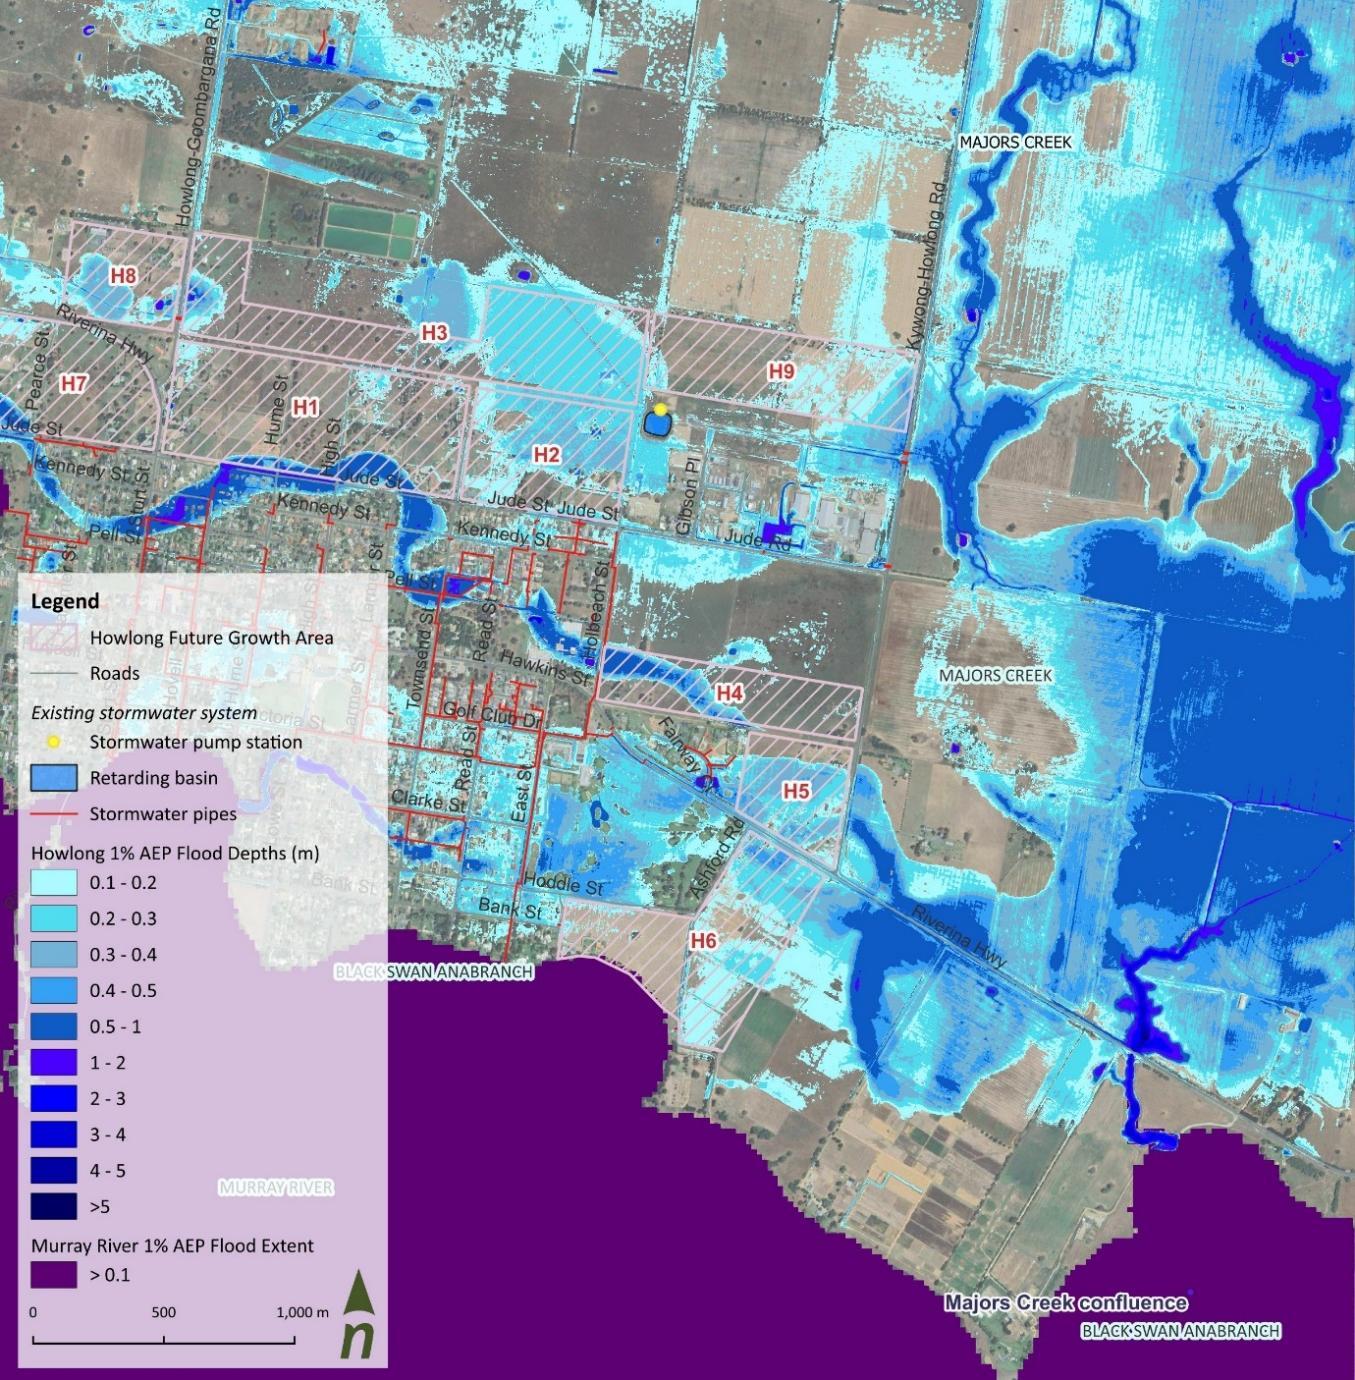
Figure 9. Howlong 1% AEP Flood Depths (with the Murray River flood extent)
Mulwala
In Mulwala, local overland flooding is primarily caused by the town's flat terrain, leading to frequent ponding during storm events. In a 20% AEP event, water begins to pond in newly developed areas near Tocumwal Road, as well as around Payne Street, Hicks Street, Manners Street, and Nyncoola Circuit. In the western part of the town, isolated areas of ponding occur in trapped low points As the severity of events increases, the extent and depth of ponding become more significant. In a 1% AEP event, flood depths range from 0.3 m to 0.5 m in the affected areas. During a PMF event, most of the town is inundated, with flood depths generally around 0.5 m, reaching up to 1 m in some locations.
Figure 10 presents the peak flood depths during the 1% AEP flood event in Mulwala, also showing the Murray River flood extent, existing drainage infrastructure, and proposed future growth areas. These flood results were produced for the Corowa, Howlong and Mulwala Flood Study (WMAwater 2024).
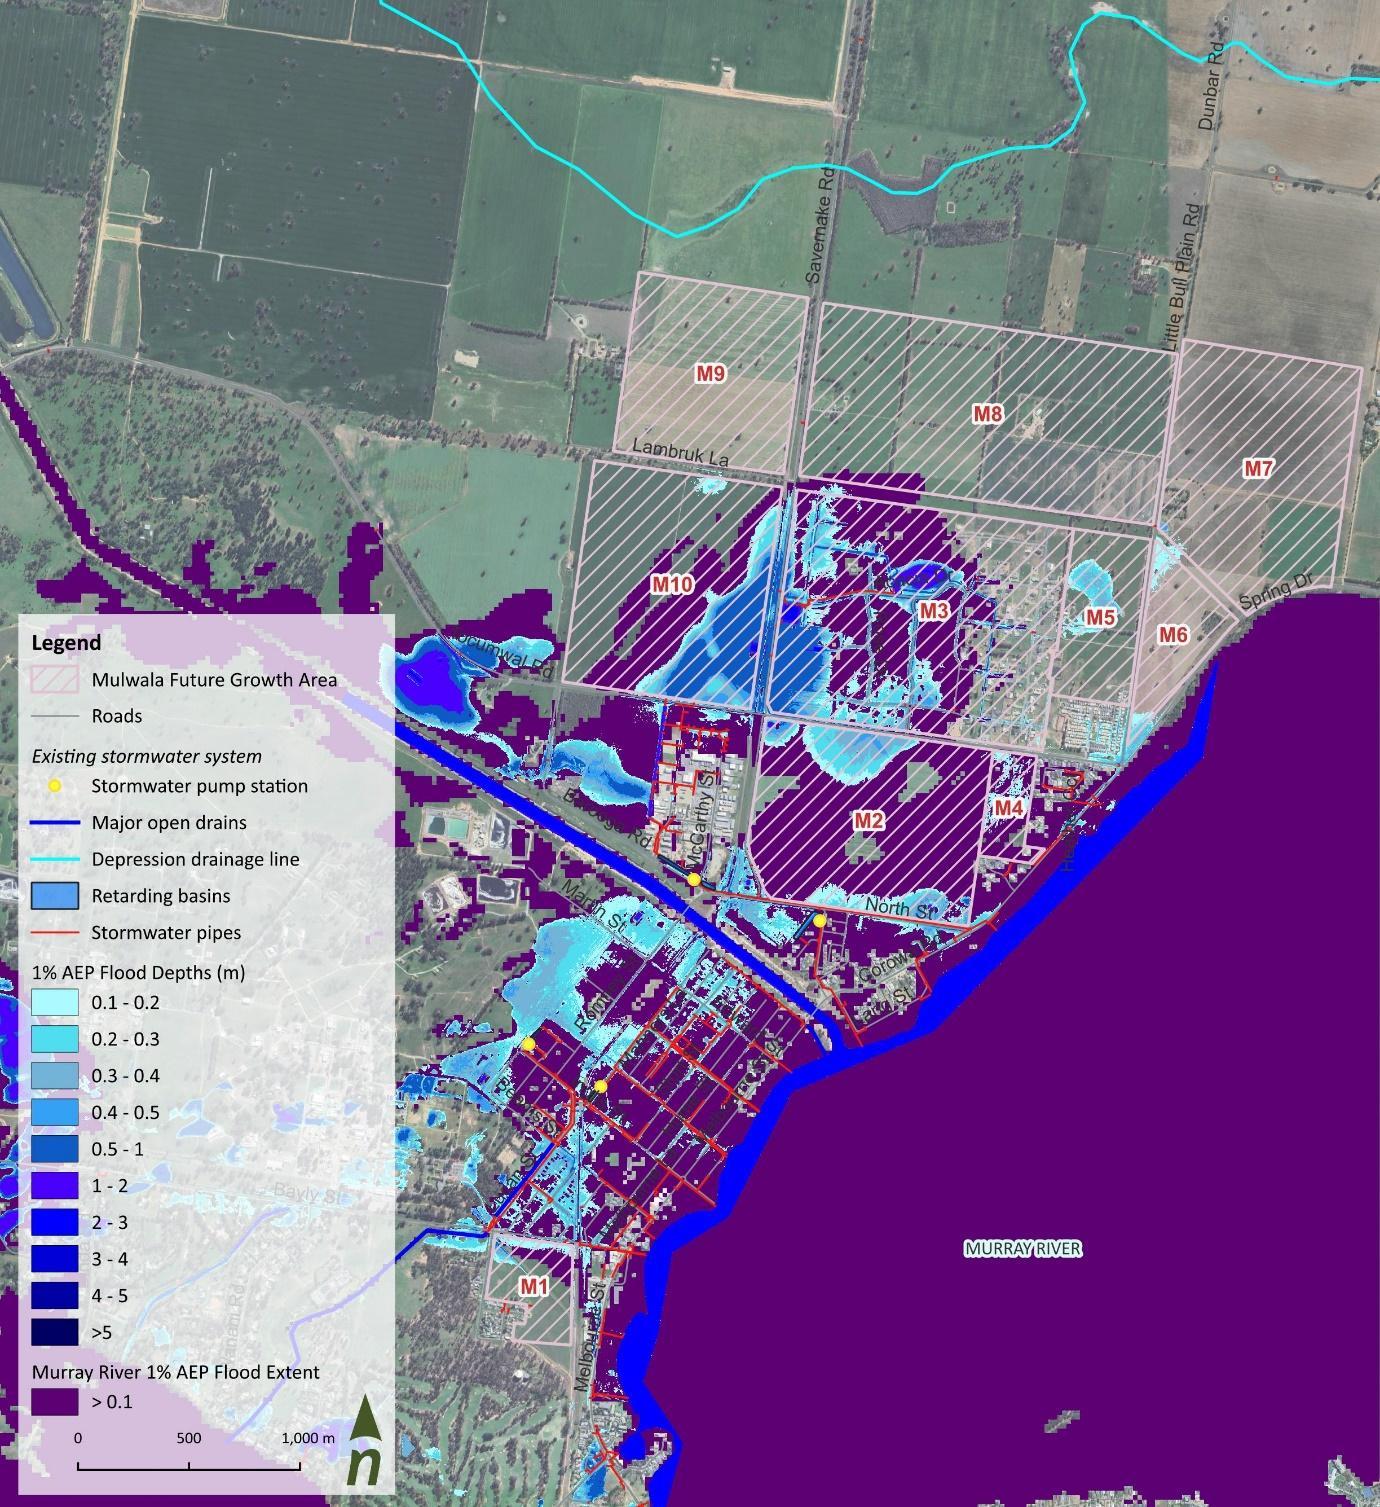
Figure 10. Mulwala 1% AEP Flood Depths (with the Murray River flood extent)
2.3 Flora and fauna
The Federation Council region in New South Wales is home to a diverse array of flora and fauna, with over 1600 recorded species. This biodiversity includes several species that are of significant conservation concern. Below is a list of notable species found in the area, along with their NSW and Commonwealth conservation statuses, respectively. This information was sourced from BioNet Atlas NSW and is relevant for the whole Federation Council LGA:
• Sloanes Froglet (Crinia Sloanei) (E1, P) (E)
• Green and Golden Bell Frog (Litoria aurea) (E1, P) (V)
• Booroolong Frog (Litoria booroolongensis) (E1,P) (E)
• Southern Bell Frog (Litoria raniformis) (E1, P) (V)
• Pink-tailed Legless Lizard (Asprasia parapulchella) (V, P) (V)
• Stiped Legless Lizard (Delma impar) (V, P ) (V)
• Grey Snake (Hemiaspsi damelii) (E1, P) (E)
• Malleefowl (Leipoa ocallata) (E1, P) (V)
• Fork-tailed Swift (Apus pacificus) (P) (C, J, K)
• White-throated Needletail (Hirundapus caudacutus) (V, P) (V, C, J, K)
Definitions of conservation statuses:
• NSW Status:
o E1: Endangered (Biodiversity Conservation Act 2016)
o V: Vulnerable (Biodiversity Conservation Act 2016)
o P: Protected (National Parks & Wildlife Act 1974)
• Commonwealth Status:
o C: Listed on China Australia Migratory Bird Agreement
o E: Endangered (Commonwealth EPBC Act 1999)
o J: Listed on Japan Australia Migratory Bird Agreement
o K: Listed on Republic of Korea Australia Migratory Bird Agreement
o V: Vulnerable (Commonwealth EPBC Act 1999)
Sloane’s Froglet (Crinia Sloanei) is an endangered species (under the Environment and Biodiversity Conservation Act 1999) with a very limited distribution in New South Wales. Significant populations are found in the Corowa region, as well as in Thurgoona-Wirlinga (near Albury) (see Figure 11); however, they have been recorded in all five of the townships to be covered by the SSP. The froglet inhabits temporarily inundated grasslands and wetlands, where it relies on specific habitat features such as shallow water bodies with emergent vegetation.
Sloane’s Froglet are a dynamic frog species and can be found in a wide range of natural and constructed wetlands. Key features that Sloane’s Froglet prefers for breeding include locations subject to periodic inundation like Gilgai (a type of wetland), wetlands with shallow, vegetated water and gentle sloping banks, and the presence of structured, small-stemmed vegetation, which is crucial for the attachment of eggs (Albury City Council, 2024)
Urban development and habitat loss are major threats to its survival. Conservation efforts in Corowa include incorporating habitat requirements into urban planning and creating artificial wetlands to support the species.
Recorded sightings and distribution of the Sloane’s Froglet in Corowa and Howlong, as well as mapped Groundwater Dependent Ecosystems, are provided in Figure 12 and Figure 13 respectively
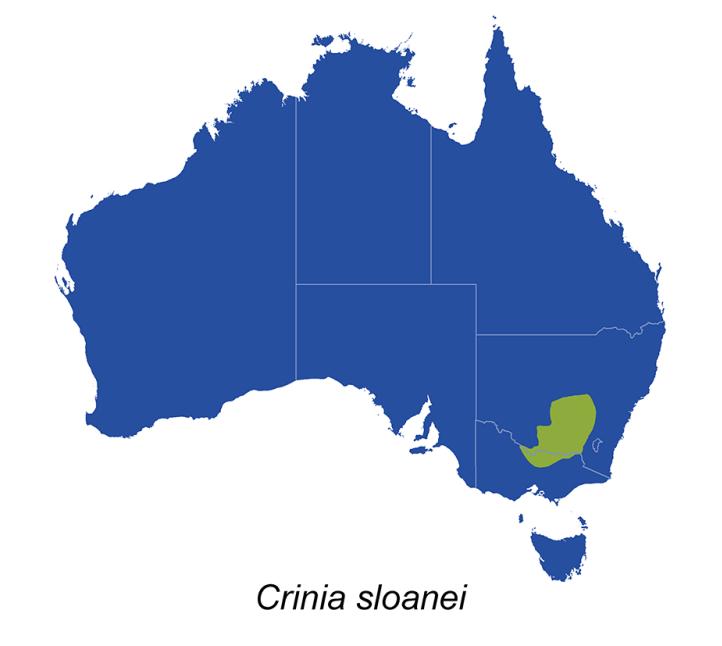
Figure 11 Distribution of Sloane's Froglet (Crinia Sloanei) in Australia from the Australian Frog Atlas (Cutajar et al. 2022)
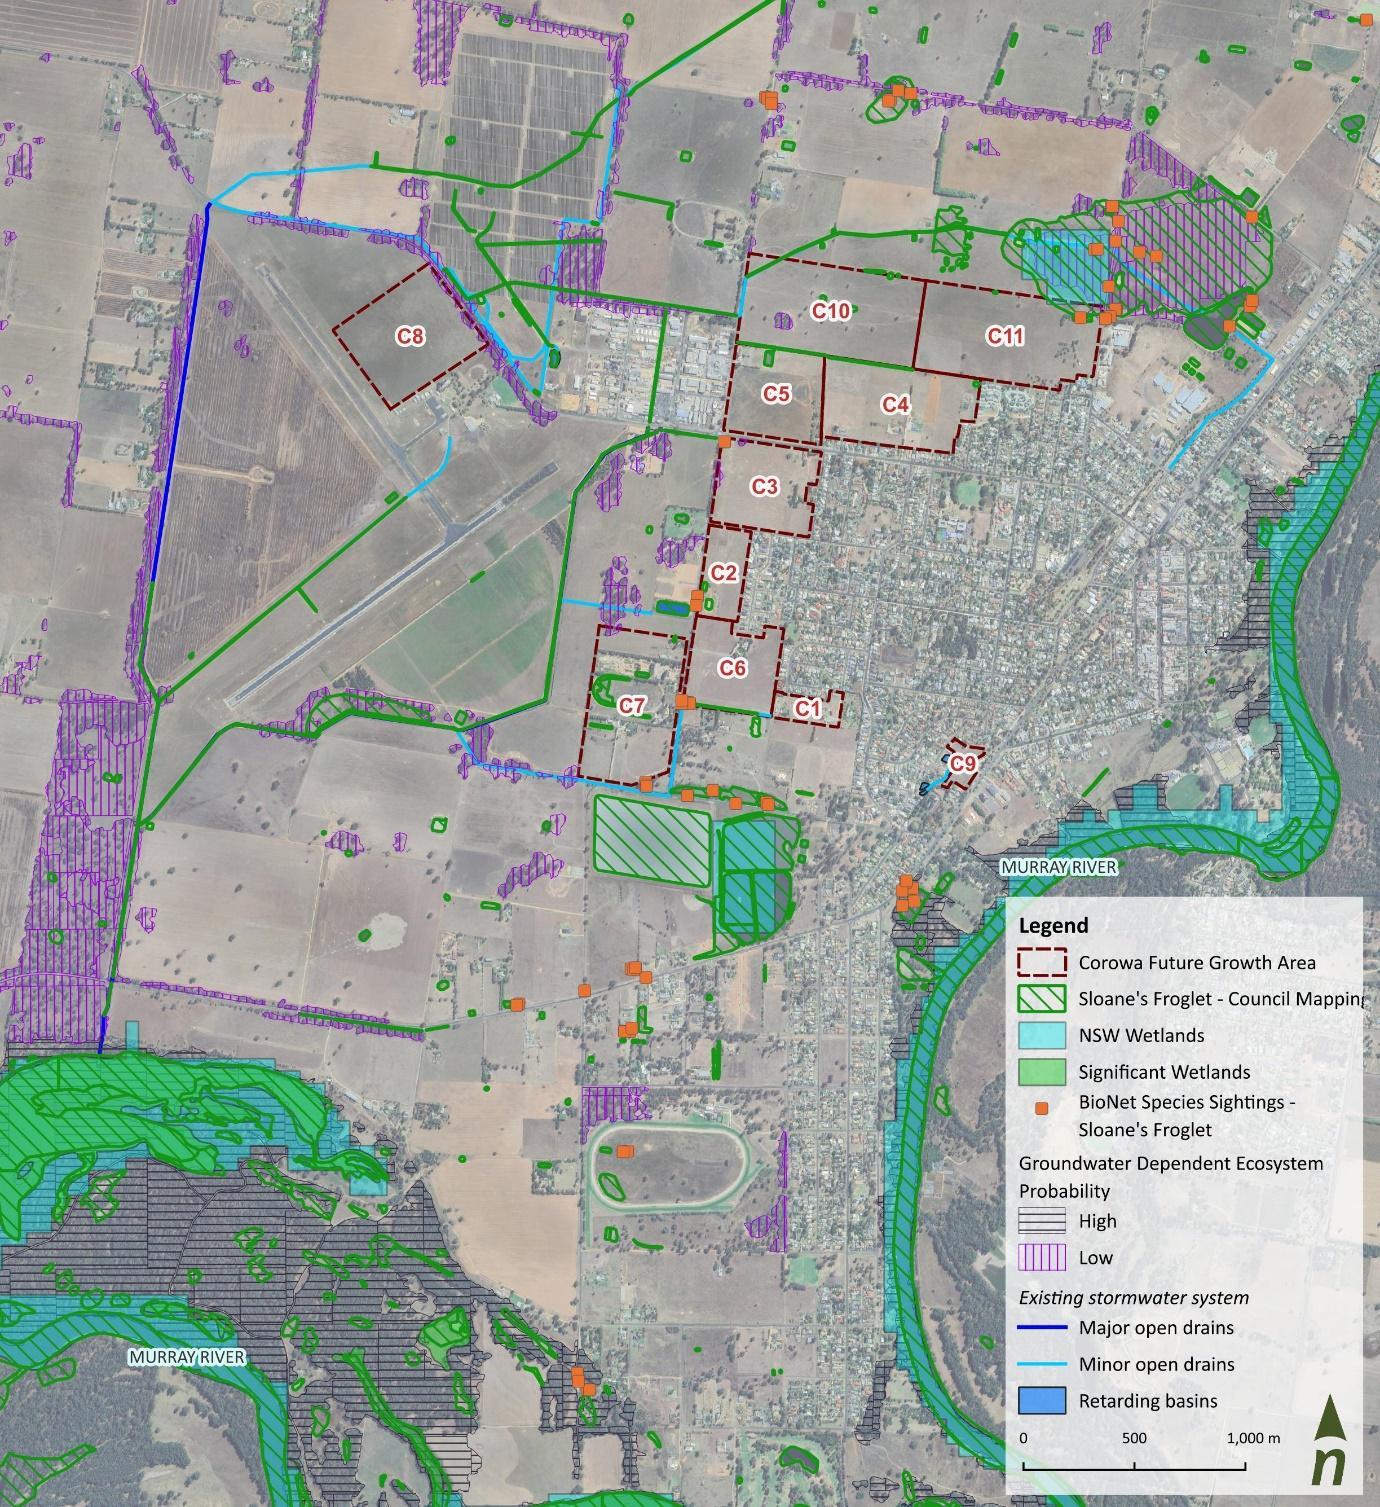
Figure 12. Distribution of Groundwater Dependent Ecosystems and sightings of the Sloane’s Froglet in Corowa
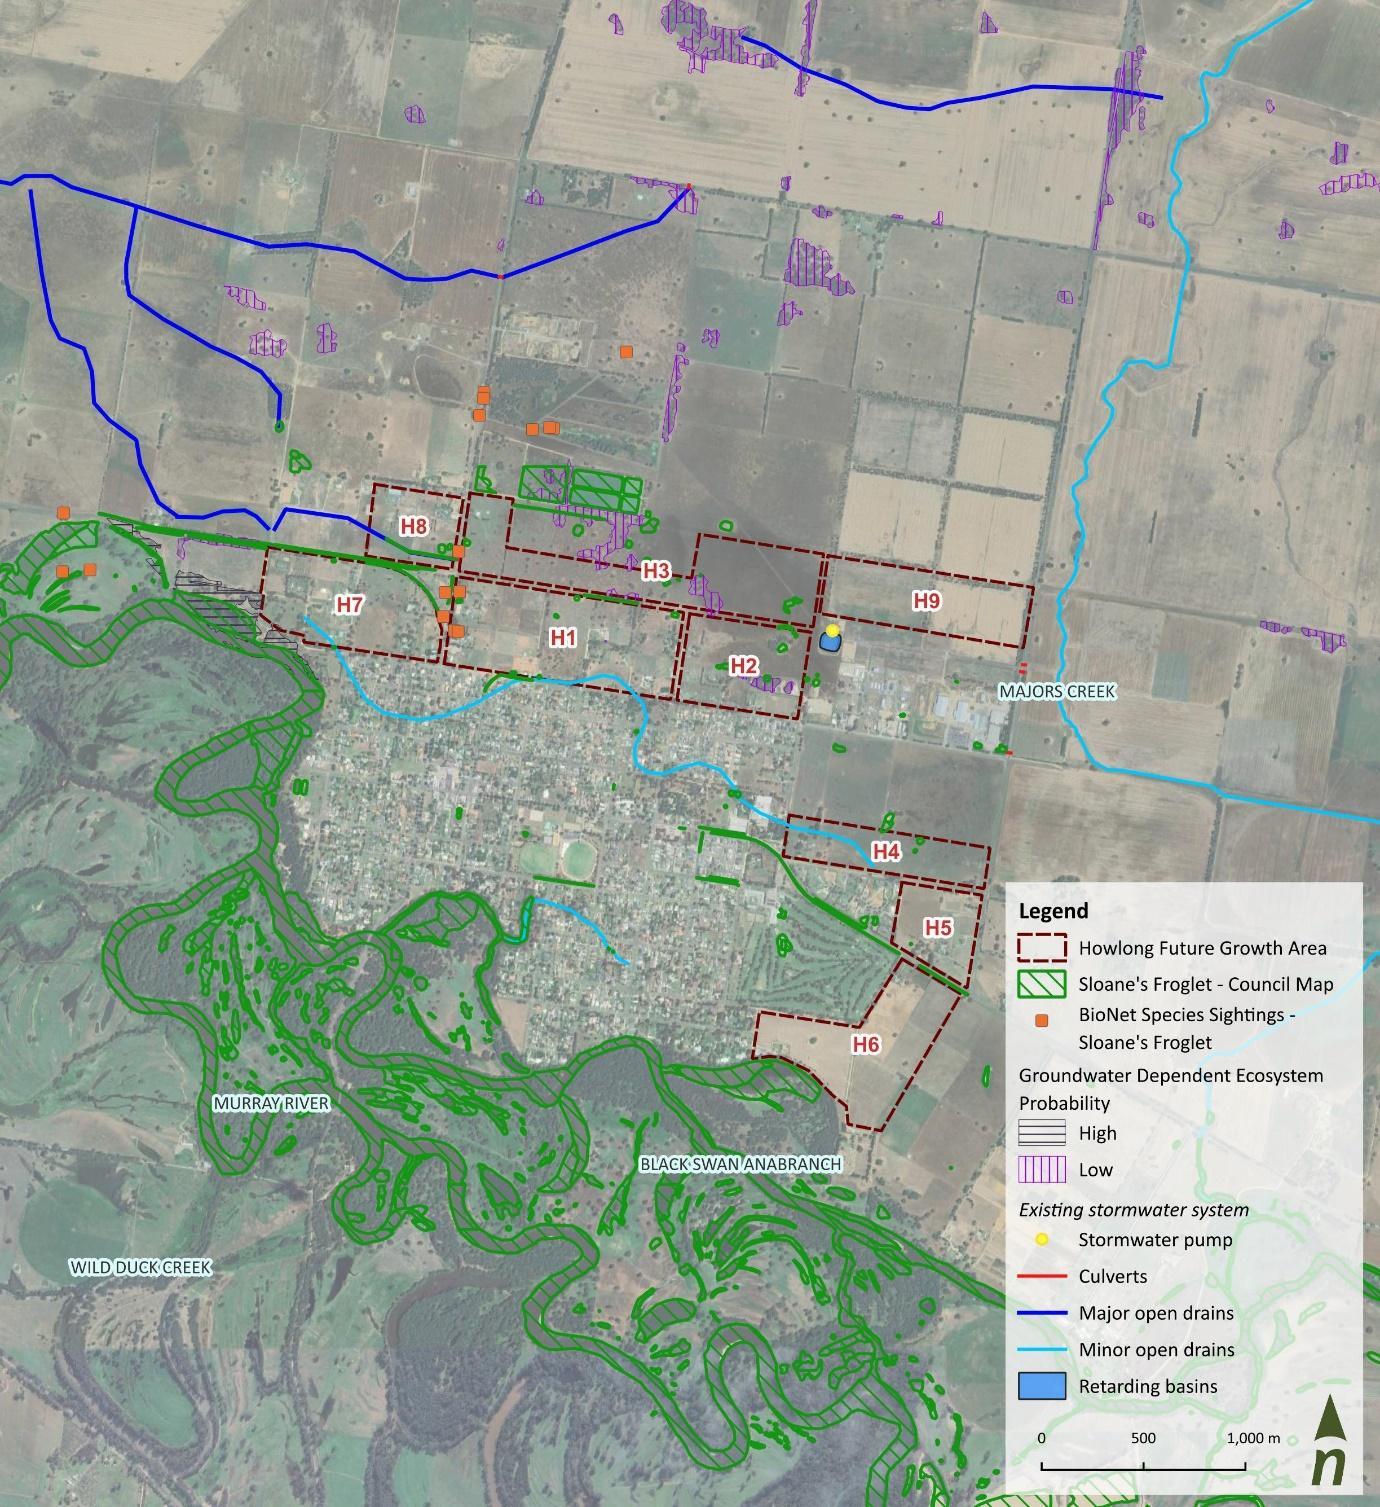
13. Distribution of Groundwater Dependent Ecosystems and sightings of the Sloane’s Froglet in Howlong
Additionally, the ‘Map of EPBC-listed of Ecological Communities occurring in New South Wales and the Australian Capital Territory’ (DCCEEW, 2025) provides indicative boundaries of areas in which threatened ecological communities may occur. In most cases, the communities have been heavily cleared and are fragmented within the boundaries. The communities which may occur in the project areas include:
• Weeping Myall Woodlands
• White Box-Yellow Box-Blakely’s Red Gum Grassy Woodland and Derived Native Grassland
• Natural Grasslands of the Murray Valley Plains
• Buloke Woodlands of the Riverina and Murray Darling Depression Bioregions
• Grey Box Grassy Woodlands and Derived Native Grasslands of South-eastern Australia
It is recommended that Council undertake a comprehensive flora and fauna assessment for the urban growth areas during detailed design.
Figure
2.4 Services and infrastructure
Many proposed urban growth areas have potable water and sewer mains passing through. In general, these appear to follow the road corridor cadastral boundaries and may not pose a large restriction on development in the areas There are also overhead electrical services crossing the urban growth areas. Overhead wiring survey will be required during detailed design to ensure there are no impacts to the electrical infrastructure.
The Federation Council Water Supply Servicing Strategy (2021) and Sewage Disposal Servicing Strategy (2021) included network augmentation options and a recommended strategy in response to the new equivalent tenements at the urban growth areas. These augmentation options have been summarised in Table 4 Planned mains predominately traverse between urban growth areas on existing roadways.
Township Description of existing utilities
Corowa C1, C2, C3, C6, C9 – 2 x sewer rising mains (1 x 150 mm and 1 x 300 mm diameter) passing through several growth areas, running parallel to Cemetery Road. The alignment of the rising main does not appear to follow any current road reserve/ corridor delineation.
C7 – Overhead electrical wiring servicing the existing properties on the growth areas
Howlong H7, H8 – Overhead electrical wiring passing through centre of lots.
H1, H2, H3, H6 – Potable water and sewer mains through the growth areas.
Mulwala M1 – Two rising sewer mains through the growth area, one alongside the abandoned rail track and the other through the property corner.
M2 – M9 – Minimal existing utilities through the growth areas.
2.5 Geology, soils and groundwater
Description of proposed utilities
250 – 300 mm diameter potable water mains in similar alignment to existing along Cemetery Road, and new mains along Redlands Road, Tower Street, and Dawe St.
150 – 225 mm diameter sewer mains also along Cemetery Road and Redlands Road. A new treatment plant is proposed alongside C4.
250 – 300 mm diameter potable water mains along the unnamed proposed road corridors between the urban growth areas.
150 – 300 mm diameter sewer mains along Hume Street, Jude Street, and High Street.
225 – 375 mm diameter potable water main along Savernake Road, Tocumwal Road, and Little Bull Blain Road.
200 – 225 mm diameter sewer mains along the same roads as the potable water mains.
The townships lie on ground that predominantly belongs to the Shepparton geological formation (Department of Planning, Industry and Environment, 2025). A geologically recent formation, originating in the Cenozoic era and likely formed within the last 1.6 million years, the Shepparton Formation is characterised by sediments of alluvial (river transported) and aeolian (wind transported) origin (Agriculture Victoria, 2020). Largely deposited by ancient river and stream systems, the sediments found within this region are mostly composed of silts, sands, and clays in the form of a regolith. As such, the surface geological layers in Corowa, Howlong, Mulwala, Oaklands, and Urana are often very loose and unconsolidated. The proximity of these towns to the Murray River, however, signifies that some of the land they are on is of a much more recent alluvial origin (State Government of NSW and Department of Primary Industries and Regional Development, 2025). Deposited by the Murray River itself, the sediments along its banks are very fine sands, clays, and silts originating from areas upriver. Aside from these two main sediment types, the townships have small variations in rock types in some of their lands. For example, Corowa is partly settled on Ordovician sedimentary rocks such as sandstones and
Table 4 Summary of utility features of each township
mudstones, whereas Mulwala has a lake to the east, likely containing recent organic sediment at its bottom, Silurian sedimentary rocks to the west (sandstones and siltstones, with some metamorphic slate and quartzite), as well as unconsolidated sands forming dunes and created by wind action Howlong, on the other hand, only has the two alluvial sediments in its surface geology
Similarly, soil types within all the townships often overlap with all five sharing the same vertosols of grey, brown, and red clay All but Mulwala also share a significant proportion of land with chromosols of red-brown earths Additionally, Urana and Oaklands have red soils of the kurosol type, whilst Mulwala, with its eastern sand deposits, has rudosol soils of a sandy nature (Department of Planning, Industry and Environment, 2025) Based on these soil types, the infiltration capacity tendencies can be extrapolated. The areas with vertosols are characterised by very slow infiltration, whilst chromosols and kurosols have slow infiltration (Department of Planning, Industry and Environment, 2025). Only the rudosols around Mulwala stray from this trend and have a very high infiltration capacity.
Aquifers within the area are typically unconfined to semi-confined, largely due to the unconsolidated sediments of the local rock formations (Department of Planning, Industry and Environment, 2025). A further result of this, is that conductivity and transmissivity are moderate, whilst infiltration and recharge can be high. Some localised perching has been recorded in the areas surrounding Howlong and Corowa, primarily where clay contents are higher than average. Typically, the water table at these locations is shallow, having been recorded at 8-12 m below surface levels (WaterNSW, 2025). Similarly, at Mulwala, groundwater has previously been encountered at 12 m below surface.
2.6 Contamination
Whilst no contaminated soils were found to be present within the project sites, three contaminated sites were found in Corowa and one in Mulwala. All four of these were significantly outside of the project site boundaries, however.
2.7 Cultural heritage
Federation Council land is located within Bpangerang (also spelled Bangerang, Pangerang, or Bangarang) and Wiradjuri Country.
Bpangerang territory is typically identified as covering the approximate area between Echuca and Wodonga, predominantly south of the Murray River. A section of the land inhabited by the Bpangerang People also extended north of the river and included the current locations of the towns of Mulwala, Corowa, and Howlong (Deadly Story, n.d.) Some sources also include Bpangerang land as extending north into Oaklands and Urana.
Similarly, Wiradjuri land covers all of the current location of the five towns, and historically extended from Hay in the West to Lithgow in the East, and past Dubbo in the North. Its southern boundary is frequently represented as the Murray River, making the towns of Corowa, Howlong, and Mulwala, located on or near the southern limits of Wiradjuri Country (AIATSIS, 1996). The Wiradjuri community is cited as the largest Aboriginal group in NSW (Narrandera Shire Council, n.d.)
A basic Aboriginal Heritage Information Management System (AHIMS) search was performed to determine whether any Aboriginal archaeological sites were present on the locations of the project. Exact details of the sites were not obtained, but general locations indicated that three to four sites are recorded on the proposed development sites in Mulwala, whilst 17 sites in total were identified around the town. No AHIMS sites were discovered for the proposed locations in the remaining towns; however, 24 Aboriginal sites were recorded around Corowa, 3 around Urana, 1 around Oakland, and none around Howlong. Figure 14 to Figure 17 show the approximate locations of the Aboriginal sites for the four towns.
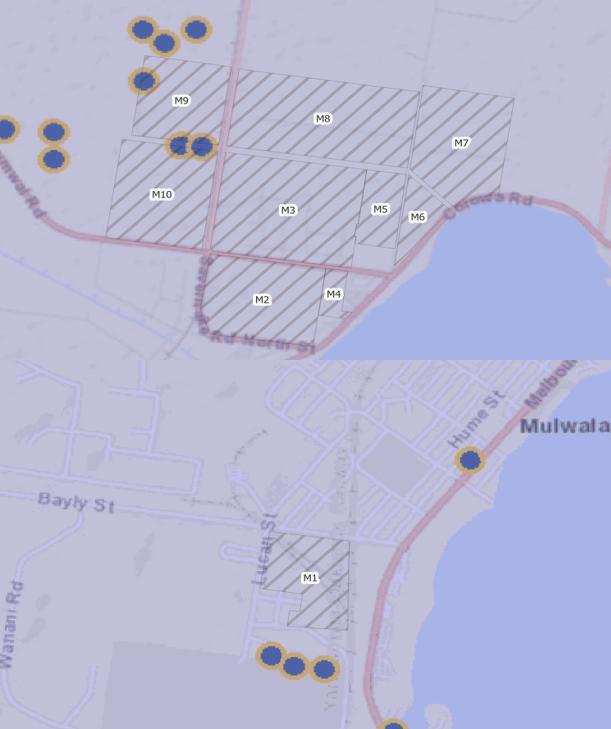
Figure 14 Aboriginal sites around Corowa. Sourced from AHIMS
Figure 15 Aboriginal sites around Mulwala. Sourced from AHIMS.
A Historic Heritage Information Management System (HHIMS) search was also performed but yielded no results for European Heritage sites around the five towns.
Figure 16 Aboriginal site around Oaklands. Sourced from AHIMS.
Figure 17 Aboriginal sites around Urana. Sourced from AHIMS.
3 Summary of design objectives
Based on the main design objectives and considerations provided by Federation Council, a set of desired outcomes and technical objectives have been developed under the key themes shown in Figure 18 and described in Table 5
Stormwater infrastructure planning
1. Assess capacity of existing infrastructure
2. Identify upgrades/ sizing to existing infrastructure
3. Determine sizing of new infrastrucuture
4. Determine land take and staging
Environmental impact and biodiversity
5. Protect and enhance
6. Support existing ecosystems
Water quality
7. Alignment with guidelines
8. Protect and enhance
Flood mitigation
9. Mitigate impacts on existing flooding conditions
10. Improve conditions
Community and public amenity
11. Encourage connectivity
12. Prioritise amenity
Figure 18 Key project themes and desired outcomes
Key theme Desired outcomes
Stormwater infrastructure planning
1. Assess the capacity of existing infrastructure: assess the capacity of the existing infrastructure to cater for increased or changed flows from the future growth areas.
2. Identify needed upgrades to existing infrastructure: identify any necessary upgrades to existing downstream infrastructure where stormwater from the future growth areas will be conveyed on route to receiving waters.
3. Determine sizing of new infrastructure: identify and assess the stormwater infrastructure required to service the future growth areas. Determine the appropriate size of conveyance and water quality treatment infrastructure including any necessary peak flow detention infrastructure.
4. Determine take and staging: Endeavour to minimise the land take required to accommodate the necessary new and upgraded stormwater infrastructure.
Technical objectives
• For all urban growth areas in Corowa, Howlong and Mulwala (except M3 and C9), design the internal overland flow paths to convey major flows (1% AEP).
• For all urban growth areas in Corowa, Howlong and Mulwala (except M3 and C9), nominate types of stormwater infrastructure that will convey the minor system flows (i.e., 10% AEP or 20% AEP depending on zoning per the Federation Council Engineering Standards). Should there be any challenges conveying the minor event, site specific responses to challenges will be nominated (i.e., excessive pipe sizes, tailwater constraints, flat topography).
• For all urban growth areas in Corowa, Howlong and Mulwala (except M3 and C9) where there are changes to land use design stormwater infrastructure to attenuate fully developed stormwater runoff rates to the equivalent pre-development peak flow rates up to the 1% AEP event. This may include the design of new assets, and assessment of existing infrastructure including open channels, or retarding basins/ stormwater detention systems
• For infill development area C9 (Corowa) review existing stormwater infrastructure, and the options proposed within the Council Internal Report – Sophia\ Pinot Stormwater Drainage Investigation Preliminary Report (November 2023). Options are to be sized and selected based on their approximate cost, and ability to meet the specific flooding objectives for this site and service the urban growth areas.
• For infill development area M3 (Riverland Gardens Estate, Mulwala) review the existing drainage configuration for effectiveness in conveying the major and minor flows (design report and WAE available) and suggest improvements.
• Develop a staging strategy that will best suit the probable sequence of development of the future urban growth areas.
Environmental impact and biodiversity
5. Protect: Minimise any adverse environmental impacts associated with establishing the new and upgraded infrastructure to protect the health of the downstream receiving waterways and surrounding environment.
• Design stormwater infrastructure to maintain connectivity and/ or increase key habitat for Sloanes Froglet where they are known to exist.
Key theme Desired outcomes
6. Enhance: Enhance habitat through biodiversity sensitive stormwater infrastructure where possible.
7. Support existing ecosystems: Design stormwater infrastructure with consideration of how the system can continue to supply runoff/ water to the existing trunk drainage channels, retain open space vegetation and support biodiversity that exists throughout the catchments, particularly Sloanes froglet.
Technical objectives
Water quality
8. Alignment with guidelines: Ensure that the stormwater servicing plans align with the relevant plans and guidelines, including; the Australian and New Zealand Conservation Council (ANZECC) Guidelines and the Murray-Darling Basin Plan and the ‘Sloane’s Froglet Stormwater Wetland Design Guidelines’ (ACC & OEH 2017).
9. Protect and enhance: Demonstrate that the servicing plans aim to not only protect these objectives, plans and targets where they are currently being met, but also contribute to achieving the water quality objectives and benefits over time in areas where they are not yet met.
• Pollutant reduction targets: Adopt water quality pollutant reduction targets as objectives for development areas whenever feasible. The performance against these targets can be demonstrated using the Model for Urban Stormwater Improvement Conceptualisation (MUSIC) software by eWater, where the developed (treated) scenario is modelled and compared against targets established from the developed (untreated) scenario to confirm if the targets are achieved.
Based on the ‘Sloane’s Froglet Stormwater Wetland Design Guidelines’ (ACC & OEH 2017), the following percentage pollutant reduction targets are recommended:
• Total Suspended Solids – 80%
• Total Phosphorus – 45%
• Total Nitrogen – 45%
• Gross Pollutants – 90%
• Use the MUSIC model to estimate the quantities of key stormwater pollutants generated, evaluate potential impacts and demonstrate pollutant reductions achieved through proposed treatment systems
Flood mitigation 10. Mitigate impacts on existing flooding conditions: assess what is required to ensure that future development within the proposed urban growth areas does not have a negative impact on existing flooding conditions.
11. Improve conditions: improve or not worsen major riverine or overland flooding conditions.
• Apply the principles of avoidance, minimisation, and mitigation to flood risk management. The focus is on reducing social and financial costs, limiting community risks on the floodplain, and enhancing the sustainable use of floodplain resources while protecting dependent ecosystems.
• Evaluate the current and future flood risk to existing communities and future developments considering how climate change may alter flood behaviour, hazards, and risk over time. This assessment should guide longterm floodplain management and inform land-use decisions to reduce the community's exposure to future risk
Key theme Desired outcomes
Technical objectives
• Analyse the role of infrastructure in flood behaviour, including the potential impacts of new or upgraded infrastructure on flood risk. Incorporate mitigation measures such as detention/retention basins, waterway modifications, and flood-compatible zoning in high-hazard areas to reduce risks. Ensure that infrastructure planning aligns with floodplain management objectives by considering its role in emergency management (EM), including response, recovery, and continuity planning for critical services.
• Consider the importance of community awareness of flood risks, including rare or extreme flood events. This should include considerations for public education on evacuation routes, flood warnings, and preparedness measures to enhance overall community resilience and support the development of future emergency management plans.
• Stormwater detention/ retention infrastructure is to be designed to protect the downstream adjacent properties and receiving infrastructure (i.e., open channels).
• With the aforementioned objectives taken into consideration, use TUFLOW to:
i. Model a range of flood sizes, from including 20%AEP, 2%AEP, 1% AEP, and PMF
ii. Ensure no reduction in existing flood storage volume
iii. Ensure no reduction in existing flood conveyance
iv. Ensure no increases in flood level to downstream properties
• For C9 in Corowa we wish to achieve the criteria below, as adopted by Council’s engineering staff at a meeting on the 14th November, 2023.
i. 1% AEP flood level post works – 137.4 m AHD
• Protects all houses from 1% AEP above floor flooding
• Allows emergency evacuation
• Garages are typically 0.1 m below the house floor level and will also be protected
ii. 20% AEP flood level post works – 136.9 m AHD
• Roadway conditions remain trafficable
• Major improvement compared to current conditions
Key theme Desired outcomes
Community and public amenity
12. Encourage connectivity: Link conveyance and water quality treatment assets through a linear waterway where possible, incorporating open space, landscaping, ecology and native vegetation where practical.
13. Prioritise amenity: Endeavour to maximise the amenity and usability of the new and upgraded infrastructure to integrate with the future urban growth areas
Technical objectives
• Design cost sensitive stormwater improvements with public amenity benefits for Urana and Oaklands.
4 Summary of options analysis
Options identification and analysis were undertaken following the Stage 1 review of existing conditions, model consolidation, and identification of design objectives. The options identification was focussed on finding suitable methods of addressing the project objectives, and considered the following key factors and inputs within each township:
• Topographic relief
• Flood mapping
• Existing stormwater infrastructure
• Location of farm dams
• Existing and proposed utilities
• Incoming catchment sizes
• Land use and changes to land use
• Presence of Sloane’s Froglet
Understanding and utilising topographic relief was a key consideration for options identification in the flatter townships of Mulwala and Howlong. A grading analysis was undertaken for each township using LiDAR data, delineated subcatchments, and flow paths derived from CatchmentSIM. This grading analysis was used to determine the location of natural low points and preferred alignments of stormwater infrastructure. Utilising natural low points would ultimately minimise the excavation volumes and lengths of stormwater infrastructure and ensure that the systems are able to discharge effectively.
The options for Corowa, Howlong, and Mulwala could be categorised into two overarching typologies: the chain of ponds and centralised basin typologies. These are further discussed in Section 8.1 relative to the concept designs that were ultimately adopted, though with a preference for the chain of ponds typology.
To assess the areas required for flood storage, conveyance, and water quality, and to compare various options, a unit base case approach was adopted. This approach involved examining a select number of representative catchments in Mulwala and included developing more detailed designs specific to two urban growth areas, and creating catchment/ growth-area based ratios. The unit base case approach has been continually adopted through the concept design however significant refinements have been made to the methodology to consider the updated design inputs. This is further discussed in Section 6
A multi criteria assessment (MCA) of the options was undertaken which considered criteria such as cost, functionality, climate adaptability, biodiversity impacts and environmental factors, land take, and community and public benefit. The MCA was weighted resulting in the following options ranking:
1. Chain of ponds – score of 48.5
2. Centralised basins with swales – 44.5
3. Centralised basins with pipework – 34.5
Following the MCA, Council confirmed their preference for the chain of ponds stormwater typology. This typology has been further developed as part of the concept design where possible, inclusive of refinement of the hydrological modelling, physical modelling within 12d and AutoCAD, and hydraulic assessment. Centralised basins (WLRBs) were proposed in some growth areas where chain of ponds were not feasible. The concept design refinement is discussed further within this report. Refer to the Federation Council Stormwater Servicing Plans – Options Development and Assessment report (Alluvium, 2025) for a full description of the MCA process and outcomes.
5 Review of existing stormwater issues
As part of the development of the SSP’s for Corowa, Howlong, and Mulwala, Council have highlighted key areas where there are issues with the existing stormwater system that impact existing development or are expected to impact proposed urban development. The sections below provide an assessment of the issues within these areas.
5.1 Sophia Close and Pinot Crescent basins
There are two existing, hydraulically linked stormwater retarding basins servicing the area surrounding Sophia Close and Pinot Crescent in Corowa These basins are adjacent to the urban growth area C9 Flooding problems have been present within this area since the development of the area in the early 1990’s, which included the construction of the flow retardation basin adjoining Pinot Crescent. As the area has been progressively developed since the impacts of flooding have increased (Federation Council, 2023).
Federation Council (2024) undertook an investigation and review of the stormwater drainage infrastructure servicing the area and proposed several options for mitigation of the flood issues These options included a new outfall drain from the basins to the Murray River, additional retardation, and upgrades to the size of the existing outfall drains. Several revised configurations that combine enhanced inlet conditions (i.e. widened and regraded swales) with upgraded pipe infrastructure have been tested and assessed through refinement of the existing hydraulic model as part of this project
The hydraulic assessment showed that increasing the outfall capacity provides measurable reductions in basin flood levels; however, flood mitigation benefits plateau beyond a dual-barrel (2x1200 mm) configuration. Several revised options achieved the improved flood levels both within the 1% AEP and 20% AEP events however consideration should also be given to the desired accessibility to Sophia Close, particularly during the 20% AEP event In addition to these options, modifications to local drainage connections into the Sophia Close and Pinot Crescent basins were also recommended to improve drawdown of trapped low points These recommendations have been made independent to stormwater servicing plans for urban growth area C9.
Refer to Appendix F for the hydraulic options assessment of the Sophia Close and Pinot Crescent basins.
5.2 Mulwala M3 – Riverland Gardens Estate stormwater infrastructure
The Riverland Gardens Estate (M3) in Mulwala has also faced challenges with its stormwater drainage system
The estate civil works were completed in 2020 with approximately 60% of the lots being developed within the estate since then. A central infiltration basin was designed to meet the estate’s stormwater servicing needs; however, the basin has underperformed, resulting in several overflow incidents, particularly in 2022
Efforts have been made to alleviate issues with the basin; however, these have not resulted in any improvements to performance A review of the stormwater infrastructure was undertaken to determine the cause of performance issues with the infiltration basin and recommend actions for stormwater management
There are several factors that are likely impacting the performance of the infiltration basin, including assumed in-situ infiltration rates, the size of the incoming catchment, existing hydrogeological conditions, and basin operations and maintenance plans Recommendations to improve performance of the existing infiltration basin include improving maintenance, modifying inlet arrangements, increasing storage capacity, and considering alternative stormwater strategies for future developments, especially given the hydrogeological constraints of the area.
Refer to Appendix G for the stormwater infrastructure review at the Riverland Gardens Estate.
6 Hydrological modelling
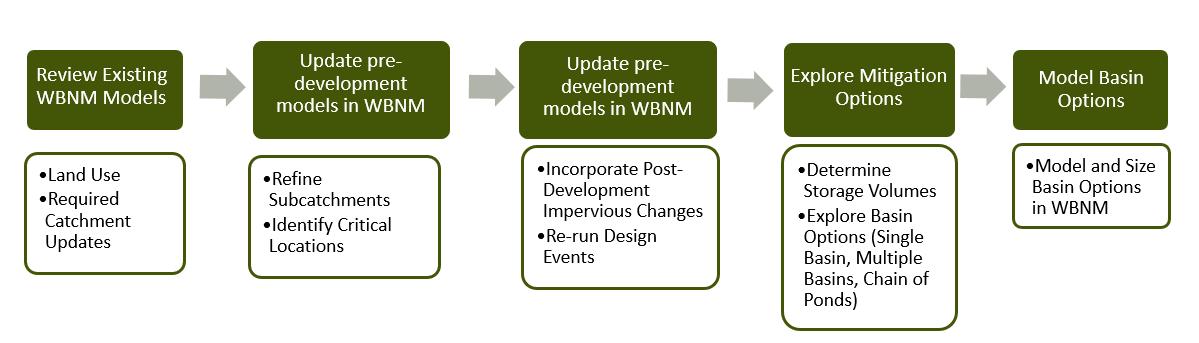
The aim of the hydrological analysis is to support the development of the concept design. This has involved:
• Reviewing and updating the existing WBNM hydrological models for the townships of Corowa, Howlong, and Mulwala
• Updating the existing hydraulic models for the purpose of checking flooding impacts of the development.
• Exploring mitigation options by determining storage volumes and sizing basins for flood mitigation.
The broad methodology of the hydrological modelling process is shown in Figure 19
19 Hydrological approach overview
The Corowa, Howlong, and Mulwala Flood Study (WMAwater, 2024) involved the development of three WBNM hydrological models – one for each township – to generate subcatchment inflows for input to the hydraulic modelling component of the flood study. To align with the specific objectives of this assessment, the existing hydrological models required targeted refinements. These updates included adjustments to land use classification, refinement of subcatchment resolution, and delineation of additional upstream catchment areas. The modifications were limited to catchments relevant to the identified development areas and are detailed in the sections below
Definitions of pre-development, post-development, and mitigation scenarios referred to in the following sections are provided in Table 6
Table 6 Definitions of pre-development, post-development and mitigation scenarios Scenario Definition
Pre-development
Post-development
Mitigation
Catchment linkage has been established while the land use is the original land use.
Catchment linkage has been established, and land use has been developed. Mitigation has not been added in, but the links between the subcatchments that will be present for the chain of ponds or centralised basin scenarios are used.
For the chain of ponds or centralised basin scenarios. Catchment linkage has been established, land use has been developed, and basins have been used to mitigate the outflow to the pre-development conditions.
Figure
6.1 Pre-development model
Land use
In the original hydrological model, a uniform Effective Impervious Area (EIA) of 5% was applied to both farmland and rural residential land uses. Within the Mulwala township, development area M3 was initially classified as farmland, and assigned an EIA of 5%. However, analysis of high-resolution satellite imagery indicated that the Total Impervious Area (TIA) within the residential portion of M3 is approximately 17.3%. Applying the same EIA/TIA ratio used in the existing model, this corresponds to an adjusted EIA of approximately 10%.
As a result, an EIA of 10% was adopted for M3 and extended to other areas characterised as rural or low-density residential development across the three townships. The updated land use classifications and associated EIA values are summarised in Table 7
30 for Corowa & Mulwala 20 for Howlong
30 for Corowa & Mulwala 20 for Howlong
Catchment
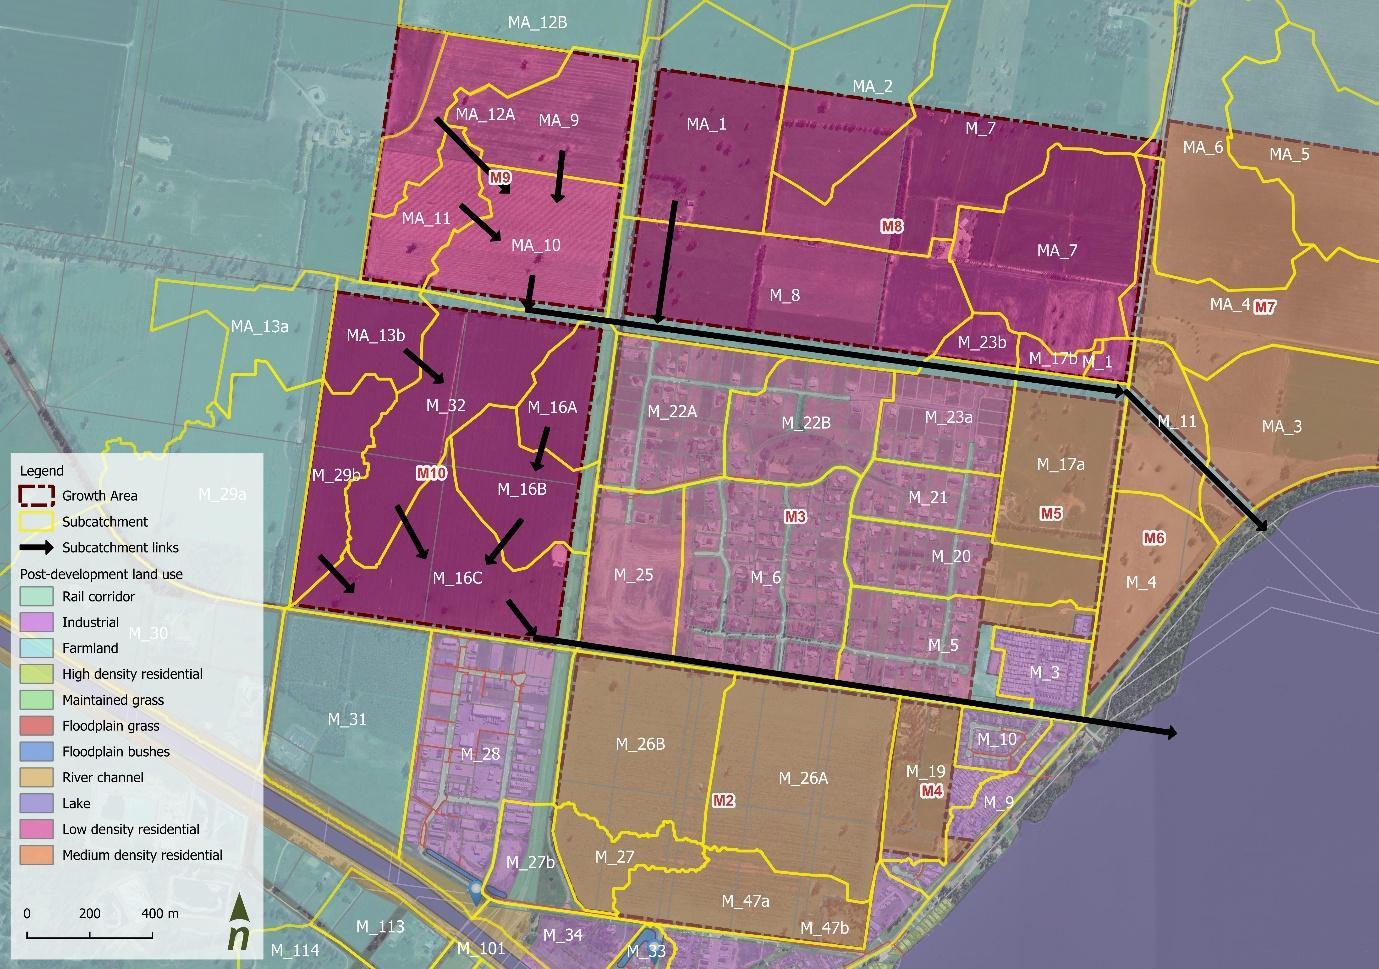
The existing hydrological model for Mulwala did not fully encompass the designated development areas specifically, catchments corresponding to M7, M8, and M9 were absent. Furthermore, the original model lacked LiDAR coverage for the northern extent of Mulwala, where these areas are located. To address this, supplementary 5 metre LiDAR data (2015) was sourced, and updated catchment delineation was carried out using CatchmentSIM (refer Figure 27)
Catchment boundaries of the existing model for Corowa were further divided according to development parcel boundaries along C1, C4, C5, C6, C10 and C11. Streamlines from CatchmentSIM were used to split a subcatchment in two around C7 to better represent flow directions.
Catchment boundaries for the existing model for Howlong were considered sufficient for modelling purposes, and no further delineation was undertaken.
Critical locations and sub-catchment resolution
To assess changes in hydrological response between pre- and post-development scenarios for each development area, critical flow hydrographs were required at the outlet(s) of each area. These outlet locations defined as the downstream points capturing runoff from individual development parcels serve as the critical locations for hydrograph extraction. Depending on local topography and flow direction, some development areas have multiple outlets.
To obtain representative flow hydrographs at these critical locations, selected sub-catchments from the original model were further subdivided. This refinement was necessary as several existing sub-catchments were spatially extensive and spanned multiple development areas, which was not suitable for investigating potential basin storage options or localised impacts
Table 7 Updated land use Effective Impervious Area (EIA) in WBNM hydrological models
Flow routing
The existing hydrological models were primarily configured to generate excess rainfall hydrographs at individual sub-catchment outlets for use as inflows to a TUFLOW model. The existing hydrologic models had limited representation of flow routing between sub-catchments. This approach was suitable for input into the hydraulic model but did not facilitate the identification of cumulative hydrographs at downstream critical points
For this study, sub-catchments associated with development areas were connected according to the flow paths derived from the updated catchment delineation. Flow routing was implemented to extract critical hydrographs at designated outlet locations. The stream lag factor was also applied to the development areas to account for the existing channel types. For the existing condition, all channels were modelled as natural channel with a stream lag factor of 1.
The updates to the existing models for the three townships are shown in Figure 20, Figure 21, and Figure 22, and stream lag factor values are provided in Table 8
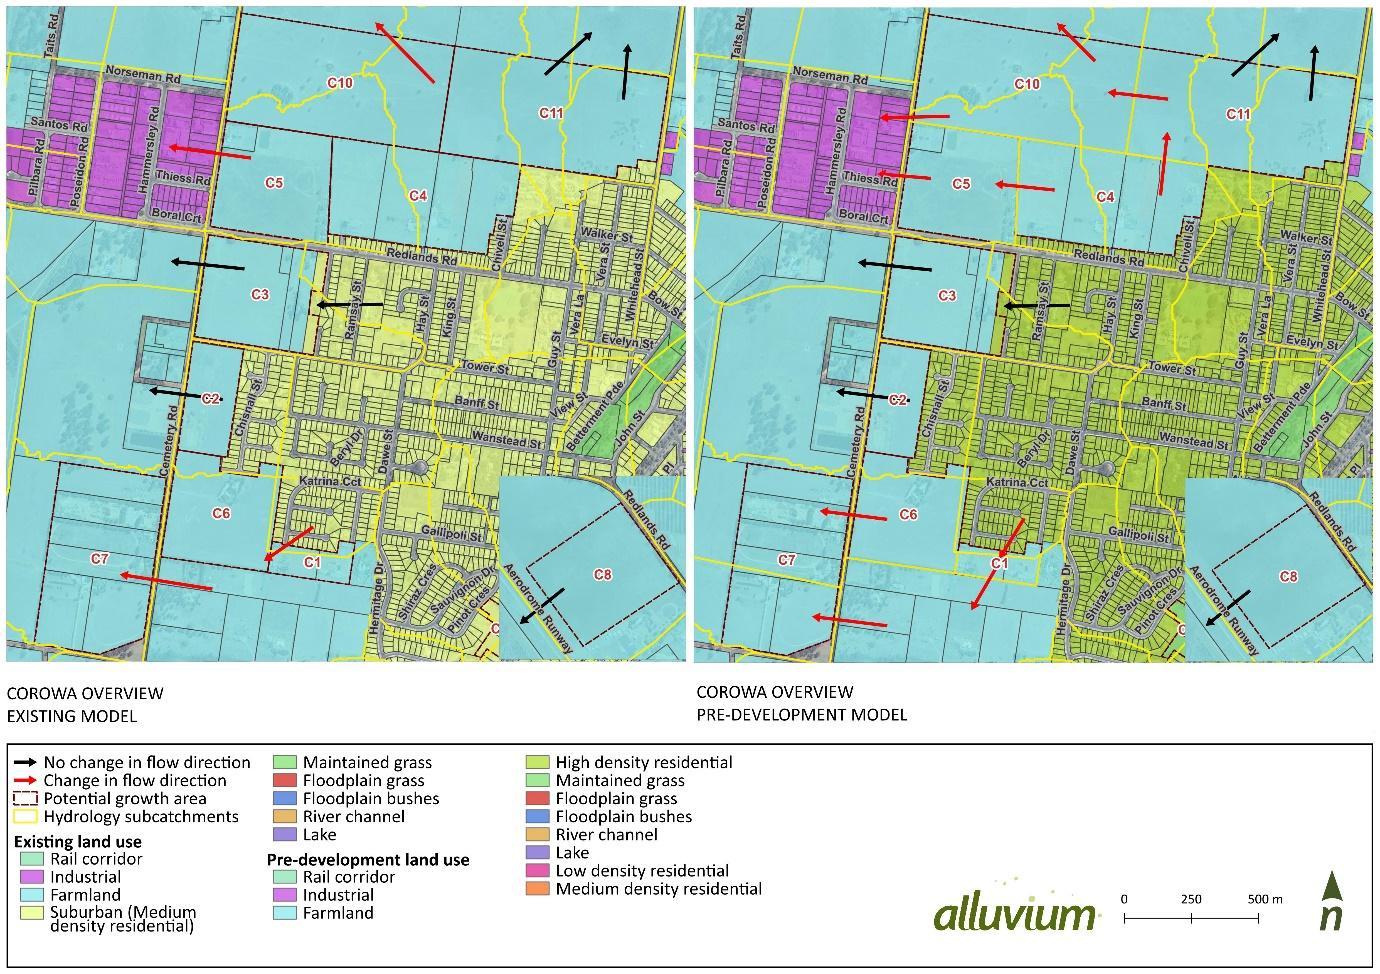
20. Pre-development model updates from the existing hydrological model for
Figure
Corowa
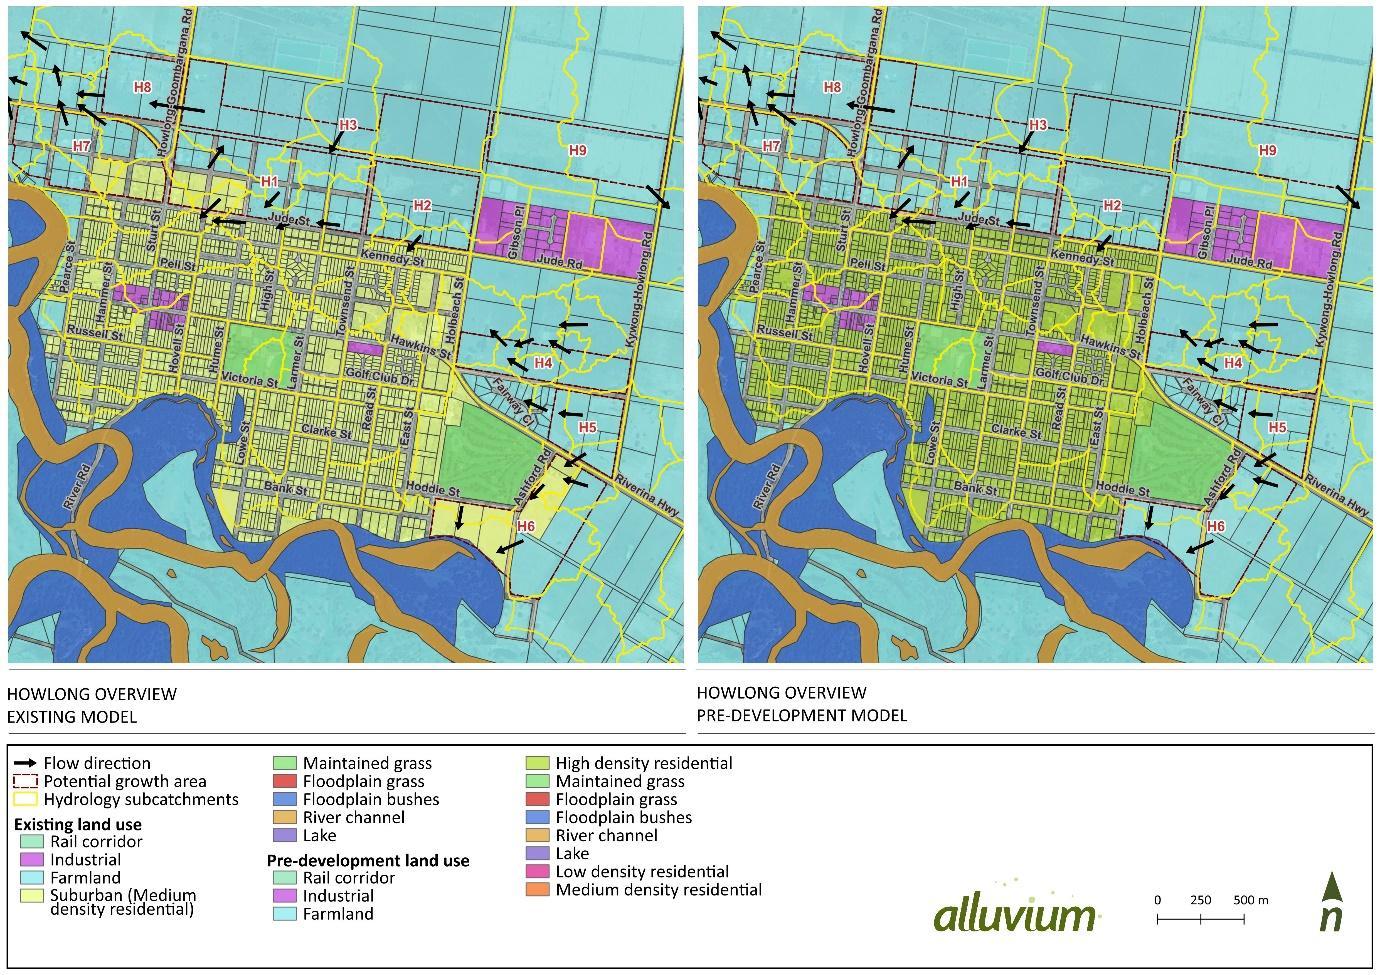
21. Pre-development model updates from the existing hydrological model for Howlong
Figure
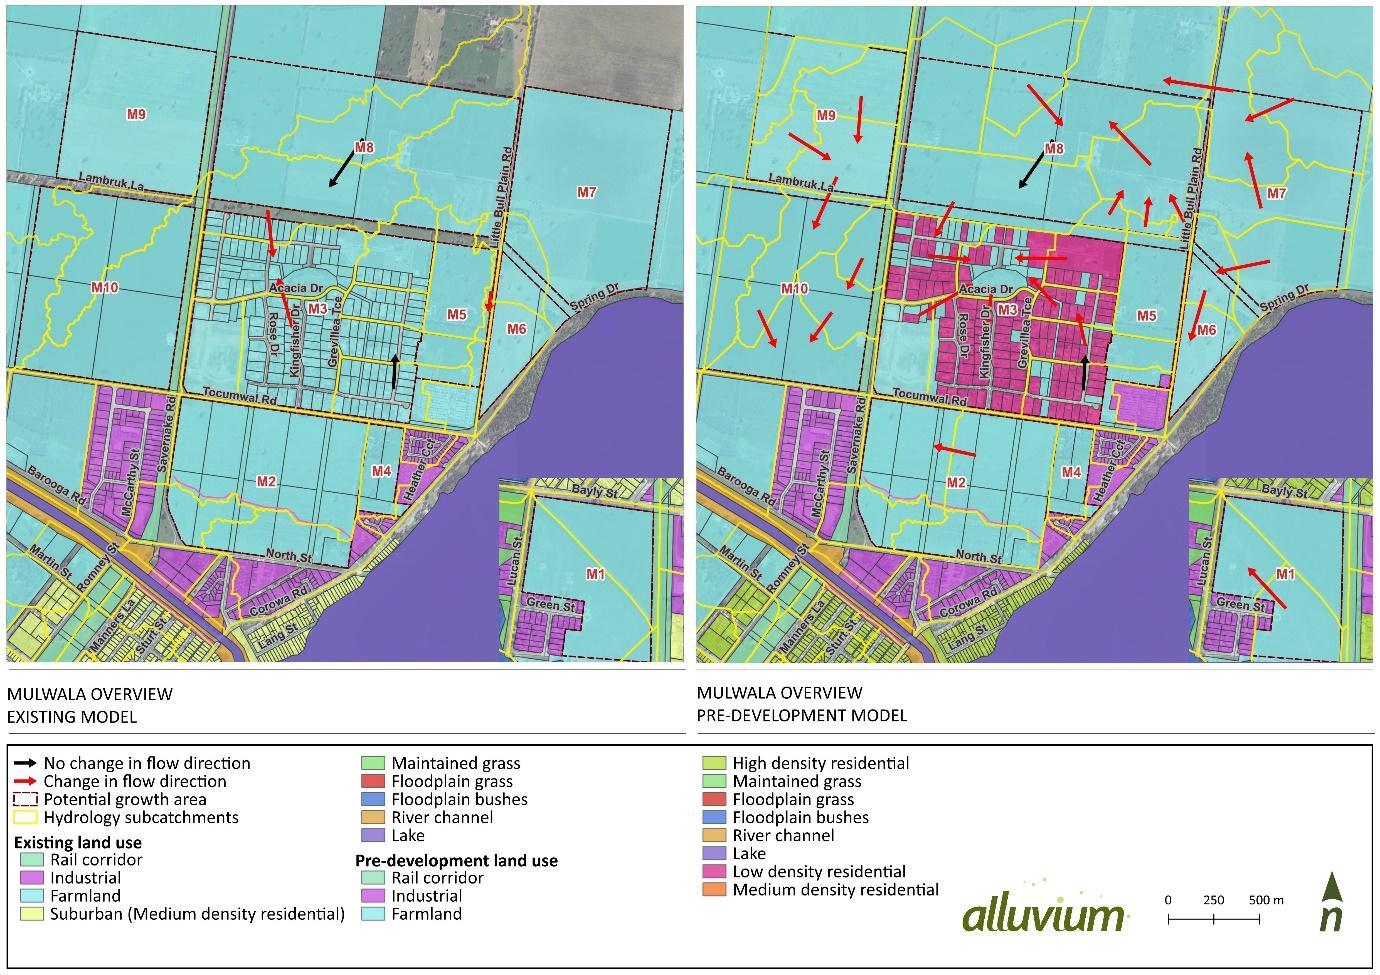
22. Pre-development model updates from the existing hydrological model for
Figure
Mulwala
Table
Chain of ponds 0.7 for post development scenarios 1.0 for mitigation scenarios
Swale/Gravel bed with rip rap
Critical flows
The WBNM hydrological models representing pre-development conditions were run for the full suite of design storm events specified in the original flood study. Apart from the model updates described in preceding sections, all other parameters remained consistent with the existing model setup. A summary of the adopted model parameters is provided in Table 9
Each model was simulated using an ensemble of ten temporal patterns across storm durations ranging from 20 minutes to 48 hours. For each duration, the adopted temporal pattern was selected as the one producing the median peak flow from the ensemble. The critical duration for each design event was then determined as the duration yielding the highest mean flow across the identified median patterns.
This procedure was repeated for each critical location across the study area to identify the critical duration and flow rate for each critical location.
Stream lag factor
area lag factor
Intensity duration frequency (IDF)
Design events
Temporal pattern
Areal Reduction Factors
Initial loss
Table 8 - various depending on channel types
Single IFD at catchment centroid of each town
20%, 10%, 5%, 2%, 1%, 0.5%, 0.2% AEP
ARR2019 Murray Basin temporal patterns
Not applicable
Probability neutral burst initial losses
Table 9 WBNM model parameters
6.2 Post-development model
The WBNM hydrological models for the post-development scenarios incorporated several updates to reflect the anticipated land use and drainage characteristics of the proposed growth areas. These updates are outlined below.
Land use changes
Post-development land use was determined based on the number of lots planned for each growth area, as provided in the Federation Council Sewage Disposal Servicing Plan (2021). For each growth area, the total area was divided by the corresponding number of lots to estimate an average lot size. A summary of the derived lot sizes for each growth area are provided in Table 10, Table 11 and Table 12
In the existing models, a single residential land use category suburban was defined with an Effective Impervious Area (EIA) of 30%, typically representing lot sizes between 550 m² and 1,000 m². To better reflect the wider range of residential densities in the growth areas, the suburban classification was refined into three categories: High-Density Residential (HDR), Medium-Density Residential (MDR), and Low-Density Residential (LDR). These land use types, along with their corresponding EIA assumptions, are defined in Table 13 to get the EIA for LDR and MDR land use. This was cross-checked by finding a typical lot of that size within the township and calculating the impervious fraction using QGIS. The land use classifications in Table 7 were used to determine the post-development land uses for the growth areas in Table 10, Table 11, and Table 12
Table 10. Post-development residential land use classifications for growth areas in Corowa
Assume LDR from position at edge of development and land use of C5
Assume LDR from position at edge of development and land use of C5
Table 11. Post-development residential land use classifications for growth areas in Howlong
Table 12. Post-development residential land use classifications for growth areas in Mulwala
The existing model’s initial estimate of 30% EIA for residential properties was broken into a graduated scale as shown in Table 13
Flow path modifications
Under post-development conditions, modifications to local drainage patterns were considered. In some cases, flow paths were altered to reflect potential stormwater infrastructure, including the diversion of upstream flows into development areas to accommodate future stormwater management infrastructure. Accordingly, subcatchment connectivity was revised, and stream lag factors were adjusted to reflect the change in channel types. The post development updates to the models for the three townships are shown in Figure 23, Figure 24, and Figure 25 with updated lag factors in Table 8
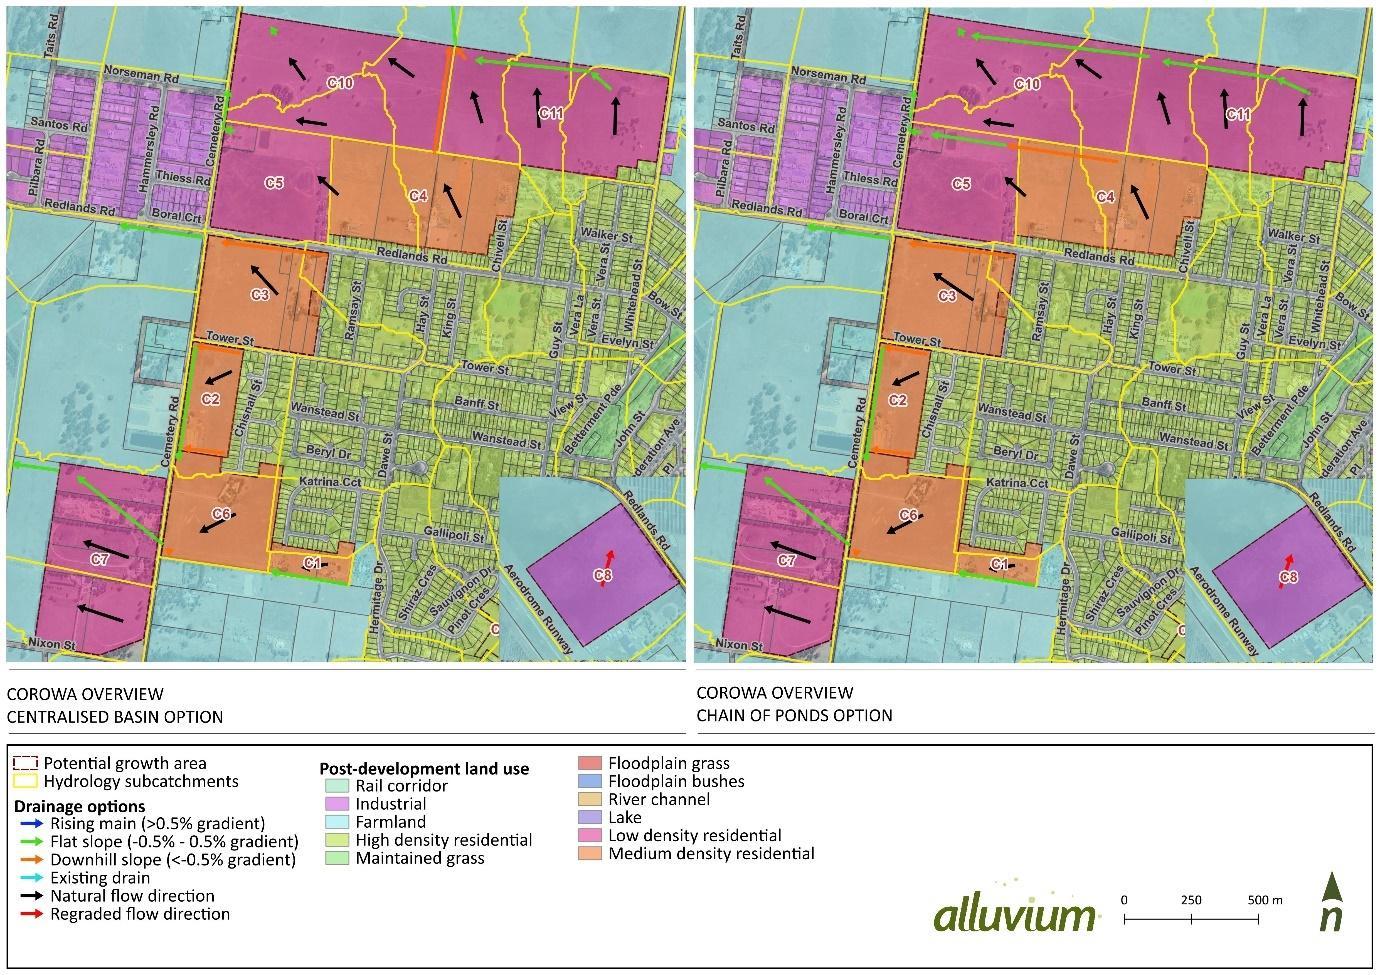
and flow direction
Figure 23. Corowa centralised basin and chain of ponds option post-development land use
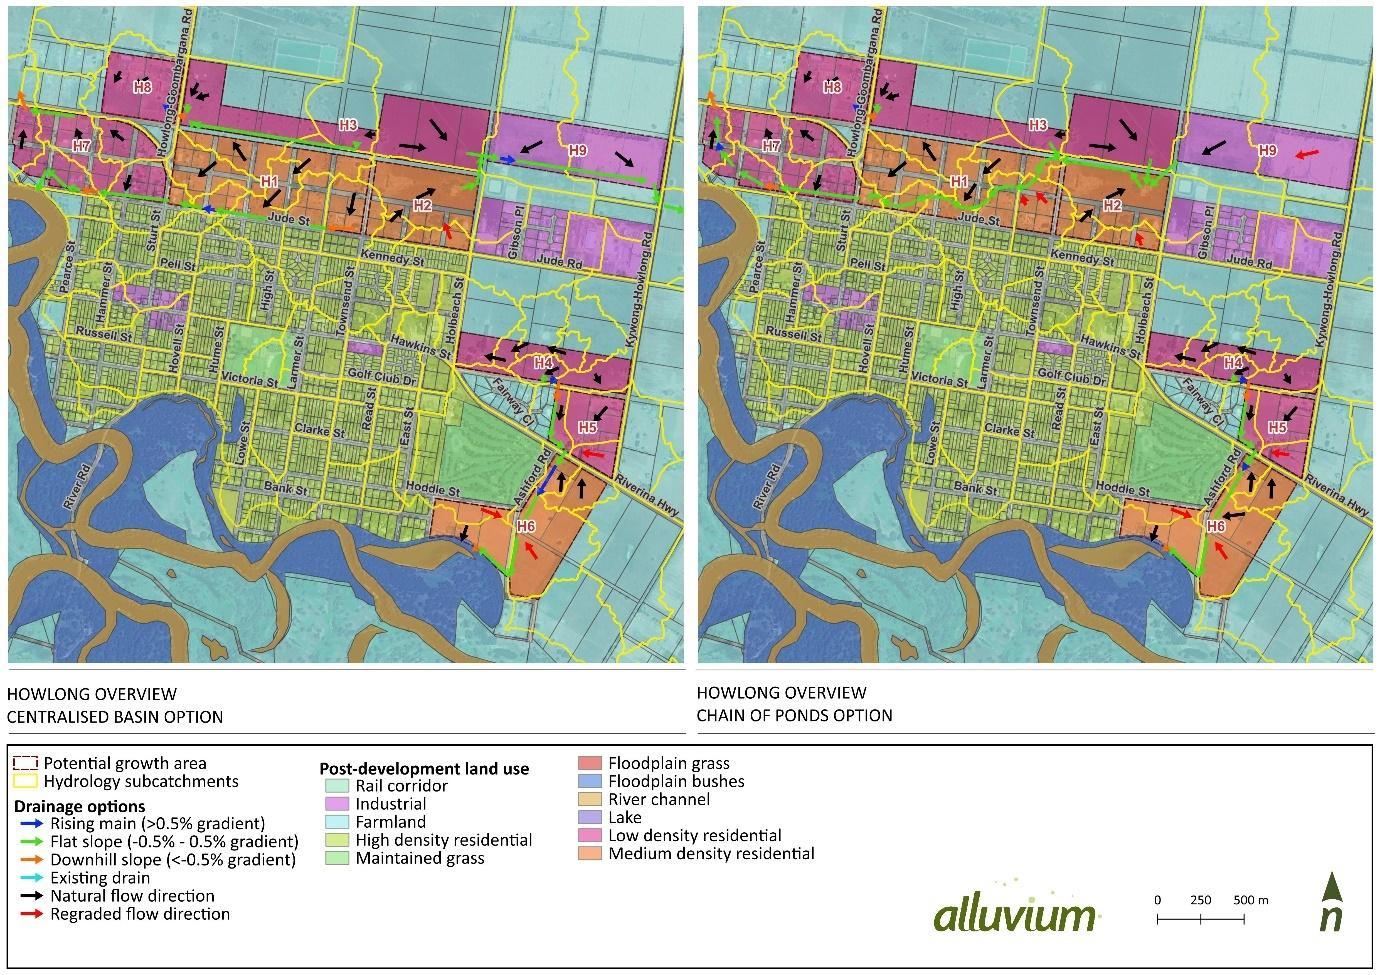
24. Howlong centralised basin and chain of ponds option post-development land use and flow direction
Figure
land use and flow direction
Figure 25. Mulwala centralised basin and chain of ponds option post-development
6.3 Flood storage
Base case scaling development
To assess the areas required for flood storage and water quality, a unit base case approach was adopted. This approach involved detailed hydrological assessment for a number of representative catchments to come up with asset footprint/catchment ratios. These ratios have been applied to other catchments to estimate the required flood storage and water quality footprints.
The development of the unit base case scenario allows for flexibility in assessment, option adaptation, and decision-making. This aligns with the staged development approach for the broader plan, as the ratios developed can be used for future decision-making and be easily adjusted to any changes in the development plans going forward
The primary output of the unit base case assessment was the determination of the 1% AEP unit storage footprint per unit of catchment impervious area. This metric can be scaled according to the impervious area of any catchment within the three townships to estimate the indicative storage footprint required to achieve both flood mitigation and water quality management objectives.
During detailed design, the unit base case footprint can be further optimised with detailed modelling.
Conceptual layout
Conceptual layouts of the storage footprint strategies adopted for the two mitigation options are illustrated in Figure 26
In the centralised basin configuration, the permanent pool volume addresses water quality requirements, while the flood storage component comprises the volume between the permanent pool and the basin’s maximum flood storage level. Therefore, the two footprints are overlapped; the total storage footprint is defined by the flood mitigation requirement alone.
In the chain of ponds configuration, the water quality and flood mitigation components are spatially separated. As a result, the total storage footprint in this option is the sum of the water quality footprint and the flood storage footprint.
Flood storage volumes were defined based on the total extended flood storage depth, measured from the basin invert or the top of the permanent pool where applicable, to the maximum flood storage level. Where applicable (i.e., in combined wetland retarding basins) the permanent pool does not provide any flood storage and cannot be applied to the volume, hence the flood storage invert is the top of the permanent pool.
Detailed descriptions of the modelling approach used to derive each of these storage footprints are provided in the following sections.
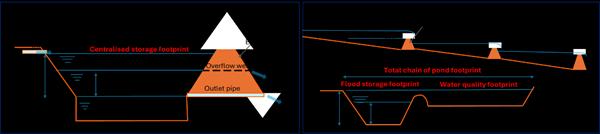
Figure 26 Storage footprints conceptualisation for the two options
Froglet considerations
Due to the ecological significance of the Sloane's Froglet within the Federation Council LGA, particularly given the mapping of froglet habitats throughout Corowa and Howlong, the relevant design guidelines (Albury City Council, 2024) were considered in the hydrology assessment. These guidelines significantly influence the
adopted criteria and impact the base case development. To accommodate the Sloane's Froglet, total flood storage and extended detention depths are highly restricted, resulting in increased land take requirements. Key comparisons for the hydrologic modelling parameters considering and not considering Sloane’s Froglet habitat are detailed in Table 14
Table 14 Design criteria for the two options in consideration to froglet habitat
Key Parameters
Extended detention depth (EDD) of 0.1 m.
With Froglet
Without Froglet
Total flood storage depth of 1 m.
EDD of 0.35 m.
Total flood storage depth of 1.5 m.
Post-development flood storage requirements
As outlined in Section 6.2, post-development conditions characterised by increased impervious area, larger contributing catchment sizes, and modified flow paths, tend to result in elevated peak flows and reduced critical durations. To mitigate these effects, flood storage infrastructure is required to attenuate post-development hydrographs and restore them to a condition comparable to pre-development flows (refer to example in Figure 27).
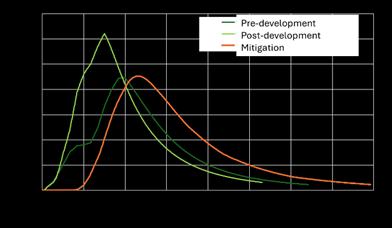
Figure 27 Example of the flood hydrographs for development area M9 for pre-development, post-development, and with centralised basin mitigation
General unit base case process
For both the centralised basin and chain of ponds unit base case development, WBNM models incorporating conceptual storage structures were used to estimate the flood storage volumes, each with and without ecological considerations for froglet habitat.
The required flood storage volume for each scenario was initially estimated as the difference in runoff volume between pre- and post-development hydrographs at each critical location. Iterative WBNM modelling was then undertaken to determine the final basin dimensions and overflow weir lengths, ensuring the post-development peak flow did not exceed pre-development levels and the critical duration was not reduced. Footprint, i.e., surface area at the total flood storage depth, of the basin was then estimated using the basin dimensions.
Unit flood storage volume (vi) and unit flood storage footprint (si) were calculated for each representative growth area i in the unit base case, using the following equations:
The final unit storage footprint (s) and unit flood storage volume (v) to be used in for all growth areas in this study were the average of all unit footprint for all representative growth areas n from the base case study as below:


Conceptual diagrams illustrating the hydrological modelling approach are provided in Appendix D
Centralised wetland retarding basin unit base case
The growth areas selected for the centralised basin unit base case development for the ‘with froglet’ and ‘without froglet’ scenarios were M9, M10, and the northwest corner of M8 in Mulwala (see Figure 28) due to the following factors:
• Mulwala offers very little topographic relief. While this can be seen as a negative, it provided a conservative base case to use with regards to the hydrological assessment.
• Mulwala has many ‘sinks’ within the existing hydrological model. Due to the need to add conveyance infrastructure, re-routing of the sinks was necessary. This re-routing was considered in the development of the unit storage footprints and was also applicable to catchment scenarios in the Howlong township.
• There are several catchment scenarios which can be compared including urban growth areas with and without external catchments. This provides a good representation for the scenarios across the other townships.
The calculations of the unit base case footprint used the same general process above. The key modelling assumptions and results for the centralised basin option are summarised in Table 15
Table 15 Centralised basin unit base case key assumptions and results
Figure 28 Centralised basin unit base case in Mulwala including M9, M10 and part of M8 (catchment MA_1)
With froglet Without froglet
Unit flood storage volume per catchment impervious area (m3/ha)
Chain of ponds unit base case
The growth areas selected for the ‘without froglet’ unit base case development were M9, M10 and M2, constituting the western chain of ponds for Mulwala, shown in Figure 29. The growth areas selected for the ‘with froglet’ unit base case development were H3, H2, H1 and H7, constituting the northern chain of ponds for Howlong, shown in Figure 30. It was important to consider the whole length of each chain of ponds to understand the increase in pond sizes along the chain in a downstream direction.
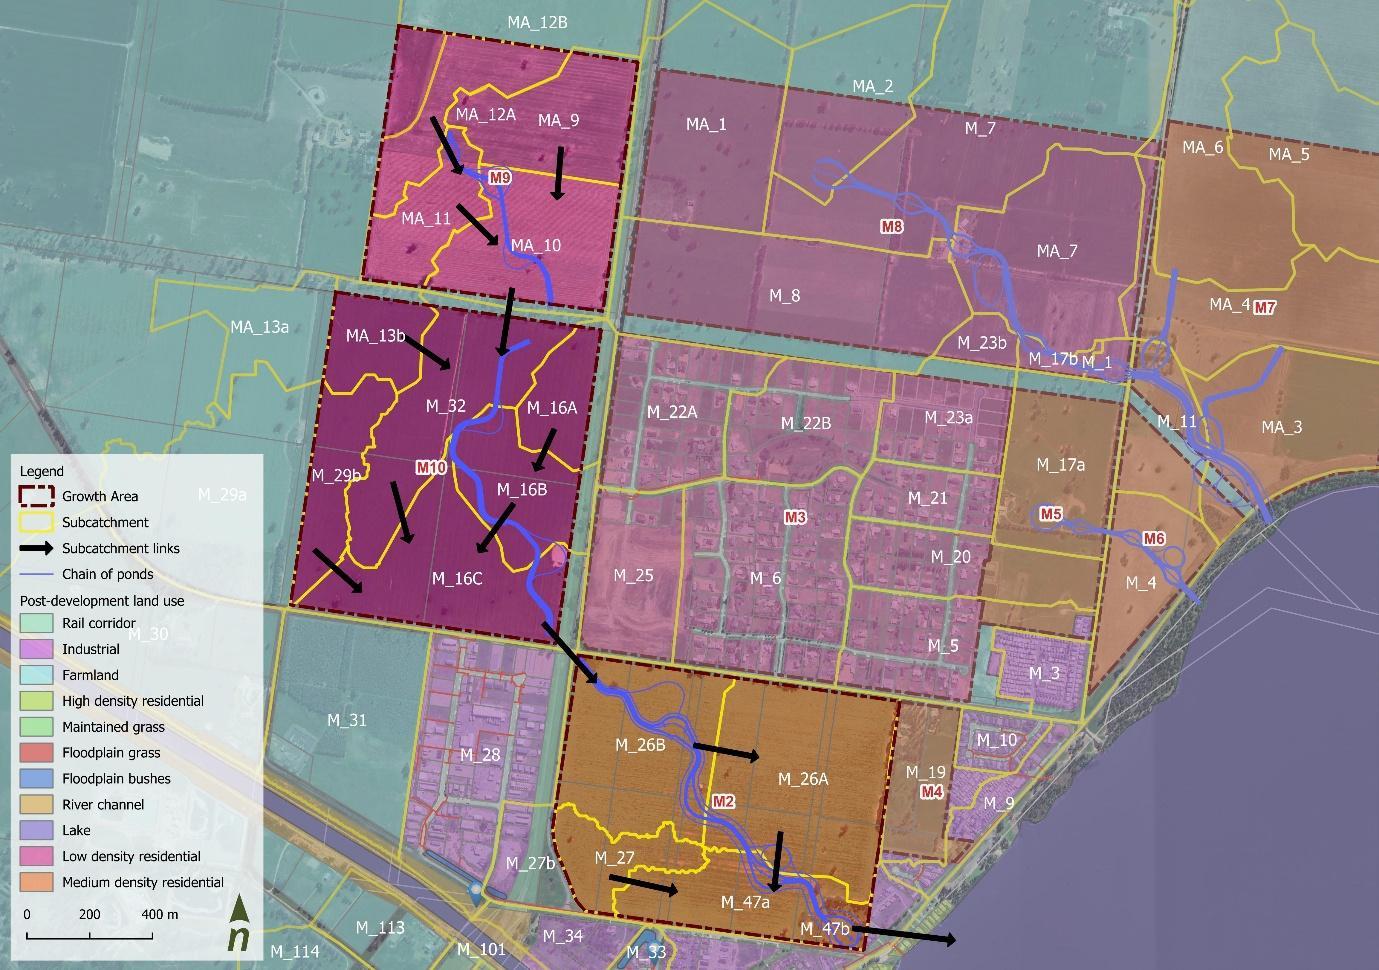
Figure 29 Chain of ponds unit base case in Mulwala including M9, M10 and M2
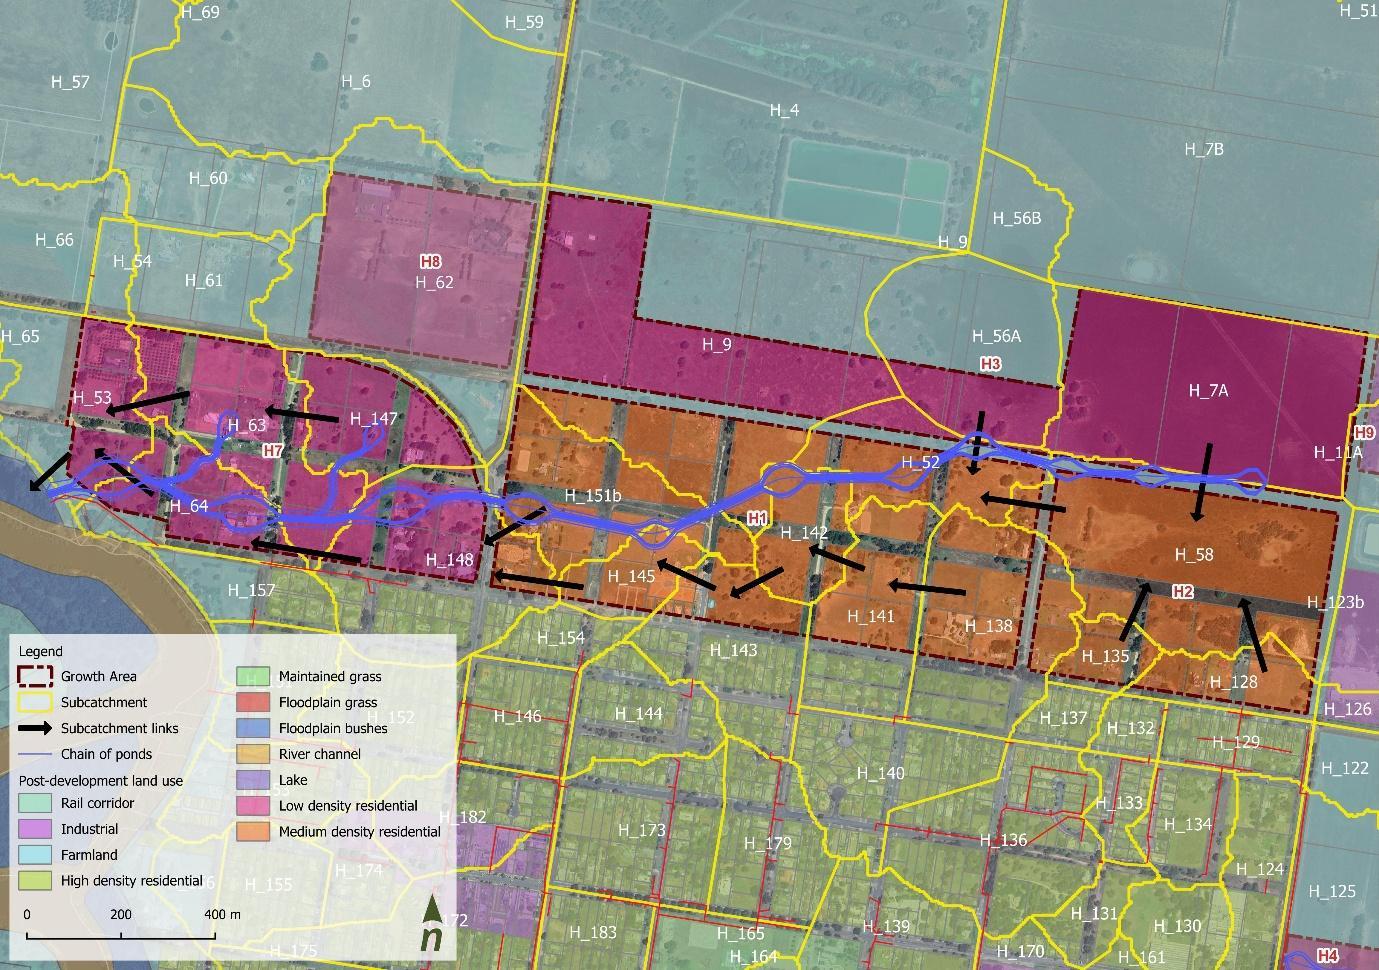
Basin sizing was done sequentially in a downstream direction for each growth area along the chain of ponds The chain of ponds designs require the changes in flow paths and catchment linkages, and thus the outflow from the chain of ponds can be substantially different from the pre-development outflow from the individual subcatchments, even without the change in land use. Therefore, comparing the pre- and post-development with the traditional approach in section ‘Post-development flood storage requirements’ can result in an overdesign of the flood mitigation requirements.
To avoid this over-design potential, a reconsideration of pre-development, post-development, and mitigation definition was conducted for the chain of ponds approach.
• Pre-development condition of a chain of ponds is when the catchment linkage has been established while land use is the original land use.
• Post-development condition of a chain of ponds is when the catchment linkage has been established, and land use has been developed.
• Mitigation condition of a chain of ponds is when the catchment linkage has been established, land use has been developed, and basins have been used to mitigate the outflow to the pre-development conditions.
The basin sizing process was conducted from upstream to downstream. When sizing the basins of the downstream growth area, the mitigated upstream condition can be better than the pre-development condition. Considering this effect on sizing the downstream basins, the pre-development condition of a downstream catchment reflected the mitigation condition of its upstream catchment and its pre-development condition. This accounts for the fact that the flow had already undergone mitigation before reaching the current growth area. The process of setting up the pre- and post-development for basin sizing of the chain of pond is shown in Table 16 Table 16
Figure 30 Chain of ponds unit base case in Howlong including H3, H2, H1 and H7
Table 16
Pre-development, post-development, and mitigation set up for the chain of pond basin sizing
Growth Area(s)
Pre-development Mitigated
Post-development
land use Pre-development land use
land use Post-development land use Mitigation
Post-development land use
Iterations of basin sizing and weir lengths within the current growth area occurred until the conditions in Table 17Table 17 were met, then the process continued for the next growth area downstream until all basins along the chain of ponds had been sized.
Table 17. Basin sizing requirements for each growth area in the chain of ponds unit base case
Final basin at the outlet of a growth area
< 1 m (without froglet), <0.5 m (with froglet)
Other basins in that growth area < 1 m (without froglet), <0.5 m (with froglet) -
Approximately less than or equal to the pre-development peak flow
Greater than or equal to the pre-development critical duration
Following the iteration process, the recorded storage depths and basin dimensions for each basin along the chain of ponds were used to calculate basin surface areas and volumes. The equations (1) and (3) were then used to calculate the unit footprint for each growth area. An average of the unit footprints from each growth area was taken to provide the unit base case footprints for the ‘with froglet’ and ‘without froglet’ scenarios
The key modelling assumptions and results for the chain of ponds option is summarised in Table 18Table 18
Table 18 Chain of ponds unit base case key assumptions and results
Although the basins were aimed to store on the increased flow caused by the change in land use between the pre- and post-development, they also need to receive and convey the flow coming from the upstream catchments via the overflow weirs. Sizing large weirs to discharge the out-of-scope flow can be economically unsound. Therefore, the basin sizes are expected to increase toward the downstream of the chain of ponds.
The scaling factors to account for smaller upstream basins and larger downstream basins are provided in Table 19Table 19. The upstream and downstream scaling factors were calculated by dividing the most upstream or most downstream growth area’s unit footprint, respectively, by the average unit footprint for the whole chain of ponds.
Table 19. Scaling factors for the chain of ponds unit base case
To size the remaining basins in Corowa, Howlong, and Mulwala, the impervious area for each growth area was calculated and multiplied by the unit surface area per catchment impervious area to get the total basin footprint. This footprint was divided by the number of basins to find the footprint per basin. Upstream and downstream scaling factors were applied to the first and last basins in each chain of ponds, respectively, with intermediate basins scaled according to their position within the chain. Differences in the sum of the basin footprints before and after scaling were redistributed to ensure total footprint conservation
Comparison
A comparison of the unit surface area per catchment impervious area for the ‘with froglet’ and ‘without froglet’ centralised basin and chain of ponds scenarios is provided in Table 20Table 20
Table 20. Comparison of centralised basin and chain of ponds unit base case footprints
Overall, the chain of ponds configuration tends to have a smaller flood storage footprint when compared to the centralised basin options. It is important to note that the flood storage volumes associated with the chain of ponds options reflect basin storage only; channel storage contributions along connecting reaches were not included in the assessment. The connecting reaches, if included, would combine with the basins to have a larger land take than the centralised basin options. Despite this, the chain of ponds option has many benefits, including the opportunity to have a series of blue-green corridors throughout the development, which have potential to improve amenity, provide recreational opportunities, reduce flow velocities and promote localised cooling A central chain of ponds waterway also provides more opportunities for subdivisional drainage.
It is well established now that our climate is changing and that historical climate patterns no longer reliably predict future conditions. Future climatic conditions are projected to generate more extreme rainfall events as well as have longer dry periods which results in higher variability in catchment response and more complexity for managing flooding. Considering this, change in the climate and the added variability and complexity, particularly from a rainfall and flooding perspective, is very important when planning for the future.
The latest Intergovernmental Panel on Climate Change (IPCC) reports (IPCC 2023) suggests that these shifts in the climate will continue, and provides guidance on projected changes based on the best available science. These changes are projected through Shared Socioeconomic Pathways (SSPs), which are scenarios that describe different potential futures based on varying levels of societal, economic, and environmental changes. The SSPs (See Figure 31) help understand future climate change impacts, as they link greenhouse gas emissions with socioeconomic developments and policies. For instance:
• SSP2-4.5 represents a middle-of-the-road scenario, where global development progresses similarly to current trends, with moderate efforts to mitigate emissions.
• SSP3-7.0 portrays a more fragmented world with higher emissions and limited international cooperation, leading to more severe climate impacts.
These pathways project future change in climate that is then indexed to estimate future flood risk. The updated ARR 2019 version 4.2 provides guidance on how we incorporate these changes into hydrologic parameters within Australia. Here, AR and R provides recommended adjustments to the Intensity-Frequency-Duration (IFD) curves as well as losses within the catchment to account for the non-stationarity of climate conditions.
The current Federation Council DCPs do not account for these climate change impacts in its flood risk considerations. The recent Corowa, Howlong and Mulwala flood study incorporated limited sensitivity analysis by using the 0.5% AEP and 0.2% AEP events as proxies for a future 1% AEP Climate Change scenarios, potentially underestimating future risks The sensitivity results indicated that the Murray River could be highly sensitive to climate change. However, the long-duration storms required to produce flooding in the catchment, along with drier overall conditions, may mean that runoff increases are not as severe as expected. Conversely, overland flow flooding appears less sensitive to increased rainfall intensity, though significant changes still occur on major flow paths and in flood storage areas.

Figure 31 Projected temperature increases associated with AR6 socioeconomic pathways relative to 1961-1990 and their associated uncertainty (IPCC, 2021)
Considering the added variability and complexity in catchment responses and managing flooding for future conditions, along with the fact that this stormwater servicing plan is for a future development in 50 to 100 years, an adaptive planning approach is suggested to accommodate the range of potential climate futures. An adaptive planning approach allows designing for more moderate SSPs such as SSP2-4.5, while considering the potential need to adjust for more extreme outcomes, such as projected pathways represented by SSP-3 or even SSP-5 The benefits of an adaptive approach are:
• It provides flexibility to account for the variability and complexity of future climate conditions and resulting flood risks.
• It allows for flood infrastructure and risk mitigation measures to be implemented in the near future while accommodating potential changes in the long term.
• It allows optimised use of current land and financial resources to develop cost effective flood management measures.
• It provides council a way to adapt to the significant uncertainties related to planning for the future.
7 Water quality modelling
To meet the water quality design objectives outlined in Section 3, the project utilised the Model for Urban Stormwater Improvement Conceptualisation (MUSIC) software by eWater MUSIC models were used to estimate the quantities of key stormwater pollutants, evaluate potential impacts, and demonstrate pollutant reductions achieved through the proposed treatment systems. This approach allows for simulation and analysis of stormwater treatment measures to achieve the desired water quality outcomes. The Sloane’s Froglet Stormwater Wetland Design Guidelines (ACC & OEH 2017) and the NSW MUSIC Modelling Guidelines were used for guidance on the modelling and evaluation process.
The MUSIC model was iteratively evaluated and updated to assess the stormwater quality treatment outcomes and potential treatment options for each growth area, aiming to meet the following pollutant reduction targets:
• Total Suspended Solids – 80%
• Total Phosphorus – 45%
• Total Nitrogen – 45%
• Gross Pollutants – 90%
The developed (treated) scenario was compared against the developed (untreated) scenario to confirm if the targets were achieved. Initially, a unit base case model was prepared to estimate approximate footprints required per hectare of impervious area. Then, the setup and performance of the models were evaluated for each growth area to estimate the total footprint required to meet the targets if sediment basins and wetlands are chosen for water quality treatment.
The MUSIC model setup parameters are outlined in Table 21Table 21
Table 21. MUSIC model setup
Model Component Source/Method
Long-term average rainfall year data (1955-2010 period from Albury (eWater supplied rainfall file)). This data was compared to climate data for Corowa and deemed appropriate for use.
Source nodes The growth areas have been used to estimate the total treatment footprints required
Fraction imperviousness
Rainfall runoff parameters
The total fraction imperviousness from the hydrologic modelling were adopted, both for the existing and post-development land uses, outlined in Section 6.2
Default MUSIC values, except:
• Soil storage capacity – 120 mm
• Field capacity – 50 mm
Treatment systems As per the Sloane’s Froglet Stormwater Wetland Design Guidelines (ACC & OEH 2017) and NSW MUSIC Modelling Guidelines (BMT 2015).
The following steps outline the overall process for estimating the sizes of both the sediment basins and wetlands for each growth area:
1. Sediment basin sizing:
o Feyer and Geyer Equations: The Feyer and Geyer Equations were applied to determine the appropriate dimensions and capacities of the sediment basins, optimising their performance in sediment removal.
2. Wetland sizing:
Rainfall
o Design guidelines: Wetlands were designed following the Sloane’s Froglet Stormwater Wetland Design Guidelines (Albury City Council, 2017), which are tailored to protect the habitat of this ecologically significant species.
o MUSIC Modelling: MUSIC was used to estimate the sizing of the wetlands, ensuring they met the percent reduction treatment targets for key pollutants.
The MUSIC model simulated the effectiveness of the sediment basins and wetlands in reducing pollutant loads. This included assessing the percent reduction in total suspended solids (TSS), total nitrogen (TN), and total phosphorus (TP).
7.1 Unit base case
The water quality unit-base case areas were established following an analysis using the MUSIC modelling results. This analysis evaluated the stormwater treatment measures to achieve significant pollutant load reductions while accommodating the ecological requirements of the Sloane's Froglet. The resulting unit-base case areas provided a high-level framework for estimating water quality treatment requirements within the growth areas of Corowa, Howlong, and Mulwala.
Table 22 summarises the unit water quality footprint per hectare for two scenarios:
1. Developed land with 10% imperviousness (anticipated imperviousness of the future developed areas)
2. Fully impervious area
This highlights the areas required for sediment basins and wetlands to meet water quality treatment requirements. As described in Section 4, while the water quality areas remain consistent for both options (centralised basins and chain of ponds), their overall layouts will differ based on their interaction with the hydraulic attenuation areas.
Additional design information and sizes of sediment basins and wetlands for each urban growth area are provided within Sections 0 and 1.1
Table 22. Water quality unit-base case areas
8 Concept design overview
The following section outlines the stormwater servicing concept design for the urban growth areas of Corowa, Howlong, and Mulwala. Per Councils preferences, the preferred approach to stormwater servicing across the townships will be the chain of ponds typology, with centralised wetland retarding basins (WLRBs) adopted for certain urban growth areas (i.e., C9 in Corowa). Components of designing for Sloane’s Froglet are discussed throughout this section.
The stormwater servicing schemes were three dimensionally modelled in 12d model software, incorporating the outputs from the hydrological and water quality modelling, as discussed in Sections 6 and 7
8.1 Stormwater management asset typologies
A summary of the stormwater management asset typologies discussed and developed within the options assessment is provided below. These typologies and their alignments, lengths, sizes, pros and cons were presented in an options identification meeting to the Council stakeholder group on the 11th February 2025, with a more detailed workshop held on the 16th of April 2025 An associated Options Development and Assessment Report (Alluvium, 2024) was also prepared as the outcome of Stage 3 (Table 1) of the project and documents the pros and cons of each option.
Chain of ponds
The chain of ponds typology is comprised of non-linear (meandering) waterways, connecting a chain of shallow, in-line ponds that are the primary mechanism for flood storage. Offline wetlands provide water quality treatment. Gravity fed pipes or swales connect minor flows from growth areas into the waterways. This system is not reliant on flows being centralised meaning local flows can enter the chain of ponds in multiple locations.
The chain of ponds aims to create a blue-green corridor through the urban growth areas which encompasses space for public amenity, as well as stormwater conveyance, treatment, and retention. The in-line ponds are also commonly referred to as ‘sponges,’ which can take the form of excavated or surface bunded shallow depressions, swamps, swales and underground trenches. In this case, they are referred to as flood storage ponds within the waterway area and are considered for their ability to regulate surface runoff via infiltration and evaporation, or evapotranspiration processes as well as improving hydration of landscapes. Infiltration in the case of Federation Council has been considered as a potential benefit but not modelled given the unknown groundwater conditions. Further consideration of groundwater and geotechnical conditions is needed when assessing the potential for infiltration.
An example of the application of a chain of ponds, plus linear and non-linear channels at another project site is shown in Figure 32 The 400 m wide Merri Creek conservation reserve also exemplifies the use of offline, waterway adjacent wetlands that were designed to provide Growling Grass Frog (GGF) habitat. Corowa similarly has several existing linear stormwater channels that will be used for stormwater discharge, but the design has sought to use chain of ponds where possible for their multiple benefits.
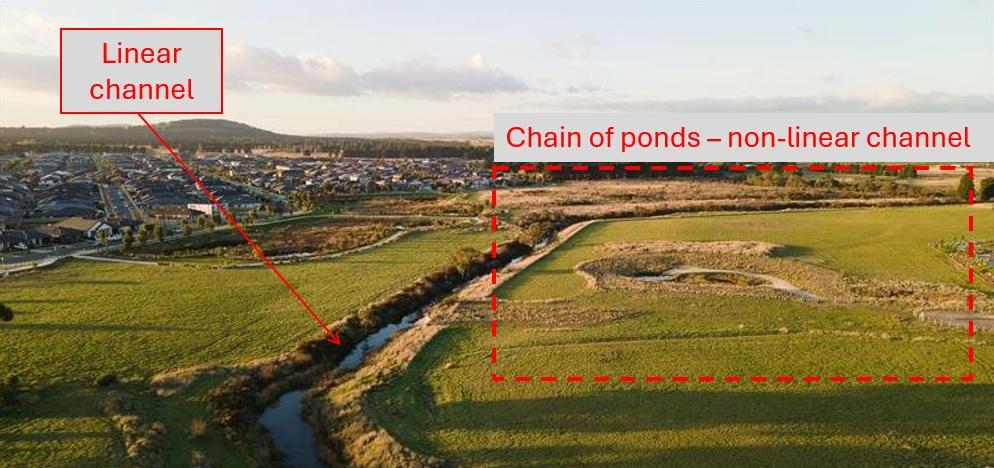
Table 23Table 23 explains the key features of each element of the chain of ponds, and the stormwater management function they will provide. A schematic plan of the chain of ponds typology from the concept design drawings is shown in Figure 35
Table 23 Chain of ponds elements and their functions
Element
Minor drainage system to sediment basins
Function
The minor drainage flows from the surrounding catchments will be directed into the sediment basins. Flows from the sediment basins will then enter the chain of ponds system (inclusive of wetlands). Sediment basins will be critical to manage sediment across the networks given the flat longitudinal grades within the waterways and the risk of sedimentation in them.
Waterway to wetland
Low flows will be diverted from the waterway to wetlands, with surplus flows bypassing During higher flows, the wetlands will be fully inundated and contribute to flood attenuation storage. Constructed stormwater treatment wetlands will be interspersed throughout the urban growth areas, sized in accordance with the outcomes of the water quality modelling. They will be located adjacent to the chain of ponds and have a low flow offtake from the waterway. The low flow offtake to the wetland will be sized to cater for the 4EY flow. The wetlands will be designed to allow for high flow bypasses back into the waterway.
Figure 34 schematises the offline wetlands.
Waterways will convey major flows to the designated outfall.
Waterway
In-line ponds
Iin-line pools which will be created through low, permeable weirs which allow the pools to be ephemeral. This means that without pumping, the pools will naturally draw-down to provide increased flood retention.
In-line ponds primarily have been designed to meet the flood detention requirements as outlined within the project objectives.
Figure 32 Example of a linear channel and non-linear chain of ponds at Merri Creek & Kalkallo Creek
Element Function
Waterway (system) outfalls
The major waterways have been designed to outfall to existing drainage systems. The system outfalls have been described in Table 28 Reference to the systems, urban growth areas, flows, and waterway types are shown in Table 26
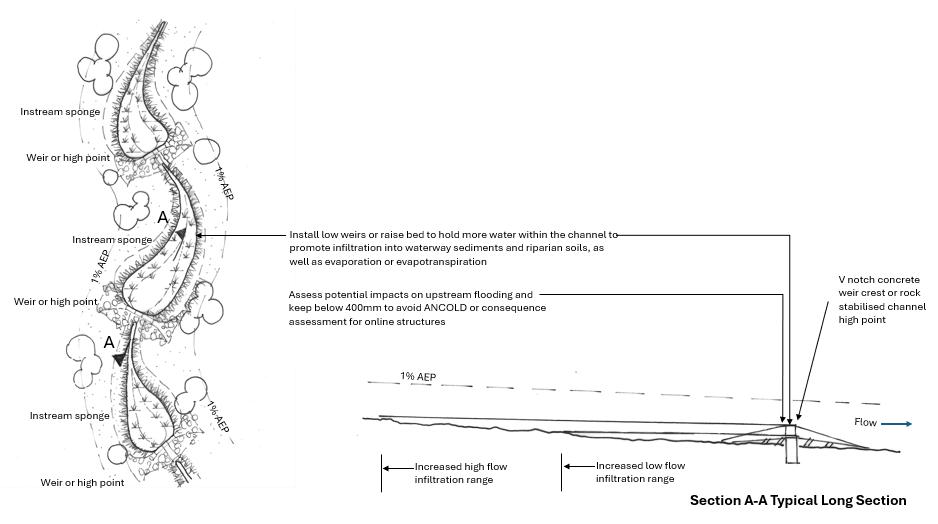
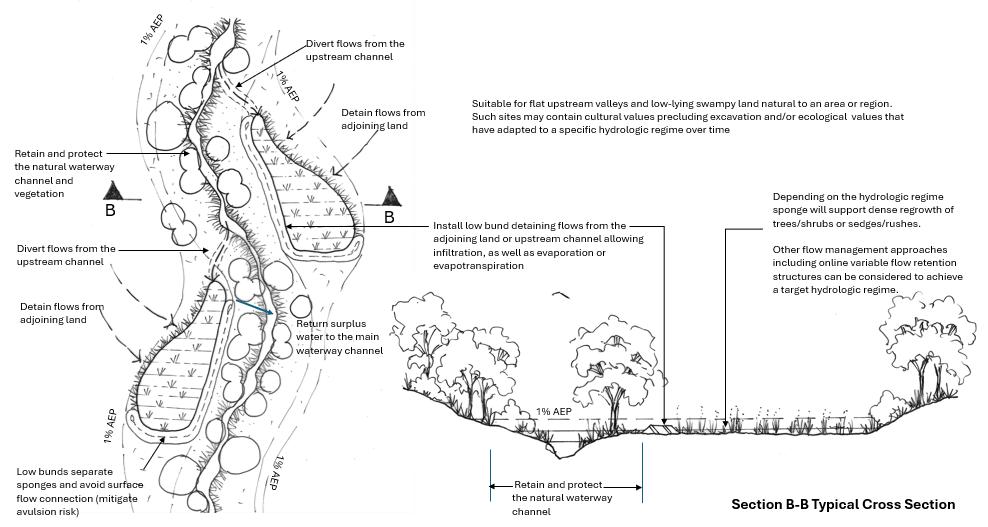
Figure 33 Chain of ponds in-line pools schematic (Alluvium & Mosaic, 2024)
Figure 34 Chain of ponds offline wetlands schematic (Alluvium & Mosaic, 2024)
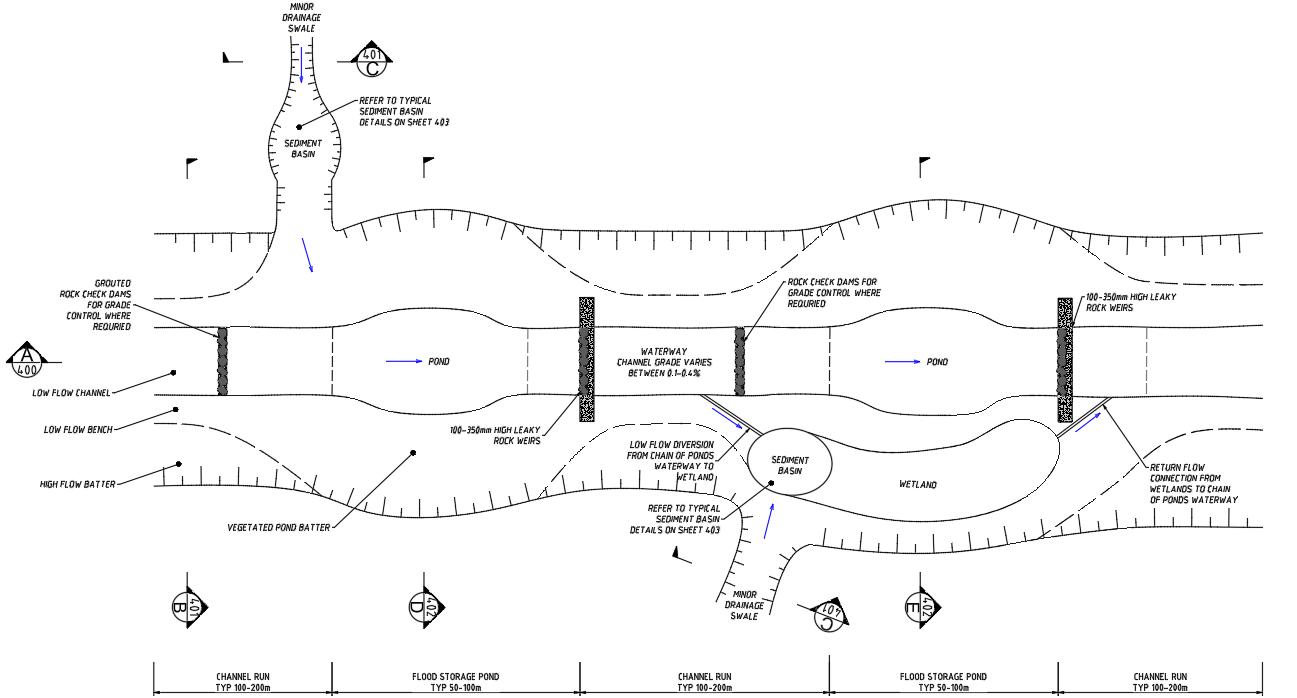
Figure 35 Typical schematic plan showing the chain of ponds stormwater servicing strategy schematic for Corowa, Howlong, Mulwala
Wetland retarding basins
Wetland retarding basins (WLRB) are commonly used as a method that can meet both water quality and water quantity management requirements for urban growth areas This dual function leads to space efficiencies Council has experience in using both wet and dry retention basins and are familiar with their usage parameters and typical operational requirements which often include pumping
Swales will connect local, minor flows from growth areas into the WLRB which will then discharge into the major drainage infrastructure. As such, WLRBs will typically be located offline, though in proximity to the major infrastructure, and may lead to longer lengths of minor infrastructure. The major downsides of WLRBs are that they are typically deeper asset types and therefore require more excavation and potentially pumping. Given their increased depth, they are typically less suitable for flat catchments with little existing topographic relief. A WLRB is typically deeper than a corresponding treatment wetland and flood detention basin located separately.
WLRBs have been adopted throughout the concept design in industrially zoned and selected confined urban growth areas. A concept design cross-section of a WLRB is shown in Figure 36. The maximum depth of a wetland is typically 1.5 - 1.8 m to the top of the extended detention (TED).
Within a WLRB, the base storage of the asset encompasses the wetland, with the wetland footprint sized to cater for the water quality requirements. Additional ‘air space’ is provided above the wetland TED level, which is used for flood attenuation. This has been further explained with regard to hydrologic implications in Section 6 WRLBs are designed such that:
• Frequent high flows bypass the WLRB so that the health of the wetland macrophytes and performance of the asset are not impacted.
• The 1% AEP is detained to pre-development conditions.
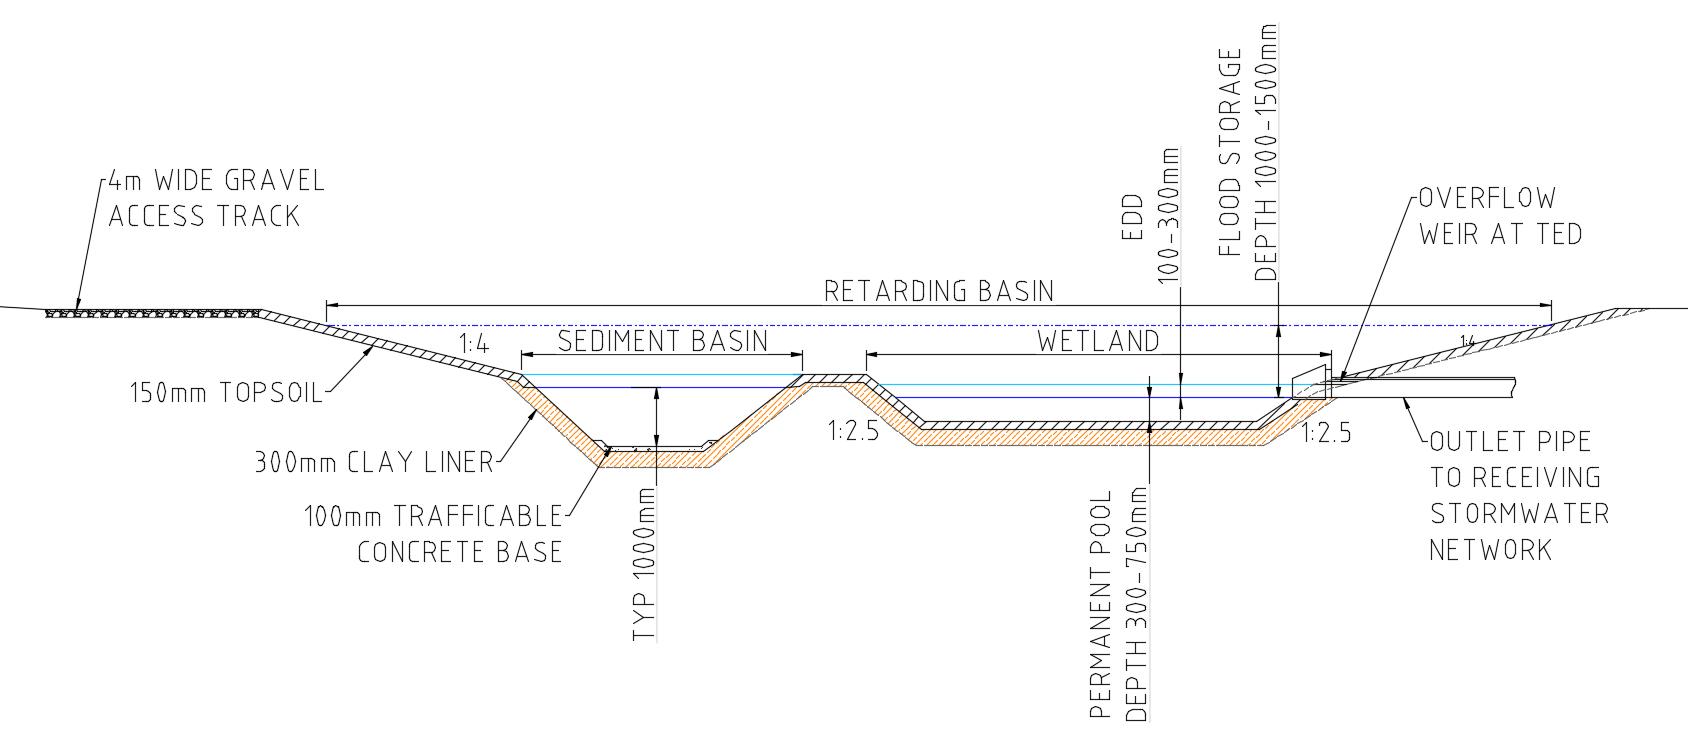
Considered design of WLRBs means that public amenity benefits could still be realised; however, may be more difficult to achieve safely, given the increased depth of the assets. Dense, impenetrable planting or handrails would likely be required around the perimeter of the asset to address fall safety.
Figure 36 WLRB cross-section
9 Concept design descriptions
9.1 Minor drainage system
The proposed drainage systems internal to the urban growth areas should be designed and constructed in accordance with the minor drainage system objectives. For the townships, the minor drainage should typically consist of an above ground network of swales designed to accommodate the 10% AEP event for residential zoned lots, and the 20% AEP event for industrial zoned lots. Minor drainage systems discharge into the major drainage systems.
In many urban settings, both minor and major drainage systems typically consist of pit and pipe collection networks Adopting pit and pipe collection networks requires a typical minimum depth (at the upstream end of the network) of approximately 1.2 m. This accommodates a 375 mm diameter stormwater pipe with 800 mm cover. This drastically increases the minimum depth requirements for the major drainage network which, per Section 9.2, in some cases only needs to be 300 mm to accommodate flows Due to the flat topography across the urban growth areas in Federation Council it is suggested that these are not utilised for minor flow conveyance unless the depth of the major system is already sufficient to accommodate piped drainage (i.e., > 1.2 m)
Increasing the minimum channel depths to 1.2 m would:
• Limit the ability of the major system to discharge into the receiving network (i.e., Mulwala systems have a limited outlet invert level due to the bathymetry of Lake Mulwala).
• Lead to deeper major drainage systems, which often must grade more steeply than the surrounding topography.
• Lead to increase excavation volumes, corridor areas and costs.
Some urban growth areas that would easily accommodate piped drainage due to deeper major systems include M2, M7 and H7. These areas are located in the downstream reaches of the proposed chain of ponds systems Piped drainage can be also considered within the context of steeper catchments, where increases to the depth of receiving networks would not be required.
At the time of preparing this concept design, most of the urban growth areas were delineated by gross boundaries and did not yet have any internal subdivisions nominated. As such, the range of minor design flows across the sub-catchments have been assessed and divided into quantiles. Typical maximum trapezoidal swale dimensions have been calculated for each flow quantile using Mannings equation for open channel flow, and are shown in Table 24. A typical trapezoidal swale detail is shown in Figure 37.
The minor flows for each of the urban growth areas from the RORB hydrological modelling and associated swale sizes have been tabulated in Table 25 and reflect the post-development, non-cumulative flows from each catchment. Detailed designs will need to be developed once the urban growth areas have been subdivided, and sub-catchments have been confirmed. It has been assumed that minor swale drainage can achieve a minimum longitudinal grade of 0.5 % across the subdivisions.
When located within road reserves, swales can be subject to velocities associated with major flood flows (1% AEP) being conveyed along the road corridor. Appropriate checks need to be undertaken on the resultant velocities within the swale to ensure the maximum velocities during minor and major events within the swale do not exceed 2.0 m/s. Should velocities exceed 2.0 m/s, non-vegetated swale linings should be implemented. Similar checks should also be undertaken to assess the depth x velocity product (the general proxy for flood hazard) within the swale, at crossings and adjacent to pedestrian and bicycle pathways and on road carriageways to ensure public safety criteria are satisfied (Townsville City Council, 2011)
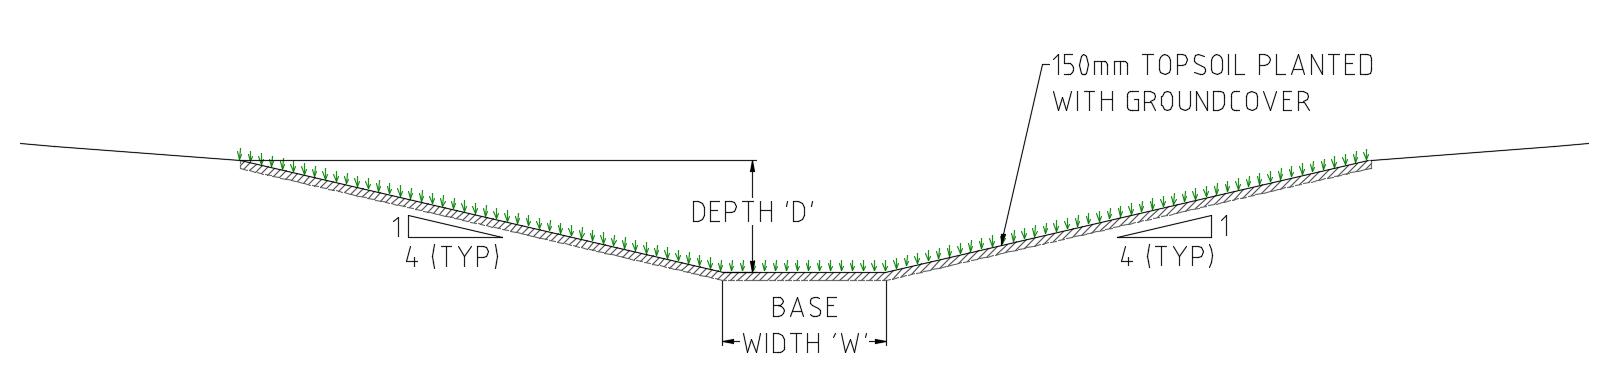
37 Typical cross-section - vegetated swale
Table 24. Minor drainage swale types with estimated required dimensions, assuming a longitudinal grade of 0.5%
Table 25 Modelled minor flows by subcatchment
Figure
Corowa
Mulwala
1
1
2
1
Swale 1 M_29b
Swale 1
9.2 Major drainage system
The major drainage system will need to convey the 1% AEP event flows through the urban growth areas to a suitable discharge location. The major drainage system, as determined by the options analysis, will consist of a chain of ponds network that incorporates naturalised, meandering waterways and intermittent shallow ponds to provide flood attenuation. Road reserves throughout the urban growth areas should also be designed to have capacity for the 1% AEP flows that will ultimately enter the chain of ponds network.
The waterway cross-sectional configuration concepts have been developed using the Constructed Waterways Design Manual (Melbourne Water, 2019) and the Constructed Shallow Lake Systems Design Guidelines for Developers (Melbourne Water, 2005).
Major flows for each of the urban growth areas from the RORB hydrological modelling have been tabulated in Table 26 respective to their waterway systems and waterway types and predominately used for the initial system sizing The major design flows across the catchments were assessed, and a range of typical maximum channel (compound or trapezoidal) dimensions adopted.
Following the hydraulic modelling, some further design refinements and checks were made to systems with complex outfall conditions (most particularly, System 1 in Mulwala) or pumped outfalls. These checks were made given the large difference between the hydrologic and hydraulic results. These modelling differences are further discussed in Section 9.6
The growth areas have been presented from upstream to downstream. A typical compound waterway detail is shown in Figure 38
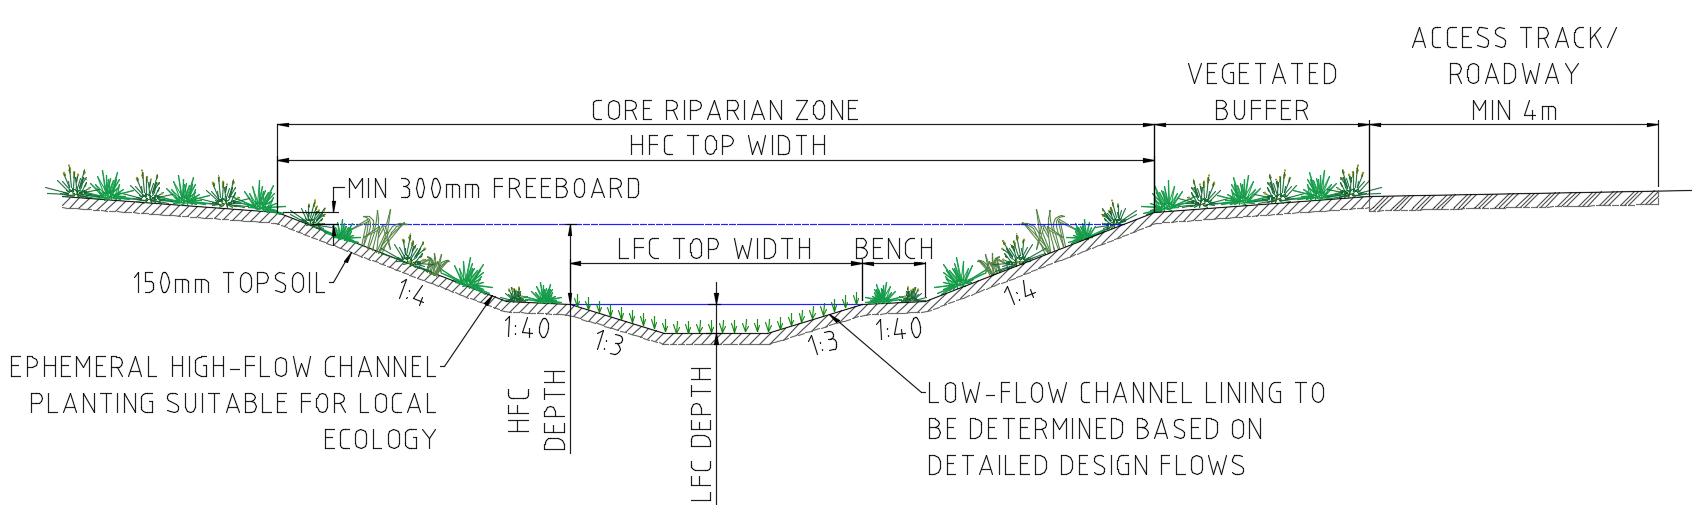
Figure 38 Typical cross-section - compound waterway
Cross sectional geometry
There is little guidance in terms of designing for Sloane’s Froglet within waterways (Knight, 2014) particularly regarding suitable hydraulic conditions They are generally found in waterbodies where water is still; however, have been mapped within several of the slow-flowing vegetated waterways in Corowa and Howlong. Given the characteristics of their current mapped habitat, there are opportunities to replicate this habitat throughout the chain of ponds and incorporate Sloane’s Froglet sensitive design principles within the cross-sectional geometry of the waterways and flood storage ponds (both in-line and centralised basins). This may include the provision of benches or niches to facilitate shallow, low velocity flows It is recommended that design discussions are held with a Sloane’s Froglet expert to further develop the cross-sectional geometry.
The adopted cross-sectional parameters for three types of compound waterways are shown in Table 27 Due to the desired minimum dimensions of a compound waterway (i.e., width to depth ratio and minimum width and depth of the low flow channel), the lowest capacity waterway type (1) has a capacity of 7 m3/s. For flows less than 5 m3/s, trapezoidal waterways (non-compound) have been adopted in line with the minor drainage swale sizing from Table 24 The Constructed Waterway Design Manual (Melbourne Water, 2019) does not explicitly recommend the use of compound waterways for a system of linear pools however they have been adopted for the larger flows for several reason. During low flows, the water can be confined to the low flow channel to provide the necessary flow velocities to prevent sediment build up within the channel; however, during high flows, excess water spreads onto the high flow benches increasing overall capacity. This helps to reduce flood risk and dissipate erosive force without needing to deepen or widen the low flow channel excessively.
Key parameters like vegetation buffers and total corridor widths have been adopted per the recommendations shown in Figure 39. Vegetation buffers will still apply to major waterways that have been designed with a trapezoidal cross-section.
Table 27. Channel cross sectional geometry and design parameters
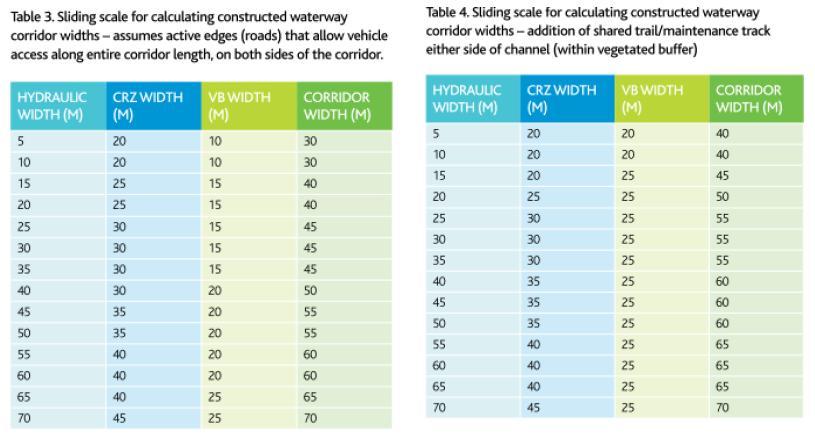
Longitudinal profile
The Constructed Waterways Design Manual (Melbourne Water, 2019) recommends adopting design grades less than 0.5% where possible to avoid the need for rock chutes or other bed grade control structures within constructed waterways Where natural slopes are less than 0.125%, a system of linear pools (see Figure 40) is recommended.
Longitudinal grades are very low and constrained across the townships of Mulwala and Howlong particularly, with natural slopes between 0.1% and 0.3% being common. As per the outcome of the options analysis, chain of ponds waterways have been adopted across the townships, which also aligns with the recommendations of the Constructed Waterways Design Manual (Melbourne Water, 2019)
Conversely, longitudinal grades within Corowa range between 0.5% and 1.5%, which will require bed grade control structures to be implemented. While in-line (linear) pools are recommended for waterways in catchments with flat natural slopes to provide hydraulic grade, the presence of in-line pools in steeper catchments also provides benefit. Several pools in Corowa will need to be designed with small chutes at their upstream end for energy dissipation purposes
Longitudinal grades for the design waterways are provided within Table 26
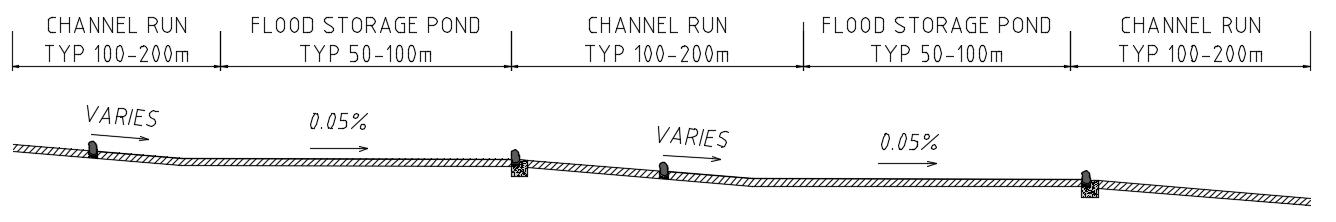
The waterways have not been designed with a low-flow meander as the available longitudinal grade is already so low and a meander would make it even flatter.
System outfalls
System outfalls for the major proposed chain of ponds or centralised basins are described in Table 28
Figure 39 Sliding scale for constructed waterway corridor widths (Melbourne Water, 2019)
Figure 40 Linear pools long section in chain of ponds
System Outfall Location
1
2
3
4
5
6
7
Chain of ponds outfalls to the minor open drain to the north side of the industrial estate. This is identified as the ‘North side drain to industrial estate’ within the Council GIS data. The outfall level of the chain of ponds cannot be less than IL 139.8 m AHD, which is the invert of the existing drain.
Chain of ponds outfalls into the downstream pond of System 1 at approximately chainage 1150
Chain of ponds outfalls to the intersection between Redlands Road and Cemetery Road. Culverts crossing Cemetery Road will be required to discharge stormwater into the existing swale running west along the southern side of Redlands Road. This swale connects into the existing major aerodrome drain which runs in a south-westerly direction.
Chain of ponds outfalls to the existing major aerodrome drain. This chain of ponds will have to traverse through land not currently designated for development (west of growth area C7). The downstream level of the connection is currently at IL 138.87 m AHD, which is approximately 500 mm above the invert of the aerodrome drain. To avoid the need for mass modifications to the existing drain (which is mapped as Sloane’s Froglet habitat), connections should be kept shallow and less intrusive.
The southern subcatchment of C7 will be serviced by a centralised WLRB which will outfall to an existing unnamed stormwater channel that runs in a westerly direction along the north of Nixon Street and adjacent to growth area C7. The channel ultimately discharges into the major aerodrome drain.
A pump will be required to service this WLRB.
The industrial growth area C8 will be serviced by a WLRB which will outfall to the north towards the existing swale drain on Redlands Road.
A pump will be required to service this WLRB.
The infill urban growth area C9 will be serviced by a WLRB which will either outfall to the existing Pinot Basin swale, or to the existing DN 750 mm stormwater pipe running through the growth area.
A pump will likely be required to service this WLRB, unless the depth and size ratio of the WLRB are adjusted such that it is shallower, and allows a gravity connection into receiving infrastructure.
8 Chain of ponds outfalls to the existing minor drain identified as the ‘Katrina Circuit outfall drain’ which runs in a westerly direction along the C6 southern boundary.
Howlong
1 Chain of ponds outfalls to the Murray River.
2
Outfall to the existing DN 400 mm RCP that runs southward along Holbeach Street. The existing (obscured) surcharge inlet pit shown in the image below can be converted to a junction pit to allow the connection. The Council GIS data indicates that the pit has a depth to invert of 1.8m, which has driven the grading and depth of the chain of ponds. There is significant capacity to shallow or steepen the chain of ponds system to facilitate connection into the existing stormwater network, once invert levels and depths are confirmed The H6 system has been placed directly on top of the existing topographic low point and is therefore already discharging to the piped stormwater network via the surcharge pit.
Corowa
3
4
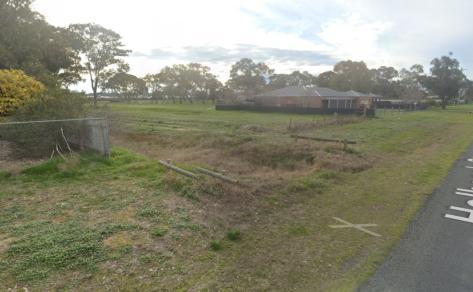
Chain of ponds outfalls to the Black Swan Anabranch and subsequently to the Murray River, via urban growth area H6.
Chain of ponds outfalls to the Black Swan Anabranch and subsequently to the Murray River. 5
Chain of ponds outfalls to a rural drainage depression west of urban growth area H8. The existing depression visible from Sturt Street (through H8) is pictured below.
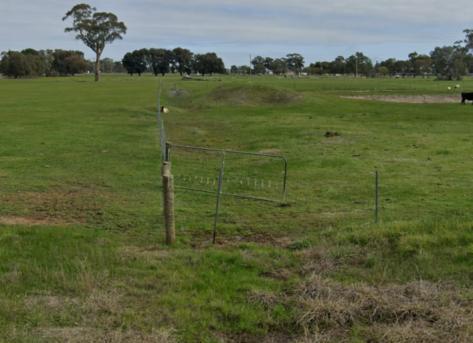
Outfall towards Majors Creek to the west. The new WLRB will require new approximately 500 m rising main and pump to move water to the crest of the new (unnamed) roadway servicing the industrial area to the south. The water can then be gravity drained to the west towards Majors Creek via an existing roadside swale and culvert crossing Kywong-Howlong Road.
This a similar outfall/ discharge approach taken by the existing detention basin built to service the industrial area to the south of H9.
7
A linear cutoff drain constructed along the northern boundary of growth area H9 that outfalls towards Majors Creek to the west. Some retardation and detention may be required for these external catchment flows prior to discharge to Majors Creek; however, this requires further development. Flows may have to be directed back towards the existing culvert crossing KywongHowlong Road to the south, via upgraded roadside swales.
8 A linear cutoff drain constructed north of growth areas H3 and H7 that outfalls towards the existing minor drainage channel/ depression near H8.
Chain of ponds outfalls to Lake Mulwala near the intersection of North Street and Corowa Road via 2x750 mm diameter stormwater pipes. The culverts will need to cross Corowa Road however can also pass through an existing Council owned parcel fronting Lake Mulwala.
The current modelling suggests that a pump with a minimum capacity of 50 L/s would also be required to discharge flows from the System give the higher elevation of the outlet pipes relative to the channel invert, and tailwater conditions. This pump sizing should be confirmed with
Mulwala 1
System Outfall Location
further detailed hydraulic analysis and take into consideration any changes made to land use and system design.
Peak flow within the outlet pipes under gravity conditions during the 1% AEP event is 3.4 m3/s.
An analysis of existing stormwater pipes was undertaken to determine the lowest existing outlet levels to Lake Mulwala. Several existing stormwater pipes have relatively shallow outlet invert levels with minimum inverts of approximately 124.0 m AHD. Pipes with inverts at or near this level include the Lane Street drainage pipe (DN 300 mm with and outlet IL 124.15 m AHD), and the Sturt Street drainage pipe (DN 600 mm with an outlet IL 123.98 m AHD).
Bathymetric survey undertaken by Dugdale & Clements (2015) was utilised to determine the outlet invert level for the system. An outlet IL of 124.0 m AHD has been adopted, assuming that a non-return structure will be installed at the outlet of the pipe.
An updated bathymetric survey at the proposed outlet pipe location should be undertaken during detailed design to determine whether the invert of the outlet pipe can be lowered. Under the current bathymetric conditions, in order for the outlet pipe to be at the invert of the System, the pipe would need to be extended another 62 m into Lake Mulwala, however, the standing water level within Lake Mulwala still presents a tailwater condition.
2
3
4
Chain of ponds outfalls to Lake Mulwala via M7. Based on the arrangement of the urban growth areas, it is assumed that there will be a roadway between urban growth areas M6 and M7, as well as urban growth areas M3 and M8. The chain of pond system will run alongside the north of this roadway, crossing Little Bull Plain Road. A culvert crossing will be required at this location. An outlet IL 124 9 m AHD has been adopted for this system.
Chain of ponds outfalls to Lake Mulwala via urban growth area M6. An outlet IL 125.0 m AHD has been adopted for this system. A culvert crossing Corowa Road will be required.
There is a minor crest through urban growth area M1 however due to the flatness of the site, local stormwater drainage systems can be directed to a single WLRB to minimise land take. There are three options for the discharge of the WLRB.
1. Discharge to the roadside swales. This option would require a pumped discharge and not guarantee drainage of the urban growth area due to existing ponding issues along Bayly Street, between the rail corridor and Lucan Street
2. Discharge to the existing DN 375 mm piped network near the intersection of Bayly Street and the rail corridor. There is an existing pit there with a nominated depth to invert of 1.5 m (based on the Council GIS system). This would require an under-line crossing of the rail corridor which would require consultation with the rail operators
3. Discharge to the existing swale at the Lucan Street/ Bayly Street intersection which drains towards the south-west. Discharging to this swale would require crossing Lucan Street and several subsurface utilities including water and sewer. The invert of the existing swale is approximately 124.7 m AHD at the Bayly Street/ Lucan Street intersection. This does not provide much grade with which to discharge from the WLRB given the current design NWL
The design drawings show that the WLRB will discharge to the existing swale across Lucan Street
The height and location of all services will require survey to confirm whether this option is feasible.
Pumping requirements
The pumping requirements across the Systems have been reviewed based on the outputs of the hydrologic and hydraulic modelling. Pumps are likely to be required predominately within WLRBs at Corowa at System 5 (C7),
System 6 (C8), System 7 (C9), Howlong System 6 (H9), and Mulwala System 1 (M2, M9, M10). These Systems are all WLRBs that cannot drain via gravity to the nominated system outfalls
The unit base case was developed assuming that pumps would not be required. Testing was undertaken on the noted WLRBs to determine the impact of small pumps instead of gravity outfalls (i.e., pumps with a max capacity of 20 L/s). No or low pump rates will increase the flood depths in the WLRBs by approximately 100250mm. Given the exponentially increasing cost of pumps, it is more cost effective for the depth of the basins to be increased.
9.3 Sediment basins
Sediment basins will be constructed at each outlet to the chain of ponds systems, and at the inlet to wetland retarding basins. These will be critical to limiting sedimentation in the channel, pond and wetland assets.
Sizing for sediment basins has been undertaken on a per urban growth area basis. The basins have been sized this way to allow flexibility with their placement. There are two options for the placement of the sediment basins:
1. At the outlets of the minor drainage system swales, prior to flows entering the waterways
2. At the upstream end of the wetlands
The locations of sediment basins (and wetlands) have not been shown on the concept design drawing plans; however, have been allowed for within the land take estimations and the cost assessment. Sediment basins should be located during the detailed design once the urban layout and stormwater services are finalised.
The sediment basins for the system have been sized to ensure capture efficiency of 90% for coarse particles greater than 125 µm diameter for the diversion flows. The Feyer and Geyer equation has been applied for the conceptual design of the sediment basins; this procedure aligns with ARR2019 (Australian Rainfall and Runoff 2019). This equation helps determine the appropriate dimensions and effectiveness of sediment basins to manage sediment runoff during storm events. The basins have been modelled with a typical sediment loading rate of 1.6 m3/ha/year for a developing catchment, a pool depth of 1.5 m, and a standard cleanout frequency of 5 years.
The batter requirements are specified in Table 29. Where a batter of minimum 1(V):5(H) above open water cannot be met, a fence or barrier should be adopted for safety reasons.
NWL to TED (350 mm)
Above TED (freeboard)
9.4 Flood storage ponds
Flood storage ponds will provide flood attenuation through temporary storage of floodwaters
Through the hydrological analysis, overall pond dimensions and sizes were analysed relative to each urban growth area and catchment size. This overall sizing approach was adopted to provide flexibility to the geometric design considering the concept level design and size of the stormwater servicing schemes The adopted hydrologic design parameters for the ponds are shown within Table 30 for both the ponds to be designed for froglet and non-froglet conditions The following criteria have been adopted for the design of the ponds:
Table 29. Sediment basin batters
• Avoid modifications to existing shallow-water bodies
• Typical regular pond spacing along the naturalised waterways of 150-200 m
• Typical maximum pond width of 40-50 m
• Pond EDD of:
o 150 mm for the design adopting Sloane’s Froglet parameters, o 350 mm for the design not adopting Sloane’s Froglet parameters.
The largest factor impacting the overall size of the flood storage ponds is the use of Sloane’s Froglet design parameters, and the very shallow EDD requirement Where reasonable, the adoption of Sloane’s Froglet parameters has been relaxed to allow for reduced land take. An example of where this has been done is within the industrially zoned urban growth areas C8 and H9, as well as the infill urban growth area C9. Additionally, while the unit base case hydrological parameters have been adopted across the areas to determine pond areas in line with the methodology discussed in Section 6, the parameters and total pond areas have been adjusted in certain growth areas.
One example of this is within Corowa, where the chains of ponds are shorter, and external catchments smaller than in Howlong and Mulwala. The total flood storage pond area along a chain of ponds alignment has been developed based on the base case ratios which in turn have been developed by looking at representative catchments along chain of ponds alignments. Generally, pond areas are larger at downstream sections of chains of ponds due to the larger cumulative incoming catchment. As such, the typical base case ratios were overestimating the required flood storage areas in Corowa. In these areas, lower base case ratios were selectively adopted Hydraulic modelling (further discussed in Section 9.6) was used to assess the performance of the flood storage ponds across the townships and urban growth areas
Based on the findings in the review of the infrastructure within the Riverland Gardens Estate (M3), no additional infrastructure has been proposed for this urban growth area. Recommendations for improvements to existing infrastructure have been provided within Appendix G
Table 30. Flood storage pond sizes across urban growth areas Urban Growth Area (& Subcatchment)
Corowa
C7 (C_247A)
C7 (C_247B)
No froglet
Howlong
Sloane’s Froglet
Sloane’s Froglet
(west)
Cutoff drain west
Mulwala
currently modelled in 12d
9.5 Wetlands and WLRBs
Wetlands and WLRBs will provide stormwater treatment, and stormwater treatment plus flood detention, respectively.
Wetlands were sized for treatment using the MUSIC model along with guidance from the Sloane’s Froglet Stormwater Wetland Design Guidelines (ACC & OEH 2017) The guidelines outline how specific habitat requirements of this endangered species can be incorporated into the design This approach aims to protect existing habitats while also facilitating the creation of suitable future habitats. These design parameters were consistently applied across all townships, including Mulwala, even though the flood storage ponds in this area were not designed with Sloane’s Froglet parameters in mind.
For growth areas implementing WLRB systems, two alternative wetland sizes were developed. The first aligns with the Sloane’s Froglet guidelines, prioritising ecological habitat outcomes such as shallow water zones. The second configuration incorporates increased EDDs and larger permanent pool volumes, consistent with the NSW MUSIC Modelling Guidelines and standard urban stormwater management practices but does not meet the Sloane’s Froglet guideline recommendations. This approach allows for flexibility in balancing ecological objectives with hydraulic performance and water quality treatment efficiency. The size of the WLRB is the maximum of the flood storage pond and the wetland areas.
Like the approach applied for sizing the sediment basins, the required total footprints of the wetlands were estimated based on the growth area (Table 32). This method ensures that the spatial requirements for the wetlands are proportionate to the development area and proposed imperviousness, facilitating an integrated and scalable design.
The analysis of inundation frequency and the detailed design of the wetlands are critical components that will be addressed in the future stages of design development. This phase should involve a comprehensive assessment of hydrological data to determine the frequency and duration of wetland inundation, ensuring that the design can accommodate varying water levels and flow conditions. The detailed designs will need to refine the initial conceptual plans, incorporating precise engineering specifications and adaptive management strategies to enhance the resilience and performance of the wetlands.
Growth areas with higher levels of proposed imperviousness (>20%) result in greater proposed wetland footprints. These areas will require a thorough investigation to determine the feasibility of using wetlands to meet the treatment targets These growth areas may require a different approach to water quality treatment which utilises measures with a reduced footprint, such as proprietary treatment devices or biofilters
Model assumptions
The wetlands and WLRBs were modelled in 12d Model using a set of standardised design parameters, as shown within Table 31 Other design assumptions have been noted below:
• Bathymetry of the wetlands and WRLBs has not been comprehensively modelled. Current modelling assumes that the wetland base is uniform and therefore wetlands have a consistent depth profile. This largely in line with the Sloane’s Froglet wetland design drawings (Albury City Council, 2024) and provides a conservative estimation of cut volumes.
• Sediment basins have not been modelled in 3D
• Sloane’s Froglet wetland design drawings (Albury City Council, 2024) show permanent pool depth as a range between 0.2-0.35 m. Modelling assumed consistent permanent pool depth below the NWL of 0.3 m
Table 31. Wetland and WLRB design parameters Wetland
NWL to pool base
NWL to TED
TED to top of freeboard
1(V):5(H)
NWL to pool base
NWL to TED
TED to top of retarding basin
Top of retarding basin to top of freeboard
Interfacing to surface (applied to Wetlands and WLRBs)
Access track (freeboard to outside edge of track)
Interfacing offset (outside edge of track to existing surface) 4.0
Where a chain of ponds was adopted, the total water quality areas (wetlands) were apportioned along the length of the waterway, typically allowing for 2-3 large wetlands per urban growth area to meet the water quality requirements. The information in Table 32 presents the wetland areas required on a per urban growth area basis. Refer to the concept design drawings (Appendix A) for the individual sizes of the wetlands that was modelled.
Where a WLRB was adopted, the required areas for flood storage and water quality were compared, and the larger of the two adopted for the size of the asset. Figure 41 shows the typical arrangements of the wetland and its interface with the chain of ponds waterway, while Figure 42 shows a typical WLRB cross-sectional detail.
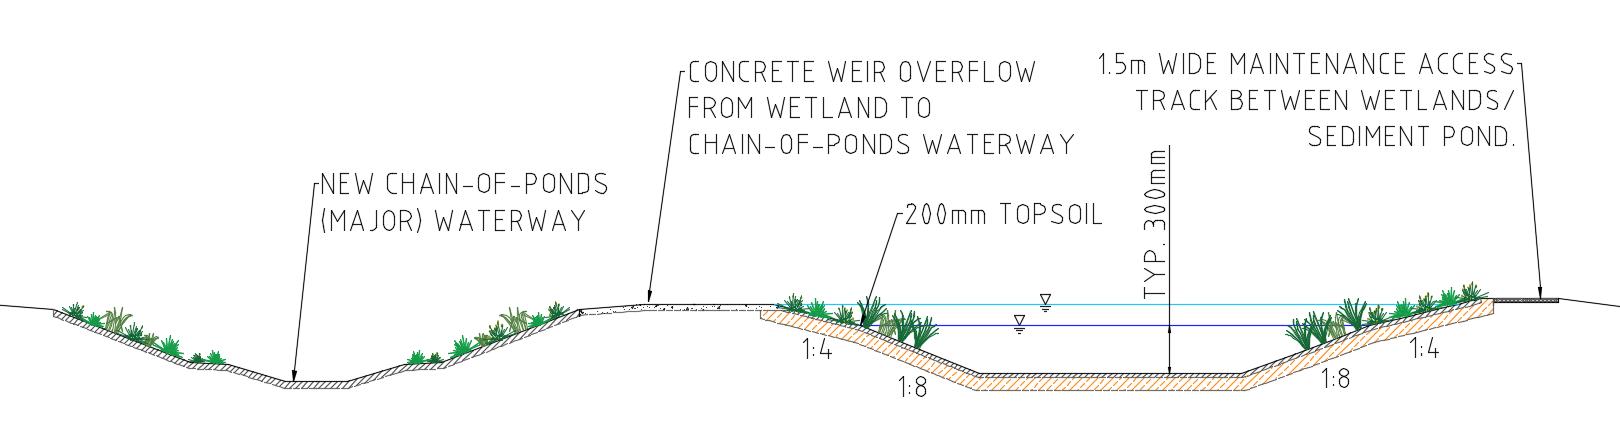
Figure 41. Typical wetland and waterway concept design section
Figure 42. Typical wetland retarding basin (WLRB) concept design section
Howlong
Table 32. Estimated sediment basin and wetland sizing
Corowa
*growth areas implementing Centralised Basin or Wetland Retarding Basin (WLRB) systems, wetlands modelled without Sloane’s Froglet
0.75 m)
9.6 Hydraulic modelling
Hydraulic modelling was undertaken for the three key townships: Corowa, Howlong, and Mulwala. These models are based on existing TUFLOW hydraulic models previously developed for the Federation Council flood studies. As part of this assessment, each model was updated to support the evaluation of concept drainage layouts for future growth areas.
Model updates
Key updates made to the hydraulic models include:
• Integration of updated hydrology: The hydrological inputs for each catchment were updated using refined WBNM models tailored to the growth areas. The updates included minor changes to existing land use and reflected the expected post development land use changes. Section 6 of this report details the hydrologic updates
• Flow boundary refinement: The inflow boundaries were revised to align with the updated hydrology. For pre-development scenarios, boundaries were updated using revised pre-development inflow hydrographs. For post-development scenarios, inflows were updated to reflect increased runoff due to changes in land use Minor updates to the model’s source-area boundaries were made to reflect these changes.
• Expansion of Mulwala model extent: The Mulwala model was expanded to incorporate surrounding growth areas previously outside of the hydraulic domain
• Representation of concept drainage infrastructure: For post-development scenarios, the concept design layouts for major and minor drainage systems (detailed in Sections 9.1 and 9.2) were incorporated into the hydraulic models. These include stormwater pipe networks, open channels, and major flow paths where applicable.
• Manning’s roughness adjustments: Manning’s ‘n’ values were updated to reflect the newly graded channels, ensuring appropriate representation of post-development surface conditions.
Model scenarios and preliminary results
Hydraulic modelling was undertaken for the 20%, 10%, 5%, 2% and 1% AEP design storm events.
Corowa
Results are presented in Appendix H
• Figures C1 to C5 – Existing Flood Depth from 1% to 20% AEP respectively
• Figures C6 to C10 – Existing Flood Velocity from 1% to 20% AEP respectively
• Figures C11 to C15 – Existing Flood Hazard from 1% to 20% AEP respectively
• Figures C16 to 20 – Design Flood Depth from 1% to 20% AEP respectively
• Figures C21 to C25 – Design Flood Velocity from 1% to 20% AEP respectively
• Figures C26 to C30 – Design Flood Hazard from 1% to 20% AEP respectively
• Figures C31 to C35 – Flood Level Difference from 1% to 20% AEP respectively
• Figures C36 to C40 – Flood Velocity Difference from 1% to 20% AEP respectively
Howlong
• Figures H1 to H5 – Existing Flood Depth from 1% to 20% AEP respectively
• Figures H6 to H10 – Existing Flood Velocity from 1% to 20% AEP respectively
• Figures H11 to H15 – Existing Flood Hazard from 1% to 20% AEP respectively
• Figures H16 to 20 – Design Flood Depth from 1% to 20% AEP respectively
• Figures H21 to H25 – Design Flood Velocity from 1% to 20% AEP respectively
• Figures H26 to H30 – Design Flood Hazard from 1% to 20% AEP respectively
• Figures H31 to H35 – Flood Level Difference from 1% to 20% AEP respectively
• Figures H36 to H40 – Flood Velocity Difference from 1% to 20% AEP respectively
Mulwala
• Figures M1 to M5 – Existing Flood Depth from 1% to 20% AEP respectively
• Figures M6 to M10 – Existing Flood Velocity from 1% to 20% AEP respectively
• Figures M11 to M15 – Existing Flood Hazard from 1% to 20% AEP respectively
• Figures M16 to M20 – Design Flood Depth from 1% to 20% AEP respectively
• Figures M21 to M25 – Design Flood Velocity from 1% to 20% AEP respectively
• Figures M26 to M30 – Design Flood Hazard from 1% to 20% AEP respectively
• Figures M31 to M35 – Flood Level Difference from 1% to 20% AEP respectively
• Figures M36 to M40 – Flood Velocity Difference from 1% to 20% AEP respectively
Corowa
The updated hydraulic modelling for Corowa shows a combination of localised increases and decreases within the growth areas, with downstream areas generally experiencing neutral or reduced flood levels across most events.
• C4, C5, C10 and C11 - Flood behaviour within these precincts includes both increases and decreases, reflecting the redistribution of local flows through the proposed drainage corridors. There are no net downstream increases in any storm event. Reductions are recorded across the industrial area along Hammersley Road, including Reporting Locations 17, 20, 7, 8, 9 and 18. Reductions are typically between 0.01 m and 0.03 m, with Location 7 showing a larger reduction of about 0.33 m across all AEP events.
• C3 - Localised increases and decreases occur near the downstream extent of the precinct. The design provides attenuation that results in minor reductions along the engineered swale downstream. Reporting Location 5 shows reductions of up to 0.01 m to 0.02 m in most events, with small increases of only a few centimetres in rarer events.
• C1, C2, C6 and C7 - Mixed behaviour is observed within the growth areas, with downstream reductions evident around Reporting Locations 3 and 12. The chain of ponds increases conveyance and provides useful upstream retention, lowering flood levels in most AEP events particularly in areas south of C6 and C7. Small increases of roughly 0.02 m are noted in the 1% AEP event downstream, suggesting that additional retention may be required to further mitigate peak flows in this scenario.
• C9 - Decreases are noted across all design events. Reporting Location 1 shows reductions of 0.01 m to 0.03 m, reflecting the addition of storage in this area.
• C8 - Reductions are observed across all events, consistent with Reporting Location 16. The largest decreases occur in the rarer events where downstream storage is more heavily engaged
Across the township, most reporting locations show small reductions or negligible changes. Increases, where present, are minor and typically within the order of a few centimetres, occurring in areas where increased storage or flow-path adjustment slightly elevates local water levels without causing adverse impacts to developed land.
Table 33 Flood level reduction (m) at reporting locations in Corowa
Howlong
The updated hydraulic modelling for Howlong shows widespread reductions in flood levels across all growth precincts following the introduction of the chain of ponds system. The additional storage and structured conveyance created by the ponds provide a downstream pathway for previously trapped local stormwater, lowering flood levels both within the development areas and in large parts of the township.
• H2, H9 and H3 - Reductions are observed across all reporting locations associated with these precincts, including Locations 22, 23, 6, 4, 2 and 7. Reductions at H9 are minor to neutral, reflecting its position on the fringe of the improved drainage network. More substantial reductions occur at H3, where decreases of about 0.04 m to 0.06 m are recorded across the design events. These reductions occur due to the provision of an outlet via the chain of ponds, which removes previously trapped water and lowers flood levels downstream.
• H1, H7 and H8 - New areas of inundation appear along the swale alignment through H1 and H7, consistent with the intended design function of conveying local overland flow. These changes result in reductions beyond the growth areas, including within the adjacent palaeochannel. Reductions are reflected at Reporting Locations 1, 2, 3, 20 and 21. No net increases are observed within H8, where changes remain neutral to slightly reduced across the storm events.
• H4, H5 and H6 - Large reductions are observed in the southern precinct cluster and across parts of the existing township, particularly at Reporting Locations 16 and 17.
Across the township, the reporting location table shows reductions at most points, with several locations recording decreases greater than 1 m where the proposed swale and chain of ponds remove long-standing trapped water. The reductions are consistent across the 1, 2, 5 and 10% AEP events, with neutral outcomes in smaller, more frequent events where limited storage is engaged.
Table 34. Flood level reduction (m) at reporting locations in Howlong
Mulwala
The updated hydraulic modelling shows reductions in flood levels across most of the Mulwala growth areas; however, translating these outcomes into a practical design requires careful consideration of the physical constraints at Mulwala.
• M2 - The modelling demonstrates that the chain of ponds system provides sufficient head during larger events, including the 1%AEP to enable gravity driven attenuation and reduce flood levels within the growth areas. These reductions occur even with the high tailwater conditions (RL 124.7 m AHD) imposed by Lake Mulwala. For more frequent events, however, the available gradient between Growth Precinct M2 and the lake outlet is small. This limits the ability of the system to fully drain under gravity and results in residual ponding within the lower reaches of the swale. Under these conditions, pumping is required to remove the remaining water. Current estimates call for a pump of around 50 L/s to drain the storage in a day.
• M3 – The modelling suggests that M3 continues to behave as a trapped low point. The introduction of the chain of ponds has shown broad-scale reductions in flood levels where some of the runoff is able to be discharged towards Lake Mulwala. There is further room for improvement where the alignment of the chain of ponds be adjusted towards Tocumwal Road to allow the system to intercept a larger portion of the runoff trapped from the low point and provide a more efficient connection for flows generated north of Tocumwal Road.
• M8, M7 and M5 – These precincts drain directly to the east and contribute to downstream reductions in flood levels. This behaviour is reflected in the reductions at Reporting Locations 11, 14, 12, 15 and 13, where decreases are consistent across most design events due to improved conveyance.
• M9, M10 – Localised increases and decreases are observed within these areas. The increases are associated with higher runoff from land use changes before flows enter the designed swales and storages. Once the system engages, downstream reductions occur as storage attenuates peak flows.
• M1 – Changes are generally neutral. Storage within the precinct produces slight reductions, consistent with the small decreases observed at Reporting Location 1.
Overall, the modelling confirms that the chain of ponds concept reduces flood levels across the majority of the township; however, practical delivery will need to address the constraints imposed by the low gradient to the outlet, the persistent trapped low point at M3 and the requirement for appropriately sized pumping infrastructure during frequent events.
Table 35 Flood level reduction (m) at reporting locations in Mulwala
Hydrologic and hydraulic modelling differences
The 1% AEP event pre-development and post-development peak flows from the hydrologic modelling for the preferred concept design are provided in Appendix D.
A comparison of hydrographs showed that peak flows from the hydraulic model were lower than those from the hydrologic model. This is attributed to the flat nature of the Mulwala catchment, were numerous low points and obstructions store and delay runoff. These features are explicitly represented in the hydraulic model but not in the hydrologic model.
The hydrologic model assumes more efficient routing, with water efficiently conveyed downstream along continuous pathways. This provides a conservative estimate of flow but does not reflect the storage and attenuation that occur in reality. The hydraulic model, by contrast, accounts for these local conditions, producing lower but more realistic peak flows.
Together, the two approaches are complementary. The hydrologic model offers a conservative upper bound of catchment yield, while the hydraulic model demonstrates how storage, obstructions and surface connectivity shape actual flood behaviour.
9.7 Impacts
Utilities
To inform the utilities impacts assessment, the Council GIS data for the stormwater, potable water, sewer and electricity networks were reviewed. All available Council utilities mapping is shown on the concept design drawings (Appendix A). The key services that are located within the construction boundary and if/how they will be impacted are shown in Table 36
A summary of existing (and proposed) impacted utilities is provided with Table 4 and Table 36. The key risk regarding utilities is working near overhead wiring.
Water main – 150 mm BB Sewer – 40 mm uPVC
Sewer main –225/300 mm uPVC and 150 mm uPVC
C7 Sewer main – 250 mm uPVC
Main running east west direction along the southern boundary of C1.
Redlands Road (east west) at the intersection with Cemetery Road.
Through the south, west and north of the growth area.
Along Nixon Street (east west) and adjacent to the southern boundary of C7.
Main will impact the alignment of the chain of ponds. Chain of ponds has been shifted to allow for a service corridor to its south.
Mains will impact the road crossing required from chain of ponds systems 2 and 3.
Mains will impact the chain of ponds. Depending on depth of mains, waterway may be able to pass above sewer mains.
Minor impact as the location of the WLRB can be adjusted to avoid the sewer main.
Table 36. Utilities impacts
C1 Sewer main – 150 mm uPVC
C3/C5
C6
H1
Water main – 100 mm AC
H1 Water main – 50 mm uPVC
H1/H2/H3 Water main – 100 mm uPVC
H1 Sewer – 300 mm uPVA rising main
Water main – 50 mm uPVC
Hume Street (north south) - disposed main along the eastern kerb
High Street (north south)minor pipe size.
Townsend Street (north south) – minor pipe size.
Hume Street (north south) along the eastern kerb and western kerbs.
No impact to works given service is disposed
Close to proposed chain of ponds but no current impact. However, the main is minor and servicing local properties. New mains will likely be required for the growth area.
No current impact to works; however, the main is minor and servicing local properties. New mains will likely be required for the growth area.
Works will be impacted due to main location Hume Street will likely get extended to the north as part of the urban growth area development. A bridge crossing the chain of ponds should be considered instead of providing culverts for a road crossing. This means that any existing (or new) services can be suspended to or below the bridge. Given these services lead directly to the wastewater treatment plant, it is likely that upgrades or new services along the existing alignment may be required.
H9
Stormwater rising main
H5/H6 Water main – 100 mm uPVC
H6 Water main – 100 mm BB
M2 Water main – 100 mm BB
M2 Stormwater main –
450 mm uPVC and 100 mm PE rising main
M2 Sewer main:
80 mm uPVC x 3
50 mm uPVC
Unnamed roadway (east west) along the northern verge, between H9 and the new industrial precinct to the south.
Riverina Highway at the interface between urban growth areas H5 and H6.
Ashford Road (north south) along the western edge.
Corowa Road and North Street intersection – water mains running alongside both road kerbs.
Corowa Road and North Street intersection –stormwater mains running along the northern kerb.
Corowa Road and North Street intersection –several sewer mains running along both kerbs.
Design of the WLRB to service H9 should consider the placement of the existing rising main (i.e., co-locating services may be an option).
H5 pond and culvert crossing the Riverina Highway will require clearance from existing service.
If service is to be retained, chain of ponds can be shifted to the east to provide the required clearance.
Chain of ponds system will need to cross several services in this location to outlet to Lake Mulwala. There are other potential outlet locations along Corowa Road though they are all similarly service restricted. Due to the depth of system outfall, and likely shallow depth of water, sewer, and stormwater services, it is anticipated that the culvert will be able to cross beneath existing services.
Existing stormwater system
It is not expected that any existing stormwater networks will require upgrades to cater for changes in capacity. This is due to two main design factors:
1. Flood detention ponds have been designed to retard the peak 1% AEP flows and cater for the changes in land use,
2. There have been no changes to catchment flow directions upstream of existing stormwater systems (i.e., flows are generally being discharged via new chains of ponds in line with existing natural topographic relief). Refer to Figure 23, Figure 24 and Figure 25 for comparisons between predevelopment and post development flow directions.
It should be noted that post development flow directions have been significantly changed in Mulwala, however as all systems discharge to Lake Mulwala, there are also no impacts on existing stormwater networks.
Hydraulic modelling for a range of events doesn’t indicate there are any negative impacts to the existing systems, and nuisance flooding does not impact any urban areas. As such, no capacity improvements are suggested.
Changes to receiving systems, particularly in Corowa, should be approached with caution due to the presence of Sloane’s Froglet. While some nuisance flooding across the urban growth areas could be improved by removing dense vegetation and sediment build up within channels, this could potentially impact Sloane’s Froglet unfavourably.
10 Operations and maintenance
Council should be aware of and plan for the operational and maintenance needs of the new maintenance assets, as if this is not planned and budgeted for and then performed, the assets will not function as intended. The following section provides some additional information on these allowances.
Access
Ongoing site access will mainly be required for maintenance activities on the sediment basins, WLRBs and Chain of Ponds including mowing grass and weed removal, and can be obtained through a minimum 4 m wide reserve surrounding the assets. Allowances for access tracks have been made surrounding the wetlands and WLRBs, as well is within the chain of ponds corridors. It is assumed that the access tracks will be suitable for a standard utility vehicle.
Sediment basins should be equipped with direct access tracks for sediment removal They will need to be accessed by a small or medium truck It is envisaged that access to the sediment basin will be required no more than once every 3-5 years for dewatering.
Maintenance
The principal maintenance activity would be to undertake sediment dewatering of the sediment basin, and infrequent drainage of the wetland system. Sediment basin access would be via a 4 m wide, 1 in 5 (max) graded access ramp to the base of the sediment basin The base of the sediment basins should be lined with concrete or rock to improve maintainability.
Maintenance costs for assets typically vary based on the following parameters:
• Vegetation type & density: macrophytes, riparian planting and grassing.
• Access & safety: urban vs. semi-natural settings.
• Performance standards: water quality targets, habitat complexity.
• Frequency of sediment/debris removal
Averaged annual maintenance costs for typical asset types have been provided within Table 37. Maintenance costs for chain of ponds naturalised waterways are not available in current data; however, provided that preliminary sediment management is undertaken via the sediment basins, the chain of ponds waterways should be subject to minimal maintenance requirements.
Table 37. Averaged annual asset maintenance costs Asset
Sediment basins (per m2)
Constructed wetlands (per m2)
Stormwater drainage (assume piped) (per residential lot)
Sediment dewatering areas
$20-40
$8 - $20
$57-$157
Previous Alluvium/ NCE work
(Water Sensitive SA, 2025)
Previous Alluvium/ NCE work
A sediment dewatering area will be required for each sediment basin to allow for accumulated sediment taken from the sediment basin to be dried before it is transported off the site. This is proposed to occur adjacent to each asset, so that wet sediment can be moved by a bobcat with short trips. Access to the sediment basin is typically via a ramp to the base of the basin.
Construction sediment management
There is a frequently occurring issue in the development industry that newly constructed stormwater management basins suffer from excess sedimentation from lot scale development in the catchment.
Based on the staging of these developments, it is likely that the stormwater management basins assets will be delivered first, with subsequent contractors being engaged to deliver the minor drainage infrastructure and housing assets.
Therefore, it is recommended that Council strictly enforce erosion and sediment controls, and also require that developers clean out sediment basins prior to the handover of assets to ensure appropriate functionality under normal sediment loading conditions
11 Estimate of probable costs
A bill of quantities and construction cost estimate has been prepared for the concept design package. The costs were sourced from Rawlinsons Construction Handbook 2024, supplier quotations, and construction costs for previous projects. Quantities were compiled using the 3D design prepared in 12d Model, and project drawings.
The costing has been prepared on the basis that the urban growth areas and systems will be developed separately and staged. Due to the concept level design, a 40% contingency has been applied to the costings. Further refinement of the preliminary costs is required.
A summary of the cost estimates has been provided in Table 38 (Corowa), Table 39 (Howlong), and Table 40 (Mulwala). A full copy of the cost estimates has also been provided within Appendix B, including tables of asset volumetric and area breakdowns, and assumptions.
Table 38 Estimate of probable costs at Corowa
Table 39. Estimate of probable costs at Howlong
Table 40. Estimate of probable costs at Mulwala
12 Land use
Table 41 shows the proportion of each stormwater servicing plan area relative to its corresponding urban growth area. These figures exclude the widths of minor stormwater drains, as these are typically located within road corridors and are already accounted for in road design. In some cases, road corridors can also be integrated into the chain of ponds riparian corridors for space efficiency.
Table 41. Proportion of stormwater system area to developable area (per system)
13 Funding and staging strategy
13.1 Funding opportunities
The Federation Shire Council annual budget is primarily focussed on asset renewal, and maintenance with a capital works program is directed towards roads, stormwater, water and sewer assets or assets required It is envisaged that Council will need additional funding to deliver the stormwater servicing for the urban growth areas to supplement the funding available under the capital works program.
There are several typical mechanisms that councils utilise to deliver stormwater infrastructure in NSW. These include implementing a Stormwater Management Service Charge or requesting developer contributions Council may wish to use a combination of mechanisms to support the detailed design and construction of the proposed stormwater scheme plans. Funding mechanisms are discussed below:
1. Developer contributions - these contributions are governed by the Environmental Planning and Assessment Act and are a primary funding source for growth-related infrastructure.
▪ Section 7.11 Contributions – charged when there is a direct link between development and the infrastructure required. Councils prepare contribution plans that outline costs for stormwater drainage and other infrastructure.
▪ Section 7.12 Levies: A fixed percentage (usually up to 1%) of the development cost, used for local infrastructure including stormwater systems.
▪ Planning Agreements (VPAs): Negotiated agreements with developers to deliver or fund infrastructure beyond standard contributions.
2. State and Federal grant programs – several grants may be available to Council including:
▪ The Floodplain Management Program grants to reduce flood risk, including stormwater upgrades. Given the designs afford improvements in flooding, they may qualify under this grant program.
▪ The Accelerated Infrastructure Fund was launched in 2020 as part of the Planning System Acceleration Program. The program aims to speed up housing delivery in high-growth areas of NSW. Tranche 3 of the fund was announced in 2024. It is unknown whether a Tranche 4 will be announced; however, Council should look out for opportunities under this scheme.
3. Stormwater management service charges
▪ Council does not currently have an established general Stormwater Management Service Charge. Guidelines (Department of Local Government, 2006) are available to assist councils in deciding whether and how much to levy. Council is currently undertaking the Special Rate Variation Project (Federation Council, 2025) in their journey to be financially sustainable, following the amalgamation of several separate LGAs, and per the 2025/26 Revenue Policy are planning on levying a property service certificate of $105.
Sydney Water Aerotropolis example
Sydney Water is currently rolling out NSW’s largest integrated stormwater servicing scheme for the Aerotropolis precincts surrounding Western Sydney International Airport. The stormwater scheme uses an integrated water cycle management (IWCM) approach where stormwater will flow into natural water channels and wetlands instead of relying on subsurface drainage. The stormwater collected in wetlands will be used for harvesting, treatment, and reuse as recycled water, all with the aim of meeting the mean annual runoff volume (MARV) targets set for Wianamatta South Creek.
Sydney Water is implementing several funding mechanisms as discussed above, to deliver the Aerotropolis stormwater scheme plans. These are discussed below and have been used as examples for what Federation Council could also implement:
1. Government investment – the NSW Government has committed $644 million to Sydney Water for the delivery of stormwater and recycled water infrastructure in the Mamre Road Precinct, which is the first precinct to be developed within the Aerotropolis.
2. Developer contributions in the form of Development Servicing Plans (DSPs) that outline infrastructure needs and costs:
o Developers are required to contribute to stormwater infrastructure costs through per-hectare charges
o For Mamre Road, the initial proposed bond fee was $1.3 million per hectare, but after government negotiations, it was reduced to $877,000 per hectare
3. Interim bonding arrangements – for precincts where DSPs are not yet finalised, Sydney Water has implemented Stormwater Infrastructure Contribution Bonds These bonds act as financial security to allow development to proceed while final plans are being completed. The current bonding rate is $1.019 million per developable hectare (FY25).
13.2 Staging principles
The drainage assessment for the Federation Council stormwater servicing plans is for the ultimate development scenario. Development will not necessarily occur in a linear upstream-downstream sequence, in other words it will be ‘out of sequence development’. Reaches of waterways are frequently constructed out-of-sequence by different developers and designed by entities. It is therefore important to understand the expectations on developers to provide a sufficient level of service, and for planning authorities to have an indicative staging strategy.
Development staging must ensure the early delivery of ultimate waterway/drainage infrastructure including stormwater quality treatment. Where this is not possible, development must demonstrate how any interim solution adequately manages and treats stormwater generated from the development and how this will enable delivery of an ultimate drainage solution, all to the satisfaction of the responsible authority.
The proposed construction strategy has been based on the principal objectives of constructing the project in a timely and efficient manner and ensuring impacts are minimised through the provision of appropriate management measures. The strategy for construction consists of the following key elements:
• It is critical that outfalls are provided for any stormwater works
• If an upstream development occurs before downstream ones, the developer will need to build a temporary outfall with construction and maintenance at their expense.
• A developer can also negotiate with downstream landowners/developers to come to an agreement in terms of either a temporary outfall or building the final waterway asset required.
• Temporary interface management treatments should be provided if upstream developments are yet to occur to provide stability (e.g. rockwork)
• The function of Council assets is required to be maintained at all times through the development (including the conveyance of external flows through the development).
• No section of Council assets should be decommissioned until the agreed arrangements are in place to provide the current services
• Construction staging will need to ensure that new assets are not filled with pollutants from upstream development. This will need to be achieved through strict erosion and sediment controls, and assets should not be accepted by Council as completed until associated upstream development is completed.
Asset ownership agreements
It is assumed that Council will have ownership of any new stormwater drainage assets within the urban growth areas. Developers would be responsible for the construction of the assets and then hand them over to Council following the appropriate consolidation and maintenance periods. This should include sufficient vegetation establishment periods and inspections
Staging
The function the Council assets provide is always required to be maintained through the development and no section of asset should be decommissioned until the agreed arrangements are in place to provide the current services.
Council indicated that staging of drainage works may be possible, but any connection to Council controlled drainage assets will be subject to retardation and flow rate restrictions (i.e. such that the channel capacities are not exceeded). It is therefore desirable to stage development from the downstream end of the drainage catchment, with the first phase of each stage being the ownership/management transfer and reconfiguration of drainage. This option is preferable as it would limit Council’s risks to their remaining assets (i.e. not constructing upstream areas first that will outfall into existing Council drains). It does, however, require temporary diversions around the new waterway/wetland alignments while they are being constructed. This approach is schematised in Figure 43
The alternative staging arrangement is if upstream developments occur first, developers will need to retard flows within their development before discharging into the newly constructed waterway/wetland alignments or temporary diversions, which then flow into the existing Council drains. This ensures the downstream drain is not impacted/exceeded in capacity. This option will still require temporary diversions as the constructed waterways will be much deeper than existing Council drains, so will not freely drain unless some temporary outfall is provided.
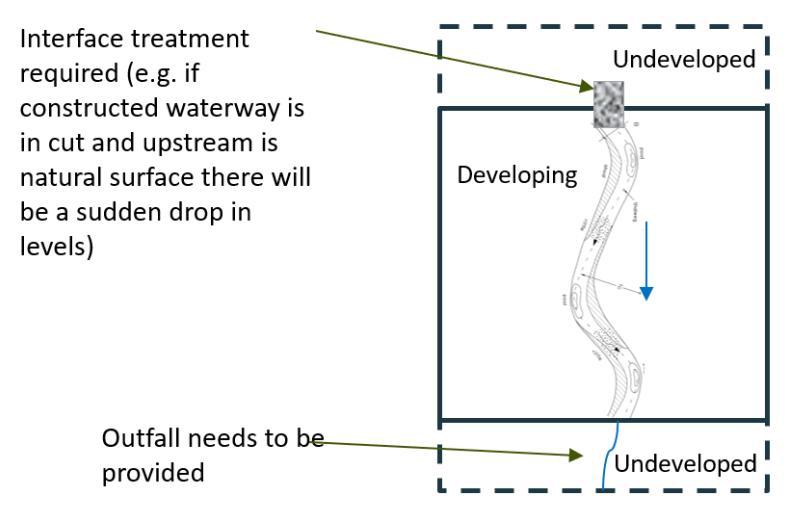
There is also a potential for the land use of certain growth areas to change during the development horizon. An example of this is also in Mulwala, whereby growth areas M9 and M10, currently designated residential growth areas with an ultimate development horizon (i.e., 30 – 45 years) may be developed industrially as solar farms within the 0 – 15 year development horizon.
The concept design was developed considering the proposed land use. WLRBs were the preference for industrial areas where possible. Developing M9 and M10 as industrial areas will change the post-development flows but also impacts the desirable stormwater servicing design. Developing these areas is difficult inherently due to their topographical constraints and distance to Lake Mulwala and their servicing has impacted the
Figure 43 Staging schematic
options selection for M2. If these areas were not to be developed at all, M2 could be serviced with a much shallower, smaller capacity chain of ponds, or with a WLRB.
To account for the potential development of upstream growth areas, M2 (or similar urban growth areas) could be developed in the short term with a smaller chain of ponds, designed to cater for the directly contributing catchment to M2 The creek corridor required for the future growth should be allowed for in this case. If the upstream growth areas are developed, the creek can subsequently be expanded to suit.
Cons of this approach are that by expanding the creek corridor and pond infrastructure, additional construction works would be required, and vegetation would have to be re-established The benefits of this approach include needing to only maintain and operate an asset that is suitably sized for the relevant growth area
Preferential development of the downstream growth areas is broadly in line with Council’s current water and sewer servicing strategies (Federation Council, 2021) These strategies are reflected within the indicative staging plans presented within Section 13.3 Growth area H7 does not reflect this strategy
Water quality
The capacity of most of the major waterways have been designed to cater for the volume of external flows coming through the precinct; however, as described in Section 1.1, the wetlands themselves have not been sized to treat flows from external catchments. Wetlands will somewhat treat the flows from the external agricultural areas when they pass through the vegetated zones in the wetlands.
Council encourages its customers to be mindful of their agricultural practices and their impact on the environment; however, it has limited control over the quality of water entering its drainage system from irrigated farmland.
13.3 Indicative staging plan
A staging plan has been developed for the townships based on achievement of the design principles previously stated, and working with the land parcels where possible. The preferable staging plan has been prepared using Mulwala urban growth areas as an example reference, as the chains of ponds pass through several urban growth areas.
The steps below are for an indicative staging plan that would best meet Council’s requirements and provide adequate drainage of both the developing urban areas and existing rural areas. This plan is applicable to all townships; however, does rely on developing downstream infrastructure preferentially.
1. Outfall channel/ culvert works (system 1 to the Lake Mulwala near North Street and Corowa Road).
a. Assets transferred to Council (following establishment and civil handover period).
2. Construction of system 1 through urban growth areas M2 and M4.
a. Assets transferred to Council (following establishment and civil handover period).
3. Construction of channel/ culvert works at the Tocumwal Road crossing. This includes ponds and detention infrastructure on either side of the culvert.
a. Assets transferred to Council (following establishment and civil handover period).
4. Construction of system 1 through urban growth area M10.
a. Assets transferred to Council (following establishment and civil handover period).
5. Construction of system 1 through urban growth area M9.
a. Assets transferred to Council (following establishment and civil handover period).
Table 42 below shows the indicative staging steps for a given system. Ultimately this should be refined by the contractor prior to works.
Table 42. Indicative staging plan example for a section of waterway
Preliminaries
1. Supply and approval of Construction Programme
2. Supply and approval of Traffic Management Plan (TMP)
3. Supply and approval of Construction Environmental Management Plan (CEMP)
4. Supply and approval of Project Management Plan incl Quality Management and OH& S Plans
5. Supply and approval of Council asset diversion and decommissioning plans; ownership agreements
6. Geotechnical investigations to assess use of in-situ clay; soil contamination investigations
7. Cultural heritage staff induction and protection fence installation
8. Site protection fencing and measures to retain safe public access
9. Inspection of set out of all works
10. Pre-works weed and vermin control
11. Plant/materials procurement Alignment construction (wetland/ waterway)
12. Temporary diversion of existing Council drain (ownership handed over to Council)
13. Topsoil strip and stock piling
14. Bulk earthworks excavation (waterways and sediment basins)
15. Clay liner compaction results and final level check
16. Construction of waterway crossings and culvert placement
17. Sedimentation basin (if any) connection pipe installation
18. Cutting and armouring of stormwater outlets
19. Rockwork installation
20. Final level check prior to placement of topsoil
21. Placement of topsoil
22. Jute matting and mulch placement
23. Concrete path formwork and concrete placement
24. Fencing, bollards, handrail and gate installation (if applicable)
25. Planting, guards
26. Commencement of watering program (cart watering) Finalisation
27. As constructed survey PDF and CAD files
28. Final trim and hydroseeding/sprigging of disturbed areas
29. Practical Completion
30. 13 Week Plant Establishment Inspection
31. 26 Week Plant Establishment Inspection
32. 39 Week Plant Establishment Inspection
33. Maintenance manual handover
34. Final Completion 52 weeks
Township specific staging plans have also been indicatively developed and show within Figure 44, Figure 45, and Figure 46. These consider the 15-year, 30-year and ultimate development horizons used within the Water Supply and Sewage Disposal Servicing Strategies (Federation Council, 2021). Further work is required to align these with Councils anticipated procurement strategy
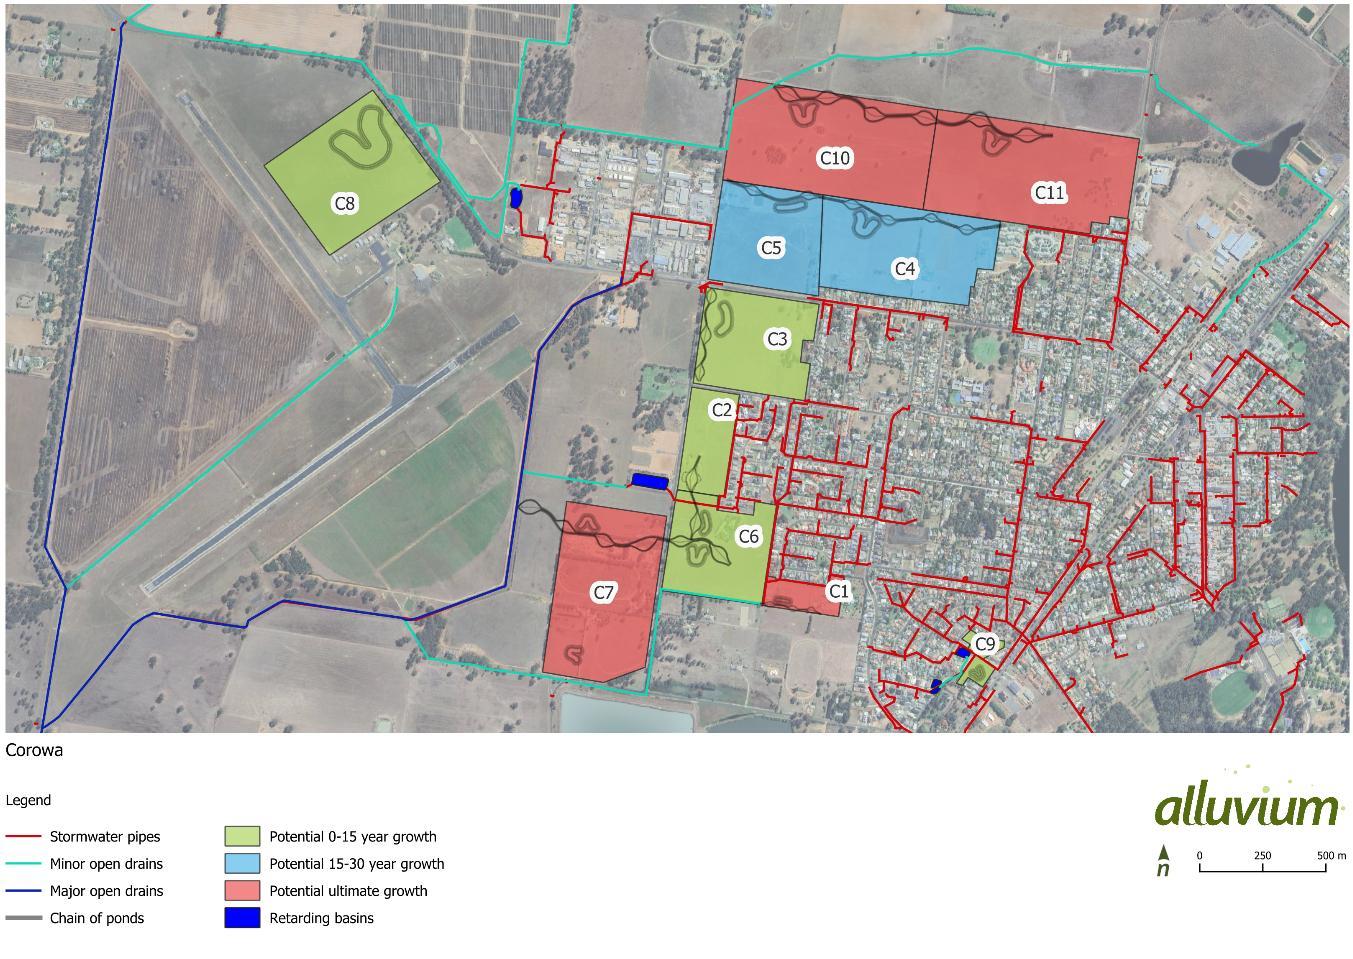
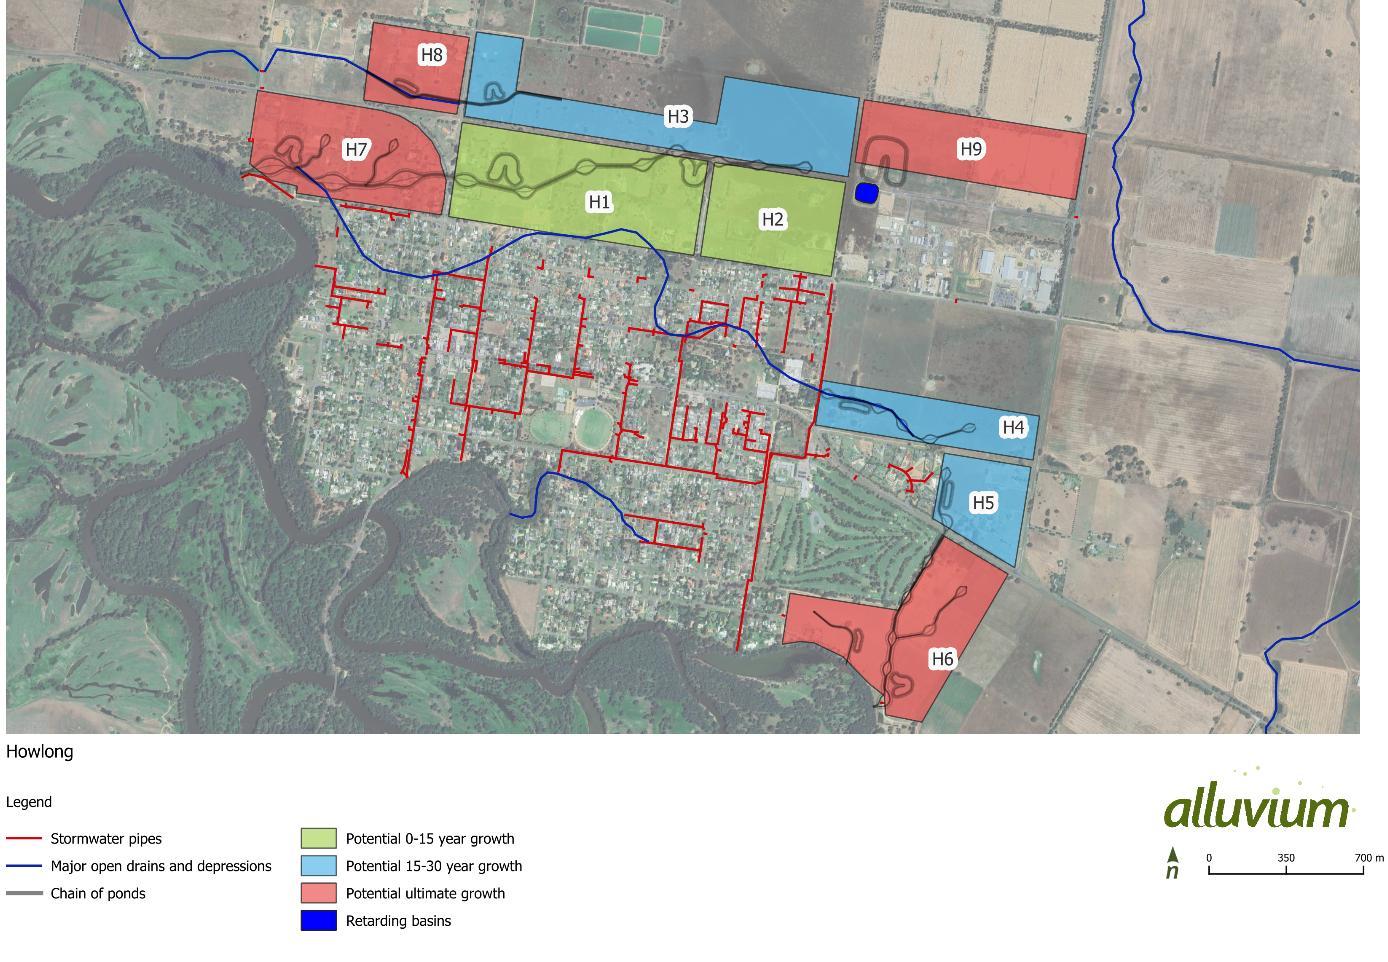
Figure 44 Indicative Corowa staging plan
Figure 45 Indicative Howlong staging plan
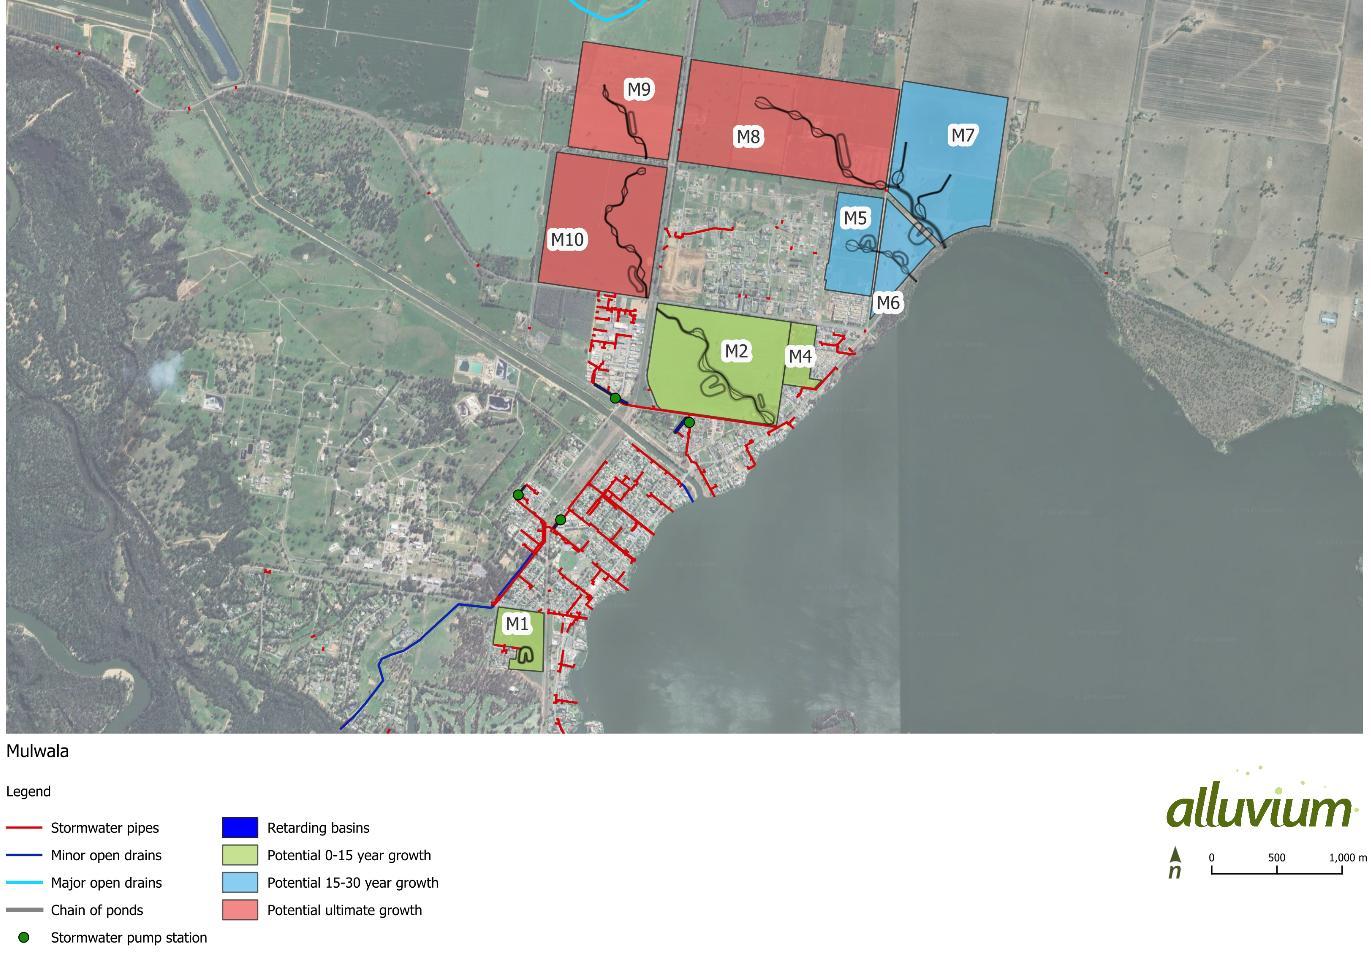
Figure 46. Indicative Mulwala staging plan
14 Safety in Design
The design of these works should seek all opportunities to minimise the risk to the safety of those building stormwater infrastructure, those maintaining it, and the public
Public safety is an important consideration near stormwater conveyance and treatment systems, especially in areas which will be zoned for residential use. Levels of risk can relate to the location of the waterway and wetland, type of inflow, ease of access, nearby land uses, and site context, as well as risks associated with maintenance and general management activities.
Alluvium held a Safety in Design (SiD) workshop and compiled a register during the concept design stage. During the risk assessment process, identified safety hazards were assigned a mitigation action and a responsible party. The register is attached with the Safety in Design report in Appendix C of this report and this register should be continually revisited through further design and construction to design out safety hazards where possible.
Some of the key design risks have been summarised in the sections below
14.1 Flood events
The design of the servicing plans will be assessed for impacts on flood levels and floodplain storage which could adversely affect adjacent landholders. Hydraulic hazard is further discussed in Section 9.6; however, it has been preliminarily noted that some of the waterways have a high hydraulic hazard.
The following measures can be considered to manage flood-related risks:
• Physical barriers – install fencing or guard rails at locations with high hydraulic hazard
• Vegetation buffers – establish dense low-lying or riparian vegetation along channel edges to discourage access and provide a natural barrier while maintaining environmental values.
• Signage – provide warning signage at key public access points to advice of potential flood risk
• Emergency planning – Coordinate with Council to ensure suitable procedures are in place for evacuation procedures and safe access routes during precinct development.
14.2 Batters
The construction of new waterbodies brings hazards to users of the surrounding land, and their edges must be designed to manage these hazards.
While the design has been completed to concept level only, adopted batters should generally be in line with the recommendations relative to each asset type, except for naturalised waterways. For the naturalised waterways, batter slopes of 1(V):4(H) for the high flow channel have been adopted, with more detail provided in Section 9.2 It is also recommended that there is a minimum 300 mm wide dense impenetrable planting zone at the top of all batters steeper than 1(V):4(H), leading to water depths of greater than 200 mm This will deter pedestrian access to deep-water zones and provide a vegetation buffer between the hydraulic zone and any adjacent roads or pedestrian or maintenance access tracks. Due to the flat natural slopes in some of the urban growth areas, the waterways will become quite deep, enhancing the need for vegetation buffers or benching (though further benching will have impacts on corridor widths).
15 Next steps and recommendations
Once this plan is implemented, the concept designs should be refined into detailed designs by an appropriate consultant/s. Refinement should include:
• Size and alignment of culvert road crossings.
• Size of WLRBs.
• Pumping requirements.
• Size of the major waterways.
• Size of the minor waterways.
• Size of all outlet pipes.
• Stakeholder consultation.
Mulwala System 1 (M2, M4, M9 and M10)
Ongoing discussions have been had with Council through the development of these concept designs, particularly regarding the chain of ponds and pumping arrangement at Mulwala System 1. The System is very limited with regard to discharge opportunities considering the distance between the most upstream growth area and the limited natural topographic relief. As aforementioned, the designed System relies on pumping to Lake Mulwala to discharge flows.
The critical event from the flood modelling for the 1% AEP event results in a flow of 3.25 m3/s and total volume of 3.05 ML. Some of this will be discharged under gravity conditions by the outlet pipe, and some will require pumping to Lake Mulwala. Under this hydraulic flow condition, a pump at a rate of 30 L/s will take approximately 28 hours to clear the water within the channel.
Due to the limitations associated with the concept design flood modelling (i.e., earthworks modelling has not been undertaken to grade the surrounding areas to the chain of ponds) a portion of the overland flows are being detained in a natural depression to the northwest of M2, near Tocumwal and Savernake Road. This is resulting in a significantly smaller flow to the chain of ponds outlet when compared to the flows resulting from the hydrological modelling.
Further comparisons between hydrologic and hydraulic modelling flow rates for other events are provided below:
• 1pc - 3.4 m3/s through channel (hydraulics) compared to 11 m3/s (hydrology).
• 2pc - 2.5 m3/s through the channel (hydraulics) compared to 6 m3/s (hydrology).
• 20pc - 0.6 m3/s through the channel (hydraulics) compared to 3.5 m3/s (hydrology).
As discussed within Section 9.6, the hydraulic and hydrologic modelling approaches should be considered as complementary, with additional modelling undertaken when the design of the System is more progressed to confirm the pumping requirements.
Though there is significant volumetric storage provided within the chain of ponds (approximately 127ML of storage) and the concept design results in reductions in flood levels across growth areas M2, M4, M9 and M10, the growth areas are still affected by flooding during the 20%, 10%, 5%, 2% and 1% AEP events. If adopting the current concept design, Council may want to consider restricting development on flood affected land within M2 and M4, which would aid in reducing pumping sizes and requirements by allowing retention of flood storage areas
Council cannot currently impose finished floor level limitations based on the 2024 study, therefore re-zoning the flood prone land in M9 and M10 will be considered, and residential development only progress in M2 in the near term.
Council has noted that in the future, Mulwala System 1 should ideally be reconfigured to only service the M2 growth area, and the chain of ponds system be constructed to terminate at the southern side of the Tocumwal/ Savernake Road intersection Design modifications associated with this could include shortening, realignment
and raising of the invert by a minimum of 500mm. These modifications may enable the chain of ponds to discharge freely to Lake Mulwala, without the need for significant pumping.
Any further extension of System 1 would only be in the long term if development of M10 and M9 ever went ahead. It is Council’s objective that runoff from north of the Tocumwal Road, including any overflows from Riverland Gardens Estate, can discharge to System 1 at the Tocumwal/ Savernake Road intersection
Areas subject to development
There are several growth areas across the townships that are either subject to active development applications or currently being developed. The known areas are shown in Figure 47 and Figure 48
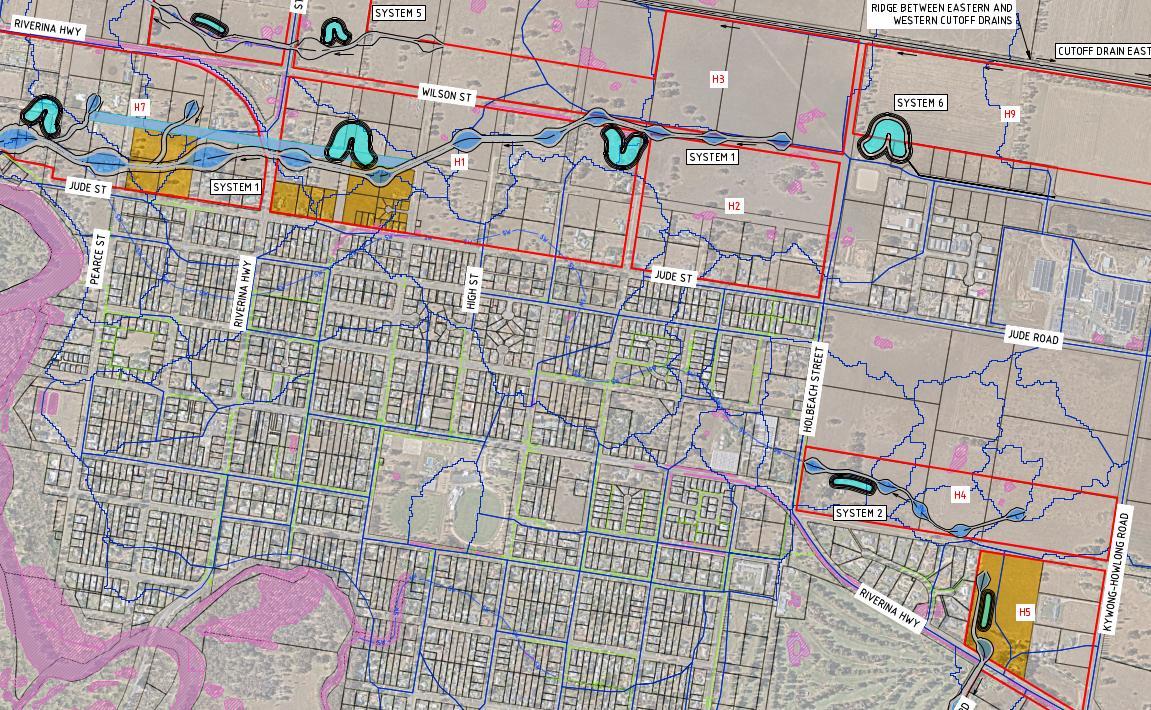
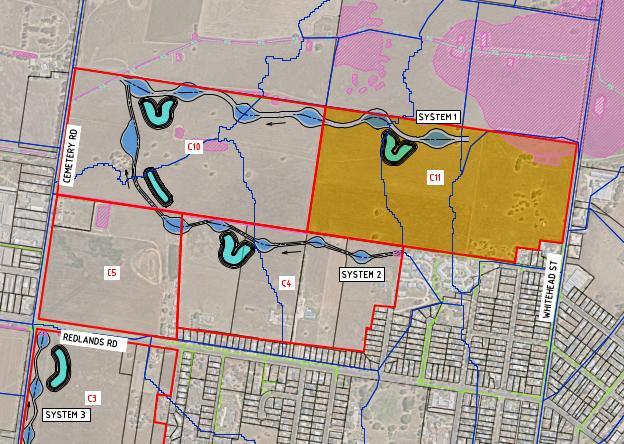
Figure 47 Areas subject to development (hatched yellow) - Howlong
Figure 48 Areas subject to development (hatched yellow) - Corowa
These areas will need to be considered during any subsequent detailed design of the stormwater servicing to ensure that constraints (and potential opportunities) are appropriately incorporated and the systems function as intended
References
ACC & OEH (2017). Sloane’s froglet stormwater wetland design guidelines. Report prepared by Spiire for Albury City Council and the NSW Office of Environment and Heritage, Albury.
Agriculture Victoria. (2020). Goulburn Broken Region – Geology and Geomorphology Available at: https://vro.agriculture.vic.gov.au/dpi/vro/gbbregn.nsf/pages/soil_survey_geology
AIATSIS. (1996). Map of Indigenous Australia. Available to view at: https://aiatsis.gov.au/explore/mapindigenous-australia
Albury City Council. (2024). Sloane’s Froglet Albury City Council, Albury, Australia. Available at: https://www.alburycity.nsw.gov.au/services/pets-and-animals/local-wildlife/amphibians/sloanes-froglet
Alluvium. (2019). Surface/ Storm water management strategy: 1960 & 2040 Mickleham Road, Mickleham, Lindum Vale – Precinct 1.
Alluvium (2020). Shepparton South East Precinct Structure Plan – Stormwater Design.
Alluvium (2024). Federation Council Stormwater Servicing Plans – Objectives and Approach Report.
Alluvium (2025). Federation Council Stormwater Servicing Plans – Options Development and Assessment.
Alluvium & Mosaic (2024) Sponge Typologies and Opportunities – Final Report.
ANZG (2018). Australian and New Zealand Guidelines for Fresh and Marine Water Quality. Australian and New Zealand Governments and Australian state and territory governments, Canberra ACT, Australia. Available at www.waterquality.gov.au/anz-guidelines
B.M Civil Engineers (2006). Site Assessment Viscounts Gardens Estate Mulwala
BMT (2015). NSW MUSIC Modelling Guidelines. BMT WBM, prepared for Greater Sydney Local Land Services. Available at: https://www.cityofparramatta.nsw.gov.au/sites/council/files/2021-04/nsw-music-modellingguidelines-august-2015.pdf
Corowa Shire. (2013) Development Control Plan. Available at Development_Control_Plan3.pdf
Cutajar, Timothy P., Christopher D. Portway, Grace L. Gillard, and Jodi J. L. Rowley. (2022). Australian Frog Atlas: species’ distribution maps informed by the FrogID dataset. Technical Reports of the Australian Museum, Online 36: 1–48. https://doi.org/10.3853/j.1835-4211.36.2022.1789. Available at: https://media.australian.museum/media/dd/documents/1789_complete.da22971.pdf
DCEEW (2018). State Government of NSW and NSW Department of Climate Change, Energy, the Environment and Water 2018, Biodiversity Values Map, accessed from The Sharing and Enabling Environmental Data Portal [https://datasets.seed.nsw.gov.au/dataset/4d840c5f-fd68-4d6f-ae07-b75e1b79aa57], date accessed 2024-1030
Deadly Story. (n.d.) Bangerang People. Available at: https://deadlystory.com/page/aboriginal-countrymap/Aboriginal_Country_Completed/Bangerang/Bangerang_People
Department of Local Government. (2006). Stormwater Management Service Charge Guidelines. Available at: Department of Local Government - Circular to Councils 06/47 - Stormwater Management Services Charge Guidelines
Department of Planning, Industry and Environment. (2021). Sloane’s froglet. Target: manage and monitor all critical threats to Sloane’s froglet. Available at: Saving our Species projects 2016-21: Sloane’s froglet (Crinia sloanei)
Dugdale, T & Clements, D. (2015). Management of Egeria in Lake Mulwala Key Lessons. Available at: (PDF) Management of Egeria in Lake Mulwala Key lessons
Federation Council. (2021). Sewage Disposal Servicing Strategy – September 2021.
Federation Council. (2021). Water Supply Servicing Strategy – September 2021.
Federation Council. (2023). Sophia Close & Pinot Crescent, Corowa – Stormwater Drainage Investigation Preliminary Report.
Federation Council. (2024). Special Rate Variation Project 24-25 Website at: Special Rate Variation Project 2425 - Federation Council
Geotechdata.info, Soil void ratio, http://geotechdata.info/parameter/permeability.html (as of October 7, 2013).
Development Outcomes (2020). Riverland Gardens Works as Executed drawings.
Federation Council. (2024) Sewage Disposal Servicing Strategy – September 2021
Federation Council. (2024) Water Supply Servicing Strategy – September 2021
Federation Council. (2018). Engineering Guidelines for Subdivisions and Development Standards – Part 3 Stormwater Drainage Design. Available at Engineering Development Standards - Federation Council
GHD. (2008). Corowa Shire Council – Report for Howlong Drainage Strategy – Drainage Report.
Goulbourn Murray Water (2008). Lake Mulwala Land and On-Water Management Plan. Available at: TATDOC_2612374_v1_LAKE_MULWALA_LAND_AND_ON_WATER_MANAGEMENT_PLAN_2008_ADDENDUM.PD F
IPCC 2021, Figure based on Figure SPM.8 from the Summary for Policymakers (SPM) of the Working Group I (WGI) Contribution to the Intergovernmental Panel on Climate Change (IPCC) Sixth Assessment Report (AR6)
Knight, Alexandra (2014). Sloane’s Froglet interim habitat guide and management recommendation. Office of Environment and Heritage, Sydney. Available at: Office of Enviroment & Herritage A5 Booklet - A4
Melbourne Water (2005). Constructed Shallow Lake Systems – Design Guidelines for Developers, Version 2, November 2005. Available at: https://www.google.com/url?sa=t&rct=j&q=&esrc=s&source=web&cd=&ved=2ahUKEwjb3aenpomOAxVTb_UH HdgtHXUQFnoECBcQAQ&url=https%3A%2F%2Fwww.melbournewater.com.au%2Fmedia%2F607%2Fdownload &usg=AOvVaw3BmgSIV_tbwLZISNipz1cc&opi=89978449
Melbourne Water (2019). Constructed Waterway Design Manual. Available at: Constructed waterway design manual | Melbourne Water
MDBA (2012). Murray-Darling Basin Plan. Murray Darling Basin Authority Canberra, Australia. Available at: https://www.mdba.gov.au/water-management/basin-plan
Narrandera Shire Council. (n.d.) Wiradjuri Country. Available at: https://www.narrandera.nsw.gov.au/community/our-people/wiradjuri-people
NSW Government (2023). Flood Risk Management Manual. Available at Flood Risk Management Manual | NSW Environment and Heritage
Product catalogue - Geoscience Australia
R.H.P.M P.T.Y. L.T.D (2015). Riverland Gardens Estate stage 1B Tocumwal Road, Mulwala, As-Constructed drawings.
Stephen Oxley (2006). Viscount Gardens Drainage Report Sedimentation and Infiltration Basin Design.
State Government of NSW and Department of Primary Industries and Regional Development (DPIRD) (2025) NSW 1500K Simplified Surface Geology, Available at: https://datasets.seed.nsw.gov.au/dataset/8e2820f4-e54e4683-90bd-d494b899f28d
State of NSW and Department of Planning, Industry and Environment. (2025) Hydrogeological landscapes layer. Available at: espade.environment.nsw.gov.au
State of NSW and Department of Planning, Industry and Environment. (2025) Soil profile layer. Available at: espade.environment.nsw.gov.au
State of NSW and Department of Planning, Industry and Environment. (2025) Statewide land and soil mapping layer. Available at: espade.environment.nsw.gov.au
State of NSW and Department of Planning, Industry and Environment. (2025) Surface geology layer. Available at: espade.environment.nsw.gov.au
Townsville City Council (2011). Water Sensitive Urban Design for the Coastal Dry Tropics (Townsville) – Technical Design Guidelines for Stormwater Management. Available at: GUIDELINES_Complete.pdf
Urana Shire Council. (2011) Urana Shire Development Control Plan 2011.
Water NSW. (2025) Groundwater Site Details – GW503110. Available at: https://realtimedata.waternsw.com.au/water.stm?ppbm=GW503110&ag&0&agpf_org
Water NSW. (2025) Groundwater Site Details – GW048907. Available at: https://realtimedata.waternsw.com.au/water.stm?ppbm=GW048907&ag&0&agpf_org
Water NSW. (2025) Groundwater Site Details – GW061483. Available at: https://realtimedata.waternsw.com.au/water.stm?ppbm=GW061483&ag&0&agpf_org
Water Sensitive SA. (2025). Water sensitive urban design (WSUD) assets – Inspection maintenance guidelines, Constructed Wetlands Available at: Inspection-and-Maintenance-Guideline-Constructed-wetlands-V1_0_FINAL-for-WEBSITE-28June2025.pdf
WMA Water (2022). Federation Villages Floodplain Risk Management Study and Plan. Available at: https://www.federationcouncil.nsw.gov.au/Building-Planning/Zoning-Policies/Flood-Study-Reports/FederationVillages
WMA Water (2024) Corowa, Howlong and Mulwala Flood Study
Appendix A – Concept Design Drawings
Appendix B – Assessment of Probable Costs
Appendix
Appendix D – Hydrologic Modelling Schematics and Results
The conceptualised diagrams of the WBNM hydrologic models for the centralised basin and chain of ponds options for each township are provided in Figure D 1 to Figure D 4
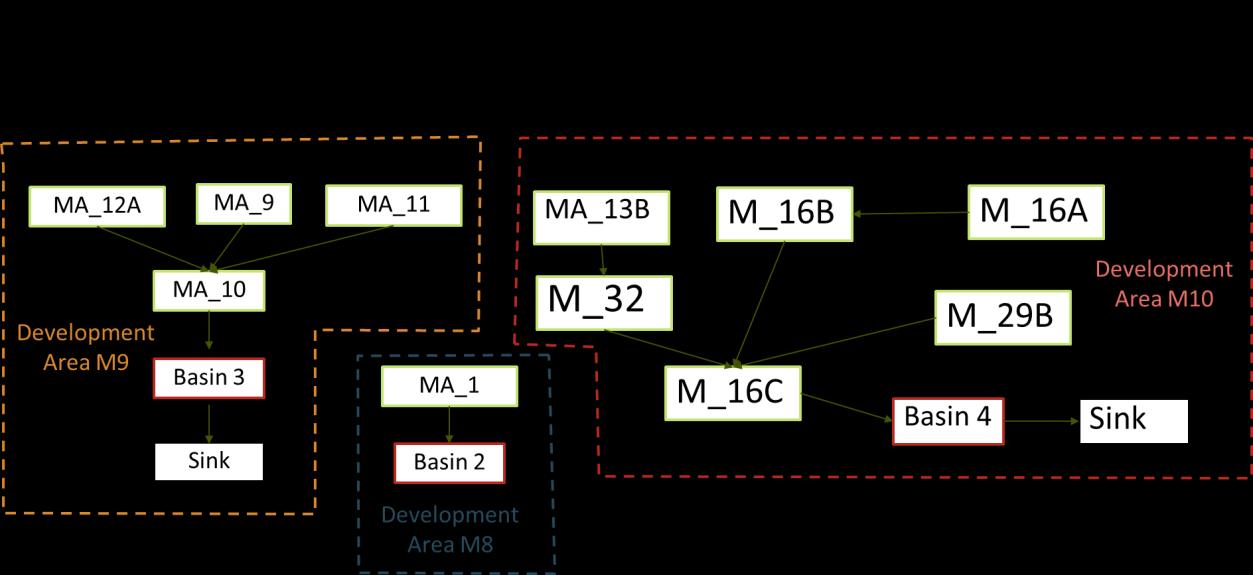
Figure D 1 Conceptualised diagram of the WBNM hydrological modelling of the centralised basin option for the base case basins in Mulwala
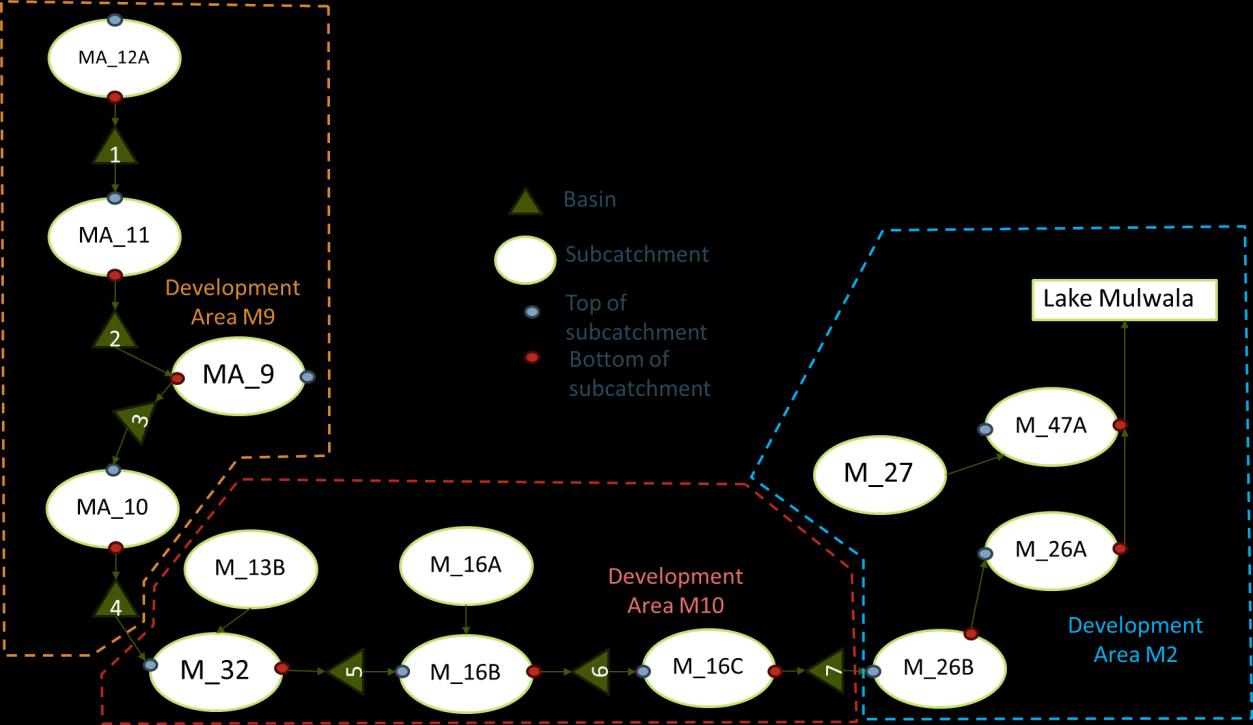
Figure D 2 Conceptualised diagram of the WBNM hydrological modelling of the chain of ponds option for the base case basins in Mulwala
Appendix E – Urana and Oaklands Stormwater Improvement Options
Appendix E.1 – Urana & Oaklands Concept Design
Appendix
E.2 – Urana & Oaklands Assessment of Probable Costs
Appendix F – Sophia Pinot Hydraulic Assessment
Appendix G – Riverland Gardens Estate Stormwater Infrastructure Review
The Riverland Gardens Estate (M3) is an urban growth area within Mulwala in which development has been progressing for some years. The drainage strategy for M3 was to predominately collect stormwater via a system of grassed swales, which discharge to a central infiltration basin, now bounded by Adam Close, Acacia Drive, Grevillea Terrace, and Corella Crescent (Stephen Oxley, 2006). The infiltration basin was located within a natural depression. The suitability of the site for infiltration (i.e., permeability) was assessed via somewhat limited geotechnical investigations.
The basin was designed to fully detain and infiltrate the 1% AEP runoff (Stephen Oxley, 2006), however issues with the performance of the infiltration basin have been noted by Council. Most notably, during the spring of 2022, the main infiltration basin filled and backwatered into the incoming drains, overflowing out onto Savernake Road at Acacia Drive Council have noted that the basin is taking longer to infiltrate stored water than expected, particularly after large runoff events.
Ongoing maintenance at the infiltration basin is likely to be required to remove any accumulated silt/clay surface deposits. A sediment basin is present on site upstream of the infiltration basin (Figure G 1) though it has been planted out and is therefore unable to be easily maintained and desilted. Additionally, as recently as 2023, an additional area adjacent to the ‘sediment basin’ was excavated and not stabilised with vegetation or any other material. The intended use of this zone is unknown however it is assumed that it is to provide additional bare earth and/ or additional storage area to aid infiltration and storage capacity.
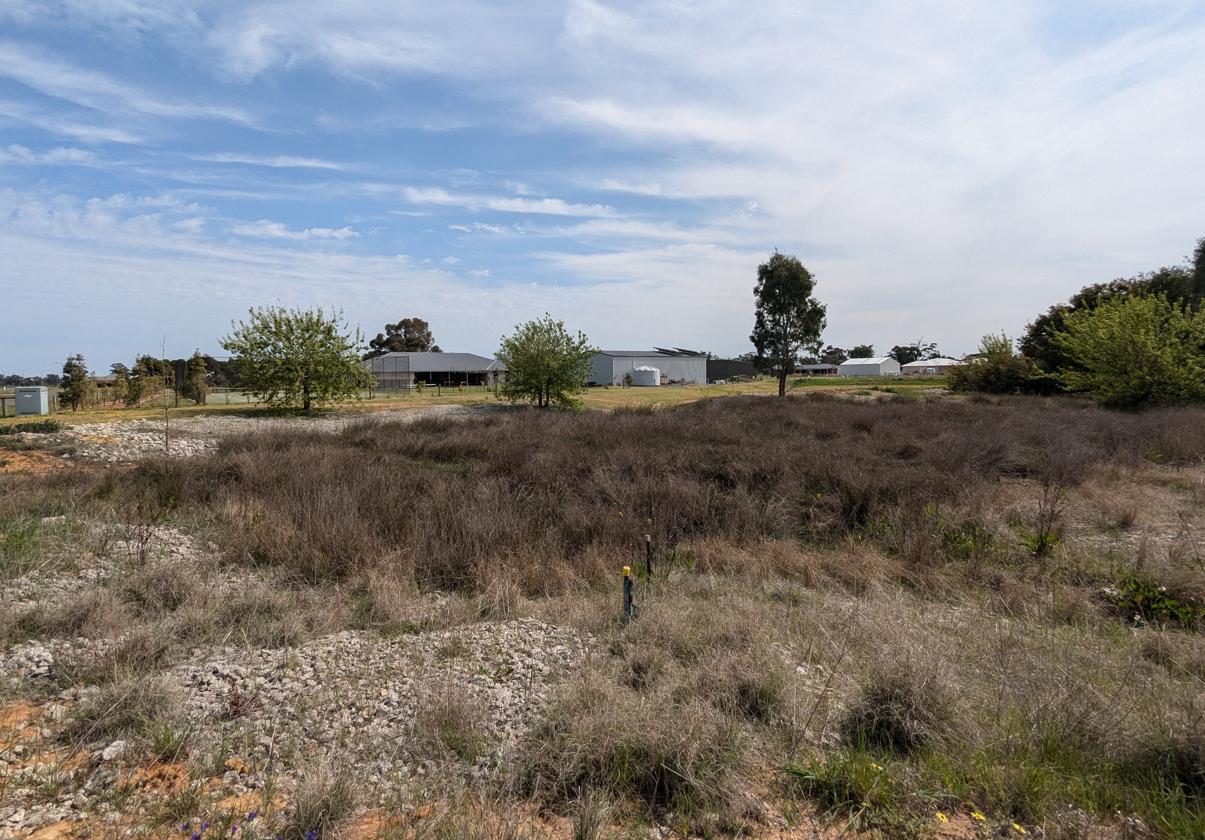
In 2020, an additional basin at the corner of Acacia Drive and Savernake Road was constructed (see Figure G 1) not intended as an infiltration basin but to provide additional storage via a balance pipe to the infiltration basin. However, the additional storage basin has a portion of ‘dead’, i.e. unusable storage. There are no pumping facilities available to pump from this secondary basin to the main infiltration basin, as Council did not think it was required
Figure G 1. ‘Sedimentation basin’ upstream of the infiltration basin (Alluvium, 2024)
Appendix H – Hydraulic Modelling Results
Appendix I – Comments Register