SUBJECT: President’s Budget 2027 Modernized Selected Acquisition Report Submissions for Major Defense Acquisition Programs and Major Subprograms
In collaboration with your respective staffs, my officedevelopedthe attached “President’s Budget 2027 Modernized Selected Acquisition Report Preparation and Review Guidance” for the annual modernized selected acquisition report (MSAR) data collection process.
In accordance with the “Implementation Plan for the Department of Defense’s Modernized Selected Acquisition Report Process,” and Section 809 of the National Defense Authorization Act for Fiscal Year 2023, Component Acquisition Executives are to submit MSAR data for all current major defense acquisition programs (MDAPs) and major subprograms within 60 days after the President’s Budget is submitted to Congress.
The “Implementation Plan for the Department of Defense’s Modernized Selected Acquisition Report Process” includes data requirements not supported by the Defense Acquisition Visibility Environment (DAVE). Therefore, a portion of theMSARdata will be collected in DAVEand a separate portion will be collectedusing a Supplemental Data Collection Workbook. For each MDAPand major subprogram, the data collected from DAVE will be combined with the data collected from theSupplemental Data Collection Workbook to produce a final MSAR. This MSAR will betransmitted toCongress viathe Advanced AnalyticsAcquisition Congress stream as the Department’s official MSAR submissionand a copy will be posted to a publicly accessible Washington Headquarters Services Freedom of Information Act website.
Mypoint of contact for policy related question is questions is Mr. Joseph Beauregard (joseph.e.beauregard.civ@mail.mil). Contact the DAVE Service Desk for technical assistance (osd.DAVE@mail.mil), and for technical assistance using the MSAR Supplement Workbook, contact osd.sardata@mail.mil.
Thank you for your continued support to this important data collection effort.
James A. Ruocco Performing the
Duties
of AssistantSecretary of War for Acquisition
Attachment: PB 2027 MSAR Preparation and Review Guidance
November 2025
Revision History
Revision Date Description
1.0 1/11/2022 Selected Acquisition Report Data Guidance
2.0 12/12/2022 Major Capability Acquisition Data Guidance
3.0 11/17/2023 Modernized Selected Acquisition Report Preparation and Review Guidance
Text in blue font indicates new guidance for this year or guidance that data providers sometimes misunderstand or overlook.
1.1. OVERVIEW
The purpose of this document is to provide Office of the Assistant Secretary of War for Acquisition (OASW(A)) guidance for completing Fiscal Year (FY) 2027 President’s Budget (PB) Modernized Selected Acquisition Reports (MSARs) for major defense acquisition programs (MDAPs) and major subprograms utilizing the Major Capability Acquisition (MCA) pathway.
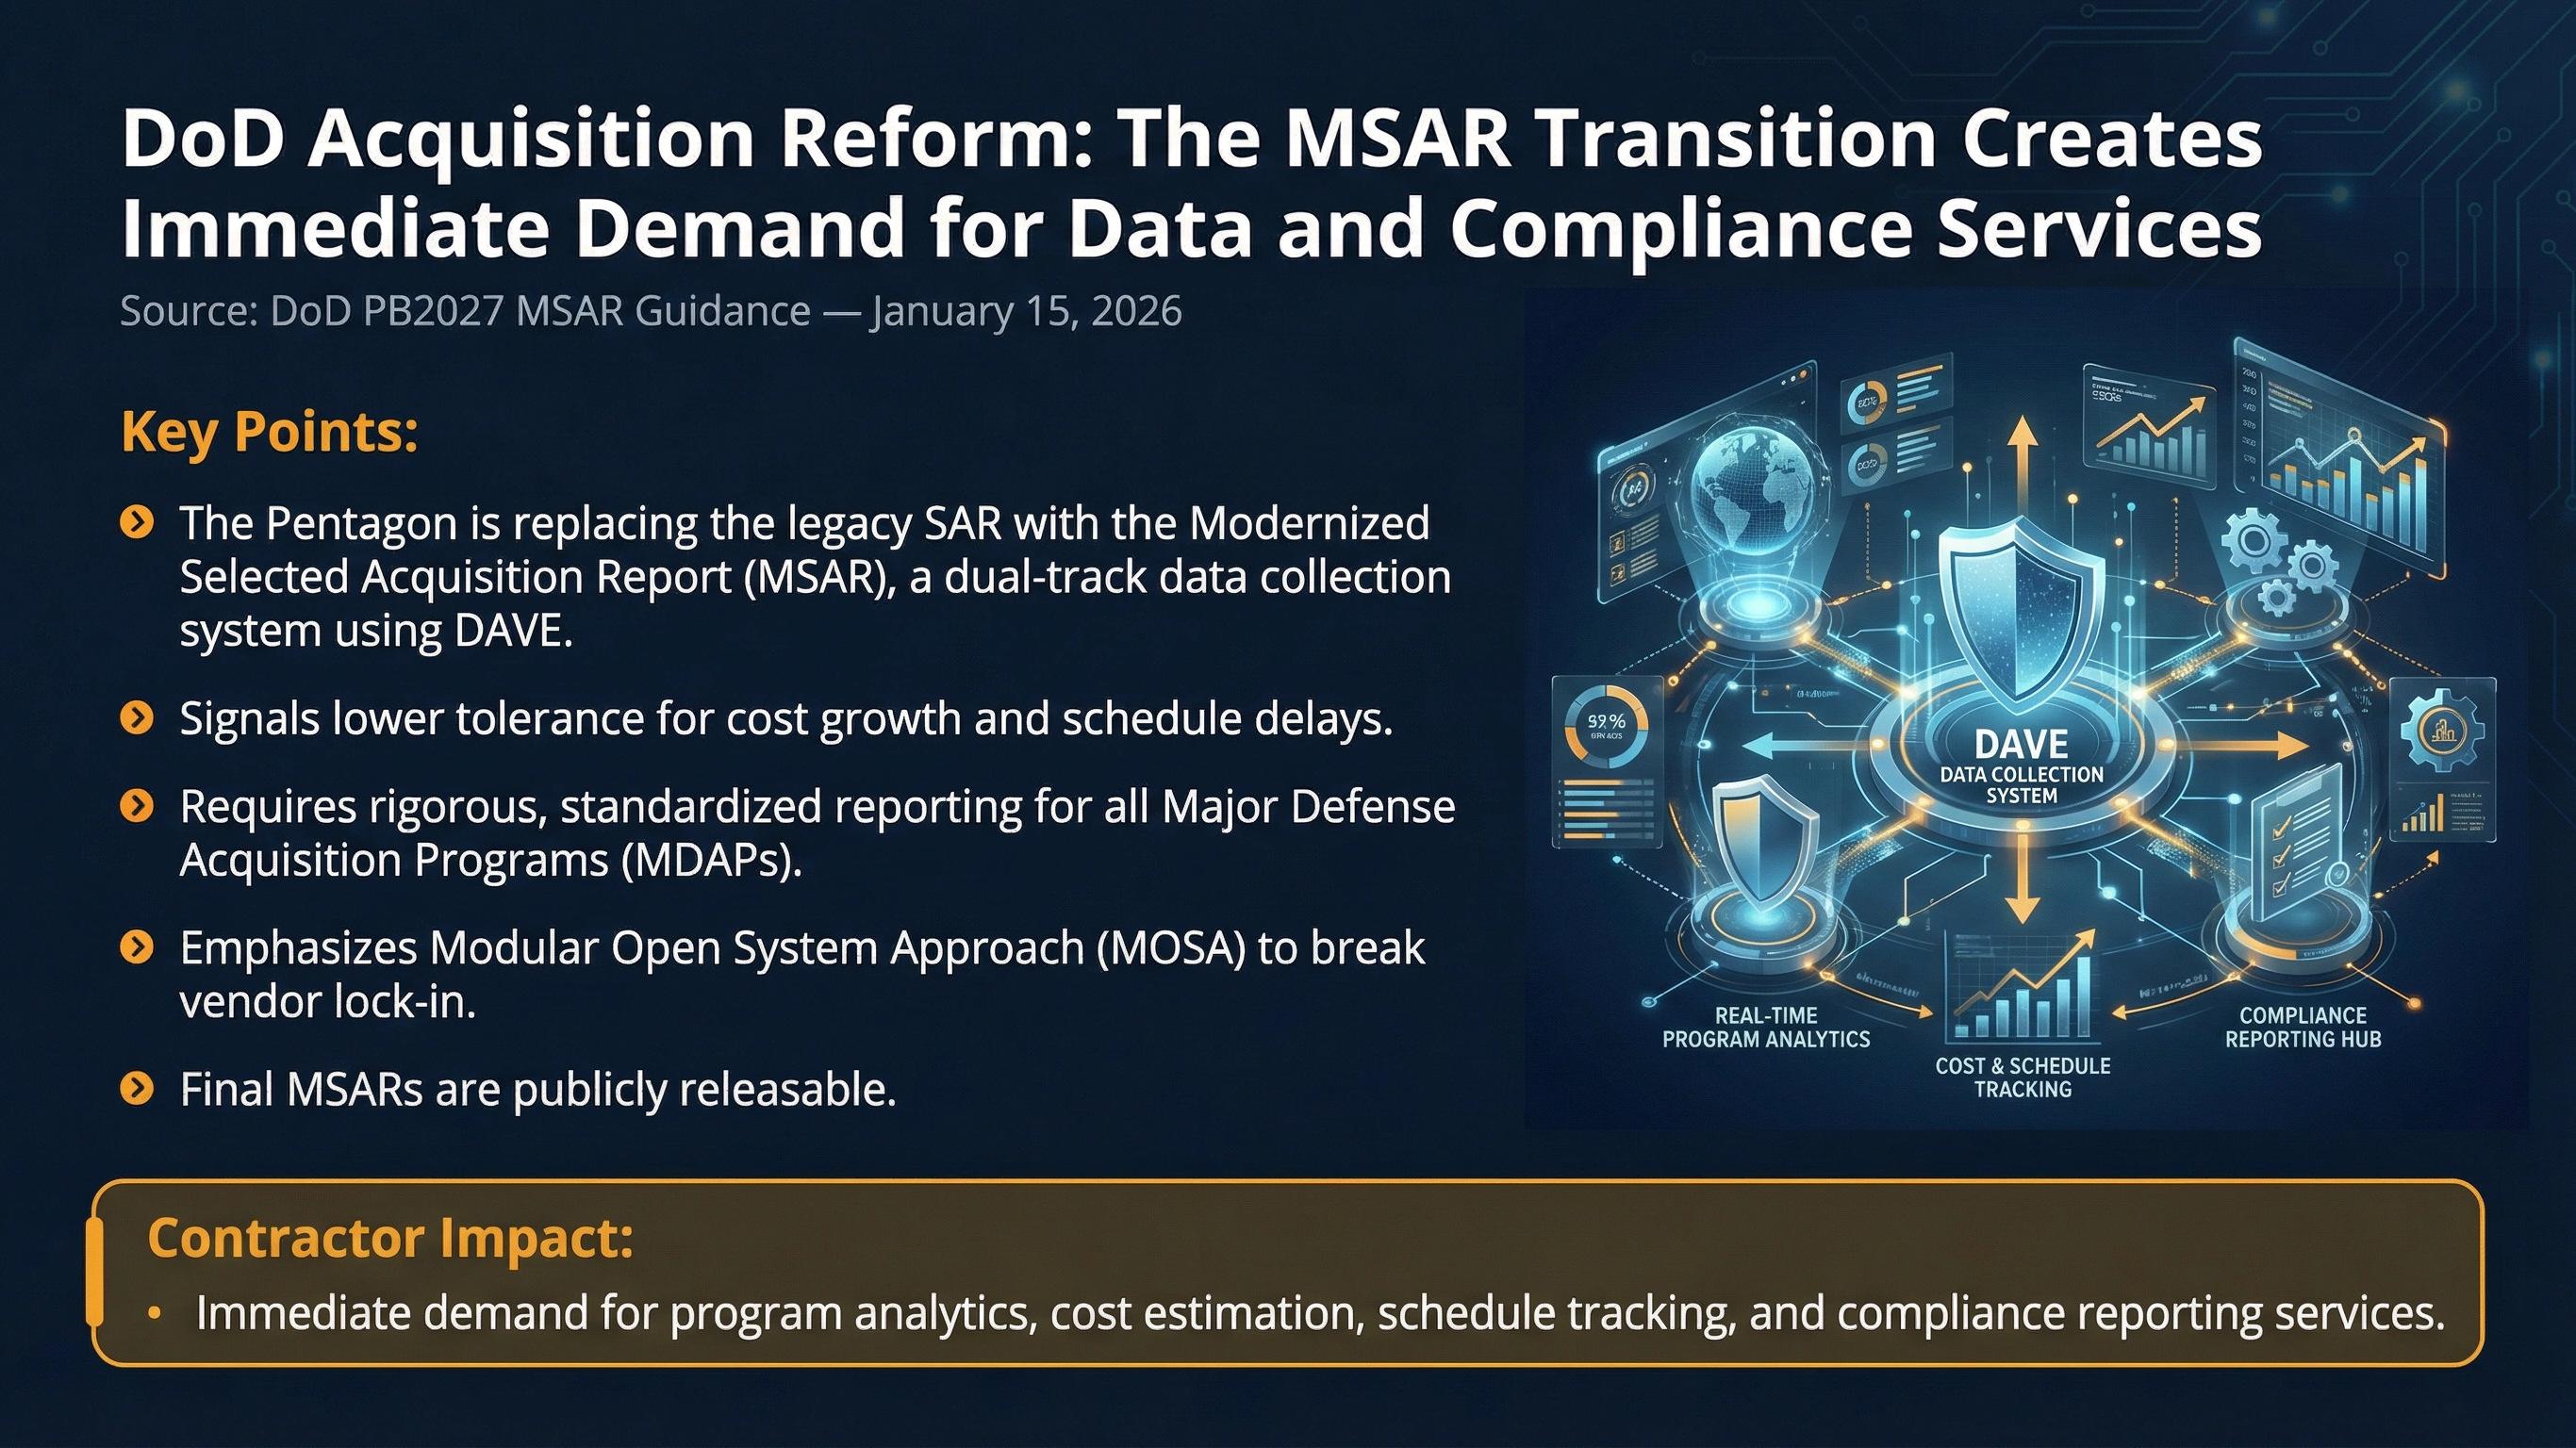
Section 805(c)(2) of the National Defense Authorization Act (NDAA) for FY 2022 (Public Law 117-81) directed the Under Secretary of Defense for Acquisition and Sustainment (USD(A&S)) to submit the Department of Defense (DoD) plan to effectively share acquisition data using a new reporting system for covered programs that were previously required to submit selected acquisition reports (SARs) under section 2432 (now renumbered as section 4351) of title 10, United States Code (U.S.C.). Section 809 of the FY 2023 NDAA provided additional direction that the new reporting system would replace the requirements of the SAR statute (10 U.S.C. § 4351). The requirements in 10 U.S.C. § 4351 terminated after the final SAR submission covering FY 2023. The USD(A&S) developed an Implementation Plan for the Department of Defense’s Modernized Selected Acquisition Report Process, or “MSAR Implementation Plan,” dated June 2023, in coordination with the Director of Cost Assessment and Program Evaluation (CAPE) and the Chief Digital and Artificial Intelligence Office (CDAO), that fulfilled the requirements in Section 805 of the NDAA for FY 2022. The term “Modernized Selected Acquisition Report,” or “MSAR,” refers to the acquisition reporting system that replaced historical SARs.
The MSAR Implementation Plan included data requirements not yet supported by the Defense Acquisition Visibility Environment (DAVE) Program Registration and Program Progress Submission (PPS) capabilities. Therefore, a portion of the MSAR is created and published in DAVE (whose data guidance is in Section 2) and a portion is created and published using a MSAR supplemental data collection workbook (hereafter, “the workbook”) whose data guidance is in Section 3.
The MSAR data published in DAVE and the workbook are transmitted to Advanced Analytics (Advana) for visualizations in the Acquisition Congress Stream (accessible to DoD Advana users) and the DoD's Secure Unclassified Network (SUNet) environment, which is accessible to congressional members and staff. The MSARs are also published in Portable Document Format (PDF) and posted in the publicly accessible Washington Headquarters Services (WHS) Freedom of Information Act reading room website.
Appendix A lists Common DoD Abbreviations that may be used within the MSAR; all other abbreviations must be defined.
Appendix B provides instructions for redacting CUI data from the MSAR.
b. DAVE Program Registration and Program Progress Submission https://dave.acq.osd.mil/help/Program_Registraion_HELP, https://dave.acq.osd.mil/help/Program_Progress_HELP or osd.dave@mail.mil
c. MSAR Supplemental Data Collection Workbook https://dave.acq.osd.mil/help/Selected_Acquisition_Report_HELP or osd.dave@mail.mil
1.2. APPLICABILITY
a. Annual MSAR: Component Acquisition Executives (CAEs) will submit MSARs for all MDAPs and major subprograms that—as of the end of the first quarter of the fiscal year (December 31)—
(1) have entered the engineering and manufacturing development or production and deployment phase,
(2) have reasonable cost estimates established by their milestone decision authorities (MDAs) in acquisition program baselines (APBs),
(3) have not yet delivered 90 percent of their end-items defined in their APB, and
(4) have not yet made 90 percent of planned expenditures of their estimated acquisition costs.
CAEs will also submit MSARs for any other programs if specifically directed by the USW(A&S) or Congress.
b. Exception MSAR: When, during the second, third, or fourth fiscal quarter, a Service Secretary determines that the program acquisition unit cost (PAUC) or the average procurement unit cost (APUC) for an MDAP or major subprogram has increased by a percentage equal to or greater than the significant or critical cost growth threshold,1 and notifies Congress in writing, the CAE will submit an Exception MSAR for that MDAP or major subprogram (the “congressional notification”). If the congressional notification
1 10 U.S.C. § 4371, 10 U.S.C. § 4375
Section 1 2
occurs during the second fiscal quarter but before the PB submission, the cost growth details will be included in the MSAR and a separate Exception MSAR is not required.2
1.3. TIMING AND PROCESS
a. The effective date for an Annual MSAR will be the date of the PB submission, and the effective date for an Exception MSAR will be the congressional notification date. Data in an Annual or Exception MSAR will be current as of the effective date.
b. The publication target for Annual MSARs is sixty days after the date on which the President transmits the budget for the following fiscal year to Congress. The publication target for Exception MSARs is sixty days after the congressional notification.
c. The Annual MSAR process must adapt to uncertain timing of the PB submission. By law, the PB will be submitted on or before the first Monday in February; however, in recent years, the PB has been submitted as late as the fourth week of May. The following timeline assumes an on-time PB submission and will be updated if the PB submission is delayed.
(1) OASW(A) staff will distribute the workbook in November, but these draft workbooks will not yet have the FY 2027 inflation indices.
(2) Once the OUSW(Comptroller) "locks" the DoW budget and the Future Years Defense Program (FYDP), and the Naval Cost Division and Air Force Directorate of Economics and Business Management release inflation indices for all Department of the Army, Department of the Navy, Department of the Air Force, and Defense-Wide accounts, OASW(A) staff will update and distribute a final workbook (typically in mid-February).
(3) CAE reporting leads will assign reporting programs evenly to Groups 1, 2, and 3 and notify OASW(A) staff by 16 January 2026.
(4) The Deputy Assistant Secretary of War (DASW) for Strategic, Space, and Intelligence Portfolio Management (SSIPM) and the DASW for Platform and Weapon Portfolio Management (PWPM) review of draft MSARs will begin eight (8) days after the PB submission and will be completed 28 days after the PB submission. The ODASW(SSIPM) and ODASW(PWPM) must approve MSARs assigned to them before they are be finalized and submitted. Component-level reviews that have not been completed may continue during this time, but CAE staff should notify OASW(A) staff of any significant MSAR changes that result from component reviews.
(5) Ideally, the draft MSARs should include the program’s final, inflation-adjusted budgets and estimates, but preliminary budgets and estimates are acceptable since these are not the focus of the DASW(SSIPM) or DASW(PWPM) reviews.
(6) CAE staff will ensure each program's final DAVE PPS and worksheet include the final PB position and ensure estimates in Constant Year dollars are based on the new inflation indices.
(7) CAE staff and OASW(A) staff will agree on when to finalize the draft MSAR submissions in DAVE to avoid rework.
(8) OASW(A) staff will ensure MSAR data is available in the Advana Acquisition Congress Stream for Component final reviews and CAE Reporting Lead approval before CDAO transfers data to SUNet.
1.4. CLASSIFICATION AND CONGRESSIONAL PREPUBLICATION REVIEW
a. Each final MSAR will be a publicly releasable, unclassified report with no dissemination controls or controlled unclassified information.
(1) Current estimates and other information provided in the DAVE PPS may not contain CUI or classified information. Use the indicator at the top of each PPS data section to specify whether classified data exists and is reported in a Secret Internet Protocol Router Network (SIPRNet) MSAR annex (only if a classified annex has been specifically directed for that program).
(2) The Non-classified Internet Protocol Router Network (NIPRNet) DAVE PPS may reference CUI APB data; however—
(a) OASW(A) staff will ensure any CUI data from the DAVE PPS is redacted in Advana before it is displayed in the Acquisition Congress Stream and transmitted to SUNet.
(b) CAE staff or OASW(A) staff will manually redact all CUI from the exported PDF report before distribution to WHS. See Appendix B for instructions.
b. MSAR Supplemental Workbook:
(1) The workbook data file is marked CUI because it contains hidden sheets with CUI data.
(2) MSAR data entered in the workbook and viewable in the published PDF may not contain CUI or classified information. The PDF created from the workbook data will be marked UNCLASSIFIED.
(3) The top of each section of the workbook includes a checkbox the data provider should use to indicate that some data in the section cannot be reported because it is not Unclassified. There will be no classified annexes for the workbook.
c. OASW(A) staff will submit DD Form 1790, "Congressional Review," and DD Form 1910, “Clearance Request for Public Release of Department of Defense Information,” to the WHS Chief Defense Office of Prepublication and Security Review for all MSARs.
d. Classified MSAR information is not required and will only be submitted to OUSW(A&S) through appropriate channels if specifically requested.
1.5. GENERAL GUIDANCE
a. All acronyms and other abbreviations should be spelled out the first time they appear in each section unless they are included in the Common DoD Abbreviations list with the
submission (see Appendix A). The program’s official short name may be used in all data sections (the full name does not need to be used).
b. Actual dates in narratives should be formatted Month Day, Year (December 20, 2019). Stand-alone fiscal year references should be represented as FY YYYY (FY 2020), constant year references should be represented as CY YYYY (CY 2020). Avoid using “CY” for calendar year since it can be confused with constant year.
c. OSW CAPE has recommended the term “Base Year dollars” (BY$) not be used as a valid dollar type because it can be taken to mean Constant Year dollars (CY$) or Constant Price (CP$). However, CAPE considers that the term “Base Year” is still a valid reference to the year in which a cost estimate is approved for a Development or Production APB.
(1) While the DAVE user interface still uses BY$ labels, program offices should ensure CY$ estimates are provided in both DAVE and the workbook, and ensure the workbook correctly identifies the source for Then-Year dollars (TY$) to CY$ conversions (see Sections 3.10 and 3.13).
(2) The PDFs generated from DAVE and the workbook will display CY$ labels, and in the future the DAVE user interface will be updated as well.
SECTION 2: DAVE MSAR DATA GUIDANCE
2.1. PROGRAM DESCRIPTION AND RESPONSIBLE OFFICE
Prior to initiating a DAVE Program Progress Submission (PPS) for the MSAR, review all program and subprogram registration data (also called Program Attributes) in DAVE for accuracy and completeness. This includes identification of related programs.
If program registration updates are made while the draft PPS is in progress, be sure to reload the program data from the PPS Review and Submit page. Refer to the DAVE Program Attributes User Guide for instructions to make updates: https://dave.acq.osd.mil/help/Program_Registraion_HELP.
This following program data will be displayed or used within the MSAR:
a. Full Name, Short Name, PNO
b. Lead Component, Milestone Decision Authority, Program Executive Office
c. Joint Program Indicator, Supporting Component(s), Federal Partners
d. International Partner(s): must be identified in Program Attributes in order to report Foreign Military Sales cases and International Agreements in the International Program Aspects section.
e. Adaptive Acquisition Pathway, Acquisition Type, Acquisition Category
f. Acquired System(s): the official designation (e.g., Type/Model/Series, Mission Design Series) of the system and system variants the program will acquire or modify, and which may have significantly different characteristics and planned usage. These must be identified in Program Attributes in order to report MSAR Operating and Support (O&S) cost estimates, Annual Acquisition Quantities and Operational Fielding Plans.
g. Antecedent System(s): the official designation of the system(s) each acquired system is replacing. Not displayed in the MSAR Program Description section but must be identified in Program Attributes to report unitized O&S cost comparisons with Acquired Systems.
h. Acquisition Status
i. Mission & Description
j. Program Executive Officer: full name, email address and phone number
k. Program Manager: full name, email address and phone number
l. Related Programs. Identify the MDAP’s or major subprogram’s related programs:
(1) Definition: One program linked to another program because together they contribute to an overarching capability. Two or more programs can be related via incremental or evolutionary acquisition, by transitions among Adaptive Acquisition Framework (AAF) pathways, or because a capability acquired by one program is embedded in a system acquired by another program.
(2) Examples:
(a) Capability developed under an MTA program transitions into an MCA program.
(b) Software acquired in the Software Acquisition Pathway that will be embedded in an MDAP's acquired system.
(c) MTA Rapid Prototyping capability transition to an MTA Rapid Fielding program.
(d) “Block” or “Increment” Programs.
(e) Former programs that have been restructured.
2.2. PPS INITIALIZATION
a. Programs with Subprograms: Select which subprogram(s) are to be included in the report.
b. Effective Date:
(1) Annual MSAR: date of the PB submission (nominally first Monday in February, but this should be updated to the date of the actual PB submission before the PPS is finalized).
(2) Exception MSAR: Date of Service Secretary’s congressional notification.
c. APB References: identify for the MDAP, or for each major subprogram, its:
(1) Current Baseline: The most recent APB approved prior to the MSAR submission.
(2) Milestone Baseline, formerly known as SAR Baseline: The APB approved at the most recent milestone (MS A (if any), MS B or MS C).
(3) Original Baseline:3 The APB approved at MS B or at Program Initiation whichever occurred later. When a program is recertified following a Critical Unit Cost Breach, a Revised Original Baseline replaces the Original Baseline for unit cost reporting.
(4) Note, sometimes the same APB can be two of these or even all three.
3 10 U.S.C. § 4214 (d)
d. Providing these baseline references ensures that current estimates for schedule, performance, cost, and unit cost are displayed in the context of the baseline data.
2.3. AAF
This data is included within the PPS Program Description section following the Mission statement. Information in the subsection is collected for the report’s MDAP (not for subprograms).
a. Program Use of the AAF
(1) Definition: A narrative that summarizes a program’s use of the AAF for the overall acquisition plan and interdependencies with related programs and pathways.
(2) This is particularly informative when a system is acquired through related programs. Provide a summary of the logical order and dependencies among the programs and if transitions have occurred or are planned. Identify the milestone or decision point at which successive programs began or will begin.
(3) This is not a history of antecedent systems.
(4) Limit the narrative to 2,500 characters or less.
(5) If there are no related programs simply state, “This acquisition is accomplished by a single program in the Major Capability Acquisition Pathway.”
b. Related Programs. To add or remove related programs, see Section 2.1. Then indicate whether related program costs are included in the MSAR.
(1) Costs in Report? (Acquisition): Identify, for each Related Program, whether the acquisition estimate of the MSAR’s primary program contains estimated or actual acquisition costs for a particular related program pursued under the same or another AAF pathway.
(2) Costs in Report? (O&S): Identify, for each Related Program, whether the O&S estimate of the MSAR’s primary program contains estimated or actual O&S costs for a particular related program pursued under the same or another AAF pathway.
(3) Reference: USD(A&S) Memo, Accounting for Program Costs When Acquisition Framework Pathways Are Used Sequentially or in Combination, 19 Jul 2022
(a) “Addressing Costs in the Acquisition Program Baseline (APB): …The cost component of the MCA APB will include the costs for the program completed under any other pathway as well as the planned MCA program. Actual costs incurred for the prior part of the program should be included to the maximum extent practicable to ensure visibility into the total cost of the capability….”
(b) “Determining Selected Acquisition Report (SAR) Content: If a program exceeds the MDAP statutory threshold the program SAR will be submitted in accordance with applicable statute, and the scope of the program reported in the MCA SAR will aggregate program activity under all pathways as documented in the APB.”
(c) It is important the costs and end item quantities in the MSAR be consistent with the scope of the baselined program, so if a related program's content was not included in the APB, then it should not be included in the MSAR either (but could be annotated in notes fields or the Program Use of the Adaptive Acquisition Framework field).
2.4. EXECUTIVE SUMMARY
Provide a Program Highlights narrative and a History of Significant Events for the program. For an MDAP with major subprograms, this information can be provided for the overall MDAP or for each subprogram at the discretion of the CAE.
a. Program Highlights Since Last Report (DoD Only): this narrative is not applicable to the MSAR and will not be displayed within the published report PDF.
b. Program Highlights Since Last Report (For Release to Congress): this is not a program history (“old news”) unless that information is necessary to explain current developments. The narrative should correspond to the data in the rest of the Program Progress data sections.
(1) If this is the initial MSAR for the program or subprogram, insert: “This is the initial MSAR submission for the [program name] MDAP” (or “for the [subprogram name] major subprogram”). The summary should typically also include a brief chronology of program activities to date.
(2) A final MSAR is not required for a program or subprogram that is beyond 90 percent complete.
(3) Exception MSAR Rationale, if applicable, e.g., “This Exception MSAR reports critical cost growth for the [program name] MDAP (or “for the [subprogram name] major subprogram”): APUC has increased 28% above the current APB.”
(4) Major milestone decisions.
(5) Major contract awards or modifications.
(6) Funding Status: Reprogramming actions, significant congressional marks and adjustments, and enacted supplemental funding.
(7) APB deviations, status of required Program Deviation Reports to the MDA and plans to resolve or mitigate the deviations.
(8) Status of Developmental Test and Evaluations or Operational Test and Evaluations, if applicable, or estimates when testing will commence.
(9) MSAR following Critical Cost Growth when program is restructured instead of terminated4: Description of funding changes made following a report of Critical Cost Growth in the program (aka “a Critical Unit Cost Breach”), including reductions made in funding for other programs to accommodate such cost growth.
(10) Modular Open System Approach: Summary description of the key elements, or rationale for not using a modular open system approach. This is not required for programs achieving Milestone B approval before January 1, 2019.
(11) Software Component Significant Changes:
(a) Significant changes in schedule events and rationale.
(b) Significant changes in expected performance and rationale.
(c) Significant changes in development or procurement cost and rationale.
(d) If no significant changes exist, state, “There are no significant software-related issues with this program at this time.”
(12) Business Base Considerations: Summarize Foreign Military Sales impacts to the cost or schedule of the program.
c. History of Significant Developments Since Program Initiation: list major program events (especially those not included in the schedule section) such as capability requirement document validations, major contract awards, significant test periods, production delivery, congressional marks and adjustments, Nunn-McCurdy unit cost breaches and major program restructures. List in reverse-chronological order.
2.5. SCHEDULE
a. Schedule Baseline Events:
(1) Event Grouping: When possible and applicable, group together related events as they are arranged in the Schedule Baseline, especially those that support critical technologies or components critical to the program’s success.
(2) Provide updated estimates for future events. The PPS can support an estimated start date and an estimated completion date for each event or activity. Normally, only the estimated completion date should be provided unless the schedule baseline had a threshold start date for the event. The estimated start date is typically used when the event or activity takes place over time, such as a test period. 4
(3) Provide actual dates for completed events. Normally, only the actual completion date should be provided unless the schedule baseline had a threshold start date for the event.
(4) Ensure schedule event deviations are indicated when the estimated or actual date is later than the APB threshold date.
b. Other Significant Engineering Events: Provide estimates or actual dates for events such as System Requirements Reviews (SRR), Preliminary Design Reviews (PDR), and Critical Design Reviews (CDR) that do not exist in the schedule baseline. If these events are not in the Schedule Baseline, create and add them to the table of Schedule Events. Since this was a new MSAR requirement, it is not necessary to add events to the schedule that completed prior to 2024.
c. Schedule Baseline Deviation Explanation: provide an explanation when at least one schedule event deviation exists.
(1) Explain new deviations.
(2) If an event deviation existed in the prior MSAR, provide an explanation if the estimate has slipped more than three months since the prior MSAR. Otherwise, the explanation need only note that the deviation was reported previously. For example, “The MS C deviation was reported in the MSAR for the FY 2025 PB.”
d. Schedule Notes: Provide any amplifying information about the program schedule. Note the status of any APB revision to correct a deviation or the submission of a Program Deviation Report (PDR).
e. Significant Schedule Risks:
(1) Identify current schedule risks as of the date of the MSAR submission.
(2) Identify prior risks that existed at the time of each the milestone review. These are not risks of meeting the milestones, but risks that existed at the time of the milestone.
(3) Provide negative statements if applicable, e.g., “There are currently no schedule risks,” or “There were no schedule risks identified at Milestone B.”
2.6. PERFORMANCE
a. Performance Baseline Attributes:
(1) Performance Attribute Grouping: When possible and applicable, group together related attributes as they are arranged in the Performance Baseline.
(2) Provide updated current estimates for all system performance attributes (Key Performance Parameters, Key System Attributes, and Additional Performance Attributes).
(3) Ensure performance attribute deviations are indicated when current estimates do not meet APB threshold criteria.
(4) Demonstrated Performance: Indicate performance measured during developmental testing (and date measured), or state “TBD” if an attribute has not yet been tested. If an attribute’s demonstrated performance is still TBD once the program reaches Production (i.e., Milestone C), explain in the Performance Notes.
b. Performance Baseline Deviation Explanation: provide an explanation when at least one performance attribute deviation exists.
(1) Explain new deviations and deviations for estimates that have changed significantly since the prior MSAR.
(2) For previously reported deviations, the explanation need only note that the deviation was reported previously. For example, “The Interoperability KPP deviation was reported in the MSAR for the FY 2025 PB.”
c. Performance Notes: Provide any amplifying information about the system performance. Explain any “TBD” demonstrated performance after a program has entered production. Note the status of any APB revision to correct a deviation or the submission of a Program Deviation Report (PDR).
d. Requirement Source: APB Requirement Sponsors and Capability Requirements Document types and validation dates will be displayed.
2.7. ACQUISITION BUDGET ESTIMATE
a. While the PPS Acquisition Budget Estimate section still uses BY$ labels, program offices should ensure CY$ estimates are provided in both DAVE and the workbook, and ensure the workbook correctly identifies the source for TY$ to CY$ conversions (see Sections 3.9).
b. The inflation indices for TY$ to CY$ conversions in the workbook come from ASN FMB-6 and SAF/FMCE but it usually takes these organizations about a month and a half to two months to update their inflation indices after OUSW(C) releases inflation guidance. OASW(A) staff will update and distribute an updated workbook as soon as possible after receipt of the indices.
c. Cost Units: Set to $Millions unless program has very low unit costs that require reporting in $Thousands. Cost units will be consistent throughout the report.
d. Budget Position: Set to “PB.”
e. Budget Year: Set to the first fiscal year of the PB FYDP. E.g., the MSAR for the FY 2027 PB should have a 2027 budget year.
f. Base Year: Must match the Base Year of the Current APB
g. Appropriation Category Current Estimates
(1) Acquisition Appropriation Categories align to Public Law titles:
(a) Research, Development, Test & Evaluation (RDT&E)
(b) Procurement
(c) Military Construction (MILCON)
(d) Operation & Maintenance (O&M): Only include funds related to the program’s Acquisition Cost, not Operating & Support (O&S) Cost.
(e) Revolving & Management Funds (R&MF): Only include Working Capital Funds related to the program’s Acquisition Cost, not O&S Cost.
(2) For each Appropriation Category, provide the program manager’s total estimate for the approved program, assuming the PB and FYDP budget are enacted. (Do not include acquisition efforts outside the scope of the APB.) For this reason, it is called an Acquisition Budget Estimate and includes:
(a) Actual prior obligations for expired appropriations,
(b) Current budget authority for enacted appropriations (e.g., three fiscal years of budget authority for procurement accounts, two years for RDT&E accounts),
(c) Current FYDP budget for the approved (baselined) program (i.e., PB budget year through BY+4), and
(d) PM’s estimate to complete approved (baselined) program beyond the FYDP.
(e) Provide estimates in TY$ and CY$. Be sure to complete the Annual Acquisition Estimates and Annual Acquisition Quantities sections of the workbook (see Sections 3.09 and 3.10) before entering appropriation category totals in this PPS section. The PPS estimates in TY$ and CY$ for each appropriation category, PAUC and APUC must match the workbook estimates.
(f) Ensure an Appropriation Category Deviation is indicated if the estimate in CY$ is greater than the corresponding APB threshold in CY$.
(g) Deviation Explanation: provide an explanation when an appropriation category deviation exists.
(i) Explain new deviations.
(ii) If an appropriation category deviation existed in the prior MSAR, provide an explanation if the estimate grown more than 5% since the prior MSAR. Otherwise, the explanation need only note that the deviation was reported previously. For example, “The RDT&E deviation was reported in the MSAR for the FY 2025 PB.”
h. Program End-Item Quantities: provide the number of fully configured end items to be acquired for the planned program:
(1) Total Development Quantity
(2) Total Procurement Quantity
(3) Total O&M-Acquired Quantity: very rare and only approved by Component Comptroller if the end item cost is less than the investment/expense threshold. Consult CAE reporting staff before this type of acquisition end-item quantity is provided.
(4) Ensure the Program End-Item Quantities match the totals calculated in the workbook (Section 3.10 below)
i. PAUC and APUC Current Estimates: Calculated using acquisition estimates and enditem quantities.
(1) Ensure a PAUC or APUC Deviation is indicated if the estimate in CY$ is greater than the corresponding APB threshold in CY$.
(2) Deviation Explanation: provide an explanation when a deviation exists.
(a) Explain new deviations.
(b) If a unit cost deviation existed in the prior MSAR, provide an explanation if the estimate grown more than 5% since the prior MSAR. Otherwise, the explanation need only note that the deviation was reported previously. For example, “The PAUC deviation was reported in the MSAR for the FY 2025 PB.”
(3) Ensure PAUC and APUC estimates match values calculated in the MSAR Workbook (Section 3.9 below).
j. Budget and Quantity Notes: Provide any amplifying information about the acquisition budget estimate and planned end-item quantities. Note the status of any APB revision to correct a deviation or the submission of a Program Deviation Report (PDR).
k. Quantity Unit Description: Provide a simple definition for the “unit” used in the Acquisition End-Item Quantities table and unit cost calculations (what is being counted as an end item or unit). Provide this for the program or for each subprogram.
l. Risk and Sensitivity Analyses:
(1) Identify current risks with the Procurement Cost Estimate as of the date of the MSAR submission.
(2) Cost risks identified in the Original (or Revised Original) and Current APBs are displayed in the MSAR for reference.
2.8. UNIT COSTS
This section of the MSAR displays the Unit Cost Report (UCR) for the MDAP or each major subprogram. It includes comparisons of the program's current estimates for PAUC and APUC with the unit costs in the Current Baseline and Original Baseline. A unit cost breach exists when the PAUC or the APUC for an MDAP or major subprogram has increased by a percentage equal to or greater than the significant or critical cost growth threshold, as defined in 10 U.S.C. § 4371. This is also known as a “Nunn-McCurdy Breach.”
a. Current Estimate Compared with Current Baseline: This table displays the percent difference in the PAUC and APUC estimates from the Current APB objective values. It displays significant or critical cost growth indications if criteria are met.
b. Current Estimate Compared with Original Baseline: This table displays the percent difference in the PAUC and APUC estimates from the Original (or Revised Original) Baseline objective values and displays significant and critical cost growth indications. In cases where the Original APB and Budget Estimate have different Base Years, provide deflated Budget Estimates to enable the appropriate comparison. Ensure the estimates for Total Acquisition, Total Procurement, PAUC and APUC in the base year of the original APB match the estimates calculated in the workbook (Section 3.8 below).
c. Significant or Critical Cost Growth Details:
(1) If the CAE determines that the PAUC or the APUC for an MDAP or major subprogram has not increased by a percentage equal to or greater than the significant or critical cost growth threshold despite calculated indications, the PM should explain this in the Unit Cost Notes.
(2) If the Service Secretary (or Agency Head) determines the PAUC or the APUC for an MDAP or major subprogram has increased by a percentage equal to or greater than the critical cost growth threshold, the USW(A&S) will commence actions required by 10 U.S.C. § 4376.
(3) If the Service Secretary (or Agency Head) determines the PAUC or the APUC for an MDAP or major subprogram has increased by a percentage equal to or greater than
the significant cost growth threshold, the USW(A&S) will commence actions required by 10 U.S.C. § 4375, and provide the following additional information in the MSAR:
(a) PAUC and/or APUC Breach Explanations, including any change in End-Item Quantity since Current Baseline and Original Baseline
(b) Impacts of Schedule Changes on Unit Cost
(c) Impacts of Performance Changes on Unit Cost
(d) Actions Taken or Proposed to Control Future Cost Growth
(e) This information is only required if the PAUC or the APUC for an MDAP or major subprogram has increased by a percentage equal to or greater than the significant or critical cost growth threshold. The section will not be displayed in the PDF if the fields are all blank.
2.9. FUNDING SOURCES
a. Acquisition Funding Notes: Provide any amplifying information regarding the program’s (or subprogram’s) funding sources for the acquisition portion of the lifecycle.
b. Acquisition Budget Lines: Identify each budget line that has funded or currently funds the acquisition program (or subprogram) in the President’s Budget (PB) and/or FYDP.
(1) Data source is OUSW(Comptroller) Next Generation Resource Management System (NGRMS).
(2) Include budget lines that fund efforts within the scope of the APB from all applicable appropriation categories (i.e., RDT&E, Procurement, MILCON, Acquisition-Related O&M, and Revolving & Management Funds (R&MF)).
(a) For the purposes of the MSAR, a budget line is the combination of accounting codes that identifies a portion of the DoD budget that funds a program, e.g.,
Descriptor
Example Code Example Title
Account 2040A Research, Development, Test, and Evaluation, Army
Budget Activity (BA) 07 Operational Systems Development
Budget Line Item (BLI) 0203744A Aircraft Modifications/Product Improvement Programs
Program Element (PE) 0203744A Aircraft Modifications/Product Improvement Programs
RDT&E Project D17 Apache Block III
Account 2031A Aircraft Procurement, Army
Budget Activity (BA) 01 Aircraft
Budget Line Item (BLI) 5757A05111 AH-64 Apache Block IIIA Reman
Program Element (PE) 0210100A Aviation Procurement - AA
RDT&E Project - -
Account 2020A Operation and Maintenance, Army
Budget Activity (BA) 04
Administration and Service-Wide Activities
Budget Line Item (BLI) 435 Other Service Support
Program Element (PE) 0207806A Acquisition and Management Support
RDT&E Project - -
(b) If a particular MILCON or O&M Program Element that funds the program has many Line Items Projects, it is acceptable to select one representative and include a note indicating that there are others.
(c) Given the timing of the PB submission, DAVE might not contain budget lines that are new for the PB. If a Budget Line that supports the program cannot be found, select the Budget Line Item “Other” in the given Account and add the details in the Budget Line Note.
(3) Indicate that a budget line is “Shared” if it is not dedicated to the program, i.e., if it funds programs or efforts in the FYDP in addition to the approved (baselined) program or subprogram.
(4) Indicate that a budget line is “Sunk” if the PB does not request funding for the approved (baselined) program within the FYDP. Including Sunk budget lines is especially informative when the program still has unobligated funds in those line items or projects.
c. Operating and Support Funding Notes: Provide any amplifying information regarding the program’s (or subprogram’s) funding sources for the O&S portion of the lifecycle.
d. Operating and Support Budget Lines: Identify each budget line that has funded or currently funds O&S for the acquired system(s) in the President’s Budget (PB) and/or FYDP.
(1) Include budget lines that fund O&S activities that are executed by the program office (or sustainment office), which typically begin as the program prepares for Initial Operational Capability. It is not necessary to identify sources of funding for O&S costs outside the control of the program manager or sustainment manager.
(2) Include line items from all applicable appropriation categories (i.e., RDT&E, Procurement, MILCON, O&M, Military Personnel (MILPERS) and R&MF).
(3) Indicate that a budget line is “Shared” or “Sunk” if applicable.
e. Nuclear Costs: Program Use of Department of Energy Resources
(1) Include total costs (in TY $M) for program-related nuclear armament and propulsion.
(2) Include the data source (e.g., Department of Energy, Defense Threat Reduction Agency, etc.).
(3) These are “non-add basis” costs; that is, they are not to be included in the program’s Acquisition Budget Estimate or O&S Estimate.
(4) Enter “None” if the program has no DOE funding.
2.10. LIFE-CYCLE COSTS
MSAR O&S estimates should be consistent with the APB’s O&S assumptions and scope. For example, the O&S scope for a modification program could be a system component or subsystem, or it could be the modified system overall.
If the program acquires multiple systems or variants with significantly different characteristics and planned usage, these acquired systems and their antecedent systems should be identified in Program Attributes before initiating the PPS, and their O&S estimates should be reported separately. See Section 2.1.
a. While the DAVE user interface PPS Acquisition Budget Estimate section still uses BY$ labels, program offices should ensure CY$ estimates are provided in both DAVE and the workbook (see Section 3.13).
b. O&S Cost Estimates by Cost Category and Acquired System
(1) O&S Cost Categories are defined by the OSD Cost Assessment and Program Evaluation (CAPE) O&S Cost-Estimating Guide:
(a) 1.0 Unit-Level Manpower
(b) 2.0 Unit Operations
(c) 3.0 Maintenance
(d) 4.0 Sustaining Support
(e) 5.0 Continuing System Improvements
(2) Provide the Current Cost Estimate for each category in CY$ for each weapon system and system variant acquired by the MDAP or major subprogram.
(3) Be sure to complete the Annual O&S Estimates section of the workbook (see Section 3.13) before entering the O&S cost element totals in this PPS section. Ensure cost element totals in CY$ for each system are consistent with the estimates calculated in the workbook.
c. O&S and Disposal Costs Compared with Baseline and Deviation Explanation
(1) Provide the Total O&S estimate for the MDAP or major subprogram in TY$. The total estimate in CY$ will be summed from the system O&S estimates by category.
(2) Ensure an O&S Deviation is indicated if the estimate in CY$ is greater than the APB threshold in CY$.
(a) Explain a new deviation.
(b) If a deviation existed in the prior MSAR, provide an explanation if the estimate grown more than 5% since the prior MSAR. Otherwise, the explanation need only note that the deviation was reported previously. For example, “The O&S deviation was reported in the MSAR for the FY 2025 PB.”
(3) Provide the Total Disposal Current Estimate for the MDAP or major subprogram in TY$ and CY$ if one exists. Deviations are not applicable to Disposal Cost.
d. Cost Estimates Sources: provide source information for the current O&S and Disposal estimates, including type (e.g., program office estimate, DoD Component cost position, DoD Component cost estimate, independent cost estimate), approval authority and date. If applicable, provide a No Estimate Reason for O&S cost and/or Disposal cost.
e. O&S Cost Variance by Cost Category compares the program’s current estimate with its prior approved estimate, whenever it was accomplished (not necessarily an MSAR-toMSAR comparison).
(1) Provide the prior total O&S estimate for the MDAP or major subprogram and its approval date.
(2) Allocate the differences between the prior and current estimate by cost element and provide an explanation for each variance.
f. Annual O&S Costs per Unit Compared with Antecedent System
(1) Provide the Current Estimate for annual O&S Cost per Unit by CAPE cost category for each acquired system and system variant, as well as at least one antecedent system if applicable. If an acquired system is replacing more than one antecedent system, only the costs of one antecedent should be provided.
(2) For modification programs, O&S estimate comparisons with the antecedent system is left to the CAE discretion. In some cases, the antecedent system would be the unmodified system.
g. O&S Estimate Assumptions
(1) Provide quantitative assumptions used for the Acquired and Antecedent System estimates:
(a) End-Item Quantity to Sustain
(b) Unit Expected Service Life (average)
(c) Quantity Unit of Measure (e.g., aircraft)
(d) First Operational Fiscal Year (typically IOC)
(e) Final Operational Fiscal Year
(2) Additional O&S Estimate Assumptions and Antecedent Estimate Assumptions: Provide amplifying information in these narratives if needed. If antecedent system estimates are not provided, include a note stating, "Antecedent system estimates are not available," or "there is no comparable antecedent system for the [insert acquired system name]."
h. O&S Annual Cost Calculation Memo: Identify how the Annual O&S Costs per Unit were calculated or estimated. If the estimated costs are at “steady-state” instead of true averages over the life cycle, identify the steady-state timeframe.
2.11. TECHNOLOGIES AND SYSTEMS ENGINEERING
a. Major Software Efforts: List ongoing Major Software Efforts for the program or subprogram that will affect delivery of capability to the warfighter and whose estimated costs exceed $50 million each. Completed efforts do not need to be included.
(1) For each effort provide a title, status, expected fielding date, and brief description.
(2) Status selections are “Design”, “Development” and “Deployment”.
(3) It is unnecessary to include fully deployed software efforts.
b. Major Engineering Changes: List ongoing Major Engineering Changes that may affect scope, cost, or schedule, and whose estimated costs exceed $50 million each. Completed efforts do not need to be included.
(1) For each change, provide a title, original need date, fielding date and a Description, Rationale, and Program Impacts
(2) It is unnecessary to include engineering changes that have been fully incorporated into production.
c. Significant Technical Risks:
(1) Identify current technical risks as of the date of the MSAR submission.
(2) Identify prior risks that existed at the time of each milestone review. These are not risks of meeting the milestones, but the risks that existed at the time of the milestone.
(3) Provide negative statements if applicable, e.g., “There are currently no technical risks,” or “There were no technical risks identified at Milestone B.”
2.12. PERFORMING ACTIVITIES AND CONTRACTS
a. Defense Cost and Resource Center (DCARC) Cost and Software Data Reporting (CSDR) Compliance Rating
(1) The final view and PDF of the MSAR PPS will display the most recent DCARC CSDR Compliance Rating for the program, if one exists.
(2) Data source is the OSW CAPE Defense Acquisition Executive Summary (DAES) Assessment color rating for the Management indicator. Color rating criteria are defined here: https://cade.osd.mil/csdrreportingguidance/csdrcompliancerating.html
b. External Government Activities: Identify other government entities such as test, training, or logistics activities funded by the acquisition program.
(1) Activity Title
(2) Supported Phase: Development, Production, or Sustainment
(3) Commercial and Government Entity (CAGE): Code, Legal Name, City, State. Refer to https://cage.dla.mil/.
(4) Work Start Date
c. Contract Identification: Identify each of the program’s active contracts (including services contracts) that qualify for CSDR requirements.5 If more than twenty qualify, limit to largest twenty. Reporting on other contracts is at the discretion of the CAE. For each covered contract, provide:
(1) Contract Number, Order Number (if applicable), Contract Title
(2) Contract Strategy (select the dominant type if more than one applies)
(3) CAGE Code, Legal Name, City, State
(4) Contracting Office
d. Effort Identification:
(1) Effort Number: PMO-defined and represents a discrete portion (or portions) of a contract that should be tied to the contractor reporting activities as defined in the contract data requirements list (CDRL). The contract/effort pair must be unique since
5 CSDR reports in DoDI 5000.73 Table 1 are Contractor Cost Data Report, Software Resources Data Report, Contractor Business Data Report, Maintenance and Repair Parts Data Report and Technical Data Report. Generally, for ACAT I-II Programs, CSDRs apply to contracts valued at more than $50 million (or software contracts valued at more than $20 million) and other contracts in the CSDR plan.
it is the “primary key” for contract status and Earned Value Management (EVM) reporting.
(2) Effort Description: Identify the contract portion that the effort number represents, e.g., the particular CLINs included for the performance reporting.
(3) Supported Phase: Contracts that support more than one phase (e.g., production and sustainment) should be apportioned into efforts if possible. Otherwise, identify the predominant phase.
(4) Contract Type: select “Multiple Types” if more than one applies and explain in the Contract Notes (e.g., CPIF 50%, FFP 30%, FPIF 20%)
(5) Award Date: Only include awarded contracts (including undefinitized contract actions).
(6) Definitization Date (if applicable)
(7) Latest Modification Date and Number (if applicable)
(8) Work Start Date
(9) Technical Data Rights (select the dominant type if more than one applies)
(10) Indicate whether the CDRL includes CSDRs.
e. Contract Performance (all amounts in TY$): Target Price data is required for all contract types. EVM data should be current as of the date of the latest CPR.
(1) Initial Target Price and Current Target Price: Explain significant differences. These should match for Firm-Fixed-Price (FFP) contracts.
(2) Initial Ceiling Price and Current Ceiling Price (applicable to fixed price incentive fee (FPIF) contracts): Explain significant differences.
(3) Contractor’s Estimated Price at Completion and Program Manager’s Estimated Price at Completion: Explain significant differences. These should match for FFP contracts.
(4) Earned Value Management Performance: Provide for cost- and incentive-type contract/efforts.
(a) Integrated Program Management Data and Analysis Report (IPMDAR) Effective Date: Provide the ending date of the period covered by the IPMDAR from which the contract performance data were obtained.
(b) Work Completed (%), Cost Variance and Schedule Variance: Calculated using Budget at Completion, Budgeted Cost for Work Scheduled, Budgeted Cost for Work Performed, and Actual Cost of Work Performed.
(c) Factors Contributing to Cost Variance CV and Projected Effects on Program Costs
(d) Factors Contributing to Schedule Variance and Projected Effects on Program Schedule
2.13. PRODUCTION
Identify the MDA's original and latest low-rate initial production (LRIP) determination for the MDAP or major subprogram.6
a. Original LRIP Determination
(1) Total LRIP Quantity
(2) Date determination was made, typically the LRIP acquisition decision memorandum (ADM) date.
(3) Reference: typically, the LRIP ADM documenting the decision.
(4) LRIP Period: first and final fiscal years of production lots.
(5) Total Procurement Quantity for the baselined program at the time decision was made.
(6) LRIP Percentage of Total: calculated by dividing the Total LRIP Quantity by the Total Procurement Quantity as of the date of the determination.
b. Current LRIP Determination: Provide data for the latest LRIP Determination. Provide the same values if the Current Determination is the Original Determination.
c. Provide a Rationale if LRIP Quantity Exceeds 10% of Total Procurement Quantity.
2.14. DELIVERIES, EXPENDITURES AND FIELDING
a. Provide the program's or subprogram's completion status in terms of the number of years appropriated, amount of acquisition funding appropriated, amount of acquisition funding expended, and the number of end items delivered. Additionally, provide operational fielding plans and inventories of each acquired system.
b. Acquisition Funding Completion Status:
10 U.S.C. § 4231 (a)(5)
(1) Years Appropriated:
(a) Total Estimate: number of years of congressional budget appropriations that required for the MDAP or major subprogram. This is the calculated range from the first fiscal year to the last, excluding any prior or future years with no funding.
(b) Actual to Date:* number of years of budget appropriations. This is the calculated range from the first fiscal year to the most recent year of appropriations, excluding any prior years with no funding.
(c) Actual, Percent Complete: Calculated by dividing Actual to Date by Total Estimate.
(2) Funding Appropriated:
(a) Total Estimate: Total Acquisition Estimate from the PPS Acquisition Budget Estimate section.
(b) Actual to Date:* Cumulative acquisition funding appropriated by Congress for MDAP or major subprogram.
(c) Actual, Percent Complete: Calculated by dividing Actual to Date by Total Estimate.
(3) Expenditures:
(a) Total Estimate: Total Acquisition Estimate from the PPS Acquisition Budget Estimate section.
(b) Actual to Date:* Cumulative expenditures of appropriated funding for MDAP or major subprogram.
(c) Actual expenditures as a percentage of total estimate of acquisition funding required.
(4) * Use the Notes fields to indicate the "as of" effective date(s) for these measures of completion status. This is typically the date of the President's Budget submission or close to it.
c. End Item Deliveries:
(1) Total Required: Current Estimate of Development Quantity, Procurement Quantity and O&M Acquired Quantity from the PPS Acquisition Budget Estimate section.
(2) Planned to Date:* Cumulative number of program end items that should have been formally delivered to the U.S. Government (apportioned by acquired system or
variant) as of the report. This should be consistent with the Current Estimates supporting the President's Budget.
(3) Actual to Date:* Cumulative number of end items formally delivered to the U.S. Government.
(4) Actual, Percent Complete: Calculated by dividing Actual to Date by Total Required.
(5) * Use the Notes fields to indicate the "as of" effective date(s) for these measures of delivery status. This is typically the date of the President's Budget submission or close to it.
d. Operational Fielding Plan and Inventory. Provide operational fielding and inventory data for each acquired system and system variant of the MDAP or major subprograms:
(1) First Operational Delivery Fiscal Year: Provide the actual or expected fiscal year in which the first system was (or will be) formally delivered to the operational inventory for storage or fielding.
(2) Fielding Plan Notes: Describe the system’s operational fielding (or beddown) plan and inventory that are the basis for system O&S estimates.
(3) Fielding Plan and Inventory: Report actual and projected changes by category beginning with FY 2024 and extending through the FYDP (e.g., FY 2031 for the PB27 MSAR).
(a) Total Active Inventory: If the system’s first operational delivery was prior to FY 2024, provide the total operational inventory as of the end of FY 2023 (the first fiscal year for this MSAR requirement).
(b) Store: For each fiscal year beyond FY 2023, provide the actual or projected net number of operational systems placed in storage (if any). Enter a negative number for the net quantity removed from storage.
(c) Field: For each fiscal year, provide the actual or projected net number of operational systems fielded for operational use (if any).
(d) Expend/Loss: For each fiscal year, provide the net number of operational systems expended (for systems such as munitions), as well as operational losses (if any).
(e) Decommission: For each fiscal year, provide the actual or projected net number of operational systems decommissioned or otherwise intentionally removed from the operational inventory (if any).
2.15. SUSTAINMENT
The status of sustainment plans and metrics are required for the DAES but not required the MSAR. Any PPS data provided will not be transmitted to Advana's Acquisition Congress Stream or SUNet and will not be published in the MSAR PDF.
2.16. INTERNATIONAL PROGRAM ASPECTS
a. General Memo: Summary narrative pertaining to the MDAP’s or major subprogram’s International Program Aspects.
b. Exportability and Business Issues:7 Summarize potential impacts on the program from leveraging Foreign Military Sales (FMS), Direct Commercial Sales (DCS) and International Cooperative Program (ICP) procurements, industry partner cost-sharing contributions to exportability, cost savings, and other strategic/operational benefits to U.S. and partners for making a system available for foreign sales sooner due to exportability design efforts.
(1) Is design for international exportability planned?
(2) If not, has the MDA approved an exportability waiver for a U.S.-only design? (Required for MDAPs by DoDI 5000.85 Para. 3C.4.a).
(3) Industry/Partner Exportability Cost-Sharing? Indicate whether the program contains any contract with a cost-sharing provision that requires the contractor to bear half of the cost to enable the exportability of the system (either for development of program protection strategies for the system or the design and incorporation of exportability features into the system), or such other portion as the Secretary considers appropriate upon showing of good cause.
c. Program Protection: Technology Security and Foreign Disclosure Issues: Summarize impacts on Supply Chain Assurance, Information Assurance, Anti-Tamper, Analysis of Critical Program Information (with program identification of status of CPI analysis, any inherited CPI and source program, and whether program has conducted horizontal protection for CPI and critical systems), and Exportability.
d. Agreements: Identify FMS, DCS and ICP agreements for the MDAP or major subprograms, including the quantity and estimated cost by recipient country. For FMS, only include actual sales; projected or anticipated sales may be mentioned in the General Memo but should not be included in the data table. Exclude any sensitive information. For each agreement identify:
(1) International Partner or Partners
7 DoDI 5000.85, Appendix 3C, Para. 3C.4.a
(2) Activity Date, Agreement Type, and Agreement Number
(3) For each partner, the agreement’s Funding and End-Item Quantity by fiscal year. If the Agreement Quantity item is something other than a program end-item, describe this in the Agreement Note.
SECTION 3: MSAR SUPPLEMENTAL WORKBOOK DATA GUIDANCE
3.1 PREPARATION
a. The workbook does not include “live” source data. It includes recent snapshots of data from DAVE and other sources:
(1) Program table (DAVE)
(2) System table (DAVE)
(3) Program-System link table (DAVE)
(4) PB 2024 Cost Accounts and Budget Lines (DAVE, sourced from the OUSW(C) Next Generation Resource Management System)
(5) Account-specific Raw Inflation Rates and Outlay Rates, sourced from indices provided by ASN FMB-6 and SAF/FMCE.
(6) OUSW(Comptroller) National Defense Budget Estimates (Green Book) Table 5-9 for CY-CY conversions
b. The workbook is structured to support data entry for programs without subprograms and programs with up to four subprograms. It supports programs and subprograms with up to three acquired systems. Notify OASW(A) staff immediately (osd.dave@mail.mil) if there are more than four reporting subprograms, more than three acquired systems per program or subprogram, whether new systems have been added, or names have changed
c. OASW(A) staff will update the workbook with official PB inflation indices when they are available and distribute an updated workbook template to CAE staff.
3.2 GENERAL INSTRUCTIONS AND BUSINESS RULES
a. Classification: Only include Unclassified information in the workbook; do not include Controlled Unclassified Information (CUI) or classified information. The top of each section of the workbook includes a checkbox the data provider should use to indicate that some data in this section cannot be reported because it is not Unclassified. Select “x” for the box if that is the case and then enter the information that can be provided. There will be no classified annex for the workbook.
b. The workbook is structured and formatted to facilitate data quality, enable the publication of a report PDF, and enable data extraction into the DoD Advana analytics platform. OASW(A) staff will ensure each program's workbook is formatted to support creation of a "clean" PDF, combine it with the DAVE MSAR PDF, and then submit the final document to WHS for publication.
c. Please observe these instructions to minimize data loss and maintain a standard format among the DoD’s reports:
(1) Do not change the sheet names in the workbook. In most cases these will appear as section names in the footer of the PDF report.
(2) Do not modify or remove the workbook’s hidden sheets that contain source data to support data entry. Note that some of that data is CUI, so maintain the “(CUI)” label in the file name of the workbook. The PDF resulting from publication will not include this CUI; it will be Unclassified.
(3) Maintain the workbook sheet protections to permit data entry where it is needed and prevent unintentional corruption of formulas. Contact OASW(A) staff (osd.dave@mail.mil) if forms need to be adjusted (e.g., rows or columns added) to accommodate data entry.
(4) The workbook accommodates data entry for a program, or for a program with up to four subprograms. Therefore, most data sections have additional columns to support data entry for multiple subprograms. Do not delete any columns or rows in the workbook of otherwise modify the workbook structure. The standardized template enables data extraction and transfer into Advana.
(5) Do not adjust column widths of the sheets. Pages are formatted so that printing the sheet or workbook as a PDF would produce in a report suitable for publication. View “Page Break Preview” to see the printable area of each sheet. Prior to publication this will be adjusted to “hide” unneeded rows of each worksheet so that unneeded columns (e.g., for additional subprograms) are not printed.
(6) Row heights may be adjusted to display word-wrapped text that would not otherwise be displayed in a cell or row. Prior to publication unneeded worksheet rows will be “hidden”.
(7) Avoid using special characters or formatted text in narratives.
(8) Do not insert links to external sources.
d. MSAR Supplemental Workbook Crosswalk to DAVE PPS:
Workbook Sheet Data
Cover Subprograms
Program Description
Cover Acquired Systems Life-Cycle Cost
Acq. & Qty. Summary Base Years
Acq. & Qty. Summary
Acq. & Qty. Summary
Acquisition Estimates: TY$, CY$ (Current APB Base Year)
Annual O&S Estimates Total System O&S per Cost Element Life-Cycle Cost
Ensure subprograms selected for inclusion in the workbook match the subprograms selected for inclusion in the PPS.
Ensure the program's (or subprograms') acquired systems selected for inclusion in the workbook match the systems whose O&S costs are reported in the PPS.
Ensure the Current APB and Original APB Base Years identified for the program (or each subprogram) in the workbook match the Current and Original APB Base Years in the PPS.
Ensure the Appropriation Category values, PAUC and APUC, in TY$ and CY$ in the Current APB Base Year, match the values in the PPS.
Ensure the Development, Procurement and O&MAcquired End Item Quantities match the values in the PPS.
If the Base Years of the Original APB and Current APB are different, ensure the Total Procurement, Total Acquisition, PAUC and APUC, in CY$ in the Original APB Base Year match the deflated Current Estimate values in the PPS Unit Cost section (using the Original APB Base Year).
Ensure the Total O&S Current Estimates by Cost Element for each system calculated in the workbook match the System O&S Cost Element Structure Estimates in the PPS.
3.3 COVER PAGE AND INITIAL PROGRAM SETUP
a. The “Cover” sheet of the workbook is used to identify the report’s primary program (typically an MDAP) and any major subprograms that are required to be included in the MSAR (see Section 1.2 for Major Subprograms to include).
b. The sheet will include a warning if the workbook has not yet been updated with the official inflation indices for the MSAR.
c. Select the primary program name (typically the MDAP name) in cell C6. Use filters for Lead Component, Acquisition Type, and/or Acquisition Status to refine drop-down selections. Entering a portion of program name text in cell C6 will also filter the selections as “type-ahead” text.
d. MSAR Effective Date: For the annual MSAR, this will be the date of the President's Budget (PB) submission. For an Exception MSAR, this is the date of the Secretary's Significant or Critical Unit Cost Growth Breach notification
e. Budget Year: The MSAR or Exception MSAR Budget Year is the President’s Budget Fiscal Year, so it will always be the Current Fiscal Year plus one. E.g., The Budget Year will be 2027 for MSARs and Exception MSARs produced during FY 2026.
f. If the program has no subprograms, select its acquired system or systems in cells C11C15. Contact OASW(A) staff (osd.dave@mail.mil) if the program's acquired system selection(s) are not correct, and they will help update the data in DAVE and the workbook.
g. Next, if the program has one or more reporting subprograms, select them in cells C18, E18, G18, and I18.
h. Do not select systems for the program if it has reporting subprograms. Instead, select systems for each subprogram in cells C22-C26, E22-E26, G22-G26, and I22-I26.
i. Leave unneeded fields blank.
3.4 ACQUISITION & QUANTITY SUMMARY
a. Ensure appropriation category totals, unit costs and quantity totals on this sheet match data provided in the MSAR Program Progress Submission (see Section 2.6 Acquisition Budget Estimate and Section 2.7 Unit Costs).
b. Except for the Base Year and Unit Description fields, the “Acquisition & Quantity Summary” sheet is formatted to be display-only for an MDAP with no subprograms or for each major subprogram.
c. Base Year (Current APB): Enter the Current APB base year(s) for the program (or for each subprogram) in column F. These are used for TY$ to CY$ conversions.
d. Base Year (Original APB): Enter the Original APB base year(s) for the program (or for each subprogram) in column H. These are used to convert estimates to the base year of the Original APB.
e. Displayed data are calculated from the workbook’s “Annual Acquisition Estimates” and “Annual Acquisition Quantities” sheets:
(1) Acquisition Estimates table displays calculated current estimates for appropriation category totals, PAUC, and APUC:
(a) Then-Year $Millions (TY ($M)) column: These values are calculated using the account TY$ total estimates in the Annual Acquisition Estimates sheet and values in the Acquisition End-Item quantities table.
(b) Constant-Year $Millions (CY ($M)) column using Current APB base year: These values are calculated using the account CY$ total estimates in the Annual
Acquisition Estimates sheet and values in the Acquisition End-Item quantities table.
(c) CY ($M) column using the Original APB base year: These values are calculated using the Current APB Base Year, the Original Base Year, and the OUSW(Comptroller) National Defense Budget Estimates (Green Book) Table 5-9 for CY-CY conversions.
(d) CY ($M) column using the MSAR fiscal year: These values are calculated using the Current APB Base Year, current fiscal year, and Green Book Table 5-9.
(2) Acquisition End-Item Quantities table displays Development, Procurement, and any O&M-Acquired end item quantities by acquired system. These values are calculated using the total quantities by account in the Annual Acquisition Quantities sheet.
(3) Current and Future Years Defense Program Summary (FYDP) table displays— for each appropriation category—the program’s budget estimate for the current fiscal year and FYDP, as well as prior years and to-complete years. These values are calculated using the account TY$ estimates in the Annual Acquisition Estimates sheet.
3.5 ANNUAL ACQUISITION ESTIMATES
a. The “Annual Acquisition Estimates” sheet is formatted to enable data entry for an MDAP with no subprograms or data entry for each major subprogram (up to twenty subprogram appropriation accounts. If data entry is needed for additional appropriation accounts, contact OASW(A) staff (osd.dave@mail.mil).
b. Annual Acquisition Estimates by Appropriation Account: Repeat these steps for each appropriation account that comprises the Acquisition Budget Estimate for the program (or for each subprogram).
(1) Select the Subprogram in row 5 (if the MSAR includes subprograms).
(2) Select the Appropriation Category in row 7. Only select O&M if that appropriation category funds a portion of the Total Acquisition Cost.
(3) Select the Appropriation Account in row 8.
(4) Indicate if Non-Treasury (e.g., foreign) sources fund the Appropriation Category by checking the box in row 9. In this case you can still select a DoD Account in row 8 to use for the TY$-CY$ conversions.
(5) Source for TY$ to CY$ conversion is displayed in row 18.
(a) Unless otherwise indicated in row 10, the source will be ASN FMB-6 Inflation Rates and Outlay factors for Army, Navy, and Defense Wide accounts, or SAF/FMCE for Air Force accounts.
(b) If the MDA has approved the use of alternate, program-specific weighted rates check the box in row 10 and identify the source.
(6) Enter the annual acquisition estimates—in TY($M)—in the table.
(a) If the Appropriation Category is “Procurement”, allocate the total annual amount using the displayed categories. Note “Depot Activation” was a new category required by ASW(S) for fiscal years beginning with 2023.
(i) End Item Recurring Flyaway: Procurement cost or appropriated funding associated with the specific end item quantity of the primary unit of measure. Recurring are the efforts that occur repeatedly during the development or production process (e.g., material, labor, and other expenses incurred in support of final system production). Flyaway are the efforts related to producing a usable end item of military hardware. Includes the cost of creating the basic unit (airframe, hull, chassis, etc.), an allowance for changes, propulsion equipment, electronics, armament, other installed GovernmentFurnished Equipment (GFE), and nonrecurring start-up production costs. An analogous term is “rollaway cost” for military vehicles and “sail-away cost” for naval vessels. Procurement is the program investment funding for acquisition, production, and modification of equipment, supplies, materials, services, and spare parts.
(ii) Non-End Item Recurring Flyaway: Procurement cost or appropriated funding not associated with the specific quantity of the primary unit of measure. Recurring are the efforts that occur repeatedly during the development or production process (e.g., material, labor, and other expenses incurred in support of final system production). Flyaway are the efforts related to producing a usable end item of military hardware.
(iii)Non-Recurring Flyaway: Procurement cost or appropriated funding used for one-time assembly line setup and shutdown costs, special tooling, and other nonrecurring costs associated with producing the end items, such as preproduction engineering, initial spoilage and rework, and specialized work force training.
(iv) Initial Spares: Procurement cost or appropriated funding used for deliverable spare components, assemblies, and subassemblies used for initial replacement purposes.
(v) Depot Activation: Procurement cost or appropriated funding used to establish or activate Integrated Product Support requirements outlined in the
maintenance plan, as well as activities required to achieve a depot maintenance capability for each specified system. This includes the delivery of required supportability data.
(vi) Other/Unallocated: Additional procurement cost or appropriated funding not allocated to one of the above categories. May include tech data, manuals, training devices, peculiar support equipment, and services.
(b) If the Appropriation Category is not “Procurement,” provide the total annual amount in the “Other/Unallocated” column.
(c) Undistributed: Provide acquisition estimates in the "Undistributed" table row only if Unclassified estimates by fiscal year (for future years) cannot be provided. These estimates will be included in the program totals as well as the "To Complete" column of the Current and Future Years Defense Program Summary table.
(d) Prior Year amounts: Provide actual obligation amounts for fiscal years in which the account is no longer active. Provide current budget authority for fiscal years in which funds have been appropriated and are still active.
(e) Current Year amount: Provide current budget authority.
(f) Budget Year (BY) through BY+4 amounts: Provide budgeted amounts consistent with the current budget position (the President’s Budget for an MSAR).
(g) To Complete amounts: For fiscal years beyond BY+4, provide the annual budgets required to complete the program, assuming the FYDP budget is fully funded.
(h) Weighted Rate: the weighted rate is derived using the program’s Current APB Base Year and official inflation indices and outlay rates provided by ASN FMB-6 and SAF/FMCE. If the MDA has approved the use of alternate, program-specific weighted rates, unprotect the sheet, insert the weighted rates for the account, and identify the source in row 10. Note that the use of alternate weighted rates is very rare; consult with your CAE’s MSAR POC before using these.
(7) To standardize the ordering of Acquisition Estimates by Account tables in the published MSAR Supplement, please provide data in this order:
(a) If the program has subprograms, create all tables for the first subprogram before creating tables for the next subprogram(s).
(c) Appropriation Accounts within each category (if more than one): Army, Navy, Air Force, Defense-Wide, and then in numeric order if more than one per department.
c. Total Annual Acquisition Estimates for all accounts are summed in column D, for reference, to make it clear which “Prior” and “To Complete” fiscal years can be hidden when publishing the report.
3.6 ANNUAL ACQUISITION QUANTITIES
a. The “Annual Acquisition Quantities” sheet is formatted to enable data entry for an MDAP with no subprograms or data entry for each major subprogram (up to eight appropriation accounts for Development, Procurement, and any O&M-Acquired Quantities. If data entry is needed for additional appropriation accounts, contact OASW(A) staff (osd.dave@mail.mil).
b. Annual Acquired System End-Item Quantities by Appropriation Account: Repeat these steps for each appropriation account that comprises the Acquisition Budget Estimate for the program (or for each subprogram).
(1) Select the Subprogram in row 5 (if the MSAR includes subprograms).
(2) Select the Appropriation Category in row 7. Only select O&M if the program is approved to use that appropriation category to acquire program end-items (this is rare).
(3) Select the Appropriation Account in row 8.
(4) For each of the program’s (or subprogram’s) acquired systems, enter the annual enditem quantities aligned with the fiscal year acquisition budget estimates. A warning will appear if no acquired systems have been identified in the Cover sheet.
(a) Undistributed: Provide end-item quantities in the “Undistributed” table row if quantities cannot be aligned with specific fiscal years, notwithstanding the Full Funding policy of the DoD Financial Management Regulation, DoD 7000.14-R, Volume 2A, Section 010202. Undistributed quantities may not be used for Procurement appropriation accounts.
(b) Prior Year amounts: Provide end-item quantities associated with actual obligation amounts for fiscal years in which the account is no longer active. Provide planned quantities associated with the budget authority for fiscal years in which funds have been appropriated and are still active.
(c) Current Year (CY) amount: Provide planned quantities associated with current budget authority.
(d) Budget Year (BY) through BY+4 amounts: Provide budgeted quantities consistent with the current budget position (the President’s Budget for an MSAR).
(e) To Complete amounts: For fiscal years beyond BY+4, provide the annual quantities required to complete the program, assuming the FYDP budget is fully funded.
(5) To standardize the ordering of Acquired System Quantities by Account tables in the published MSAR Supplement, please provide data in this order:
(a) If the program has subprograms, create all tables for the first subprogram before creating tables for the next subprogram(s).
(c) Appropriation Accounts within each category (if more than one): Army, Navy, Air Force, Defense-Wide, and then in numeric order if more than one per department.
c. Total Annual Acquisition Quantities for all accounts are summed in column E, for reference, to make it clear which “Prior” and “To Complete” fiscal years can be hidden when publishing the report.
3.7 ANNUAL O&S ESTIMATES
a. The “Annual O&S Estimates” sheet is formatted to enable data entry for acquired systems of an MDAP or each major subprogram. This is the O&S CE by fiscal year. If a CE does not yet exist for the program's or subprogram's system, create table headers for each acquired system—steps c(1) and c(2) below—but leave the table blank.
b. Base Year (Current APB): The Current APB base year(s) for the program (or for each subprogram) are displayed in rows 3-7 of column F (referencing the base years entered in the “Annual Acquisition Estimates” sheet).
c. Annual O&S Estimates by Cost Element: Repeat these steps for each acquired system that comprises the Current O&S Estimate for the program (or for each subprogram).
(1) Select the program’s System in row 5 (if the MSAR does not include subprograms).
(2) Or, if the MSAR includes subprograms, select the Subprogram in row 7 and its System in row 9.
(3) Source for TY$ to CY$ conversion is collected in row 12 and displayed in row 24.
(4) Enter the Annual O&S Estimates by Cost Element in CY($M) in the base year of the Current APB. Enter costs for each applicable fiscal year of the acquired system.
(5) If total estimates are available, but estimates by fiscal year are not available, enter the values in the "Undistributed" row 28.
d. Data Exists? in column K is provided, for reference, to make it clear which “Prior” and “To Complete” fiscal years can be hidden when publishing the report.
3.8 SUBMITTING THE MSAR SUPPLEMENT TO OASW(A)
a. Filename for the workbook: “(CUI) [program short name] MSAR Supplement PB2027”, e.g., “(CUI) AMDR FoR MSAR Supplement PB2027”
b. OASW(A) staff will provide CAE staff a OneDrive drop off location or other file transfer instructions.
c. Contact osd.dave@mail.mil for assistance.
APPENDIX A: COMMON DOD ABBREVIATIONS
$B Billions of Dollars
$K Thousands of Dollars
$M Millions of Dollars
AAF Adaptive Acquisition Framework
ACAT Acquisition Category
Acq O&M Acquisition-Related Operations and Maintenance
ADM Acquisition Decision Memorandum
APA Additional Performance Attribute
APB Acquisition Program Baseline
APPN Appropriation
APUC Average Procurement Unit Cost
ASW Assistant Secretary of War
BA Budget Authority or Budget Activity
Blk Block BY Base Year
CAE Component Acquisition Executive
CAGE Commercial and Government Entity
CAPE Cost Assessment and Program Evaluation
CARD Cost Analysis Requirements Description
CDD Capability Development Document
CDRL Contract Data Requirements List
CLIN Contract Line Item Number
CPD Capability Production Document
CSDR Cost and Software Data Reporting
CY Constant Year
DAB Defense Acquisition Board
DAE Defense Acquisition Executive
DAES Defense Acquisition Executive Summary
DASW Deputy Assistant Secretary of War
DAVE Defense Acquisition Visibility Environment
DCARC Defense Cost and Resource Center
DSN Defense Switched Network
EMD Engineering and Manufacturing Development
EVM Earned Value Management
FD Full Deployment
FDD Full Deployment Decision
FMS Foreign Military Sales
FOC Full Operational Capability
FRP Full Rate Production
FY Fiscal Year
FYDP Future Years Defense Program
ICD Initial Capabilities Document
Inc Increment
IOC Initial Operational Capability
IPMDAR Integrated Program Management Data and Analysis Report
IT Information Technology
JROC Joint Requirements Oversight Council
KPP Key Performance Parameter
KSA Key System Attribute
LRIP Low Rate Initial Production
MDA Milestone Decision Authority
MDAP Major Defense Acquisition Program
MILCON Military Construction
MSAR Modernized Selected Acquisition Report
MTA Middle Tier of Acquisition
O Objective
O&M Operations and Maintenance
O&S Operating and Support
ORD Operational Requirements Document
OSD Office of the Secretary of Defense
OSW Office of the Secretary of War
PAUC Program Acquisition Unit Cost
PB President’s Budget
PE Program Element
PEO Program Executive Officer
PM Program Manager
R&MF Revolving and Management Funds
RDT&E Research, Development, Test, and Evaluation
SCP Service Cost Position
T Threshold
TY Then Year
U.S.C United States Code
UCR Unit Cost Reporting
USD Under Secretary of Defense
USW Under Secretary of War
APPENDIX B: REDACTING CUI DATA FROM DAVE MSAR
B.1. REQUIREMENT
a. Each MSAR will be submitted as a publicly releasable, unclassified report with no dissemination controls.
b. DAVE MSAR data on the NIPRNet:
(1) Ensure Program Registration information that appears in the PPS (such as the Mission and Description narrative) contains no CUI or classified information.
(2) Ensure current estimates and other information provided in the PPS contain no CUI or classified information. Use the indicator at the top of each PPS data sections to specify whether classified data exists and is reported in a SIPRNet MSAR annex.
(3) The NIPR DAVE PPS may reference CUI APB data, however—
(a) CAE staff or OASW(A) staff must manually redact all CUI from the exported PDF report before distribution to Washington Headquarters Services (WHS) (see below). CAE Staff must review and approve any PDF redactions accomplished by OASW(A) staff.
(b) OASW(A) staff must redact any CUI data from the DAVE PPS data in Advana before it is transmitted to the Acquisition Congress Stream and SUNet.
B.2. CUI DATA DISPLAYED IN A DAVE MSAR PDF
a. The PDF of a PPS MSAR with CUI data will have a CUI Designation Indicator on the first page and CUI banner markings on every page (Figure B.1).
b. CUI data will have field-level portion markings, and these markings “roll up” to table headers, subsection headers and section headers (Figure B.2)
B.3. STEPS TO REDACT CUI DATA FROM AN MSAR PDF
DAVE does not have a feature to generate a redacted PPS PDF. Follow these steps to edit the file, redact the sensitive data, and update the security markings.
a. Open the file with Adobe Acrobat Pro or a similar PDF editor, then in the “Tools” tab select “Edit PDF.”
b. Locate the CUI data in the document. Highlight the number, text or date and replace it with the word REDACTED in bold font. Then locate portion markings in the table
headers, subsection headers, and section headers and change them to (U) once you are sure all CUI data has been redacted (Figure B.3).
c. Replace “CUI” banner markings on all pages with “UNCLASSIFIED” once you are sure all CUI data from the entire report has been redacted. Finally, remove the CUI Designation Indicator on the cover page (Figures B.4).
d. CAE Staff must review and approve any PDF redactions accomplished by OASW(A) staff.
Figure B.1
Figure B.2
Figure B.3
Figure B.4
Note: The following is a redacted version of the original report published January 26, 2026 [28 pgs]. All company mentions by GS analysts are illustrative and should not be interpreted as investment recommendations.
AMERICAS FIRST
The Trump Administration kicked off 2026 with a new, more forceful foreign policy, driven by the so-called “Donroe Doctrine”. So, what could “America First” evolving to “Americas First” mean for economies, assets, and geopolitical risk? Trump’s former Special Envoy for Latin America, Mauricio Claver-Carone, and Johns Hopkins
SAIS’ Hal Brands discuss the motives behind the Donroe Doctrine and agree it portends more action in the Western Hemisphere. GS’ Alberto Ramos then explores the implications for regional economies, and GS’ Neil Mehta and Daan Struyven dig into the implications for the asset at the center of recent events: oil. But with perhaps the most profound implication being the rise in geopolitical risk, we ask the Centre for Liberal Strategies’ Ivan Krastev what’s ahead for US-Europe relations (a rocky period, but not a divorce) and GS’ Christian Mueller-Glissmann how to protect portfolios (diversify, don’t time), with GS’ Kamakshya Trivedi also seeing value in a surprisingly resilient corner of the market: EM assets.
WHAT’S INSIDE
The prospect of a fundamental shift in US policy is more real now than at any point in the last 70 years.
-Hal Brands
President Trump has long believed that the US can’t be the preeminent global power if it’s not the preeminent regional power.
-Mauricio Claver-Carone
The [US-Europe] relationship looks to be headed for a rocky period, but not a divorce.
-Ivan Krastev
INTERVIEWS WITH:
Hal Brands, Professor, Johns Hopkins School of Advanced International Studies, Senior Fellow, AEI
Mauricio Claver-Carone, Managing Partner, LARA Fund, Former US Special Envoy for Latin America and Senior Director for Western Hemisphere Affairs at the NSC in the Trump Administration
Ivan Krastev, Chair, Centre for Liberal Strategies in Sofia
VENEZUELA: WHAT’S NEXT?
Alberto Ramos, GS LatAm Economics Research
Q&A ON IMPLICATIONS FOR VENEZUELAN OIL
Neil Mehta, GS Natural Resources Equity Research, and Daan Struyven, GS Commodities Research
WHEN GEOPOLITICS MEETS PORTFOLIOS
Christian Mueller-Glissmann, GS Asset Allocation Research
EM ASSETS: CONTINUED RESILIENCE
Kamakshya Trivedi, GS FX and EM Research
Q&A ON DEFENSE SECTOR GEOPOLITICAL RISK
Noah Poponak and Sam Burgess, GS Equity Research
...AND MORE
Allison Nathan | allison.nathan@gs.com
Jenny Grimberg | jenny.grimberg@gs.com
Ashley Rhodes | ashley.rhodes@gs.com
Goldman Sachs does and seeks to do business with companies covered in its research reports. As a result, investors should be aware that the firm may have a conflict of interest that could affect the objectivity of this report. Investors should consider this report as only a single factor in making their investment decision. For Reg AC certification and other important disclosures, see the Disclosure Appendix, or go to www.gs.com/research/hedge.html. Analysts employed by non-US affiliates are not registered/qualified as research analysts with FINRA in the U.S. This report is intended for distribution to GS institutional clients only.
The Goldman Sachs Group, Inc.
Macro news and views
US Japan
Latest GS proprietary datapoints/major changes in views
• We now expect two 25bp cuts in Jun and Sept (vs. Mar and Jun previously) to a terminal rate range of 3-3.25%
• We recently lowered our 12m US recession probability to 20% (vs. 30%) partly owing to early signs of labor market stabilization
Datapoints/trends we’re focused on
• US growth; we expect somewhat stronger growth of 2.5% in 2026 (Q4/Q4) as the tariff drag gives way to a fiscal boost.
• US government shutdown, the odds of which have spiked.
• DoJ investigation into Fed Chair Powell, which we don’t expect to impact Fed policy for now, but we find that a less independent Fed would put upward pressure on inflation
• AI job apocalypse concerns, which we think are overblown.
Technological change: a key driver of job growth
Employment by new and pre-existing occupations, millions
Latest GS proprietary datapoints/major changes in views
• No major changes in views.
Datapoints/trends we’re focused on
• Japanese growth; we expect still-steady growth of 0.8% in 2026 (yoy) led by domestic demand, but see external demand slowing slightly amid higher Japan-China tensions.
• BoJ policy; we expect the BoJ to hike at a semiannual pace, with the next hike in July, to a policy rate of 1.5% by mid2027, though the timing of the next hike is uncertain.
• Japanese fiscal fears, which have risen on the back of the looming Lower House election (February 8), with all political parties advocating for a consumption tax reduction
Japan: a potential undermining of fiscal health ahead Japanese government debt-to-GDP ratio by scenario, % of GDP
Increase defense spending + abolish consumption tax on food
Increase defense spending to 3% of GDP
Current forecast (post FY2025 suppl. budget) GS estimates
Europe
Latest GS proprietary datapoints/major changes in views
• No major changes in views.
Datapoints/trends we’re focused on
• EA growth; we expect real GDP growth of 1.2% in 2026 (yoy) reflecting real income gains and a fading fiscal drag but growing headwinds from increased competition with China
• UK economy, for which we expect another mixed year in 2026 characterized by trend-like growth and a further rise in unemployment but much lower inflation and more BoE cuts.
• Trade policy; we see only limited downside to European growth and limited upside to inflation if the US-EU trade deal implementation remains stalled
Europe: a meaningful drag from China Shock 2.0
Estimated country-level real GDP impact of higher Chinese
Latest GS proprietary datapoints/major changes in views
• No major changes in views.
Datapoints/trends we’re focused on
• China’s current account surplus, which we expect to rise further over the next several years to almost 1% of global GDP, the biggest of any country in recorded history, owing to China’s manufacturing strength and weak domestic demand.
• China policy easing; we expect more easing this year, including two 10bp rate cuts, which should support our above-consensus growth and inflation forecasts.
• EM policy normalization, which we expect to continue amid further inflation normalization, including in Brazil and CEEMEA
China current account surplus: rising to record levels
China current account surplus as a share of GDP, % export growth by end-2029, %
Source: Goldman Sachs GIR.
Source: Ministry of Finance, Cabinet Office, Goldman Sachs GIR
Emerging Markets (EM)
Source: Haver Analytics, Goldman Sachs GIR
Source: IMF, Haver Analytics, Goldman Sachs GIR.
Americas First
The Trump Administration kicked off 2026 with a new, more forceful foreign policy, driven by the so-called “Donroe Doctrine” a corollary to the Monroe Doctrine that aims to expand US influence and control in the Western Hemisphere (see pg. 8). What the evolution of “America First” to “Americas First” and potentially beyond means for economies, assets, and geopolitical risk more broadly is Top of Mind.
We first turn to Mauricio Claver-Carone, President Trump’s former Special Envoy for Latin America and Senior Director for Western Hemisphere Affairs at the NSC, and Johns Hopkins School of Advanced International Studies‘ Hal Brands for more insight into the Donroe Doctrine and the Trump Administration’s potential next moves.
Claver-Carone explains that the Donroe Doctrine reflects Trump’s long-held belief that “the US can’t be the preeminent global power if it’s not the preeminent regional power” (see pg. 9). This belief is driving Trump to reassert US dominance in Latin America with the overarching goal of strengthening US security namely, national security and, importantly, energy security, which Claver-Carone says are closely linked. He sees no contradiction between this and Trump’s “America First” policy, arguing that “Americas First” is its natural extension.
Brands, for his part, sees two motivating factors behind the Donroe Doctrine, which he characterizes as “a reversion to an earlier style of statecraft”: the US’ desire to consolidate its position in the Western Hemisphere amid a new era of great power rivalry, and Trump’s desire to increase America’s control of hemispheric resources (think oil and territory).
But Claver-Carone and Brands agree: the Donroe Doctrine portends more action in the Western Hemisphere ahead. Claver-Carone expects the Trump Administration to continue pursuing “practical partnerships” with Latin American countries. And Brands underscores the importance of the Greenland issue (see pg. 14), suggesting that it likely won’t be easily resolved, though he also argues that “we shouldn’t view the Donroe Doctrine as a constraint on action elsewhere” (e.g. Iran).
So, what could this all mean for regional economies? Alberto Ramos, GS Head of LatAm Economics Research, doesn’t expect major economic spillovers from the developments in Venezuela to the rest of Latin America given their minimal linkages owing to Venezuela’s strikingly prolonged and deep depression and hyperinflation. He sees similarly limited political implications as voters in several Latin American countries (Peru, Brazil, and Colombia) are set to head to the polls later this year.
And what about exposed assets? Ramos recounts the many uncertainties facing Venezuela’s defaulted bonds amid potential debt restructuring. Neil Mehta, GS Head of North American Natural Resources Equity Research, and Daan Struyven, Cohead of Global Commodities Research, then dig into the global
asset at the center of the recent developments oil. Struyven expects the Administration’s plan to revitalize Venezuela’s beleaguered oil sector to result in a modest increase in Venezuelan oil production and a modestly negative impact on oil prices over the next several years, with more significant oil price impacts over the longer run as production ramps up further (see pg. 11 for a map of Venezuelan oil assets).
But the most profound and potentially lasting implication of the recent developments is the rise in geopolitical risk (see pg. 18).
We speak with the Centre for Liberal Strategies’ Ivan Krastev about the future of the US-Europe relationship, which he describes as at a “turning point but not a breaking point” given Europe’s security, economic, and technological dependence on the US as well as American political realities that may constrain US policy. But he expects a rocky period in the relationship ahead given that trust has been broken, not just because of Greenland, but also because of US actions vis-à-vis Ukraine and the US’ broader treatment of Europe.
And Brands sees even broader geopolitical implications, arguing that US designs on Greenland may test the global territorial status quo that has prevailed post WWII. He warns that the US deciding to play a fundamentally different role in the world than it has in the past 70 years could lead to significant changes in everything from nuclear proliferation, to the security of seaborne transit and democracy, to Dollar dominance.
So, what does this elevated geopolitical risk environment mean for global investors? Christian Mueller-Glissmann, GS Head of Asset Allocation Research, offers guidance on how to protect portfolios against this risk. He argues that rather than trying to time geopolitical shocks, investors’ first line of defense should be diversification. He see value in several diversification strategies: turning to bonds and other safe havens like the Swiss Franc, increasing allocations to assets that could benefit from geopolitical shocks (like gold and the defense sector, which GS defense analysts Noah Poponak and Sam Burgess believe has not yet fully priced in elevated geopolitical risk), limiting direct and indirect exposures, and hedging with options.
Kamakshya Trivedi, GS Chief FX & EM Strategist, also sees value in a surprisingly resilient corner of the market: EM assets, which have held up despite elevated geopolitical risk, which typically weighs on EM relative performance. He expects this resilience to continue this year, with EM assets’ role as diversifiers further increasing their value proposition. In this context, Trivedi believes frontier assets are also worth a look.
Allison Nathan, Editor
Email: allison.nathan@gs.com
Tel: 212-357-7504
Goldman Sachs & Co. LLC
Interview with Hal Brands
Hal Brands is Henry A. Kissinger Distinguished Professor of Global Affairs at the Johns Hopkins School of Advanced International Studies and Senior Fellow at the American Enterprise Institute Below, he discusses the US’ renewed assertiveness in the Western Hemisphere, which he argues could have major repercussions for the global order. The views stated herein are those of the interviewee and do not necessarily reflect those of Goldman Sachs.
Allison Nathan: In 2024, you argued that a second Trump presidency would feature a “revitalized Monroe Doctrine”. What factors are motivating the US’ more forceful posture in the Western Hemisphere?
Hal Brands: I see two motivating factors one structural, one personal. The structural factor is the US’ historic pattern of attempting to consolidate its position in the Western Hemisphere when the rest of the world is falling apart. During both World Wars and the Cold War, the US worked hard to try to ensure its dominance in the Western Hemisphere. So, it's not surprising that the US is now doing the same as the world enters a new era of great power rivalry.
The personal factor revolves around President Trump’s longheld interest in renewing the Monroe Doctrine to increase the US’ control of hemispheric resources, like oil, and territory, specifically from Panama, Canada, and Greenland. The President is also intensely focused on tangible threats to American sovereignty and security rooted in hemispheric issues like drug trafficking and migration. Putting all this together, it's not surprising that this Administration has focused on reconsolidating US primacy in the Western Hemisphere.
What is a bit more surprising is how energetic the Administration has been in doing so. The Venezuela intervention has received substantial attention, but it’s just the capstone of a much bigger and broader campaign that has featured diplomatic pressure on Colombia and Panama, economic support to allies like the Milei government in Argentina, partnerships with El Salvador’s Bukele government and other ideological fellow travelers, lethal strikes on drug boats, and an array of other military, diplomatic, and economic initiatives. In many ways, this has been the centerpiece of Trump’s foreign policy so far.
Allison Nathan: So, it’s right to think that oil was a key motivation for the Venezuela actions?
Hal Brands: Resource control is undoubtedly at the forefront of the President’s calculus. He has long associated it with national power, often remarking that the primary mistake in the American invasion of Iraq was not “taking the oil”. In describing US aims in Venezuela since the intervention, Trump has said very little about democracy and good governance, and even relatively little about drug trafficking. He talks a lot about the US exerting greater control over the disposition and sale of Venezuelan oil and the desire for greater openness of the Venezuelan oil industry to the US oil majors. Others in the Administration may value different things in this Trump Corollary to the Monroe Doctrine, but for Trump himself, the
primary issues are essentially about economic gain and a neomercantilist approach to international economics.
Allison Nathan: Is that what differentiates the “Donroe Doctrine” from the Monroe Doctrine?
Hal Brands: The Monroe Doctrine’s meaning has evolved over time. It was initially about preventing the reimposition of colonial control by European powers. During the 20th century, it became about keeping fascist and communist regimes out of the hemisphere. In some ways, the “Donroe Doctrine” is a throwback it is a reversion to an earlier style of statecraft that is much less apologetic about the desire to control the resources of weaker countries and much more willing to talk about outright territorial acquisition and other ideas that went out of style with the end of the age of imperialism. It's sometimes said that Trump is trying to revive a 19th century style of foreign policy. I agree that he would likely feel quite at home if he were presiding over some of the US’ interventions in Latin America in the late 19th and early 20th centuries. Indeed, the tactics he has used in Venezuela overthrowing a government and exerting control of the country’s trade revenues aren’t that different from what the US did in places like the Dominican Republic well over a century ago.
Allison Nathan: With that context, why do you think the Administration chose to leave the rest of the Maduro regime in place?
Hal Brands: Trump is seeking maximum leverage and gain with minimum long-term investment of resources and political capital. He burst onto the domestic political scene 10 years ago by arguing that the US had made terrible mistakes by undertaking nation-building missions in Afghanistan and Iraq. And flying Maria Corina Machado or Edmundo Gonzalez into Caracas in the hours after Maduro's apprehension probably would have incited a lot of instability by putting them in conflict with the remnants of the Maduro regime. So, the mechanism Trump has settled on is a 21st century version of gunboat diplomacy, where the US will work through the existing authorities while threatening them with punishment if they don't do the Administration's bidding.
Allison Nathan: What do these developments mean for other countries in the region, many of which are slated to hold elections this year?
Hal Brands: They serve notice to any vulnerable anti-American regimes playing strategic footsie with China and Russia that they will likely face greater US pressure. Cuba might be the best example. That said, I’m skeptical that the US would undertake a large-scale military intervention in Cuba because a collapse of that regime might produce a flood of refugees headed for the US. More broadly, countries from Colombia to Mexico will likely feel pressure to act with greater urgency on
issues related to narcotrafficking, which we’re already seeing evidence of in the discussions the US and Mexico appear to be having about a potential role for the US military in going after cartels operating in Mexico, as well as some of Trump's comments about Colombia.
The domestic political implications of these shifts will vary given the array of political cultures and levels of susceptibility to US interests throughout the region. In Brazil, the political culture to some degree has long been interwoven with resistance to US influence in Latin America, even in periods when conservative military governments in Brazil worked very closely with the US. So, I wouldn't be shocked if US efforts backfire to some degree in the next Brazilian election. But it could go the other way there and/or in other countries, where the US either has more influence or where a homegrown swing to the right or in the direction of neo-populist politics occurs.
Allison Nathan: What lessons do you think China and Russia are taking from the recent US actions, and how are they shifting their calculus in the region?
Hal Brands: Beijing and Moscow have run up hard against the reality of US hard power in the Western Hemisphere. Whether it’s the US Navy and Coast Guard seizing shadow fleet tankers, the US forcibly deposing Maduro, or the Pentagon shooting up drug boats in the Caribbean, neither China nor Russia can do much to contest the application of American military power in the Western Hemisphere. That said, China’s influence in the region in particular is multifaceted and deeply embedded in everything from trade relationships to the diffusion of technology to physical and digital infrastructure, all of which will persist to some degree.
It’s important to note that China’s influence is not simply imposed on Latin American countries, but a response to their needs. Big gaps in physical and digital infrastructure exist in the region, which China is well-placed to address. So, Beijing will play the long game and continue to attempt to win influence in the region through economic, political, and, in some cases, low profile security relationships that will focus more on internal security than traditional military functions. If anything, the recent developments likely mark the start of an even more intense phase of competition for influence in the region.
Allison Nathan: How does Greenland fit into Trump’s plan, and what might that suggest about his next steps there?
Hal Brands: Greenland is both a hemispheric and global issue. It’s a hemispheric issue in the sense that the Trump Administration views consolidating US control of Greenland as part of the larger effort to revive the Monroe Doctrine. And they can point to historic examples of the US increasing its influence in Greenland as part of a strategy of hemispheric defense, as President Roosevelt did in the run-up to US entry into WWII.
It's also a global issue, for two reasons. First, Greenland powerfully affects the fate of NATO and the transatlantic community; it’s hard to overstate the degree of outright alarm that Canada and many European countries feel about US designs on the territory. Second, Greenland is the best test of whether the US will seek changes to the global territorial status quo. That’s an explosive issue because China and Russia are attempting to do much the same thing in the South China
Sea/Himalayas and Ukraine, respectively. So, a world in which the US also aims to redraw borders through coercion or even force is a world in which the three most powerful countries are all violently or coercively disrupting the territorial status quo. That’s something we haven't seen since the 1930s and could be deeply corrosive to the post-1945 global order.
Allison Nathan: So, recent US actions have helped further the ambitions of China and Russia in some respects?
Hal Brands: Both countries were undoubtedly unhappy to see Maduro go, especially at the hands of ruthlessly efficient US military power. But recent developments aren’t entirely bad news for Beijing and Moscow. A world in which international law and norms matter less, and great powers are free to do as they like, especially in their own backyards, is a world in which Chinese and Russian leaders would feel comfortable. In fact, that’s exactly the world they aim to bring about. And if an intensification of US military activity in the Western Hemisphere pulls resources away from other regions, as was the case when Trump redeployed an aircraft carrier covering the Middle East and Europe from the Mediterranean to the Caribbean, that's even better news for them.
Allison Nathan: How does Iran fit in here?
Hal Brands: Iran is a key reason why we should be skeptical of the idea that the world is rapidly transitioning into a spheres of influence arrangement. Trump wants an American sphere of influence in the Western Hemisphere, but he also likes to maintain unhindered freedom of action globally when he views it as advantageous to him. This was clear in the recentlyreleased national security strategy. This Administration has also conducted two major military interventions in the Middle East and threatened others. We shouldn’t view the Donroe Doctrine as a constraint on action elsewhere.
Allison Nathan: Amid all this, what geopolitical risks should companies and investors be most focused on?
Hal Brands: The mega risk is the potential for the US to decide to play a fundamentally different role in the world. We have lived for so long in the post-1945 international order in which US power was wielded to secure strong prohibitions on forcible conquest, freedom of navigation to support and propel the global economy, and protection of human rights and the spread of democracy, that it’s difficult to conceive of a world without that leadership. Such a world would likely see more countries pursuing nuclear weapons, greater disorder on the high seas that would impact global trade and finance, a challenge to Dollar dominance, and a global retreat of democratic values.
30 years ago, I would have said there was little chance of such a shift. 15 years ago, I would have said signs of retrenchmentminded inclinations in the US foreign policy debate had grown. We now have a US president who often expresses a desire for fundamental change in US foreign policy and the way the US engages in the global economy, even if the policies don’t always match the rhetoric. So, the prospect of a fundamental shift in US policy is more real now than at any point in the last 70 years. The stakes are high, and the choices the US makes in the coming years will not only determine its own role on the world stage, but also the trajectory of the international order.
Interview with Mauricio Claver-Carone
Mauricio Claver-Carone is Managing Partner of the Latin America Real Assets Opportunity Fund He served as US Special Envoy for Latin America and Senior Director for Western Hemisphere Affairs at the National Security Council in the Trump Administration. Below, he argues that President Trump views US dominance in the Western Hemisphere as essential for global preeminence, and that “Americas First” is a natural extension of “America First” The views stated herein are those of the interviewee and do not necessarily reflect those of Goldman Sachs.
Jenny Grimberg: You played a key role in foreign policy in the Western Hemisphere during both Trump Administrations. What’s behind President Trump’s focus on the region, and do you sense a shift in that focus from his first term?
Mauricio Claver-Carone: President Trump has long believed that the US can’t be the preeminent global power if it’s not the preeminent regional power. That is the “Donroe Doctrine”. And contrary to widespread perception, this reflects the President’s own thinking, not his advisors’ influence. President Trump is a developer from New York he thinks in terms of building neighborhoods. He has traveled throughout the region and knows it well. And he believes that no region in the world impacts Americans’ daily lives more than Latin America and the Caribbean from a security, economic, and social perspective.
I’ve seen firsthand many times how focused the President has been on this, and on the US’ waning influence and positioning in the region over the last two decades, especially vis-à-vis China. During periods of conflict in Afghanistan and Syria in his first term, President Trump would incredulously remark on how eagerly and easily the US sent troops to those countries yet was too scared to have any type of presence in its own hemisphere. And I remember at one point during the intensifying crisis that gripped Venezuela in 2019, the President being disturbed to learn that the US Navy had no ships in the vicinity of the Caribbean because they were all deployed to the Persian Gulf, South Asia, and the Mediterranean.
That said, given his team was distracted by the Middle East and Asia at the time, President Trump’s first term was largely about facilitating a pivot from China in the region. The Administration focused on setting frameworks to, mostly through soft power, execute this pivot, which led to the creation of the America Crece Initiative to catalyze private sector investment in energy and infrastructure projects across Latin America and the Caribbean.
The second term, by contrast, is about the implementation of President Trump’s vision for the region. He made that vision extraordinarily clear during his second inauguration as he harkened back to President McKinley and the golden era of American influence, projected not only through policy the Monroe Doctrine and, later, the Roosevelt Corollary to it but also through brick-and-mortar initiatives like the Panama Canal. And this time around, his team is aligned with that vision. Secretary of State and National Security Advisor Marco Rubio understands and cares about the region and President Trump’s vision for it. Deputy Chief of Staff for Policy and Homeland
Security Advisor Stephen Miller is also focused on the region owing to his holistic approach on immigration and his view that immigration would be less of a problem for the US if Latin American countries were thriving. And, in contrast to the secretary of defense in the first Administration, who didn’t believe that the Department of Defense should be involved in counternarcotics, Secretary of Defense Pete Hegseth is very involved.
Jenny Grimberg: What does the President hope to achieve by reasserting US influence in Latin America?
Mauricio Claver-Carone: The Trump Administration’s actions in Latin America from the Venezuela operation to the relationship it created with Mexico to the historic support it lent Argentina during its economic crisis last year are based first and foremost on US security. This runs the gamut from national security in terms of halting narcotic and migrant flows and reducing terrorism risk to energy security. The Achilles heel of Latin America and the Caribbean in particular is energy. Fidel Castro always understood that, which is why he helped install Hugo Chavez and viewed Venezuela as his golden crown. And Caribbean countries’ pressing need for energy led to the formation of PetroCaribe, an initiative launched by Chavez to supply Venezuelan oil to these countries on favorable financial terms, which allowed Venezuela to essentially control the Caribbean for many years.
Energy security is closely intertwined with national security, as high energy costs have been a key driver of migration throughout Central America. So, energy security is incredibly important, which is consistent with President Trump’s desire to increase oil production in the Western Hemisphere. The US is an energy powerhouse in its own right, and many Latin American countries could be too with proper management. US influence can play a crucial role here. Guyana currently produces more oil than Venezuela, largely because the Guyanese government has worked hand-in-hand with US companies to develop the right policies from the get-go and leave behind the nationalist ideological strains that were embedded into the psyche of the regional population during the 20th century revolutions.
Jenny Grimberg: Does expanding US influence in Latin America conflict with the “America First” pillar of President Trump’s Make America Great Again (MAGA) platform?
Mauricio Claver-Carone: Not at all. “Americas First” is the natural extension of America First as President Trump works to counter the notion of every DC think tank expert that the 21st century would be the Chinese century. The President was adamant during his inauguration that it would instead be
another American century, and potentially the greatest American century. And contrary to what many believe, the President’s Latin America strategy is not about boots on the ground or nation-building. It is about practical partnerships between nations as the US shifts from a policy of noninterventionism which served neither the local population nor the US well by leading to the rise of Chavez and China to nonimperial expansionism, a term coined to explain the strategy of deepening US influence in the region through partnerships.
These are not political partnerships the US is currently working with the right-leaning governments of Argentina, El Salvador, Costa Rica, and Chile as well as the left-leaning governments of Mexico and Venezuela but practical, business-oriented relationships that benefit not only the US but also these countries, whose populations desire security and economic opportunities. The best example of that is Argentina. Many people, including myself, worried that the Trump Administration’s financial support ahead of last year’s midterm elections could spark a backlash against President Milei’s Conservative party given that strains of Peronism still exist in Argentina. But the election results showed that most of the party’s support came from the poor, who are fed up with ideologies that neither pay the bills nor put food on the table. So, the region has undergone a dynamic social shift.
Jenny Grimberg: How does the Trump Administration’s decision to depose Maduro fit into that?
Mauricio Claver-Carone: Let me first clarify that the Administration didn’t “depose” Maduro. This was a law enforcement operation with military support to capture an individual indicted for narcoterrorism in the US. Now, this was a particularly complicated operation because Maduro was de facto running a nation-state with a military, which showed the world that nobody is outside of US reach and sent a message of US influence, ability, and capability. But the operation also underscored the Trump Administration’s preference for partnership. President Trump gave Maduro plenty of opportunities to work together; he expressly rejected every offer, which led the Administration to execute a carefully thought-out operation to capture him. That sends an important message: when President Trump offers you a deal or an opportunity, you take it.
The Trump Administration’s subsequent actions in Venezuela are also a testament to its partnership preference. The US undoubtedly had the capabilities for a broader operation, but assessed that the other people in Venezuela controlling the institutions of power would want to work with the US. And so far, that assessment has proven right. In the days following the operation, the US reached a deal to purchase 30-50 million barrels of Venezuelan oil and several million barrels moved shortly after. Venezuela is also increasingly and consistently releasing political prisoners. And the US is working with the Venezuelan authorities to put the country on a path toward becoming a more stable and secure presence in the region with an open, participative process. Much remains uncertain, but I’m optimistic.
Jenny Grimberg: The million-dollar question is what President Trump will do next in Latin America and the broader Western Hemisphere. What’s your view?
Mauricio Claver-Carone: Further efforts at forming and consolidating partnerships with countries in the region are likely. Upcoming elections in Brazil and Colombia will be important. Conservative candidates recently won Honduras’ and Chile’s presidential elections, and if right-wing candidates also prevail in Colombia and Brazil, it would result in a historic ideological consolidation for the region. But again, this isn’t about ideology but whether the new leaders will choose the US first and foremost as their partner. That would give the US a historic opportunity to modernize its business relationships and commercial partnerships across Latin America.
That could start with Mexico and the upcoming USMCA renegotiation, which seems to be the path the President is heading down. But President Trump’s intense focus on trade is reactive. He feels that the trade deals of the 1990s/early 2000s were all flawed, forcing him to focus on fixing them. As those issues resolve, the focus of US partnerships with regional allies could shift to making deals that ensure a US strategic presence in critical sectors like energy and infrastructure. The hope is that by the end of President Trump’s term, nobody will ever again talk about China’s expanding influence in the region, because it will be unquestionably clear that the US is the partner of choice for Latin America and the Caribbean.
Jenny Grimberg: As an investor in the region, what advice do you have for investors attempting to navigate Latin America’s evolving geopolitical landscape?
Mauricio Claver-Carone: Investors looking to monetize the “Donroe Doctrine trade” by focusing more on Latin America should look beyond the big-ticket deals in Mexico and Brazil, which have often been walloped by currency issues, to smaller countries. The deals are smaller, but the returns are bigger as a percentage, and these countries are among the region’s fastest-growing economies, offering great opportunities for investors. The secret sauce is local partners.
I would also advise against relying on multilateral development banks. As a former president of the Inter-American Development Bank, I’ve seen firsthand that these institutions aren’t focused on finding or creating the best deals. Investors should instead focus on US domestic finance institutions like the International Development Finance Corporation (DFC), which partners with the private sector to mobilize capital for strategic investments around the world and recently secured a six-year reauthorization, to gain exposure to long-term deals in strategic sectors.
I also see significant short and medium-term investment opportunities in the energy and infrastructure space. The timing is right for these investments because the US government is focused on and geopolitically invested in Latin America and wants to encourage private investment in the region, and that focus isn’t going away given President Trump’s “Americas First” philosophy.
The Monroe Doctrine through the years
19021904 Roosevelt Corollary: In 1902, a fleet of British, German, and Italian gunboats set up a blockade of Venezuela’s ports after the nation defaulted on its debts to European lenders.
President Theodore Roosevelt, as part of his foreign policy to “speak softly, but carry a big stick,” issued a corollary to the Monroe Doctrine that gave the US “international police power” over the Western Hemisphere, justifying US intervention in Latin American affairs to prevent European influence. Roosevelt used this to justify US intervention in Venezuela, as well as Panama in 1903 and Cuba in 1904.
INVOKING THE MONROE DOCTRINE
The Monroe Doctrine, first articulated by President James Monroe in 1823, declared that European powers should not interfere in the affairs of the newly independent nations of the Americas, a stance motivated by concerns over potential European recolonization. Since its inception, US presidents have frequently invoked the Doctrine to justify various foreign policy actions across the Western Hemisphere.
1915 US intervention in Haiti: Following the assassination of the Haitian President, President Woodrow Wilson dispatched US Marines to Haiti with the goal of restoring order and maintaining political and economic stability in the Caribbean. The US maintained control over Haiti until 1934.
1895 Cleveland and the Venezuela boundary dispute: The Cleveland Administration intervened on Venezuela’s behalf in the country’s boundary dispute with Britishcontrolled Guiana (now Guyana) after gold was found in the contested region, asserting that the US had the right to intervene in the dispute based on the Monroe Doctrine.
1865 support for Mexico against France: In 1864, France installed an Austrian Habsburg prince as the Emperor of Mexico, which the Lincoln Administration saw as a violation of the Monroe Doctrine. In 1865, the US exerted diplomatic and military pressure to help Mexican President Benito Juárez lead a successful revolt against the Emperor.
2026 Trump Corollary and the Donroe Doctrine: President Trump laid out a Trump Corollary to the Monroe Doctrine that aims to restore US preeminence in the Western Hemisphere. Referring to it as the “ Donroe Doctrine,” Trump used it as justification for the arrest and extradition of Venezuelan leader Nicolás Maduro on drug trafficking charges.
1989 capture of Manuel Noriega in Panama: President George H.W. Bush deployed US troops to Panama to arrest and extradite Manuel Noriega on drug trafficking and money laundering charges. The US cited the Monroe Doctrine to justify the invasion, claiming that Noriega’s regime threatened US citizens living in Panama as well as the security of the Panama Canal.
2018 Trump 1.0 revitalization: During his first term, President Trump invoked the Monroe Doctrine in relation to US policy toward Venezuela and other nations in the Western Hemisphere, reaffirming his “enduring commitment” to the Doctrine.
1983 Reagan and the invasion of Grenada: The US launched an operation in Grenada to oust its Marxist government after the execution of leader Maurice Bishop. President Reagan invoked the Monroe Doctrine in order to safeguard American lives in Grenada and extinguish communist influences. Reagan called the invasion of Grenada the first successful “rollback” of communist influence since the onset of the Cold War.
1954 USbacked coup in Guatemala: The US intervened in Guatemala in a CIAbacked coup to overthrow President Jacobo Árbenz amid fears that his government was being influenced by communist groups.
Origin of the Monroe Doctrine: In an address to Congress, President James Monroe declared that the Western Hemisphere was offlimits to European colonization and, in return, promised US noninterference in Europe in what became known as the Monroe Doctrine.
1962 JFK and the Cuban Missile Crisis: President Kennedy invoked the Monroe Doctrine during a televised address in October 1962, announcing the discovery that the Soviet Union was secretly installing offensive nuclear missile sites in Cuba. Kennedy ordered a naval blockade around the island, characterizing the Soviet action as a direct challenge to the longstanding principle of preventing hostile foreign powers from establishing military bases in the Western Hemisphere.
1823
1933 FDR and the “Good Neighbor Policy”: By the early 1930s, US relations with Latin America were strained due to decades of military interventions. In an effort to improve relations, President Franklin D. Roosevelt established the “Good Neighbor Policy,” which renounced direct US intervention in Latin America in favor of economic cooperation with the region.
Not an exhaustive list of all policy actions related to the Monroe Doctrine. Source: US Department of State, National Archives, Office of the Historian, compiled by Goldman Sachs GIR.
The Donroe Doctrine, in Trump’s words
April 1, 2020: Trump deploys US Navy destroyers, surveillance aircraft, and additional military personnel to the Caribbean near Venezuela, saying “As governments and nations focus on the coronavirus, there is a growing threat that cartels, criminals, terrorists, and other malign actors will try to exploit the situation for their own gain. We must not let that happen.”
August 20, 2019: “Denmark is a very special country with incredible people, but based on Prime Minister Mette Frederiksen’s comments, that she would have no interest in discussing the [US] purchase of Greenland, I will be postponing our meeting scheduled in two weeks for another time.”
September 25, 2018: “Here in the Western Hemisphere, we are committed to maintaining our independence from the encroachment of expansionist foreign powers. It has been the formal policy of our country since President Monroe that we reject the interference of foreign nations in this hemisphere and in our own affairs… In that spirit, we ask the nations gathered here to join us in calling for the restoration of democracy in Venezuela. Today, we are announcing additional sanctions against the repressive regime, targeting Maduro’s inner circle and close advisors.”
June 16, 2017: ” Last year, I promised to be a voice against repression in our region remember, tremendous oppression and a voice for the freedom of the Cuban people… America will expose the crimes of the Castro regime and stand with the Cuban people in their struggle for freedom. Because we know it is best for America to have freedom in our hemisphere, whether in Cuba or Venezuela.”
Jan 20, 2017: “ From this moment on, it’s going to be America First Every decision on trade, on taxes, on immigration, on foreign affairs, will be made to benefit American workers and American families… We will seek friendship and goodwill with the nations of the world –but we do so with the understanding that it is the right of all nations to put their own interests first.”
May 8, 2020: “If I wanted to go into Venezuela, I wouldn't make a secret about it. I wouldn't send a small, little group, no, no, no. It would be called an army.”
September 25, 2019: “For all of the countries of the Western Hemisphere, our goal is to help people invest in the bright futures of their own nation… We want every nation in our region to flourish and its people to thrive in freedom and peace. In that mission, we are also committed to supporting those people in the Western Hemisphere who live under brutal oppression, such as those in Cuba, Nicaragua, and Venezuela... We are watching the Venezuela situation very closely. We await the day when democracy will be restored, when Venezuela will be free, and when liberty will prevail throughout this hemisphere.”
July 18, 2023: “When I'm back in the White House, on Day One, we are returning to a foreign policy that puts America's interests first… I will restore the proud culture and honor traditions of America's armed forces. And there will be no Marxism allowed, no communism allowed, and we'll get rid of the fascists.”
August 11, 2017: “We have many options for Venezuela, including a possible military option, if necessary… We don’t talk about it. But a military operation, a military option, is certainly something we could pursue.”
January 14, 2026: "The United States needs Greenland for the purpose of National Security. It is vital for the Golden Dome that we are building. NATO should be leading the way for us to get it. IF WE DON’T, RUSSIA OR CHINA WILL, AND THAT IS NOT GOING TO HAPPEN!"
January 8, 2026: “It's a doctrine of 'don't send drugs into our country.' That's what the doctrine is. Don't send drugs into our country."
December 2, 2025: “The United States will never waver in defense of our homeland, our interests, or the wellbeing of our citizens. Today, my Administration proudly reaffirms this promise under a new ‘ Trump Corollary ’ to the Monroe Doctrine: That the American people not foreign nations nor globalist institutions will always control their own destiny in our hemisphere... Reinvigorated by my Trump Corollary, the Monroe Doctrine is alive and well and American leadership is coming roaring back stronger than ever before.”
January 21, 2026: “We probably won't get anything [on Greenland] unless I decide to use excessive strength and force where we would be, frankly, unstoppable. But I won't do that.”
January 16, 2026: “I may put a tariff on countries if they don’t go along with Greenland, because we need Greenland for national security.”
January 14, 2026: “We are making tremendous progress, as we help Venezuela stabilize and recover… This partnership between the United States and Venezuela will be a spectacular one FOR ALL. Venezuela will soon be great and prosperous again, perhaps more so than ever before.”
January 3, 2026: “The Monroe Doctrine is a big deal, but we’ve superseded it by a lot, by a real lot. They now call it the Donroe document ... [the] Monroe Doctrine, we sort of forgot about it. It was very important, but we forgot about it. We don't forget about it anymore. Under our new national security strategy, American dominance in the Western Hemisphere will never be questioned again. It won’t happen… For decades other Administrations have neglected or even contributed to these growing security threats in the Western Hemisphere. Under the Trump Administration, we are reasserting American power in a very powerful way in our home region.”
May 2025: “For far too long, the communist Cuban regime has trampled on the rights of its people to lead lives of freedom and has caused endless poverty, suffering, and hardship. America will continue to work alongside our allies and partners in the Western Hemisphere to bring stability, liberty, cooperation, and a free future to the people of Cuba.”
Source: White House, Truth Social, CBS, X, compiled by Goldman Sachs GIR.
Venezuela: what’s next?
Alberto
Ramos
explores what developments in Venezuela could mean for the country’s economy and the broader LatAm region
Following the US operation in Venezuela, the situation on the ground remains very fluid and the outlook complex and uncertain. The Trump Administration is now working with the remnants of the Maduro regime to stabilize the Venezuelan economy, focusing first and foremost on the battered oil sector, and eventually hold open elections
An economic collapse of historic proportions
Venezuela has been trapped in a seemingly never-ending economic depression and hyperinflationary spiral. Large macro and financial imbalances have spawned an economic collapse of historic proportions. In fact, Venezuela has experienced one of the worst peacetime economic downfalls in modern history, with real GDP contracting far more than in the US during the Great Depression (-28%), Spain during the Spanish Civil War (-28%), and the 2009 Greece crisis (-27%). Per the IMF, in Dollar terms, Venezuelan GDP has shrunk by ~80% since 2012, with seven consecutive years of negative real GDP growth over 2014-2020 for an astonishing cumulative decline of 74.3%.
Quite telling and illustrative of the major economic collapse of the last 20 years is the dramatic shift within Venezuela’s oil sector the country’s key source of foreign exchange. Oil production fell from 2.7mb/d in 2015 to 0.93mb/d in 2025, resulting in an oil-export hard-currency crunch that imposed a severe and debilitating constraint on imports. As a result, Venezuela’s economy has contracted to ~$80bn today, roughly the size of Uruguay and less than a quarter the size of Chile.
Hyperbolic inflation immiserizes
Annual inflation over the decade leading up to 2025 was an astronomical 14,544% on average—reflecting years of hyperinflation (inflation was ~130,000% in 2018). Over the same period, Venezuela’s currency (the Bolivar) lost ~98% of its value. The economic hardship has helped generate a mass exodus of people over the last 16 years. According to the UNHCR, nearly 8mn people fled the county, close to a quarter of the population and one of the world's largest displacements, with most settling in nearby countries, particularly Colombia. Venezuela has experienced hyperinflation and depression Nominal GDP in USD (lhs, index, 2012=100) vs. CPI (rhs, log 10 scale)
of LatAm. However, if the situation on the ground were to deteriorate into widespread lawlessness and violence, we could see renewed migration flows, likely affecting neighboring countries first and foremost. Beyond migration, the situation in Venezuela could indirectly impact the region through their impact on key commodity prices, particularly oil and gold.
…and political implications
The political implications for the rest of LatAm also seem limited. The reactions of regional governments were mixed and clearly divided along political/ideological lines, but even those critical of the situation were cautious and contained in their responses. However, US actions in Venezuela could stress its relationship with Mexico, Colombia, and Brazil, especially if the US expands its focus to the regime in Cuba and/or conducts military strikes on drug cartels inside Mexico or Colombia. At this juncture, we do not expect the ongoing developments in Venezuela to impact upcoming elections in Brazil (general election in October), Colombia (congressional elections in March, presidential in May), or Peru (general elections in April).
Debt restructuring key to watch from here
Venezuela defaulted on international bonds in late 2017 due to the compounding effects of the deep economic crisis and sanctions. Defaulted debt is estimated at north of $150bn, including around $60bn (face value) in defaulted bonds (sovereign and state oil company PDVSA), other PDVSA obligations (e.g., suppliers’ debt), bilateral loans (e.g., with China, Russia), and multilateral debt, with significant unpaid interest as well as legal claims from expropriation cases compounding the total since the 2017 default.
Venezuela bond prices rallied following the US military operation Venezuela and PDVSA bond price, bp
VENZ Oct-24
VENZ Oct-26
VENZ Jan-34
PDVSA Nov-26
PDVSA May-35
Source: Bloomberg, Goldman Sachs GIR.
Source: IMF, Goldman Sachs GIR.
Likely limited economic and financial spillovers…
It therefore comes as no surprise that the economic and financial linkages between Venezuela and the rest of LatAm have become minor. Accordingly, we do not anticipate major economic spillovers from the situation in Venezuela to the rest
operation
Venezuela bond prices rallied in 4Q25 on expectations that rising US pressure and military buildup would eventually lead to regime change. And the initial market rection to the January 3 US airstrikes was positive. Indeed, defaulted Venezuelan bond prices rallied 8-9pts (including PDVSA) on January 5 on expectations of a brighter outlook for Venezuela’s economy and oil sector as well as the potential for debt restructuring. However, bond prices have since given back some of these gains due to the complex and still highly uncertain economic and political picture, the perception that debt restructuring may not be a near-term priority, President Trump’s executive order protecting Venezuelan oil revenue held in US Treasury accounts, and bond valuations commensurate with lowerbound recovery levels. The market debate has now shifted to “what type of restructuring” and when and with whom creditors will eventually be negotiating.
*We use OPEC data on proven crude oil reserves as of 2024 for all the countries above except Canada, where we use Energy Inst itute proven reserves estimates as of 2020 (latest available).
Sources: OPEC, Energy Institute, s econdary s ources, S&P Global Energy, Goldman Sachs GIR. Special thanks to GS Commodities Research team for charts.
Q&A on implications for Venezuelan oil
Neil Mehta and Daan Struyven answer key questions about the implications of US plans to revitalize Venezuela’s oil sector 1
Q: What’s the size of the opportunity for the oil industry of the US’ plan to revitalize Venezuela’s oil sector?
A: Venezuela accounts for roughly one-fifth of the world's proven oil reserves2 , yet its production is constrained at ~800900kb/d, which is less than ~1% of global output. The Trump Administration has called for ~$100bn of investment into the country over the next decade to rebuild infrastructure and bring production back to peak levels of ~3mb/d. We believe gains of a few hundred thousand barrels per day are achievable in the near term. Specifically, we expect Venezuelan crude production to rise by 0.2mb/d over the next 12m (from 0.8-0.9mb/d in Dec 2025) as an anticipated easing of sanctions and modest investment in existing assets help ease some operational bottlenecks. We expect production to rise by an additional 0.2mb/d by 2030 (to 1.3mb/d). But a complete restoration of the country’s output to ~3mb/d would likely extend into the next decade and require significant capital investment. Some estimates suggest an initial ~$5-10bn of capital investment over the next 2-3 years could yield an additional ~500kb/d in Venezuela, but the subsequent ~1mb/d would require an estimated ~$70-80bn Upstream production expansions would also require a reactivation of damaged upgraders that process heavy crude, extension of pipeline infrastructure, investments in the power grid, and continued political stability.
We expect a modest increase in Venezuelan crude supply Venezuelan crude supply, mb/d
Venezuelan barrels could displace Canadian heavy crude on the Gulf Coast and result in wider WTI-WCS differentials
Q: How have US oil companies responded to these potential opportunities/risks so far?
A: Among the US Majors, Chevron is doubling its liftings from the country immediately and raising its production by 50% (or ~100kb/d) over the next 18-24 months. By contrast, ConocoPhillips and Exxon remain focused on recovering previous debt following the nationalization of their assets. Exxon has also publicly discussed its view that Venezuela is difficult to invest in without significant changes to the legal and commercial environment. Among oilfield services companies, SLB has discussed its ability to scale quickly as needed in the country, as it currently has operations on the ground. Halliburton and Weatherford have also commented on their ability and interest in allocating resources to Venezuela if activity and production ramp up.
Q: How much of the upside/downside of these developments is already priced into stocks?
A: Energy equities reacted sharply on the back of the initial Venezuela headlines, including the stocks of US majors, US refiners, international service companies, and Canadian oil producers. While we believe the latest developments are now largely reflected in the equities, we continue to highlight strong fundamentals across the energy complex.
Source: Secondary sources, Goldman Sachs GIR.
Q: What types of companies could be harmed by the revitalization of the Venezuelan oil industry?
A: On a relative basis, Canadian oil companies could be negatively impacted by higher oil production from Venezuela. In particular, Venezuelan barrels could displace Canadian heavy crude on the Gulf Coast and result in wider WTI-WCS differentials, which would reduce realized prices for Canadian producers.
1 The research views in this section are those of the analysts who cover the relevant areas. Equity research views are expressed by Neil Mehta, an Equity Research Analyst covering Americas Integrated Oil & Refiners. Commodities views are expressed by Daan Struyven, a Macro Research Analyst covering global commodities. 2 According to OPEC data.
Suncor Energy (SU)
Canadian Natural Resources (CNQ)
Cenovus Energy (CVE)
Energy equities reacted sharply on the back of the initial Venezuela headlines, including across US Majors…
Stocks of US Majors, index, Jan 2 close=100
CVX (Chevron)
COP (ConocoPhillips) XOM (Exxon Mobil)
captures Maduro Iran protests escalate
…international services…
Stocks of international services, index, Jan 2 close=100
SLB (SLB NV) WFRD (Weatherford) BKR (Baker Hughes) HAL (Halliburton)
…US Gulf Coast refineries…
US captures Maduro
protests escalate
Stocks of US Gulf Coast refineries, index, Jan 2 close=100
Stocks of Canadian producers, index, Jan 2 close=100
CVE (Cenovus Energy)
CNQ (Canadian Natural Resources)
US captures Maduro Iran protests escalate Trump threatens tariffs on Iran trade partners
Source: Bloomberg, Goldman Sachs GIR.
Q: What, if anything, are investors underappreciating about the potential impacts of the Venezuela developments for US oil companies?
A: Given the state of Venezuela’s energy infrastructure which has deteriorated amid underinvestment investors may be underestimating the challenges associated with sustainably ramping Venezuelan volumes. We also believe the scale of investment required to increase their Venezuelan presence as well as the political and legal risks of doing so could deter companies from making significant new capital commitments in the country, which is a major reason we expect an only modest increase in Venezuela’s production by 2030.
Q: What are you watching most closely ahead to gauge how this could all play out for the US oil industry?
A: Despite the recent developments in Venezuela, the outlook for the US oil industry should remain largely unchanged from our base case scenario, with three primary forces continuing to drive the industry’s trajectory. First, after rising from 5-6mb/d in early 2000s to 14mb/d of crude today, the industry is now entering a period of slowing growth and maturity. Accordingly, US producers will likely focus on harvesting cash flow domestically, investing in international exploration, and driving consolidation through M&A.
Second, the larger companies have structural advantages of scale and the ability to execute an international development plan. That leaves the US majors, as well as international services companies, well-positioned for growth Third, we believe that refiners are structurally well-positioned on a multiyear basis as crack spreads are likely to remain above historical averages and global oil demand is expected to outpace new capacity additions between now and 2030.
Q: What could the Venezuela developments mean for oil prices?
A: We estimate that the 0.2mb/d increase in Venezuelan oil production we expect over the next 12m will have a $1 impact on Brent/WTI prices this year (baseline forecast of $56/$52/bbl average 2026 prices vs. $57/$53/bbl in a scenario of flat production). But the impact on long-run oil prices will likely be more significant. We estimate that the cumulative 0.4mb/d increase in Venezuelan production we expect by 2030 will have a $2 impact on long-term oil prices. This, together with higher expected US and Russian production, led us to lower our longrun Brent/WTI price forecasts to $75/$71/bbl earlier this month (2030-35, from $80/$76/bbl). We estimate that a larger recovery in Venezuelan production to 2mb/d by 2030 would pose $3 of downside to these revised forecasts
Neil Mehta, Head of North American Natural Resources Equity Research
Email: neil.mehta@gs.com
Tel: 212-357-4042
Daan Struyven, Co-head of Global Commodities Research
Email: daan.struyven@gs.com
Tel: 212-357-4172
Greenland’s strategic value, mapped out
Source: Bloomberg, USGS, GEUS, Goldman Sachs GIR. Special thanks to GS Commodities Research team for charts.
Interview with Ivan Krastev
Ivan Krastev is Chair of the Centre for Liberal Strategies in Sofia, Bulgaria. Below, he argues that US-Europe relations have reached a turning point, but not a breaking point The views stated herein are those of the interviewee and do not necessarily reflect those of Goldman Sachs.
Allison Nathan: Do the Greenland developments mark a turning point in US-Europe relations?
Ivan Krastev: They mark a turning point but not a breaking point because alliances don't exist on paper, but in the minds of the public and policymakers. And the Greenland story, combined with the Trump Administration’s recently-released national security strategy and Venezuela actions, have substantially shifted how Europe views transatlantic relations. I was part of a recent European Council on Foreign Relations group that conducted global polling revealing that only 16% of Europeans see the US as an ally, while 20% view it as a rival, with most others seeing it as only a necessary partner. This marks a big shift from the past.
The Greenland issue has been especially difficult for Europeans to digest because the Danes are ready to cooperate with the US on almost anything it wanted from a security and even economic perspective. And the Danish government is one of the most pro-Atlantic governments in the European Union. So, Europeans are shockingly no longer sure about three things: one, the extent to which the Trump Administration believes that its relationships with Russia and Europe would be more difficult in NATO’s absence; two, that one of the objectives of US trade policies is not the European Union’s destruction; and, three, that the EU would be able to count on the US in times of major crisis, which was a key part of the magic of NATO.
Allison Nathan: So, why isn’t this a breaking point?
Ivan Krastev: First of all, it's one thing to understand that your marriage is not working in the same way as before, but it's completely different to imagine what divorced life would look like. Europe is too dependent on the US not only for its security, but also technologically and economically, to prefer the divorced life today. And the stakes are too high to find out what such a life would look like, with the very survival of the European project on the line. Remember that the European Union was largely an American project. In the moment of crisis, Americans played a critical role in securing European unity.
Second, some Europeans believe that Trump’s actions don’t reflect the consensus among American society or the elite, and point to the walking back of the potential use of military force in Greenland as evidence of the constraints Trump faces. So, Europeans believe that when they stand against Trump on this issue, they are not standing against America. Third, while Trump has strong allies within some European countries on issues like immigration, they have not sided with him on Greenland because no European leader can convince their voters that the US getting its way in Greenland is in Europe’s best interest. It’s noteworthy that the European Parliament stalled ratification of the US-EU trade deal, and all MPs, from the mainstream parties to the nationalistic right, applauded the decision to stand behind Denmark and Greenland.
Now, this is largely about territory for both sides. But while Trump views land from the lens of a real estate manager, European countries, especially small ones, view land as a critically important part of their national sovereignty, and the idea that small countries don’t matter is not good news for anyone in Europe. So, European leaders agree that caving on Greenland would be disastrous for Europe and its credibility. In that light, this issue has strengthened European unity. And Europe’s weakness paradoxically means that it cannot not retaliate when it comes to this red line, because its weakness would be exposed. My sense is that Trump initially miscalculated on this point but now seems to understand it.
Allison Nathan: How could US-Europe relations evolve?
Ivan Krastev: The relationship looks to be headed for a rocky period, but not a divorce. For Europe, while there is much talk about finding new allies, aligning with others won’t be a quick or easy process. The European Parliament essentially blocking the EU-Mercosur trade deal shows that too many competing interests exist among EU countries. And I’m skeptical that Europe and China will suddenly have a smoother relationship just because the US-Europe marriage has hit hard times. Instead, Europe will be focused on showing the US that Europe matters, not only because it can be helpful to the US, but also because it can be harmful. One action Europe can take to show that it is strong and serious about consolidating its economic power is making major progress on capital market integration Europe will also look inward in terms of focusing on building up its defenses, but here too it will encounter difficulties. Europe is struggling against time, and the blame doesn’t lie with Trump. 15 years ago, then US Secretary of Defense Robert Gates warned Europe that the US would not pay for Europe’s defense if it wasn’t willing to increase its defense budgets, which Europeans chose to ignore, and now time is not on its side. But Europe’s biggest problem is that budgets don't fight wars people do. And Europe culturally is not prepared for the more hostile world it now finds itself in. That said, some European countries are taking their defense more seriously, and I expect closer cooperation among those countries, especially those closest to the Ukrainian crisis, as well as Germany and France in its capacity as the only European nuclear power. The Greenland issue has also brought the UK closer to the EU on defense, which will be critically important in bolstering European defense capabilities.
For the US, midterm elections loom large, which I suspect will continue to serve as a constraint on the Administration’s actions. So, both the US and Europe will likely look for ways to de-escalate tensions and compromise, as has already begun But the trust between the US and Europe has been broken, not just because of Greenland but also because of Ukraine in terms of US policy related to the conflict, and the broader US treatment of Europe. So, I don’t expect the relationship to go back to the way it was even if, as we’ve discussed, the current moment doesn’t prove to be a breaking point.
When geopolitics meets portfolios
Christian Mueller-Glissmann discusses how to navigate and hedge against geopolitical risk
Geopolitical risk has returned to the forefront following the recent developments around Venezuela, Iran, and Greenland, and is likely to remain there for some time as the US continues to reshape its geopolitical and economic relationships with the world. This has raised questions about how investors can protect themselves from geopolitical shocks, which can have material impacts on global growth, inflation, and sentiment, especially as the linkages between economies and markets have become increasingly complex. Rather than try to time geopolitical shocks, which can be difficult, we think robust portfolio construction and diversification should be investors’ first line of defense.
Geopolitical shocks: rhyming, but seldom repeating
While geopolitical shocks are a key risk for portfolios, they tend to differ every time and are particularly difficult to position for as the timing and potential economic and market impacts are hard to anticipate. Geopolitical tensions can also linger for a long time before they escalate. To further complicate matters, geopolitical shocks often start out as local shocks but can extend globally and have lasting knock-on effects.
The broader macro backdrop also affects how markets react to geopolitical shocks. We find an imperfect relationship between the news-based Geopolitical Risk Index and equity volatility, with an increase in geopolitical tensions often leading to higher but not extreme volatility. Geopolitical risks alone have seldom pushed the VIX above 40. But the combination of such risks and an already-weak macro backdrop has often sent volatility sharply higher. A more resilient US economy and a Fed able to buffer negative growth shocks may help markets digest geopolitical shocks better today, though low volatility, elevated equity valuations, and bullish investor sentiment to start the year increase the risk of a volatility spike.
The individual asset impacts of geopolitical shocks can also vary. Historically, large geopolitical shocks like the Middle East wars have driven oil prices sharply higher, often resulting in a worsening global growth/inflation mix. By contrast, oil prices have remained in a downtrend amid the recent geopolitical developments due to excess supply, with the Dollar also weakening as investors have become more concerned about US assets.
Finally, the inherent unpredictability of geopolitical events, including the possibility of a reversal of the shock, creates material market timing risk. Equities on average have recovered and risen after geopolitical shocks. In some cases, uncertainty can decline rapidly as more information becomes available or a policy pivot occurs, which can drive sharp equity recoveries, as happened around “Liberation Day” last April, which showcased the difficulty of timing equity moves.
Protecting portfolios: diversify, don’t time
Given these challenges, investors’ first line of defense against geopolitical shocks should be robust portfolio construction and diversification. In a balanced multi-asset portfolio, bonds can provide a buffer for risky assets against unanticipated growth
shocks. However, bonds become a less effective hedge if the geopolitical shock increases inflation risk. US policy uncertainty and global fiscal risks have also weighed on bonds, with recent concerns about potential fiscal expansion in Japan increasing the upward pressure on long-dated bond yields globally. Longdated bonds may provide a smaller buffer for risky assets going forward if fiscal risks persist.
Investors can also turn to other global safe haven assets like the Swiss Franc, which has become a more effective “risk-off” hedge vs. the Euro in periods of rising geopolitical risk. But it’s important to keep in mind that while safe haven assets tend to outperform during risk-off episodes, they usually have lower returns through the cycle. So, as with bonds, investors need to consider the tradeoffs between risk reduction and returns.
Increased allocations to assets that could benefit from an escalating shock can also buffer geopolitical risk. Commodities like oil and gold have often been useful diversifiers in periods of geopolitical uncertainty, though their hedge value can vary depending on the drivers (if there are oil supply disruptions, for example) and again they tend to have relatively low riskadjusted returns over longer horizons. That said, gold and precious metals more broadly have recently helped buffer both geopolitical and fiscal risks, with higher central bank demand further boosting their risk-adjusted returns. Defense stocks are another potential beneficiary of geopolitical shocks (see pg. 20).
Investors can also manage geopolitical risk by avoiding or reducing direct and indirect exposures. This could include avoiding the country/region facing elevated geopolitical risk or large energy consumers (in the event of sharply higher oil prices) as well as reducing indirect exposure from trade linkages. With global investor portfolios currently dominated by US assets due to their large weights in equity and bond benchmarks, investors could also increase home bias in portfolios to reduce FX risk, though the potential impacts of large shifts out of US assets on portfolio returns and risk should be carefully considered.
Finally, the fact that geopolitical shocks can reverse quickly suggests that options can be a valuable hedge. Hedging tail risk with options can undoubtedly be expensive, making prolonged exposure to risk management strategies that protect portfolios systematically unfeasible. That said, realized and implied volatility has been very low coming into the year, increasing the value of tactical portfolio overlay hedges.
So, for investors looking for ways to protect their portfolios from geopolitical shocks, the message is: diversify, don’t time. Specifically, we recommend more regional, sector, and style diversification relative to global benchmarks and like safe assets such as gold and selectively hedging Dollar risk. With the volatility reset, we also like shorter-dated rates receivers as a hedge for major growth shocks, credit payer spreads/VIX call spreads to hedge corrections, and longer-dated calls to maintain overweight equity allocations despite the potential for more geopolitical shocks.
Christian Mueller-Glissmann, Head of Asset Allocation Research
Email: christian.mueller-glissmann@gs.com Goldman Sachs International Tel: 44-20-7774-1714
The relationship between geopolitical risk and equity volatility is mixed VIX Index (lhs) vs. Geopolitical Risk Index (rhs), 1-month average
equities around geopolitical shocks has been very difficult Equity response to geopolitical shocks since 1970 (15 geopolitical shocks included)
Gulf War (Jan '91)
Liberation Day (Apr '25)
Average
Iraq invades Kuwait (Aug '90)
Ukraine invasion (Feb '22)
Yom Kippur war (Oct '73)
Geopolitical risk through the years
Geopolitical tensions, which take many different forms, are difficult to measure. One proxy for assessing the geopolitical environment is the news-based Geopolitical Risk Index developed by economists from the Federal Reserve Board.
Geopolitical Risk Index, 1900-2019=100
Geopolitical Risk Index, 1985-2019=100 Note: The
US nuclear weapons test (Operation Greenhouse) Berlin Crisis of 1961
EM assets: continued resilience
Kamakshya Trivedi discusses the outlook for EM assets amid elevated geopolitical risk
Geopolitical risks have dominated headlines in 2026, from developments in Venezuela and Iran to Greenland. Despite that, EM equities have started the year strong and have comfortably outpaced DM equity markets, EM currencies are among the top performers year-to-date, and EM rates and spreads have held on. We think this is indicative of the resilient upside that we expect out of EM this year. Indeed, despite heightened geopolitical risks and several upcoming elections, our global macro outlook of sturdy growth, low inflation, and further Fed cuts is a friendly one for EM assets, even if less intensely so than in 2025. Better local EM fundamentals and still-low global investor allocations should also support returns in 2026. Limited spillovers from Venezuela
Venezuelan developments while highly pertinent from a geopolitical standpoint have had limited spillovers in part because of limited exposure in EM investor portfolios. Political shifts can create significant volatility in local markets as seen in Argentina last year and the political ructions in Türkiye before that—but their relatively small share of aggregate EM portfolios typically limits any impact. Equally, the improvement in EM fundamentals in recent years solid growth, further inflation normalization, and scope for rate cuts as well as contained fiscal and current account positions has helped insulate the broader EM complex from political and geopolitical shocks.
A positive returns story for EM assets
We continue to expect positive returns for EM assets this year amid a friendly global macro backdrop. In particular, we expect EM equities to outperform DM equities again, though we look for more moderate returns of ~15% (vs. last year’s record 30% gains) driven primarily by solid earnings growth (19%/12% in 2026/2027) spread across the EM geographies. In EM FX, after the year of carry in 2025, we think that cyclical exposure via both equity and commodity price linkages will be as important as carry levels in 2026 for relative spot returns. This includes ZAR, CLP, and KRW, which have high betas to cyclical pricing and to the appreciation we expect in the CNY anchor and remain among the more undervalued currencies vs. USD In EM fixed income, the scope for deeper cutting cycles in EM high-yielders (like Hungary and Brazil) should provide the best opportunities in local rates. We remain defensive on EM sovereign credit, with total returns likely to be largely a function of yield given our expectation of a modest widening in very tight spreads.
EM assets as diversifiers
EM assets can also provide an attractive opportunity for investors given their role as diversifiers. In particular, EM assets can help balance AI exposure amid growing investor concerns about valuations. For example, within EM, while we continue to favor the tech-sensitive equity markets of Korea, Taiwan (strong semiconductor earnings), and Mainland China (AI-driven growth and external market share gains), we prefer rotating some portfolio weight into the more domestic-oriented equity markets of South Africa (where a cyclical growth recovery and easing rates should help laggard domestic sectors catch up to the miners), India (with its mass-consumption revival), and
Brazil (where rate cuts should drive further gains).
EM has seen a broad-based rally this year Returns, %, USD
YTD return (USD) % upside (end-2026, GSe)
*MSCI weight in tech/hardware, semis, internet, software, m edia/entertainment
Source: FactSet, Goldman Sachs GIR.
Uncorrelated risks and returns on the EM Frontier Frontier markets also provide a source of returns that are relatively uncorrelated to the broader macro backdrop (although they come with their own risks, as Venezuela shows). Amid renewed geopolitical risks and the potential for higher volatility this year, we think that Frontier currencies continue to represent an attractive investment proposition in a more rangebound Dollar environment owing to elevated carry levels together with low correlation to Dollar strength and global macro volatility relative to other EM counterparts.
In particular, given still-healthy GSDEER model valuations and our economists' constructive external outlook, we favor carry longs in CEEMEA, including EGP, NGN, and KES, where risks are skewed toward appreciation given historically high FX reserves. Specifically, a still-cautious central bank in Egypt, which could keep real rates elevated for longer than we previously expected, led us to recently extend the target on our short USD/EGP trade recommendation (opened last July). And in Türkiye, we expect TRY monthly total returns to remain around 1-1.5% as a slight reduction in carry is offset by a decline in the pace of nominal depreciation amid slowing yearon-year inflation. The main risk to this constructive view is elevated positioning in still-relatively illiquid FX markets that could reverse sharply on a negative shock. Finally, we expect ARS to weaken along wider FX flotation bands given Argentine policymakers’ objective to rapidly accumulate international reserves this year from critically low levels.
Frontier currencies are less correlated with USD and global vol Last six-month correlation of 12m forwards
Note: We take log changes of all series before computing correlations. *Median of BRL, COP, MXN, and ZAR.
Source: Goldman Sachs GIR.
Kamakshya Trivedi, Chief FX & EM Strategist
Email: kamakshya.trivedi@gs.com Goldman Sachs International
Tel: 44-20-7051-4005
Q&A on defense sector geopolitical risk
We ask our equity analysts about the potential implications of elevated geopolitical risk for the defense sector.
US Defense
Q: Is the upside for defense stocks on the back of elevated geopolitical risk already fully priced in?
A: A lot of upside is priced in some stocks, but it is not fully priced across the sector. The US Defense sector has outperformed yearto-date on the back of geopolitical developments and statements from the White House regarding potentially much higher defense budgets. The Administration currently appears to want to further grow the US defense budget, but efforts are also underway to shift more financial and technology development risk onto the industrial base, creating a somewhat mixed picture for defense firms’ financials. Product category prioritizations are also driving different growth profiles across verticals and individual companies in the sector. And with the US defense budget already at an all-time high and questions remaining about the appropriate level of US government spending, the annual level of defense spending will continue to be debated notwithstanding the clear focus on national security. Valuations at the sector level are on average above their historical midpoint but below their highs, with enough dispersion at the company level to still find value.
Q: Where does value remain in the sector?
A: We see value in stocks leveraged to product and vertical prioritizations that have growth and margin upside potential (rather than facing more financial risk as the Administration and Pentagon seek to shift more of the investment burden onto firms) and trade at relatively attractive valuations. We also see value in select Defense Tech companies
Q: What key catalysts are you watching to realize the upside?
A: The White House recently discussed the possibility of a much higher US defense budget. The government typically makes its official budget request for the next fiscal year in the spring, which then goes through the congressional armed services committees through the summer, and should be finalized by the fall. Where that budget ultimately lands will go a long way toward informing future growth. We’re also watching the moving pieces under the hood to continue to understand the verticals and products in higher demand. New Administration frameworks have been incrementally informing major changes in the Pentagon’s defense procurement process, capital requirements, and risk sharing processes. And Defense budgets have been rising in other places, especially Europe, which will impact defense companies in those regions as well as US companies given that other countries procure military technologies from the US.
Q: Is the upside for defense stocks on the back of elevated geopolitical risk already fully priced in?
A: No. While geopolitical tensions, alongside an increasingly fractious NATO alliance, have driven a sharp re-rating in European defense equities with the GS EU Defense basket (GSSBDEFE) up over 20% year-to-date we still see value in the sector. On growth-adjusted metrics, European defense valuations remain materially cheaper than US peers, with the discount currently at one of the highest points over the past three years. As a result, we would push back on the idea of a European defense bubble the sector has clearly re-rated, but valuations are not uniformly stretched
Q: What key catalysts are you watching to realize the upside?
A: As global geopolitical developments continue to emerge, we are watching for catalysts that reinforce defense spending as a necessary “insurance” outlay rather than a discretionary budget item for European policymakers. We are also keeping an eye on European defense budgets as well as disbursements from the ~€150bn European Security Action for Europe (SAFE) fund, a financial instrument providing loans to EU member states for defense procurement, which should drive meaningful orders for European primes. And we will be monitoring European primes’ ability to expand capacity and meet demand in the new environment of increased military spending
Noah Poponak, GS Equity Research
European Defense
Sam Burgess, GS Equity Research
Summary of our key forecasts
Glossary of GS proprietary indices
Current Activity Indicator (CAI)
GS CAIs measure the growth signal in a broad range of weekly and monthly indicators, offering an alternative to Gross Domestic Product (GDP). GDP is an imperfect guide to current activity: In most countries, it is only available quarterly and is released with a substantial delay, and its initial estimates are often heavily revised. GDP also ignores important measures of real activity, such as employment and the purchasing managers’ indexes (PMIs). All of these problems reduce the effectiveness of GDP for investment and policy decisions. Our CAIs aim to address GDP’s shortcomings and provide a timelier read on the pace of growth.
For more, see our CAI page and Global Economics Comment: Technical Updates to Our Global CAIs
Dynamic Equilibrium Exchange Rates (DEER)
The GSDEER framework establishes an equilibrium (or “fair”)
terms-of-trade differentials.
For more, see our GSDEER page,
Financial Conditions Index (FCI)
GS FCIs gauge the “looseness” or “tightness” of financial conditions across the world’s major economies, incorporating variables that directly affect spending on domestically produced goods and services. FCIs can provide valuable information about the economic growth outlook and the direct and indirect effects of monetary policy on real economic activity.
FCIs for the G10 economies are calculated as a weighted average of a policy rate, a long-term risk-free bond yield, a corporate credit spread, an equity price variable, and a trade-weighted exchange rate; the Euro area FCI also includes a sovereign credit spread. The weights mirror the effects of the financial variables on real GDP growth in our models over a one-year horizon. FCIs for emerging markets are calculated as a weighted average of a short-term interest rate, a long-term swap rate, a CDS spread, an equity price variable, a trade-weighted exchange rate, and in economies with large foreign-currency-denominated debt stocks a debt-weighted exchange rate index.
For more, see our FCI page, Global Economics Analyst: Our New G10 Financial Conditions Indices, 20 April 2017, and Global Economics Analyst: Tracking EM Financial Conditions – Our New FCIs, 6 October 2017
Goldman Sachs Analyst Index (GSAI)
The US GSAI is based on a monthly survey of GS equity analysts to obtain their assessments of business conditions in the industries they follow. The results provide timely “bottom-up” information about US economic activity to supplement and crosscheck our analysis of “top-down” data. Based on analysts’ responses, we create a diffusion index for economic activity comparable to the ISM’s indexes for activity in the manufacturing and nonmanufacturing sectors.
Macro-Data Assessment Platform (MAP)
GS MAP scores facilitate rapid interpretation of new data releases for economic indicators worldwide. MAP summarizes the importance of a specific data release (i.e., its historical correlation with GDP) and the degree of surprise relative to the consensus forecast. The sign on the degree of surprise characterizes underperformance with a negative number and outperformance with a positive number. Each of these two components is ranked on a scale from 0 to 5, with the MAP score being the product of the two, i.e., from -25 to +25. For example, a MAP score of +20 (5;+4) would indicate that the data has a very high correlation to GDP (5) and that it came out well above consensus expectations (+4), for a total MAP value of +20.
Top of Mind archive: click to access
Special Issue
2025: 4 themes in charts
December 15, 2025
Issue 144
The US-China tech race
December 4, 2025
Issue 143
AI: in a bubble?
October 22, 2025
Issue 142
Data (un)reliability September 11, 2025
Issue 141
Stablecoin summer August 19, 2025
Issue 140
US fiscal worries: Is this time different?
June 12, 2025
Issue 139
Fed independence: how concerning? May 15, 2025
Issue 138
Tariff-induced recession risk April 17, 2025
Issue 137
Europe’s shifting security landscape
March 13, 2025
Issue 136
Trump tariffs: mostly talk, or big action?
February 26, 2025
Issue 135
High bond yields: here to stay? February 5, 2025
Special Issue
2024: 4 themes in charts
December 18, 2024
Issue 134
Will China's policy stimulus be enough? December 11, 2024
Issue 133
Market concentration: how big a worry? November 25, 2024
Issue 132
Post-election economic policies
October 21, 2024
Issue 131
Is the Fed behind the curve? September 3, 2024
Issue 130
How investable is Europe? August 1, 2024
Issue 129
Gen AI: too much spend, too little benefit? June 25, 2024
Issue 128
Central bank divergence room to run? May 21, 2024
Issue 127
Weighing the GLP-1 market
April 12, 2024
Issue 126
Global transit & trade: in rough waters March 12, 2024
Issue 125
2024: The year of elections February 1, 2024
Issue 124
Middle East risks
December 5, 2023
Issue 123
US outperformance: at a turning point? October 30, 2023
Issue 122
Commercial real estate risks October 9, 2023
Issue 121
Corporate credit concerns August 10, 2023
Issue 120
Generative AI: hype, or truly transformative? July 5, 2023
Issue 119
Daunting debt limit dynamics May 22, 2023
Issue 118
US-China: more decoupling ahead? May 1, 2023
Issue 117
All about bank(panic)s April 3, 2023
Issue 116
(Japanese) Bonds, Bonds, Bonds February 23, 2023
Issue 115
The Bigger Worry: Growth or Inflation? January 27, 2023
Special Issue
2022: 3 themes in charts December 15, 2022
Issue 114
The Winter of Crypto’s Discontents December 9, 2022
Disclosure Appendix
Reg AC
We, Allison Nathan, Jenny Grimberg, Ashley Rhodes, Christian Mueller-Glissmann, CFA, Alberto Ramos, Daan Struyven and Kamakshya Trivedi, hereby certify that all of the views expressed in this report accurately reflect our personal views, which have not been influenced by considerations of the firm's business or client relationships.
We, Neil Mehta, Noah Poponak, CFA and Sam Burgess, hereby certify that all of the views expressed in this report accurately reflect our personal views about the subject company or companies and its or their securities. We also certify that no part of our compensation was, is or will be, directly or indirectly, related to the specific recommendations or views expressed in this report. Unless otherwise stated, the individuals listed on the cover page of this report are analysts in Goldman Sachs' Global Investment Research division.
Rating and pricing information
AeroVironment Inc. (Buy, $307.75), BAE Systems (Buy, 2,027p), Beta Technologies (Buy, $25.15), CACI International Inc. (Buy, $662.19), Canadian Natural Resources Ltd. (Buy, $36.14), Cenovus Energy Inc. (Buy, $18.77), Chevron Corp. (Buy, $166.72), ConocoPhillips (Buy, $98.35), Huntington Ingalls Industries Inc. (Buy, $418.58), Imperial Oil Ltd. (Sell, C$138.55), Kratos (Buy, $110.39), L3Harris Technologies Inc. (Buy, $354.73), Leonardo DRS (Buy, $40.99), Lockheed Martin Corp. (Sell, $590.82), Northrop Grumman Corp. (Neutral, $672.95), Rheinmetall (Buy, €1,830.00), SLB (Buy, $49.15), Suncor Energy Inc. (Buy, $50.87), TechnipFMC Plc (Buy, $54.26) and Valero Energy Corp. (Buy, $187.09)
GS Factor Profile
The Goldman Sachs Factor Profile provides investment context for a stock by comparing key attributes to the market (i.e. our universe of rated stocks) and its sector peers. The four key attributes depicted are: Growth, Financial Returns, Multiple (e.g. valuation) and Integrated (a composite of Growth, Financial Returns and Multiple). Growth, Financial Returns and Multiple are calculated by using normalized ranks for specific metrics for each stock. The normalized ranks for the metrics are then averaged and converted into percentiles for the relevant attribute. The precise calculation of each metric may vary depending on the fiscal year, industry and region, but the standard approach is as follows:
Growth is based on a stock's forward-looking sales growth, EBITDA growth and EPS growth (for financial stocks, only EPS and sales growth), with a higher percentile indicating a higher growth company. Financial Returns is based on a stock's forwardlooking ROE, ROCE and CROCI (for financial stocks, only ROE), with a higher percentile indicating a company with higher financial returns. Multiple is based on a stock's forward-looking P/E, P/B, price/dividend (P/D), EV/EBITDA, EV/FCF and EV/Debt Adjusted Cash Flow (DACF) (for financial stocks, only P/E, P/B and P/D), with a higher percentile indicating a stock trading at a higher multiple. The Integrated percentile is calculated as the average of the Growth percentile, Financial Returns percentile and (100%Multiple percentile).
Financial Returns and Multiple use the Goldman Sachs analyst forecasts at the fiscal year-end at least three quarters in the future. Growth uses inputs for the fiscal year at least seven quarters in the future compared with the year at least three quarters in the future (on a per-share basis for all metrics).
For a more detailed description of how we calculate the GS Factor Profile, please contact your GS representative.
M&A Rank
Across our global coverage, we examine stocks using an M&A framework, considering both qualitative factors and quantitative factors (which may vary across sectors and regions) to incorporate the potential that certain companies could be acquired. We then assign a M&A rank as a means of scoring companies under our rated coverage from 1 to 3, with 1 representing high (30%-50%) probability of the company becoming an acquisition target, 2 representing medium (15%-30%) probability and 3 representing low (0%-15%) probability. For companies ranked 1 or 2, in line with our standard departmental guidelines we incorporate an M&A component into our target price. M&A rank of 3 is considered immaterial and therefore does not factor into our price target, and may or may not be discussed in research.
Quantum
Quantum is Goldman Sachs' proprietary database providing access to detailed financial statement histories, forecasts and ratios. It can be used for in-depth analysis of a single company, or to make comparisons between companies in different sectors and markets.
Disclosures
Option Specific Disclosures
Price target methodology: Please refer to the analyst’s previously published research for methodology and risks associated with equity price targets.
Pricing Disclosure: Option prices and volatility levels in this note are indicative only, and are based on our estimates of recent midmarket levels(unless otherwise noted). All prices and levels exclude transaction costs unless otherwise stated.
General Options Risks – The risks below and any other options risks mentioned in this research report pertain both to specific derivative trade recommendations mentioned and to discussion of general opportunities and advantages of derivative strategies Unless otherwise noted, options strategies mentioned in this report may be a combination of the strategies below and therefore carry with them the risks of those strategies.
Buying Options - Investors who buy call (put) options risk loss of the entire premium paid if the underlying security finishes below (above) the strike price at expiration. Investors who buy call or put spreads also risk a maximum loss of the premium paid. The maximum gain on a long call or put spread is the difference between the strike prices, less the premium paid.
Selling Options - Investors who sell calls on securities they do not own risk unlimited loss of the security price less the strike price. Investors who sell covered calls (sell calls while owning the underlying security) risk having to deliver the underlying security or pay the difference between the security price and the strike price, depending on whether the option is settled by physical delivery or cash-settled. Investors who sell puts risk loss of the strike price less the premium received for selling the put. Investors who sell put or call spreads risk a maximum loss of the difference between the strikes less the premium received, while their maximum gain is the premium received.
For options settled by physical delivery, the above risks assume the options buyer or seller, buys or sells the resulting securities at the settlement price on expiry.
Distribution of ratings/investment banking relationships
Goldman Sachs Investment Research global Equity coverage universe
As of January 1, 2026, Goldman Sachs Global Investment Research had investment ratings on 3,055 equity securities. Goldman Sachs assigns stocks as Buys and Sells on various regional Investment Lists; stocks not so assigned are deemed Neutral. Such assignments equate to Buy, Hold and Sell for the purposes of the above disclosure required by the FINRA Rules. See 'Ratings, Coverage universe and related definitions' below. The Investment Banking Relationships chart reflects the percentage of subject companies within each rating category for whom Goldman Sachs has provided investment banking services within the previous twelve months.
Regulatory disclosures
Disclosures required by United States laws and regulations
See company-specific regulatory disclosures above for any of the following disclosures required as to companies referred to in this report: manager or co-manager in a pending transaction; 1% or other ownership; compensation for certain services; types of client relationships; managed/co-managed public offerings in prior periods; directorships; for equity securities, market making and/or specialist role. Goldman Sachs trades or may trade as a principal in debt securities (or in related derivatives) of issuers discussed in this report.
The following are additional required disclosures: Ownership and material conflicts of interest: Goldman Sachs policy prohibits its analysts, professionals reporting to analysts and members of their households from owning securities of any company in the analyst's area of coverage. Analyst compensation: Analysts are paid in part based on the profitability of Goldman Sachs, which includes investment banking revenues. Analyst as officer or director: Goldman Sachs policy generally prohibits its analysts, persons reporting to analysts or members of their households from serving as an officer, director or advisor of any company in the analyst's area of coverage. Non-U.S. Analysts: Non-U.S. analysts may not be associated persons of Goldman Sachs & Co. LLC and therefore may not be subject to FINRA Rule 2241 or FINRA Rule 2242 restrictions on communications with a subject company, public appearances and trading in securities covered by the analysts.
Additional disclosures required under the laws and regulations of jurisdictions other than the United States
The following disclosures are those required by the jurisdiction indicated, except to the extent already made above pursuant to United States laws and regulations. Australia: Goldman Sachs Australia Pty Ltd and its affiliates are not authorised deposit-taking institutions (as that term is defined in the Banking Act 1959 (Cth)) in Australia and do not provide banking services, nor carry on a banking business, in Australia. This research, and any access to it, is intended only for "wholesale clients" within the meaning of the Australian Corporations Act, unless otherwise agreed by Goldman Sachs. In producing research reports, members of Global Investment Research of Goldman Sachs Australia may attend site visits and other meetings hosted by the companies and other entities which are the subject of its research reports. In some instances the costs of such site visits or meetings may be met in part or in whole by the issuers concerned if Goldman Sachs Australia considers it is appropriate and reasonable in the specific circumstances relating to the site visit or meeting. To the extent that the contents of this document contains any financial product advice, it is general advice only and has been prepared by Goldman Sachs without taking into account a client's objectives, financial situation or needs. A client should, before acting on any such advice, consider the appropriateness of the advice having regard to the client's own objectives, financial situation and needs. A copy of certain Goldman Sachs Australia and New Zealand disclosure of interests and a copy of Goldman Sachs’ Australian Sell-Side Research Independence Policy Statement are available
at: https://www.goldmansachs.com/disclosures/australia-new-zealand/index.html Brazil: Disclosure information in relation to CVM Resolution n. 20 is available at https://www.gs.com/worldwide/brazil/area/gir/index.html. Where applicable, the Brazil-registered analyst primarily responsible for the content of this research report, as defined in Article 20 of CVM Resolution n. 20, is the first author named at the beginning of this report, unless indicated otherwise at the end of the text. Canada: This information is being provided to you for information purposes only and is not, and under no circumstances should be construed as, an advertisement, offering or solicitation by Goldman Sachs & Co. LLC for purchasers of securities in Canada to trade in any Canadian security. Goldman Sachs & Co. LLC is not registered as a dealer in any jurisdiction in Canada under applicable Canadian securities laws and generally is not permitted to trade in Canadian securities and may be prohibited from selling certain securities and products in certain jurisdictions in Canada. If you wish to trade in any Canadian securities or other products in Canada please contact Goldman Sachs Canada Inc., an affiliate of The Goldman Sachs Group Inc., or another registered Canadian dealer. Hong Kong: Further information on the securities of covered companies referred to in this research may be obtained on request from Goldman Sachs (Asia) L.L.C. India: Further information on the subject company or companies referred to in this research may be obtained from Goldman Sachs (India) Securities Private Limited, Research Analyst - SEBI Registration Number INH000001493, 10th Floor, AscentWorli, Sudam Kalu Ahire Marg, Worli, Mumbai-400 025, India, Corporate Identity Number U74140MH2006FTC160634, Phone +91 22 6616 9000, Fax +91 22 6616 9001. Goldman Sachs may beneficially own 1% or more of the securities (as such term is defined in clause 2 (h) the Indian Securities Contracts (Regulation) Act, 1956) of the subject company or companies referred to in this research report. Investment in securities market are subject to market risks. Read all the related documents carefully before investing. Registration granted by SEBI and certification from NISM in no way guarantee performance of the intermediary or provide any assurance of returns to investors. Goldman Sachs (India) Securities Private Limited compliance officer and investor grievance contact details can be found at: https://www.goldmansachs.com/worldwide/india/documents/Grievance-Redressal-andEscalation-Matrix.pdf, and a copy of the annual audit compliance report can be found at this link: https://publishing.gs.com/content/site/india-annual-compliance-report.html Japan: See below. Korea: This research, and any access to it, is intended only for "professional investors" within the meaning of the Financial Services and Capital Markets Act, unless otherwise agreed by Goldman Sachs. Further information on the subject company or companies referred to in this research may be obtained from Goldman Sachs (Asia) L.L.C., Seoul Branch. New Zealand: Goldman Sachs New Zealand Limited and its affiliates are neither "registered banks" nor "deposit takers" (as defined in the Reserve Bank of New Zealand Act 1989) in New Zealand. This research, and any access to it, is intended for "wholesale clients" (as defined in the Financial Advisers Act 2008) unless otherwise agreed by Goldman Sachs. A copy of certain Goldman Sachs Australia and New Zealand disclosure of interests is available at: https://www.goldmansachs.com/disclosures/australia-new-zealand/index.html Russia: Research reports distributed in the Russian Federation are not advertising as defined in the Russian legislation, but are information and analysis not having product promotion as their main purpose and do not provide appraisal within the meaning of the Russian legislation on appraisal activity. Research reports do not constitute a personalized investment recommendation as defined in Russian laws and regulations, are not addressed to a specific client, and are prepared without analyzing the financial circumstances, investment profiles or risk profiles of clients. Goldman Sachs assumes no responsibility for any investment decisions that may be taken by a client or any other person based on this research report. Singapore: Goldman Sachs (Singapore) Pte. (Company Number: 198602165W), which is regulated by the Monetary Authority of Singapore, accepts legal responsibility for this research, and should be contacted with respect to any matters arising from, or in connection with, this research. Taiwan: This material is for reference only and must not be reprinted without permission. Investors should carefully consider their own investment risk. Investment results are the responsibility of the individual investor. United Kingdom: Persons who would be categorized as retail clients in the United Kingdom, as such term is defined in the rules of the Financial Conduct Authority, should read this research in conjunction with prior Goldman Sachs research on the covered companies referred to herein and should refer to the risk warnings that have been sent to them by Goldman Sachs International. A copy of these risks warnings, and a glossary of certain financial terms used in this report, are available from Goldman Sachs International on request.
European Union and United Kingdom: Disclosure information in relation to Article 6 (2) of the European Commission Delegated Regulation (EU) (2016/958) supplementing Regulation (EU) No 596/2014 of the European Parliament and of the Council (including as that Delegated Regulation is implemented into United Kingdom domestic law and regulation following the United Kingdom’s departure from the European Union and the European Economic Area) with regard to regulatory technical standards for the technical arrangements for objective presentation of investment recommendations or other information recommending or suggesting an investment strategy and for disclosure of particular interests or indications of conflicts of interest is available at https://www.gs.com/disclosures/europeanpolicy.html which states the European Policy for Managing Conflicts of Interest in Connection with Investment Research.
Japan: Goldman Sachs Japan Co., Ltd. is a Financial Instrument Dealer registered with the Kanto Financial Bureau under registration number Kinsho 69, and a member of Japan Securities Dealers Association, Financial Futures Association of Japan Type II Financial Instruments Firms Association, The Investment Trusts Association, Japan, and Japan Investment Advisers Association. Sales and purchase of equities are subject to commission pre-determined with clients plus consumption tax. See company-specific disclosures as to any applicable disclosures required by Japanese stock exchanges, the Japanese Securities Dealers Association or the Japanese Securities Finance Company. Ratings, coverage universe and related definitions
Buy (B), Neutral (N), Sell (S) Analysts recommend stocks as Buys or Sells for inclusion on various regional Investment Lists. Being assigned a Buy or Sell on an Investment List is determined by a stock's total return potential relative to its coverage universe. Any stock not assigned as a Buy or a Sell on an Investment List with an active rating (i.e., a stock that is not Rating Suspended, Not Rated, Early-Stage Biotech, Coverage Suspended or Not Covered), is deemed Neutral. Each region manages Regional Conviction Lists, which are selected from Buy rated stocks on the respective region's Investment Lists and represent investment recommendations focused on the size of the total return potential and/or the likelihood of the realization of the return across their respective areas of coverage. The addition or removal of stocks from such Conviction Lists are managed by the Investment Review Committee or other designated committee in each respective region and do not represent a change in the analysts’ investment rating for such stocks.
Total return potential represents the upside or downside differential between the current share price and the price target, including all paid or anticipated dividends, expected during the time horizon associated with the price target. Price targets are required for all covered stocks. The total return potential, price target and associated time horizon are stated in each report adding or reiterating an Investment List membership.
Coverage Universe: A list of all stocks in each coverage universe is available by primary analyst, stock and coverage universe at https://www.gs.com/research/hedge.html
Not Rated (NR). The investment rating, target price and earnings estimates (where relevant) are removed pursuant to Goldman Sachs policy when Goldman Sachs is acting in an advisory capacity in a merger or in a strategic transaction involving this company, when there are legal, regulatory or policy constraints due to Goldman Sachs’ involvement in a transaction, and in certain other circumstances. Early-Stage Biotech (ES). An investment rating and a target price are not assigned pursuant to Goldman Sachs policy when this company neither has a drug, treatment or medical device that has passed a Phase II clinical trial nor a license to distribute a post-Phase II drug, treatment or medical device. Rating Suspended (RS). Goldman Sachs Research has suspended the investment rating and price target for this stock, because there is not a sufficient fundamental basis for determining an investment rating or target price. The previous investment rating and target price, if any, are no longer in effect for this stock and should not be relied upon. Coverage Suspended (CS). Goldman Sachs has suspended coverage of this company. Not Covered (NC). Goldman Sachs does not cover this company.
Global product; distributing entities
Goldman Sachs Global Investment Research produces and distributes research products for clients of Goldman Sachs on a global basis. Analysts based in Goldman Sachs offices around the world produce research on industries and companies, and research on macroeconomics, currencies, commodities and portfolio strategy. This research is disseminated in Australia by Goldman Sachs Australia Pty Ltd (ABN 21 006 797 897); in Brazil by Goldman Sachs do Brasil Corretora de Títulos e Valores Mobiliários S.A.; Public Communication Channel Goldman Sachs Brazil: 0800 727 5764 and / or contatogoldmanbrasil@gs.com. Available Weekdays (except holidays), from 9am to 6pm. Canal de Comunicação com o Público Goldman Sachs Brasil: 0800 727 5764 e/ou contatogoldmanbrasil@gs.com. Horário de funcionamento: segunda-feira à sexta-feira (exceto feriados), das 9h às 18h; in Canada by Goldman Sachs & Co. LLC; in Hong Kong by Goldman Sachs (Asia) L.L.C.; in India by Goldman Sachs (India) Securities Private Ltd.; in Japan by Goldman Sachs Japan Co., Ltd.; in the Republic of Korea by Goldman Sachs (Asia) L.L.C., Seoul Branch; in New Zealand by Goldman Sachs New Zealand Limited; in Russia by OOO Goldman Sachs; in Singapore by Goldman Sachs (Singapore) Pte. (Company Number: 198602165W); and in the United States of America by Goldman Sachs & Co. LLC. Goldman Sachs International has approved this research in connection with its distribution in the United Kingdom. Goldman Sachs International (“GSI”), authorised by the Prudential Regulation Authority (“PRA”) and regulated by the Financial Conduct Authority (“FCA”) and the PRA, has approved this research in connection with its distribution in the United Kingdom. European Economic Area: Goldman Sachs Bank Europe SE (“GSBE”) is a credit institution incorporated in Germany and, within the Single Supervisory Mechanism, subject to direct prudential supervision by the European Central Bank and in other respects supervised by German Federal Financial Supervisory Authority (Bundesanstalt für Finanzdienstleistungsaufsicht, BaFin) and Deutsche Bundesbank and disseminates research within the European Economic Area.
General disclosures
This research is for our clients only. Other than disclosures relating to Goldman Sachs, this research is based on current public information that we consider reliable, but we do not represent it is accurate or complete, and it should not be relied on as such. The information, opinions, estimates and forecasts contained herein are as of the date hereof and are subject to change without prior notification. We seek to update our research as appropriate, but various regulations may prevent us from doing so. Other than certain industry reports published on a periodic basis, the large majority of reports are published at irregular intervals as appropriate in the analyst's judgment.
Goldman Sachs conducts a global full-service, integrated investment banking, investment management, and brokerage business. We have investment banking and other business relationships with a substantial percentage of the companies covered by Global Investment Research. Goldman Sachs & Co. LLC, the United States broker dealer, is a member of SIPC (https://www.sipc.org).
Our salespeople, traders, and other professionals may provide oral or written market commentary or trading strategies to our clients and principal trading desks that reflect opinions that are contrary to the opinions expressed in this research. Our asset
management area, principal trading desks and investing businesses may make investment decisions that are inconsistent with the recommendations or views expressed in this research.
The analysts named in this report may have from time to time discussed with our clients, including Goldman Sachs salespersons and traders, or may discuss in this report, trading strategies that reference catalysts or events that may have a near-term impact on the market price of the equity securities discussed in this report, which impact may be directionally counter to the analyst's published price target expectations for such stocks. Any such trading strategies are distinct from and do not affect the analyst's fundamental equity rating for such stocks, which rating reflects a stock's return potential relative to its coverage universe as described herein.
We and our affiliates, officers, directors, and employees will from time to time have long or short positions in, act as principal in, and buy or sell, the securities or derivatives, if any, referred to in this research, unless otherwise prohibited by regulation or Goldman Sachs policy.
The views attributed to third party presenters at Goldman Sachs arranged conferences, including individuals from other parts of Goldman Sachs, do not necessarily reflect those of Global Investment Research and are not an official view of Goldman Sachs.
Any third party referenced herein, including any salespeople, traders and other professionals or members of their household, may have positions in the products mentioned that are inconsistent with the views expressed by analysts named in this report. This research is not an offer to sell or the solicitation of an offer to buy any security in any jurisdiction where such an offer or solicitation would be illegal. It does not constitute a personal recommendation or take into account the particular investment objectives, financial situations, or needs of individual clients. Clients should consider whether any advice or recommendation in this research is suitable for their particular circumstances and, if appropriate, seek professional advice, including tax advice. The price and value of investments referred to in this research and the income from them may fluctuate. Past performance is not a guide to future performance, future returns are not guaranteed, and a loss of original capital may occur. Fluctuations in exchange rates could have adverse effects on the value or price of, or income derived from, certain investments.
Certain transactions, including those involving futures, options, and other derivatives, give rise to substantial risk and are not suitable for all investors. Investors should review current options and futures disclosure documents which are available from Goldman Sachs sales representatives or at https://www.theocc.com/about/publications/characterrisks.jsp and https://www.goldmansachs.com/disclosures/cftc_fcm_disclosures. Transaction costs may be significant in option strategies calling for multiple purchase and sales of options such as spreads. Supporting documentation will be supplied upon request.
Differing Levels of Service provided by Global Investment Research: The level and types of services provided to you by Goldman Sachs Global Investment Research may vary as compared to that provided to internal and other external clients of GS, depending on various factors including your individual preferences as to the frequency and manner of receiving communication, your risk profile and investment focus and perspective (e.g., marketwide, sector specific, long term, short term), the size and scope of your overall client relationship with GS, and legal and regulatory constraints. As an example, certain clients may request to receive notifications when research on specific securities is published, and certain clients may request that specific data underlying analysts’ fundamental analysis available on our internal client websites be delivered to them electronically through data feeds or otherwise. No change to an analyst’s fundamental research views (e.g., ratings, price targets, or material changes to earnings estimates for equity securities), will be communicated to any client prior to inclusion of such information in a research report broadly disseminated through electronic publication to our internal client websites or through other means, as necessary, to all clients who are entitled to receive such reports.
All research reports are disseminated and available to all clients simultaneously through electronic publication to our internal client websites. Not all research content is redistributed to our clients or available to third-party aggregators, nor is Goldman Sachs responsible for the redistribution of our research by third party aggregators. For research, models or other data related to one or more securities, markets or asset classes (including related services) that may be available to you, please contact your GS representative or go to https://research.gs.com
Disclosure information is also available at https://www.gs.com/research/hedge.html or from Research Compliance, 200 West Street, New York, NY 10282.
You are permitted to store, display, analyze, modify, reformat, and print the information made available to you via this service only for your own use. You may not resell or reverse engineer this information to calculate or develop any index for disclosure and/or marketing or create any other derivative works or commercial product(s), data or offering(s) without the express written consent of Goldman Sachs. You are not permitted to publish, transmit, or otherwise reproduce this information, in whole or in part, in any format to any third party without the express written consent of Goldman Sachs. This foregoing restriction includes, without limitation, using, extracting, downloading or retrieving this information, in whole or in part, to train or finetune a machine learning or artificial intelligence system, or to provide or reproduce this information, in whole or in part, as a prompt or input to any such system.
Testimony Before the Subcommittee on the Legislative Branch, Committee on Appropriations, United States House of Representatives
Fiscal Year 2027 Budget Request
Statement of Orice Williams Brown Acting Comptroller General of the United States
FISCAL YEAR 2027 BUDGET REQUEST
Highlights
U.S. Government Accountability Office
GAO-26-900720 March 2026
A testimony before the Subcommittee on the Legislative Branch, Committee on Appropriations, United States House of Representatives
Contact: Dave Powner at pownerd@gao.gov
What GAO Found
GAO’s work continues to make an impact. Executive branch agencies use GAO’s work to improve their operations, performance, and efficiency, and Congress uses it to inform key legislative decisions. For example, consistent with GAO’s recommendation to Congress, the Ending Improper Payments to Deceased People Act requires the Social Security Administration to permanently share its Death Master File with the Department of the Treasury to help prevent payments to deceased individuals. This will save millions of dollars each year.
By the Numbers: GAO’s Fiscal Year 2025 Accomplishments
$62.7 billion
Source: GAO. | GAO-26-900720
To meet congressional demand for GAO’s work, GAO is requesting $860 million in appropriated dollars for fiscal year (FY) 2027. This is a 5.9 percent increase over the FY 2026 enacted level. GAO’s FY 2027 budget request also uses $50 million in offsetting receipts, for $910 million in total budget authority for the fiscal year. The FY 2027 budget request will support 3,210 full-time equivalents, a reduction of 4.2 percent compared to FY 2026 and 10.2 percent since the end of FY 2024.
With these resources, GAO will continue to focus on the priority needs of the Congress, including five key areas of importance: advancing efforts to address fraud, waste, and abuse in federal programs; evaluating national security activities; assessing the impacts of emerging science and technology issues; assessing efforts to address evolving cybersecurity threats; and analyzing health care spending.
GAO also plans to make targeted, critical investments in its information technology systems, advanced analytic capabilities, and cybersecurity. To help drive efficiency, an important focus will be increasing the use of emerging technology, including artificial intelligence.
Background
GAO’s mission is to support Congress in meeting its constitutional responsibilities and to help improve the performance and ensure the accountability of the federal government for the benefit of the American people. GAO’s work spans the full breadth and scope of the federal government’s responsibilities. Congress relies on GAO’s nonpartisan, objective, and high-quality work to help inform congressional deliberations as well as oversight of the executive branch. GAO routinely conducts work for the Chairs or Ranking Members of over 90 percent of all standing committees.
Since 2002, GAO’s work has resulted in over $1.51 trillion in financial benefits and almost 30,800 program and operational benefits that helped create or change laws, improve public safety and other services, and promote better management throughout the government.
Chair Valadao, Ranking Member Espaillat, and Members of the Subcommittee:
I appreciate the opportunity to discuss GAO’s fiscal year (FY) 2027 budget request. GAO’s mission is to support Congress in carrying out its constitutional responsibilities and improve government efficiency and effectiveness through our fact-based, nonpartisan, and objective analysis and recommendations.
Fiscal Year 2027 Budget Request
The FY 2027 budget request reflects our commitment to delivering on this mission and being prudent stewards of federal dollars. We are requesting $860 million in appropriated dollars. This is a 5.9 percent increase (or $48.2 million) over the FY 2026 enacted level. As instructed by the Committee, our request includes the projected cost-of-living (COLA) and inflation adjustment factors determined by the Congressional Budget Office (CBO). GAO’s FY 2027 budget request also uses $50 million in offsets and supplemental appropriations, for $910 million in total budget authority for the fiscal year. (See table 1.)
Table 1: Summary of GAO Resources by Program, Fiscal Years 2025–2027
Source: GAO. | GAO-26-900720
1 Includes offsetting receipts and reimbursements from program and financial audits; rental income; training fees, collection of bid protest system user fees; supplemental funds for specific program oversight, as well as disaster and pandemic related audits.
2 Salaries and expenses appropriation includes $5.0 million in no-year funding to evaluate program spending pursuant to the Infrastructure Investment and Jobs Act (PL 117-58). FY 2026 offsets include $1.18 million of these funds carried forward from FY 2025.
The FY 2027 budget request will require further reductions in the size of GAO’s workforce. The request will support 3,210 full-time equivalents (FTE), a reduction of 4.2 percent compared to FY 2026 and 10.2 percent since the end of FY 2024. The reduction in staffing levels is needed, even with the requested 5.9 percent budget increase, due to several factors. In particular, GAO’s budget has been flat since FY 2024, when we received a 2.7 percent increase in direct appropriations. This has required the agency to absorb inflationary and other cost increases, such as COLA, increases in the costs of the employer share of health care benefits, and other personnel-related cost increases.
My remaining comments will focus on the results that we have delivered with the funds that you have previously entrusted to us and how we will use the requested FY 2027 funding.
Commitment to Improving Government Effectiveness and Efficiency
GAO’s work continues to make an impact. Agencies use our work to improve their operations and performance, and Congress uses it to inform key legislative decisions. For example, the FY 2026 spending bills alone contained more than 30 provisions directed at federal agencies based on GAO’s findings and recommendations, with a similar number of provisions across the One Big Beautiful Bill Act and the Servicemember Quality of Life Improvement and National Defense Authorization Act for FY 2025. The examples below highlight how GAO’s findings and recommendations informed numerous provisions of legislation.
Public Law 119-21, commonly known as the One Big Beautiful Bill Act
GAO’s work contributed to a number of provisions in the act. For example, the act provides for the following:
y Establishes new statutory limits on states’ use of taxes on health care providers to finance their nonfederal share of Medicaid expenditures. These new limits would save an estimated $191 billion in the next decade, according to CBO.
y Directs the Centers for Medicare and Medicaid Services’ Chief Actuary to certify budget neutrality for Medicaid demonstration projects before they are approved, which could save approximately $3 billion over the next decade, according to CBO.
y Directs the Office of Personnel Management (OPM) to implement a process to verify Federal Employees Health Benefit Program records and confirm eligibility of family members, conduct a comprehensive audit of existing family members, and develop a process to disenroll ineligible family members, which could save approximately $2 billion over the next decade, according to CBO.
y Requires that updates to the Thrifty Food Plan—the basis for maximum Supplemental Nutrition Assistance Program (SNAP) benefits—be cost-neutral and that future reevaluations of the Plan generally do not increase costs beyond inflation
y Extends the Pandemic Response Accountability Committee, including its Pandemic Analytics Center of Excellence, which we have recommended be made permanent to enhance advanced analytics and prevent fraud, for 9 additional years.
Servicemember Quality of Life Improvement and National Defense Authorization Act for Fiscal Year 2025
The act includes several directives consistent with GAO’s findings and recommendations, including requiring the following:
y DOD to enhance the cybersecurity of background investigation systems to ensure they comply with current standards for cybersecurity and privacy; take steps to ensure the quality and nutrition of food available to military service members; take certain actions to improve implementation of financial relief for civilians treated in military medical treatment facilities; and implement a program to improve pre- and post-natal mental health services for military health care beneficiaries.
y The Department of the Navy to assess and report on cost targets for its Ford-Class ships and use commercial industry leading practices to help the agency deliver new ships that meet its needs faster.
The Ending Improper Payments to Deceased People Act
GAO recommended that Congress amend the Social Security Act to allow the Social Security Administration (SSA) to share its full death data (known as the Death Master File) with the Department of the Treasury to help prevent payments to deceased individuals. In December 2020, Congress enacted legislation for SSA to share this data with Treasury for a 3-year period. In April 2025, Treasury determined this led to $109 million in payment errors identified, prevented, or recovered in 2024, the first year of the 3-year period. The Ending Improper Payments to Deceased People Act makes permanent the requirement that SSA share its database of deceased individuals with Treasury, which could result in millions of dollars in savings annually
Financial and Other Impacts of GAO’s Work and Services
In addition to informing legislative activity, our work leads to additional financial benefits (i.e., cost savings, cost avoidance, and revenue enhancements) and other programmatic and operational improvements when Congress and agencies act on our recommendations. In FY 2025, our work resulted in a total of $62.7 billion in financial benefits and 1,295 programmatic and operational improvements
Implementation of our open recommendations to Congress and executive branch agencies could result in hundreds of billions of dollars in measurable future financial benefits. For example, as of October 2025, we estimated that implementation of open recommendations could result in $132 billion to $251 billion in measurable future financial benefits. We will continue to discuss the benefits of implementing these recommendations with Congress and agencies.
GAO support of Congress extends well beyond these numbers. Congressional committees and subcommittees regularly ask our subject matter experts to testify at hearings or use our work to inform the focus of the hearing. In FY 2025, GAO was asked to testify 46 times before 31 separate committees or subcommittees on various topics. GAO’s work was cited by members of Congress and witnesses in over 185 hearings beyond those at which we testified.
Further, we provided over 640 instances of technical assistance at the request of Members of Congress, which includes briefings on prior work by GAO experts, data analysis, white papers, or comments on legislative bills. This included 218 instances of technical assistance on appropriations law matters. Additionally, we continued to hold events for congressional staff in our dedicated space at the Longworth House Office Building. We offer information sessions each week on appropriations law and science and technology. In the last year, GAO also hosted 14 events covering various topics, including data privacy in artificial intelligence (AI) and quantum technology.
Congressional Priorities Continue to Drive GAO’s Work in FY2027 and Beyond
As we plan for FY 2027, we will continue to focus our resources on congressional priorities. Congressional requests and mandates consistently account for 95 percent or more of our resources. We identify congressional priorities through regular outreach to Members and staff and our strategic planning process. Based on these inputs, we have identified five areas of focus for our audit work in FY 2027, including the following:
Advancing efforts to address fraud, waste, and abuse in federal programs
We will continue to build our body of work on rooting out fraud, waste, and abuse across the federal government. We have previously estimated the federal government could lose between $233 billion and
$521 billion annually, based on 2018-2022 data. To help agencies combat fraud, we issued A Framework for Managing Fraud Risks in Federal Programs. Since the issuance of the framework in 2015, we have examined the extent to which over 40 agencies and program offices are adhering to leading practices to safeguard their programs from fraud. As of January 2026, we have made approximately 200 recommendations to agencies and programs to better manage their fraud risks.
Moving forward, we plan to develop additional estimates of fraud related to federal revenue and for specific program areas and examine how federal agencies can help prevent schemes that defraud the government and scam Americans.
Evaluating national security activities
In FY 2027, we will continue to evaluate U.S. government efforts across the spectrum of national security activities. This includes focusing on how well the United States can organize, train, and operate complex military forces and intelligence capabilities to meet the challenges laid out in the 2025 National Security Strategy and the 2026 National Defense Strategy. We will also continue to evaluate DOD’s progress in improving the acquisition of its weapon systems. This work is critical as DOD plans to invest more than $2.4 trillion to develop and acquire its costliest weapon programs.
Assessing the impacts of emerging science and technology issues
We will continue to build our body of work on emerging science and technology issues to provide policymakers reliable and timely information. For example, last year we issued our first science and technology trend paper—which provides foresight into emerging science and technologies that could have significant impacts on the American people. This first paper explored gene editing, manufacturing in space, and biodegradable plastics. We will issue the next trend paper this spring.
We will continue to issue technology assessments—which describe current and emerging technologies and offer policy options for enhancing their benefits or mitigating challenges they may present. For example, last year we issued a technology assessment on the potential effects of generative AI technologies and policy options to enhance the benefits or mitigate the challenges of these technologies. Looking ahead, we plan to issue technology assessments on hydrogen energy, water quality sensors, and technologies for reducing critical mineral dependence, to name a few. We will also continue to issue Science & Tech Spotlights—which distill complex issues into 2-page summaries.
Assessing efforts to address evolving cybersecurity threats
Federal agencies and our nation’s critical infrastructure depend on IT systems to carry out operations and process essential data. However, risks to IT systems are increasing, highlighting the importance of our cybersecurity work. In FY 2025, we reported on agencies’ efforts to improve monitoring of their networks, assessed the U.S. national quantum computing cybersecurity strategy, and reported on how AI can impact our nation’s critical infrastructure.
In FY 2027, we will continue to assess cutting-edge technologies as they are incorporated into federal and critical infrastructure networks. These assessments include the threat that quantum computing poses to many of the encryption methods used by federal and critical infrastructure networks; and federal efforts to implement zero trust architectures and ensure the cybersecurity of private-sector cloud service providers.
Analyzing health care spending
Health care spending now accounts for around 27 percent of the federal budget and is one of the fastest growing federal expenditures. In addition, federal health programs may face significant vulnerabilities to
fraud, waste, abuse and mismanagement due to their size and complexity.
Our work in this space has improved the delivery of care while reducing costs. In FY 2025, we documented over $16 billion in savings from agencies acting on our recommendations. In FY 2027, we will continue to examine the Medicare and Medicaid programs, which are expected to place additional strain on the federal budget in the coming years. Together, these programs accounted for over $1 trillion in federal expenditures and over $95 billion in improper payments in FY 2025. Agency and congressional action on GAO recommendations related to Medicare and Medicaid has resulted in over $210 billion in financial benefits since FY 2008.
We understand that congressional priorities and interests can quickly shift. Notably, national emergencies or disasters can change Congress’s priorities for work overnight, and Congress frequently turns to us for realtime, fact-based information during these times. We will continue to engage in regular communication with our clients to help ensure that we are working on their highest priorities across the federal landscape and adjusting as needed.
Continuing GAO’s Efficiency and Effectiveness
We will also seek to meet evolving congressional needs by continuing to improve the agency’s agility, efficiency, and effectiveness. We have a number of initiatives underway to help us more quickly shift staff resources to emerging congressional priorities, modernize our processes and products, and meet increasingly accelerated congressional time frames. Funding these efficiencies is an imperative as we will have a smaller workforce to continue to meet the demand for our work.
We plan to increase efficiency through targeted, critical investments in our IT systems, advanced analytic capabilities, and cybersecurity. Investments are needed to improve network reliability and ensure our staff have the tools needed to streamline and shorten the time required to complete aspects of our audit work so that we can deliver results faster for our clients.
An important focus will be increasing the use of emerging technology, including AI for our audit work and operations. This will require investments in technology and training our staff, as they will need to become proficient in using this technology. But, by integrating AI into workflows, staff can boost efficiency and speed—creating opportunities for them to focus on higher-order work. We believe some of the tools that we are developing and testing could have applicability for other legislative branch agencies. The Legislative Branch AI Working Group serves as a forum for us to share our experiences and collaborate on AI use cases with other legislative branch agencies.
Summary
We have a proven track record of supporting Congress with fact-based, nonpartisan, and objective information and analysis. We have also consistently demonstrated that we are a good investment, as we regularly deliver financial benefits in excess of 70 times the amount of funding we are provided. But we understand that we cannot be satisfied with maintaining the status quo. GAO has changed significantly over its 105-year history, evolving from checkers of financial vouchers to a leading professional services organization and the standard-setter for the auditing community. We must continue to evolve and modernize to support Congress in meeting the challenges of today and tomorrow. We have a plan for doing so. With the subcommittee’s support, we will execute this plan and continue delivering the results that Congress and the American taxpayer have come to expect from GAO.
This concludes my prepared remarks. I would be pleased to answer any questions at the appropriate time.