


SOURCE: Noell Consulting Group
Garden, G-Urban, and Midrise all attract similar audiences, but the lower the density the lower the cost, and thus more affordable to attract more moderate incomes. In this market Garden = $6095k, Garden-Urban $80-120k, and Midrise $100k+
Total demand through 2030 of 1,575 units. This covers all Class A rental product including new BTR (TH or SFD), garden, gardenurban, amd midrise apartments.
years
Demand for one smaller scale facility, under 120 units, through 2030.
Typically 70-90 years
Demand for one additional facility of +/- 100 beds through 2030.
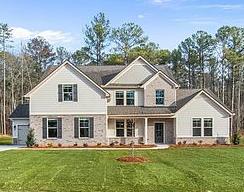
Starter families, Couple w/dogs, Empty Nesters. HHs waiting to build/buy
See above
None
None
None, though forsale communities could switch
Exhibit 3
Summary

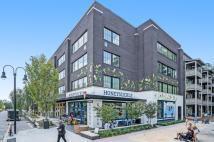
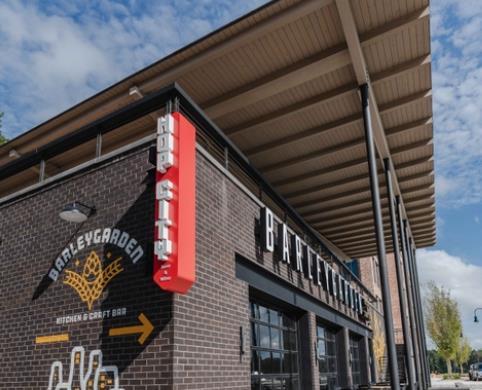
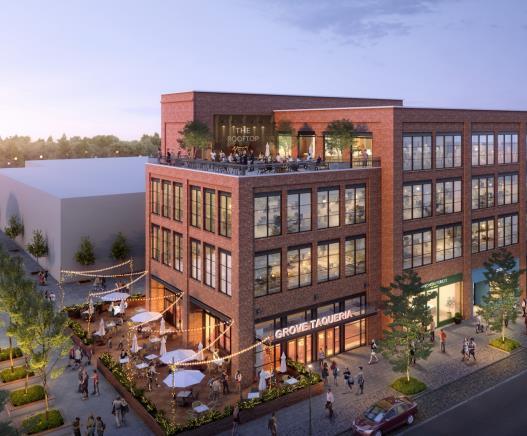
Destination oriented retail in unique locations such as Downtown Square, Town Center, Trilith, etc. Many conventional categories such as clothing and food & beverage are currently over-supplied in the market, however new concepts/missing brands can still find opportunity in the market, though likely at the expense of older concepts.
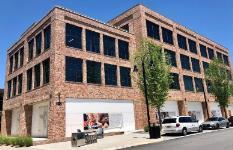
Small market that is predominantly driven by medical uses and population servicing industries. Lower rates make new construction difficult to support, but new growth will come from QTS and US Soccer related firms and may justify new costs in build-to-suit and owner occupied situations.
$25-30/SF NNN
Local population, population growth, local employees, US Soccer/Trilith visitors, regional destination visitors 100,000 SF per year of retail and service, up to 700,000 SF 128,415 SF
$24-26/SF Mod. Gross Heavily medical and population servicing firms 16,000 SF per year, up to 111,000 SF
772,442 SF (540k of which is QTS and Trilith which will likely need a build-tosuit)
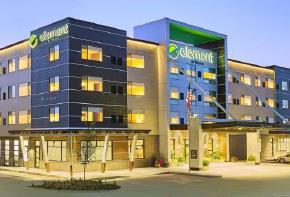
Select-service brand with a national flag. Given market audience and demand generators an extend stay such as Element by Westin or Residence Inn by Marriott would be ideal. Will want to locate close to US Soccer Facility or near Downtown.
$160 ADR
Contractors, US Soccer visitors, SMRF (social, military, religious, fraternal)
SOURCE: Noell Consulting Group
8/16/2024
Support for existing 213 rooms in pipeline + 110 additional rooms by 2030 213 Rooms
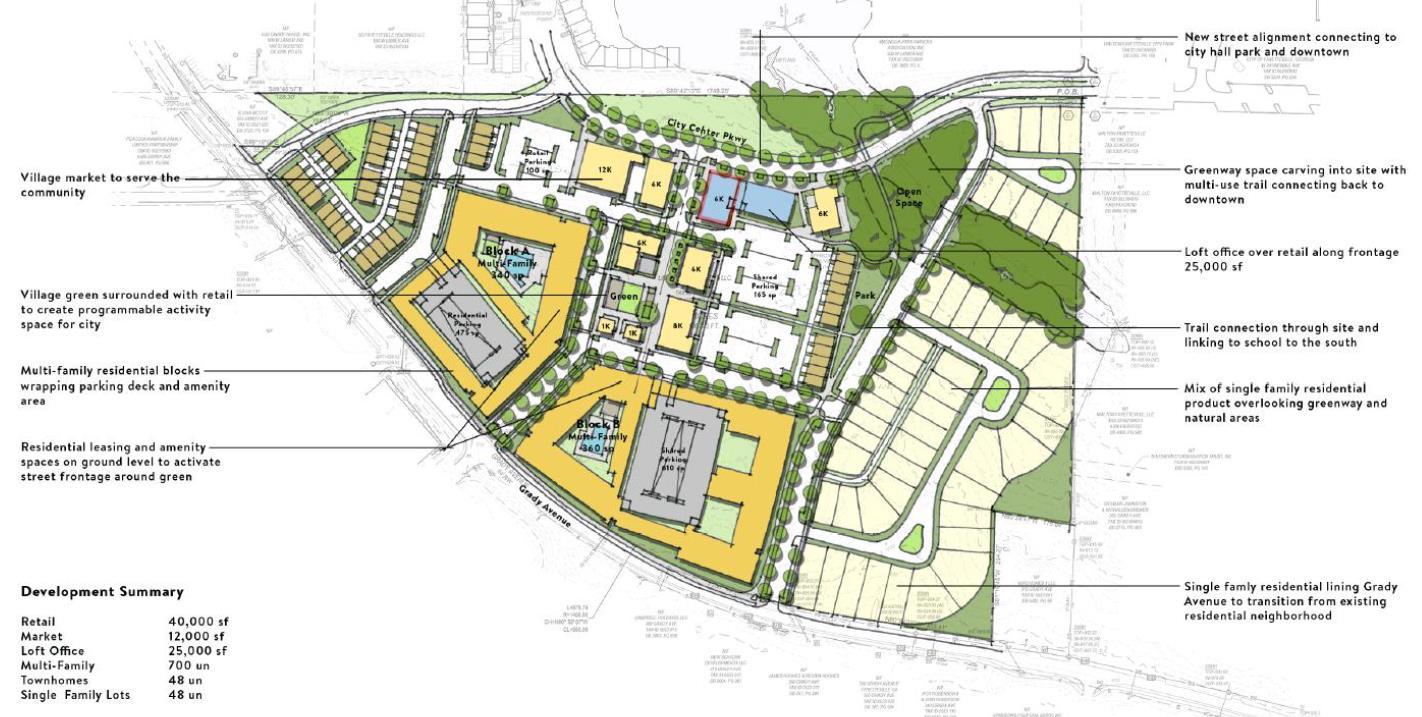
Planned Fayetteville Town Center
Ample demand was found to support all planned uses in the town center. It will be important to create a unique destination in order to support more food & Beverage tenants (a category currently over supplied in the market), particularly non-chain, chefdriven concepts. Additional analysis to the ability of this retail to be successful without a traditional anchor is warranted. Additionally, while demand was found to support 700 units of multifamily, current rental rates in the market do not support structured parking. City subsidies will be required to justify the structured parking costs and entice a developer.
Exhibit 4
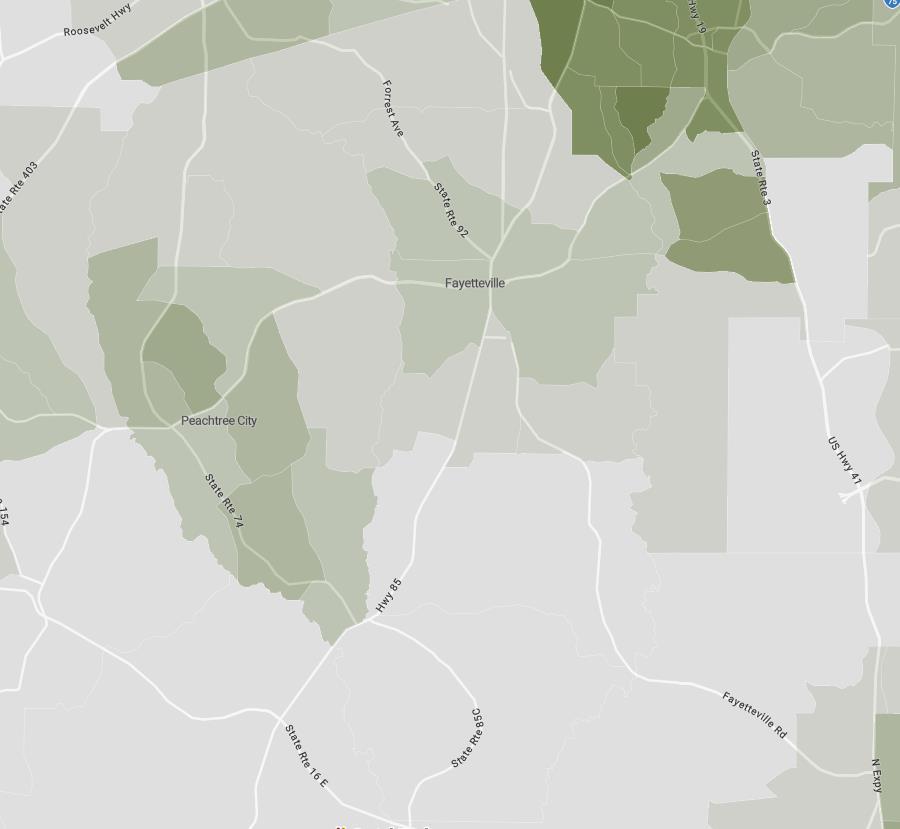
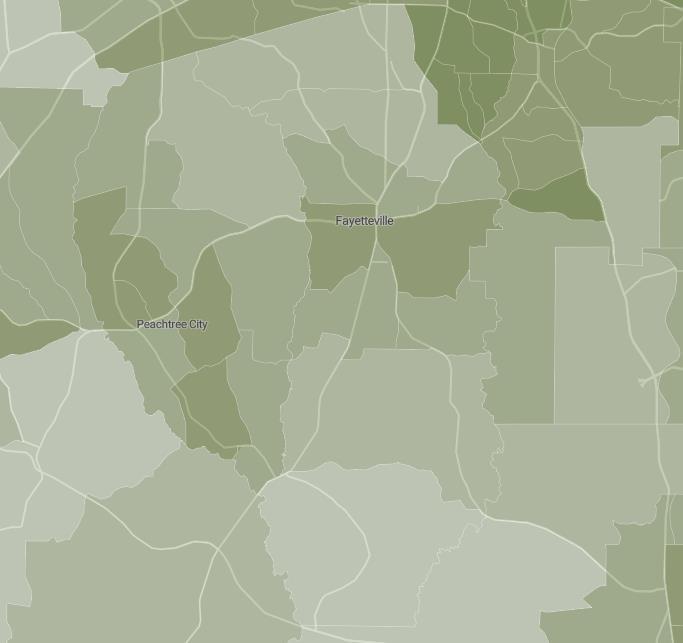
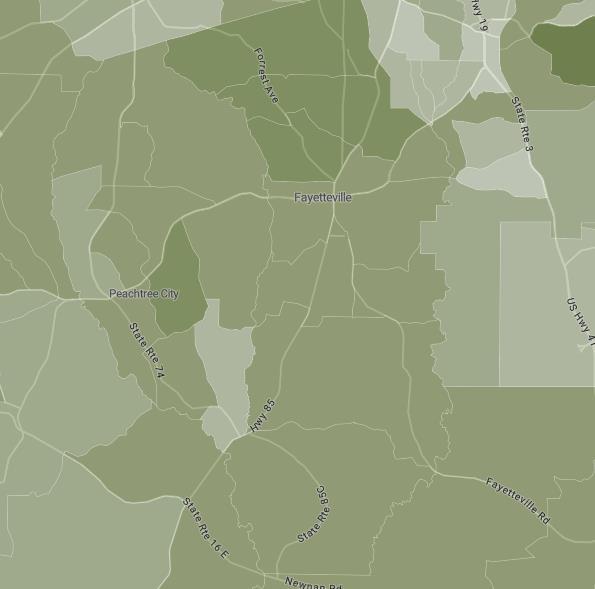
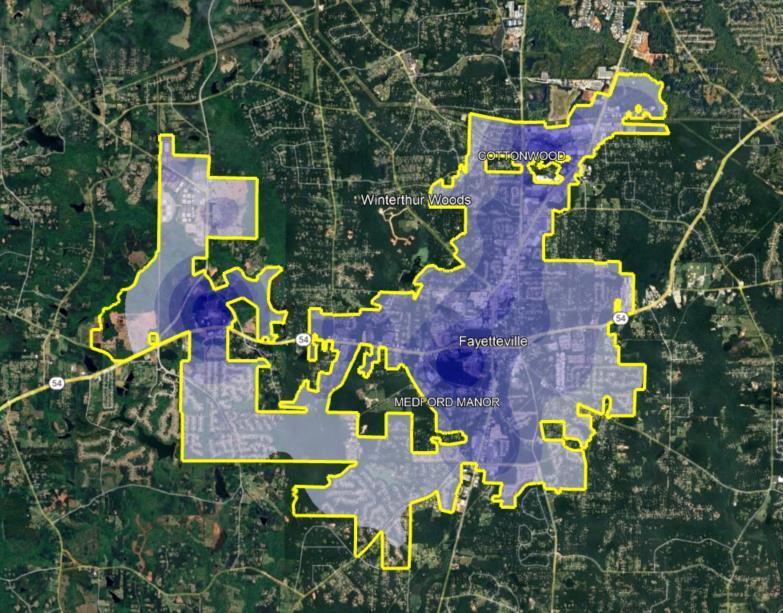
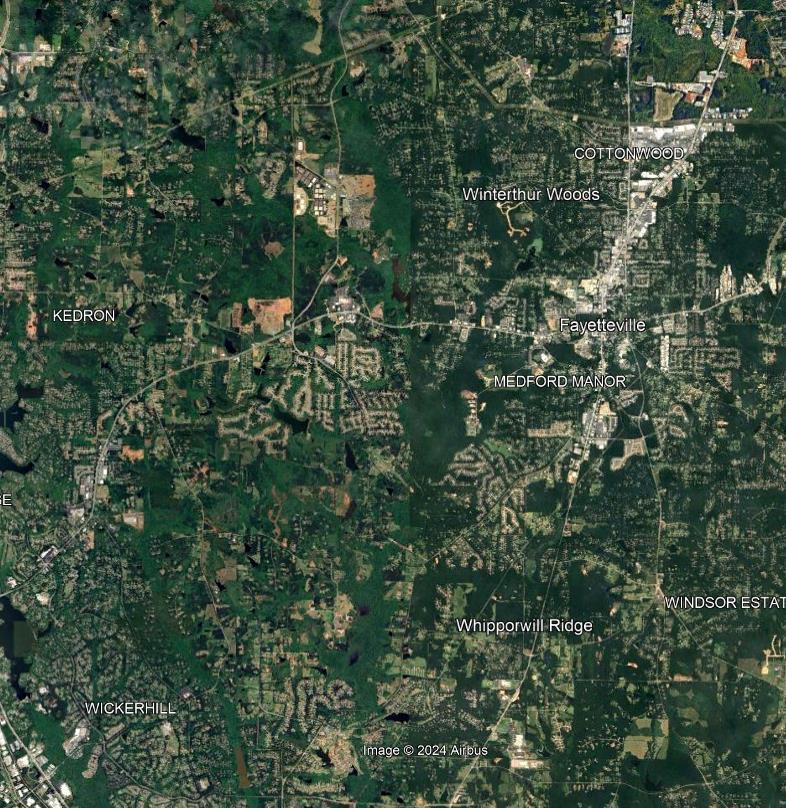
Land Use Map


SOURCE: Noell Consulting Group, Google Earth


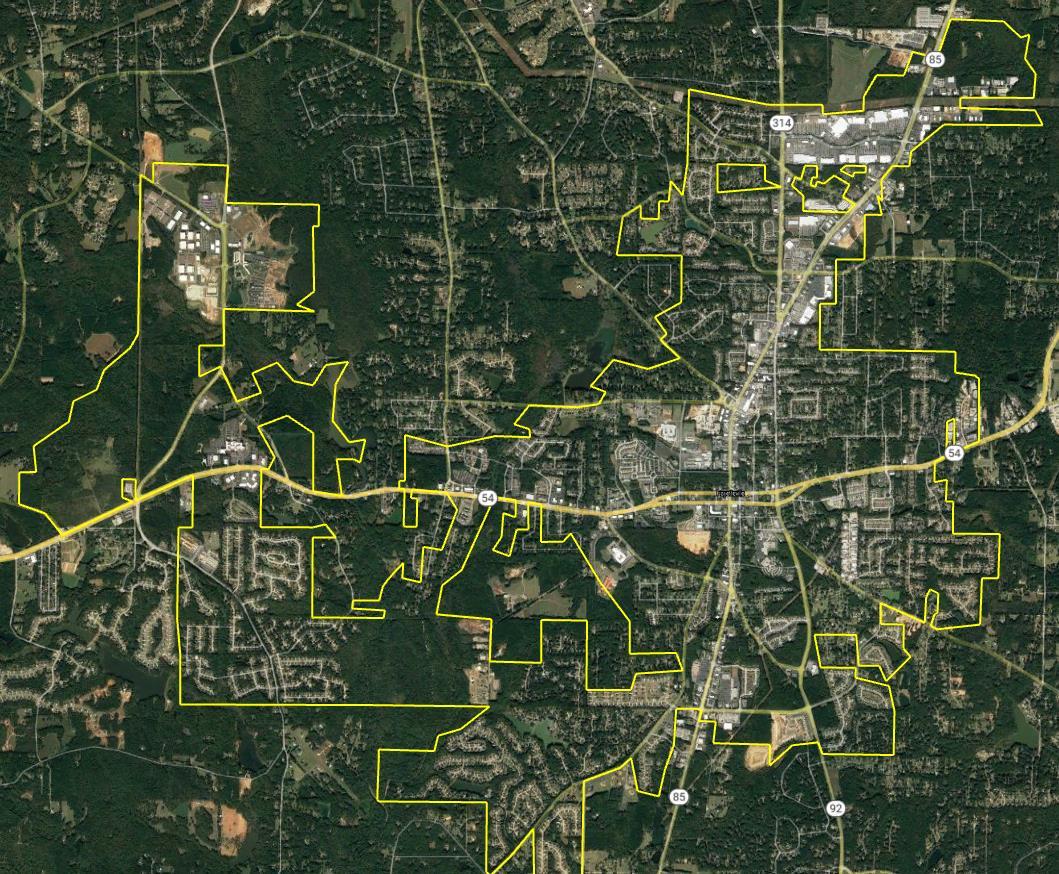
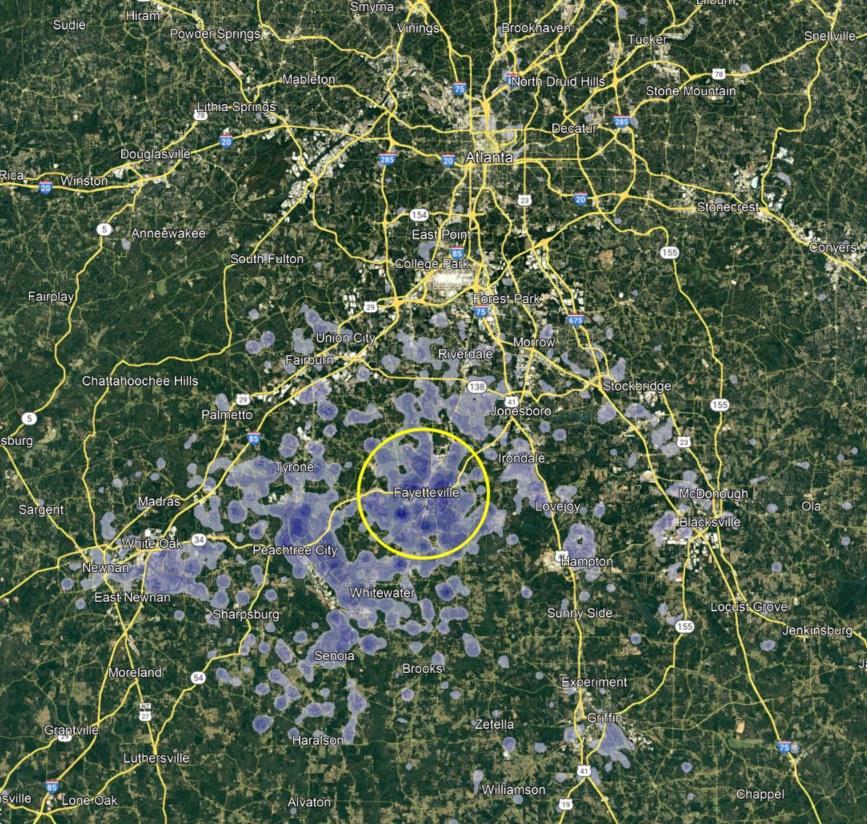
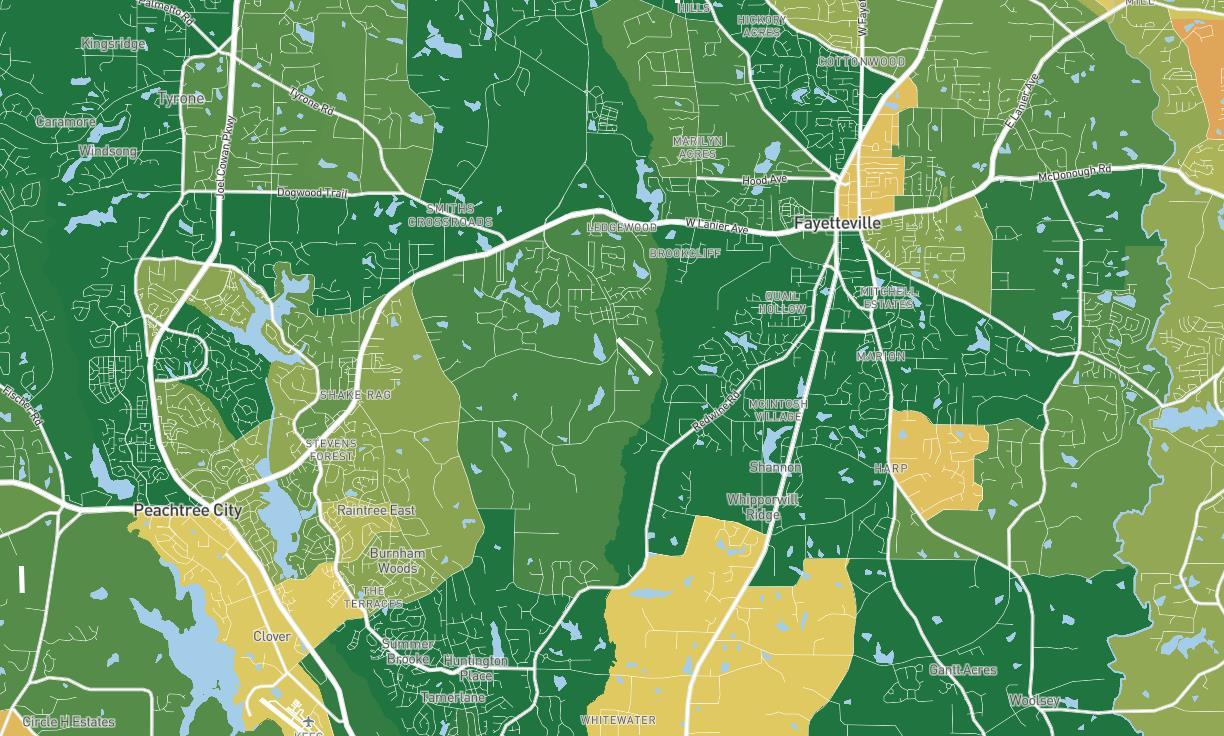
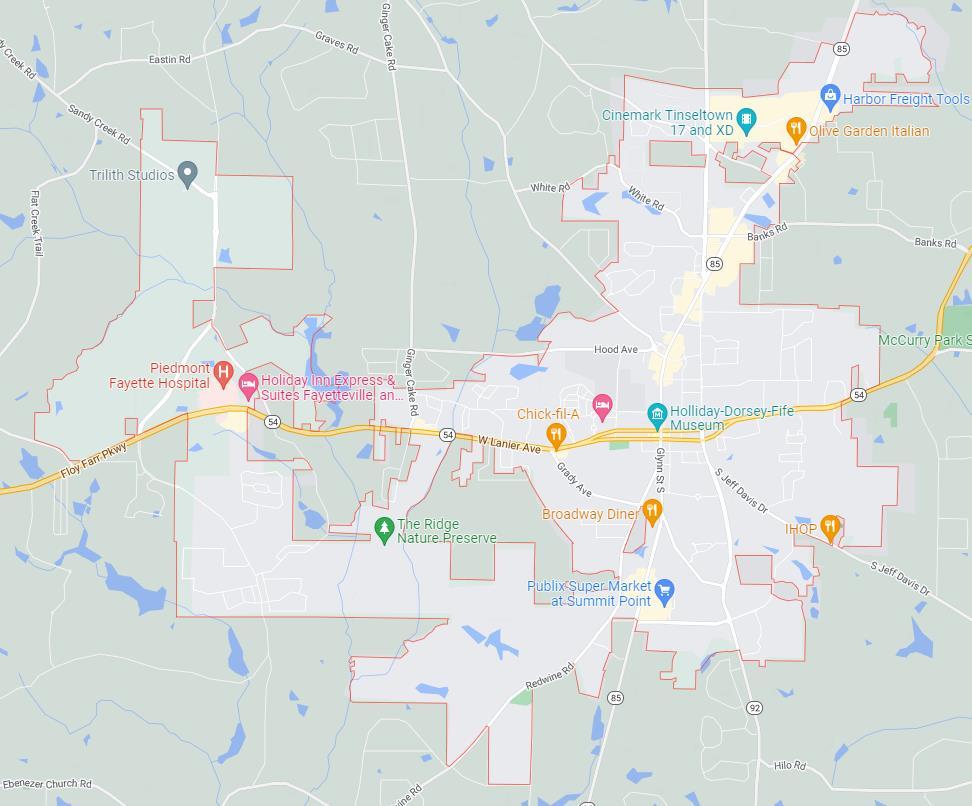
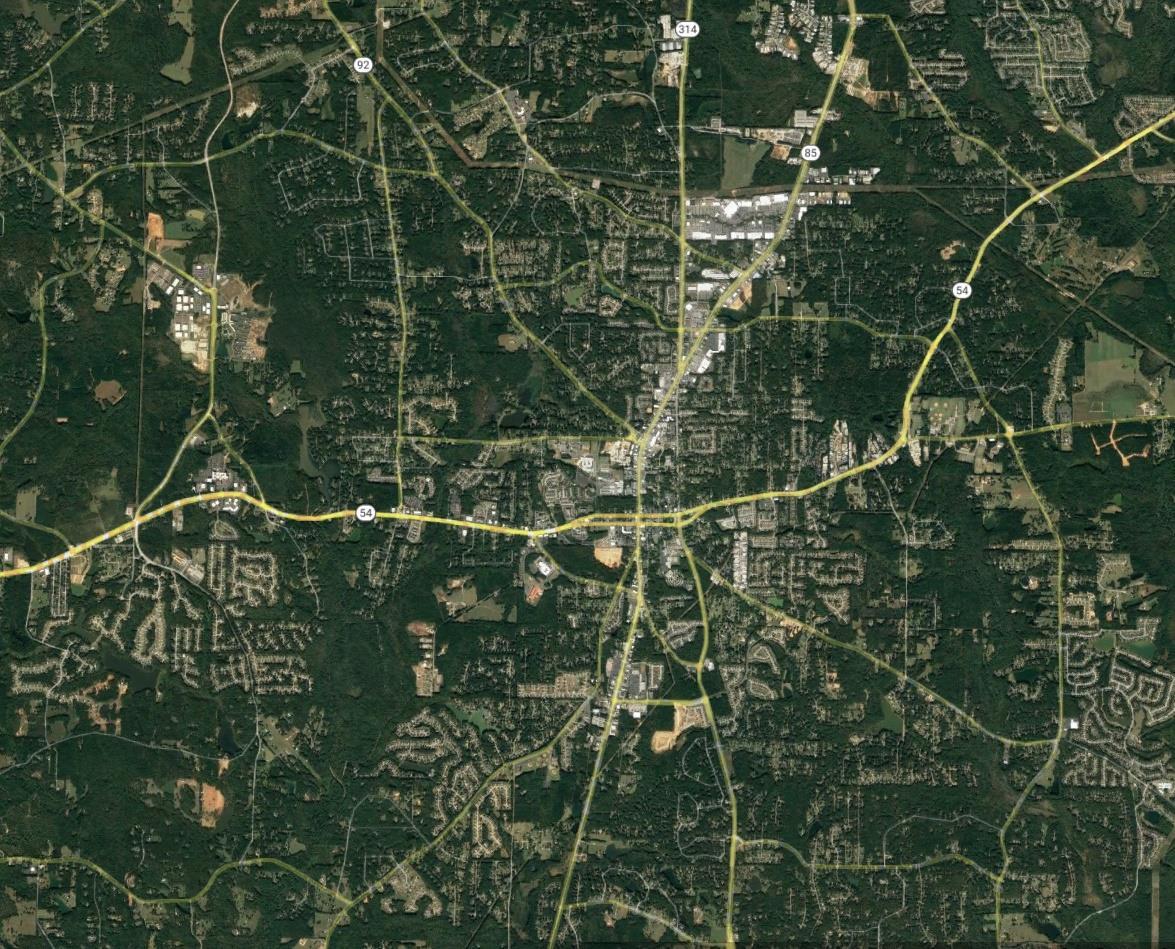
The City of Fayetteville is fairly developed, but there are pockets of opportunity for new housing development to occur.
The map to the left shows existing concentrations of land use, with areas of opportunities for future development highlighted in red circles.
Higher density forms of housing such as apartments and townhomes, should be located near Downtown, Piedmont, and Trilith, where density is naturally higher and a mix of land uses join together. Additionally, senior living facilities and apartments should be located along heavily trafficked corridors for visibility purposes.


Lower density housing such as single family subdivisions and estate lots can be located near the City's edge where density is naturally lower and existing residential homes are more spread out.
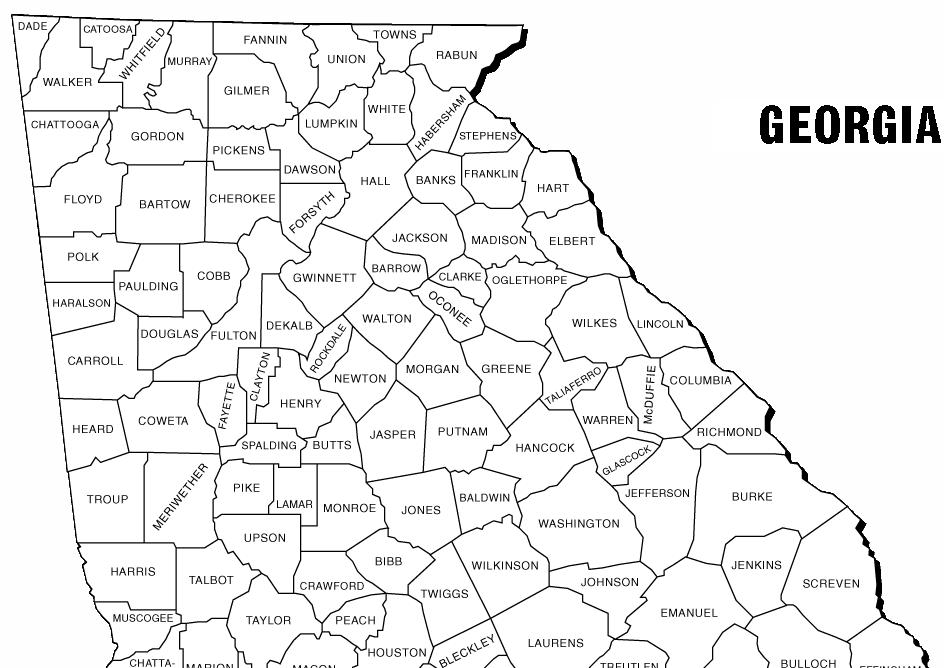
The City is located in Fayette County, within the Atlanta-Sandy Springs-Roswell Metropolitan Statistical Area (MSA). The Atlanta MSA includes 29 counties, with ten central counties belonging to the Atlanta Regional Commission (ARC) and forming the core of the MSA. Roughly 66% of the population of the MSA lives within this ten county core. From 2000 to 2010 only 67% of all growth occurred in this ten county core, however, since 2010 roughly 85% of all growth has occurred in this ten county core as younger and older generations increasingly seek walkable neighborhoods, both in urban and suburban areas. Fayette County had considerable growth from 2000 to 2010 with an annual growth rate of 1.2%. Since 2010, the County has experienced a positive growth rate of 1.0% as some cities in Fayette County, such as Peachtree City, have slowed construction. However, the story for the City of Fayetteville is more positive. The City of Fayetteville outpaced many of the fastest growing counties, from 2000 to 2010, with 3.6% annual growth. Since 2010, The City's growth rate is still strong and has outpaced all counties in the MSA except for Cherokee County from 2010 to 2022 with an annual growth rate of 1.7%.
SOURCE: Noell Consulting Group, U.S. Census Bureau
Description of the City and Study Area
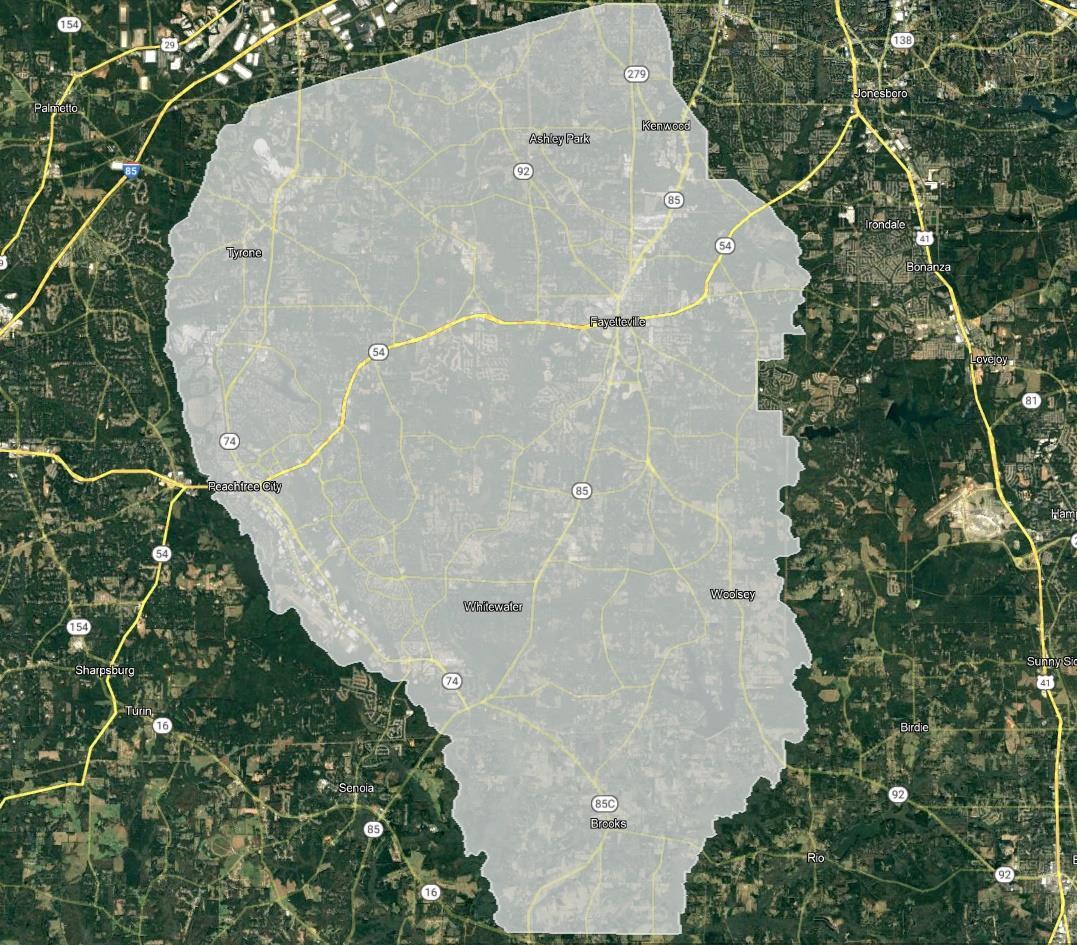


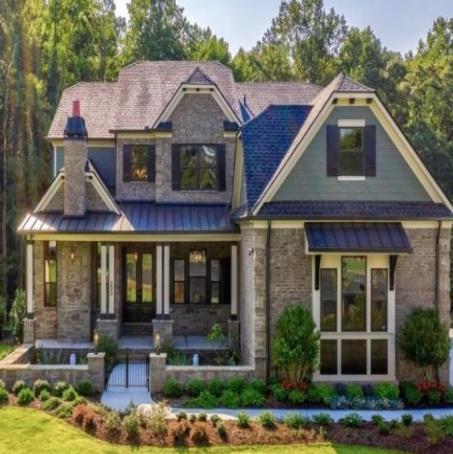
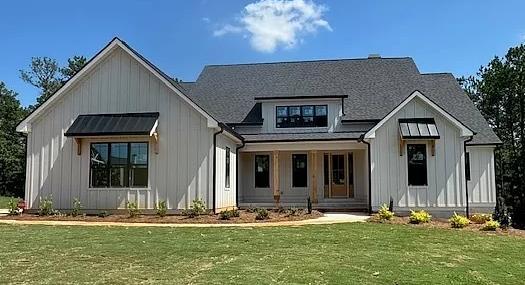
The City of Fayetteville is located in the center of Fayette County. Historically, Fayetteville was predominately an agricultural area of cotton fields with sprawling homes on large acre lots.
Recently, Fayetteville has worked to restore the historic streetscape and Downtown country charm, while still welcoming new residents and businesses.
SOURCE: Noell Consulting Group, Google Maps
8/16/2024


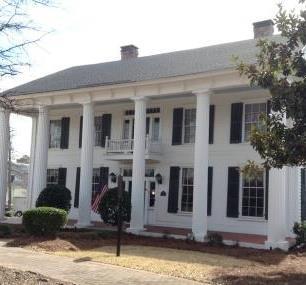
Exhibit 7
Migration Flows for Fayette County
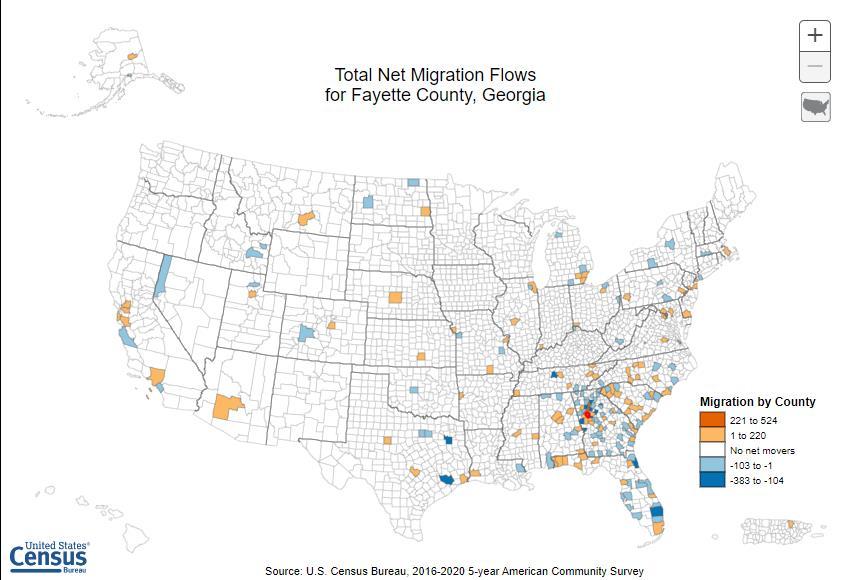


The map in this exhibit shows the total inbound migration flows for Fayette County, Georgia utilizing 2016-2020 5Year American Community Survey (ACS) Data. The leading out of market states are New York and Virginia representing retirees that are largely settling at locations closer to children and family. The county is very diverse with 65% local migrants with 35% of migrants coming from out of state or abroad. Naturally, most of the local migrants come from neighboring Walton County, Clayton County, and Fulton County --with in-Fayette same county migration at nearly 31%.
SOURCE: Noell Consulting Group, US Census Bureau
Exhibit 8
Migration Demographics for Fayetteville, 2024 7
From
In this exhibit NCG looks at the inbound migration data for the census defined City of Fayetteville. The graph on the left shows where people who moved to the City are coming from. For those who are new to market, those aged below 55 largely originated in other Georgia counties. That trend declines with the three age tiers from ages 55-60 and reemerges at the 65 and up age group. Among those three groups, intra-county migration was the most popular. Migrants from abroad were more heavily leaving ownership positions (85%) and migrants from other states came from 49% ownership positions. However, persons moving within Fayette County showed a heavy distribution of renters, 68% renters, over homeownership, 32%, who had moved within the County. Current residents in Fayetteville skew toward owning, 74%.
SOURCE: Noell Consulting Group, US Census Bureau


SOURCE: Noell Consulting Group, Social Explorer The


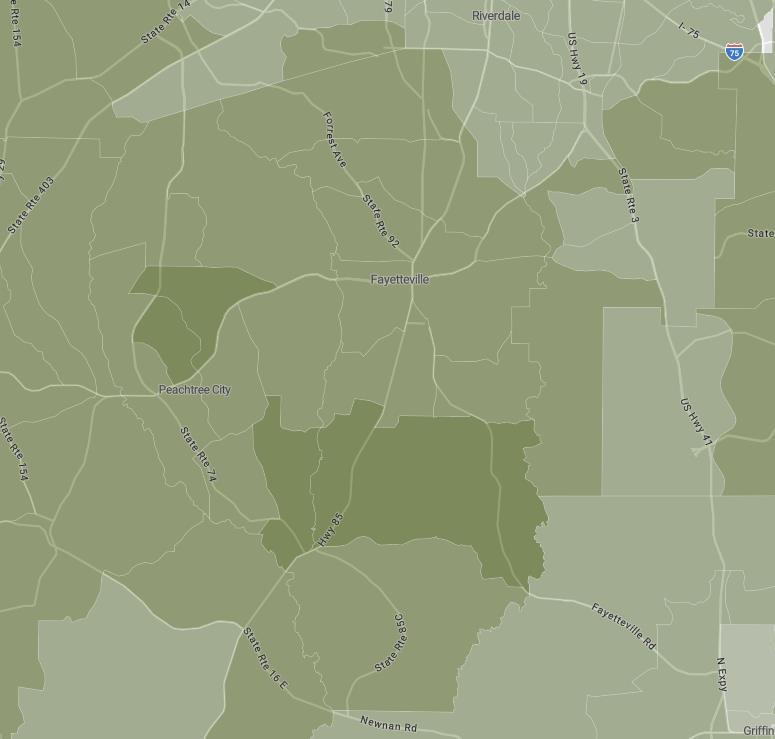
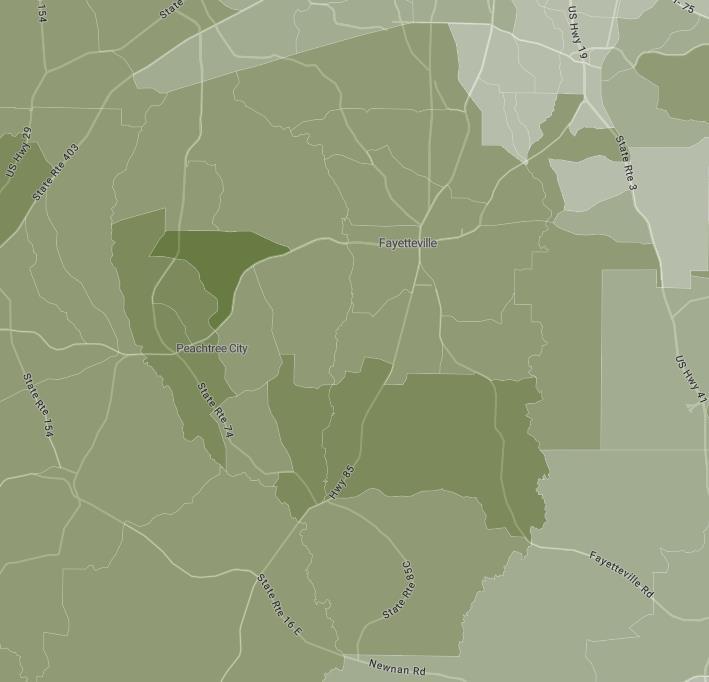
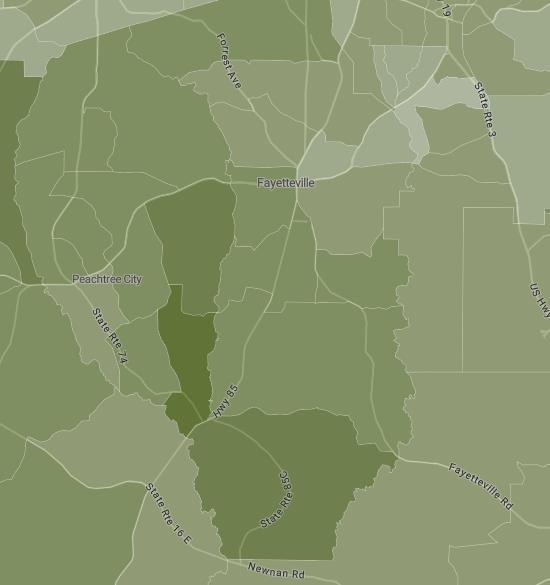
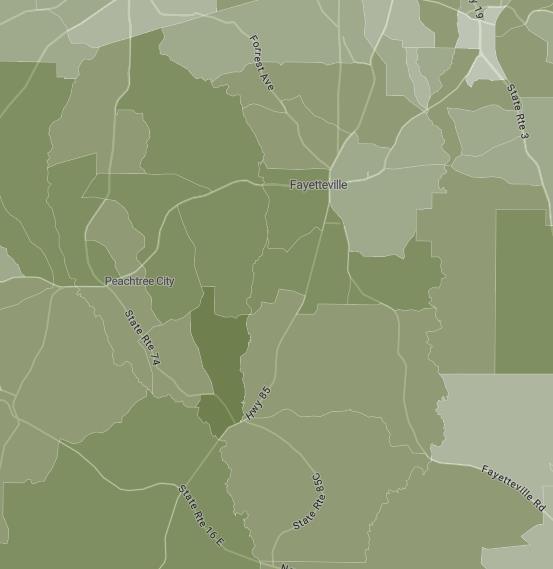
Exhibit 10


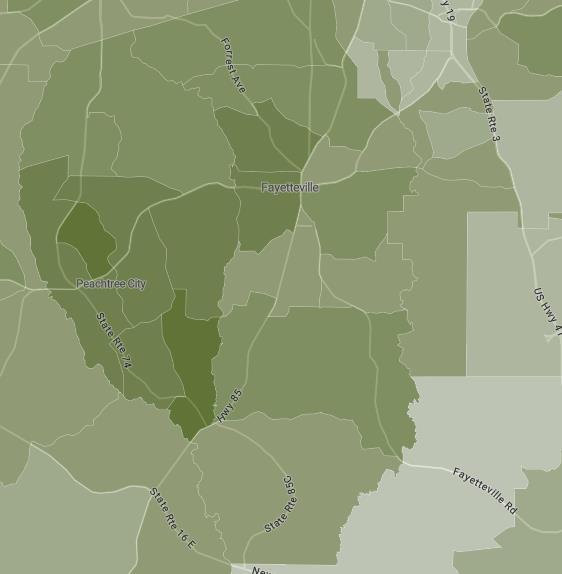


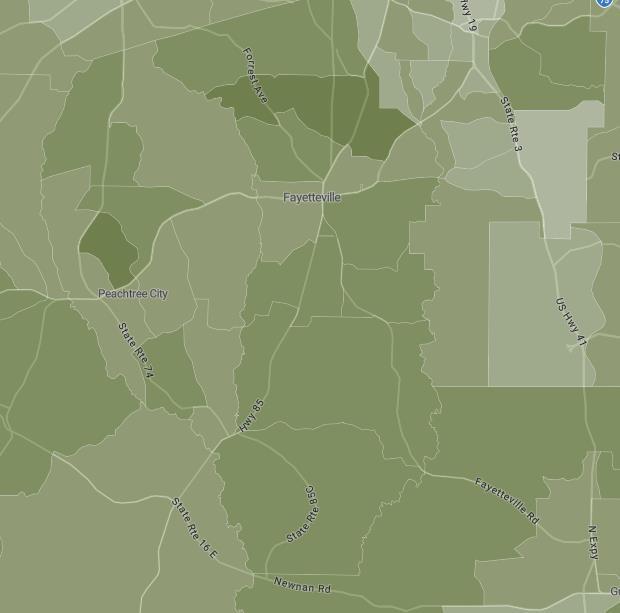
The maps in this exhibit show the change in the population, per census tract, aged 25+ that have obtained a bachelor's degree or more using the 2010 Census and 2022 5-Year ACS (American Community Survey) data. Historically, college educated individuals in Fayette County have been concentrated in the west and south west near Peachtree City and Tyrone, but over the past few decades college educated individuals have been pushing east increasing the educational attainment in Downtown Fayetteville, and Fayette County, as a whole. This surge is primarily due to many people being priced out of more established neighborhoods to the west. NCG believes, based on available data, educational attainment will continue to growth in the coming years.
SOURCE: Noell Consulting Group, Social Explorer
8/16/2024


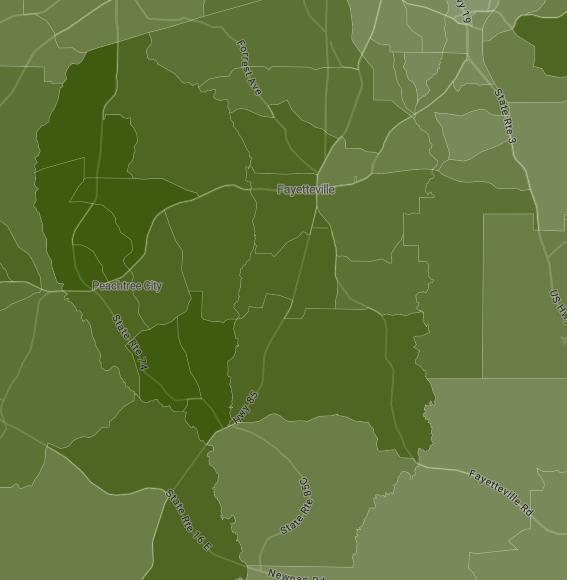
SOURCE: Noell Consulting Group, Social Explorer


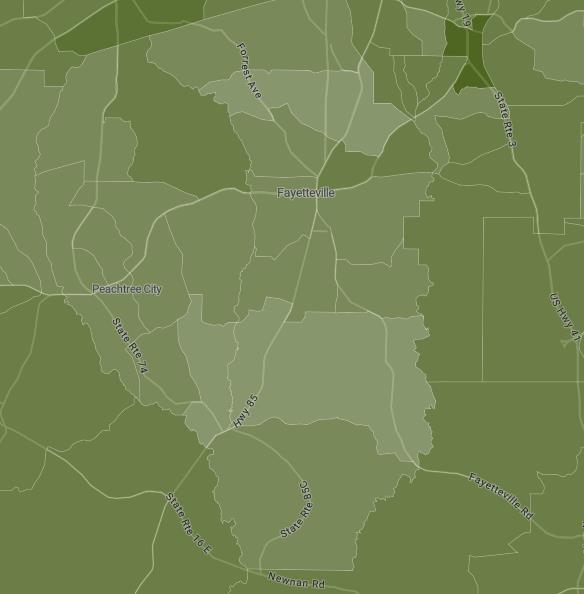
The maps above show the change in median household income above per census tract within Fayette County. Downtown Fayetteville had an average median household income of $76,432 to $91,558 in 2022. There has been increases in median income throughout the city with concentrations of high-earning households to the west and south. There is a massive cluster of high earning households to the south and west of Fayette County which is predominantly family/empty nester homeowners who want to live close by one of Fayette County's highest rated schools.


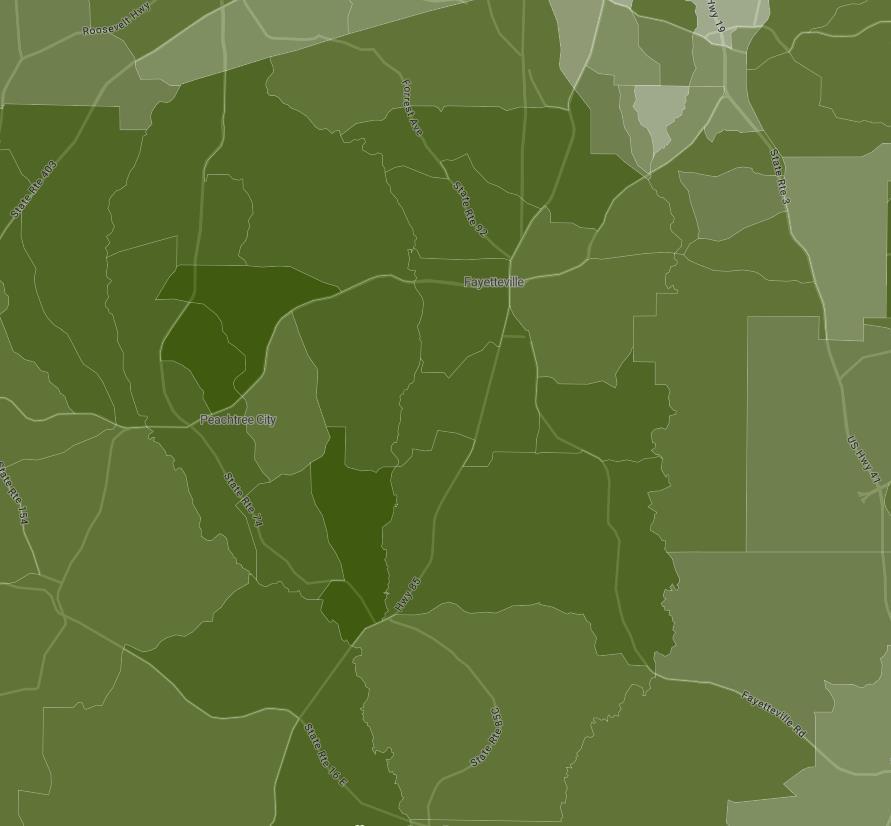
SOURCE: Noell Consulting Group, Social Explorer


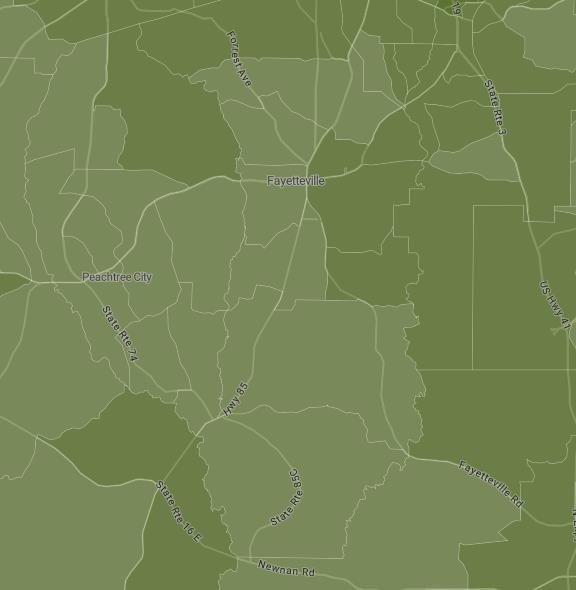
The above maps show the change in median home value of owner-occupied housing. Downtown Fayetteville stands out slightly with a 20% increase in median home value since 2010. Further, the combined median home value of Downtown Fayetteville is 62.4% less than the Fayette County median home value of $487,223. While Downtown has some varying home values depending on the side of town you are on, the highest home values are concentrated to the west, in Peachtree City and Tyrone, as well as south of the city. The disparity can be attributed to a deficit of new housing being built in Downtown Fayetteville, as well as Peachtree City being an alternative solution to Downtown living.


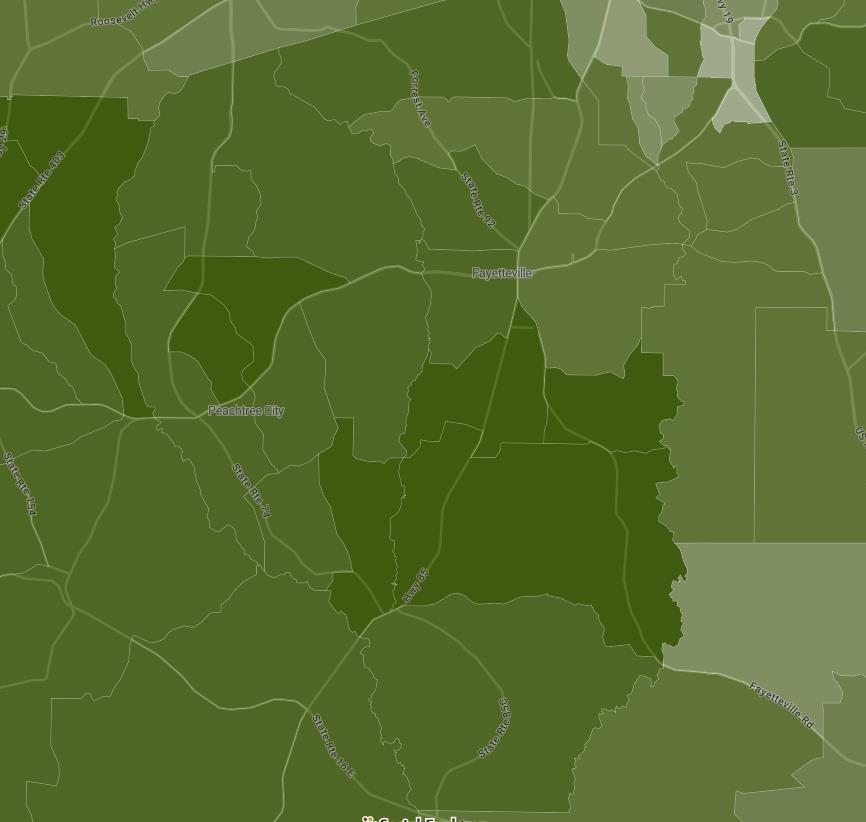
The above maps show the percentage of households, per census tract, that consist of a married-couple family household with children under the age of 18. Downtown Fayetteville showed 22% of this household type--a 15% decrease since 2010. A number of factors play into decreasing family households, such as aging population, younger families being priced out, better schools being located in Peachtree City, etc. but a more plausible explanation is that as the children leave the household and go to college, the parents then become empty nesters. As you will see later in the analysis, the population aged 18-34 is increasing as well as the over 55 population which confirms the exodus of 18 year olds from Fayette County to college.
SOURCE: Noell Consulting Group, Social Explorer
Exhibit 14


The maps above show the concentration of the population, per census tract, aged 55+. Downtown Fayetteville's surrounding community has seen an increase in population of people over 55 years of age. Since 2010, the tracts containing Downtown Fayetteville have seen the 55+ population grow more than 10% - consistent with the steady growth seen in neighboring areas.
Peachtree City has seen a significant concentration and growth of residents aged 55 and over. This bodes well for Downtown Fayetteville as these persons are strong candidates for a downsize value play.
SOURCE: Noell Consulting Group, Social Explorer
Exhibit 15


This exhibit examines age of residents as of 2022 to examine the growing number of 18-34 aged cohorts in a given area. Downtown Fayetteville has seen an increase of younger demographics in the southern area of the City and a decline in younger populations in the northern area of the City. The shift in age is predominantly due to great schools being located to the west by Peachtree City and South of the City, as well as job cores for younger demographics located to the west, Trilith Studios and Piedmont Hospital, and manufacturing jobs to the east/north of the City.
SOURCE: Noell Consulting Group, Social Explorer
Exhibit 16
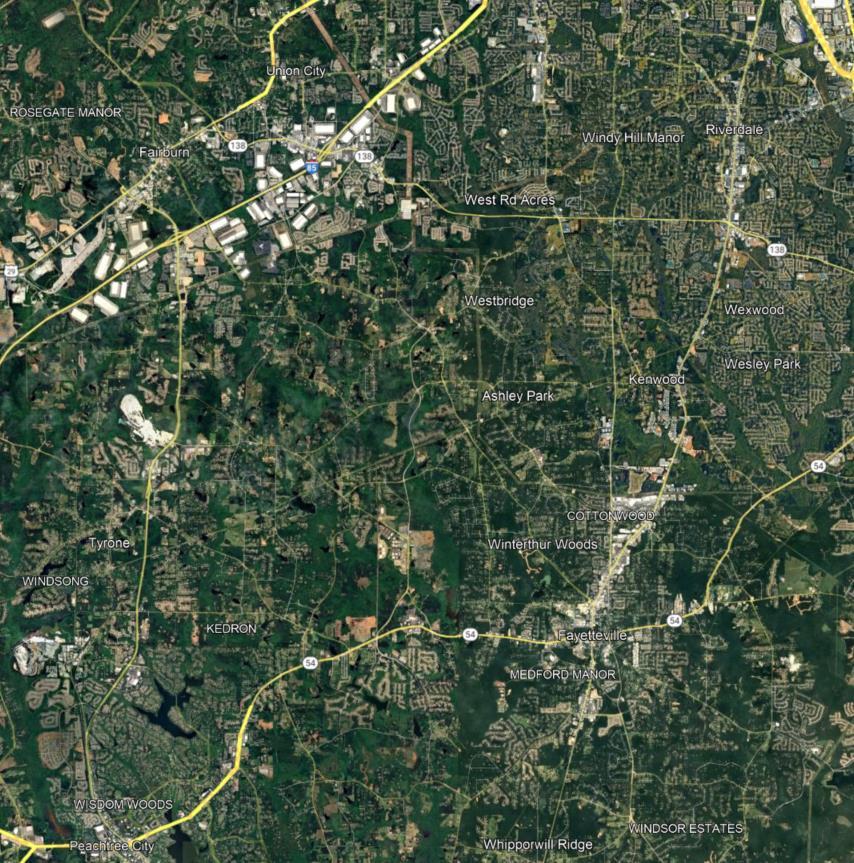
Proximity and Connection of Fayetteville to Jobs
Proximity to work is a key factor for residents choosing where to live. There are nearly 40,000 jobs paying at least
$40,000 per year within 10 miles of the study area. The most popular sector within this area is educational services (13% of jobs) followed by Manufacturing (12%.) andHealth Care and Social Assistance (11%). You can see the majority of jobs are concentrated along Highway 74 through Tyrone and Peachtree City, as well as Highway 85 through Kenwood and Downtown Fayettevi lle. The Downtown being farther away from the I-85 corridor that houses major job centers, such as the Airport, is a hindrance to the City and has lead to the exponential growth of Tyrone and Peachtree City. However, with new commercial development, Downtown Fayetteville will be able to provide more local employment options.
Employment w/in 10 Miles - Top 10 Industry Sectors
Density of Jobs over $40k/year within 10 miles of Downtown Fayetteville (2021)


Total Employment by Distance from Downtown Fayetteville

10
5
0
SOURCE: Noell Consulting Group, Google Maps, OntheMap, Gwinnett County
8/16/2024


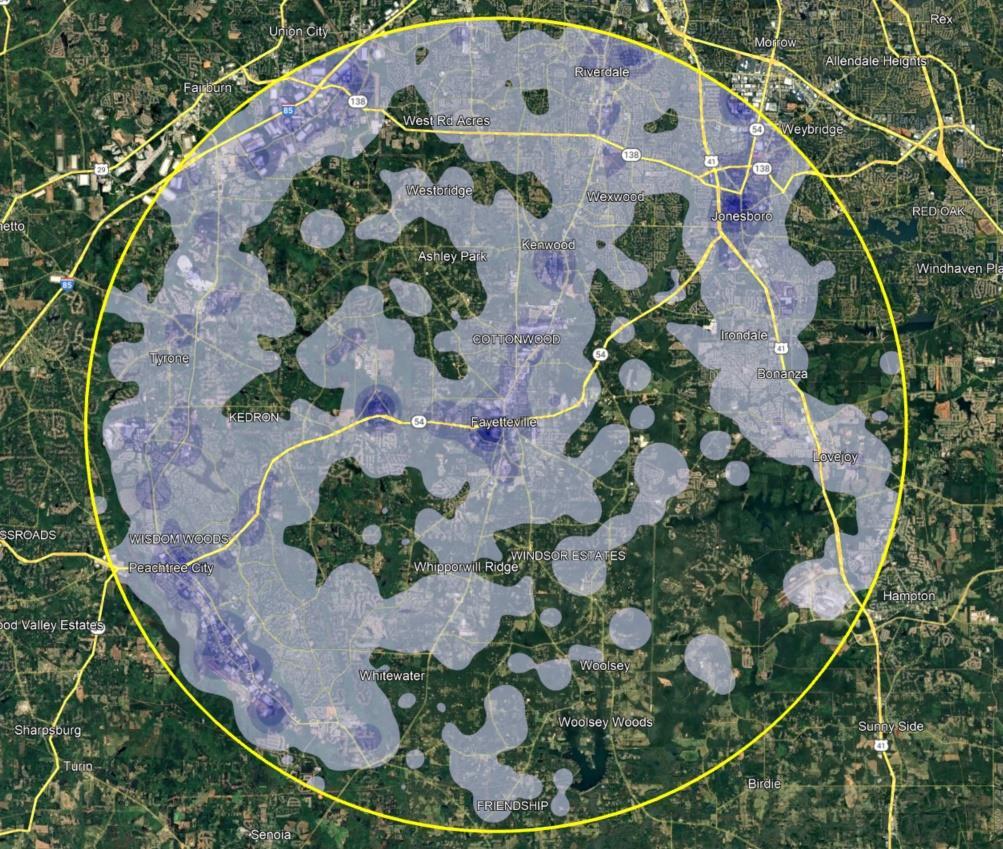
Exhibit 17
Fayetteville employs 16,223 people in the city limits. The largest employment sectors within the city are Healthcare and Soci al Assistance, followed by Retail Trade and Accommodation and Food Services. The City is broken down into Construction/manufacturing/warehouse jobs concentrated to the east and north,medical and technical jobs to the west, and public administration jobs concentrated in Downtown.
Roughly 41% of City employees earn more than $3,333 per month or $40,000 annually, 33% earn between $1,250-$3,3333 a month ($15,000 - $40,000 annually), and 25% earn less than $1,250 per month ($15,000 annually). Of the 16,233 employees, 15,395 live outside of Fayetteville's limits and commute in, pointing to what could be a lack of housing options for employees nearby. 828 Fayetteville residents live and work within the City, and 7,277 of residents commute out of the City for work.
Total Jobs in Fayetteville (2021)
per month or less, 25% $1,251 to $3,333 per month, 33%
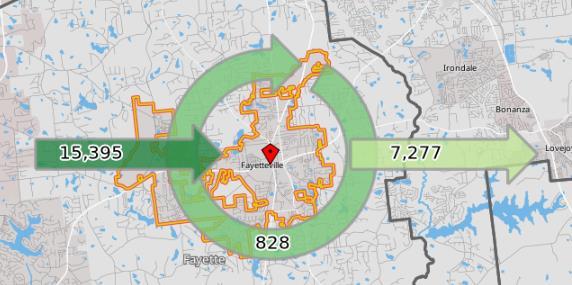
4.9% of total employees live and work in Fayetteville compared to the 13.77% that live and work in Peachtree City.


SOURCE: Noell Consulting Group, Google Maps, OntheMap, Gwinnett County
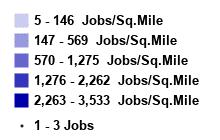
Exhibit 18
Study Area Resident Work Outflow, Residents Earning Over $40,000/Year
Commuting patterns of residents can help identify target audiences for residential development. While residents making over $40k/year within a 4-mile radius work all over the metro Atlanta area, the highest concentration (11%) work in the Greater Fayetteville area. A substantial amount work near HartsfieldJackson International Airport (6%), as well as Midtown Atlanta (5%) and Peachtree City (5%).

SOURCE: Noell Consulting Group, Google Maps, OnTheMap


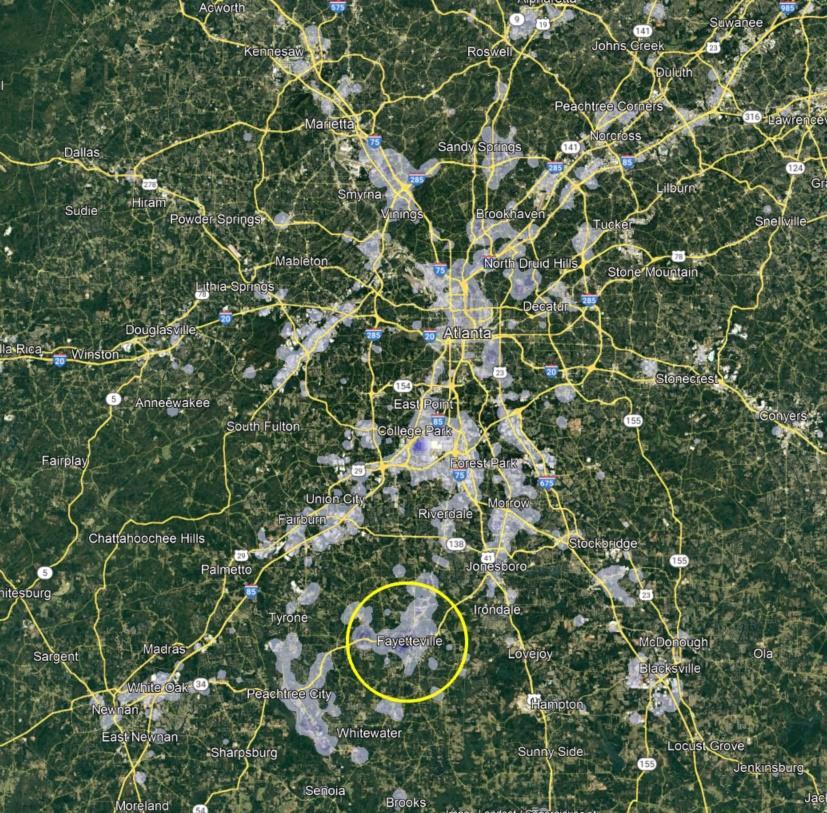
Exhibit 19
Downtown Fayetteville Work Inflow, Residents Earning Over $40,000/Year
In the previous exhibit we looked at where residents of Fayetteville work. This exhibit shows where people who work inside the Fayetteville limits are commuting in from.
The majority of jobs paying more than $40k/year in Fayetteville are in the healthcare or public administration fields. Roughly 18% of people who work within 4-miles of Fayetteville are already living close by and within the city. Another 11% of workers live nearby in Tyrone, Peachtree City, and Jonesboro.
As the chart points out, Fayetteville is a central location where the majority of workers in a 4 mile radius South of I-20 prefer to live.
Top 10 Resident Locations (By Zip Code)


SOURCE: Noell Consulting Group, Google Maps, OnTheMap
8/16/2024


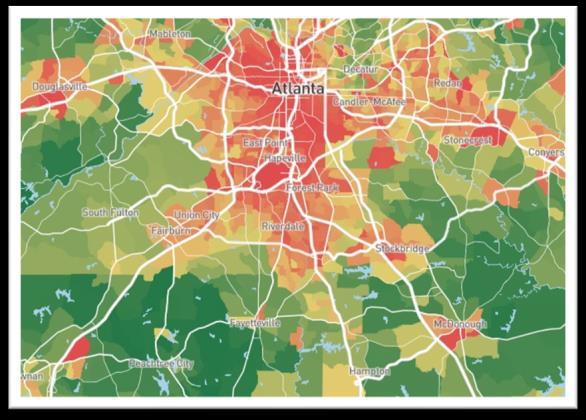
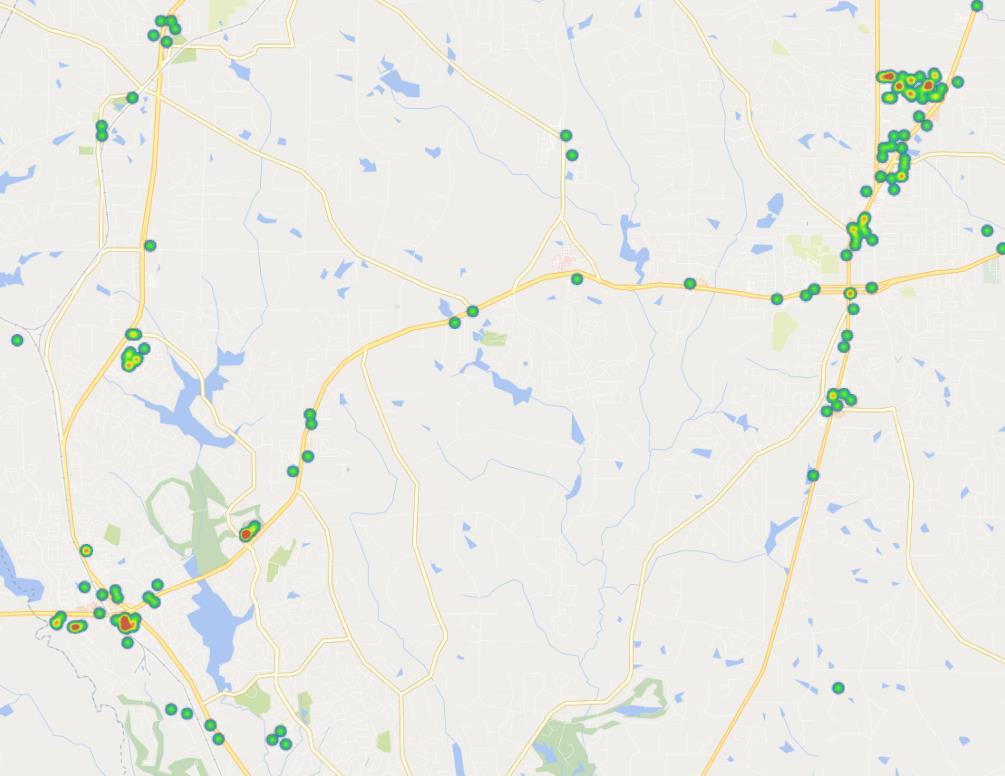
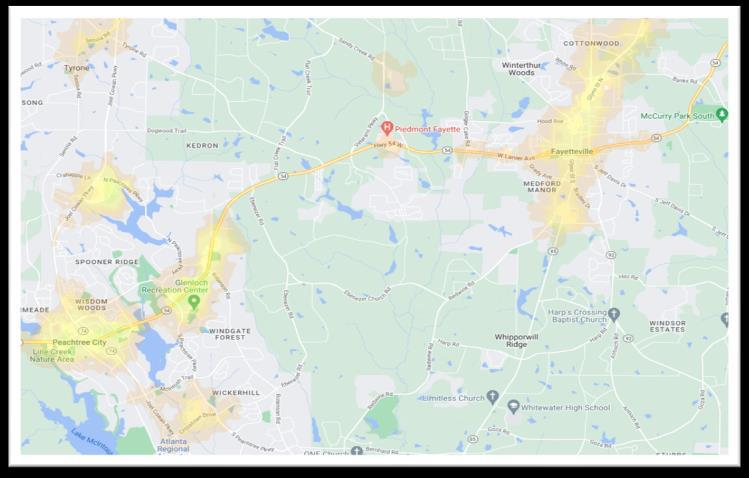
The heat map within this exhibit shows area crime in relation to the City (provided by Crimegrade.com). The majority of crime in the City of Fayetteville occurs in the east side of the city and east neighborhoods. However, this pales in comparison to the amount of crime occurring in more established areas of Georgia, such as Atlanta, as well as some areas of Georgia similar to the Fayetteville area, Marietta and Douglasville, and those cities south of I-20 such as Stockbridge, McDonough, and Newnan. A low crime rate is excellent for future families moving to the area who want a safe place to raise a family.
SOURCE: Noell Consulting Group, Crimegrade.com
8/16/2024
Exhibit 21
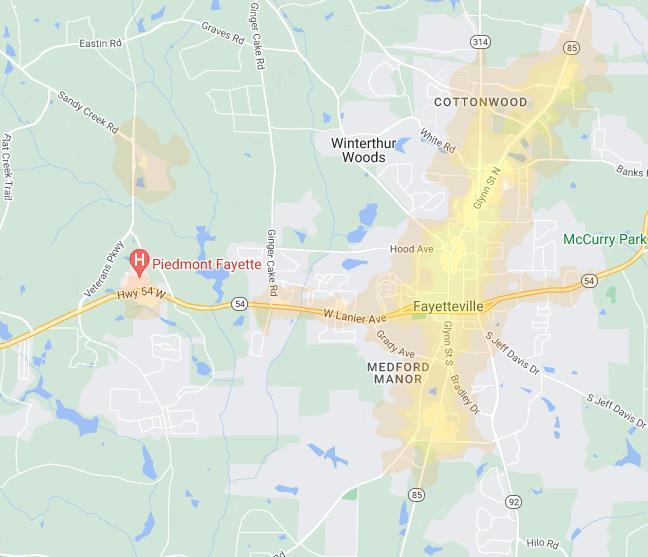
Commuting from the City


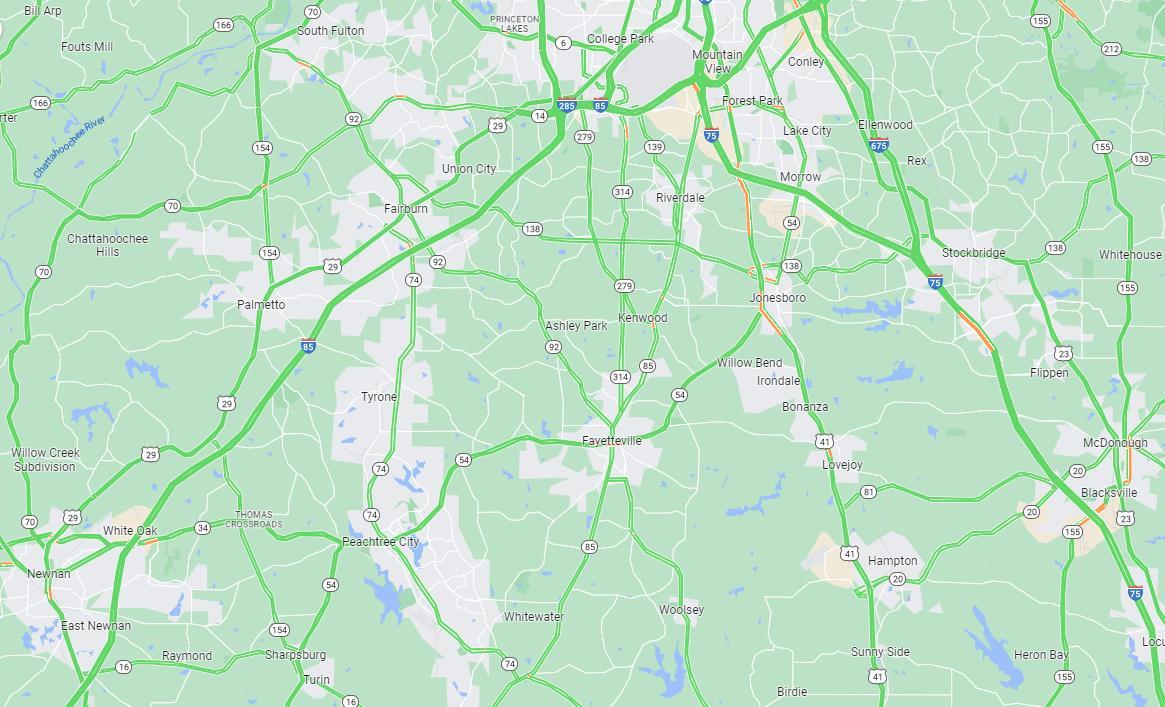


The map in this exhibit is a traffic map showing commute times via automobile in and around the Fayette County area per data from Google Maps. The City of Fayetteville'sproximity to I85 and I-75 hinders the location slightly, hence why other cities such as Newnan and Peachtree City have grown considerably given their good interstate access. However, Fayetteville is still within adequate driving distance to major employment cores such as Hartsfield-Jackson Airport, South Atlanta, and along I-85 and I-75 which are only 7- 13 miles (15-20 mins) away. Further, as seen previously in the work inflows map we see that the majority of workers live in the cities highlighted above as well as work locally within the city or commute to the cores listed above.
SOURCE: Noell Consulting Group, Trulia.com
Exhibit 22


SOURCE: Noell Consulting Group, Yelp, Bing Maps
8/16/2024
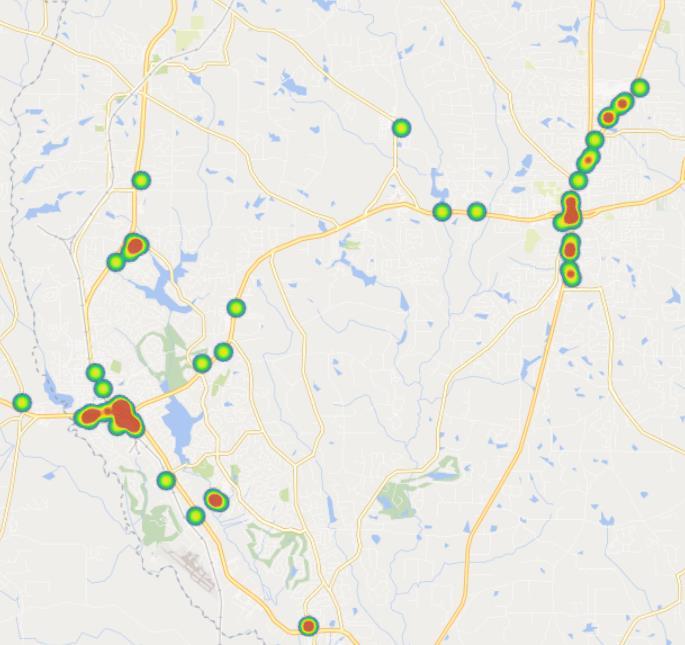
Living close to restaurants and bar options is a key factor for many households when choosing where to locate, as well as for businesses when choosing office space. The heat map within this exhibit shows restaurant and bar options near the City that have been reviewed by users of Yelp.


There are more than two dozen dining options and bars in Downtown Fayetteville. Although the majority of dining options in Downtown are chain restaurants, there are some more boutique options such as Line Creek Brewery and City Cafe and Bakery. Farther west there are more options. geared towards a fancier dining experience at Trilith Studios. Farther west is Peachtree City which has a plethora of dining options from Breweries like Line Creek to Ted's Montana Grill.
In terms of walkability, there are some restaurants within walking distance to Downtown, however most are accessible with a short drive. Although Downtown is well served, it will be important for the city to allow more unique infrastructure, like breweries or a dog park with beer and food. To the extent this can be maximized, the stronger the appeal of Downtown Fayetteville being seen as a lifestyle amenity that many residents coming from the north seek.
Exhibit 23


As with restaurants and bars, living close to retail and grocers is an important factor to residential households when choosing where to live and to an extent, office decision makers when choosing where to locate their business. By pulling Yelp data from the area we are able to visualize where key retail and shopping nodes are in relation to the City.


SOURCE: Noell Consulting Group, Yelp, Bing Maps
The largest retail corridors in Fayette County are located in Downtown Fayetteville and Peachtree City. Downtown Fayette offers a lot of shopping/retail options from large chain stores like Dick's or JCPenney as well as many grocery options such as Kroger and Publix. Peachtree City has many of the same offerings as well as some more boutique shopping/grocery options, such as Sprouts.
All in all, the level of retail/shopping is more than suitable for the area.
Future development ideas would be to add higher level shopping and retail to the area such as a Sprouts as the median income increases.


Exhibit 24
Walkability

Fayetteville Overall


Pavilion


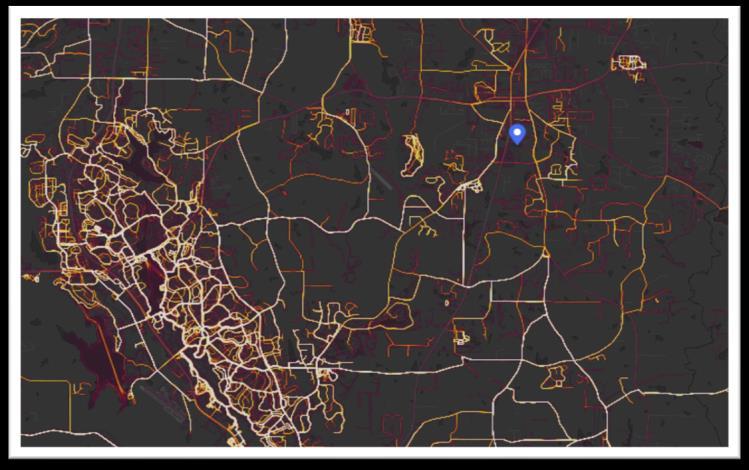


Walkable environments are key to economic competitiveness and creating healthy communities. Increasingly, Millennials and seniors are looking for walkable environments, with studies showing 80% of 18 to 34-year olds want to live in walkable neighborhoods and per AARP surveys roughly 60% of those over 50 want to live within one mile of daily goods and services. Christopher Leinberger of George Washington University completed a study of WalkUPs (Walkable Urban Places) throughout the nation, including Atlanta, and discovered that office, retail, and rental housing achieved 30%, 144%, and 12% premiums respectively over their drivable, suburban counterparts. Furthermore, a study completed by the Wall Street Journal indicated a 1.69% premium in home prices for a one-point increase in Walk Score. The City of Fayetteville is "Somewhat Walkable" according to Walk Score with much of the area still being dependent on vehicles to access grocery/retail/entertainment. However, foot traffic is still active in the area as shown by the white lines on the top right map. Peachtree City's walkscore is very similar to the City of Fayetteville yet they have an infrastructure that allows golf carts to take presence over foot travel. To increase the Walkability of the City of Fayetteville, the city could invest in more sidewalks as well as nature trails to increase foot traffic to the area which will be a major draw for empty nesters as well as younger audiences.
SOURCE: Noell Consulting Group, WalkScore, Strava
8/16/2024
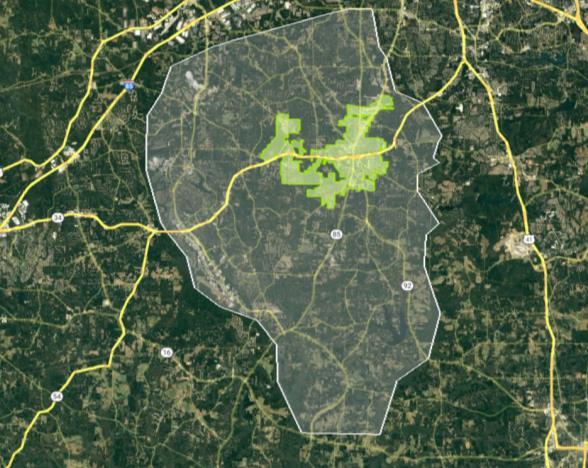
Exhibit 25
City School Districts

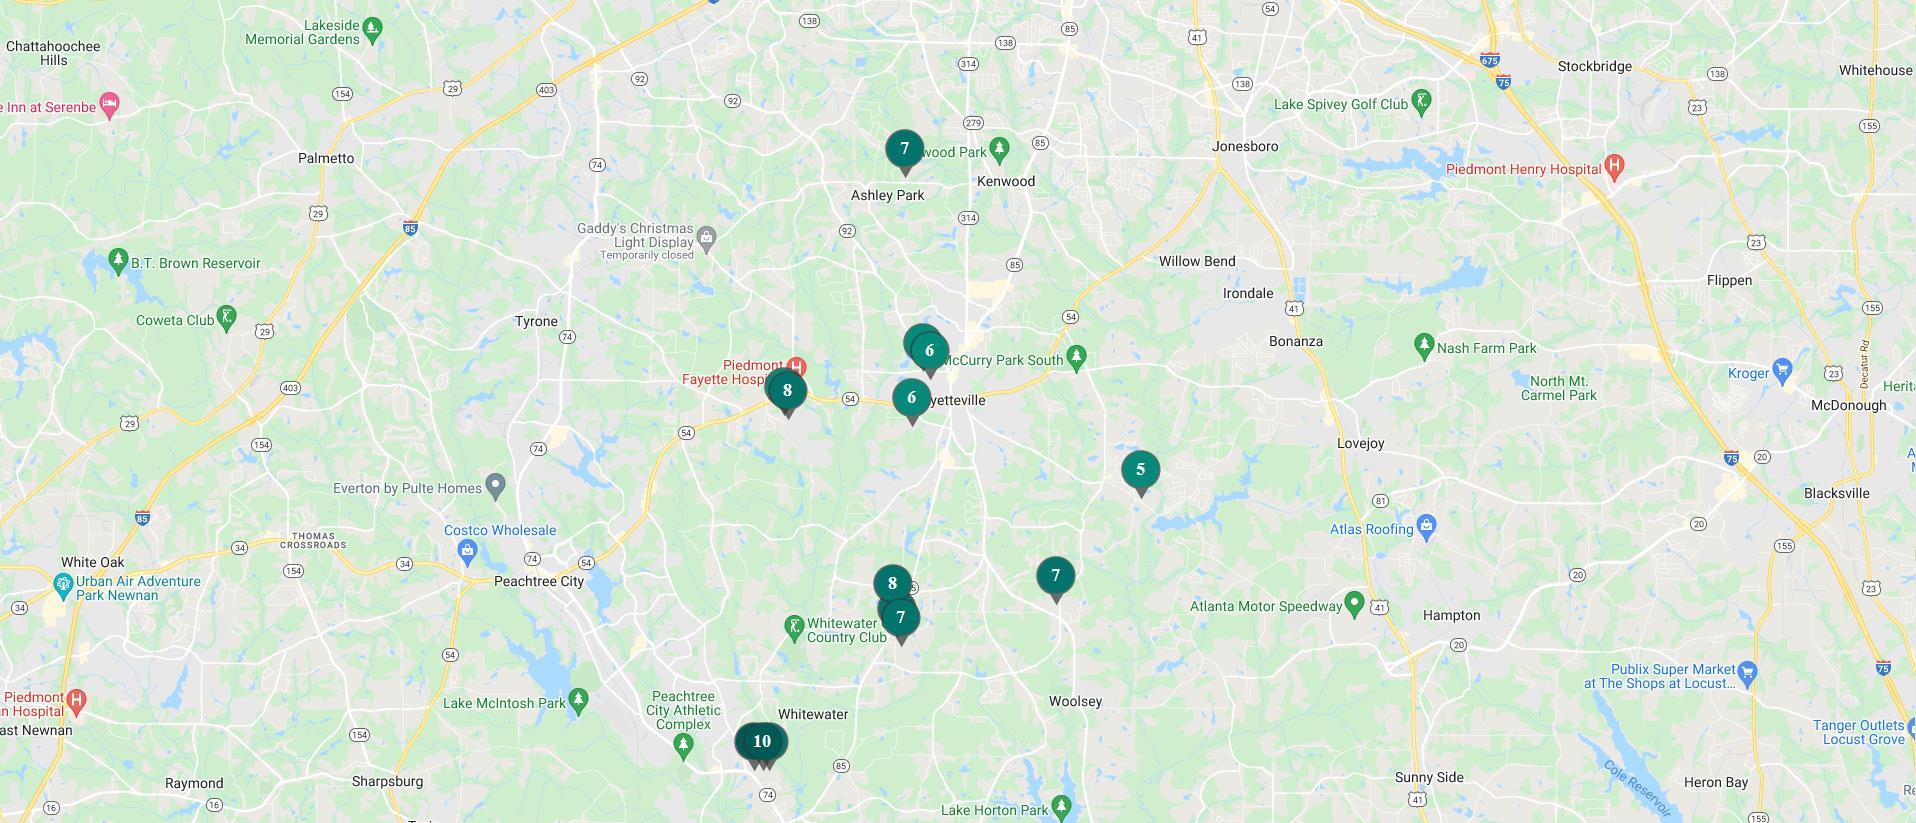


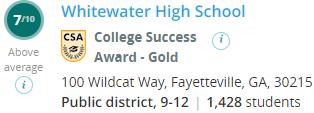
This exhibit presents context with regard to the local school offerings in the City of Fayetteville, the north city limits and south city limits are separated out. Downtown Fayetteville's assigned elementary, middle, and high schools rank above average in quality. After market interviews, the highly rated schools are a major draw to younger families coming to the area and buying in the Downtown area, though this face should not turn off prospective family buyers with older aged children or empty-nester/downsizer audiences not affected by the assigned schools.
SOURCE: Noell Consulting Group, Great Schools
8/16/2024
City Demographic Profile
Fayette County Population
2024 Estimate 123,984 Households 44,687
City of Fayetteville Population
2024 Estimate 20,724 Households 7,899
Fayetteville Capture of County
2024 Census Estimate 17% Households 18%
Source: NCG, US Census Bureau, Spotlight by Environics Analytics
Fayetteville captures roughly 17% of Fayette County's population, with a 2024 census estimate of 20,724 persons and 7,899 households living in the city. Fayetteville has a smaller population in comparison to similar Atlanta suburbs including Newnan, Peachtree City, and McDonough. Fayetteville's population is fairly diverse across age, race, and income cohorts. While being historically more rural than suburban analogs, recent development activity and housing market trends have fueled growth in Fayetteville. 8/16/2024
Source: NCG, US Census Bureau, Spotlight by Environics Analytics
The City of Fayetteville has steadily grown since 2010. Based on 2029 census based estimates, the strongest growth will have occurred from 2024 - 2029 with an 5.25% population increase, or just over 1.05% per year.
That growth primarily came from increases in the population aged 18 - 34 and 55 - 85+, and the Black/African American and Asian populations. This points to a growing number of young singles and professionals as well as empty nesters and retirees - many of whom will require greater variety in housing products.
Decreases in the population age 5 - 17 and 35 - 54 indicate there are fewer families with young children in Fayetteville, again signaling a need for a variety of housing products behind the traditional single-family home.
28 Age and Income Analysis of the City of Fayetteville and Comparison to Fayette County 2000 - 2029 (Estimates)

Growth By Age (HHs $50k+ Only)
Household Growth by Income
$200,000 +
$150,000 - $200,000
$100,000 - $150,000
$75,000 - $100,000
$50,000 - $75,000
$35,000 - $50,000
of Fayetteville Fayette County
29
Summary of Renter Households in the City of Fayetteville, 2024
Of the 7,194 households in Fayetteville, roughly 29% or 2,077 are renter households. Of the renter households, 34% of them earn less than $35,000 a year, 17% earn between $50,000 - $75,000, and 35% earn more than $75,000 annually. Households earning less than $35,000 annually are likely renting due to income restrictions and a lack of affordable housing options, but there is a strong share of renters who could afford to own but choose to rent. Renters are split fairly evenly amongst household type (singles, married couples, and other family), and age distribution (25-34, 35-44, and 45-54).
SOURCE: Noell Consulting


Description
How They Use Their Units
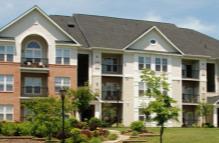
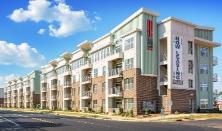
Professionals working in the area seeking a lifestyle and easy access to employment and entertainment.
Singles over 35 seek convenience in quieter setting. Many have relocated to the area for work and may choose to rent before buying.

Couples mostly in their 30s, with some late 20s and early 40s. A mix of recently married and dating. May be recent relocatees.
Use unit as crash pad and place to unwind. Often more active/out and about. Trade space for less rent. Appreciate well-executed building amenities. Tend to stay in more than younger counterparts. More likely to cook and host. Value space, quality, but not excessive finishes, and functional unit layouts. Eat-in more often, but still enjoy going out. Tend to stay local. Value amenities, and have friends over on a frequently.

Mature couples and empty nesters. Established and seeking home close to work and in the suburbs.
A true home. Eat-in most nights and host friends on a regular basis. seek spacious kitchen and living areas. Often down-sizing and need extra storage.

New parents and those with young and early school-aged children. Some single parents working in the area.

Students, recent graduates, and working roommates who moved our of their parents homes or are new to the area for jobs and school.
Seeking space and functionality. Values finish levels and amenities but will make trade-offs for price.
Most space for the money and keeping absolute rents lower. Larger floorplans with a minimum of 2BRs.
Seek areas with a trendy local perception and proximity to entertainment, employment and retail. Downtown core and Trilith only areas in the County that feature this.
Value proximity to employment and retail, but will generally prefer quieter neighborhood areas.
Can afford higher end product with dual incomes, will likely be saving to buy a home in the future. Often look for more spacious product types.
Many will rent units while waiting for homes to be built, but a growing segment is choosing a rental lifestyle. Typically either temporary renters who want space for a growing family while waiting to build/buy, or lack financial means to purchase.
Summary: The City of Fayetteville's diverse renter audiences lead to the potential support for a variety of rental product types, beyond the predominately conventional rental flat communities already in-place or in the coming pipeline. Consideration should be given to rental TH/villa, and/or 55+ rental communities.
SOURCE: Noell Consulting Group
8/16/2024
of Owner Households in the City of Fayetteville PMA, 2024


Description
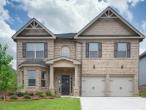
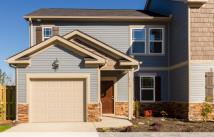
Young and mature professionals seeking access to employment and entertainment. Often more active/out and about. More willing to trade space for price. Often between the ages of 20-35, and many coming out of apartments nearby, or graduating and coming back to where they grew up and looking to purchase their first home at an affordable price.
Typically fairly affluent dual working couples, primarily 35-45, value both work access and neighborhood quality. Most likely first time home buyers ready to settle in the suburbs, or looking for the best value home for a decent price. Often coming from rental communities in the City, as well as out-ofmarket move-ins.
Mix of first-time and moveup buyers from existing product in the market, or relocates from out of market. Looking for a home that offers room to grow as the family expands. Will be concerned with school districts, neighborhood safety, and where other young families are located.
Established families with older children and teenagers. May include some executive households and corporate employees, or divorced households and single parents. Likely upgrading into larger homes or moving in from out of market.
Mature couples who are either looking to simplify lifestyle with smaller homes, or upgrade to accommodate grandchildren and family visitors. Most likely to purchase homes in presale phases or build custom dream homes to retire in.
Retired senior couples and some widows who are looking for a maintenance free lifestyle but don't want to leave the area. Will appreciate quality and may have money from prior home sale to spend, but will be modest in spending retirement incomes and likely to downsize.
Citywide we believe Fayetteville has a lack of product diversity, with an estimated 85% being conventional single-family homes and/or estate homes. This leaves very little opportunity for those looking for lower price points, maintenance-free products, and/or homes in a more walkable lifestyle option. An estimated 50% of the market audiences have the majority of their preferences being non-typical SFD products, leaving a significant market gap. Also worth noting is that many of the under represented housing products are more dense, helping to justify higher land prices and smaller parcel sizes which is a majority of the undeveloped land in the City, but also helping to keep absolute home affordability.
SOURCE: Noell Consulting Group
8/16/2024
Exhibit 33
Fayetteville Growth, Gentrification, and Implications to New Housing Product Needs
Fayetteville Household Projected Growth Next 5 Years by Age and Income, 2024 - 2029
Land/construction costs do not justify without substantial subsidy
High - Decreasing opportunity for the private sector to hit these price points without subsidy
Medium - Moderate ability for the private sector to deliver this product without subsidy
Low - Strong ability for the private sector to deliver this product without subsidy
Without the ability for new housing stock to hit the potential demand levels, particularly rental product below $800 and for-sale product below $300,000, demographic projections forecast a loss in households earning less than $75,000, and the majority of future growth is projected from those earning greater than $75,000 through 2029.
While much of the new apartment development is obtainable for those earning above $75,000, land and constriction costs are making it harder for those earning under $75k, and especially under $50k to rent in the community, making renter households earning $35-50k the most at risk. Garden apartments represent the best market based opportunity to solve this, or relying on LIHTC subsidized deals.
New single-family homes are generally obtainable for those earning above $150,000, but it is largely only townhome and/or condominiums that are affordable to those earning $75-150k. Increasing land and construction costs are making it considerably harder for those earning $75-100k (often young singles/couplesand starter families) to purchase. This makes those in the estimated 113150% AMI levels ($75-100k) the most at risk. Starter townhomes, including one bedrooms and those without garages to maximize affordability, represent the best opportunity to solve this.
SOURCE: Noell Consulting Group based on data obtained from US Census and Claritas.
8/16/2024
34
Fayetteville Depth For Affordable Units
Fayetteville Households by Age and Income, 2024

SOURCE: Noell Consulting Group based on data obtained from US Census and Claritas.
8/16/2024
Exhibit 35
Historical and Projected Job Growth to Apartment Absorption Relationship in Atlanta Metro
Atlanta Metro Job Growth
The Atlanta Metro Area has seen a very strong rebound from the Covid Pandemic, netting 48,743 new jobs annually on average from 2020 through 2023. The national economy is expected to moderate in the coming years as the economy faces "demographic headwinds", including mass retirement of Boomers, fewer adults opting to have children, and the flow of immigration in serious question; hence constricting options to grow the labor force. To this, Atlanta's economy will continue to post solid growth, albeit at a more moderate pace (52,900 net new jobs annually) relative to the 2010s (65,000 net new jobs annually). With the exception of 2022, which was impacted by a drop in household formations and robust absorption in 2020 and 2021, apartment absorption in the Atlanta Metro has been very strong, averaging nearly 10,000 units absorbed annually from 2017 through 2023. 2024 has seen explosive growth in absorption and could be a record-setting year, although we believe the pace of absorption will soften a bit from that seen in Q2, with the more moderate economic growth nationally and regionally, and reduced interest rates positively impacting home affordability, tempering demand thereafter. Overall we expect demand to remain solid through 2028, averaging around 12,100 units absorbed annually.
Atlanta Metro Class A Apartment Absorption (Excludes Corporate, Student, Senior, Vacation, and 100% Affordable)
SOURCE: Noell Consulting Group, Costar, Economy.com | Moody's Analytics
South of I-20 Capture of Atlanta Metro Class A Apartment Absorption
Atlanta Class A Apartment Absorption & South of I-20 Capture
The South Metro Area, which largely includes all of Metro Atlanta below I-20, saw its capture of metro demand drop significantly from levels seen in the 2000s, when it captured nearly one-third of metro demand. The rise of intown and the damage from the Great Recession massively slowed demand in the area. With aging product and strong logistics and airport growth on the southside, demand has regained momentum since 2020, with the area averaging around 19% capture of the metro from 2020 - 2023 (up from 8% in the 2010s). High intown housing costs, delivery of quality product, and continued job growth will allow the area to slowly build on this capture through 2028, capturing around 24% of demand during the coming years, or around 2,900 new units annually, on average.
South of I-20 Class A Apartment Absorption
SOURCE: Noell Consulting Group (based on surveys of properties)
SOURCE: Noell Consulting Group and Costar
Exhibit 37
Fayetteville Submarket Capture of South of I-20 Apartment Absorption
South of I-20 Class A Apartment Absorption & Fayetteville Capture
Over the past cycle (2011-2019) the Fayetteville market averaged a 5.3% capture of the South of I-20 market, heavily driven by the delivery of Meridian at Lafayette, boosting the market above its historic average of <1% in 2006-2010. The delivery of two additional deals between 2020-2023 and the onset of the COVID-19 pandemic only increased this trend as more urban dwellers relocated to suburban locations to save on living expenses while not as tied to daily commutes. Going forward we believe this capture rate will continue its gradual increase as seen from 2011-2019, largely due to additional planned deliveries. The result is a forecasted average of 225 units per year from 2024-2028.
Fayetteville Class A Apartment Absorption
SOURCE: Noell Consulting Group and Costar
Exhibit 38 (Page 1 of 2)
South Atlanta Supply and Demand Analysis

1/ Employment growth from Economy.com
3/ North Gwinnett submarket and City of Duluth shown above
SOURCE: Noell Consulting Group, CoStar, Economy.com


2/ Noell Consulting Group analysis based on larger analysis and trends of the market.


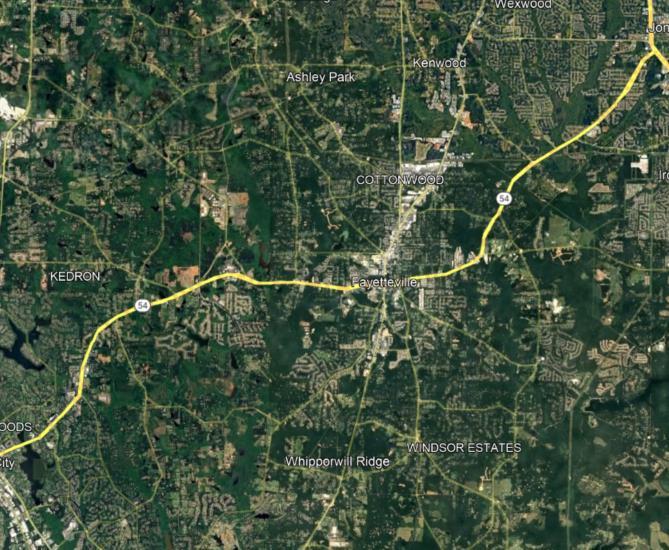


Exhibit 38 (Page 2 of 2)
South Atlanta Supply and Demand Analysis
NOTES:
1. The numbers found beneath the year columns for each project indicate the percentage of the year the projects are expected to be in leaseup.
2. Projects that delivered in 2023 or 2024, but were/are currently in lease-up are designated in PURPLE, with the number of outstanding units as of January 1st, 2024 listed. Projects that are currently under construction are designated in GREEN
3. There are currently 16 units in lease-up and 0 units under construction in the submarket. There are an additional 1,384 units planned, bringing the total pipeline to 1,400 units. When accounting for matriculation, including projects that drop out, convert to for-sale, are delayed, etc., this pipeline equals 723 units that we forecast will come to market by the end of 2028. This is less than our forecasted demand of 1,127 for the same period, resulting in unmet demand of over 400 units which could be filled with the second phase of Fayetteville TC.
SOURCE: Noell Consulting Group, CoStar, Economy.com
8/16/2024
1/ Claritas, Inc. for HHs 65+.
2/ AARP based on National average.
3/ Noell Consulting using modified estimates from the US Census.
4/ US Census Bureau
5/ From previous interviews and research with analogous facilities in the
SOURCE: Noell Consulting, Claritas, AARP, US Census
8/16/2024


4
5
1
8
9
Application Fees: $25-$35 Per Applicant
Amenity Fee: $300 - $450 per application
Pet Fees: $300-$400 non-refundable $45-$55/mo. Rent - per pet
Parking Fees: Free surface. $65 first, $50 second, $75 reserved
Parking Ratio (Per Bed): 0.8 - 1.0 per bed
Storage Units: $25-$1000/mo. Depending on size
SOURCE: NCG, CoStar
42 Comparison of Recommended Positioning for the Subject Site Relative to Key Competitors in the Market - Weighted Average


SOURCE: Noell Consulting Group based on surveys of properties.
Rental Community - Solstice (1111 Oakley Industrial Blvd)
Developer Name Peak
App. + Admin. Fee: $90/$100
Owner Name Peak Management Pet Fees: $350/$20
Property Manager Name Peak - Solstice Storage Fees: $50/month Year Built 2017
Class + Type: Class-A / Mid-Rise
Lease Up Pace: N/A
Walk Score®: 29 - Car Dependent
Parking Type: Surface
Total Spaces 522
Market Audience: Singles take up the majority of 1 bedroom units as opposed to couples while roommates tend to occupy the 2 bedroom units as opposed to couples. A large number of residents are employed at the airport along with the Tyler Perry and Trilith Studios
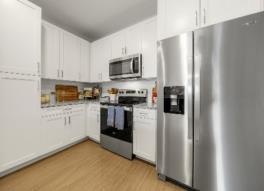
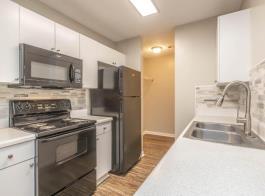
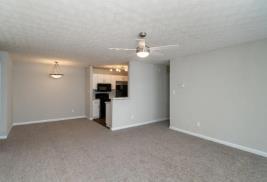
Building Summary:
Ceiling Height and Finish: 9-10ft ceilings, fans
Lighting and Fixtures: Lighted ceiling fan, track lighting in kitchen
Flooring: Vinyl flooring, carpeted bedrooms
Cabinets and Hardware:
Countertops: Granite countertops, under-mount sink
Appliance Package: SS appliances, single-door refrigerator
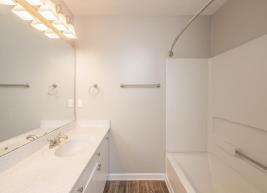
Laundry and Bath Detail: In unit W/D, shower/tub combo,


Source: Noell Consulting Group, CoStar Windows and Balconies: Double pain windows, balconies
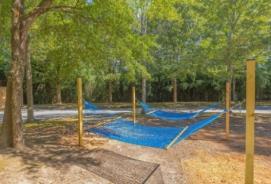
Additional Features: Volleyball courts, walking/biking trails, car charging stations, car wash, dog park
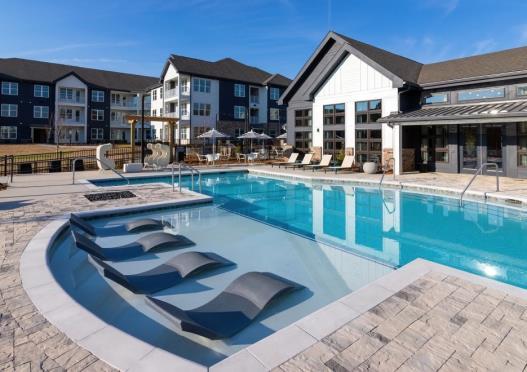
Community Features and Amenities: Courtyard, grilling station, pool,

Rental Community - The Dylan at Fairburn (6010 Renaissance Pky)
Developer Name - App. + Admin. Fee: $150/$100 (Reservation Fee)
Owner Name NPRC Fairburn LLC
Property Manager Name AMP - The Dylan at Fairburn
Pet Fees: $350/$35
Storage Fees: $30 - $50/month Year Built 2020
Class + Type: Class-A / Mid-Rise
Lease Up Pace: N/A
Walk Score®: 31 - Car Dependent
Garage Fees: $175/month (48)
Parking Type: Surface
Total Spaces 400
Spaces/Bed:
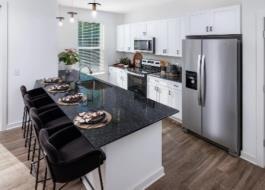
Market Audience: About half local from Atlanta moving for affordability and half from out of state moving for work. Mainly Delta, Airport, Amazon, Film Industry. 3-beds are young families, home office. 1-beds are couples downsizing or young singles. 10% 55+. Some residents leaving due to affordability concerns.
Building Summary:
This is a 3-4-story building with spacious amenities that have a great atmosphere. Although they have wellexecuted amenities for this market, the volleyball and bocci ball courts are never used. Standard unit
Ceiling Height and Finish: 9 ft ceilings
Lighting and Fixtures: Lighted ceiling fan in bedrooms, pendant and recess lighting in kitchen
Flooring: Hardwood style flooring, carpeted bedrooms
Cabinets and Hardware:
Shaker style cabinets
Countertops: Granite countertops
Appliance Package: SS appliances, French door fridge, smooth-top range, garbage disposal
Laundry and Bath Detail: Stacked W/D, double vanity (select units)
Windows and Balconies: Standard punch windows, balconies
Additional Features: EV charging stations, volleyball, bocce ball
Community Features and Amenities: Heated pool, grilling stations, micro-offices, cross-training fitness center, dog park
Source: Noell Consulting Group, CoStar
8/16/2024


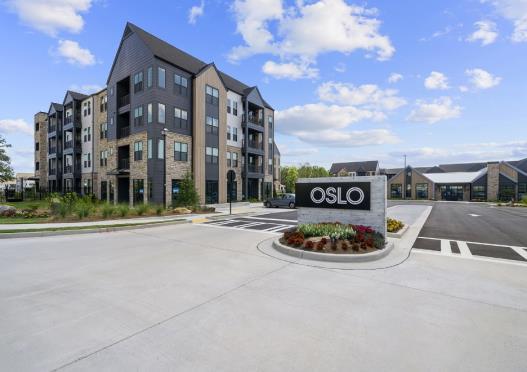
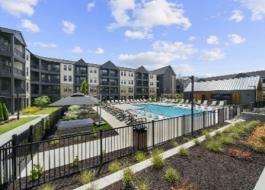
Competitive Rental Community - Oslo (7000 Renaissance Pky)
Developer Name South City Partners
App. + Admin. Fee: $150/$100
Owner Name South City Partners Pet Fees: $350/$35
Property Manager Name Greystar Storage Fees: $35 - $50/month Year Built 2024
Class + Type: Class-B / Garden
Number Of Stories 3
Walk Score®: 50 - Car Dependent
Parking Type: Surface
Total Spaces -
Spaces/Bed:
Garage Fees: $200/month -
Market Audience: Delta employees, responders, smallest units going first. Leasing mentioned many are asking for section 8 housing and/or senior living
Building Summary:
Feb 2024 move-in, will be completed Aug 2024. Really well executed community with unique design, strong finishes and nice amenities.
Ceiling Height and Finish: 9'
Lighting and Fixtures: Recessed Flooring: LVP
Cabinets and Hardware:
White or Black Shaker Style Cabinets
Countertops: Granite Counters, White Tile B/S
Appliance Package: SS Appliances, French w/ Ice, Standalone Electric Range
Laundry and Bath Detail: Tub/Shower Combo, LVP
Windows and Balconies: Punch Windows, Balconies
Source: Noell Consulting Group, CoStar

Rental Community - Marlowe South Fulton (5617 Oakley Industrial Blvd)
Developer Name Greystar
App. + Admin. Fee: $99/-
Owner Name Greystar Real Estate Partners Pet Fees: $400/$20
Property Manager Name Greystar - Marlowe South Fulton Storage Fees: $70 - $150/month (36) Year Built 2024
Class + Type: Class A / Garden
Number Of Stories 3
Walk Score®: 48 - Car Dependent
Parking Type: Surface
Total Spaces -
Spaces/Bed:
Garage Fees: $150/month (16) -
Market Audience: Leasing said two-beds are leasing the quickest. Residents like the growing area and want to be close to the highway. Working at Airport, Delta, Education, Govt. Residents are looking for new product.
Building Summary:
New standard garden style deal outside of Fairburn. Trades traffic with Oslo, Solstice, Riverside, and The Dylan. Strong finishes and amenities.
Ceiling Height and Finish: 9'
Lighting and Fixtures: Recessed, Pendant Flooring: LVP
Cabinets and Hardware:
White Shaker Style Cabinetry
Countertops: Quartz Island, Farm Sink, Tile B/S
Appliance Package: SS Appliances, French w/ Ice, Standalone Electric Range
Laundry and Bath Detail: Tub/Shower Combo, Tile B/S, Tile Floor, Double Vanity
Windows and Balconies: Punch Windows, Balconies
Additional Features:
Community Features and Amenities:
Source: Noell Consulting Group, CoStar
8/16/2024


Developer Name Pace Lynch Corporation
App. + Admin. Fee: $75/app + $200/admin
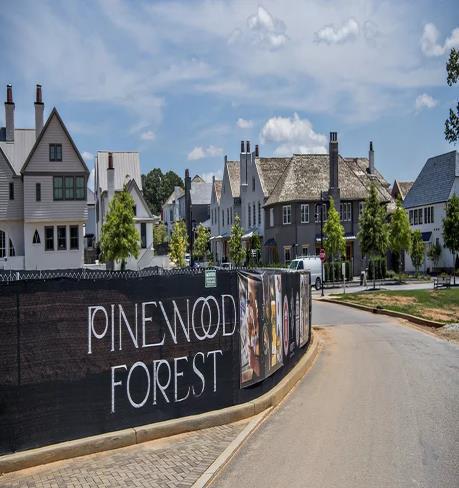
Owner Name Pinewood Forrest Real Estate Pet Fees: $350 fee + $30/mo
Property Manager Name Capstone Companies - Premier Lofts at Pinewood For Other Fees: $30/mo valet trash Year Built 2019-2020
Number Of Stories 4
Lease Up Pace: N/A
Walk Score®: 15 (Car-Dependent)
Parking Fees: $50/mo for 2nd vehicle
Parking Type: Surface/parking deck
Total Spaces 442
Spaces/Bed:
Market Audience: According to the leasing agent, there is a wide mix of age demographics with many young professionals working at local hospital, airport, and other south Atlanta employers as well retirees and families.
Building Summary:
Multi-phase apartment complex that is part of the Pinewood Forest ecosystem, including for-sale resi, retail, office, and movie studio. Leasing has just begun, with 18 units online and another 18 coming online March 1st. All unit phases are expected to be complete and online by the end of Q3 2020, for a total of 263 units that will also include some Studios and 3B's.
Ceiling Height and Finish: 9' ceilings
Lighting and Fixtures: Black track lighting in kitchen/bath, glass pendants in kitchen, lighted fans in living/bedroom
Flooring: LVT throughout
Cabinets and Hardware:
Shaker cabinets w/ SS pulls
Countertops: Granite countertops; subway tile backsplash
Appliance Package: Flat top electric SS appliances with standard SS refrigerator
Laundry and Bath Detail: Stackable full size washer and dryer
Source: Noell Consulting Group, CoStar Windows and Balconies: Large double pane windows
Additional Features: French doors leading to balcony/patio (in select units)
Community Features and Amenities: 24-hour fitness center, lounge, courtyard, pool, grill stations, clubhouse w/ entertainment room, dog park, on-site retail/restaurant, electric vehicle charging stations


Rental Community - The Meridian at Lafayette (665 Lafayette Ave)
Developer Name - App. + Admin. Fee: $85/app + $250/admin
Owner Name Cowart Building Group Pet Fees: $350 fee + $30/mo
Property Manager Name Matrix - The Meridian at Lafayette Other Fees: $45-$85/mo storage Year Built 2017 8/16/2024
Number Of Stories 3
Parking Type: Surface/assigned garage
Lease Up Pace: 25 units/mo Total Spaces 317
Walk Score®: 39 (Car-Dependent)
Building Summary:
Parking Fees: Free surface, $150/mo garage 0.88
Spaces/Bed:
Market Audience: Primarily 60% local families, with the rest comprising of young professionals working at local hospital, airport, and other south Atlanta employers.
Newer apartment community adjacent to Downtown Fayetteville and the price leader in Fayetteville. Offers an updated finished and amenity package and the only community in the competitive set offering dens.
Ceiling Height and Finish: 9'-10' ceilings
Lighting and Fixtures: Track in kitchen, pendants over island
Flooring: Vinyl HW in kitchen, bath and living room. Carpet in bedroom. Cabinets and Hardware:
42" shaker with vertical pulls
Countertops: Two packages, cloud white granite or harbor white granite
Appliance Package: Whirlpool stainless steel with smooth top range
Laundry and Bath Detail: Full sized, washer/dryer, tub/shower combo, standing showers in select units
and Balconies: Standard punch windows, balconies in select units Additional Features: USB outlets
Source: Noell Consulting Group, CoStar


Competitive Rental Community - Retreat at Southpointe (201 Clarendon Pl)
Developer Name Scarbrough & Rolader Development LLC App. + Admin. Fee: $50/app + $199/admin
Owner Name Vantage Point Acquisitions Pet Fees: -
Property Manager Name Asset Living - Retreat at Southpointe Other Fees:Year Built 1995
Number Of Stories 2
Walk Score®: 21
Parking Type: Surface
Lease Up Pace: - Total Spaces 122
Parking Ratio
Parking Fees:1.15
Market Audience: Roughly equal percentages of healthcare workers, air-line employees, studio workers, and locals. There is a 50/50 split in age demographics
Building Summary:
An old class C apartment community east of Downtown Fayetteville. Currently, the only community in the competitive set offering patios.
Ceiling Height and Finish: 9' ceilings
Lighting and Fixtures: Track in kitchen, pendants over island
Flooring: LVP and Carpet
Cabinets and Hardware:
Shaker style with vertical pulls
Countertops: Granite
Appliance Package: Standard black appliances
Laundry and Bath Detail: Plastic Tub liner, washer and dryer connections
Windows and Balconies: Standard punch windows, balconies in select units
Additional Features: Garages
Community Features and Amenities: Picnic area with Barbecue
Source: Noell Consulting Group, CoStar


Developer Name N/A
App. + Admin. Fee: $100/app + $300/admin
Owner Name Saratoga Capital Partners Pet Fees: $400 fee + $45/mo
Property Manager Name Alexander Properties - The Hundred Exchange Other Fees:Year Built 1988
Number Of Stories 3
Lease Up Pace: N/A
Walk Score®: 13 (Car-Dependent)
Building Summary:
3B/2b
Parking Type: Surface
Total Spaces 388
Spaces/Bed:
Parking Fees:1.04
Market Audience: Roughly equal percentages of healthcare workers, air-line employees, studio workers, and locals. There is a 50/50 split in age demographics
An old class A apartment community east of Downtown Fayetteville. Currently, the only community in the competitive set offering dens, sunrooms, and patios.
Ceiling Height and Finish: 9'-10' ceilings
Lighting and Fixtures: Fluorescent light in kitchen, flush lighting in living area, no ceiling fans in bedrooms
Flooring: Vinyl HW in kitchen, bath and living room. Carpet in bedroom.
Cabinets and Hardware:
shaker with SS knobs, subway tile backsplash
Countertops: Granite throughout
Appliance Package: Standard black appliances
Laundry and Bath Detail: Quartz

8/16/2024
The Atlanta housing market, like many American metros, is dealing with several counteracting trends. First, the Atlanta metro has been undersupplied with housing since the Great Recession, with housing permits from 2011 to 2020 falling by 30% from the 2001-2007 average. This chronic undersupply has led to strong home price appreciation, almost 5% per year over this span.
Second, the COVID-19 pandemic dramatically increased spending on housing, which coupled with historically low interest rates led to a boom in housing production. Finally interest rates have increased over the last 18 months, and in response, existing homeowners have withheld their homes from the market and caused existing inventories to decline significantly. New home sales have remained surprisingly strong despite high interest rates because there are simply no existing homes available for purchase.
The homeownership rate for metro Atlanta has tracked national trends, with a major decline following the Great Recession and a long, slow recovery over the 2010's as Millennials moved into home-buying ages and the economy continued to recover. The COVID-19 pandemic caused a surge in homeownership, although some of this surge was due to a decline in renter households returning to live with family. Over the last three years, the local homeownership rate has settled back close to pre-pandemic levels although it should continue to rise slowly over the next several years due to demographic trends.
Metro Values & Housing Supply Source: NCG, S&P / Case-Shiller Home Price Indices, Georgia MLS
The Atlanta metro has been facing low levels of active listings for existing homes since mid 2020. While active listings have increased year-over-year since interest rates spiked in mid 2022, overall listings are still well below historical levels and thus far in 2024 have only seen a small increase. Year over year growth started to trend lower in late summer. Existing homeowners are simply unwilling to put their homes on the market with interest rates around 7% and price appreciation flat.
The level of active listings was relatively stable from 2016 through early 2020, and consequently home price appreciation was relatively stable at almost 5%/year. The metro Case-Shiller price index exceeded the nominal preRecession peak in early 2017 and continued to grow steadily up to the COVID-19 pandemic.
The pandemic-fueled increase in housing demand caused low inventory levels and a massive increase in prices that exceeded the housing bubble by magnitudes, exceeding 25% year-over-year growth in early 2022. Rising mortgage rates largely stopped this appreciation in its tracks, but since the turn of the year, home prices have begun to increase again, reflecting the lack of supply as well as the decades of pent-up demand.
The impact of recent mortgage rate changes has not been uniform across the housing market. Trailing two-month new home sales under $400,000 have cratered and are now below 2010 lows. By contrast, home sales above $400,000 have only declined by 8% since interest rates began to increase.
Home sales have been particularly stable above the $500,000 threshold, with total sales volume exceeding even 2005 bubble-era levels. While some of this difference is due to longer-term inflation, through August 2023, trailing 12-month sales over $500,000 are 1.5 times pre-COVID levels.
These higher-tier homes have been less impacted by mortgage rates because many of these buyers are able to pay with a significant amount of cash and have higher incomes in general, allowing them to absorb interest rate hikes. Price points may have adjusted, but sales volume has held up, while lower-tier buyers have simply been priced out of the market.
Home sales have ceased declining at all price points and have even begun to recover at the under $400,000 price point. Provided that employment levels remain stable, we expect short-term sales at these higher prices to remain at current levels and then return to pre-COVID growth rates of 1-2% per year on average. We do not anticipate lower-tier prices to reach pre2019 levels (e.g., above $420,000 per year) unless interest rates drop back to 4.0%.
The South region, the smallest geography with data available through 1Q 2024, has seen total sales decline by more than 25% from early-2021, although sales have been stabilizing over the last quarter.
The >$500,000 price point has held up slightly better in the South Region than the rest of the nation, while lower price tiers have performed similarly to national trends. Sales over $500,000 in Q2 2023 were still up year-overyear, compared to the national trend that saw them decline slightly. Home prices in the $300,000 to $500,000 are trending down but are still substantially above pre-COVID levels.


Sources: US Census/HUD, Federal Reserve, Freddie Mac
Employment growth, the core driver of the metro Atlanta new home market, was steady and strong for much of the 2010s, averaging 65,000 new jobs per year from 2011 to 2019. The ratio of new home sales per 100 new jobs increased from 17 sales/100 jobs in 2011 to 32 sales/100 jobs in 2019. As the COVID-19 pandemic caused a surge in housing demand, the ratio of sales/jobs increased to 42.2 from 2020 to 2023. The metro area is forecasted to see lower-than-historical job growth levels for the next five years, primarily based on a national decline in prime-age population growth rates. However, we expect housing demand to remain strong since this trend should lead to lower levels of unemployment, stronger wage growth, and higher levels of household formation. Combined with the continued movement of Millennials into home-buying ages, metro new home sales should remain relatively strong at over 17,000 new sales per year, for an average of almost 33 sales/100 new jobs. While this is lower than in the years leading up to COVID-19 and during the Pandemic, absolute levels are higher than in the early 2010s. It should be noted that 2023 total sales are low as there are data lags due to county reporting, but NCG has made adjustments.
ATLANTA METRO NEW HOME SALES
SOURCE: Noell Consulting Group, MetroStudy and Economy.com | Moody's Analytics
Exhibit 57
Atlanta Metro New Home Sales and Attached Share
ATLANTA METRO NEW HOME SALES & ATTACHED CAPTURE
Prior to the great recession, attached product (including both condo and townhomes) accounted for 16%-17% of all new home sales, however, during the recession and the following recovery period, attached product sales rose into the 20%-23% range as new unattached product sales plummeted and large condo buildings, delivering during the recession, had product scooped up by investors / speculators and/or sold in distressed situations. Attached sales have slowly increased as a percentage of new sales since bottoming out in 2015, largely driven by townhome development, as people seek relative affordability in quality locations. As the Atlanta Metro and its suburbs mature, we project this number to increase, averaging around
over the next 5 years.
ATLANTA METRO NEW ATTACHED HOME SALES
SOURCE: Noell Consulting Group (based on surveys of properties)
SOURCE: Noell Consulting Group and MetroStudy
Exhibit 58
OTP Share of Atlanta Metro New Attached Sales
ATLANTA METRO NEW ATTACHED SALES W/ OTP SHARE
The Outside the Perimeter (OTP) submarket, including popular core areas such as Smyrna, Roswell, Alpharetta, and Forsyth, among others, has consistently captured 68-75% of the Metro's new attached sales since 2014. As low inventory levels and increasing prices continue to put affordability pressure on the market, and demographic surges of first-time buyers and Empty Nester/Retirees increasing look for more maintenance-free product, we forecast this capture to maintain around 76-80% over the next five year period. This will result in sales volumes surpassing what has been demonstrated in the most recent 2011-2029 cycle but continuing the more recent averages witnessed in 2017-2021.
OUTSIDE THE PERIMETER NEW ATTACHED SALES
SOURCE: Noell Consulting Group and MetroStudy
Exhibit 59
City of Fayetteville Capture of OTP New Attached Sales
OTP NEW ATTACHED SALES & FAYETTEVILLE CAPTURE
Historically Fayette County has had a significant lack of new attached homes offered, and this has only recently shifted with the addition of townhomes in Trilith (located within the City limits). To understand the potential captures the City could achieve, we examined demonstrated captures at analogous Cities such as Newnan and McDonough on the next exhibit. Based on these we are making a conservative estimate that the City could witness captures ramp up to average 2.4% through 2028, which would result in demand potential of nearly 75 attached homes per year.
CITY OF FAYETTEVILLE NEW ATTACHED SALES
SOURCE: Noell Consulting Group and MetroStudy
Exhibit 60
City of Fayetteville Analog City Attached Sales Comparison
CITY CAPTURE OF OTP NEW ATTACHED SALES
City of Fairburn Capture Peachtree City Capture Newnan Capture Fayetteville Capture Union City Capture
Although Fayetteville has had a historically low capture of the total new attached sales OTP, the projected capture rate is not unreasonable when compared to the new attached sales and capture of analog cities. Newnan and Union City's capture rates have both seen years of 1.4%-4.0%. Not show on the charts is the Alpharetta average capture of 5.2% and total new attached sales of 921 homes. Fayetteville can model their attached product after the high quality well executed Alpharetta stock and maintain the value of attached product.
CITY OF FAYETTEVILLE NEW ATTACHED SALES COMPARSION
Total New Attached Sales 20152023
Fairburn - 9
Newnan - 190
Peachtree City - 23
Fayetteville - 59
Union City - 234
SOURCE: Noell Consulting Group and MetroStudy
Historically, Fayetteville delivered no attached housing product until the delivery of Trilith in 2019. The Trilith attached product price point is much higher than that of entry townhomes, duplexes, and other attached product, pointing to a lack of diverse and affordable attached product that the City could benefit from providing. An increase in density and attached product can help offset increasing prices of land and construction costs, but product can be well designed to maintain high home values throughout Fayetteville. Attached product can also be located in concentrations, like in Trilith, near Downtown in walkable areas where density is appropriate. Village Towns is a great example of a more affordable, yet still quality, townhome product now offered in the City.
Trilith and Village Towns make up the majority of these sales.
1. Employment growth from Moody's and Woods & Poole.
2. For the purpose of NCG's supply and demand analysis the Primary Market Area (PMA) Is defined as The City of Fayetteville.
3. The potential fair share capture is 100% across all price bands and years given we used the City of Fayetteville as the primary market area.
4. The results of our demand analysis indicate the City can support an annual average of approximately 74 new attached sales per year, or a total of 368 through 2028.
SOURCE: Noell Consulting Group, MetroStudy, Moodys / Woods & Poole
Exhibit 63
Atlanta Metro New Home Sales and Detached Share
ATLANTA METRO NEW HOME SALES & DETACHED CAPTURE
With the exception of the recovery post great recession, detached product has accounted for 82%-86% of all new home sales in the metro up until 2017. Since 2017 however there has been a significant decline in the detached home sale portion of the market, as affordability pressure increased following a strong economic run and associated price appreciation, which was only sped up further with the onset of COVID. While 2021 witnessed a slight bounce back, we forecast the trend will continue with a gradually declining % of detached sales as more attached products gain popularity both for their more affordable price point, but also in many areas their increased walkability and maintenance-free aspects.
ATLANTA METRO NEW DETACHED HOME SALES
SOURCE: Noell Consulting Group (based on surveys of properties)
SOURCE: Noell Consulting Group and MetroStudy
Share of Atlanta Metro New Detached Sales
METRO NEW DETACHED SALES W/ OTP SHARE
While not a surprise, the market has witnessed nearly 90% of the new detached sales occurring Outside the Perimeter, as infill sites for
are becoming increasingly scarce. We believe this trend will largely continue, resulting in a forecast of nearly
THE PERIMETER NEW DETACHED SALES
SOURCE: Noell Consulting Group and MetroStudy
Exhibit 65
City of Fayetteville Capture of OTP New Detached Sales
OUTSIDE THE PERIMETER NEW DETACHED SALES & CITY OF FAYETTEVILLE. CAPTURE
Historically the City of Fayetteville has averaged a 0.5-2% capture of the OTP new detached home sale market. In more recent years, Trilith has enabled that capture to ramp up to nearly 3.5% when significant inventory was available. To understand demand potential, we are assuming the City can witness a ramp up to 2% of the OTP market if inventory was made available. As can be seen below this results in just over 173 average sales per year.
CITY OF FAYETTEVILLE NEW DETACHED SALES
SOURCE: Noell Consulting Group and MetroStudy
While high interest rates have cooled the market in 2023 and thus far in 2024, 2022 saw a near record level of sales and across a strong variety of price bands. The highest concentration of sales occurred in the $400-750k band.
NOTES:
1. Employment growth from Moody's/Woods & Poole..
2. For the purpose of NCG's supply and demand analysis the Primary Market Area (PMA) Is defined as The City of Fayetteville.
3. The potential fair share capture is 100% across all price bands and years given we used the City as the primary market area.
4. The results of our demand analysis indicate the City can support an annual average of approximately 173 new detached sales per year, or a total of 863 through 2028.
SOURCE: Noell Consulting Group, MetroStudy, Moodys / Woods & Poole.


5
Comparison of Key Competitive/Analogous Communities For-Sale Product in the Market - Weighted Average
55+ For-Sale Communities For-Sale Single Family For-Sale Townhomes


75 (Page 2 of 2)


SOURCE: Noell Consulting Group based on surveys of properties.
Competitive SFD Community - Apple Orchard (Apple Blossom Lane, Winesap Way, Stayman Park)
Developer: Delivery:
Unknown
Presale: Unknown
Concrete Siding, Stick
Private
Private
Sales Pace: Phased

Competitive SFD Community - Annelise Park Drive: Park (Vinings Walk; Annelise Park Drive,)
Developer: Delivery:
Multiple
Presale: N/A Type:
Sales Pace: Construction began in 2005 and the community has been slowly adding on through the years. The current data is only resales.
2-3 car garages

Competitive
Developer: Delivery:
Presale: Began Q3 2017 Type:
Construction: Parking Type: Spaces/Ratio: HOA


◘ Developer: Euram-Macauley One, LLC/Reynolds Capitol Group, LLC
◘ Lot sales and construction began in 2006, still ongoing
◘ HOA fees: $700
◘ Master planned community of approximately 600 acres
◘ 350 homesites along 2 freshwater lakes
◘ Lake-adjacent cottage with fitness center, pool, coffee bar, addtl.
SOURCE: Noell Consulting Group, Metrostudy

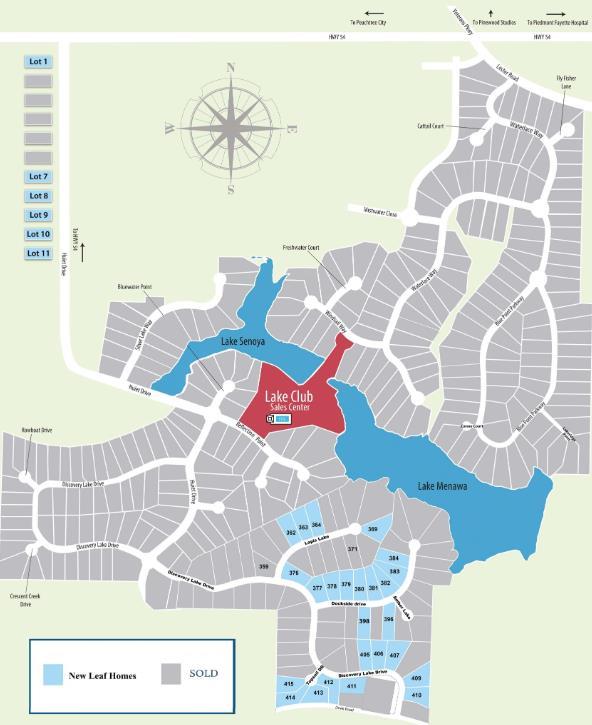
Master planned community with custom homes as well as pre-built or pre-designed options. Includes access to 2 freshwater lakes along with wharf docks and canoe storage. Lake cottage includes some traditional amenities like lighted tennis courts, sunroom, coffee bar, fitness center, catering kitchen, and lap pool. Located within convenient driving distance of historic downtown Fayetteville as well as Trilith. All home sites 1 acre or more. 8/16/2024
Competitive SFD Community - Trilith (290 Heatherden Ave)
Halbert
Developer: Delivery: Presale: Began Q1 2017
/ Pinewood Atlanta Studios
Sales


Competitive TH Community - Trilith (290 Heatherden Ave)


Pulte
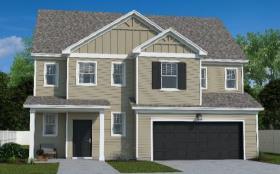
SFD Community - Brighton Homes (110 Eastmark Wy, Fayetteville, GA 30214) Developer: Delivery: Presale: N/A
Sales


Competitive
Developer: Delivery:
Lennar Homes
Presale:
Cement Siding, Stick Built
2 car garages per unit
2 car garages per unit
Sales Pace: Construction began in Q1 2021 with presales beginning in February 2021. Sold out in Q3 2023 for an estimated pace of 34 units per month.
Features & Amenities: Club House and Pool
neighborhood close to Downtown Fayetteville. Typical product for 55+ communities (master on main with limited two story homes). Recessed can lighting, lighted fans in living and bedrooms, chandeliers in kitchen, track
are moving due to downsizing and/or wanting to be close to good schools .
SOURCE: Noell Consulting Group


Competitive SFD Community - Annelise Park Drive: Park (Vinings Walk; Annelise Park Drive,)
Developer: Delivery:
Ryan Homes
Q3 2023+
Presale: N/A Type:
74 townhomes in 2 and 3 story variants
Brick, Architectural siding 1-2 car garages
1-2 car garages
Sales Pace: First opened for sales around Thanksgiving of 2023. Sold well, but was reportedly greatly impacted by rising interest rates and political uncertainty. Summer particularly slow. Est. 2-3/mo.
Features & Amenities: Limited. Landscaping and exterior maintenance handled by HOA. Main advertised feature is proximity to other attractions.

noted specifically) and movedowns. Most moving from in-town or nearby cities including Newnan, Tyrone, and Peachtree City. Mostly couples.
Attached townhomes located outside of Downtown Fayetteville. Sales pace has been heavily impacted by interest rates.
Competitive SFD Community - Dixon Farm (1045 George Masters Place,)
Sales
Competitive SFD Community - Riverbend Overlook (115-155 Bre Drive)

BRANCH PROPERTIES, LLC
LAUREL ISLAND MARKET ANALYSIS
County Retail Locations 8/16/2024

The Class A (defined by Costars 3,4, and 5-star rating)
Fayette County retail market has seen over 600,000 SF of positive net absorption since 2019, while only 223,000 SF of new space was delivered. The result has been generally declining vacancy rates and increasing rental rate growth. The market now has record low vacancy at under 4% and average rental rates crested over $20/SF over the last two years. While YTD 2024 has witnessed rental rates strugglethis is likely due to higher tenant build-out costs and interest rates which will begin to correct themselves with the coming Federal rate cuts expected.
Currently new construction is at under 30,000 SF, and there has not been a large delivery since Trilith and the Satterfield Crossing strip center and pads began delivering in 2020.
Source: NCG, CoStar
Exhibit 83
Historical and Projected Job Growth to Retail Absorption Relationship in Atlanta Metro
Atlanta Metro Job Growth
Atlanta Metro Class A Retail Absorption
Employment growth in the Atlanta metro area has been strong since the Great Recession with over 65,000 jobs added annually since 2011 and three consecutive years of ~80,000 net new jobs in 2014-2016. This growth has led to strong population/household gains and economic confidence which in turn has led to strong retail absorption across the metro, averaging just over 3.1 million SF annually from 2012 to 2019. The COVID recession resulted in a near shut down of retail resulting in negative absorption in 2020, however 2021 and 2022 witnessed a strong rebound. That said, we believe going forward it will moderate back to more historic norms with a gradual decline as online shopping continues gaining momentum. The result is a forecast of only about half what we had witnessed in 2012-2019 at around 1,300,000 SF annually. The result is an average of 25 SF of retail absorption per new job gain. 9,312,262 6,613,176 5,593,477 (637,283) 1,615,476
SOURCE: Noell Consulting Group, Costar and Economy.com | Moody's Analytics (Class A is defined as 3, 4 and 5 star properties from CoStar), Woods and Poole
Exhibit 84
South Atlanta Capture of Atlanta Class A Retail Absorption
Atlanta Class A Retail Absorption & South Atlanta Capture
The South Atlanta market has witnessed an increasing capture of Metro retail absorption following the strong population gains the area has seen. This capture has ramped up from 14% to 25%, and we project it to continue into the low 30%s - driven by new destination retail such as Trilith, along with the infusion of major demand generators such as the US Soccer Facility. The result is an annual average of over 400,000 SF of net new retail absorption through 2028. 9,312,262 6,613,176
-6,000,000 -4,000,000 -2,000,000 0 2,000,000
South Atlanta Class A Retail Absorption
SOURCE: Noell Consulting Group (based on surveys of properties)
SOURCE: Noell Consulting Group, Costar and Economy.com | Moody's Analytics (Class A is defined as 3, 4 and 5 star properties from CoStar), Woods and Poole
Exhibit 85
Fayette County Capture of South Atlanta Class A Retail Absorption
South Atlanta Class A Retail Absorption & Fayette County Capture
While captures have fluctuated significantly due to the smaller nature of the submarket, Fayette County has still witnessed average captures of 11-15% of South Atlanta since 2011. During years of 20,000 SF+ new deliveries, the market averaged 22% captures. Because of this, NCG is projecting an average of 22% captures in 2024-2028 resulting in a forecasted absorption of 92,000 SF/year from 2024-2028. While this is County-wide, it is believed that the City could capture the majority of this if new product was available.
Fayette County Class A Retail Absorption
SOURCE: Noell Consulting Group (based on surveys of properties)
SOURCE: Noell Consulting Group, Costar and Economy.com | Moody's Analytics (Class A is defined as 3, 4 and 5 star properties from CoStar), Woods and Poole
Estimated Retail Sales Leakage in the County Today
Motor Vehicle and Parts Dealers
Cafeterias, grill buffets, and buffets (NAICS 722514) Snack and non-alcoholic beverage bars (NAICS 722515)
$465,772,678
Furniture and Home Furnishings Stores -$19,645,979
Electronics and Appliance Stores -$4,064,160
Building Material and Garden Equipment and Supplies Dealers -$30,759,577
Limited-service restaurants (NAICS 722513)
Food and Beverage Stores -$262,194,770
Health and Personal Care Stores
Gasoline Stations
Full-service restaurants (NAICS 722511)
$55,740,788
Clothing and Clothing Accessories Stores -$32,339,587
Drinking places (alcoholic beverages) (NAICS 7224)
Sporting Goods, Hobby, Musical Instrument, and Book Stores
General Merchandise Stores
Miscellaneous Store Retailers
$5,714,937
Drinking places (alcoholic beverages) (NAICS 7224) $7,431,729
Full-service restaurants (NAICS 722511) -$16,957,778
Limited-service restaurants (NAICS 722513)
Cafeterias, grill buffets, and buffets (NAICS 722514)
Snack and non-alcoholic beverage bars (NAICS 722515) $9,303,171
County-wide the majority of current retail leakage (demand leaving the County) is in Motor Vehicle and Parts Dealers (not surprising given the adjacency to Union City), and Gasoline Stations. Other categories demand could be captured back in the County include Snacks and Beverage Bars, Drinking Places (alcoholic), and Miscellaneous Store Retailers (which includes things like pet stores, consignment stores, and lifestyle boutiques).
It should be noted that retail store types such as FullService Restaurants and Clothing boutiques can be more destination driven and have ability to pull from outside the county.
SOURCE: Claritas, Inc. $465,772,678
Estimated Retail Sales Leakage in the City Today
Snack and non-alcoholic beverage bars (NAICS 722515)
Motor Vehicle and Parts Dealers $44,988,430 Furniture and Home Furnishings Stores
Cafeterias, grill buffets, and buffets (NAICS 722514)
Electronics and Appliance Stores
Building Material and Garden Equipment and Supplies Dealers
Limited-service restaurants (NAICS 722513)
Full-service restaurants (NAICS 722511)
Drinking places (alcoholic beverages) (NAICS 7224)
Sporting Goods, Hobby, Musical Instrument, and Book Stores
Miscellaneous Store Retailers
Miscellaneous Store Retailers
General Merchandise Stores
Drinking places (alcoholic beverages) (NAICS 7224)
Full-service restaurants (NAICS 722511)
Sporting Goods, Hobby, Musical Instrument, and Book Stores
Limited-service restaurants (NAICS 722513)
Cafeterias, grill buffets, and buffets (NAICS 722514)
Snack and non-alcoholic beverage bars (NAICS 722515)
SOURCE: Claritas, Inc.
8/16/2024
City-wide retail leakage (demand leaving the County) largely mirrors the county with Motor Vehicle and Parts and Gasoline Stations being the top two categories. Other categories demand could be captured back in the City include Snacks and Beverage Bars, Drinking Places (alcoholic), and a small amount of Health and Personal Care Stores.
It should be noted that retail store types such as FullService Restaurants and Clothing boutiques can be more destination driven and have ability to pull from outside the county/city. This will require the creation of a unique shopping/dining destination such as the Town Center being envisioned on the City's 38-acres.


6
1
2
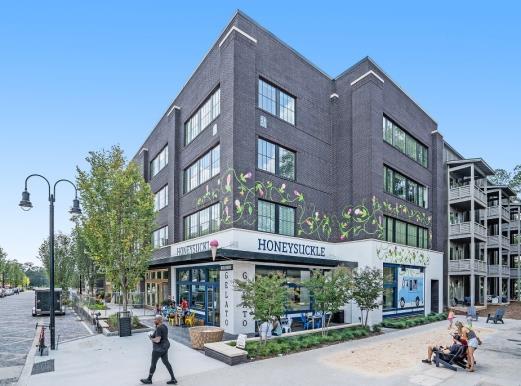
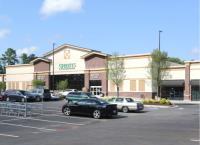
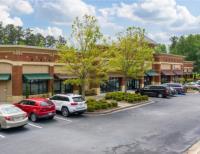
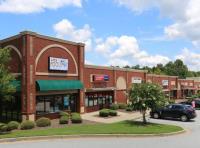
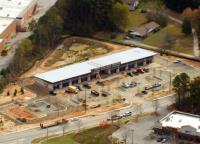
90 Competitive Retail Center : Trilith

Roam at Trilith (4,404 SF)
Hero Doughnuts (3,217 SF)
Fairway Social (7,277 SF)
Capra Dental Spa (2,934 SF)
CT Taqueria (2,469 SF)
Thumbs Up Diner (2,218 SF)
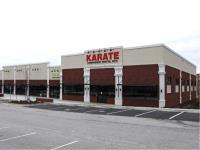

Championship Martial Arts, Ginza Japanese Restaurant, The Fit Kitchen
Restaurant and service-oriented retail adjacent to Lexington Circle. Near hwy 52, but not adjacent.
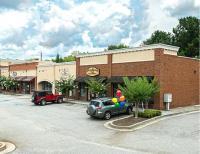
Restaurants and neighborhood serving retail. Sprouts, Seafood Oyster Bar, Your Pie, salon and spa. Shopping center at the corner of hwy 54 and Walt Banks Rd, offering strong visibility. Sprouts Farmer's Market anchors and occupies 30,115 sf.
Roam at Trilith, Fairway Social, Thumbs Up Diner, Capra Dental Spa
Restaurant and retail spaces adjacent to Trilith town center and Pinewood Studios. Trilith contains 1,300 homes and apartments, while Pinewood is home to 3,500 employees. Currently vacant space at $40/SF (2nd generation).
Village Podiatry, Underdogs JiuJitsu, Nails Spa, Accentu8 Beauty Bar
Various neighborhood serving small retailers. Village Paint, Apex Pools, CBD Smoke & Vape
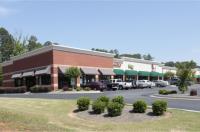
Retail community center consisting of multiple buildings located just off hwy 54 across from Piedmont Hospital. Space can also be office/medical.
Commercial strip center along hwy 54 west of Fayetteville. Features mostly sub 1,000 sf spaces with mostly local retailers and small businesses. Retail Summary: SOURCE: Noell Consulting Group, CoStar

SOURCE: Noell Consulting Group, CoStar NNN Lease Rates 8/16/2024
Commercial space adjacent to the newly constructed Mega liquor store at the intersection of Highway 314 and New Hope Road. With a built-in grease trap, this space is ready to facilitate culinary businesses or other retail.
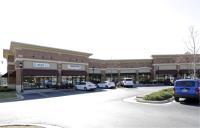
Tanzer Nail Spa, Southern Fire Kitchen, Frida's Bar & Grill, Cleansing Waters Brand new retail center north of Fayetteville core featuring 2 restaurant spaces and 6 generic retail spaces. Located adjacent to Fayette Pavilion with 1mm+ sf of retail.
Halftime Barbershop, Beauty N Bean Hair Studio, Hertz, Unique Dominican Hair Salon Strip retail center near Fayetteville core. Though technically located off hwy 92, still offers good visibility.
Townsquare Playhouse, The Fusion Chefs, Party Party, Atlanta Vapor Strip retail off Glynn Street slightly south of Downtown Fayetteville.
Caesar's Pizza Neighborhood center off Glynn Street south of Downtown Fayetteville.


SOURCE: Noell Consulting Group based on surveys of properties.
Total demand exists within the County for up to 56,314 SF of small office and service oriented users. While this demand is county-wide, a majority could be captured in the City limits. 8/16/2024
BRANCH PROPERTIES, LLC
LAUREL ISLAND MARKET ANALYSIS


SOURCE: Noell Consulting Group, CoStar
The Atlanta office market has demonstrated strong fundamentals but has struggled postcovid, and currently holds a vacancy rate of 16.5% and 12 mo. net absorption totaling over negative 2 million square feet. Over 1.1 million square feet of office space was delivered since 2023 3Q, with Midtown accounting for 35% of all deliveries.
The South Atlanta market, where the City resides, does not offer the dense office environment found in Midtown or Downtown cores, but rather small office parks and standalone office/medical office buildings throughout. Due to this nature it has been relatively less impacted by the proliferation of remote working, leading to low vacancy and an industry makeup consisting of jobs more likely to remain in-office like construction, medical, or other population-serving industries. Currently, South Atlanta has quoted rates at $24.02 / SF, among the cheapest in the Atlanta metro, but has the lowest vacancy rate (7.4%) among all submarkets, and accounts for ~4% of total square feet under construction. However, 100k of the under construction office product is located at Porsche's Hapeville headquarters, and the remainder is medical office.
The South Atlanta office submarket has some of the lowest vacancy rates in the Atlanta metro but has struggled with rental rates due to the majority of the market consisting of small offices and neighborhood-serving business as opposed to the major corporate tenants in areas like Downtown, Midtown, and Buckhead. However, the market historically has been consistent and has experienced moderate growth in base rents and steadily decreasing vacancy as limited new deliveries of quality Class A product have been absorbed.
However, as newer product experiences growth in rents and occupancy, older product in the South Atlanta submarket has been contributing to the submarkets low rental rates.
Source: NCG, CoStar, BLS
Exhibit 97
Historical and Projected Job Growth to Office Absorption Relationship in Atlanta Metro
Atlanta Metro Job Growth
Employment growth in the Atlanta metro area has been strong since the Great Recession with over 65,000 jobs added annually from 2011-2019 and, despite the COVID recession wiping out nearly 150,000 jobs in 2020, three consecutive years of job growth from 2021-2023 adding over 113,000 jobs per year on average. This growth has led to strong office absorption across the metro, averaging 2.7 million SF annually from 2012 to 2019. The COVID pandemic caused the office market to slow significantly, leading to significant negative absorption in 2020 and 2021. 2022 was a moderate bounce back with a more successful 1.3mm SF of office product being absorbed, though this figure was considerably lower than historical levels of absorption for this level of job growth, especially considering metro Atlanta surpassed pre-pandemic employment levels in 2022. 2023 saw tempered office absorption as a result, and Moody's is projecting extremely modest employment growth going forward, although even this may not materialize if the national economy runs into a recession. Moody's, like many national forecasters, projects lower job growth from 2024 forward as slow labor force growth inhibits growth. NCG projects that continued work-from-home trends and slower labor force growth will lead to moderate absorption over the next five years, with the overall SF/jobs ratio averaging a massive 87% drop from that of the pre-pandemic cycle. The result is a forecast of just over 238,000 SF per year, or only about 9% of the pace witnessed in 2012-2019.
Atlanta Metro Class A Office Absorption
4,249,942 6,999,624 2,816,818
SOURCE: Noell Consulting Group, Costar and Economy.com | Moody's Analytics (Class A is defined as 3, 4 and 5 star properties from CoStar), Woods and Poole
Exhibit 98
South Atlanta Capture of Atlanta Class A Office Absorption
Atlanta Class A Office Absorption & South Atlanta Capture
4,249,942 6,999,624 2,816,818 (2,870,814)
While captures have fluctuated year to year based on deliveries, the South Atlanta market has still witnessed captures of approximately 5-10% of the metro market over most of the past two decades. The impact of the COVID pandemic has been severe on suburban office markets, and caused the Atlanta metro to average over 500,000 SF of negative absorption from 2020-2023. Despite this loss, the South Atlanta submarket recovered quickly, reaching a positive absorption as soon as 2021. This is partly due to the industry makeup of South Atlanta, however several major tenants have artificially increased this absorption including major SF absorption by the GA Dept. of Public Safety, SMC3, and Piedmont Medical. Assuming no similarly major unexpected developments, we believe the South Atlanta market will only witness a slightly negative capture in 2024, but recover quickly to levels seen pre-pandemic, achieving approximately 77,000 SF per year from 2024-2028. We believe the vast majority of this will be located closer to the City of Atlanta, while new office absorption near the City of Fayetteville is likely to consist primarily of medical offices.
South Atlanta Class A Office Absorption
SOURCE: Noell Consulting Group (based on surveys of properties)
SOURCE: Noell Consulting Group, Costar and Economy.com | Moody's Analytics (Class A is defined as 3, 4 and 5 star properties from CoStar), Woods and Poole
Exhibit 99
Fayette County Capture of South Atlanta Class A Office Absorption
South Atlanta Class A Office Absorption & Fayette County Capture
While captures have fluctuated significantly due to the smaller nature of the submarket, Fayette County has still witnessed average captures of 13-34% of South Atlanta since 2011. The impact of COVID was lessened due to its suburban nature and the presence of office tenants that are more likely to remain in-person due to the population-serving nature of their industries. While 2020-2023 saw an unusually high amount of absorption (71,000 SF/year), this is driven largely by Piedmont Medical and associated nearby MOB which is unlikely to absorb significant amounts of office SF in the near-term. Because of this, NCG is projecting more moderate captures in 2024-2025, ramping up over the forecasting period to reach an average 20.8% capture rate, or somewhat between that seen in 2011-2019 and the post-pandemic period. This results in a modest absorption of approximately 16,000 SF/year from 20242028.
Fayette County Class A Office Absorption
SOURCE: Noell Consulting Group (based on surveys of properties)
SOURCE: Noell Consulting Group, Costar and Economy.com | Moody's Analytics (Class A is defined as 3, 4 and 5 star properties from CoStar), Woods and Poole
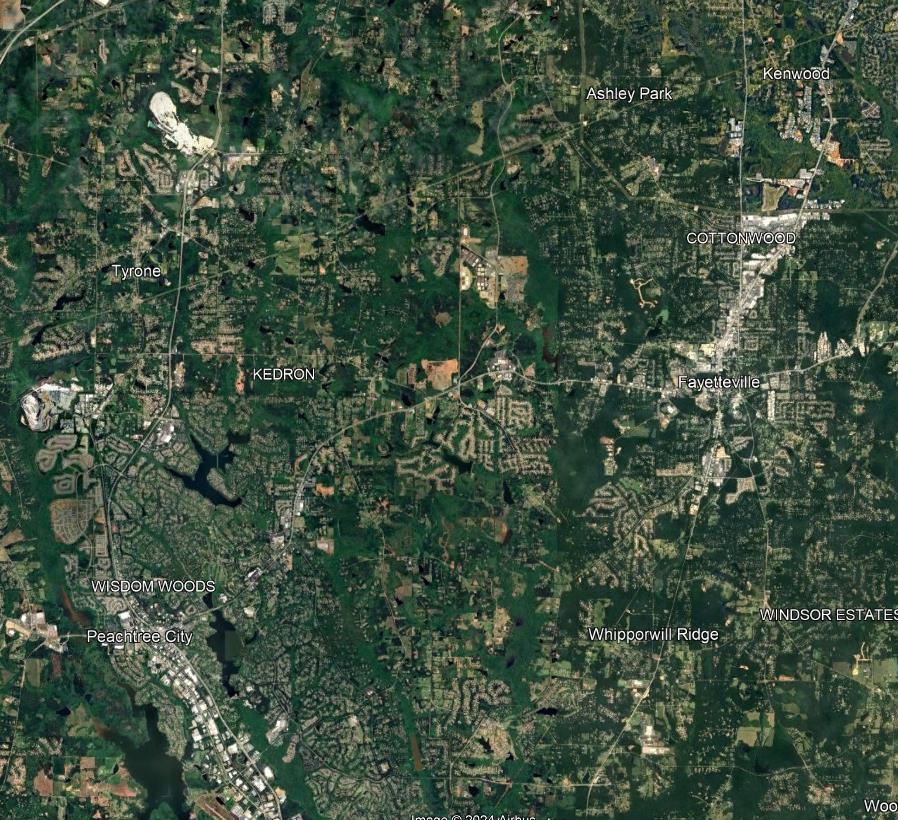


6
1
SOURCE: NCG, CoStar
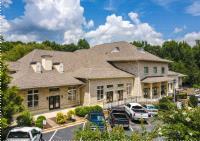

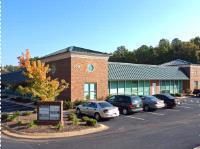
SOURCE: Noell Consulting Group, CoStar
NNN Lease Rates 8/16/2024
The Skin Society, Raymond James & Associates, Actioncoach Peachtree Four story office building near Trilith Town Center. Also includes coworking space and ground floor retail.
Atlanta Vascular Specialists, PCA Interventional Spine, Sparkling Smiles Fayetteville Medical office building directly adjacent to, but not connected with, Piedmont Hospital Fayette.
Metro Infusion Center, Piedmont Healthcare, Quest Diagnostics Office and medical office complex off hwy 54 west of Downtown Fayetteville.
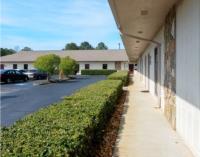
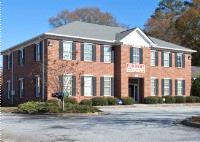
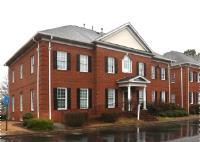
104 Comparison of Recommended Positioning for the Subject Site Relative to Key Competitors in the Market - Weighted Average


SOURCE: Noell Consulting Group based on surveys of properties.


BRANCH PROPERTIES, LLC
LAUREL ISLAND MARKET ANALYSIS
Exhibit 105
Introduction to Project and the Local Hospitality Market
The local hospitality market is limited, with only 3 existing traditional hotels in the immediate market, 3 other hotels were pulled from the Peachtree City market to support our research.
All of these hotels, with the exception of TrilithGuesthouse and Holiday Inn Suites Peachtree City, are concentrated around highway 54, with 5 of the 6 traditional hot els being grouped along the highway 54 corridor, where there is a significant concentration of retail, medical centers, and office parks, in addition to convenient highway interconnectivity to other nearby cores. These hotels are also relatively homogeneous. They are mostly full service, meaning they provide luxuries like room service, full-service restaurants, etc., and all maintain similar average daily rates, generally between $120 - $150 per night, with notable seasonal variation. Trilith Guesthouse is again an exception, as it is a different product in an affluent community surrounded by retail. Their offering is highly specific and not representative of the larger market.
The future development of the US Soccer Training Facility is likely to increaseroom nights demanded in the market by an estimated 10%, which the City is well-positioned to capture.
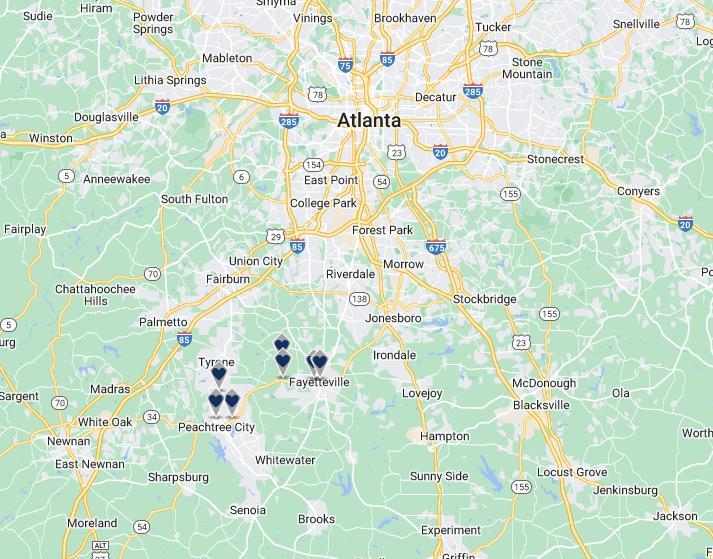

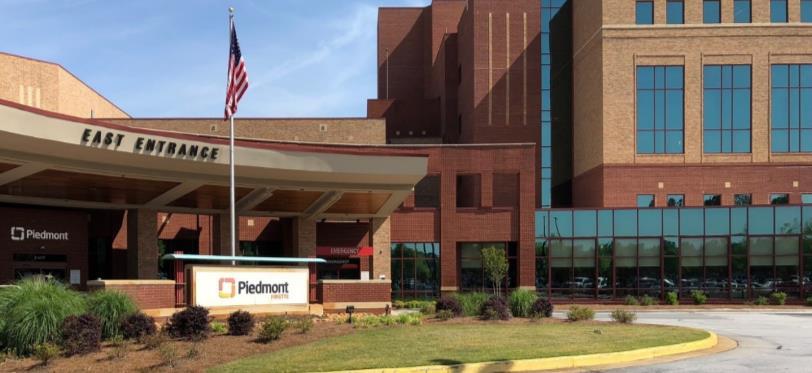


SOURCE: Noell Consulting Group, Google Earth
8/16/2024
The chart below presents data from the hotels in Fayette County
The local hotel market experienced spikes in growth since 2020, with enough supply to outpace demand. Overall the market has experienced enough demand to justify a new hotel delivery in both 2020 and 2024. Occupancy levels had slowly climbed from 64% in 2013 to the low 70%'s prior to 2020. The average daily rate experienced a healthy increase going from $95 in 2013 to $131 over the same period.
The Covid-19 Pandemic impacted the entire US hotel market, including those in Fayetteville. As seen below demand dropped by almost 27% between 2019 and 2020. Along with demand dropping, occupancy dropped 28% which caused RevPAR to drop 42%, and ADR to drop by 19%. The market has now largely recovered with demand, occupancy, ADR and RevPAR returning to, or even exceeding, pre-pandemic levels in the case of demand, RevPAR, and ADR. 8/16/2024
Occupancy rates in the Fayette County submarket have consistently remained near 70% prior to the COVID 19 pandemic, and recovered in room nights demanded much quicker than the Atlanta metro. However, projected room night demand in the Fayette County submarket is largely consumed by the delivery of the under-construction Residence Inn Peachtree City and three other proposed deals. Notably, the City's strong location relative to new the U.S Soccer Training Facility may give it an edge over competitors, allowing it to cannibalize demand from other, less proximate hotels. Additionally, this U.S. Soccer facility leads to increased Fayette County room night capture, jumping from 3% to 9% by 2029. However, the potential for Fayetteville annexing land including this new facility is likely to lead to potential hotel developmentin that area which exceeds Downtown in convenience, tempering potential demand near the Downtown Square. 8/16/2024
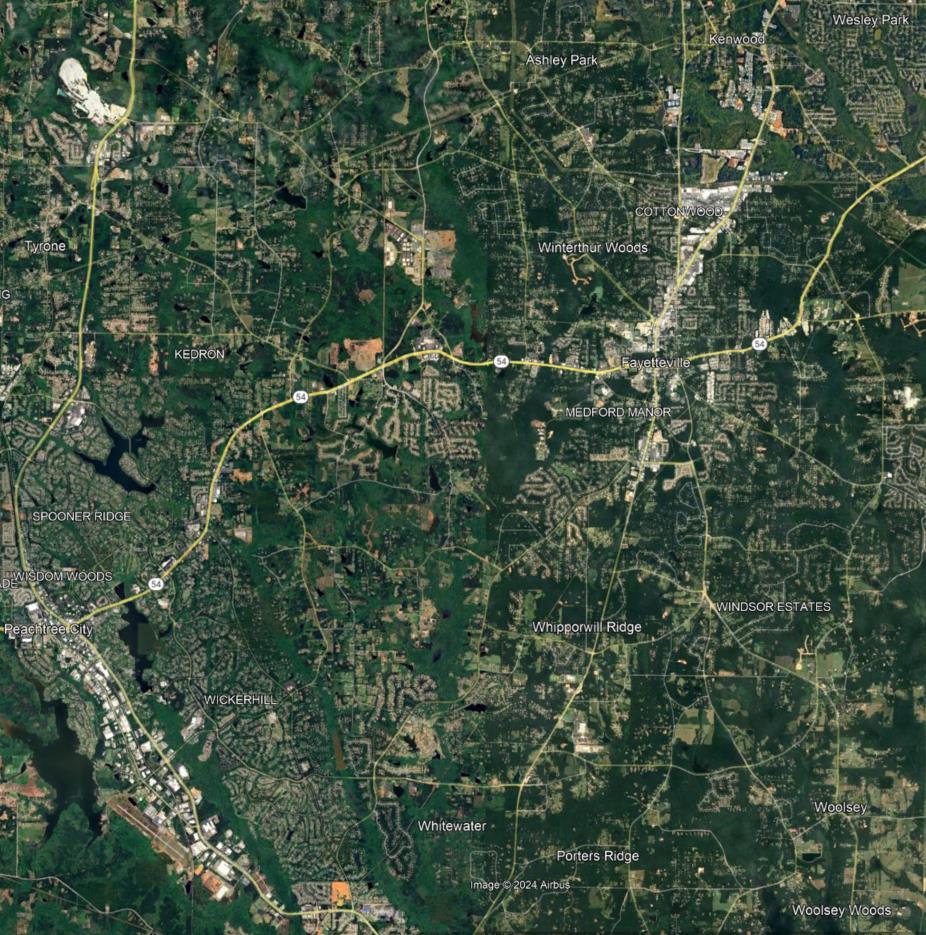


Exhibit 109
The local hotel market is fairly homogenous, with similar flags having a presence in the market. Hilton has the largest share of rooms in the local market (44%) followed by Tribute Portfolio (24%)
Of the 6 hotels, 2 properties were built after 2010, and most brands are categorized as upper midscale on the chain scale.
The current stock of hotels is fairly outdated and repetitive in its amenity and room offerings that cater to a limited crowd of users. There are currently numerous brands not in the market today. These include a variety of brands both midscale or nicer that might draw in different crowds, if demand exists
Flag Market Share (%)
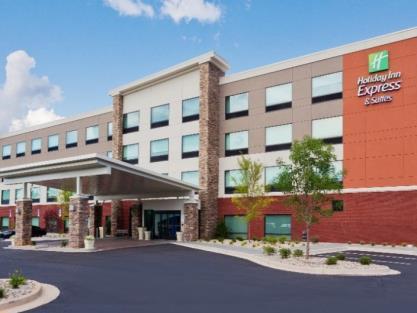

% of Rooms by Chain Scale
Brands Missing in Market


Other: Includes hotel chains that only have one location in the market.
Source: NCG, CoStar
8/16/2024


* Sampling of National brands missing from market. Excludes luxury brands
One of four hotels in the market built before 2010, with the lowest ADR. Adjacent from residential development such as apartments and single family homes. Hilton


*ADR estimates are based on interviews with hotel general managers, property websites and booking websites. *Rate ranges are based on a sample selection of quoted hotel rates during September 2024 - June 2025
SOURCE: Noell Consulting Group, Costar, Interviews with hotel GM's
Business center, fitness center,
Business center, pool,
Business Center, meeting rooms, conference space, computer
a la carte breakfast
Oldest hotel in the comp set, but generally in line with comp quality and rates. Holds the second highest ADR.
Newer hotel with a one of the highest ADR's in the comp set. Second Hilton hotel in Peachtree City.
Business center, conference space, bar/lounge, restaurant, fitness center, pool, snack bar
Second oldest hotel in the comp set, but in line with the quality and rates of comparable hotels.
Business center, fitness center, indoor swimming pool, free continental breakfast
Newer hotel with lower number of keys than most hotels in the comp set. Their ADR is the same as the other holiday inn in the market which is much older.
Newest hotel in the market with the highest ADR, part of a 235 acre master planned community. Surrounded by residences, commercial and miles of green space.
Given that the Fayetteville hotel market does not offer any luxury brand hotels, ADR's have (with the exception of Trilith Guesthouse) remained near or below $150. Growth in ADRs has been positive but limited, and daily rates recovered quickly from the COVID 19 pandemic. Despite this, overall demand in the Fayette County submarket remains low, and will be mostly consumed by existing hotel stock. However, Trilith Guesthouse has an ADR greatly surpassing all others in the market, suggest ing that there may be untapped demand for an upscale or luxury boutique hotel in a walkable location near Downtown Fayetteville that is not captured in the current selection of hote ls.


SOURCE: Noell Consulting Group based on surveys of properties
8/16/2024
