


12,377
17.94%
98.7%
TOTAL STOCKHOLDERS CREDIT QUALITY
TOTAL PERMANENT CAPITAL
$31.2 MILLION ADB
6.6%
GROSS LOANS OWNED AND MANAGED PRETAX NET INCOME
2023’S STRONGEST LENDING SECTORS
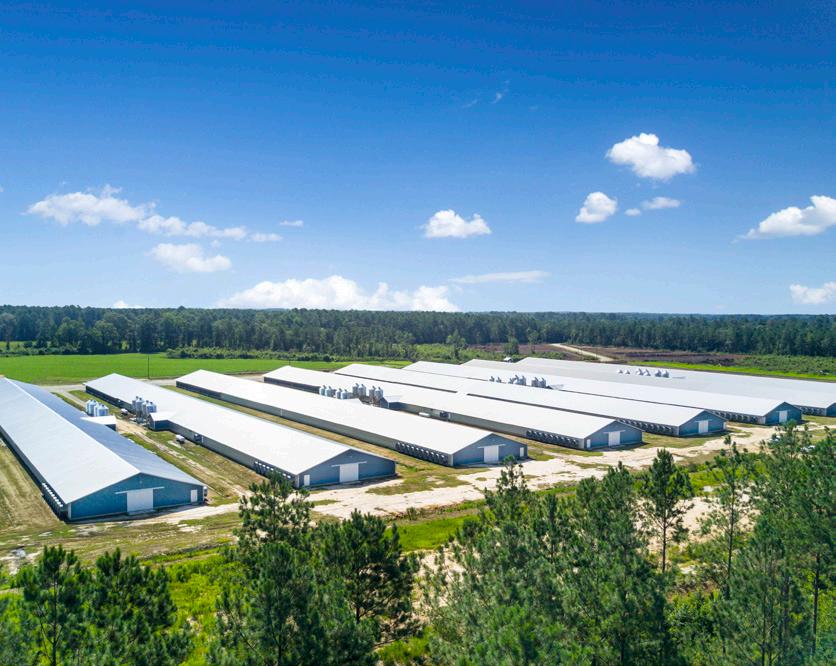
POULTRY

RURAL HOMES
PARTTIME FARMS
$11.7 MILLION DISTRIBUTED IN 2024
94% SMALL FARMERS LESS THAN $250K GROSS FARM INCOME
31% YOUNG FARMERS AGE 35 & YOUNGER
60% BEGINNING FARMERS FARMING 10 YEARS OR LESS 123123
TOTAL PATRONAGE CASH (SOME MEMBERS MAY FALL INTO MORE THAN ONE CATEGORY.)

On behalf of the Board of Directors, Senior Management Team, and employees, we are pleased to present the Farm Credit Services of Western Arkansas, ACA 2023 Annual Report. Despite rising interest rates throughout 2023, the Association broke several positive records thanks to solid growth and earnings. This translated to a record patronage amount due to the stellar 2023 fiscal year. Patronage on 2023 profits came in at $11.7 million The Association's pretax net income for 2023 landed at $31.2 million.
In 2023, interest rates rose aggressively to levels not seen in years. Despite these rate increases, signs of inflation continued to hang around. These economic challenges contributed to sluggish housing and agriculture construction growth in western Arkansas. Existing mortgage debt was more than likely held at record setting low-interest rates, and for those members, there was little desire or incentive to refinance in the rising rate environment of 2023. Despite these challenges, the Association saw strong financial performance over the past year.
No doubt, the Association rallied, and with the support of the members and the drive of the employees, we finished strong in a very unique and challenging year that saw technology and organizational enhancements and overhauls, in addition to the economic headwinds that faced western Arkansas and the country during 2023.
As we look toward 2024, we are committed to continually improving our member experience through the technology and organizational changes implemented in 2023. With the technology upgrades, our goal is improved customer service and increased speed of delivery in 2024 and beyond. Thank you again for your continued support as we look forward to the promises and goals of the new year.

Cody Jones Chairperson of the Board Farm Credit Services of Western Arkansas, ACA

Brandon Haberer
Presidentand Chief Executive Officer Farm Credit Services of Western Arkansas, ACA
March 6, 2024
The following commentary reviews the consolidated financial condition and consolidated results of operations of Farm Credit Services of Western Arkansas, ACA (the Association) and its subsidiaries, Farm Credit Services of Western Arkansas, FLCA and Farm Credit Services of Western Arkansas, PCA, and provides additional specific information. The accompanying Consolidated Financial Statements and Notes to the Consolidated Financial Statements also contain important information about our financial condition and results of operations.
The Farm Credit System (System) is a federally chartered network of borrower-owned lending institutions comprised of cooperatives and related service organizations, established by Congress to meet the credit needs of American agriculture. As of January 1, 2024, the System consisted of three Farm Credit Banks, one Agricultural Credit Bank, and 56 borrower-owned cooperative lending institutions (associations) The System serves all 50 states, Washington D.C., and Puerto Rico. This network of financial cooperatives is owned and governed by the customers the System serves
The AgriBank Farm Credit District (AgriBank District or the District) is primarily comprised of AgriBank, FCB (AgriBank), a System Farm Credit Bank, and its District associations We are an association in the District.
The Farm Credit Administration (FCA) is authorized by Congress to regulate the System The Farm Credit System Insurance Corporation (FCSIC) administers the Farm Credit Insurance Fund (Insurance Fund). The Insurance Fund is used to ensure the timely payment of principal and interest on Systemwide debt obligations, to ensure the retirement of protected borrower capital at par or stated value, and for other specified purposes
Due to the nature of our financial relationship with AgriBank, the financial condition and results of operations of AgriBank materially impact our members’ investment. To request free copies of AgriBank financial reports, contact us at:
Farm Credit Services of Western Arkansas, ACA
AgriBank, FCB
3115 West 2nd Court 30 East 7th Street, Suite 1600 Russellville, AR 72801 St. Paul, MN 55101 (479) 968-1434 (651) 282-8800
www.myaglender.com
www.AgriBank.com
FinancialReporting@AgriBank.com
Our Annual Report is available on our website no later than 75 days after the end of the calendar year and members are provided a copy of such report no later than 90 days after the end of the calendar year. The Quarterly Reports are available on our website no later than 40 days after the end of each calendar quarter. To request free copies of our Annual or Quarterly Reports, contact us as stated above
This Annual Report includes forward-looking statements. These statements are not guarantees of future performance and involve certain risks, uncertainties, and assumptions that are difficult to predict. Words such as "anticipate", “believe", "estimate", "may", “expect”, “intend”, “outlook”, and similar expressions are used to identify such forward-looking statements. These statements reflect our current views with respect to future events. However, actual results may differ materially from our expectations due to a number of risks and uncertainties which may be beyond our control. The information in this report is based on current knowledge and is subject to many risks and uncertainties including, but not limited to:
• Political (including trade policies, environmental policies, and civil unrest), legal, regulatory, financial markets, and economic conditions, or other conditions and developments in the United States (U.S.) and abroad
• Economic fluctuations, including inflationary indicators, in the agricultural, international, rural, and farm-related business sectors
• Weather-related, disease, and other adverse climatic or biological conditions that periodically occur and can impact agricultural productivity and income
• Changes in U.S. government support of the agricultural industry (including government support payments) and the System as a governmentsponsored enterprise, as well as investor and rating agency reactions to events involving the U.S. government, other government-sponsored enterprises, and other financial institutions
• Actions taken by the Federal Reserve and U.S. Treasury in implementing monetary policy
• Cybersecurity risks, including a failure or breach of our operational or security systems or infrastructure, or those of our third-party vendors or other service providers
• Credit, interest rate, and liquidity risks inherent in our lending activities
• Disruptive technologies impacting the banking and financial services industries or implemented by our competitors which negatively impact our ability to compete in the marketplace
• Length and severity of an epidemic or pandemic
• Changes in our assumptions for determining the allowance for credit losses and fair value measurements
• Industry outlooks for agricultural conditions
Weather conditions for the end of 2023 were slightly dryer than at the end of September 2023 At the beginning of October 2023, there was only 32.24% of the entire state showing drought conditions, while at the end of December 2023, 82.42% of the state was showing drought conditions, with a considerable portion of the Association’s territory being included Conditions, however, were worse in the eastern part of the state where drought conditions ranged from areas of abnormal dryness to areas in southeast Arkansas in extreme drought
According to Express Markets, Inc. (EMI) as of January 3, 2024, the number of broilers processed increased 3.9% from a year prior to 167.1 million head, with average live weights declining from 6.5 pounds to 6.45 pounds Some integrators likely pulled birds forward in the production cycle due to holiday schedules, which would decrease average live weight slightly. In the EMI weekly broiler market recap from January 2024, total broiler cold storage stocks ended November 2023 at 875.2 million pounds which is a 3.4% decline from November 2022 Storage stocks from October 2023 to December 2023 declined by 23.5 million pounds driven by declines in whole birds, drums, and paws Since October 2023, 2.1 million broilers and 32 thousand breeders and breeder pullets have been depopulated due to highly pathogenic avian influenza During 2023, 2.5 million broilers were depopulated, which surpasses 2022 totals of 2.3 million.
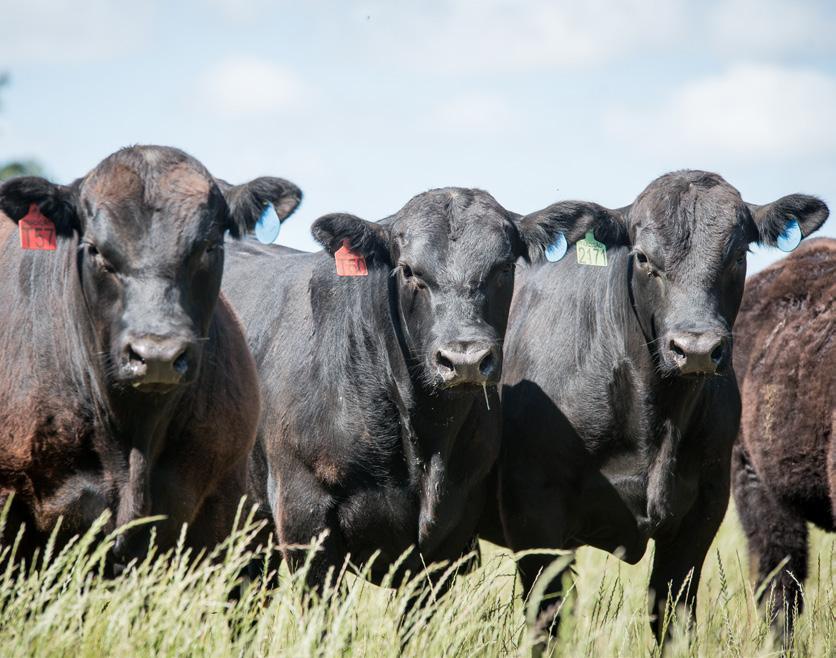
Based on EMI data as of December 14, 2023, the U S imported almost 1.6 million cattle head, an increase of 24.2% from the prior year through October 2023 The U S has imported cattle from both Mexico and Canada Both countries have been dealing with their own drought issues, which has led to more cattle being sourced to the U S. Through October 2023, Mexican cattle imports were up 52.8% compared to a year prior and accounted for 62.0% of the cattle imported in the U S While Canadian imports were down 4.8% from a year prior, making up 38% of the total cattle imported to the U S. For the state of Arkansas reporting week ended December 18, 2023, medium and large steers (600-648 pounds) averaged $243.25 per hundredweight
Loan Portfolio
Total loans were $1.8 billion at December 31, 2023, a decrease of $11.9 million from December 31, 2022
2023 2022 2021
The other category is primarily composed of rural infrastructure and rural residential real estate related loans
The Association participates in asset pool programs to effectively leverage District capital and other cooperative benefits, as well as manage concentration risk and portfolio growth In the past, we sold AgriBank participation interests primarily in real estate loans as part of asset pool programs As of December 31, 2021, we purchased the loans from this prior asset pool program back from AgriBank. On November 1, 2023, we sold AgriBank participations of $164.5 million, representing a participation interest across the majority of our loan portfolio The total outstanding participation interests in loans sold to AgriBank as part of asset pool programs were $161.8 million December 31, 2023
We offer variable, fixed, capped, indexed, and adjustable interest rate loan programs to our borrowers We determine interest margins charged on each lending program based on cost of funds, credit risk, market conditions, and the need to generate sufficient earnings.
ICE Benchmark Administration (the entity responsible for calculating the London Inter-bank Offer Rate (LIBOR)) ceased the publication of all USD LIBOR settings after June 30, 2023. As anticipated, the Secured Overnight Financing Rate (SOFR) published by the CME Group has generally been the fallback to LIBOR. We have transitioned from the use of LIBOR to SOFR, which did not have a material impact on us and as of December 31, 2023, we have no exposure to LIBOR
We are chartered to serve certain counties in western Arkansas Approximately 73.0% of our total loan portfolio was concentrated in Arkansas at December 31, 2023. The remainder of our portfolio is purchased outside of Arkansas to support rural America and to diversify our portfolio risk. Approximately 15.1% of our total loan portfolio was in Washington and Benton counties at December 31, 2023 No other counties exceeded more than 5.0% of our total loan portfolio at December 31, 2023
Agricultural Concentrations
Commodities are based on the borrower’s primary intended commodity at the time of loan origination and may change due to borrower business decisions as a result of changes in weather, prices, input costs, and other circumstances.
The credit quality of our portfolio remained stable from December 31, 2022 Adversely classified loans were 1.3% of the portfolio at December 31, 2023, and 2022 Adversely classified loans are loans we have identified as showing some credit weakness according to our credit standards We have considered portfolio credit quality in assessing the reasonableness of our allowance for credit losses on loans Additional credit quality information is included in Note 3 to the accompanying Consolidated Financial Statements
In certain circumstances, government agency guarantee programs are used to reduce the risk of loss. At December 31, 2023, $29.7 million of our loans were substantially guaranteed under these government programs.
Effective January 1, 2023, we adopted Accounting Standards Update 2016-13 “Financial Instruments - Credit Losses (Topic 326): Measurement of Credit Losses on Financial Instruments.” This guidance established a single allowance framework for all financial assets measured at amortized cost and certain offbalance sheet credit exposures, and replaced the incurred loss guidance. This framework requires that management’s estimate reflects credit losses over the asset’s remaining expected life and considers expected future changes in macroeconomic conditions and is referred to as the Current Expected Credit Loss (CECL) model The allowance for credit losses comprises the allowance for credit losses on loans and unfunded commitments
1Prior years' ratios have been updated to conform to the current year's presentation.
2Total delinquencies include accrual and nonaccrual loans 30 days or more past due.
Note: Prior to the adoption of CECL, which was effective January 1, 2023, accruing loans included accrued interest receivable.
Our nonperforming assets have increased from December 31, 2022, but remained at acceptable levels Despite the increase in nonperforming assets, total nonperforming loans as a percentage of total loans were well within our established risk management guidelines
The increase in nonaccrual loans was primarily due to one relationship in our capital markets portfolio and a small number of poultry loans transferring to nonaccrual during the period ended December 31, 2023. Nonaccrual loans remained at an acceptable level at December 31, 2023, 2022, and 2021
Our accounting policy requires loans past due 90 days or more to be transferred into nonaccrual status unless adequately secured and in the process of collection Based on our analysis, accruing loans 90 days or more past due were eligible to remain in accruing status
Allowance for Credit Losses on Loans
Allowance for Credit Losses on Loans Coverage Ratios
As of December 31, 2023 2022 2021
1Prior years' ratios have been updated to conform to the current year's presentation.
Effective January 1, 2023, the allowance for credit losses on loans is an estimate of expected credit losses in our portfolio. We determine the appropriate level of allowance for credit losses on loans based on a disciplined process and methodology that incorporates expected probabilities of default and loss given default based on historical portfolio performance, forecasts of future economic conditions, and management's judgment with respect to unique aspects of current and expected conditions that may not be contemplated in historical loss experience or forecasted economic conditions. Prior to January 1, 2023, the allowance for loan losses was an estimate of losses incurred on loans in our portfolio that were probable and estimable as of December 31, 2022, and 2021
Total allowance for credit losses on loans was $4.4 million, $3.4 million, and $2.3 million at December 31, 2023, 2022, and 2021, respectively The increase from December 31, 2022, was primarily related to the corresponding increase in nonaccrual loans partially offset by a charge-off in our capital markets portfolio
Additional loan information is included in Notes 3, 9, 10, and 11 to the accompanying Consolidated Financial Statements
RESULTS OF OPERATIONS
Changes presented in the profitability information chart relate directly to:
• Changes in net income discussed in this section
• Changes in assets discussed in the Loan Portfolio section
• Changes in capital discussed in the Capital Adequacy section
Net interest income included income on nonaccrual loans that totaled $527 thousand, $727 thousand, and $294 thousand in 2023, 2022, and 2021, respectively. Nonaccrual interest income is recognized when received in cash, collection of the recorded investment is fully expected, and prior charge-offs have been recovered
Net interest margin (net interest income as a percentage of average earning assets) was 3.0%, 2.9%, and 2.8% in 2023, 2022, and 2021, respectively Our net interest margin is sensitive to interest rate changes and competition.
The change in non-interest expense was primarily related to an increase in salaries and employee benefits, purchased and vendor services, and occupancy and equipment expenses.
Salaries and Employee Benefits: Salaries and employee benefits expense increased primarily due to 2023 merit raises and open positions being filled.
Purchased and Vendor Services: The increase in purchased and vendor services expense was primarily due to technology expenses from upgrades being put into service
Occupancy and Equipment: The increase in occupancy and equipment expense was primarily due to depreciation related to purchased software being put into service
We borrow from AgriBank, under a note payable, in the form of a line of credit, as described in Note 5 to the accompanying Consolidated Financial Statements This line of credit is our primary source of liquidity and is used to fund operations and meet current obligations. At December 31, 2023, we had $541.2 million available under our line of credit. We generally apply excess cash to this line of credit. Due to the cooperative structure of the Farm Credit System and as we are a stockholder of AgriBank, we expect this borrowing relationship to continue into the foreseeable future. Our other source of lendable funds is from equity.
(dollars in thousands)
December 31, 2023 2022 2021
Our average cost of funds is variable and may fluctuate based on the current interest rate environment.
The repricing attributes of our line of credit generally correspond to the repricing attributes of our loan portfolio, which significantly reduces our market interest rate risk However, we maintain some exposure to interest rates, primarily from loans to customers which may not have a component of our line of credit with an exact repricing attribute
In August 2023, Fitch Ratings lowered the U.S. sovereign’s long-term Issuer Default Rating and the long-term debt rating for the Farm Credit System to AA+ from AAA, the F1+ short-term ratings were affirmed, and the outlooks on the long-term debt ratings were revised to stable. As a government-sponsored entity, the Farm Credit System benefits from the implicit government support and, therefore, the ratings are directly linked to the U.S. sovereign rating. Additionally, Fitch Ratings lowered the long-term debt rating for the Farm Credit Banks, including AgriBank, to A+ from AA-, the F1+ short-term rating was affirmed, and the outlook on the long-term debt rating was revised to stable. The reduction in the credit rating by Fitch Ratings for the Farm Credit Banks, including AgriBank, could result in higher funding costs which could impact our costs and, ultimately, retail rates. However, to date we have noticed no significant impact as a result of this rating change.
Total members’ equity was $383.3 million, $363.2 million, and $344.9 million at December 31, 2023, 2022, and 2021, respectively. Total members’ equity increased $20.1 million from December 31, 2022, primarily due to net income for the year partially offset by patronage distribution accruals
The FCA Regulations require us to maintain minimums for our common equity tier 1, tier 1 capital, total capital, and permanent capital risk-based capital ratios. In addition, the FCA requires us to maintain minimums for our non-risk-adjusted ratios of tier 1 leverage and unallocated retained earnings and equivalents leverage Effective January 1, 2022, the FCA Regulations slightly modified the calculation of the unallocated retained earnings and equivalents leverage ratio to include certain additional deductions. The modification did not have a material impact on this ratio.
Our capital plan is designed to maintain an adequate amount of surplus and allowance for credit losses which represents our reserve for adversity prior to impairment of stock. We manage our capital to allow us to meet member needs and protect member interests, both now and in the future
Capital ratios are directly impacted by changes in capital, assets, and off-balance sheet commitments. Refer to the Loan Portfolio section for further discussion of the changes in assets Additional information on regulatory ratios and members’ equity information is included in Note 6 to the accompanying Consolidated Financial Statements and information on off-balance sheet commitments is included in Note 10 to the accompanying Consolidated Financial Statements
In addition to these regulatory requirements, we establish an optimum permanent capital target This target allows us to maintain a capital base adequate for future growth and investment in new products and services The target is subject to revision as circumstances change Our optimum permanent capital target is 15.5%, as defined in our 2024 capital plan
If the capital ratios fall below the total requirements, including the buffer amounts, capital distributions (equity redemptions, dividends, and patronage) and discretionary senior executive bonuses are restricted or prohibited without prior FCA approval. We do not foresee any events that would result in this prohibition in 2024
We borrow from AgriBank to fund our lending operations in accordance with the Farm Credit Act. Approval from AgriBank is required for us to borrow elsewhere. A General Financing Agreement (GFA), as described in Note 5 to the accompanying Consolidated Financial Statements, governs this lending relationship.
The components of cost of funds under the GFA include:
• A marginal cost of debt component
• A spread component, which includes cost of servicing, cost of liquidity, and bank profit
• A risk premium component, if applicable
In the periods presented, we were not subject to the risk premium component. Certain factors may impact our cost of funds, which primarily include market interest rate changes impacting marginal cost of debt as well as changes to pricing methodologies impacting the spread components described above.
The marginal cost of debt approach simulates matching the cost of underlying debt with similar terms as the anticipated terms of our loans to borrowers. This approach substantially protects us from market interest rate risk We may occasionally engage in funding strategies that result in limited interest rate risk with approval by AgriBank’s Asset/Liability Committee.
We are required to invest in AgriBank capital stock as a condition of borrowing. This investment may be in the form of purchased stock or stock representing distributed AgriBank surplus As of December 31, 2023, we were required by AgriBank to maintain an investment equal to 3.0% of the average quarterly balance of our note payable The required investment increased to 3.1% for 2024 In addition to the required investment based on the note payable, asset pool programs are typically capitalized at a higher rate that is mutually agreed upon in the asset pool program agreements.
We are also required to hold additional investment in AgriBank based on a contractual agreement under any asset pool program in which we participate
As an AgDirect, LLP partnering association, we are required to purchase stock in AgDirect, which purchases an equivalent amount of stock in AgriBank. Patronage
AgriBank’s capital plan is intended to provide for adequate capital at AgriBank under capital regulations as well as to create a path to long-term capital optimization within the AgriBank District The plan optimizes capital at AgriBank; distributing available AgriBank earnings in the form of patronage, either cash or AgriBank stock, which is at the sole discretion of the AgriBank Board of Directors The plan is designed to maintain capital adequacy such that sufficient earnings will be retained in the form of unallocated retained earnings and allocated stock to meet the leverage ratio target and other regulatory or policy constraints prior to any cash patronage distributions.
Purchased Services
We purchase certain business services, primarily financial reporting, from AgriBank. Additional related party information is included in Note 9 to the accompanying Consolidated Financial Statements.
Due to the nature of our financial relationship with AgriBank, the financial condition and results of operations of AgriBank materially impact our members’ investment
Capital Markets Collaboration: We participate in the Capital Markets Collaboration (CMC) with three other AgriBank District associations, which involves purchasing participation interests in loans to eligible borrowers GreenStone Farm Credit Services, ACA is the lead lender and facilitating agent of these participations. The CMC focuses on generating revenue and loan volume for the financial benefit of all four participating associations. Management for each association has direct decision-making authority over the loans purchased and serviced for their respective association. The business arrangement provides additional means for diversifying each participant’s portfolio, helps reduce concentration risk, and positions the participants for continued growth.
CentRic Technology Collaboration: We participate in CentRic Technology Collaboration (CTC) with certain other AgriBank District associations. The CTC facilitates the development and maintenance of certain retail technology systems essential to providing credit and other services to our members The CTC operations are governed by representatives of each participating association The expenses of CTC are allocated to each of the participating associations based on an agreed upon formula. The systems developed are owned by each of the participating associations.
CoBank, ACB: We have a relationship with CoBank, ACB (CoBank), a System bank, which involves purchasing and selling participation interests in loans As part of this relationship, our equity investment in CoBank was $8 thousand as of December 31, 2023. As of December 31, 2022, and 2021 we did not hold an equity investment in CoBank.
SunStream Business Services: We have a relationship with SunStream Business Services (SunStream), a System service corporation, which involves purchasing financial and retail information technology, collateral, tax reporting, and insurance services As of December 31, 2023, 2022, and 2021, our investment in SunStream was $696 thousand, $598 thousand, and $503 thousand, respectively Additional related party information is included in Note 9 to the accompanying Consolidated Financial Statements. We also guarantee the amounts borrowed by SunStream on their line of credit with AgriBank, up to $40.0 million. Refer to Note 10 to the accompanying Consolidated Financial Statements for further disclosure
Farm Credit Foundations: We have a relationship with Farm Credit Foundations (Foundations), a System service corporation, which involves purchasing human resource, benefit, payroll, and workforce management services As of December 31, 2023, 2022, and 2021, our investment in Foundations was $17 thousand Additional related party information is included in Note 9 to the accompanying Consolidated Financial Statements.
Rural Business Investment Company: We and other Farm Credit institutions are among the limited partners for a Rural Business Investment Company (RBIC) Our investment in a RBIC, was $1.8 million, $1.7 million, and $1.4 million at December 31, 2023, 2022, and 2021, respectively Refer to Note 10 to the accompanying Consolidated Financial Statements for further disclosure
Unincorporated Business Entities (UBEs)
In certain circumstances we may establish separate entities to acquire and manage complex collateral, primarily for legal liability purposes
AgDirect, LLP: We participate in the AgDirect trade credit financing program, which includes origination and refinancing of agriculture equipment loans through independent equipment dealers. The program is facilitated by another AgriBank District association through a limited liability partnership in which we are a partial owner Our investment in AgDirect, LLP, was $1 9 million, $1.8 million, and $1.9 million at December 31, 2023, 2022, and 2021, respectively. We also receive a partnership distribution resulting from our participation in the program, which is included in “Patronage income” in the Consolidated Statements of Comprehensive Income.
We are involved in the following programs designed to improve our credit delivery, related services, and marketplace presence
AgDirect: We participate in the AgDirect trade credit financing program Refer to the UBEs section for further discussion on this program
Farm Cash Management: We offer Farm Cash Management to our members Farm Cash Management links members’ revolving lines of credit with an AgriBank investment bond to optimize members’ use of funds.
We prepare the Consolidated Financial Statements of Farm Credit Services of Western Arkansas, ACA (the Association) and are responsible for their integrity and objectivity, including amounts that must necessarily be based on judgments and estimates The Consolidated Financial Statements have been prepared in conformity with accounting principles generally accepted in the United States of America The Consolidated Financial Statements, in our opinion, fairly present the financial condition of the Association Other financial information included in the Annual Report is consistent with that in the Consolidated Financial Statements.
To meet our responsibility for reliable financial information, we depend on accounting and internal control systems designed to provide reasonable but not absolute assurance that assets are safeguarded and transactions are properly authorized and recorded Costs must be reasonable in relation to the benefits derived when designing accounting and internal control systems. Financial operations audits are performed to monitor compliance PricewaterhouseCoopers LLP, our independent auditors, audit the Consolidated Financial Statements They also consider internal controls to the extent necessary to design audit procedures that comply with auditing standards generally accepted in the United States of America The Farm Credit Administration also performs examinations for safety and soundness as well as compliance with applicable laws and regulations
The Board of Directors has overall responsibility for our system of internal control and financial reporting The Board of Directors and its Audit Committee consults regularly with us and meets periodically with the independent auditors and other auditors to review the scope and results of their work The independent auditors have direct access to the Board of Directors, which is composed solely of directors who are not officers or employees of the Association
The undersigned certify we have reviewed the Association’s Annual Report, which has been prepared in accordance with all applicable statutory or regulatory requirements. The information contained herein is true, accurate, and complete to the best of our knowledge and belief
Cody Jones
Chairperson
of the BoardFarm Credit Services of Western Arkansas, ACA
Brandon Haberer
President and Chief Executive Officer
Farm Credit Services of Western Arkansas, ACA

Lori Schumacher
Senior Vice President of Finance and Chief Financial Officer
Farm Credit Services of Western Arkansas, ACA
March 6, 2024
The Farm Credit Services of Western Arkansas, ACA (the Association) principal executives and principal financial officers, or persons performing similar functions, are responsible for establishing and maintaining effective internal control over financial reporting for the Association’s Consolidated Financial Statements. For purposes of this report, “internal control over financial reporting” is defined as a process designed by, or under the supervision of the Association’s principal executives and principal financial officers, or persons performing similar functions, and effected by its Board of Directors, management and other personnel, to provide reasonable assurance regarding the reliability of financial reporting information and the preparation of the Consolidated Financial Statements for external purposes in accordance with accounting principles generally accepted in the United States of America and includes those policies and procedures that: (1) pertain to the maintenance of records that in reasonable detail accurately and fairly reflect the transactions and dispositions of the assets of the Association, (2) provide reasonable assurance that transactions are recorded as necessary to permit preparation of financial information in accordance with accounting principles generally accepted in the United States of America, and that receipts and expenditures are being made only in accordance with authorizations of management and directors of the Association, and (3) provide reasonable assurance regarding prevention, or timely detection and correction, of unauthorized acquisition, use, or disposition of the Association’s assets that could have a material effect on its Consolidated Financial Statements.
Because of its inherent limitations, internal control over financial reporting may not prevent or detect misstatements. Projections of any evaluation of effectiveness to future periods are subject to the risk that controls may become inadequate because of changes in conditions, or that the degree of compliance with the policies or procedures may deteriorate.
The Association’s management has completed an assessment of the effectiveness of internal control over financial reporting as of December 31, 2023 In making the assessment, management used the 2013 framework in Internal Control Integrated Framework, promulgated by the Committee of Sponsoring Organizations of the Treadway Commission, commonly referred to as the “COSO” criteria.
Based on the assessment performed, the Association concluded that as of December 31, 2023, the internal control over financial reporting was effective based upon the COSO criteria. Additionally, based on this assessment, the Association determined that there were no material weaknesses in the internal control over financial reporting as of December 31, 2023
Brandon Haberer
President and Chief Executive Officer
Farm Credit Services of Western Arkansas, ACA
Lori Schumacher
Senior Vice President of Finance and Chief Financial Officer
Farm Credit Services of Western Arkansas, ACA
March 6, 2024
The Consolidated Financial Statements were prepared under the oversight of the Audit Committee. The Audit Committee is composed of a subset of the Board of Directors of Farm Credit Services of Western Arkansas, ACA (the Association). The Audit Committee oversees the scope of the Association’s internal audit program, the approval and independence of PricewaterhouseCoopers LLP (PwC) as independent auditors, the adequacy of the Association’s system of internal controls and procedures, and the adequacy of management’s actions with respect to recommendations arising from those auditing activities The Audit Committee’s responsibilities are described more fully in the Internal Control Policy and the Audit Committee Charter.
Management is responsible for internal controls and the preparation of the Consolidated Financial Statements in accordance with accounting principles generally accepted in the United States of America. PwC is responsible for performing an independent audit of the Consolidated Financial Statements in accordance with auditing standards generally accepted in the United States of America and to issue their report based on their audit The Audit Committee’s responsibilities include monitoring and overseeing these processes
In this context, the Audit Committee reviewed and discussed the audited Consolidated Financial Statements for the year ended December 31, 2023, with management The Audit Committee also reviewed with PwC the matters required to be discussed by Statement on Auditing Standards AU-C 260, The Auditor’s Communication with Those Charged with Governance, and both PwC and the internal auditor directly provided reports on any significant matters to the Audit Committee
The Audit Committee had discussions with and received written disclosures from PwC confirming its independence The Audit Committee also reviewed the non-audit services provided by PwC, if any, and concluded these services were not incompatible with maintaining PwC’s independence The Audit Committee discussed with management and PwC any other matters and received any assurances from them as the Audit Committee deemed appropriate.
Based on the foregoing review and discussions, and relying thereon, the Audit Committee recommended the audited Consolidated Financial Statements be included in the Annual Report for the year ended December 31, 2023
 Kim Hogan Chairperson of the Audit Committee Farm Credit Services of Western Arkansas, ACA
Audit Committee Members:
Audie “Renny” Chesshir
Ralph Allen Moore
Gerald Strobel
Stephen Young
March 6, 2024

To the Board of Directors of Farm Credit Services of Western Arkansas, ACA:
We have audited the accompanying consolidated financial statements of Farm Credit Services of Western Arkansas, ACA and its subsidiaries (the “Association”), which comprise the consolidated statements of condition as of December 31, 2023, 2022 and 2021, and the related consolidated statements of comprehensive income, changes in members’ equity and cash flows for the years then ended, including the related notes (collectively referred to as the “consolidated financial statements”)
In our opinion, the accompanying consolidated financial statements present fairly, in all material respects, the financial position of the Association as of December 31, 2023, 2022 and 2021, and the results of its operations and its cash flows for the years then ended in accordance with accounting principles generally accepted in the United States of America.
We conducted our audit in accordance with auditing standards generally accepted in the United States of America (US GAAS). Our responsibilities under those standards are further described in the Auditors’ Responsibilities for the Audit of the Consolidated Financial Statements section of our report
We are required to be independent of the Association and to meet our other ethical responsibilities, in accordance with the relevant ethical requirements relating to our audit. We believe that the audit evidence we have obtained is sufficient and appropriate to provide a basis for our audit opinion.
As discussed in Note 2 to the consolidated financial statements, the Association changed the manner in which it accounts for the allowance for credit losses in 2023. Our opinion is not modified with respect to this matter.
Responsibilities of Management for the Consolidated Financial Statements
Management is responsible for the preparation and fair presentation of the consolidated financial statements in accordance with accounting principles generally accepted in the United States of America, and for the design, implementation, and maintenance of internal control relevant to the preparation and fair presentation of consolidated financial statements that are free from material misstatement, whether due to fraud or error.
In preparing the consolidated financial statements, management is required to evaluate whether there are conditions or events, considered in the aggregate, that raise substantial doubt about the Association’s ability to continue as a going concern for one year after the date the consolidated financial statements are available to be issued
Our objectives are to obtain reasonable assurance about whether the consolidated financial statements as a whole are free from material misstatement, whether due to fraud or error, and to issue an auditors’ report that includes our opinion. Reasonable assurance is a high level of assurance but is not absolute assurance and therefore is not a guarantee that an audit conducted in accordance with US GAAS will always detect a material misstatement when it exists. The risk of not detecting a material misstatement resulting from fraud is higher than for one resulting from error, as fraud may involve collusion, forgery, intentional omissions, misrepresentations, or the override of internal control. Misstatements are considered material if there is a substantial likelihood that, individually or in the aggregate, they would influence the judgment made by a reasonable user based on the consolidated financial statements
In performing an audit in accordance with US GAAS, we:
• Exercise professional judgment and maintain professional skepticism throughout the audit.
• Identify and assess the risks of material misstatement of the consolidated financial statements, whether due to fraud or error, and design and perform audit procedures responsive to those risks. Such procedures include examining, on a test basis, evidence regarding the amounts and disclosures in the consolidated financial statements
• Obtain an understanding of internal control relevant to the audit in order to design audit procedures that are appropriate in the circumstances, but not for the purpose of expressing an opinion on the effectiveness of the Association’s internal control Accordingly, no such opinion is expressed.
• Evaluate the appropriateness of accounting policies used and the reasonableness of significant accounting estimates made by management, as well as evaluate the overall presentation of the consolidated financial statements.
• Conclude whether, in our judgment, there are conditions or events, considered in the aggregate, that raise substantial doubt about the Association’s ability to continue as a going concern for a reasonable period of time.
PricewaterhouseCoopers LLP, 45 South Seventh Street, Suite 3400, Minneapolis, MN 55402
T: (612) 596 6000, F: (612) 373 7160, www.pwc.com

We are required to communicate with those charged with governance regarding, among other matters, the planned scope and timing of the audit, significant audit findings, and certain internal control-related matters that we identified during the audit.
Management is responsible for the other information included in the annual report The other information comprises the information included in the 2023 Annual Report, but does not include the consolidated financial statements and our auditors’ report thereon. Our opinion on the consolidated financial statements does not cover the other information, and we do not express an opinion or any form of assurance thereon.
In connection with our audit of the consolidated financial statements, our responsibility is to read the other information and consider whether a material inconsistency exists between the other information and the consolidated financial statements or the other information otherwise appears to be materially misstated. If, based on the work performed, we conclude that an uncorrected material misstatement of the other information exists, we are required to describe it in our report.
Minneapolis, Minnesota March 6, 2024
The accompanying notes are an integral part of these Consolidated Financial Statements.
The accompanying notes are an integral part of these Consolidated Financial Statements.
The accompanying notes are an integral part of these Consolidated Financial Statements.
The accompanying notes are an integral part of these Consolidated Financial Statements.
Farm Credit Services of Western Arkansas, ACA
The Farm Credit System (System) is a federally chartered network of borrower-owned lending institutions comprised of cooperatives and related service organizations, established by Congress to meet the credit needs of American agriculture As of January 1, 2024, the System consisted of three Farm Credit Banks, one Agricultural Credit Bank, and 56 borrower-owned cooperative lending institutions (associations) The AgriBank Farm Credit District (AgriBank District or the District) is primarily comprised of AgriBank, FCB (AgriBank), a System Farm Credit Bank, and its District associations The AgriBank District associations consist of Agricultural Credit Associations (ACA) that each have wholly-owned Federal Land Credit Association (FLCA) and Production Credit Association (PCA) subsidiaries
FLCAs are authorized to originate long-term real estate mortgage loans PCAs are authorized to originate short-term and intermediate-term loans. ACAs are authorized to originate long-term real estate mortgage loans and short-term and intermediate-term loans either directly or through their subsidiaries Associations are authorized to provide lease financing options for agricultural purposes and are also authorized to purchase and hold certain types of investments. AgriBank provides funding to all associations chartered within the District.
Associations are authorized to provide, either directly or in participation with other lenders, credit and related services to eligible borrowers Eligible borrowers may include farmers, ranchers, producers or harvesters of aquatic products, rural residents, and farm-related service businesses In addition, associations can participate with other lenders in loans to similar entities. Similar entities are parties that are not eligible for a loan from a System lending institution, but have operations that are functionally similar to the activities of eligible borrowers.
The Farm Credit Administration (FCA) is authorized by Congress to regulate the System banks and associations. We are examined by the FCA and certain association actions are subject to the prior approval of the FCA and/or AgriBank
The Farm Credit System Insurance Corporation (FCSIC) administers the Farm Credit Insurance Fund (Insurance Fund) The Insurance Fund is used to ensure the timely payment of principal and interest on Systemwide debt obligations, to ensure the retirement of protected borrower capital at par or stated value, and for other specified purposes
At the discretion of the FCSIC, the Insurance Fund is also available to provide assistance to certain troubled System institutions and for the operating expenses of the FCSIC. Each System bank is required to pay premiums into the Insurance Fund until the assets in the Insurance Fund equal 2.0% of the aggregated insured obligations adjusted to reflect the reduced risk on loans or investments guaranteed by federal or state governments. This percentage of aggregate obligations can be changed by the FCSIC, at its sole discretion, to a percentage it determines to be actuarially sound. The basis for assessing premiums is debt outstanding with adjustments made for nonaccrual loans and impaired investment securities which are assessed a surcharge while guaranteed loans and investment securities are deductions from the premium base. AgriBank, in turn, assesses premiums to District associations each year based on similar factors.
Association
Farm Credit Services of Western Arkansas, ACA (the Association) and its subsidiaries, Farm Credit Services of Western Arkansas, FLCA and Farm Credit Services of Western Arkansas, PCA (subsidiaries) are lending institutions of the System We are a borrower-owned cooperative providing credit and credit-related services to, or for the benefit of, eligible members for qualified agricultural purposes in the counties of Baxter, Benton, Boone, Calhoun, Carroll, Clark, Columbia, Conway, Crawford, Dallas, Faulkner, Franklin, Garland, Grant, Hempstead, Hot Spring, Howard, Johnson, LaFayette, Little River, Logan, Madison, Marion, Miller, Montgomery, Nevada, Newton, Ouachita, Perry, Pike, Polk, Pope, Saline, Scott, Searcy, Sebastian, Sevier, Union, Van Buren, Washington, and Yell in the state of Arkansas
We borrow from AgriBank and provide financing and related services to our members Our ACA holds all the stock of the FLCA and PCA subsidiaries
We offer credit life and term life insurance to borrowers and those eligible to borrow We also offer fee appraisals to our members
Our accounting and reporting policies conform to generally accepted accounting principles in the United States of America (GAAP) and the prevailing practices within the financial services industry. Preparing financial statements in conformity with GAAP requires us to make estimates and assumptions that affect the reported amounts of assets and liabilities and disclosure of contingent assets and liabilities at the date of the Consolidated Financial Statements and the reported amounts of revenues and expenses during the period. Actual results could differ from those estimates.
Certain amounts in prior years’ financial statements have been reclassified to conform to the current year’s presentation.
The Consolidated Financial Statements present the consolidated financial results of Farm Credit Services of Western Arkansas, ACA and its subsidiaries. All material intercompany transactions and balances have been eliminated in consolidation
Loans: Loans are carried at their principal amount outstanding, net of any unearned income, cumulative net charge-offs, unamortized deferred fees and costs on originated loans, and unamortized premiums or discounts on purchased loans Loan interest is accrued and credited to interest income based upon the daily principal amount outstanding Origination fees, net of related costs, are deferred and recognized over the life of the loan as an adjustment to net interest income
The net amount of loan fees and related origination costs are not material to the Consolidated Financial Statements taken as a whole
A loan is considered contractually past due when any principal repayment or interest payment required by the loan instrument is not received on or before the due date. A loan remains contractually past due until certain modifications are completed or until the entire amount past due, including principal, accrued interest and penalty interest incurred as the result of past due status, is collected or otherwise discharged in full
Generally, loans are placed in nonaccrual status when principal or interest is delinquent for 90 days or more (unless adequately secured and in the process of collection) or circumstances indicate that full collection is not expected. When a loan is placed in nonaccrual status, and the interest is determined to be both uncollectible and the loss is known, we immediately reverse current year accrued interest to the extent principal plus accrued interest exceeds the net realizable value of the collateral prior to reclassification. When we deem a loan to be uncollectible, we charge the loan principal and prior year(s) accrued interest against the allowance for credit losses on loans Subsequent recoveries, if any, are added to the allowance for credit losses on loans Any cash received on nonaccrual loans is applied to reduce the carrying amount in the loan, except in those cases where the collection of the carrying amount is fully expected and certain other criteria are met. In these circumstances, interest is credited to income when cash is received. Loans are charged-off at the time they are determined to be uncollectible. Nonaccrual loans may be returned to accrual status when principal and interest are current, the customer’s ability to fulfill the contractual payment terms is fully expected, and, if the loan was past due when placed in nonaccrual status, the loan has evidence of sustained performance in making on-time contractual payments (typically based on payment frequency).
Loan modifications may be granted to borrowers experiencing financial difficulty. Modifications are one or a combination of principal forgiveness, interest rate reduction, other-than-insignificant term extension, or other-than-insignificant payment deferrals Other-than-insignificant term extensions are defined as those greater than or equal to six months. Covenant waivers and modifications of contingent acceleration clauses are not considered term extensions. Other-thaninsignificant payment deferrals are defined as cumulative or individual payment delays greater than or equal to six months
Prior to January 1, 2023, in situations where, for economic or legal reasons related to the borrower’s financial difficulties, we granted a concession for other than an insignificant period of time to the borrower that we would not otherwise consider, the related loan was classified as a troubled debt restructuring (TDR), also known as a formally restructured loan for regulatory purposes. A concession was generally granted to minimize economic loss and avoid foreclosure. Concessions varied by program and borrower and may have included interest rate reductions, term extensions, payment deferrals, or an acceptance of additional collateral in lieu of payments. In limited circumstances, principal may have been forgiven. Loans classified as TDRs were considered risk loans There may have been modifications made in the normal course of business that were not considered TDRs
Loans that are sold as participations are transferred as entire financial assets, groups of entire financial assets, or participating interests in the loans The transfers of such assets or participating interests are structured such that control over the transferred assets, or participating interests have been surrendered and that all the conditions have been met to be accounted for as a sale.
Allowance for Credit Losses: Effective January 1, 2023, we adopted Accounting Standards Update (ASU) 2016-13 “Financial Instruments - Credit Losses (Topic 326): Measurement of Credit Losses on Financial Instruments.” This guidance established a single allowance framework for all financial assets measured at amortized cost and certain off-balance sheet credit exposures, and replaced the incurred loss guidance. This framework requires that management’s estimate reflects credit losses over the asset’s remaining expected life and considers expected future changes in macroeconomic conditions and is referred to as the Current Expected Credit Loss (CECL) model The allowance for credit losses (ACL) comprises the allowance for credit losses on loans and unfunded commitments
Allowance for Credit Losses on Loans
Beginning January 1, 2023, the allowance for credit losses on loans (ACLL) represents the estimated current expected credit losses on the loan portfolio over the remaining contractual life of the loan portfolio adjusted for expected prepayments The ACLL takes into consideration relevant information about past events, current conditions, and reasonable and supportable macroeconomic forecasts of future conditions. The contractual term excludes expected extensions, renewals, and modifications unless the extension or renewal options are not unconditionally cancellable.
The ACLL is increased through provisions for credit losses on loans and loan recoveries and is decreased through reversals of provision for credit losses on loans and loan charge-offs. The provision activity is included as part of the “Provision for credit losses” in the Consolidated Statements of Comprehensive Income.
Determining the appropriateness of the ACLL is complex and requires judgment by management about the effect of matters that are inherently uncertain. Loans are evaluated on the amortized cost basis, which includes unamortized premiums and discounts
We employ a disciplined process and methodology to establish the ACLL that has two basic components: first, an asset-specific component involving individual loans that do not share risk characteristics with other loans and the measurement of expected credit losses for such individual loans; and second, a pooled component for estimated expected credit losses for pools of loans that share similar risk characteristics. When a loan does not share risk characteristics with other loans, expected credit loss is measured as the difference between the amortized cost basis in the loan and the present value of expected future cash flows discounted at the loan’s effective interest rate except that, for collateral-dependent loans, credit loss is measured as the difference between the amortized cost basis in the loan and the fair value of the underlying collateral. If the calculated expected credit loss is determined to
be permanent, fixed or non-recoverable, the credit loss portion of the loan will be charged-off against the ACLL For more information see the Collateral Dependent Loans policy in the significant accounting policies section of this report
In estimating the pooled component of the ACLL that share common risk characteristics, loans are pooled and segregated into loan classes based on loan type, commodity, and internal risk rating. For reporting purposes, the portfolio is classified by loan type We utilize a model to calculate an expected life-ofloan loss percentage for each loan pool by considering the probability of default, based on the migration of loans from performing to loss by internal risk rating, and the loss given default, based on historical experience Loan borrower characteristics are also utilized and include internal risk ratings, delinquency status, and the remaining term of the loan, adjusted for expected prepayments.
In order to calculate this estimated migration of loans from performing to loss, we utilize a single economic scenario over a reasonable and supportable forecast period of three years The economic forecasts are updated on a quarterly basis and include macroeconomic variables such as net farm income, unemployment rates, real gross domestic product levels, housing price index, and agricultural land values. Subsequent to the forecast period, our model applies a smoothed reversion to historical loss experience to estimate losses for the remaining estimated contractual life of the portfolio.
The final credit loss estimate also considers factors not reflected in the economic forecast and historical loss experience due to the unique aspects of current conditions and expectations. These factors may include, but are not limited to: lending policies and procedures, experience and depth of lending staff, credit quality and delinquency trends, individual borrower and industry concentrations, national, regional, and local economic business conditions and developments, collateral value trends, and expected performance of specific industry sectors not reflected in the economic forecast Consideration of these factors, as well as the imprecision inherent in the process and methodology may lead to a management adjustment to the modeled ACLL results. Expected credit loss estimates also include consideration of expected cash recoveries on loans previously charged-off or expected recoveries on collateral dependent loans where recovery is expected through sale of the collateral.
Prior to January 1, 2023, the allowance for loan losses was an estimate of losses inherent in our loan portfolio as of the financial statement date We determined the appropriate level of allowance for loan losses based on quarterly evaluation of factors such as loan loss history, estimated probability of default, estimated loss given default, portfolio quality, and current economic and environmental conditions.
Under CECL, we evaluate the need for an allowance for credit losses on unfunded commitments, which is included in “Other liabilities” in the Consolidated Statements of Condition The related provision is included as part of the “Provision for credit losses” in the Consolidated Statements of Comprehensive Income. The amount of expected losses is determined by calculating a commitment usage factor over the contractual period for exposures that are not unconditionally cancellable by the Association and applying the loss factors used in the ACLL methodology to the results of the usage calculation. No allowance for credit losses is recorded for commitments that are unconditionally cancellable
Collateral Dependent Loans: Collateral dependent loans are loans secured by collateral, including but not limited to real estate, equipment, inventory, livestock, and income-producing property We measure the expected credit losses based on the fair value of collateral at the reporting date when we determine that foreclosure is probable. Under the fair value practical expedient measurement approach, the expected credit losses are based on the difference between the fair value of the collateral less estimated costs to sell and the amortized cost basis of the loan.
The fair value of the collateral is adjusted for the estimated cost to sell if repayment or satisfaction of a loan is dependent on the sale (rather than only on the operation) of the collateral. In accordance with our appraisal policy, the fair value of collateral-dependent loans is based upon in-house or independent thirdparty appraisals or on in-house collateral valuations. When an updated appraisal or collateral valuation is received, management reassesses the need for adjustments to the loan’s expected credit loss measurements and, where appropriate, records an adjustment.
Additionally, when a borrower is experiencing financial difficulty, we apply the fair value practical expedient measurement approach for loans when the repayment is expected to be provided substantially through the operation or sale of the collateral.
Accrued Interest Receivable: Accrued interest receivable on loans is presented separately in the Consolidated Statements of Condition
Investment in AgriBank: Our stock investment in AgriBank is on a cost plus allocated equities basis
Other Property Owned: Other property owned, consisting of real and personal property acquired through foreclosure or deed in lieu of foreclosure, is recorded at the fair value less estimated selling costs upon acquisition and is included in “Other assets” in the Consolidated Statements of Condition. Any initial reduction in the carrying amount of a loan to the fair value of the collateral received is charged to the allowance for credit losses on loans Revised estimates to the fair value less costs to sell are reported as adjustments to the carrying amount of the asset, provided that such adjusted value is not in excess of the carrying amount at acquisition Related income, expenses, and gains or losses from operations and carrying value adjustments are included in “Other non-interest expense” in the Consolidated Statements of Comprehensive Income
Other Investment: The carrying amount of the investment in the Rural Business Investment Company, in which we are a limited partner and hold a noncontrolling interest, is at cost and is included in “Other assets” in the Consolidated Statements of Condition. The investment is assessed for impairment. If impairment exists, losses are included in Net income in the Consolidated Statements of Comprehensive Income in the year of impairment. Income on the investment is limited to distributions received. In circumstances when distributions exceed our share of earnings after the date of the investment, these distributions are applied to reduce the carrying value of the investment and are not recognized as income.
Premises and Equipment: The carrying amount of premises and equipment is at cost, less accumulated depreciation and is included in “Other assets” in the Consolidated Statements of Condition Calculation of depreciation is generally on the straight-line method over the estimated useful lives of the assets Depreciation and maintenance and repair expenses are included in “Other operating expense” in the Consolidated Statements of Comprehensive Income and improvements are capitalized.
Leases: We are the lessee in operating leases We evaluate arrangements at inception to determine if it is a lease. Leases with an initial term of 12 months or less are not recorded on the Consolidated Statements of Condition with lease expense recognized on a straight-line basis over the lease term For
operating leases with terms greater than 12 months the right-of-use (ROU) assets are included in “Other assets” in the Consolidated Statements of Condition and the lease liabilities are included in “Other liabilities” in the Consolidated Statements of Condition
The ROU assets represent our right to use an underlying asset for the lease term and lease liabilities represent our obligation to make lease payments arising from the lease. Operating lease ROU assets and liabilities are recognized based on the present value of lease payments over the lease term. As most of our leases do not provide an implicit rate, we use our incremental borrowing rate based on the information available at commencement date in determining the present value of lease payments. We use the implicit rate when readily determinable. Our lease terms may include options to extend or terminate the lease The length of the lease term is modified to include the option when it is reasonably certain that we will exercise that option. Operating lease expense for lease payments is recognized on a straight-line basis over the lease term.
Post-Employment Benefit Plans: The District has various post-employment benefit plans in which our employees participate Expenses related to these plans are included in “Salaries and employee benefits” in the Consolidated Statements of Comprehensive Income
Certain employees participate in the AgriBank District Retirement Plan. The plan is comprised of two benefit formulas. At their option, employees hired prior to October 1, 2001, are on the cash balance formula or on the final average pay formula Benefit eligible employees hired between October 1, 2001, and December 31, 2006, are on the cash balance formula. Effective January 1, 2007, the AgriBank District Retirement Plan was closed to new employees. The AgriBank District Retirement Plan utilizes the "Projected Unit Credit" actuarial method for financial reporting and funding purposes
We also provide certain health insurance benefits to eligible retired employees according to the terms of those benefit plans. The anticipated cost of these benefits is accrued during the employees’ active service period.
The defined contribution plan allows eligible employees to save for their retirement either pre-tax, post-tax, or both, with an employer match on a percentage of the employee’s contributions. We provide benefits under this plan for those employees that do not participate in the AgriBank District Retirement Plan in the form of a fixed percentage of salary contribution in addition to the employer match Employer contributions are expensed when incurred.
Certain employees also participate in the Nonqualified Deferred Compensation Plan. Eligible participants must meet one of the following criteria: certain salary thresholds as determined by the Internal Revenue Service (IRS), are either a Chief Executive Officer or President of a participating employer, or have previously elected pre-tax deferrals in 2006 under predecessor nonqualified deferred compensation plans Under this plan the employee may defer a portion of his/her salary, bonus, and other compensation. Additionally, the plan provides for supplemental employer matching contributions related to any compensation deferred by the employee that would have been eligible for a matching contribution under the retirement savings plan if it were not for certain IRS limitations.
Income Taxes: The ACA and PCA accrue federal and state income taxes Deferred tax assets and liabilities are recognized for future tax consequences of temporary differences between the carrying amounts and tax basis of assets and liabilities Deferred tax assets are recorded if the deferred tax asset is more likely than not to be realized. If the realization test cannot be met, the deferred tax asset is reduced by a valuation allowance The expected future tax consequences of uncertain income tax positions are accrued.
The FLCA is exempt from federal and other taxes to the extent provided in the Farm Credit Act
Patronage Program: We accrue patronage distributions according to a prescribed formula approved by the Board of Directors. Generally, we pay the accrued patronage during the first quarter after year end.
Off-Balance Sheet Credit Exposures: Commitments to extend credit are agreements to lend to a borrower as long as there is not a violation of any condition established in the loan contract The commitments to extend credit generally have fixed expiration dates or other termination clauses Standby letters of credit are agreements to pay a beneficiary if there is a default on a contractual arrangement We evaluate the need for an allowance for credit losses on unfunded commitments, which is included in “Other liabilities” in the Consolidated Statements of Condition For more information see the allowance for credit losses on unfunded commitments policy in the significant accounting policies section of this report.
Cash: For purposes of reporting cash flow, cash includes cash on hand
Fair Value Measurement: The accounting guidance describes three levels of inputs that may be used to measure fair value
Level 1 Unadjusted quoted prices in active markets for identical assets or liabilities that the reporting entity has the ability to access at the measurement date
Level 2 Observable inputs other than quoted prices included within Level 1 that are observable for the asset or liability either directly or indirectly. Level 2 inputs include:
• Quoted prices for similar assets or liabilities in active markets
• Quoted prices for identical or similar assets or liabilities in markets that are not active so that they are traded less frequently than exchange-traded instruments, quoted prices that are not current, or principal market information that is not released publicly
• Inputs that are observable such as interest rates and yield curves, prepayment speeds, credit risks, and default rates
• Inputs derived principally from or corroborated by observable market data by correlation or other means
Level 3 Unobservable inputs that are supported by little or no market activity and that are significant to the fair value of the assets or liabilities These unobservable inputs reflect the reporting entity’s own judgments about assumptions that market participants would use in pricing the asset or liability. Level 3 assets and liabilities include financial instruments whose value is determined using pricing models, discounted cash flow methodologies, or similar techniques, as well as instruments for which the determination of fair value requires significant management judgment or estimation
We have assessed the potential impact of accounting standards that have been issued by the Financial Accounting Standards Board (FASB) and have determined the following standards to be applicable to our business. While we are a nonpublic business entity, our financial results are closely related to the performance of the combined Farm Credit System. Therefore, we typically adopt accounting pronouncements in alignment with other System institutions.
Standard and effective date
In June 2016, the FASB issued ASU 2016-13 “Financial Instruments - Credit Losses (Topic 326): Measurement of Credit Losses on Financial Instruments." The guidance was originally effective for non-U S. Securities Exchange Commission filers for our first quarter of 2021. In November 2019, the FASB issued ASU 2019-10 which amended the mandatory effective date for this guidance for certain institutions. We qualified for the deferral of the mandatory effective date. As a result of the change, the standard was effective for our first quarter of 2023 and early adoption was permitted. Additionally, the FASB issued several updates during 2019 refining and clarifying Topic 326.
In March 2022, the FASB issued ASU 2022-02 “Financial Instruments - Credit Losses (Topic 326): Troubled Debt Restructurings and Vintage Disclosures.” The guidance was effective at the same time that ASU 2016-13 was adopted.
In December 2023, the FASB issued ASU 202309, “Income Taxes (Topic 740): Improvements to Income Tax Disclosures.” This guidance is effective for annual periods beginning after December 15, 2025.
Description
This guidance replaced the incurred loss impairment methodology with a methodology that reflects expected credit losses and requires consideration of a broader range of reasonable and supportable information to inform credit loss estimates
Adoption status and financial statement impact
We adopted the standard and related updates as of January 1, 2023 As a result of adoption of this guidance, the allowance for credit losses on loans increased by $126 thousand and the allowance for credit losses on unfunded commitments increased by $184 thousand, with a cumulative-effect decrease, net of tax balances, to retained earnings of $321 thousand
This guidance eliminated the accounting guidance for troubled debt restructurings by creditors in Subtopic 310-40, ReceivablesTroubled Debt Restructurings by Creditors, while enhancing disclosure requirements for certain loan refinancings and restructurings. The expanded Vintage Disclosures are not applicable to nonpublic business entities.
This guidance requires more transparency about income tax information through improvements to income tax disclosures. The improvements applicable to our Association will require adding percentages and information by state jurisdiction to the rate reconciliation and income taxes paid disclosures.
We adopted the standard on January 1, 2023. The adoption of this guidance did not have a material impact on our financial statements, but modified certain disclosures beginning in 2023
We expect to adopt the standard as of January 1, 2026. The adoption of this guidance is not expected to have a material impact on our financial statements, but will modify certain disclosures.
The other category is primarily composed of rural infrastructure and rural residential real estate related loans
Throughout Note 3 accrued interest receivable on loans of $14.9 million at December 31, 2023, has been excluded from the amortized cost of loans and is presented in “Accrued interest receivable” in the Consolidated Statements of Condition.
Loan concentrations exist when there are amounts loaned to multiple borrowers engaged in similar activities or within close proximity, which could cause them to be similarly impacted by economic or other conditions. We lend primarily within agricultural industries.
As of December 31, 2023, amortized cost on loans plus commitments, reduced by government guaranteed portions of loans, to our ten largest borrowers totaled an amount equal to 7.5% of total loans and commitments
Total loans plus any unfunded commitments represent a proportionate maximum potential credit risk. However, substantial portions of our lending activities are collateralized. Accordingly, the credit risk associated with lending activities is less than the recorded loan principal. The amount of collateral obtained, if
deemed necessary upon extension of credit, is based on management’s credit evaluation of the borrower Collateral held varies, but may include real estate, equipment, inventory, livestock, and income-producing property Long-term real estate loans are secured by the first liens on the underlying real property
Participations
We may purchase or sell participation interests with other parties to diversify risk, manage loan volume, or comply with the limitations of the FCA Regulations or General Financing Agreement (GFA) with AgriBank
Credit risk arises from the potential inability of a borrower to meet its payment obligation and exists in our outstanding loans, letters of credit, and unfunded loan commitments. We manage credit risk associated with our lending activities through an analysis of the credit risk profile of an individual borrower based on management established underwriting standards and board approved lending policies The evaluation of the borrower’s credit risk profile may include analysis of several factors including, but not limited to, credit history, repayment capacity, financial position, and collateral Real estate mortgage loans must be secured by first liens on the real estate As required by the FCA regulations, each institution that makes loans on a secured basis must have collateral evaluation policies and procedures. Real estate mortgage loans may be made only in amounts up to 85% of the original appraised value of the property taken as security or up to 97% of the appraised value if guaranteed by a state, federal, or other governmental agency. The actual loan to appraised value when loans are made is generally lower than the statutory maximum percentage. Loans other than real estate mortgage may be made on a secured or unsecured basis.
We use a two-dimensional risk rating model based on an internally generated combined System risk rating guidance that incorporates a 14-point probability of default rating scale to identify and track the probability of borrower default and a separate 6-point scale addressing loss given default. Probability of default is our assumption of the probability that a borrower will experience a default during the life of the loan. The loss given default is our assumption as to the anticipated principal loss on a specific loan assuming default occurs during the remaining life of the loan. A default is considered to have occurred if the lender believes the borrower will not be able to pay its obligation in full or the borrower or the loan is classified as nonaccrual. This credit risk rating process incorporates objective and subjective criteria to identify inherent strengths, weaknesses, and risks in a particular relationship. We review the probability of default category periodically in accordance with our policy, or when a credit action is taken.
Each of the probability of default categories carries a distinct percentage of default probability. The probability of default rate between one and nine of the acceptable categories is very narrow and would reflect almost no default to a minimal default percentage. The probability of default rate grows more rapidly as a loan moves from acceptable to other assets especially mentioned and grows significantly as a loan moves to a substandard (viable) level. A substandard (non-viable) rating indicates that the probability of default is almost certain
We utilize the FCA Uniform Classification System to categorize loans into five credit quality categories. The categories are:
• Acceptable – loans are non-criticized loans representing the highest quality. They are expected to be fully collectible. This category is further differentiated into various probabilities of default.
• Other assets especially mentioned (Special Mention) – loans are currently collectible but exhibit some potential weakness These loans involve increased credit risk, but not to the point of justifying a substandard classification.
• Substandard – loans exhibit some serious weakness in repayment capacity, equity, and/or collateral pledged on the loan
• Doubtful – loans exhibit similar weaknesses as substandard loans Doubtful loans have additional weaknesses in existing factors, conditions, and values that make collection in full highly questionable
• Loss – loans are considered uncollectible
We had no loans categorized as loss at December 31, 2023, 2022, or 2021
Credit Qualityof Loans at Amortized Cost1
1Prior to the adoption of CECL, which was effective January 1, 2023, accruing loans included accrued interest receivable.
1Prior to the adoption of CECL, which was effective January 1, 2023, accruing loans included accrued interest receivable.
Nonaccrual Loans
Reversals of interest income on loans that moved to nonaccrual status were not material for the year ended December 31, 2023
Included within our loans are loan modifications; some of which are granted to borrowers experiencing financial difficulty.
Modifications at Amortized Cost1
1Excludes loans that were modified during the year, but were paid off or sold prior to year end.
All loans modified for borrowers experiencing financial difficulty during the reporting period were not past due or less than 30 days past due as of December 31, 2023.
Accrued interest receivable related to loan modifications granted to borrowers experiencing financial difficulty was not material at December 31, 2023
There were no loans to borrowers experiencing financial difficulty that defaulted subsequent to the modification date during the year ended December 31, 2023
There were no material commitments to lend to borrowers experiencing financial difficulty whose loans have been modified during the period.
Our loan portfolio is divided into segments primarily based on loan type which are the segments used to estimate the allowance for credit losses. As our lending authorities limit the types of loans we can originate, our portfolio is concentrated in the agriculture sector. The credit risk associated with each of our portfolio segments includes a strong correlation to agricultural commodity prices and input costs. Specifically for our real estate mortgage segment, the value of agricultural land that serves as collateral is a key risk characteristic. Additionally, unemployment rates and gross domestic product levels are additional key risk characteristics attributable to our portfolio We consider these characteristics, among others, in assigning internal risk ratings and forecasting credit losses on our loan portfolio and related unfunded commitments.
We develop our reasonable and supportable forecast by considering a multitude of macroeconomic variables Our forecasts of U S net farm income, U S real gross domestic product, and U S unemployment rate represent the key macroeconomic variables that most significantly affect the estimate of the allowance for credit losses on loans and unfunded commitments
We utilize a single macroeconomic scenario in the estimate of the allowance for credit losses on loans and unfunded commitments which represents the most probable forecasted outcome. Subsequent changes in the macroeconomic forecasts will be reflected in the provision for credit losses in future periods.
The increase in the allowance for credit losses on loans from December 31, 2022, was primarily related to the corresponding increase in nonaccrual loans partially offset by a charge-off in our capital markets portfolio
Previously Required Disclosures
The disclosures in this section were required prior to January 1, 2023. Upon the adoption of CECL, these disclosures are no longer required prospectively.
Risk Loans: Risk loans are loans for which it is probable that all principal and interest will not be collected according to the contractual terms.
1
2
For the year ended
Troubled Debt Restructurings: Prior to the adoption of CECL, a restructuring of a loan constituted a troubled debt restructuring, also known as formally restructured, if the creditor for economic or legal reasons related to the borrower’s financial difficulties granted a concession to the borrower that it would not otherwise consider. Concessions varied by program and were borrower-specific and could include interest rate reductions, term extensions, payment deferrals, or the acceptance of additional collateral in lieu of payments In limited circumstances, principal may have been forgiven.
There were no TDRs that occurred during the years ended December 31, 2022, or 2021. Additionally, there were no TDRs that defaulted during the years ended December 31, 2022, or 2021, in which the modification was within twelve months of the respective reporting period.
Note: Accruing loans include accrued interest receivable.
As of December 31, 2023, we were required by AgriBank to maintain an investment equal to 3.0% of the average quarterly balance of our note payable
We are also required to hold AgriBank stock based on a contractual agreement under any asset pool program in which we participate. The required investment amount varies by asset pool program and is generally a percentage of the loan balance in the pool
AgriBank’s capital plan provides for annual retirement of AgriBank stock and optimizes capital at AgriBank by distributing all available AgriBank earnings in the form of patronage, either in cash or stock The plan is designed to maintain capital adequacy such that sufficient earnings will be retained in the form of allocated retained earnings and allocated stock to meet the leverage ratio target and other regulatory or policy constraints prior to any cash patronage distributions.
Our note payable to AgriBank represents borrowings, in the form of a line of credit, to fund our loan portfolio The line of credit is at a variable rate as governed by a GFA and substantially all of our assets serve as collateral.
Note Payable Information
(dollars in thousands)
2021
Our note payable is scheduled to mature on May 31, 2025 We intend to renegotiate the note payable no later than the maturity date
The GFA provides for limitations on our ability to borrow funds based on specified factors or formulas relating primarily to outstanding balances, credit quality, and financial condition Additionally, we have requirements to maintain an effective program of internal controls over financial reporting At December 31, 2023, and throughout the year, we were not declared in default under any GFA covenants or provisions.
In accordance with the Farm Credit Act, each borrower is required to invest in us as a condition of obtaining a loan. As authorized by the Agricultural Credit Act and our capital bylaws, the Board of Directors has adopted a capital plan that establishes a stock purchase requirement for obtaining a loan of 2.0% of the customer’s total loan(s) or one thousand dollars, whichever is less The purchase of one participation certificate is required of all non-stockholder customers who purchase financial services The Board of Directors may increase the amount of required investment to the extent authorized in the capital bylaws The borrower acquires ownership of the capital stock at the time the loan is made The aggregate par value of the stock is added to the principal amount of the related obligation. We retain a first lien on the stock or participation certificates owned by customers
Risk-adjusted assets have been defined by the FCA Regulations as the Statement of Condition assets and off-balance-sheet commitments adjusted by various percentages, depending on the level of risk inherent in the various types of assets
Risk-adjusted assets is calculated differently for the permanent capital ratio (referred herein as PCR risk-adjusted assets) compared to the other risk-based capital ratios The primary difference is the inclusion of the allowance for credit losses on loans as a deduction to risk-adjusted assets for the permanent capital ratio.
These ratios are based on a three-month average daily balance in accordance with the FCA Regulations and are calculated as follows (not all items below may be applicable to our Association):
• Common equity tier 1 ratio is statutory minimum purchased member stock, other required member stock held for a minimum of 7 years, allocated equities held for a minimum of 7 years or not subject to retirement, unallocated retained earnings as regulatorily prescribed, paid-in capital, less certain regulatory required deductions including the amount of allocated investments in other System institutions, and the amount of purchased investments in other System institutions under the corresponding deduction approach, divided by average risk-adjusted assets
• Tier 1 capital ratio is common equity tier 1 plus non-cumulative perpetual preferred stock, divided by average risk-adjusted assets.
• Total capital is tier 1 capital plus other required member stock held for a minimum of 5 years, allocated equities held for a minimum of 5 years, subordinated debt, and limited-life preferred stock greater than 5 years to maturity at issuance subject to certain limitations, allowance for credit losses on loans and reserve for credit losses subject to certain limitations, less certain investments in other System institutions under the corresponding deduction approach, divided by average risk-adjusted assets.
• Permanent capital ratio is all at-risk borrower stock, any allocated excess stock, unallocated retained earnings as regulatorily prescribed, paid-in capital, subordinated debt, and preferred stock subject to certain limitations, less certain allocated and purchased investments in other System institutions divided by PCR risk-adjusted assets
• Tier 1 leverage ratio is tier 1 capital, including regulatory deductions, divided by average assets less regulatory deductions subject to tier 1 capital.
• Unallocated retained earnings and equivalents leverage ratio is unallocated retained earnings as regulatorily prescribed, paid-in capital, allocated surplus not subject to retirement less certain regulatory required deductions including the amount of allocated investments in other System institutions divided by average assets less regulatory deductions subject to tier 1 capital.
If the capital ratios fall below the total requirements, including the buffer amounts, capital distributions (equity redemptions, dividends, and patronage) and discretionary senior executive bonuses are restricted or prohibited without prior FCA approval.
Description of Equities
The following represents information regarding classes and number of shares of stock and participation certificates outstanding All shares and participation certificates are stated at a $5.00 par value.
Number of Shares
Under our bylaws, we are also authorized to issue Class B, Class D, and Class E common stock and Class F preferred stock Each of these classes of common stock is at-risk and nonvoting with a $5.00 par value per share Currently, no stock of these classes has been issued
Only holders of Class C common stock have voting rights Our bylaws do not prohibit us from paying dividends on any classes of stock However, no dividends have been declared to date
Our bylaws generally permit stock and participation certificates to be retired at the discretion of our Board of Directors and in accordance with our capitalization plans, provided prescribed capital standards have been met At December 31, 2023, we exceeded the prescribed standards We do not anticipate any significant changes in capital that would affect the normal retirement of stock
In the event of our liquidation or dissolution, according to our bylaws, any assets remaining after payment or retirement of all liabilities shall be distributed first pro rata to holders of preferred stock, and lastly, pro rata, to holders of all classes of common stock and participation certificates
In the event of stock impairment, losses will be absorbed first pro rata by holders of common stock and participation certificates, then pro rata by holders of preferred stock.
All classes of stock are transferable to other customers who are eligible to hold such class as long as we meet the regulatory minimum capital requirements.
We accrued patronage distributions of $11.7 million, $11.0 million, and $11.5 million at December 31, 2023, 2022, and 2021, respectively The patronage distributions are paid in cash, generally during the first quarter after year end. The Board of Directors may authorize a distribution of earnings provided we meet all statutory and regulatory requirements
(Benefit from) Provision for Income Taxes
Refer to the income taxes policy in Note 2 for information on exemptions related to our non-taxable entity.
Tax laws require certain items to be included in our tax returns at different times than the items are reflected on our Consolidated Statements of Comprehensive Income Some of these items are temporary differences that will reverse over time We record the tax effect of temporary differences as
on our Consolidated Statements of Condition
We have not provided for deferred income taxes on patronage allocations received from AgriBank prior to 1993 Such allocations, distributed in the form of stock, are subject to tax only upon conversion to cash Our intent is to permanently maintain this investment in AgriBank Our total permanent investment in AgriBank is $19.6 million. Additionally, we have not provided deferred income taxes on accumulated FLCA earnings of $353.4 million as it is our intent to permanently maintain this equity in the FLCA or to distribute the earnings to members in a manner that results in no additional tax liability to us.
Our income tax returns are subject to review by various United States taxing authorities. We record accruals for items that we believe may be challenged by these taxing authorities However, we had no uncertain income tax positions at December 31, 2023 In addition, we believe we are no longer subject to income tax examinations for years prior to 2020
Complete financial information for the pension and post-employment benefit plans may be found in the AgriBank 2023 Annual Report
The Farm Credit Foundations Plan Sponsor and Trust Committees provide oversight of the benefit plans for which AgriBank and District associations are participating employers These governance committees are comprised of elected or appointed representatives (senior leadership and/or Board of Director members) from the participating organizations. The Plan Sponsor Committee is responsible for employer decisions regarding all benefit plans including retirement benefits These decisions could include plan design changes, vendor changes, determination of employer subsidies (if any), and termination of specific benefit plans. Any action to change or terminate the retirement plan can only occur at the direction of the AgriBank District participating employers. The Trust Committee is responsible for fiduciary and plan administrative functions
Pension Plan: Certain employees participate in the AgriBank District Retirement Plan, a District-wide multi-employer defined benefit retirement plan The Department of Labor has determined the plan to be a governmental plan; therefore, the plan is not subject to the provisions of the Employee Retirement Income Security Act of 1974, as amended (ERISA). As the plan is not subject to ERISA, the plan’s benefits are not insured by the Pension Benefit Guaranty Corporation. Accordingly, the amount of accumulated benefits that participants would receive in the event of the plan’s termination is contingent on the sufficiency of the plan’s net assets to provide benefits at that time This plan is noncontributory and covers certain eligible District employees. The assets, liabilities, and costs of the plan are not segregated by participating entities. As such, plan assets are available for any of the participating employers’ retirees at any point in time. Additionally, if a participating employer stops contributing to the plan, the unfunded obligations of the plan may be borne by the remaining participating employers. Further, if we choose to stop participating in the plan, we may be required to pay an amount based on the underfunded status of the plan Because of the nature of the plan, any individual employer is not able to unilaterally change the provisions of the plan. If an employee transfers to another employer within the same plan, the employee benefits under the plan transfer. Benefits are based on salary and years of service. There is no collective bargaining agreement in place as part of this plan.
The unfunded liability reflects the net of the fair value of the plan assets and the projected benefit obligation at December 31 The projected benefit obligation is the actuarial present value of all benefits attributed by the pension benefit formula to employee service rendered prior to the measurement date based on assumed future compensation levels The accumulated benefit obligation is the actuarial present value of the benefits attributed to employee service rendered before the measurement date and based on current employee service and compensation. The funding status is subject to many variables including performance of plan assets and interest rate levels. Therefore, changes in assumptions could significantly affect these estimates.
Costs are determined for each individual employer based on costs directly related to their current employees as well as an allocation of the remaining costs based proportionately on the estimated projected liability of the employer under this plan. We recognize our proportional share of expense and contribute a proportional share of funding
Benefits paid to participants in the District were $71.3 million in 2023 While the plan is a governmental plan and is not subject to minimum funding requirements, the employers contribute amounts necessary on an actuarial basis to provide the plan with sufficient assets to meet the benefits to be paid to participants. The amount of the total District employer contributions expected to be paid into the pension plan during 2024 is $40.0 million Our allocated share of these pension contributions is expected to be $766 thousand The amount ultimately to be contributed and the amount ultimately recognized as expense as well as the timing of those contributions and expenses, are subject to many variables including performance of plan assets and interest rate levels. These variables could result in actual contributions and expenses being greater than or less than the amounts reflected in the District financial statements.
Retiree Medical Plans: District employers also provide certain health insurance benefits to eligible retired employees according to the terms of the benefit plans The anticipated costs of these benefits are accrued during the period of the employee’s active status. Net periodic benefit cost is included in “Salaries and employee benefits” in the Consolidated Statements of Comprehensive Income. Postretirement benefit costs related to the retiree medical plans were not considered material for any of the years presented. Our cash contributions were equal to the benefits paid.
We participate in a District-wide defined contribution plan. For employees hired before January 1, 2007, employee contributions are matched dollar for dollar up to 2.0% and 50 cents on the dollar on the next 4.0% on both pre-tax and post-tax contributions. The maximum employer match is 4.0%. For employees hired after December 31, 2006, we contribute 3 0% of the employee’s compensation and will match employee contributions dollar for dollar up to a maximum of 6.0% on both pre-tax and post-tax contributions The maximum employer contribution is 9 0%
We also participate in a District-wide Nonqualified Deferred Compensation Plan. Eligible participants must meet one of the following criteria: certain salary thresholds as determined by the IRS, are either a Chief Executive Officer or President of a participating employer, or have previously elected pretax deferrals in 2006 under predecessor nonqualified deferred compensation plans. Under this plan the employee may defer a portion of his/her salary, bonus, and other compensation. Additionally, the plan provides for supplemental employer matching contributions related to any compensation deferred by the employee that would have been eligible for a matching contribution under the defined contribution plan if it were not for certain IRS limitations.
Employer contribution expenses for these plans, included in “Salaries and employee benefits” in the Consolidated Statements of Comprehensive Income, were $1.0 million, $922 thousand, and $793 thousand in 2023, 2022, and 2021, respectively These expenses were equal to our cash contributions for each year
In the ordinary course of business, we may enter into loan transactions with our officers, directors, their immediate family members, and other organizations with which such persons may be associated Such transactions may be subject to special approval requirements contained in the FCA Regulations and are made on the same terms, including interest rates, amortization schedules, and collateral, as those prevailing at the time for comparable transactions with other persons In our opinion, none of these loans outstanding at December 31, 2023, involved more than a normal risk of collectability There were no material related party transactions other than the loan transactions disclosed in the related party loans information chart
The related parties can be different each year end primarily due to changes in the composition of the Board of Directors and the mix of organizations with which such persons may be associated Advances and repayments on loans in the preceding chart are related to those considered related parties at each respective year end
As described in Note 5, we borrow from AgriBank, in the form of a line of credit, to fund our loan portfolio All interest expense as shown on the Consolidated Statements of Comprehensive Income was paid to AgriBank
Total patronage from AgriBank, which includes a partnership distribution from AgDirect, LLP, was $8.3 million, $7.6 million, and $8.4 million in 2023, 2022, and 2021, respectively. Patronage income for 2023, 2022, and 2021 was received in cash and AgriBank stock
In addition, we received compensation from AgriBank for servicing loans of $55 thousand and $15 thousand in 2023 and 2021, respectively. No compensation for servicing loans was received from AgriBank in 2022.
Refer to Note 3 for information on participations sold to AgriBank and Note 4 for stock investment in AgriBank information.
We purchase certain business services, primarily financial reporting, from AgriBank We also purchase financial and retail information technology, collateral, tax reporting, and insurance services from SunStream Business Services (SunStream) In addition, we purchase human resource, benefit, payroll, and workforce management services from Farm Credit Foundations (Foundations) SunStream and Foundations are both System service corporations within the AgriBank District and the costs incurred are included in the following table in AgriBank District purchased services. In addition to the services we purchase from AgriBank, SunStream, and Foundations we also hold an investment in each of these institutions.
In the normal course of business, we have various contingent liabilities and commitments outstanding, which may not be reflected in the Consolidated Financial Statements We do not anticipate any material losses because of these contingencies or commitments.
We may be named as a defendant in certain lawsuits or legal actions in the normal course of business At the date of these Consolidated Financial Statements, our management team was not aware of any material actions. However, management cannot ensure that such actions or other contingencies will not arise in the future.
We have commitments to extend credit and letters of credit to satisfy the financing needs of our borrowers These financial instruments involve, to varying degrees, elements of credit risk in excess of the amount recognized on the financial statements Commitments to extend credit are agreements to lend to a borrower as long as there is not a violation of any condition established in the loan contract Standby letters of credit are agreements to pay a beneficiary if there is a default on a contractual arrangement At December 31, 2023, we had commitments to extend credit and unexercised commitments related to standby letters of credit of $313.2 million Additionally, we had $4.6 million of issued standby letters of credit as of December 31, 2023
Commitments to extend credit and letters of credit generally have fixed expiration dates or other termination clauses and we may require payment of a fee If commitments to extend credit and letters of credit remain unfulfilled or have not expired, they have off-balance sheet credit risk because their contractual amounts are not reflected on the balance sheet until funded or drawn upon Many of the commitments to extend credit and letters of credit will expire without being fully drawn upon. Therefore, the total commitments do not necessarily represent future cash requirements Certain letters of credit may have recourse provisions that would enable us to recover from third parties amounts paid under guarantees, thereby limiting our maximum potential exposure. The credit risk involved in issuing these financial instruments is essentially the same as that involved in extending loans to borrowers and we apply the same credit policies The amount of collateral obtained, if deemed necessary by us upon extension of credit, is based on management’s credit evaluation of the borrower.
In June 2021, we signed an agreement guaranteeing the amounts borrowed by SunStream on their line of credit with AgriBank, up to $40.0 million. The term of the line of credit is 36 months and may be extended. The guarantee is in effect until any outstanding balance is paid in full. While we are primarily liable for our pro rata portion of SunStream’s indebtedness to AgriBank, we are jointly and severally liable with certain other owners of SunStream. In the event of default by SunStream, we are responsible for the prompt and full payment of amounts outstanding. However, we may seek reimbursement from the remaining owners of SunStream subject to the guarantee agreement The outstanding balance on the SunStream line of credit at December 31, 2023, was $16.3 million. At this time we believe it is unlikely that we will be required to make payment under this guarantee
We and other Farm Credit institutions are among the limited partners for a Rural Business Investment Company (RBIC) As of December 31, 2023, our total commitment is $2.0 million, of which $0.1 million is unfunded The original commitment period was through December 2020, but was extended through April 2023 The RBIC may make additional follow-on investments after the expiration of the commitment period through April 2025
Fair value is defined as the price that would be received to sell an asset or paid to transfer a liability in an orderly transaction between market participants at the measurement date in the principal or most advantageous market for the asset or liability Accounting guidance also establishes a fair value hierarchy, with three input levels that may be used to measure fair value. Refer to Note 2 for a more complete description of the three input levels
We did not have any assets or liabilities measured at fair value on a recurring basis at December 31, 2023, 2022, or 2021
Non-Recurring Basis
We may be required, from time to time, to measure certain assets at fair value on a non-recurring basis.
Assets Measured at Fair Value on a Non-Recurring Basis
(in thousands)
As of December 31, 2023
Valuation Techniques
Loans: Represents the carrying amount of loans evaluated individually for credit losses and are deemed to be collateral dependent. The carrying value amount is based on the estimated value of the underlying collateral, less costs to sell When the fair value of the collateral, less costs to sell, is less than the amortized cost basis of the loan, a specific allowance for expected credit losses is established Costs to sell represent transaction costs and are not included as a component of the collateral’s estimated fair value Typically, the process requires significant input based on management’s knowledge of and judgment about current market conditions, specific issues relating to the collateral and other matters and, therefore, are classified as Level 3 fair value measurements
Other Property Owned: Represents the fair value of foreclosed assets measured based on the collateral value, which is generally determined using appraisals, or other indications based on sales of similar properties Costs to sell represent transaction costs and are not included as a component of the asset’s fair value. If the process uses observable market-based information, they are classified as Level 2. If the process requires significant input based on management’s knowledge of and judgment about current market conditions, specific issues relating to the property and other matters, they are classified as Level 3.
We have evaluated subsequent events through March 6, 2024, which is the date the Consolidated Financial Statements were available to be issued. There have been no material subsequent events that would require recognition in our 2023 Consolidated Financial Statements or disclosure in the Notes to Consolidated Financial Statements
Farm Credit Services of Western Arkansas, ACA (Unaudited)
Description of Business
General information regarding the business is incorporated herein by reference from Note 1 to the Consolidated Financial Statements in this Annual Report
The description of significant business developments, if any, is incorporated herein by reference from the Management's Discussion and Analysis section of this Annual Report
Description of Property PropertyInformation
Russellville
Alma
Arkadelphia
Benton
Bentonville
Magnolia
Nashville
Ozark
Paris
Perryville
Russellville
Siloam Springs
Texarkana
Tontitown
Legal Proceedings
Information regarding legal proceedings is included in Note 10 to the Consolidated Financial Statements in this Annual Report We were not subject to any enforcement actions as of December 31, 2023
Description of Capital Structure
Information regarding our capital structure is included in Note 6 to the Consolidated Financial Statements in this Annual Report
Description of Liabilities
Information regarding liabilities is included in Notes 5, 6, 7, 8, and 10 to the Consolidated Financial Statements in this Annual Report All debt and other liabilities in the financial statements are uninsured
Selected Financial Data
The Consolidated Five-Year Summary of Selected Financial Data is presented at the beginning of this Annual Report
Information regarding any material aspects of our financial condition, changes in financial condition, and results of operations are discussed in the Management's Discussion and Analysis section of this Annual Report
Our Board of Directors is organized into the following committees to carry out Board responsibilities:
• The Audit Committee oversees financial reporting, the adequacy of our internal control systems, the scope of our internal audit program, the independence of the outside auditors, the processes for monitoring compliance with laws and regulations and the code of ethics The Audit Committee also oversees the adequacy of management’s action with respect to recommendations arising from auditing activities
• The Governance Committee addresses issues of Board governance and the Board’s continuing efforts to strengthen and renew the Board, administers a process for maintaining and periodically reviewing board policies, and administers a planning process focused upon achieving our mission and maintaining a viable, competitive institution
• The Compensation Committee oversees and provides overall direction and/or recommendations for compensation, benefits, and human resource performance management programs
• The Legislative/Public Relations Committee oversees advocacy within the State of Arkansas with other AgriBank District associations, along with member public relations
Board of Directors as of December 31, 2023, including business experience during the last five years
Name Principal occupation and other business affiliations
Steve Burke
Principal occupation:
Board Service Began: 2005 Self-employed livestock, poultry (grows poultry for Tyson), and timber farmer
Current TermExpires: 2027
Audie "Renny" Chesshir
Principal occupation:
Board Service Began: 2019 Self-employed livestock (cowcalf operation) farmer
Current TermExpires: 2027
KimHogan
Principal occupation:
Appointed Director Co-owner/Practicing CPA: Leding and Hogan, CPAs, P.A.
Financial Expert Livestock farmer
Board Service Began: 2012
Current TermExpires: 2024
Ron Hubbard
Other business affiliations:
Secretary and Treasurer: Toby Hogan, Inc., a property, auto, and life insurance agency
President: Watalula Water Users Association, a rural water association
Principal occupation:
Appointed Director Self-employed livestock farmer
Board Service Began: 2004
Current TermExpires: 2026
CodyJones
Chairperson
Board Service Began: 2018
Current TermExpires: 2026
Julie Lively
Board Service Began: 2018
Current TermExpires: 2026
Ralph Allen Moore
Board Service Began: 2021
Current TermExpires: 2025
Gerald Strobel
Board Service Began: 2023
Current TermExpires: 2027
Other business affiliations:
Director:AgriBank District Farm Credit Council, a trade association representing the AgriBank District
Principal occupation:
Self-employed poultry (grows poultry for OK Foods) and livestock (cowcalf operation) farmer
Other business affiliations:
Director: Milltown Washburn Water, public water authority
Principal occupation:
Self-employed livestock and poultry farmer (grows poultry for Tyson)
Consultant for Achieve 3000 Inc., a leader in online differentiated learning instruction
Principal occupation:
Self-employed crop and cattle farmer
Vice President: NWA Hay & StrawLLC
Other business affiliations:
Director: Washington County Fair Board, county fair
Director: Farmers Co-op of feed, seed, and fertilizer
Principal occupation:
Self-employed poultry (grows poultry for OK Foods) and cattle farmer with Short Mountain Creek Farms, LLC
Other business affiliations:
Chairperson: Logan County Conservation District, conservation group
President: Subiaco Academy Alumni Board, an education alumni association
Name
Elizabeth F. Walker
Principal occupation:
Board Service Began: 2021 Self-employed cattle and poultry farmer with Lucky 13 Farm
Current Term Expires: 2025
Other business affiliations:
President: Horatio School Board
Commissioner: Arkansas Rural Development Commission, rural development organization
Member: Sevier County Farm Service Agency Board, agricultural agency
Member: Arkansas Farm Bureau Trade Committee, agricultural agency
Mark Wilcox
Principal occupation:
Board Service Began: 2013 Self-employed cattle farmer
Current Term Expires: 2025
Stephen Young
Other business affiliations:
Director: Faulkner County Farm Bureau, involved in insurance
Principal occupation:
Vice Chairperson Self-employed poultry and cattle farmer with Triple T Farms
Board Service Began: 2020 Self-employed cabinet maker with Triple T Farms
Current Term Expires: 2024
Pursuant to our bylaws, directors are paid a reasonable amount for attendance at board meetings, committee meetings, or other special assignments
Directors are also reimbursed for reasonable expenses incurred in connection with such meetings or assignments Our Board of Directors has adopted a rate of up to $600 per day depending on the length of the official event Board members also receive a $700 monthly retainer fee. The chairperson of the Board is paid an additional monthly retainer fee of $500 a month, the vice chairperson of the Board is paid an additional monthly retainer fee of $300 a month, the audit committee chairperson receives a monthly retainer fee of $600 a month, the financial expert(s) are paid an additional monthly retainer fee of $200 a month, and the chairperson of the remaining committees receives an additional monthly retainer fee of $100 per month.
Information regarding compensation paid to each director who served during 2023 follows:
1
2
Senior
Name and Position
Justin Carter
Business experience and other business affiliations
Business experience:
Executive Vice President/ Executive Vice President/Chief Credit Officer from October 2023 to present
Chief Credit Officer
Charlie McConnell
Senior Vice President of Credit/Chief Credit Officer from October 2016 to September 2023
Business experience:
Senior Vice President/ Senior Vice President/Chief Lending Officer from October 2016 to present
Chief Lending Officer
Andrea Leding
Senior Vice President of Operations
Luann Berry
Business experience:
Senior Vice President of Operations from October 2023 to present
Senior Vice President Commercial/Agriculture Lending from January 2023 to September 2023
Regional Vice President from February 2018 to December 2022
Other business affiliations:
Board Chair Fort Smith Crisis Intervention Center, non-profit organization
Board Member Arkansas Tech University Agriculture and Tourism Alumni
Member Lead Arkansas Advisory Council, a program that empowers individuals to positively impact communities and advocate for long-term economic development
Business experience:
Senior Vice President/ Senior Vice President/Chief Human Resources Officer from April 2017 to present Chief Human Resources Officer
Senior Officer Compensation
Compensation Risk Management: We believe the design and governance of our CEO and senior officer compensation program is consistent with the highest standards of risk management and provides total compensation that promotes our mission to ensure a safe, sound, and dependable source of credit and related services for agriculture and rural America Our compensation philosophy aims to provide a competitive total rewards package that will enable us to attract and retain highly qualified officers with the requisite expertise and skills while achieving desired business results aligned with the best interests of our shareholders The design of our CEO and senior officer compensation program supports our risk management goals through a set of checks and balances, including (1) a balanced mix of base and variable pay, (2) a balanced use of performance measures that are risk-adjusted where appropriate, and (3) a pay-for-performance process that allocates individual awards based on both results and how those results were achieved
Elements of Compensation: The CEO and senior officers are compensated with a mix of salary incentives as well as retirement plans generally available to all employees. Our Board of Directors determines the appropriate balance of incentives while keeping in mind their responsibilities to our shareholders
Base salary and short-term incentives are intended to be competitive with annual compensation for comparable positions at peer organizations
Base Salary: The CEO and senior officer base salaries reflect the employee’s experience and level of responsibility. Salary programs and guidelines are subject to review and approval by the Compensation Committee of our Board of Directors and are subject to adjustment based on changes in responsibilities or competitive market conditions. Market surveys are performed periodically to ensure alignment with competition.
Short-term Incentives: The CEO and senior officer incentives are paid annually based on performance criteria established by our Board of Directors. The criteria related to the overall association performance include return on assets, loan volume growth, operational expense management, customer growth, net income, and credit quality. These items are separately weighted throughout the plan to ensure a proper balance of risk where appropriate. To adjust for extraordinary items that may occur within a given year, incentives on performance measures are calculated on a 3-year rolling average. Additionally, performance criteria related to personal performance include attainment of personal objectives regarding leadership and integrity performance ratings. We calculate the incentives after the end of the plan year (the plan year is the calendar year). We pay out the incentives within 90 days of year end
Retirement Plans: We have various post-employment benefit plans which are generally available to all Association employees, including the CEO and senior officers, based on continuous dates of service with the Association or, in certain situations, with other participating District employers. These plans are not otherwise differentiated by position, unless specifically stated. Information regarding the post-employment benefit plans is included in Notes 2 and 8 to the Consolidated Financial Statements in this Annual Report
Other Components of Compensation: Additionally, compensation associated with any vehicles, group term life insurance premiums, disability insurance premiums, or other taxable reimbursements may be made available to the CEO and senior officers based on job criteria or similar plans available to all employees.
1Includes a full year of compensation for one individual that became a senior officer in October 2023.
2Includes compensation for one individual that retired in September 2022.
The Farm Credit Administration (FCA) Regulations require the disclosure of the total compensation paid during the last fiscal year to all senior officers included in the above table be available and disclosed to our members upon request.
The amount in the “Other” category in the preceding table primarily includes:
• Employer match on defined contribution plans available to all employees
• Changes in the value of pension benefits. The change in value of the pension benefits is defined as the change in the vested portion of the present value of the accumulated benefit obligation from December 31 of the prior year to December 31 of the most recent year for the District-wide Pension Plan as disclosed in Note 8 to the Consolidated Financial Statements in this Annual Report This change in value does not represent cash payments made by the Association during the year, but rather is an estimate of the change in the Association’s future obligations under the pension plan The change in the value of the pension benefits is highly sensitive to discount rates used to value the plan liabilities to participants.
• Employer match on District-wide Nonqualified Deferred Compensation plan which is available for the CEO and other employees meeting certain eligibility criteria
• Amounts paid related to a senior officer retirement in 2022
Any dollar value of tax reimbursement provided to the CEO or senior officers is included in the column for which the reimbursement was provided.
Generally, pension benefits increase annually as a result of an additional year of credited service and related compensation for plan participants The value of the pension benefits can also be significantly impacted by changes in interest rates as of the measurement date
The change in composition of the aggregate number of senior officers can have a significant impact on the calculation of the accumulated pension benefits.
Effective January 1, 2007, the AgriBank District Retirement Plan was closed to new employees Therefore, any employee starting employment with the AgriBank District after that date is not eligible to be in the plan
Information regarding related party transactions is included in Note 9 to the Consolidated Financial Statements in this Annual Report
Travel, Subsistence, and Other Related Expenses
Directors and senior officers are reimbursed for reasonable travel, subsistence, and other related expenses associated with business functions A copy of our policy for reimbursing these costs is available by contacting us at:
3115 West 2nd Court
Russellville, AR 72801 (479) 968-1434 www.myaglender.com
The total directors’ travel, subsistence, and other related expenses were $97 thousand, $78 thousand, and $37 thousand in 2023, 2022, and 2021, respectively
No events occurred during the past five years that are material to evaluating the ability or integrity of any person who served as a director or senior officer on January 1, 2024, or at any time during 2023
The FCA Regulations protect members’ nonpublic personal financial information Our directors and employees are restricted from disclosing information about our Association or our members not normally contained in published reports or press releases.
There were no changes in the independent auditors since the last Annual Report to members and we are in agreement with the opinion expressed by the independent auditors The total financial statement audit fees paid during 2023 were $95 thousand Our engagement letter commits to reimbursing the external auditor for reasonable out-of-pocket expenses as incurred for travel. In addition, we incurred $6 thousand for tax services We also incurred $38 thousand for work related to our implementation of new accounting guidance, which was pre-approved by the Audit Committee.
The Report of Management, Report on Internal Control over Financial Reporting, Report of Audit Committee, Report of Independent Auditors, Consolidated Financial Statements, and Notes to Consolidated Financial Statements are presented prior to this portion of the Consolidated Financial Statements in this Annual Report.
Effective January 1, 2024, the annual gross sales threshold for a small farmer, rancher, or producer or harvester of aquatic products increased from $250 thousand to $350 thousand and changed from measuring gross sales to gross cash farm income. Effective February 1, 2024, the FCA amended certain YBS regulations which now require banks that fund the direct-lender associations to annually review and approve each association’s YBS programs. The amended regulations also require direct-lender associations to enhance their YBS programs within their strategic plans. None of these changes impact the disclosures as of December 31, 2023.
Information regarding credit and services to young, beginning, and small farmers and ranchers, and producers or harvesters of aquatic products is included in an addendum to this Annual Report
Farm Credit Services of Western Arkansas, ACA (Unaudited)
We have specific programs in place to serve the credit and related needs of young, beginning, and small farmers and ranchers (YBS) in our territory The definitions of YBS as developed by the Farm Credit Administration (FCA) follow:
• Young: A farmer, rancher, or producer or harvester of aquatic products who is age 35 or younger as of the date the loan is originally made
• Beginning: A farmer, rancher, or producer or harvester of aquatic products who has 10 years or less farming or ranching experience as of the date the loan is originally made
• Small: A farmer, rancher, or producer or harvester of aquatic products who normally generates less than $250 thousand in annual gross sales of agricultural or aquatic products at the date the loan is originally made
Mission Statement
The mission statement for Young, Beginning, and Small Farmers and Ranchers is to maximize their financial success by providing industry leading financial services, agricultural expertise, and cooperative educational opportunities to help them succeed in the marketplace.
The Association believes it is living up to this mission because we are continually developing new programs and evolving the Young Beginning Small and Diverse (YBSD) Farmer program, which was introduced in 2010 The programs offer support toward minority farmer groups or needs; and for YBS farmers features differential lending standards, interest rate discounts, first-time real estate owner credits, and payment of loan guarantee fees if a guaranteed loan is required Annual financial reporting and meeting with a loan officer is also part of the program. Another program component is for YBS farmers to pursue farm management and/or financial management education.
Demographics
The 2017 United States Department of Agriculture (USDA) Ag-census is the source of demographic data for YBS farmer comparison and reflects 26,868 farmers in the 41 counties served by Farm Credit Services of Western Arkansas, ACA According to the census of these farmers, 2,515 (9.0%) are young farmers, 9,885 (36.8%) are beginning farmers, and 24,104 (89.7%) are small farmers.
Our goals and results for the 2023 YBS program are as follows:
Customers by Percentage1 Loan Volume2
Note: Aggregate percentages exceed 100% as the categories overlap with one another.
1Percentage of total number of borrowers
2Percentage of total volume of loans outstanding
As part of our commitment to supporting YBS farmers, each branch office supports a number of local events and activities that respond to their needs.
The Association has a long standing Youth Loan Program for 4-H and FFA students. In 2010, the Association introduced a YBSD Farmer program. In 2015, the Military Lending Program was implemented. In 2016, a special loan program known as “Fresh and Local” was created for farmers who market products direct to consumers (i.e , farmers markets, etc.). All of these programs were created to enhance lending to qualified farmers and features adjusted lending standards, interest rate advantages, and reduced fees. In 2019, a loan program titled the YBS Poultry Loan Lending Program was developed to assist YBS farmers with limited equity and collateral by offering reduced interest rates and fees as well as reduced lending standards.
We provide essential related services as part of our commitment to the YBSD Farmer program We offer these services throughout the year through our normal delivery channels.
The YBS policy has been reviewed by the Board and deemed to be within compliance and spirit of the FCA Regulations. Our Board monitors the program on an ongoing basis and reviews YBS results on a quarterly basis.
Implementation of this policy is carried out through a sound, adequate, and constructive credit and related services program for YBS farmers and ranchers.
Farm Credit Services of Western Arkansas, ACA (Unaudited)
We offer a Funds Held Program (“Program”) that provides for Borrowers to make uninsured advance payments on designated loans for the purpose of paying future maturities or other related charges.
The following terms and conditions apply to Program accounts in connection with loans from the Association, subject to any rights that the Association or Borrower may have as specified in loan documents governing designated loans.
• Advance payments received on a loan participating in the Program before the loan has been billed will normally be placed in the Program account (“Account”) as of the date received, to be applied against the next installment or other related charges on the installment due date. This is subject to any rights that the Association may have to apply such payments in a different manner as specified in loan documents governing designated loans
• Advance payments received on a loan participating in the Program after the loan has been billed will be directly applied to the installment due on the loan or other related charges and will not earn interest.
• Funds received in excess of the billed amount or other related charges will be placed in the Account.
• If a special prepayment of principal is desired, Borrowers must so specify at the time funds are paid to the Association
• When an installment becomes due, any accrued interest in the Account and other funds in the Account will be automatically applied toward payment of the installment or related charges on the due date. If the balance in the Account is not adequate to pay the installment or related charges in full, Borrowers are expected to pay the difference by the installment due date. Any excess funds will remain in the Account.
Even when no installment or related charges are due, the Association may, at its option, apply funds from the Account without notice to Borrower as follows:
• Protective Advances. If the Borrowers fail to pay when due other items as required pursuant to the mortgage, deed of trust, promissory note or any other loan documents, the Association may apply funds in the Account to pay them
• Account Ceiling. At any given point in time, the total in the Account may not exceed the unpaid balance of the related loans. If the Account balance exceeds the unpaid balance of the loan, the Association may apply the funds in the Account to repay the entire unpaid balance and will return any excess funds.
• Transfer of Security. If Borrowers sell, assign, or transfer any interest in the underlying collateral, the Association may apply the funds in the Account against the remaining loan balance
• Deceased Borrowers If all Borrowers are deceased, the Association may apply the funds in the Account to the remaining loan balance.
Interest on the Account
Interest will accrue on the Account at a rate determined by the Association, but the rate may never exceed the interest rate charged on the related loan.
The current interest rate is calculated at a rate equal to two percent less the interest rate on the related loan. Interest on Account balances will normally accrue from the date of receipt of the funds until the date the funds are applied to the loan against an installment due or other related charges. The Association may change the interest rate from time to time, and may provide for different interest rates for different categories of loans The Borrowers receive periodic statements of accounts, including Account balances, interest rates, and amounts of interest credit to the Account.
The Association may permit Borrowers to withdraw funds from the Account at the Association’s discretion based on a credit review of each specific request. The Association permits up to four (4) withdrawals by Borrowers from Accounts within a calendar year.
Account balances are not insured In the event of Association liquidation, all Borrowers having balances in these uninsured Accounts shall be notified according to FCA Regulations then in effect. Applicable FCA Regulations now provide that the notice shall instruct that the funds ceased earning interest when the receivership was instituted and will be applied against the outstanding indebtedness of any loans of the Borrowers unless, within 15 days notice, the Borrower provides direction to the Association to apply the funds according to existing loan documents
If the Association terminates the Program, Account balances will be applied to the loan balance, and any remaining excess funds will be refunded to the Borrower.


$11.7