
Creative Industries in the Great South West:
FROM THE EDGE

DRIVING INNOVATION, SKILLS AND BUSINESS GROWTH

Preface
This report reviews and analyses evidence to describe the characteristics of the creative industries in the Great South West (GSW) region of England. The Great South West is a pan-regional partnership that covers an area of the south west of England stretching from Bournemouth to the Isles of Scilly. With a population of 3.2 million, it includes all of Devon, Cornwall, and Dorset, and most of Somerset, and the urban areas of Exeter, Plymouth and Bournemouth – but excludes Bristol and Bath. The GSW is comprised of 15 local authority districts (LADs): Bournemouth, Christchurch and Poole; Dorset, Somerset; East Devon; Exeter; Mid Devon; North Devon; Torridge; Teignbridge; Torbay; South Hams; West Devon; Plymouth; Cornwall; and Isles of Scilly.
Our analysis uses the Department for Culture, Media & Sport (DCMS) classification of the creative industries, which encompasses nine subsectors: IT, software and computer services; film, TV, video, radio and photography; advertising and marketing; publishing; music, performing and visual arts; architecture; design and designer fashion; museums, galleries and libraries; and crafts. Focusing on commercial subsectors and creative businesses, rather than publicly-funded culture organisations, our report draws data from sources including Companies House, Data City, ONS, DCMS and six universities in the GSW to make the economic case for investment in the creative industries sector.
We compare the growth of the creative industries in the GSW with the UK overall and with the North East, another region with an emerging creative industries sector. We also compare the creative industries with other sectors in the GSW and explore how spillover effects from the activity of creative companies drive growth elsewhere in the economy. Finally, we recommend a number of interventions to support the future growth of the creative industries in the region.
This report was produced by creative industries specialist Joanne Evans and data journalist Miriam Quick on behalf of the Great South West University Alliance, with assistance from Fiona Waters of Waters Economics.
EXECUTIVE SUMMARY
Bigger than you think
The creative industries, taken as a whole, are one of the UK’s eight priority sectors, identified as those with the highest growth opportunity for the economy and business –sectors the ‘UK excels in today and will excel in tomorrow’.1 They generate an enormous amount of wealth for the UK. In 2022, they contributed £124.6 billion to the UK economy, or 5.7 percent of UK GVA 2 – almost as much as the entire construction sector (£139.1 billion). 3 And they are growing fast. Between 2010 and 2022, real GVA growth in the creative industries (50.3 percent) was more than double the UK economy as a whole (21.5 percent).
In 2019-2023, the creative industries generated a 15.1 percent increase in jobs compared with only 1.4 percent across all UK industries.4 They employed 2.4 million people in the UK in 2023. That’s 7.1 percent of all UK jobs.
A force for innovation
The development of technologies in the creative industries’ largest subsector – IT, software and computer services – drives innovation in other sectors, from energy and the environment to security, health to education, manufacturing to agriculture. And the creative thinking that underpins all creative industries subsectors generates spillover effects elsewhere. Creative jobs attract highly qualified people: 69 percent of those working in the UK creative industries had a degree or equivalent in 2023, compared to 44 percent of workers across all UK sectors. 5 The innovative mindset of those working in the creative industries ripples out across the wider economy: evidence shows businesses more closely connected to the creative industries, or with more employees from the sector, are more likely to produce novel product innovations.6
Creative growth in the GSW
The Great South West (GSW) is emerging as a serious creative contender. Office for National Statistics (ONS) data shows that while the GSW had only 2.4 percent of creative industry jobs in 2022, it had the joint fastest jobs growth in this sector of any British region over the 2019-22 period (4.1 percent CAGR), tying with the East Midlands. Over the longer term (20152022), the GSW’s creative industries jobs growth rate (2.8 percent CAGR) approached that of London (3.5 percent CAGR), which dominates the UK creative industries with 40 percent of sectoral employment. Within the GSW, creative industries jobs grew faster in 2019-22 than in every other major sector except arts and entertainment, with which the creative industries substantially overlap.
Our new analysis reveals at least 15,870 companies in the creative industries are registered in the GSW and active as of 1 July 2024. Around 70 percent are located within 22 geographical clusters, with significant clusters in Bournemouth, Christchurch and Poole, Exeter and Exmouth, Plymouth and Falmouth. Collectively, these companies employ at least 34,600 people. In addition, around 40,000 freelancers work in the GSW creative industries. Nearly 49,900 people, including freelancers, worked in creative jobs in other sectors in 2023, ONS data shows – an increase of 60 percent since 2014 that has helped to drive creative thinking across industries.7 Our data suggests the creative industries turnover at least £2.3 billion per year and generate £2.7 billion of GVA in the GSW.
01. Government green paper: Invest 2035: The UK’s modern industrial strategy Published 14 October 2024.
02. Department for Culture, Media & Sport: DCMS Sectors Economic Estimates Gross Value Added 2022 Released 15 February 2024. 2022 data is provisional.
03. ONS: Regional gross value added (balanced) by industry: all ITL regions Published 24 April 2024.
04. DCMS: Economic Estimates: Employment in the DCMS sectors, January 2023 to December 2023. Updated 18 July 2024.
05. DCMS: Economic Estimates: Employment and APS earnings in DCMS sectors, January 2023 to December 2023. Published 13 June 2024. Updated 18 July 2024. Percentages calculated from raw estimates.
06. Frontier Economics (2023): Creative Spillovers: Do the Creative Industries Benefit Firms in the Wider Economy? (PDF link) Report co-commissioned by DCMS and the Creative Industries PEC.
07. ONS Local: Overview of creative jobs and creative industries for the Great South West over the years 2014 to 2023 using Annual Population Survey and Business Counts Survey. Custom data request reference 2381, released 27 September 2024.

Leading from the Edge Leading from the Edge
From coastal edge to cutting edge
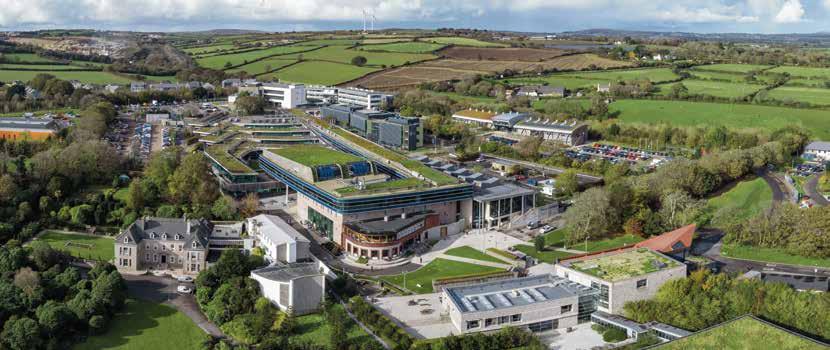
The GSW has unique advantages when it comes to the creative industries, including three specialist creative industries universities (Falmouth University, Arts University Plymouth and Arts University Bournemouth) and three other universities (Bournemouth, Plymouth and Exeter) with strong specialisms in creative industries subjects. Together, these six universities produced over 6,700 highly skilled graduates in creative and createch disciplines in 2023-24, 8 and drew in £33.6 million of research grant funding over the 2021-24 period,9 while supporting the creative sector – as well as emerging crosssectors such as agritech and health tech – with R&D, incubation programmes and state-of-the-art facilities.
The GSW had faster jobs growth over 2019-22 than the British average in advertising and marketing; architecture; and (the largest subsector) IT, software and computer services, as well as the creative industries as a whole. Our analysis shows that music, performing and visual arts contributes a higher share of the GSW’s GVA (15.6 percent) than the UK 2022 average (9.1 percent), hinting at the huge potential of this subsector.10 Indeed, the GSW is home to the world’s largest greenfield music festival, Glastonbury, and accounts for a substantial share of the two million music tourists who visited the South West region as a whole in 2023, ranking it second behind London for music tourism spend and employment.11
Overcoming barriers
Despite these advantages, significant barriers exist to investment and growth of the sector in the GSW. They include low regional and national awareness of the creative industries’ importance in the GSW, lack of a GSW-wide strategy, and the small number of large anchor companies based in the region. On top of this, creative industries growth is hampered by factors affecting all GSW industries, including a shortage of affordable housing and poor transport infrastructure.
And yet the potential of the GSW as a creative region has recently begun to be recognised. In the last two years, the Department for Culture, Media & Sport (DCMS) has designated Cornwall and Devon as a Create Growth region as part of its Create Growth Programme, a
£28.4-million mentoring and access to finance programme run in several English regions outside London.12 While it is too early to measure the direct impact of the Create Growth Programme, other evidence suggests that the GSW’s creative industries are becoming more innovative and better able to take advantage of R&D funding. GSW creative industries companies captured £1.7 million of Innovate UK grant funding in 2022-23, an amount that has surged since 2020.13 Forty-one percent of this – almost £700,000 – went to 10 organisations based in Cornwall, where Cornwall Council’s industrial strategy has targeted interventions at creative companies for a number of years.
Potential for future growth
The creative industries bring enormous economic benefits, including higher productivity, skilled jobs and spillover effects to other industries. They also benefit regions through urban regeneration, improved health and wellbeing, and net-zero behaviour change.14 And they will continue to grow. The UK government plans to expand the creative industries’ GVA by £50 billion a year and add a million extra jobs by 2030 and is investing £50 million in a new round of the Creative Industries Clusters Programme.15 As we have seen, the creative industries in the GSW are growing faster than in the rest of Great Britain. The GSW must develop its creative industries strategy to ensure that this message is heard regionally and nationally to compete with other regions for its share of national investment. Maximising the GSW’s potential as a creative industries region will roll out the benefits of a thriving regional creative economy across industry sectors.
08. Figure excludes IT and tech graduates for the non-creative industries universities
09. Data provided by universities listed
10. GSW source: our analysis for mid-2024. UK source: DCMS: DCMS Sectors Economic Estimates Gross Value Added 2022 (provisional) Published 15 February 2024.
11. UK Music press release 26 July 2024.
12. The Create Growth Programme was launched in 2022 by DCMS and Innovate UK, which is part of the UK Research and Innovation Organisation (UKRI). It was originally launched at £17.5 million then extended by £10.9 million
13. UK Research and Innovation (UKRI): Innovate UK funded projects since 2004 Last updated 13 August 2024.
14. See for example UKRI: Evaluation of the Creative Industries Clusters Programme, published 1 July 2024.
15. DCMS: Creative Industries Sector Vision. Published 14 June 2023. Last updated 20 June 2023.

Goonhilly Earth Station © 2023 Clare Louise Jackson/Shutterstock

SUMMARY OF RECOMMENDATIONS
Develop a GSW-wide strategy and sell our story
The GSW can take some immediate steps to create the right environment and campaign for more national investment by empowering the University Alliance to continue to be the strategic lead for the GSW creative sector. They should develop an economic strategy focused on growing the commercial creative industries and sell the region nationally as a rapid-growth rural and coastal cluster.
Match fund a Creative Clusters Programme bid
Local authorities will need to offer financial support for a GSW University Alliance bid for the new round of the Creative Clusters Programme. Universities will also be required to put in 20 percent match fundinng proportionate to the size of their institutions and activity. This investment will increase the region’s chance of successfully capturing the £7-8 million of UKRI funding and, with it, the potential to leverage private sector match funding.
Target interventions at growth subsectors and spillover with priority sectors
To generate the best returns, we recommend interventions are focused on subsectors that are large in the UK and growing fast in the GSW including:
⦁ IT, software and computer services because it underpins the development of technology for the creative industries and other sectors
⦁ Advertising and marketing because it is one of the UK’s and the GSW’s largest, fastest-growing and most productive subsectors
⦁ Music, performing and visual arts because it is one of the UK’s largest and most valuable subsectors and the GSW has unique and distinctive strengths here
⦁ Film, TV, video, radio and photography because key agencies now in place have shown the GSW has significant growth potential in this high-value sector
⦁ Architecture because it is vital to the green economy and energy security priorities in the region
Improve access to finance
Create a clearer funding roadmap that bridges the gap between UKRI grants and large equity raises to build a pipeline of companies ambitious to scale up. This will create the large companies the region needs as anchors for micro businesses. A dedicated digital and creative equity and loan fund for companies located in the GSW would also attract companies into the region.
Designate Culture and Creative Zones and develop infrastructure
Culture and Creative Zones (CCZs) can target areas for regeneration and make creative industries more visible. Create and name CCZs dedicated to the creative industries. They should be within the GSW’s 22 clusters, could be at town, city, village, or district level, and could reflect particular subsectoral strengths in particular areas. Investment in mid-scale infrastructure is needed to address a significant lack of production facilities compared to other regions.
Invest in skills for people living in the region
Degree apprenticeships can help regions retain skills, as students are likely to be resident within their geographical area of study. However, micro businesses’ work is often projectbased and they are unable to take on apprentices on long-term contracts. To tackle this, the GSW should create a new flexi-job apprenticeship agency, or work with an existing one.
Support companies to reach wider markets
Micro businesses need support to connect with national markets and supply chains, while more established businesses may need conference and travel bursaries to reach international markets. Both would benefit from additional support.

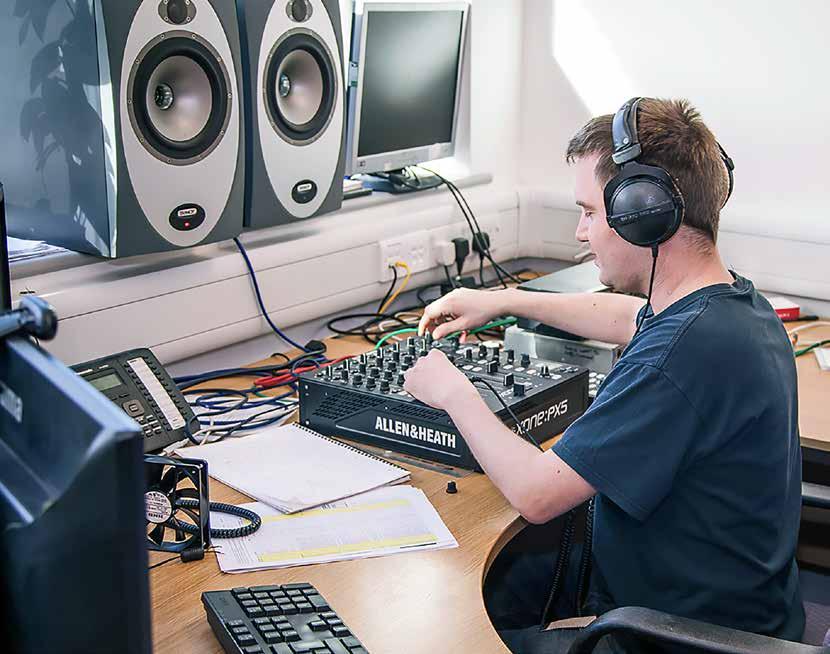
Recording desk at Cube Studios ©Cube Studios
OVERVIEW
The creative industries in the GSW
THE UK CREATIVE INDUSTRIES
The creative industries are, collectively, one of the eight UK sectors with the highest growth opportunity for the economy and business.16 The Department for Culture, Media & Sport (DCMS) defines the creative industries as ‘those industries which have their origin in individual creativity, skill and talent and which have a potential for wealth and job creation through the generation and exploitation of intellectual property’.17 DCMS also has a precise, statistical definition of the creative industries, using the concept of “creative intensity” – the proportion of occupations in an industry (at four-digit SIC code level) that are considered creative. DCMS groups the list of creative industries into nine subsectors, from architecture to publishing. (See Annex 1.1 for more information on how the creative industries and subsectors are defined.)
The creative industries are a UK economic powerhouse. In 2022, they contributed 5.7 percent of all UK GVA, at £124.6 billion.18 This is a lot: it approaches the £139.1 billion GVA contributed by the UK construction industry in 2022, for example – see Figure 1 for a comparison of the creative industries with a selection of other UK industrial sectors.19 The creative industries are growing fast. Between 2010 and 2022, their real GVA growth (50.3 percent) far outstripped that of the UK economy as a whole (21.5 percent). And the
Exports from the UK creative industries are substantial – in 2021, they generated a £2.1 billion trade surplus (in current prices), helping to reduce the UK’s trade deficit. The value of creative industries goods exports, driven by the music, performing and visual arts subsector, was £9.8 billion, equivalent to 2.7 percent of all UK goods exports. Across all DCMS sectors (with the creative industries accounting for the lion’s share), the USA bought the most goods, followed by Switzerland, France, Hong Kong and Germany.
Creative industries service exports were driven by IT, software and computer services and generated a trade surplus of £18.7 billion in 2021. USA, Germany, Ireland, Netherlands and France were the biggest customers for services across all DCMS sectors; again, the creative industries accounted for the majority. 21 Creative jobs attract highly qualified people: across the UK, 69 percent of those working in the creative industries had a degree or equivalent in 2023, compared to 44 percent of workers across all UK sectors. 22 And a larger share of workers in the creative industries are in jobs requiring degree-level skills than in other sectors. In 2023, 40 percent of those in the creative industries had a skill level of four –the highest – compared to 34 percent in other industries. While it’s true that the average UK worker is becoming more skilled over time, the share of those with level four skills is increasing faster in the creative industries than elsewhere, swelling by 11 percentage points in the last decade (see Figure 3). 23

Figure 1: The UK creative industries are bigger than you think
Figure 2:
The creative industries, which include the IT, software and computer services subsector, are increasingly collaborating with other industries, including the GSW’s priority sectors, creating hybrid sectors that can be highly innovative and disruptive. Examples include the application of AI and robotics to agriculture, collaborations between defence specialists and tech developers to create virtual training systems, and immersive health applications that combine the skills of content creators with those of health practitioners. Spillover effects from the creative industries produce considerable benefits for other sectors, as well as local communities. Work undertaken for a group of European agencies, including Arts Council England, in 201524 defined three types of spillovers:
Tom
(PDF)
Cultural
⦁ Knowledge spillovers: new ideas, innovations and processes developed by creative businesses spill over into the wider economy and society, including via skill transfer and training.
⦁ Industry spillovers: successful creative enterprises affect business culture and entrepreneurship; property markets; private and foreign investment; productivity, profitability and competitiveness; and innovation and digital technology.
⦁ Network spillovers: a high density of creative industries in a particular area leads to clustering and agglomeration effects, increasing regional attractiveness and boosting economic growth.
These spillovers can have a direct impact on employment in other industries. While our analysis cannot quantify the amount of spillover activity from the creative industries in other industries in the GSW, we know that creative jobs have a strong multiplier effect. For example, Creative PEC research reveals that, on average, each creative job in a locality generates 1.9 new jobs in other sectors, like leisure and retail, because creative company employees spend their money locally. 25
24.
Fleming Creative Consultancy:
and Creative Spillovers in Europe: Report on a Preliminary Evidence Review
Augmented Reality
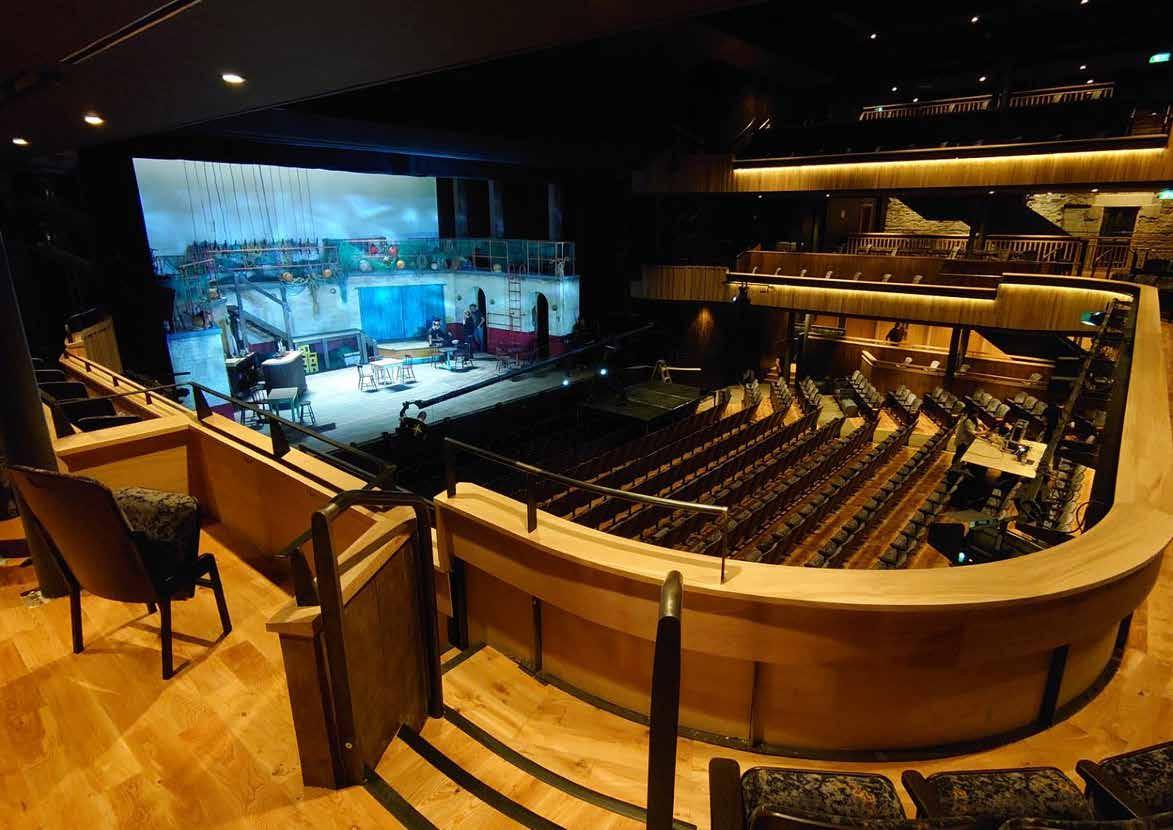
Hall for Cornwall auditorium ©Burrell Foley Fischer Architects
AMUTRI
Amutri (amutri.com) is a Penryn-based software company supported by Falmouth University’s flagship venture programme, Launchpad (falmouth.ac.uk/launchpad). Amutri has launched a first-of-its-kind product that offers fast, cloud-hosted 3D visualisation for designers, engineers and architects. The technology also supports the UK Government’s strategic goal of reducing reliance on fossil fuels for energy production by supporting alternative energy companies, like Rolls-Royce SMR, in planning, constructing, and securing stakeholder approval for alternative energy plants.
With Amutri, users can create and access 3D experiences through the web, simplifying the adoption of 3D visualisation technology. The platform is designed to be automated, costeffective, and user-friendly, lowering the barriers to entry and providing a straightforward solution for integrating 3D visualisation into sales and stakeholder engagement activities.
After participating in Launchpad, the company secured and successfully delivered a £500,000 UKRI-funded project. They raised £600,000 in equity funding at the pre-seed stage to refine their technology and expand their team to 12 employees.
Rolls-Royce Small Modular Reactors (SMR), which makes nuclear reactors, is among the early pilot adopters of Amutri’s technology from the energy sector. “3D experiences can help de-risk activities by prototyping digitally” says Greg Wilkinson, their research and technology manager. “Photorealism gives confidence to stakeholders building the plant.”


“3D experiences can help de-risk activities by prototyping digitally ]...[ Photorealism gives confidence to stakeholders building the plant.”
Greg Wilkinson, Research and technology manager
THE GSW CREATIVE INDUSTRIES
Business landscape
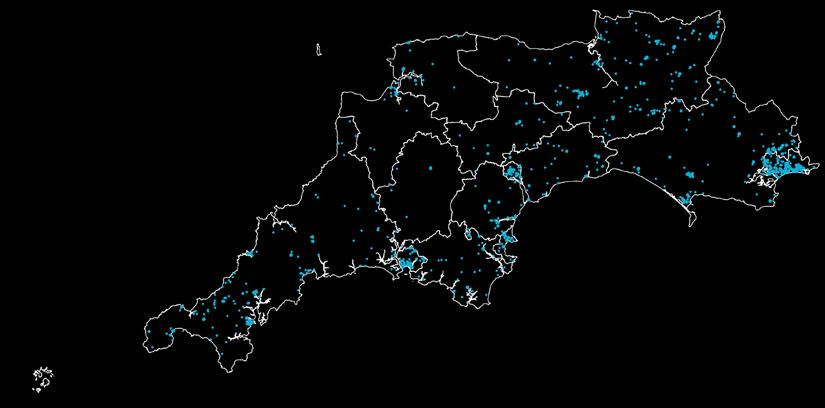
Is the GSW fully sharing in the benefits the creative industries can bring? To find out, we conducted original research into the current state of the creative industries in this region of 3.2 million people. 26 First, we took the list of companies registered by Companies House as active as of 1 July 2024, and filtered it to companies with a first-listed SIC code within the DCMS definition of the creative industries and with a registered address located within the GSW. We then matched our list to company-level economic data from Data City, a commercial data provider. (See Annex 1. Methodology for a full description of our methodology.) Our analysis uncovered 15,870 GSW-registered companies within the creative industries active in July 2024.
Only 14 companies are large (listed in Table S49 in Annex), and 58 are medium-sized, based on employee counts. Sixty-two percent are micro-sized enterprises of one to nine employees. Indeed, micro businesses characterise the creative industries nationally, with 93.4 percent of UK creative industries businesses falling into the micro band in 2023, slightly higher than 89.1 percent of all UK registered businesses. 27 A further 36 percent of our companies register no employees or turnover data, so their size cannot be determined. The apparently lower share of micro businesses in our GSW dataset compared to the UK picture is likely because we lack company size information for such a high proportion of businesses. These businesses of unknown size are likely to be mostly micro-sized businesses in reality, and will probably include many businesses of one person. Our company size breakdown should therefore not be compared to the UK-wide data.
Looking at the local authority district (LAD) of a company’s registered business address, Dorset has the largest number of companies in the creative industries (23 percent), followed by Bournemouth, Christchurch and Poole (BCP, 19 percent). Divided by county, 42 percent of GSW creative industries businesses are in Dorset (including BCP), 28 percent in Devon (including Exeter, Plymouth and so on), 16 percent are in Somerset and 14 percent in Cornwall and Isles of Scilly. 28 However, the company counts for Dorset and BCP should be treated with caution, owing to the large number of companies in these LADs registered to single addresses, mainly of accountancy firms. Some of these companies, while registered in the GSW, are likely to be mainly active outside the region – see Annex 1.3.1 for a discussion.

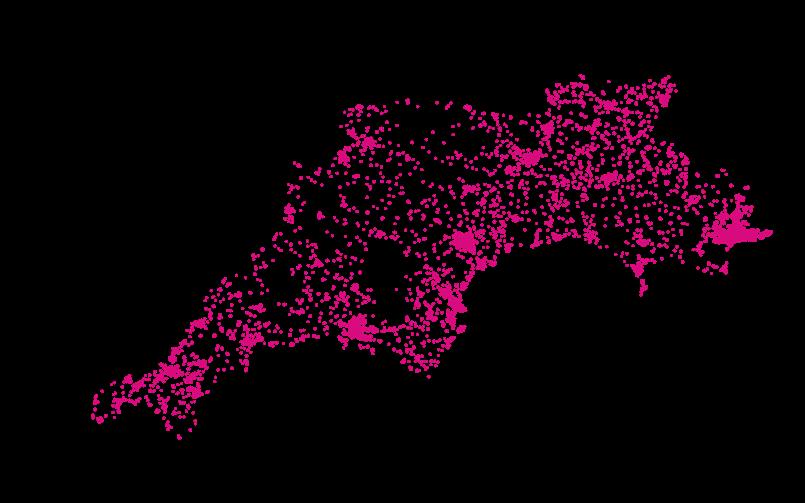
Figure 4: There are 15,870 active creative industries companies in the GSW region
©2021 Roman Fenton/Shutterstock
Economic impact
Our analysis reveals that companies in the creative industries contribute at least £2.7 billion in GVA to the GSW and turn over at least £2.3 billion per year. 29 However, the creative industries make up a smaller share of GSW GVA (3.3 percent) than across the UK (5.7 percent) as Figure 5 shows. The GSW’s 14 large companies by employee count account for the biggest share of turnover, at 33 percent, or £764 million – almost £55 million per company. The nearly 10,000 micro-sized companies combined account for a slightly smaller share: 30 percent, or £700 million of annual turnover.
By local authority, BCP, Dorset and Cornwall lead creative industries GVA, reflecting both their healthy company counts (bearing in mind the caveat listed in the Business landscape section above) and their strengths in high-value subsectors like film and TV. North Devon has a high GVA figure from large companies largely because of the Mission Group – an AIMlisted group of 19 advertising agencies all registered in Filleigh, near Barnstaple – which accounts for 47 percent of North Devon’s total creative industries GVA.
Each creative industries employee contributes an average of £76,700 to the GSW economy per year, calculated as total creative industries GVA divided by the number of employees. This compares favourably with the ONS figure for GVA per filled job of £61,700 across all UK sectors in 2022, 30 although these figures should be compared with caution. Their different data years and underlying methodologies should be noted, along with the fact the company-level Data City GVA data upon which our figures rest is provisional. These caveats aside, it is still likely that creative industries jobs contribute far more to the GSW economy than the average job.

Figure 6: By local authority, BCP, Dorset and Cornwall lead on creative industries GVA
Figure 5: The creative industries make up a smaller share of GVA in the GSW than nationally
©2024 Jacob Lund/Shutterstock
Employment
Our analysis shows at least 34,597 people were employed in companies in the creative industries in the GSW in mid-2024. 31 This is close to the ONS figure of 36,015 people in 2022, including company directors, which implies our data is robust. 32 (Note that these figures are not directly comparable and do not demonstrate a fall in employment between 2022 and 2024.) Based on our analysis, 69 percent of the almost 34,600 creative industries employees work in small or micro-sized businesses, with 16 percent in medium and 15 percent in large companies. By local authority district, BCP dominates, with 25 percent of GSW creative industries employees, followed by Dorset (16 percent) and Cornwall (14 percent).
The GSW is a high-growth region for creative industries employment. ONS data shows that while the GSW had only 2.4 percent of creative industry jobs in 2022, it had the joint fastest jobs growth in this sector of any British region, at 4.1 percent CAGR over the 2019-22 period, tying for first place with the East Midlands. 33 Looking at this data as a shift-share chart (Figure 7) shows that, while London and the South East dominate creative industries jobs, as you would expect, they are growing faster in the GSW than any other region over 2019 to 2022. Indeed, over the longer term (2015-2022), the GSW’s creative industries jobs growth rate (2.8 percent CAGR) approached that of London (3.5 percent CAGR), which dominates the UK creative industries with 40 percent of sectoral employment. 34
Within the GSW, this 4.1 percent year-on-year growth means creative industries jobs are growing faster than in every other major sector except arts and entertainment (4.7 percent CAGR over 2019-22), with which the creative industries substantially overlap. The shift share analysis represented in Figure 8 shows that, while the creative industries make up a relatively smaller share of employment in the GSW relative to other sectors –for example the bedrock sector of agriculture, forestry and fishing –creative industries employment grew faster in the GSW over 2019-22 than you would expect, relative to the national growth rates.

Figure 8: GSW creative industry employment is showing healthy growth
Figure 7: Relative to national growth
As well as people employed by creative industries companies, many people work in creative jobs in non-creative industries. An ONS custom data request we submitted reveals there were 49,863 people working in creative jobs in other sectors in 2023, an increase of 60 percent since 2014.
35 Such overlaps are productive: the innovative mindset of these people who work in creative jobs for companies outside the creative industries generates spillover effects to other industrial sectors. Evidence shows businesses that are more connected to the creative industries, or with more employees from the sector, are more likely to produce novel product innovations.
36
These new ONS figures total 75,749 people working in the creative industries in 2023. This is substantially higher than our estimate of 34,597, and the ONS BRES figure of 36,015 in 2022, because it also includes freelancers. While this report focuses on limited companies with employees, which have the strongest potential to drive growth, freelancers make up a substantial share of the national creative industries workforce – around a third (or a ratio of one freelancer per two employees).
37 The ONS data suggests that somewhere in the region of 40,000 creative freelancers may work in the GSW, a ratio of roughly one freelancer per employee.
38 This would indicate that many freelancers may be resident in the region and working elsewhere, often remotely.

Universities
One of the GSW’s unique strengths is that it is home to three creative industries universities – Falmouth University, Arts University Bournemouth and Arts University Plymouth – plus the universities of Exeter, Plymouth and Bournemouth, which have also achieved national and international recognition for their creative industries disciplines. These include digital media, art and technology at University of Plymouth, communications, drama and film at University of Exeter and creative technology and special effects at Bournemouth University, which is also home to the National Centre for Computer Animation. These six GSW universities produce world-class research: 31 percent of their research was rated world-leading (4*) and 45 percent was rated internationally excellent (3*) in Units of Assessment relevant to the creative industries in REF 2021. 39
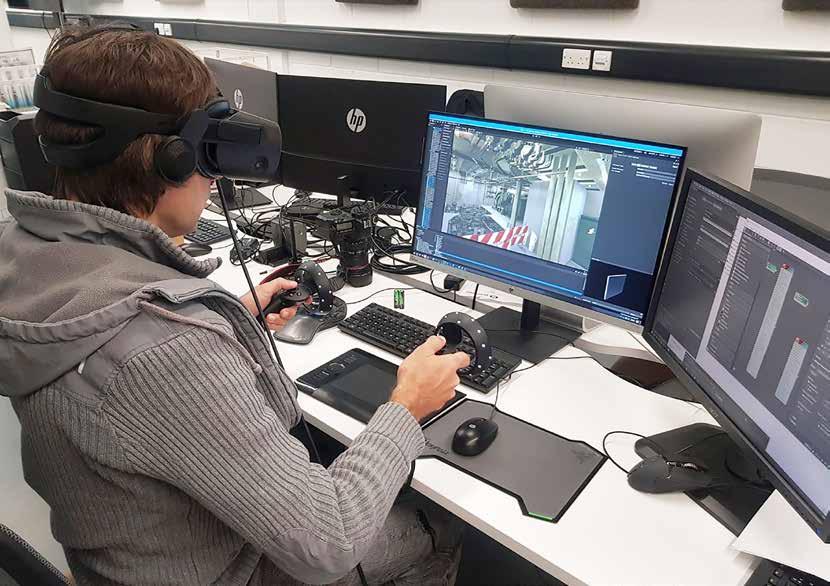
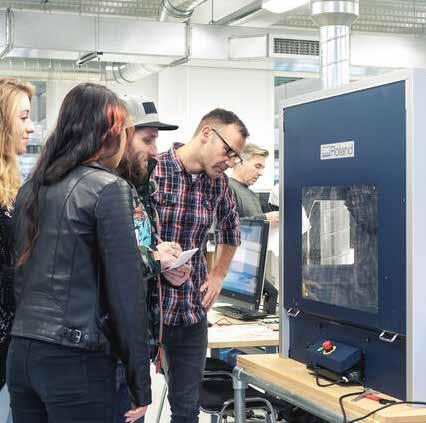
They are also home to state-of-the-art facilities for students, academic researchers and business collaborators. These include studios and labs supporting digital and immersive technologies: the Centre for Blended Realities at Falmouth,40 i-DAT Open Research Lab for creative technology at Plymouth,41 VSimulator at Exeter,42 and Immersive Technology Lab at Bournemouth. The Fablab at Arts University Plymouth43 and the Innovation Studio at Arts University Bournemouth44 provide companies from across sectors access to equipment and expertise to support the development of new products and processes.
The universities support early-stage businesses in the creative industries with a number of programmes including Launchpad Futures at Falmouth,45 which develops research partnerships with organisations to increase R&D and economic activity in Cornwall.
The six universities produced at least 6,727 graduates in creative disciplines in 2023-24.46 Creative graduates are valuable. As a recent report from GuildHE and UKADIA points out, they typically have flexible skill sets including originality, critical thinking, initiative, risktaking, teamwork and problem-solving, in addition to their subject-specific skills.47 They are agile in how they harness these skills and – because many creative graduates go into self-employment – often also possess strong business and enterprise abilities. To support students and recent graduates to set up their own companies, universities, local authorities and business advisory services deliver entrepreneur programmes such as Ignite in BCP.48
But while the GSW is producing thousands of these valuable graduates in creative fields each year, it is not hanging on to them. Graduate retention rates are low: only 20 percent of graduates stay in the South West, across all occupations.49


39. Results of Research Excellence Framework (REF) 2021 Average of data for five universities (Arts University Plymouth did not participate in REF 2021) across the following Units of Assessment: Architecture, Built Environment and Planning (Plymouth only); Art and Design (four universities); Communication, Cultural and Media Studies, Library and Information Management (Bournemouth only); English Language and Literature (three universities); Music, Drama, Dance, Performing Arts, Film and Screen Studies (three universities).
40. Falmouth University Centre for Blended Realities
41. University of Plymouth i-DAT Open Research Lab
42. University of Exeter VSimulator

46. Data provided by all six universities. This figure excludes some postgraduates, who had not graduated by the time we conducted our research, so the true figure will be higher. Further, defining a ‘creative’ graduate can be difficult. For the three creative industries universities –Falmouth, AUB and AUB – it includes graduates across all disciplines. For Plymouth, Exeter and Bournemouth, the subjects included do not match exactly across institutions. In addition, they do not include graduates and IT and technology subjects for the three non-creative industries universities.
47. GuildHE and UKADIA: The Value of Creative Graduates. Research report 2024
48. Ignite is funded by BCP Council and delivered by Evolve, a local business advisory company.
49. Based on graduate survey data from five universities (Bournemouth, Falmouth, AUB, AUP and Exeter). Graduate retention data is collected as part of the Graduate Outcomes Survey, run by HESA. Graduates complete the survey 15 months after graduation. The responding universities also took data from different time periods, for example, AUP used a 3-year average whereas Exeter is last 10 years, so are not strictly comparable.
43. Arts University Plymouth Fablab
44. Arts University Bournemouth Innovation Studio
45. Falmouth University Launchpad
Falmouth University, Exeter University Penryn Campus ©Kevin Moir/Falmouth University
Electronics prototype development - Fab Lab South West ©Arts University Plymouth Digital audio production studio ©Falmouth University
Stage prodcution light desk programming ©Falmouth University
3D printing for prototype development - Fab Lab South West ©Arts University Plymouth
CASE STUDY: OUTPOST VFX
Outpost VFX (outpost-vfx.com/en) is a high-end visual effects company with a diverse portfolio across film, broadcast, advertising and VR. It is one of the largest creative industries companies in the GSW. Outpost VFX has studios in London, Montreal and Mumbai, but its headquarters is in Bournemouth, where it has state-of-art facilities across 10,000 square feet. Founder and CEO Duncan McWilliam chose to base the Outpost VFX studio in Bournemouth because the company works closely with Bournemouth University (particularly its visual effects programme) and mentors and employs its graduates, helping the company counter the global shortage of people with visual effects skills with a local skilled labour pool. A base outside London also enables them to be more competitive on overheads. Outpost’s stunning work can be seen in critically-acclaimed films and series including Napoleon, Pachinko series 2 and House of the Dragon.


Images on this page produced by visual effects students on the Bournemouth University visual effects programme
©Bournemouth University
CLUSTERS
Where do GSW creative companies gather?
Clusters have long been recognised by researchers and the UK government as the engines of growth for the creative industries. When creative businesses cluster, companies and individuals can more easily share ideas, form supply chains and bring together the collaborative skills they need to innovate.
SUPERCLUSTERS, MICROCLUSTERS AND CREATIVE CORRIDORS
The UK’s international-scale creative industries ‘supercluster’ is London and the South East, which was responsible for 57 percent of UK creative industries jobs in 2022. 50 In a bid to compete with this supercluster, cities outside London with a large number of creative industries companies are coming together to develop strategies and ‘creative corridors’. One such creative corridor is One Creative North, which stretches from Liverpool to Newcastle via Manchester, Sheffield and Leeds and is closely associated with the Northern Powerhouse. 51 Launched in February 2024, One Creative North has been widely promoted by the North’s metro mayors. It is a strategy that seems to have produced early dividends as Beyond (the UK’s annual creative industries R&D conference, part-funded by UKRI) moves north to Salford in the heart of the corridor in November 2024.
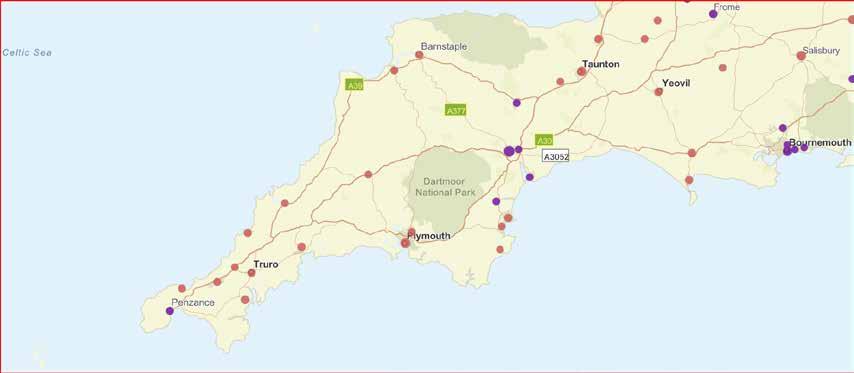
During the pandemic, focus shifted from the role played by clusters at a large city level to the characteristics of more distributed microclusters, and the significant contribution they make to UK regions. In 2020, research from the AHRC-funded Creative Industries Policy and Evidence Centre (PEC) defined these microclusters as areas in which at least 50 creative industries businesses and organisations gather together. 52 It found 709 distinct creative industry microclusters spread across the UK, including several in the GSW. Earlier work by the PEC team from back in 2016 had identified Bournemouth, Exeter and Penzance as three distinct creative industry clusters among 47 in the UK. 53
A 2022 Frontier Economics paper for the DCMS identified Bournemouth as one of 55 creative industries clusters, the DCMS-55, and grouped it with 11 other ‘creative districts’, including Brighton and Harrogate. 55 Creative districts are characterised by Frontier Economics as having “many micro-businesses and stable firms from a wide range of creative sectors, and a smaller share of high-growth businesses”. Creative districts also “score well on most counts [based on the indicators measured by Frontier Economics], the main exception being access to talent. The proportion of firms reporting that access to skills is a hindrance and that vacancies are hard to fill is higher in creative districts than the UK average. Average graduate retention is also lower [...] than in other creative clusters.”
55.
Clusters outside established clusters
52. Creative Industries Policy and Evidence Centre (PEC): Creative Radar: Mapping the UK’s creative clusters and microclusters, November 2020 (PDF)
53. Nesta: The Geography of Creativity in the UK Published 22 July 2016.
54. Creative Industries PEC: Mapping the UK’s creative industries Accessed 1 September 2024.
Frontier Economics and DCMS: Understanding the Growth Potential of Creative Clusters (PDF). Published August 2022.
Frome
Salisbury Bournemouth Yeovil Taunton
Barnstaple
Plymouth
Truro
Penzance
Figure 10: Map from the Creative Industries PEC showing GSW microclusters 54
709 microclusters:
Clusters currently inside an established creative cluster (area
Exeter
MAPPING THE GSW’S CREATIVE CLUSTERS
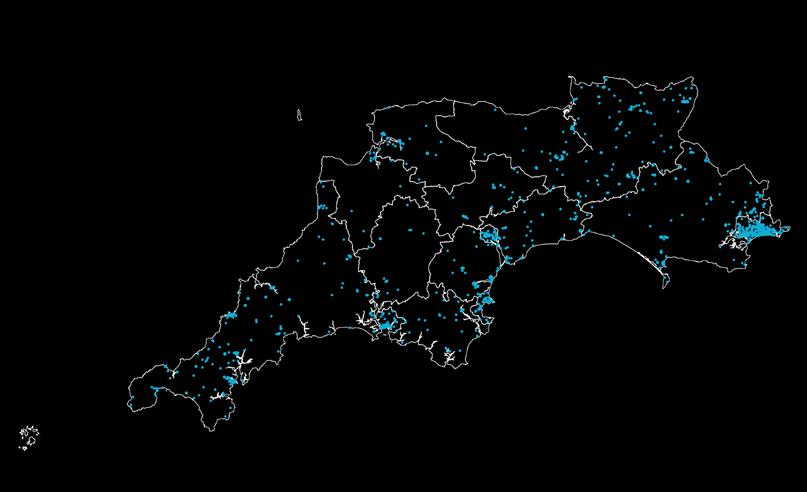
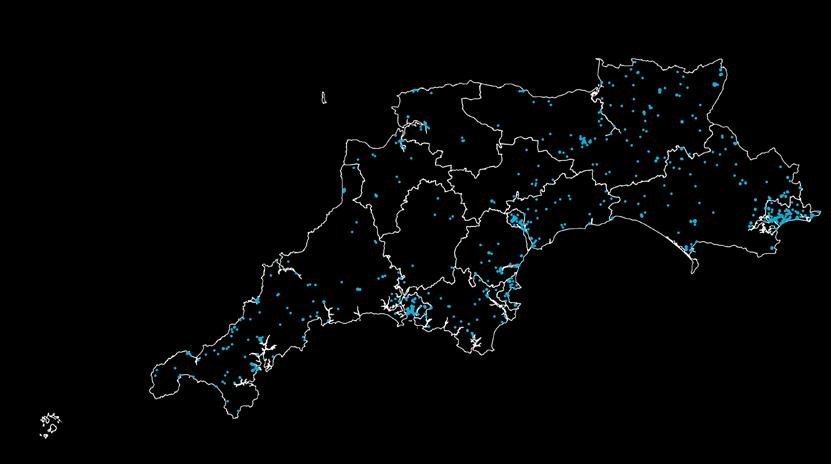
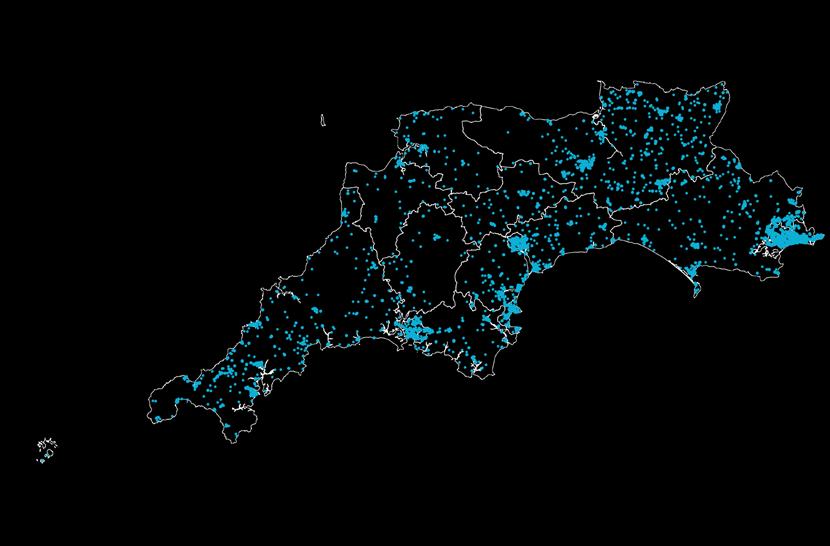
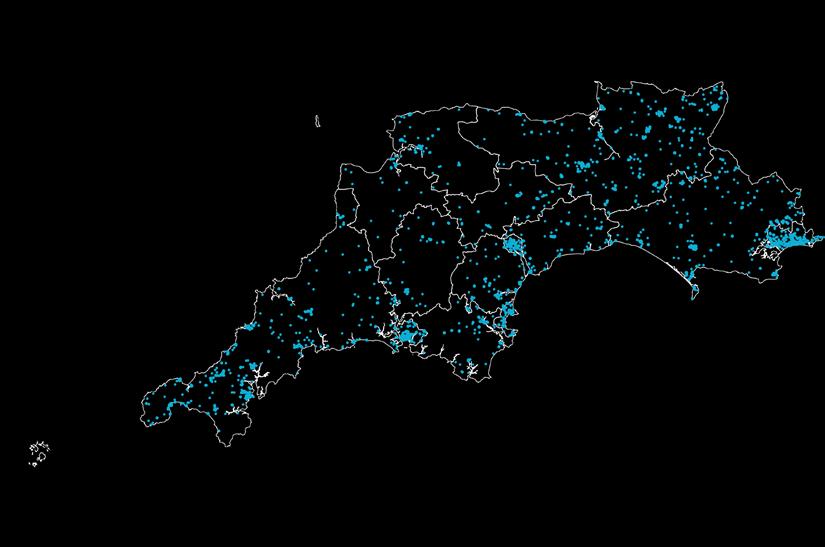
In our analysis for this report, we mapped the registered company locations of all 15,870 creative industries businesses in the GSW. We then clustered their latitudes and longitudes using the HDBSCAN clustering algorithm, with a minimum number of companies per cluster of 100. This clustering was based purely on geographical proximity and not, for example, on travel time. (See Annex 1.4.3 for a more detailed description of our cluster analysis.)
Our analysis revealed 22 distinct creative industries clusters in the GSW of at least 100 companies each. In total, 71 percent of companies fall into a cluster and 29 percent do not. Clusters are centred around towns and cities but also include many businesses in surrounding rural areas. The largest clusters by number of companies are Bournemouth, Christchurch and Poole (5,451 companies, 34 percent), Exeter and Exmouth (913 companies, 5.8 percent) and Plymouth (847 companies, 5.3 percent), but sizeable clusters can also be found in places as wide-ranging as Falmouth, North Devon, Taunton, Torquay, and Frome. Others, such as Glastonbury with 101 companies, might be better termed microclusters.
Being in a microcluster makes a big difference to companies outside the established creative clusters, research from the Creative Industries PEC has found. 56 Companies in microclusters are more likely to want to grow than those not in a microcluster, and more likely to behave like companies in bigger, established creative clusters, benefitting from a proximity to skills, customers and knowledge. In later research into rural microclusters, they found the drivers behind clustering in rural areas are the same as those in towns and cities, meaning policy interventions for the creative industries can have a significant positive impact in rural as well as urban locations. 57 Being close to a university, further education college and/or cultural anchor institution (including a museum or gallery, archive or heritage site), can also support rural as well as urban clustering, the research found.

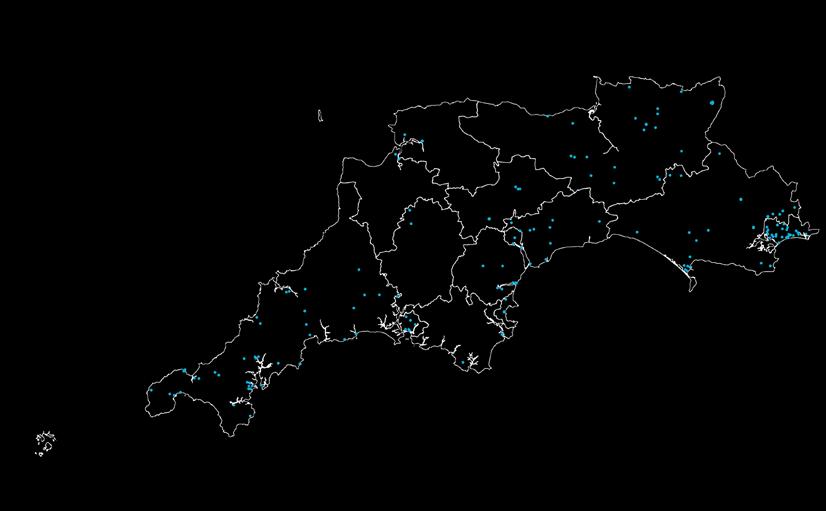
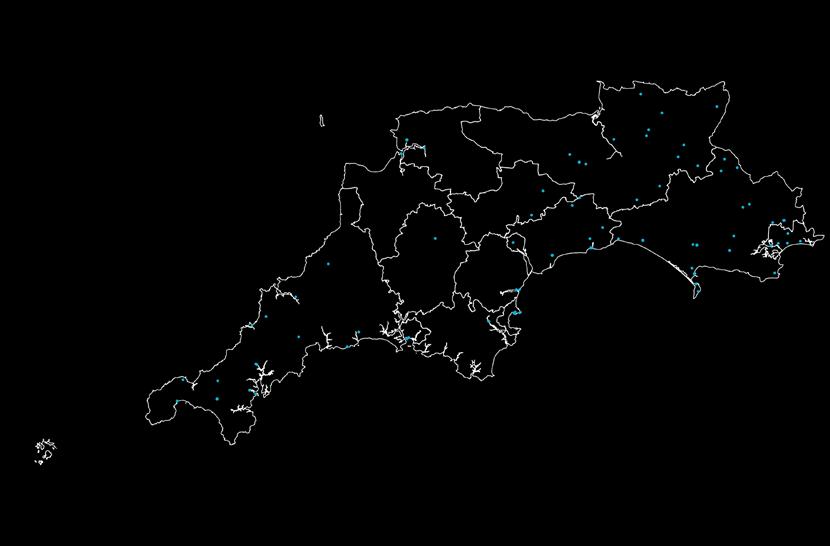
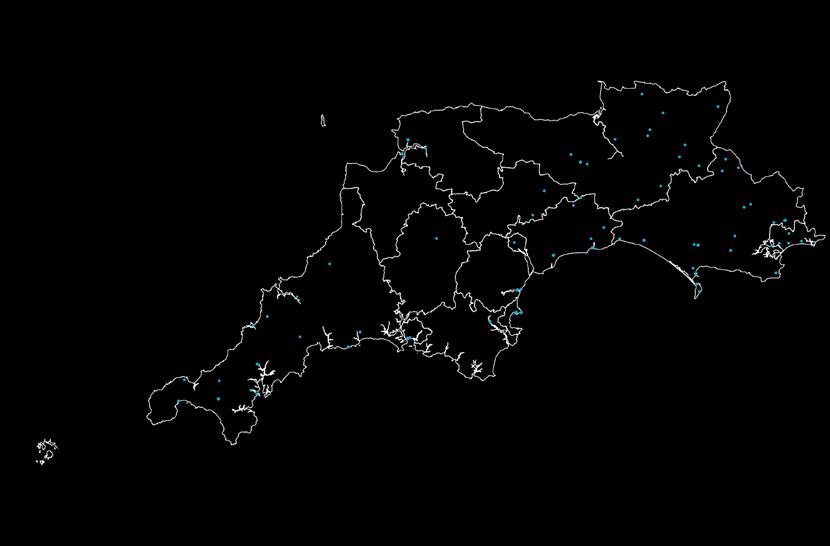
We then mapped the locations of key creative infrastructure, meaning infrastructure that could attract creative industries businesses in the GSW and incentivise them to cluster. We categorised these as:
⦁ Universities and further education (FE) colleges with significant digital and creative industries courses
⦁ Cultural and heritage organisations. In this case those designated by A rts Council England as National Portfolio Organisations (NPO)58
⦁ Immersive facilities such as Falmouth University’s Centre for Blended Realities 59
⦁ Fab labs,60 digital innovation labs and production spaces (marked ‘Space’ on Figure 12)
⦁ Major work hubs
Unsurprisingly, GSW creative industries infrastructure including culture and heritage organisations and creative industries companies tend to cluster in approximately the same areas, including BCP, Plymouth, Exeter, Taunton, Torbay, North Devon and Cornwall.
The wealth of an area may also be important when it comes to the location of creative industries businesses. The phenomenon whereby creative industries companies move into areas with cheap rent and drive the prices up (‘gentrification’) is a staple of the popular imagination, but research on the creative industries’ real influence on gentrification paints a mixed picture. Velez Ospina et al (2023), cited in the Creative Industries PEC research, found that UK creative microclusters are less likely to occur in areas with higher levels of unemployment.61 However, when they looked at the Index of Multiple Deprivation (a measure that combines various measures of deprivation), they found microclusters are slightly more likely to occur in more deprived urban areas. In rural areas, the researchers found microclusters are more likely to be affluent. This suggests the attraction of cheaper areas for creative industries companies is likely to be an urban phenomenon, whereas, in rural areas, higher incomes and the presence of cultural assets may provide a more reliable customer base for creative industries businesses and organisations.
Truro
Penzance
Figure 11: GSW creative industries companies fall into 22 geographical clusters
Figure 12: Key creative industries infrastructure in the GSW
Size: University FE Hub NPO Immersive Space
Frome Salisbury Bournemouth Yeovil Taunton Barnstaple
Truro Penzance
56. Creative Industries PEC: Creative Radar 2021, The Impact of COVID-19 on the UK’s Creative Industries (PDF). Published July 2021.
57. Creative Industries PEC: Mapping and examining the determinants of England’s rural creative microclusters . Published May 2022 and funded by the National
(NICRE).
59. Falmouth University Centre for Blended Realities
60.
Plymouth
Exeter
Exeter
SUBSECTORS
What are the GSW’s strengths?
Business landscape
The Department for Culture, Media & Sport (DCMS) groups the creative industries into nine subsectors, from architecture to publishing. (See Annex 1.1.2 for more information on how the creative industries and subsectors are defined.) We calculated company and employee counts, GVA and turnover by subsector based on our dataset of 15,870 companies. One limitation of our dataset is that data availability differs substantially by subsector, from just 46 percent for crafts employees to 82 percent for architecture turnover.
Our analysis shows that the IT, software and computer services subsector accounts for the largest share of creative industries companies in the GSW (6,754 companies, or 43 percent), followed by music, performing and visual arts (2,489, 16 percent) and film, TV, video, radio, and photography (2,092, 13 percent). These are also the three largest creative industries subsectors across the whole UK, based on DCMS company counts.62 Indeed, the breakdown of GSW businesses by subsector is close to the UK-wide proportion (see Figure S44 in Annex 2.2).
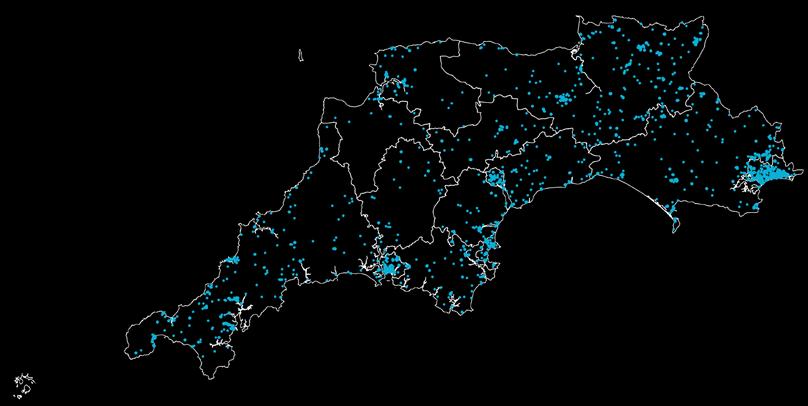
Breaking down the GSW company counts by both subsector and International Territorial Level 3 (ITL3) region63 reveals a significant number of IT and software companies in Dorset and BCP. While this could indicate the potential presence of a subsectoral cluster there, it could also be a result of the large number of companies registered to single-address accountancy firms there (see Annex 1.3.1).

Figure 14: IT companies cluster in Dorset and BCP – though may be overcounted
Figure 13: IT,
Economic impact
By turnover, the top three creative industries subsectors in the GSW are IT, software and computer services at £957 million (42 percent), advertising and marketing at £529 million (23 percent), and film, TV, video, radio and photography at £278 million (12 percent), as Figure 15 shows. The list is the same for GVA, with IT at £933 million (35 percent), advertising at £475 million (18 percent), and film at £454 million (17 percent). This mirrors the picture across the UK, where IT is the largest creative industries subsector by GVA. It contributed £53.4 billion to the national economy in 2022, according to provisional data –more than twice as much as the next largest subsector (film, at £20.8 billion).64
IT is clearly a significant subsector in the GSW. However, it is relatively less well represented regionally than nationally, as evidenced by its lower share of creative industries GVA (35 percent) than in the whole UK (43 percent), as Figure 16 shows. The large number of IT companies registered to single-address accountancy firms in Dorset and BCP, but potentially operating outside the region, will also be a factor here (see Annex 1.3.1 for discussion), meaning the true size and value of the IT subsector may be smaller than these figures suggest. By contrast, music, performing and visual arts is strong in the GSW: it contributes 15.6 percent of GSW creative industries GVA, based on our analysis –considerably higher than its 9.1 percent share nationally. Advertising and marketing is a little stronger regionally (17.9 percent) than nationally (15.2 percent) while publishing is relatively weaker. Other subsectors are similar to the national picture.65

Figure 16: Music, performing and visual arts punches above its weight
©2021 DC Studio/Shutterstock
Across the UK, the creative industries are growing faster than the economy as a whole (see 1. Overview), but some subsectors are growing faster than others. Topping the list is music, performing and visual arts, which grew 32 percent between January 2019 and June 2024, based on monthly GVA data from DCMS.66 Film, TV, radio and photography only grew 1 percent over the same period, affected not only by the pandemic, but also by strikes by two major film unions in the USA which slowed production for US studios in the UK67 . Publishing actually declined by 1 percent. Growth in the creative industries is not distributed evenly across subsectors and is volatile over time, as Figure 17 shows.
Our GSW analysis is a snapshot and cannot measure GVA growth over time in the same way as this national data. Nonetheless, our productivity figures reveal interesting current differences between subsectors. While the average GVA per employee (as of July 2024) is £76,700, this varies greatly by subsector, from only £23,300 for museums, galleries and libraries, up to £98,500 for film, TV, video, radio and photography companies (see Figure 18). Advertising and marketing and publishing also generate more than £90,000 per employee, according to our research. This is in keeping with UK-wide figures from DCMS, which also show the film and advertising subsectors with the highest output per hour worked of all creative industries sectors, at £47 and £46 respectively.68
Museums, galleries and libraries generated just £8 per hour, although it’s worth noting that many are likely to be registered charities, rather than the commercial businesses that are within the scope of this report. Further, DCMS observes that economic benefits from this subsector can be hard to quantify.69 Nonetheless, this huge disparity in output between subsectors does suggest that investment to grow the size of the GSW creative industries in easily measurable ways would do well to focus on the highest-value, like advertising and marketing, film and TV. This is not always the case currently. For example, the crafts subsector is small, although it is larger in the GSW (0.6 percent of GVA) than across the UK (0.4 percent).
70 However, the crafts subsector is not growing nationally – in fact it shrank by 11 percent between 2010 and 2022, which suggests there may be a ceiling on its growth in the GSW, too.
71

66. DCMS: DCMS Economic
Monthly GVA (to June 2024)
on DCMS’s monthly GVA series, measured in 2022 prices, which is more timely but less accurate than the annual series. It can be used as a leading indicator.
67. British Film Institute (BFI): Official BFI 2023 statistics
68. DCMS: DCMS and digital sector productivity 2022 (provisional).
GVA cannot capture wider cultural and societal benefits associated with these sectors (which may also include indirect effects on UK GVA). Hence, these productivity measures cannot fully account for output in these sectors.” Quoted from DCMS: DCMS and digital sector productivity 2022 (provisional). Published 28 March 2024.
70. UK figure from DCMS: DCMS and digital sector GVA 2022 (provisional). Based on 2022 data. Published 15 February 2024. Updated 3 September 2024. GSW figure from our analysis. 71. DCMS: DCMS and digital sector GVA 2022 (provisional).
Estimates:
This is based
Innovation Studio ©Arts University Bournemouth
Employment
Looking at creative industries employee counts, the top three subsectors are again IT, software and computer services with 13,619 employees (39 percent), advertising and marketing with 5,070 (15 percent), and music, performing and visual arts with 4,726 (14 percent). In the top four subsectors for jobs, a substantial share of employees work in large or medium-sized companies, as Figure 19 shows.
Breaking down the employee counts by subsector and ITL3 region reveals concentrations of IT employees in BCP, Dorset and Devon, with an above-average share of advertising and marketing employees in Devon. Cornwall and Isles of Scilly punches above its weight in film, TV, video, radio and photography, as well as music, performing arts and visual arts, with the second largest number of employees in both these subsectors by ITL3 region.
ONS data – complementary to ours but not directly comparable with it – shows the GSW had faster jobs growth over 2019-22 than the British average in numerous creative industries subsectors (see Figure 21). Crafts and museums, galleries and libraries show the fastest relative employment growth (local share effect on Figure 21) and are also largest relative to the national average (location quotient), though they remain small, as does design and designer fashion. Encouragingly, however, several larger subsectors also have local share effects above zero, indicating they are growing faster than the national average. These are: advertising and marketing; architecture; and (the largest subsector) IT, software and computer services, as well as the creative industries as a whole.
Figure 19: The top four subsectors for jobs have sizeable numbers employed in large companies
Figure 21: All but three GSW creative industries subsectors show faster than national growth
Figure 20: GSW creative industries jobs are concentrated in some ITL3 regions
ITL3 region: Bournemouth, Christchurch and Poole Cornwall and Isles of Scilly Devon CC Dorset Plymouth
Source: Our analysis


CASE STUDY: BRAY LEINO
Bray Leino (brayleino.co.uk) is an integrated marketing communication agency based in Filleigh, North Devon, with offices in Bristol, London, North America and Asia. It provides an end-to-end service for B2B and B2C clients across sectors including food and drink, industrial and healthcare. It is one of the top five UK B2B marketing agencies and the only agency to have held this position for over 10 years, according to a B2B Benchmarking Report.72 In 2005, it was one of the first acquisitions for the Mission Group, an AIM-listed group of 19 agencies all registered in Filleigh, North Devon. The Mission group is the largest company in our dataset, with 1,084 employees, turnover of £196 million and GVA of £111 million. Bray Leino, which is listed separately, employs 206 people, has turnover of £56.7 million, and contributes £21.2 million in GVA. As well as global brands, Bray Leino has a strong track record of helping regional businesses grow into national and international brands, including some of the GSW’s most recognisable food manufacturing companies, Rodda’s and Burts.

SECTOR PROFILES
The GSW has differing levels of strength among the nine DCMS creative industries subsectors. Here we profile these in detail.
ADVERTISING AND MARKETING
GSW COMPANY COUNT:
1,250 GVA: £479.7 MILLION (data available for 56 percent of companies) TURNOVER: £528.8 MILLION (57 percent) EMPLOYEES: 5,070 (56 percent)
EMPLOYMENT LOCATION QUOTIENT (ONS 2022):73 0.60
EMPLOYMENT GROWTH (ONS): 11.7 PERCENT CAGR 2019-22
KEY LOCAL AUTHORITY DISTRICTS FOR EMPLOYMENT (ONS 2022):74 BCP (LQ 1.16)
Advertising and marketing is a strong candidate for strategic focus as one of the largest and fastest-growing creative industries subsectors in the GSW. It is the second largest by turnover, GVA and employees. The subsector contributes a larger share of creative industries GVA in the region than nationally and is growing faster. It also has at least one large company to act as a potential subsector anchor: Bray Leino. This North Devon-based creative agency, part of the Mission Group of agencies but recorded separately in our data, is one of the ten largest creative industries companies in the GSW in terms of turnover and GVA.

ARCHITECTURE
GSW COMPANY COUNT:
784 GVA: £97.9 MILLION (data available for 81 percent of companies)
TURNOVER: £88.9 MILLION (82 percent)
EMPLOYMENT LOCATION QUOTIENT: 0.90
EMPLOYEES: 2,204 (81 percent)
EMPLOYMENT GROWTH (ONS): 3.2 PERCENT CAGR 2019-22
KEY LOCAL AUTHORITY DISTRICTS FOR EMPLOYMENT (ONS 2022): DEVON (LQ 1.09)
Architecture is another candidate for a strategic focus in the GSW. While the subsector is dominated by London, as all creative industries subsectors are, the GSW almost reaches the national architecture job share (LQ 0.9), while Devon exceeds it (LQ 1.09).
The architecture subsector, which includes construction engineering and planning businesses, is vital to the green economy and energy security priority in the region.
For example, Tor & Co (torandco.com) is a planning, design and environmental consultancy based in Bournemouth, with offices in London and Birmingham. It has advised 36 schemes across the wind, solar and biomass sectors, including on the geothermal energy plant at the Eden Project.


GSW
COUNT: 166 GVA: £15.0 MILLION (data available for 46 percent of companies)75 TURNOVER: £4.3 MILLION (46 percent) EMPLOYEES: 241 (46 percent)
EMPLOYMENT LOCATION QUOTIENT: 1.79
EMPLOYMENT GROWTH (ONS): 15.9 PERCENT CAGR 2019-22
KEY LOCAL AUTHORITY DISTRICTS FOR EMPLOYMENT (ONS 2022):
PLYMOUTH (LQ 2.69)
DEVON (LQ 2.4)
CORNWALL (LQ 2.15).

DESIGN: PRODUCT, GRAPHIC AND FASHION DESIGN
GSW COMPANY COUNT:
6,754 GVA: £932.6 MILLION (data available for 66 percent of companies)
TURNOVER: £956.6 MILLION (66 percent) EMPLOYEES: 13,619 (59 percent)
EMPLOYMENT LOCATION QUOTIENT: 0.68
EMPLOYMENT GROWTH (ONS): 8.6 PERCENT CAGR 2019-22
KEY LOCAL AUTHORITY DISTRICTS FOR EMPLOYMENT (ONS 2022): CORNWALL, DORSET, ALTHOUGH BOTH HAVE LQS BELOW 1 (0.84)
When it comes to the green economy, design is a core subsector. Practical design skills are needed to reduce or reuse resources in products and buildings, and to drive behaviour change by ensuring sustainable products, services and places are an attractive choice for everyone. Designers are already designing for environmental impact: 66 percent of designers surveyed by the Design Council in 2024 said they had done so in the previous 12 months.76 The most common issues addressed were carbon emissions and the net zero transition, awareness and sustainable behaviour change (26 percent) and climate change adaptation (24 percent).
Although our data suggests design is a relatively small subsector in the GSW, it is growing faster than average. Note that fashion designers that are also fashion manufacturers and retailers, such as Cornish sustainable surfwear company Finisterre (finisterre.com) are not included in the data as they are registered under SIC codes for clothes manufacture rather than the creative industries.

FILM, TV, VIDEO, RADIO AND PHOTOGRAPHY
GSW COMPANY COUNT:
2,092 GVA: £454.5 MILLION (data available for 61 percent of companies)

TURNOVER: £278.2 MILLION (63 percent)
EMPLOYMENT LOCATION QUOTIENT: 0.38
EMPLOYEES: 4,612 (61 percent)
EMPLOYMENT GROWTH (ONS): -2.5 PERCENT CAGR 2019-22
KEY LOCAL AUTHORITY DISTRICTS FOR EMPLOYMENT (ONS 2022): CORNWALL (LQ 0.78)
Film and TV is a hugely important subsector nationally because of its GVA, productivity, and exports that contribute to the UK’s soft power.77 In the GSW, there are fewer jobs in this subsector than the national average, but recent strategic developments that replicate successful interventions in other regions are already boosting growth. The GSW has had organisations anchoring film and TV businesses for many years, including the Exeter Phoenix, which manages small grants for resident filmmakers. Most local authorities or cities have film offices, usually hosted and funded by councils and the GSW is home to some outstanding VFX (visual effects) companies, including Outpost VFX, one of the largest creative industries companies in the region. However, the GSW has been relatively slow to put in place the scale of support and incentives, skills and infrastructure that film and TV production companies need to attract them to film in the region. There are no large studios west of The Bottle Yard Studios in Bristol,78 so companies that use GSW for on-location filming go outside the region for studio filming. Large studio complexes have been proposed for locations within the GSW, but they are capital-intensive to develop and need a commitment to fill them for several years to be commercially viable. Other regions have done better in this respect: Yorkshire, for example (see 5. Comparisons) has had a Screen Agency since 2002, with a remit to attract incoming productions and develop homegrown filmmaking.
That is changing, however. Screen Cornwall (screencornwall.com), a screen agency for Cornwall, was launched in 2019 and has already scored major strategic successes for film and TV in Cornwall. This can be seen in the relatively higher than average number of film and TV jobs in Cornwall. Successes include the recognition of Kernewek (Cornish) as a minority language in the 2023 Media Bill,79 which presents a unique opportunity for Cornish production companies, and the facilitation of £16.2 million of production spend in Cornwall in 2023-2024.80 Other screen agencies as well as additional film offices are also forming across the region to lead on screen industries strategies in their areas.
IT, SOFTWARE AND COMPUTER SERVICES
GSW COMPANY COUNT:
6,754 GVA: £932.6 MILLION (data available for 66 percent of companies)
TURNOVER: £956.6 MILLION (66 percent)
EMPLOYMENT LOCATION QUOTIENT: 0.45
EMPLOYEES: 13,619 (66 percent)
EMPLOYMENT GROWTH (ONS): 4.3 PERCENT CAGR 2019-22
KEY LOCAL AUTHORITY DISTRICTS FOR EMPLOYMENT (ONS 2022): BCP
(although job counts may be overinflated owing to the high number of IT firms registered at accountancy firm addresses in BCP)
Although it is the largest creative industries subsector in the GSW, IT, software and computer services has a lower jobs share compared with Great Britain (albeit with faster growth) and a lower GVA share than the UK average. Although 43 percent of creative companies in the GSW are in the IT, software and computer services subsector, they only contribute 35 percent of GSW creative industries GVA. This is partly because GSW IT businesses are generally smaller than those in other subsectors. IT has the highest share of companies with just one employee: 39 percent, compared to 31 percent for non-IT companies.81 Many of these will be registered to accountancy firms in Dorset and BCP, and not truly resident within the GSW. But there is some indication in our dataset that GSW IT companies may be underperforming economically too: they contribute only £68,479 in GVA per employee, much lower than the most productive sectors (£90,000+) and only slightly higher than crafts at £62,095. Nonetheless, large IT companies are also among the largest creative industries companies in the GSW. They include Bournemouth-based Visor Commerce, which has raised 49.5 million investment into its rapidly growing OnBuy online marketplace.82 IT, software and computer services companies must be a strategic focus as they underpin activity and innovation across all sectors.83 Software companies such as Amutri in Penryn (see case study) and Invidar in Poole (invidar.com), together with film and TV companies and supported by universities, are building a convergent screen sector in the region. This produces visualisations, immersive and augmented reality (AR), and real-time simulations for diverse sectors including energy, defence and health. Devonport in Plymouth is home to the largest immersive dome in the UK,84 which is poised to develop collaborations with the blue and defence sectors.

MUSEUMS, GALLERIES AND LIBRARIES
(data
EMPLOYMENT LOCATION QUOTIENT: 1.28
EMPLOYMENT GROWTH (ONS): 20.5 PERCENT CAGR 2019-22
KEY LOCAL AUTHORITY DISTRICTS FOR EMPLOYMENT (ONS 2022): CORNWALL, DORSET, SOMERSET


MUSIC, PERFORMING AND VISUAL ARTS
GSW COMPANY COUNT:
2,489 GVA: £415.1 MILLION (data available for 52 percent of companies)86

TURNOVER: £212.6 MILLION (59 percent)
EMPLOYMENT LOCATION QUOTIENT: 0.68
EMPLOYEES: 4,726 (52 percent)
EMPLOYMENT GROWTH (ONS): -1.3 PERCENT CAGR 2019-22
KEY LOCAL AUTHORITY DISTRICTS FOR EMPLOYMENT (ONS 2022): PLYMOUTH (LQ 1.01)
Note that the GVA and employee estimates for this subsector are based on a substantially smaller number of companies and so are not comparable to turnover.
The GSW should develop its unique strengths in music, performing and visual arts. It is already a strong subsector in the GSW by GVA share (see Economic impact above), though employment location quotients are lower than they should be. The exception is Plymouth, which is home to Theatre Royal Plymouth, one of the ten largest creative industries businesses in the GSW. The GSW is home to the 210,000-capacity Glastonbury Festival, the largest greenfield music and performing arts festival in the world. Other major festivals include Boardmasters (capacity 58,000), Sidmouth Folk and Sidmouth International Jazz and Blues festivals, and Summer Sessions on Plymouth Hoe. The region is also home to the Bournemouth Symphony Orchestra, which is receiving its largest annual Arts Council England grant in 2023-26 (see 4. Investment).
The South West region (including Bristol and Bath) is ranked second behind London for music tourism spend and employment, and third for the number of tourists attending live music events (behind London and the North West). Moreover, the South West accounts for 10 percent of all UK gig, concert and festival visits, 11 percent of music tourism spend and 14 percent of employment. The number of music tourists coming to the South West increased 86 percent between 2022 and 2023, from 1.1 million to 2 million. 87
In theatre, the GSW is home to some very distinctive venues and producers. Theatre Royal Plymouth (TRP) is not only one of the UK’s largest regional producing theatres, but also builds sets for other national and international productions at its TR2 Production and Learning Centre on the waterfront in Cattedown. In Ilfracombe, North Devon, the doubleconed Landmark Theatre became an NPO for the first time in 2023 to support its work with communities. In Cornwall, a long tradition of site-specific theatre, exemplified by theatre companies including Wildworks, is also symbolised by the spectacular open-air Minack Theatre in Porthcurno. Home to the Bournemouth Symphony Orchestra, Poole’s Lighthouse multi-arts venue is one of the largest in the South West.
PUBLISHING
GSW COMPANY COUNT:
1,118 GVA: £160.2 MILLION (data available for 55 percent of companies)88
TURNOVER: £75.9 MILLION (60 percent)
EMPLOYMENT LOCATION QUOTIENT: 0.56
EMPLOYEES: 1,741 (55 percent)
EMPLOYMENT GROWTH (ONS): -5.3 PERCENT CAGR 2019-22
KEY LOCAL AUTHORITY DISTRICTS FOR EMPLOYMENT (ONS 2022): DEVON, DORSET (BUT BOTH LQS BELOW 1, AT 0.76 AND 0.75)
Note that the GVA and employee estimates for this subsector are based on a substantially smaller number of companies and so are not comparable to turnover.
Publishing in the GSW reflects the state of publishing nationally, which is experiencing a decline in jobs as the subsector continues to pivot to digital and adopt new business models. One of the largest creative industries businesses in the GSW is equity-backed Kortext (kortext.com), based in Bournemouth. Kortext is a leading online learning platform and supplies digital textbooks to students globally. Exeter is one of five UNESCO Cities of Literature in the UK, 89 which reflects the GSW’s international contribution to literature. Torbay-born Agatha Christie is still regarded as the bestselling author of all time90 and many other writers of world standing from Thomas Hardy, to Michael Morpurgo to Hilary Mantel have made the GSW their home. These four writers have in common extensive adaptation of their work in other media. Extensive literary archives and expertise in IP (intellectual property) exploitation, make the universities well placed to support the region’s publishing industry to explore cross-media exploitation of content and establish successful new business models.
INVESTMENT
Creative industries companies in film and television, music, software and games can yield substantial investment returns through recurring and multiple revenue streams, while digital media can be highly lucrative due to the scalability of digital products. Venture capital (VC) funding in UK createch businesses exceeded a forecast of £1.12bn to reach £1.14bn in 2021, according to data from Tech Nation.91 UK creative industries have generated several unicorns (companies valued at over US$1 billion), including games companies Playdemic 92 and Improbable.93
While there are publicly-funded equity funds, most public sector programmes are aimed at enabling markets to work effectively and reducing barriers to growth, rather than directly investing in companies. In this way, public investment underpins the creative industries and public ‘returns on investment’ are seen through the positive contribution of the creative sector to the UK economy, in terms of the number of jobs, GVA, and growth compared to the economy as a whole.
The case for investment in the creative industries was neatly summarised in the Council of Science and Technology’s recent advice to the Government.94 It describes the creative industries as an economic and cultural success story, quoting that the creative industries delivered more economic value than the life sciences, aerospace and automotive sectors combined. Further evidence of the health and potential of the creative industries is noted in its:
⦁ High level of R&D: creative industries spend 3.2 percent of the sector’s GVA on R&D, higher than the UK average (2.3 percent).
⦁ High spillover potential: The report notes that R&D in the creative industries has produced spillover benefits in sectors as diverse as defence, agriculture, healthcare and education. It also recognises the creative industries as important generators of new ideas and knowledge with significant growth potential in subsectors that combine science and technology with arts and humanities.
Further, the multiplier impacts of the creative industries are considered to be relatively high. In considering the overall economic impact of the creative industries, Oxford Economics95 note that the contribution of the creative industries is larger than its direct employment and GVA contribution through procurement and supply chain impacts. Their report states that for every 10 jobs in creative industries, a further seven are supported in other sectors. For every £1 contributed in GVA, a further £0.5 is generated in other sectors.
The largest channel for public investment in the creative industries is Creative Industries Tax Relief. There are plans to merge them into one, but the UK government currently has eight separate tax relief programmes to support creative industries businesses: Film Tax Relief (FTR)
⦁ Film Tax Relief (FTR)
⦁ High-end Television (HETV) Tax Relief
⦁ Animation Tax Relief (ATR)
⦁ Video Games Tax Relief (VGTR)
⦁ Children’s Television (CTV) Tax Relief
⦁ Theatre Tax Relief (TTR)
⦁ Orchestra Tax Relief (OTR)
⦁ Museums and Galleries Exhibition Tax Relief (MGETR)
In the financial year 2022-23, £2.2 billion was paid out in these tax relief schemes across all creative industries companies nationally, up from £1.9 billion in 2021-22.96 High-end TV includes large-budget productions for international streamers such as Netflix, Amazon, Disney and Apple. It dwarfs the other schemes in terms of payouts. In 2021-22, it took over from film as the scheme rewarded the most tax relief. No regional breakdown of creative industries tax relief data is available, but the heavy weighting towards high-end TV, film and video games shows regions with many companies in screen industries will benefit the most from tax relief schemes.
96. MRC: Creative industries statistics commentary: August 2024 Published 29 August 2024. Data
Figure 22: High-end TV gets the most tax relief Tax relief paid, £m
MEASURING RETURN ON INVESTMENT
The DCMS and others have attempted to measure the outcomes and impacts of specific programmes and investments. However, given the very different investment and sector types, broad industry-wide return on investment (ROI) figures, in terms of GVA or jobs, are difficult to ascertain. It is easy to appreciate that the ROI in crafts would be different to that in gaming for example, with very different risks. What we can do is to point to broad indicators, and pinpoint examples.
Probably the best overarching measure of expectation of investment return lies in the amount of private capital that is attracted to public sector investment. Private sector co-investment in public programmes clearly demonstrates that the private sector can see the benefits of the activity and believes the investment will benefit them, directly or indirectly. At an industry level, the value of co-investment is probably the best broad indicator of potential return.

Creative Industries Clusters Programme
The most significant UK public programme to support clusters that has attracted coinvestment has been the Creative Industries Clusters Programme from the Arts and Humanities Research Council (AHRC) and UKRI.97 The first wave ran from 2018 to 2023, with a public investment of £61 million, including £55 million to universities. Its goal was to anchor nine regional creative industries clusters by delivering interventions at a local level. This included R&D support and devolved grant funding to SMEs.98 Most of the nine clusters had a subsectoral as well as regional focus – for example in video games, film and TV, or fashion. All had strong underpinnings from IT, software and computer services. The Clusters Programme was designed to build links between research in universities and the creative industries and deliver regional economic benefits associated with R&D cluster development, including building the capacity of creative businesses to exploit technology and data-driven innovation.
An analysis of Clusters Programme data suggests businesses were able to leverage £57 million of co-investment, follow-on funding, or investment from public and private sources over the course of the programme, a ratio of 1:1,99 with public and private coinvestment at a ratio of 1:4.6.100 Information self-reported by businesses engaged in the clusters suggests there were 107 spin-outs, start-ups and scale-ups and 3,413 jobs were created or safeguarded. The Clusters Programme has also helped to identify the types of partnerships that are critical for developing clusters, namely local authorities, cultural organisations, creative businesses including large companies and micro businesses, and higher and further education institutions.
A second AHRC R&D investment programme is Convergent Screen technologies and Performance in Realtime (CoSTAR).101 It supports immersive R&D facilities over 2023 to 2029 and recently attracted similar amounts of private sector investment. Public investment of £75.6 million attracted co-investment of £68 million, a ratio of 1:0.9. (This excludes any follow-on investment.)
In 2023, DCMS published its Creative Industries Sector Vision with a target to grow the creative industries by £50 billion and an additional one million jobs by 2030.102 This committed the government to investing £50 million in a new round of the Clusters Programme. A pre-announcement since the election has confirmed there will be a call for regional bids led by universities in spring 2025.103
PUBLIC AND PRIVATE FUNDING OF THE GSW CREATIVE INDUSTRIES
Creative businesses and cultural organisations across the GSW have benefitted from devolved funding, including Shared Prosperity Funds and Town Deals. They also receive funding directly from national government bodies, including UK Research and Innovation (UKRI) R&D grants, Arts Council England core funding and project grants, and HMRC creative industries tax relief schemes. Regional interventions targeted at creative industries companies can help them capture external funding. In this section, we outline the main sources of additive funding and investment for GSW creative industries (not Shared Prosperity Funding) and describe some recent successful interventions in the creative industries in the region.
Create Growth Programme
The Create Growth Programme (CGP) was designed to help address barriers to accessing finance in the creative industries (see Section 6 Barriers to growth) outside London. It supports management development, R&D grant applications and investment. Launched in 2022 by DCMS in partnership with Innovate UK, the CGP provided six regions with £1.275 million each. Cornwall and the Isles of Scilly received CGP funding in 2023 as part of a ‘West of England’ region that also included Bristol, Bath and North East Somerset, North Somerset and South Gloucestershire.104 In 2024, the programme was extended to six more geographical areas, with an additional £10.9 million of funding provided. Devon joined the CGP in March 2024 and DCMS has recently announced that 13 businesses in Devon successfully won £30,000 each in funding from the Create Growth competition in 2024 (although this was an open competition, and not all these businesses were on the GCP).105 Participating businesses also have the opportunity to access part of a finance growth support fund totalling £9 million in the financial year 2024-25.106 The programme is scheduled to finish in March 2025.
Innovate UK
Innovate UK, part of UKRI, is the UK’s ‘innovation agency’.107 It awarded £54.6 million of R&D grants to organisations with an address in the GSW (including universities) between 200405 and 2022-23. Almost £5.2 million of this (9.5 percent) went direct to companies in the creative industries, almost all of them SMEs, across 99 grants (we excluded grants direct to universities from this list).108 In 2022-23, 24 GSW-based creative industry SMEs captured £1.7 million of Innovate UK grant funding. Almost £700,000 of this – or 41 percent – went to 10 companies based in Cornwall, where Cornwall Council’s industrial strategy has targeted interventions at creative businesses for a number of years.109
The Innovate UK funding received by GSW creative industries companies has surged each year since 2020 (Figure 24). Over the last few years, UKRI has launched national competitions with small grants targeted at creative industries SMEs, including a Creative Catalyst110 fund and the Create Growth111 fund, as well as Women in Innovation112 and Young Innovators113 competitions, which have been won by creative industries entrepreneurs in the GSW, suggesting an increased capacity for innovation. However, there were no Innovate UK grants awarded to GSW creative industries companies in 2018-19 and 2019-20. These years coincided with the launch of the Creative Industries Clusters Programme, also funded by UKRI, which suggests that UKRI may have diverted its funding for creative industries SMEs to the nine flagship cluster regions of the Clusters Programme. As the GSW was not among the nine selected, not only did the GSW creative industries fail to gain around £7 million in Clusters Programme funding, they also may have lost more than £1 million in Innovate UK money.
104.
Figure 23: Over 40 percent of Innovate UK grant money in 2022-23 went to Cornwall
Figure 24: The GSW received no Innovate UK funding in 2018-20, but grants have surged since
Arts Council England
Arts Council England (ACE, artscouncil.org.uk) is one of the most important sources of funding for non-commercial organisations. Non-commercial organisations include museums, galleries and cultural centres. They help to anchor commercial creative industries clusters and develop a skilled workforce that moves between non-commercial and commercial subsectors. Every three years, ACE provides grant funding to selected organisations – designated as National Portfolio Organisations (NPOs) or Investment Principles Support Organisations (IPSO) – to be allocated to core funding. In February 2022, the Government instructed the Arts Council to redistribute more of its National Portfolio funding from London to other parts of England from London, starting from 2023.114
In the 2023 round of NPO selections, the Arts Council committed investment of £445 million a year over the 2023-26 period to 985 organisations across England. Just 3.3 percent of this, or £14.5 million a year, has been awarded to 42 organisations in the GSW. Twentyfour percent of this (£3.5 million a year) is going to eight theatre organisations, with 18 percent (£2.6 million) to one music organisation – The Bournemouth Symphony Orchestra – and the same amount to 14 organisations working in combined arts (Figure 25).
Figure 26 shows that, by local authority district, 28 percent of GSW total Arts Council funding, or £4.1 million a year, is going to organisations based in Plymouth, with BCP close behind on 27 percent (£3.9 million). The Bournemouth Symphony Orchestra accounts for two thirds of the BCP total: its £2.6 million grant is the single largest awarded to a GSW organisation. The Arts Council has a target to distribute a larger share of funding to English locations designated as Levelling Up for Culture Places. In the GSW, these are North Devon, Torridge, Torbay and Somerset. In total, organisations in these local authorities have been awarded £2.1 million per year for 2023-26. This is up sharply from £0.5 million a year in 2018-22, thanks mainly to new grants of £1 million to Landmark Theatres in North Devon and £0.25 million to Octagon Theatre in Somerset.
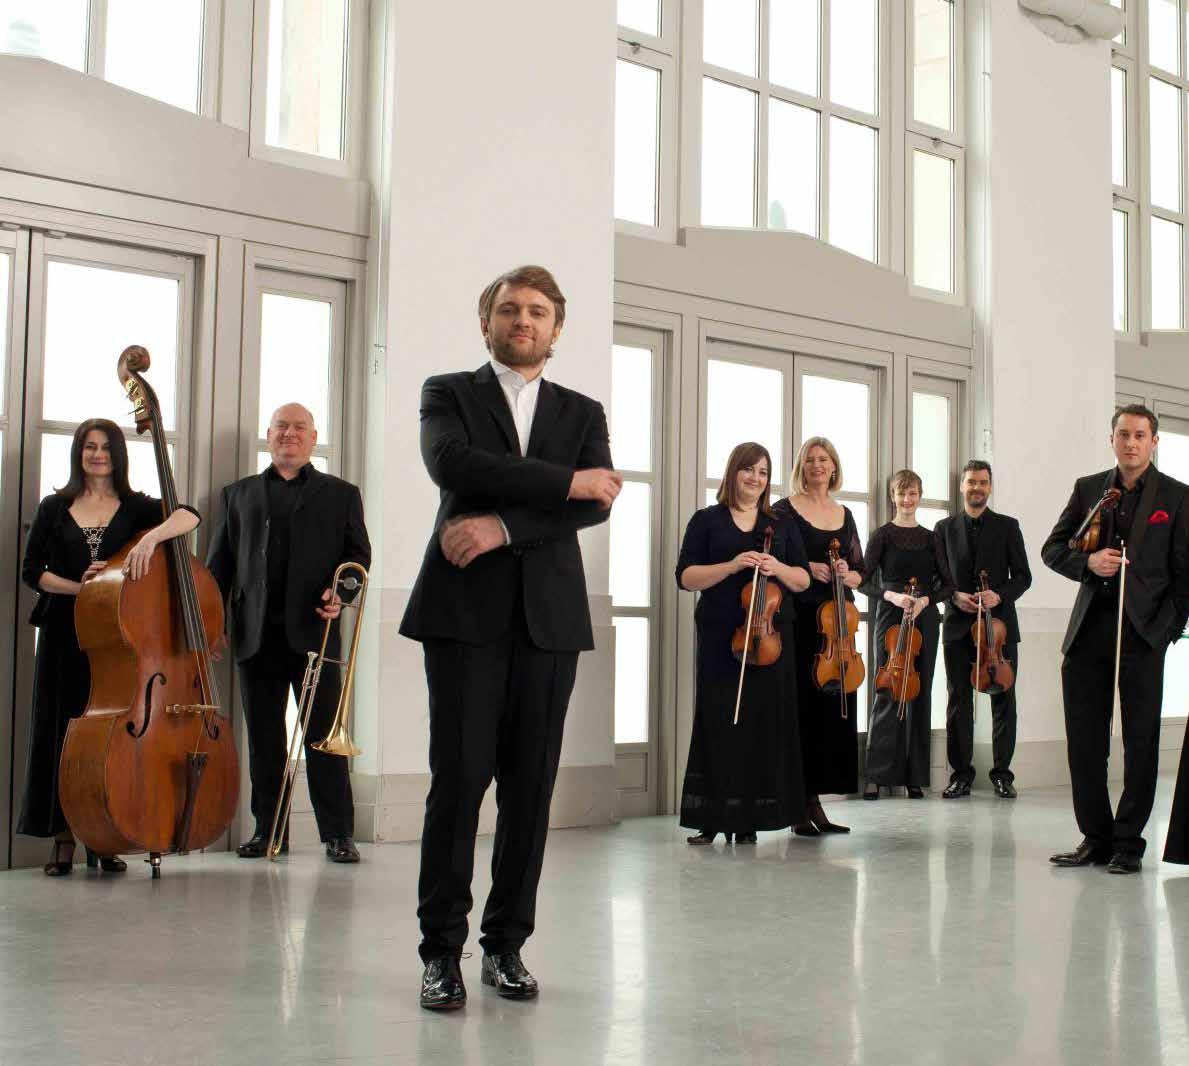
114. Arts Council: Priority Places and Levelling Up for Culture Places
Figure 25: Almost a quarter of annual GSW Arts Council funding in 2023-26 is going to theatre
Figure 26: Over a quarter of annual GSW Arts Council funding in 2023-26 is going to Plymouth
University research income
The six GSW universities received £33.6 million of research grant funding in the three years 2021-22 to 2023-24.115 These universities committed £9.4 million of match funding alongside these grants, with an additional £2.1 million coming from third-party businesses and organisations, bringing the total match over three years to £10.7 million.116
Equity and loan funding
Limited data is available for angel and private equity investment and retail bank loans for the creative industries in GSW. However, publicly funded equity and loan funds have been available in the GSW since 2018.
CLOSIF
The Cornwall and Isles of Scilly Investment Fund (CIOSIF, ciosif.co.uk) was a £40 million loan and equity fund backed by the European Regional Development Fund and the European Investment Bank. It aimed to fill the investment gap in Cornwall and Isles of Scilly resulting from a poor understanding of investment and weak supply of private sector finance. It started investing in 2018 and closed for new investments in December 2023. The average investment per company was £280,000 and 68 percent was in equity. It is too early to evaluate returns from the fund, but evidence gathered for the interim evaluation suggests CIOSIF has had a positive impact on the investee businesses, with nearly half securing follow-on funding from other funds.117
Three of the investee businesses were in arts, entertainment and leisure, and 13 in information and communication. They include Bosena (bosena.co.uk), an independent film production company based in Penzance that received £100,000 in debt finance from CIOSIF, used as working capital to develop the business. In 2022, Enys Men, Bosena’s feature film by BAFTA-winning director Mark Jenkin, premiered at Cannes Directors’ Fortnight where it sold to multiple territories worldwide. It was released to critical acclaim in 2023, generating a global box office of $583,000 to date.
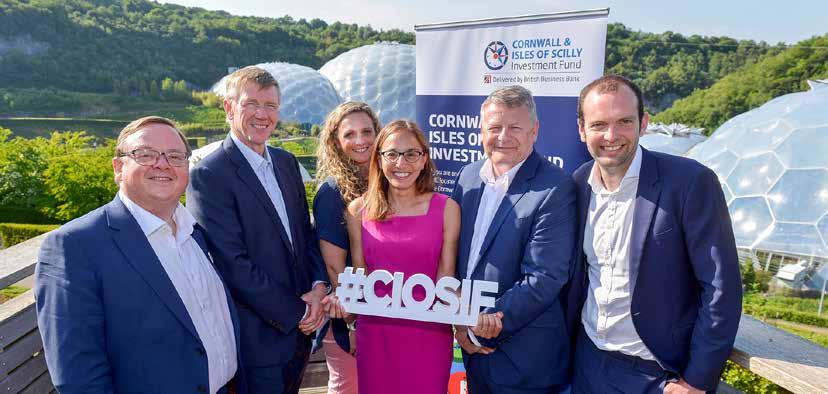
South West Investment Fund
Following on from CIOSIF, the British Business Bank launched the £200-million South West Investment Fund as one of its Nations and Regions Investment Funds in July 2023.118 It provides loans from £25,000 to £2 million and equity investment of up to £5 million across the entire South West region. Among the first investments announced is Truro-based childrens’ book publisher Hungry Tomato (hungrytomato.com).119 Founded in 2015, Hungry Tomato received an £84,000 loan to buy more stock and support working capital to publish more books in 2024. The South West Investment Fund has also funded Exeter-based VR company Cineon that develops VR applications for health and security sectors (see iSave case study).

The launch of the British Business Bank’s South West Investment Fund (SWIF), July 2023.
The Cornwall and Isles of Scilly Fund (CIOSIF), pictured summer 2018.
‘Plant’ book cover ©Hungry Tomato Published by Hungry Tomato.
Author: Annabel Griffin, Illustrator: Tjarda Borsboom.
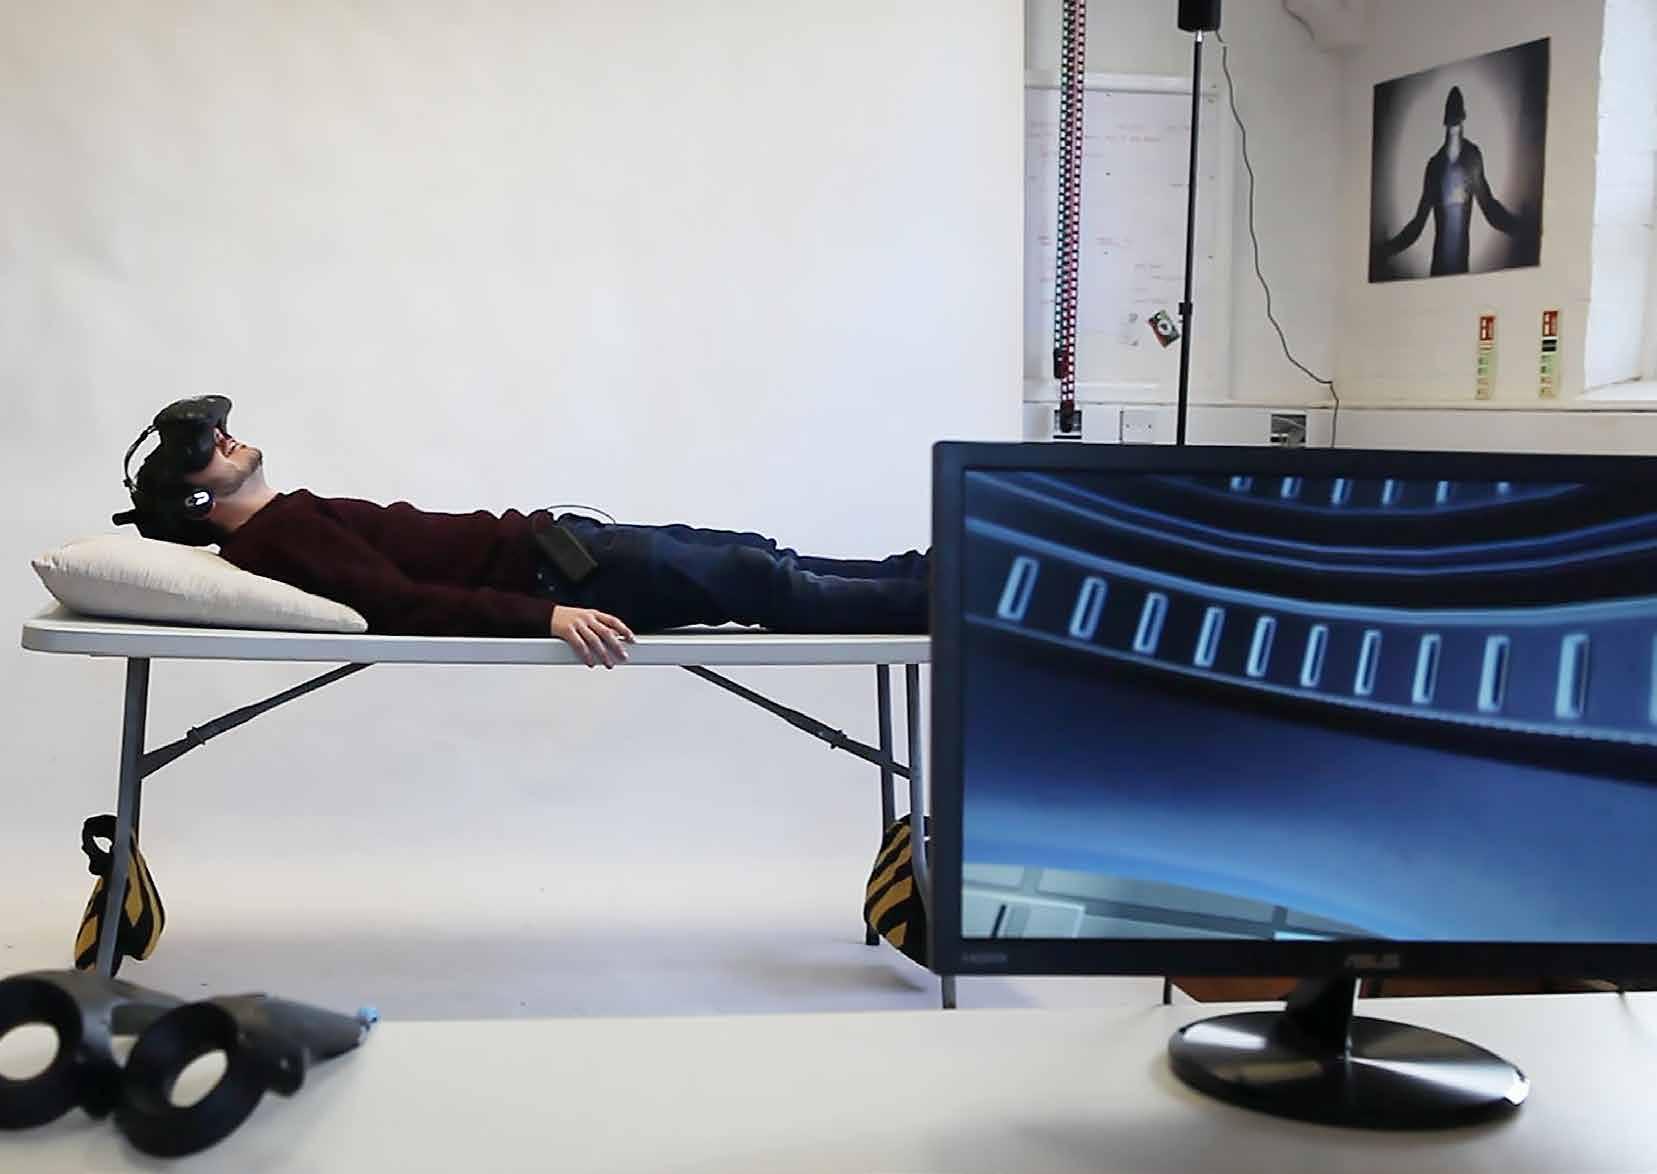
CASE STUDY: CINEON
Exeter-based immersive technology company Cineon (cineon. ai) has developed iSAVE - a VR-powered MRI simulation that familiarises patients with the scanning process before their hospital appointment. Designed to reduce cancellations, improve scan quality, and enhance patient comfort, iSAVE integrates eye-tracking and dynamically adapts to anxiety levels in real time, providing personalised exposure therapy to ease stress and uncertainty.
Missed MRI appointments cost the NHS over £11 million annually, leading to delays in diagnosis and treatment. By reducing patient anxiety and acclimatisation time, iSAVE improves efficiency, increases throughput, and lowers costs for healthcare providers. Developed in collaboration with University Hospitals Plymouth NHS Trust, Torbay and South Devon NHS Trust, Story Juice (storyjuice.co.uk), and the University of Exeter, iSAVE is backed by UKRI’s Mindset XR programme, supporting the use of VR therapies to enhance mental health.
Powered by Cineon’s proprietary Emotion AI, ELE, iSAVE also enables remote patient monitoring, offering realtime emotional insights to support clinicians in virtual consultations. Cineon recently secured £900,000 in funding, including a £400,000 investment from the South West Investment Fund, to expand its team and further advance data-driven healthcare solutions. iSAVE is shaping the future of patient-centred, technology-driven healthcare.
COMPARISONS
How do the creative industries fare elsewhere?
The GSW can learn how to grow its creative sector from other regions where it has been prioritised. Nowhere provides a perfect model. However, there are many examples of programmes designed to help the creative industries by removing barriers to finance, developing skills and targeting priority subsectors. They are often brought together under brands – both to internalise a belief in a region’s creativity, and to sell it externally as a creative cluster in order to attract national funding. Many elements of these programmes could be adapted for use in the GSW.
NORTH EAST COMBINED AUTHORITY
About the region
The North East Combined Authority (CA) provides a good comparison to the GSW. The North East Local Enterprise Partnership (North East LEP) was established in 2011 as a public, private, voluntary and education sector partnership responsible for promoting and developing economic growth in the local authority areas of County Durham, Gateshead, Newcastle, North Tyneside, Northumberland, South Tyneside and Sunderland. On 7 May 2024, the role and responsibilities of the North East LEP were merged into the new North East Combined Authority (North East CA), which covers exactly the same local authority districts.123 The North East CA sits entirely within the wider North East region, which also includes the local authority districts of Darlington, Hartlepool, Middlesbrough, Redcar and Cleveland, and Stockton-on-Tees.
The North East CA is about two-thirds the size of the GSW in population terms, with a mid-2023 population of 2.0 million compared to the GSW’s 3.2 million.124 It has a similar mix of urban, rural and coastal geography to the GSW, and its creative industries are at a comparable stage of development. In the 2021 census, the proportion of people employed in creative occupations in the North East CA, at 4.1 percent, was similar to the GSW’s 4.4 percent (compared to 5.9 percent for England).125 (Note that creative occupations only partially overlap with employment in the creative industries – see Annex 1.1.2 for the definitions of creative industries and occupations). Creative industries employment counts are also around two-thirds the GSW’s: around 23,200 people in the North East CA worked in the creative industries in 2022, compared to over 36,000 in the GSW in 2022, based on ONS data.126 (Our analysis indicated around 34,600 in the GSW in mid-2024). But jobs growth in the North East CA has been less healthy than in the GSW: creative industries employment fell 7.9 percent between 2015 and 2022 (-1.2 percent CAGR), compared to 20.9 percent growth in the GSW, or 2.8 percent CAGR (Figure 27). Growth since 2019 has been sluggish, at 1.0 percent CAGR compared to 4.1 percent in the GSW.

Figure 27: Creative industries employment in the North East CA fell between 2015 and 2022
A ‘creative challenger’
Newcastle was recognised by Mateos-Garcia et al (2018) as a ‘creative challenger’, a category that also includes Bristol, as well as Birmingham, Edinburgh and other UK cities, mostly outside London and the South East.127 Creative challengers, the authors write, “have experienced fast creative growth in recent years and are on track to become central nodes within the UK’s creative geography”. They continue: “These locations have gained creative specialisation recently, and have diverse ecosystems with some high-growth firm presence”. Commenting on the earlier research, Frontier Economics note that creative challengers ‘‘score higher than the UK average on innovation and access to talent. For these areas, [...] it is access to finance, exporting and the broader environment that appear to be weaknesses. In particular, travel-to-work times are longer in these areas, and there is a smaller share of jobs in knowledge-intensive service industries that might generate spillover benefits”.128
To address these challenges, the North East has a strategy with a number of programmes targeted at the creative industries. They include the North East Screen Industries Partnership (NESIP) with Tees Valley, which is investing £11.4 million over five years to facilitate the strategic development of the film and TV subsector in the region, with a goal to double its share of the UK production market.129 In 2021, NESIP signed a Memorandum of Understanding with the BBC to commit them to working together.
Cultural and Creative Zones
A key element of the North East’s strategy is a five-year (2022-2027) place-based approach to developing cultural and creative zones (CCZs), namely a Creative Central zone in Newcastle,130 a Cultural Quarter in North Shields131 and Create Berwick in Berwick Upon Tweed, Northumberland.132 An investment of £1.7 million in Creative Central is focused on making central Newcastle a creative hub equal to longer-standing creative districts in the city like Ouseburn. The goal is to “retain local talent, attract investment and create jobs, which will together act as a catalyst for the growth of the cultural economy and the city’s wider economy”, according to Councillor Alex Hay, Cabinet member for a Thriving City at Newcastle City Council.133
A £1.5-million investment in the Berwick CCZ aims to create a focal point for the strategic coordination of cultural and creative projects in Berwick and Northumberland, which are home to eight Arts Council NPOs, and to deliver on a vision to grow their microclusters. The Cultural Quarter in North Shields is part of a plan to capitalise on the town’s existing community of cultural and creative businesses and practitioners, to grow the creative economy and drive town centre regeneration. It aims to create a vibrant cultural corridor that links the town centre with the Fish Quay (a coastal port close to the mouth of the Tyne) and the North Sea coast.
North of Tyne Culture and Creative Investment Programme
Before the North East CA was formed, there was already a large ecosystem of business support in the North East providing advice and grants, delivered by in-region organisations. However, the North East CA has fostered and expanded its relationship with Creative UK to provide specialist expertise to the creative sector and leverage in external investment from Creative UK’s own investment funds.134
In 2021, the North East CA funded the North of Tyne Culture and Creative Investment Programme, a £2-million loan and equity fund for growth-minded businesses in the creative and cultural sector, and contracted Creative UK to manage it.135 Although the programme’s loans and equity investments are limited to between £50,000 and £150,000, Creative UK can co-invest from its UK-wide Creative Growth Finance loan fund, backed by Triodos Bank, on a business-by-business basis. This enabled a £750,000 investment round for Venture Stream (venturestream.co.uk), a digital agency in Newcastle.
Other programmes
In 2023, the North East captured £1.275 million in the first wave of the DCMS Create Growth Programme (see 4. Investment). It was managed by Creative UK, as in Cornwall and Devon. Continuing its relationship with the North East, in August 2024, Creative UK launched the North East Shared Success Fund financed by the CA, in a new investment initiative.136 This fund provides £25,000 of interest-free loans to creative industries SMEs to help them test ideas and develop new products or services, and is designed to fill the gap between creative grants and loan schemes. Businesses repay the money, interest-free, once their project succeeds or they reach a turnover threshold. Finally, Newcastle University is home to the Creative Industries Policy and Evidence Centre (PEC) and Newcastle and the North East are leading drivers of the One Creative North creative corridor, stretching from Liverpool to Newcastle via Manchester, Sheffield and Leeds.137
127. Mateos-Garcia, J., Klinger, J., and Stathoulopoulos, K. (2018).
Nation: How the Creative Industries are Powering the UK’s Nations and Regions. London: Nesta. (PDF). 128. Frontier Economics and DCMS: Understanding the Growth Potential of Creative Clusters (PDF). Published August 2022.
WEST YORKSHIRE
About the region
The metropolitan county and combined authority of West Yorkshire comprises the districts of Bradford, Calderdale, Kirklees, Leeds and Wakefield and is home to 2.4 million people (versus the GSW’s 3.2 million).138 It has a £58 billion regional economy that includes the urban areas of Leeds, Bradford, Huddersfield and Wakefield. Its creative industries are worth £2 billion to the regional economy 139 – comparable to our GSW estimate of £2.7 billion. Its creative sector employed 42,800 people in 2022 (48,000 according to more recent promotional literature),140 making it slightly larger than the GSW (36,000 in 2022).141 Job growth rates over 2015-22 are virtually identical to the GSW’s, with both at 2.8 percent CAGR (see Figure 27).
‘You Can Make It Here’
The West Yorkshire Combined Authority was chosen as a Create Growth Programme region in 2024. Leeds was recognised by Mateos-Garcia et al (2018) as a ‘creative capital’ – cities where large and medium-sized creative businesses are more important, with a bigger share of high-growth firms.142 West Yorkshire Metro Mayor Tracey Brabin – a former actor and writer – is a vocal champion of the creative industries in West Yorkshire and another driving force behind One Creative North. Alongside the announcement of £520,000 of funding from DCMS for the Create Growth programme, in January 2024 Brabin announced a £2.3 million support package from the West Yorkshire CA to grow the sector as part of the region’s newly-branded ‘You Can Make It Here’ strategy.143
West Yorkshire has deep subsectoral skills in film and TV, delivered by Screen Yorkshire for more than 20 years. Today, these are coming together with the digital subsector and a live performance campus in Wakefield to create the UK’s highest-profile future-facing virtual production and convergent screen cluster outside the M25.144

Screen Yorkshire
Screen Yorkshire (screenyorkshire.co.uk) was established in 2002 to drive the screen industries in the region. It supports UK and international film and TV productions to film in Yorkshire, dealing with hundreds of filming days a year and providing commercial investment through its Yorkshire Content Fund. Listed as one of the 10 most influential film funds in Europe, the Yorkshire Content Fund has generated over £225 million of production spend by part-financing more than 50 productions.
Screen Yorkshire also delivers training and development programmes to foster talent and build a skilled workforce for the screen industries. It has come together with North East Screen, Screen Manchester and Liverpool Film Office to form Screen Alliance North (screenalliancenorth.co.uk), the lead skills body for the North of England, to tackle skills shortages and improve access to training for diverse talent and communities. In April 2023, Screen Alliance North won £2.3 million from the British Film Institute’s (BFI) National Lottery fund to become a BFI Skills Cluster, with the goal of making the screen sector more accessible and representative.
In 2018, a partnership between Screen Yorkshire and the BFI, led by University of York, won one of the nine Creative Industries Clusters. Called XR Stories, the £15 million co-investment with AHRC aimed to establish the Yorkshire and Humber screen industries cluster as the UK centre of excellence in immersive and interactive digital storytelling.145 XR Stories now includes a new city-based R&D space in York to support businesses focused on immersive storytelling activities and skills development, working with corporates including WarnerMedia, Sky Studios and BBC R&D.
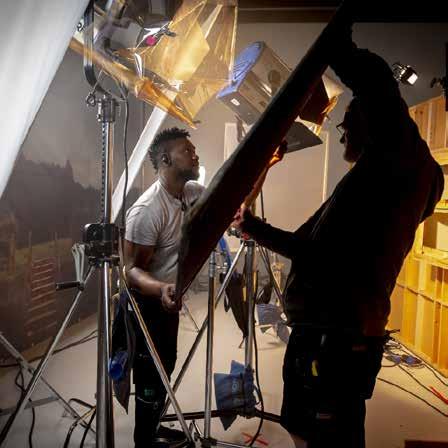

145. XR Stories - Creative Industries Clusters Programme
Screen Yorkshire’s Beyond Brontës: The Mayor’s Screen Diversity Programme Photography: Jonny Walton
©Kick Rocks Creations
©Tileyard North
©Damian Griffiths courtesy of Hawkins/Brown
©Damian Griffiths courtesy of Hawkins/Brown
Channel 4 headquarters
In 2018, Leeds beat Manchester and Birmingham to win the bid for Channel 4’s new headquarters when the public service broadcaster decided to move its national headquarters under pressure of a proposed sell-off.146 It was secured thanks to the efforts of the Leeds City Region Enterprise Partnership and West Yorkshire CA, and to the strength of its existing production sector, combined with a strong digital subsector in Leeds. When announcing the decision, Alex Mahon, Channel 4 Chief Executive, said: “Locating our National HQ in Leeds enables us to capitalise on a strong and fast-growing independent production sector in cities across the North of England”. Channel 4 also said the strong digital talent pool would help support a new Digital Creative Unit for Channel 4.147
As well as creating 200 direct jobs, Channel 4’s new headquarters – on the site of a former Leeds nightclub – has prompted significant public and private investment in production companies, post-production and training facilities across the region.148 True North, one of the UK’s largest independent factual production companies, underwent a massive expansion, adding 4,000 square feet of production facilities and office space. Versa Studios added 130,000 square feet of studio space to its existing 100,000 square feet. To coincide with the relocation, and support newer entrants to the creative industries, West Yorkshire launched a £1.5-million Creative Catalyst business support programme with Screen Yorkshire, which gave business support to 26 production and gaming businesses and provided an indie TV and development fund that funded 22 projects across 13 businesses. Initial forecasts suggest that, over 10 years, Channel 4’s presence in Leeds will add £1 billion to the regional economy and create a further 1,200 skilled jobs in the creative industries sector and supporting industries.
Published November 8, 2023.

Production Park, Wakefield
While the example of Screen Yorkshire shows the impact of public investment, Wakefield’s Production Park (productionpark.co.uk) is a spectacular example of how socially responsible private investment can make a difference. Production Park is located on a former industrial estate in South Kirkby, Wakefield. It began as a stage-building business, founded by scaffolding entrepreneur Adrian Brooks in 2006, and has evolved into Europe’s first live events campus.149 It is a creative industries ecosystem that has helped develop and regenerate the creative industries in Wakefield. One instance of this regeneration is Tileyard North (tileyardnorth.co.uk), a creative industries community home to recording studios, offices, and event and hospitality spaces.
Production Park designs and builds arena stages and provides rehearsal space, including arena-sized spaces, for the world’s biggest touring artists. In 2023, more than 100 productions – from theatre shows to global stadium tours – were built in Wakefield. Production Park was also involved in a number of major film productions in 2023 and secured a film production on-site for 2024. Its parent company, Production Park Holdings, had a turnover of £24.7 million in 2023.150 At the heart of the campus sit 15 independent live events businesses, offering services such as tour catering and lighting.
In 2011, Production Park created its own education centre, then called the Backstage Academy, offering live events and production degree courses. It provided skills to businesses and put students at the heart of industry. From 2011 to 2021, the Academy delivered University of Bolton degrees under franchise. From 2021, it has been a registered provider with the Office for Students, validated by the University of Bolton, and in 2023 it changed its name to the Academy of Live Technology 151. Over the next few years, it plans to apply for New Degree Awarding Powers (NDAPS). In August 2024, it also opened a new education centre at Rock Lititz, which is the equivalent of Production Park in Pennsylvania, USA, in a partnership with Pennsylvania College of Art & Design. The same year, it also hosted over 400 learners from the West Yorkshire community for free, to widen access.
Another Production Park business is XPLOR (xplor.one), which pioneers R&D in stage and screen industries, offering services to clients including technical consultancy, project management and networking, with core capabilities in virtual production, unreal (games and visual) development, immersive experiences, concept and product design, software controls and automation, prototyping, testing and audio. XPLOR received grant funding from the European Regional Development Fund (ERDF) and DCMS to open a £7-million facility in Autumn 2022. It boasts large-scale design and prototype spaces for testing, modelling, and building physical and virtual environments and includes an open access Centre for Virtual Production, the first extended reality facility in Yorkshire.
In August 2023, XPLOR received further co-investment from UKRI to develop its virtual production R&D facilities as part of the UKRI’s Convergent Screen Technologies and Performance in Realtime (CoSTAR) programme, which is supported by £75.6 million of government funding and £63 million of new industry investment (See Section 4: Investment).152 The CoSTAR Live Lab was secured from UKRI by a consortium that brings together Production Park and Screen Yorkshire, with the University of York, Wakefield Council, Vodafone, York and North Yorkshire Local Enterprise Partnership (LEP).
146. Prolific North: First pictures revealed as Channel 4 opens new national headquarters in Leeds Published September 6, 2021.
147. Screen Yorkshire: Leeds Wins Bid for Channel 4 National HQ. Date unclear.
148. Prolific North: Five years on after Leeds wins bid for Channel 4’s national HQ: Has it lived up to expectations?
POTENTIAL
What are the challenges and opportunities for the GSW creative industries?
Creative industries companies in the GSW face many of the same barriers to growth, such as access to finance, experienced by creative businesses across the UK. The GSW’s poor infrastructure and distance from London – home to powerful companies in the supply chain – present additional region-specific challenges. And yet the creative sector in the GSW has some remarkable strengths. Taken together, the challenges suggest specific interventions that will support economic growth while the strengths present real opportunities to bring benefits to the region.
BARRIERS TO GROWTH
Frontier Economics analysis
When it comes to the creative industries, the GSW has some remarkable strengths to build on.
In 2022, DCMS published a review by Frontier Economics to support local areas across the UK to become hubs of creative activity and contribute to the then-government’s levelling up agenda.153 It builds on earlier creative clusters identified by Nesta,154 and measures the barriers to creative industries growth in selected UK Travel To Work Areas (TTWA) in terms of five composite indicators:
⦁ Access to finance
⦁ Access to skills
⦁ Innovation
⦁ Environment (broad factors like infrastructure, quality of life and culture)
⦁ Exporting
Three GSW TTWAs were included in the review: Penzance, Exeter and Bournemouth. While these clusters have different scales (Bournemouth the largest, Penzance the smallest) and subsectoral strengths (more IT in Bournemouth and Exeter, more film and TV in Penzance), the analysis did uncover trends applicable to the GSW in general and situated them within a broader national picture.

in the UK (Mateos-Garcia and Bakhshi, 2016).
Figure 28: The three GSW TTWAs perform moderately across most composite indicators
©Engine House
The review found:
⦁ Access to finance is an issue outside the South East and specific urban clusters, but the GSW clusters are not as disadvantaged as some other areas. Almost all businesses say that access to finance is a problem, but interventions from UKRI vary considerably. The number who have applied for external finance is positive and suggests that some form of funding scheme, possibly in addition to UKRI, could help alleviate a significant barrier. It is also of note that creative industries business investment is usually far more scalable and divisible than for infrastructure assets for example.
⦁ Access to skills is an issue almost everywhere, except London and a few other pockets in major conurbations. The GSW is less favourable, but so are several other areas. The dominance of self-employed micro-firms is noted. The number of relevant graduates and talent retention suggests that programmes targeting graduate training schemes in larger organisations and/or incubator and accelerator programmes or building network solutions might be particularly effective at retaining talent and alleviating the talent barrier.
⦁ Innovation is less varied across TTWAs and likely driven more by subsector than geographical location. Exeter appears to be performing well in innovation. Penzance performs poorly, largely due to the characteristics of the creative industries subsectors there. Schemes aimed at furthering collaboration and the use of new technologies could be effective at reducing barriers.
⦁ Environment: Exeter and Bournemouth fare reasonably well, Penzance less so. However, it’s worth noting that accommodation or other costs are absent from the criteria used. Environmental factors can be difficult to influence. More general infrastructure that supports the creative industries and other sectors, such as improved internet speed, would improve matters. This is particularly important for the growing proportion of creative industries companies using digital capabilities to create content, experiences and services, including in visual and performing arts.
⦁ Exporting: London, the South East and other major clusters perform well. The GSW clusters perform better than others in central and North East regions. Access to export markets could potentially be transformed by increasing the level of demand for goods and services from outside the UK, particularly for digital organisations. Interventions aimed at strengthening clusters, collaboration and joint marketing could help reduce barriers to overseas markets.
The Frontier Economics analysis is useful at a broad level, suggesting that the GSW creative industries are better off than might be expected given the region’s distance from London and the scale of its clusters. We now explore the barriers of access to finance and skills, plus connectivity and infrastructure, as they apply to the GSW creative industries in more detail.

Access to finance
Creative businesses are heavy users of finance, but may struggle to access it. A survey by the Creative Industry Council from 2018 showed 69 percent of 575 creative businesses expected they would need more finance in the next 12 months, far higher than the 10 percent of SMEs across all sectors.155 Twenty-two percent were using three or more types of funding – including loans, overdrafts and credit cards. Forty-two percent had accessed public funds at some point, but 27 percent relied on family and friends, compared with 9 percent of businesses generally. While creative businesses said they were happy to use external finance, the majority believed investors found the sector hard to understand. As Di Novo et al (2023) put it, while creative industries companies may be able to innovate at low cost (compared to biotechnology companies, for example), “they may also lack features, such as the tangibility of their assets, the patentability of innovative outputs, or the size and scalability of operations, that could provide a signal of quality to lenders and investors”.156 That is, creative industries companies can be highly innovative, but find it difficult to communicate this to the people with the money. Consistent with this, Di Novo found that, firstly, creative innovators are not more likely to apply for mainstream debtbased finance and, when they do, they are either less or equally likely to be successful than the non-innovators. Secondly, they are more likely to apply for venture capital, but they are not more likely to receive this type of funding than non-innovators.
Access to skills
Recruitment is another challenge. Falling enrolment in further education is fuelling concerns there is a mismatch between the government’s ambition to generate a million new jobs in the creative industries by 2030 and the pipeline of young people to fill them. There is also concern that the drop in children taking arts subjects and combining arts subjects with STEM subjects in schools will widen that gap in the future.157 In England, enrolment in creative subjects at FE colleges dropped 57 percent between 2014 and 2022, compared with a 31 percent drop across all subjects, and there is very low take-up of creative industries apprenticeships. Despite policy attempts to enhance work-based learning options, only 8.7 percent of apprenticeships in England are aligned to the creative industries.158 The work of micro businesses is often project-based, which means they are unable to take on apprentices on long-term contracts.
Anecdotal evidence suggests there is already a skills shortage in some creative industries roles, particularly in emerging technologies. Survey data for 2022 from DCMS shows that, while the creative industries currently experience lower levels of skills shortages than UK industries in general, there are holes in some subsectors. For example, those working in UK advertising and marketing businesses report that 15.3 percent of their workforce has a skills gap – meaning they are judged to be not fully proficient in their role – compared to only 4.9 percent across all creative industries subsectors and 5.7 percent across all sectors.158
Connectivity
The UK has made investments in internet speed and quality in recent years, including Project Gigabit, the government’s £5 billion programme to ensure connections of at least 30 Mbps reach rural areas.160 While a positive step, it is not enough for many creative industries companies: the most technologically advanced subsectors such as IT, software and computer services, film and TV (and their convergent immersive subsector) require high security, low-latency networks of 1 Gbps or more for high-definition content generated and experienced in real-time. Outside the major conurbations of Exeter, Plymouth and BCP, internet speeds in the GSW are generally poor. Ofcom data shows 12 out of 16 local authority districts in the region had fewer than 70 percent of premises with Gigabit-capable broadband as of January 2024. In the Isles of Scilly, only 4.5 percent of premises did, the lowest of all 374 UK local authorities.161 The situation for mobile connectivity is not much better: in seven of the 16 GSW districts, 5G coverage from at least one provider was accessible from less than half the district’s area.162 However, this may not be impacting the creative industries as much as you might expect. Surprisingly, the Creative Industries PEC research found little association between broadband speed in an area and the presence of microclusters, leading them to suggest that “other locational factors” like proximity to cultural and heritage assets “may be greater attractions for businesses than faster broadband speed”.163
Infrastructure
GSW creative businesses are impacted by challenges that affect many GSW-based businesses. A shortage of affordable housing deters graduates – so essential for a sector with such a high proportion of graduate-level jobs – and poor transport infrastructure can make it difficult to reach markets, particularly for those in rural and peripheral locations. The ‘far flung’ location of much of the GSW can pose a real problem. Cornwall Council’s Creative Census 2024 found Cornish creative businesses must put in more effort and resources than their competitors to reach markets in other parts of the country. As a result, many are not trading with the rest of the UK as much as they should: 47 percent of respondents said 75 percent or more of their income came from Cornwall and Isles of Scilly.164 This can be a barrier to scaling up.
155. Creative Industries Council: Access to Finance. Published June 2018.
156. Di Novo et al 2023: Starving the golden goose? Access to finance for innovators in the creative industries
159. DCMS: DCMS Sector Skills Shortages and Skills Gaps: 2022, UK Published 2 May 2024. Data for the percentage of total workforce that are judged to be not fully proficient in their role, based on a survey of 305 people. The 4-digit SIC industry is recorded for responding businesses – which are surveyed at the establishment level, not the organisation level. DCMS sum skill gaps across these SIC codes, and by region, to get the relevant sector (and sub-sector) estimates. To ensure estimates are representative of the business population, responses are weighted by business employment estimates.
EXISTING STRENGTHS
The economic case speaks for itself: creative industry jobs grew faster in the GSW between 2019 and 2022 than in any major British region (tying with the East Midlands). They also have distinctive, region-specific strengths.
A rich cultural heritage
Many creative artists have been – and still are – resident in the GSW, reflecting its strong maker culture and the inspiration it provides as a place to live and work. The list includes great writers from Agatha Christie to Thomas Hardy, Daphne du Maurier to Ted Hughes, Michael Morpurgo to Hilary Mantel. It includes artists from Barbara Hepworth to Damien Hirst, and Robert Lenkiewicz to Beryl Cook. It includes filmmakers from Oscar-winning cinematographer Sir Roger Deakins to BAFTA-winning directors Mark Jenkin and Edgar Wright. And it includes many musicians, from Gwenno to Chris Martin, Tori Amos to Damon Albarn, Muse to conductor Kirill Karabits.
Three creative industries universities
Falmouth University, Arts University Plymouth and Arts University Bournemouth, together with GSW’s other universities and FE colleges, create a pipeline of new talent for local creative businesses to harness. They also support the sector with R&D, incubation programmes and access to state-of-the-art facilities including the Centre for Blended Realities at Falmouth, the Fablab at Arts University Plymouth and the Innovation Studio at Arts University Bournemouth.
Creative clusters and subsector specialisms
Our research reveals the GSW has significant creative industries clusters in BCP, Exeter and Exmouth, and Plymouth, and sizable clusters in North Devon, Taunton, Torquay, Falmouth, and Frome, along with several others. ONS data shows the GSW has strong annual job growth in large subsectors like advertising and marketing (11.7 percent), IT (4.3 percent) and architecture (3.2 percent),165 and strength in the music, performing and visual arts subsector (15.6 percent of GVA in 2022, compared to 9.1 percent nationally).166
Local and national recognition
GSW councils value culture’s positive impact on place-making, communities and wellbeing. This is reflected in the culture strategies of local authorities across the GSW, such as Flourishing Culture (North Devon and Torridge’s culture strategy for 2022-27),167 Somerset Council’s Cultural Strategy and Vision 2024-2034,168 and BCP’s Cultural Strategy for 2023-32.169 Cornwall and Isles of Scilly and Devon have been recognised as potential areas for growth by UKRI’s Create Growth Programme. The CGP and other intervention programmes across the region have focused on business skills and access to finance. They are showing signs of impact, with a recent increase in grant capture and some significant equity investments.
Strengths
⦁ Generates £2.7 billion GVA per year
⦁ Recent (2019-22) job growth of 4.1 percent CAGR, versus 0.7 percent across all sectors
⦁ Joint fastest job growth rate of any British region across 2019-22 period
⦁ Strong annual job growth in large subsectors: advertising and marketing (11.7 percent), IT (4.3 percent) and architecture (3.2 percent)
⦁ Strength in music, performing and visual arts subsector (15.6 percent of GVA in 2022, compared to 9.1 percent nationally)
⦁ Previous studies recognize clusters in Penzance, Exeter and Bournemouth
⦁ 22 significant further creative industries clusters identified in this study
⦁ Three creative industries universities and strong specialist departments in the others6,700+ creative graduates a year
⦁ Moderate export intensity
⦁ Strong institutional support: GSW local authorities have culture strategies
⦁ Famous resident creative professionals, past and present
Opportunities
⦁ Central government recognition of creative industries’ importance and growth potential
⦁ UK is globally recognised for its creative industries strength and export potential
⦁ £7 million of UKRI investment for a new regional creative industries cluster with the potential to attract double that in co-investment
⦁ Sector dominated by small and micro firms: investment scalable, with short lead times
⦁ Every 10 jobs in creative industries supports a further seven in other sectors, and every £1 contributed in GVA generates a further £0.5 is generated in other sectors.
⦁ Remote working in some subsectors opens up potential for greater exports
⦁ Significant linkages and spillover into other sectors, particularly through IT and software, digital, visualisation, and VR into the green and blue economies and priority sectors: food security, energy security and defence.
Weaknesses
⦁ No GSW-wide creative industries strategy, unlike other regions e.g. the Northern Powerhouse
⦁ Lack of awareness, nationally, of the GSW’s strength in the creative industries
⦁ Under-representation of key subsector: IT, software and computer services
⦁ Few large firms to anchor clusters
⦁ Physical distance from the creative powerhouse of London and the South East
⦁ Access to finance registered as a barrier to almost all firms (as with most firms outside London and the South East)
⦁ Low graduate retention rates (only 19 percent across universities)
⦁ Film and TV is an emerging sector (particularly in Cornwall) but GSW lacks infrastructure compared with other regions and has lacked screen agency development until recently
Threats
⦁ Regional lack of awareness of what creative industries are, and their importance and potential
⦁ Lack of awareness of linkages between creative industries and other sectors of the economy
⦁ Limitation of investment funding amid other priorities
⦁ Skills shortage because of high housing prices
⦁ Limited Gigabit connectivity (required by many creative industries) outside major urban areas
Figure 29: SWOT analysis of the GSW creative industries
RECOMMENDATIONS
How can we grow the creative industries in the GSW?
The SWOT analysis shows that the above-national growth of the creative industries in the GSW presents the region with an opportunity, not only to benefit from further creative industries growth, but also to generate jobs, GVA and innovation in other priority sectors. A GSW-wide strategy for the creative industries that prioritises the sector could overcome the weaknesses that prevent the region from maximising the value of its creative economy. We therefore make a number of recommendations, intended to grow the size of the creative industries sector in the GSW.
Develop a GSW-wide strategy and sell the story
To attract national cluster funding, a region needs to display a distinct creative identity, have a large number of creative industries businesses, and possess significant capacity for collaborative R&D. It also needs to demonstrate evidence of strong partnerships between local authorities, cultural organisations, and creative businesses – including large and micro businesses, and higher and further education institutions. The GSW can take some immediate steps to create the right environment and campaign for more national investment by empowering the University Alliance to continue to be the strategic lead for the GSW creative sector.
This should:
⦁ Establish a creative industries data ‘observatory’ for the GSW to continue to collect and analyse data on the creative industries to measure its growth and evaluate the return on investment of interventions.
⦁ Develop an economic strategy focused on growing the commercial creative industries and sell the region nationally, as a fast-growing rural and coastal cluster. Think One Creative North, Create Central (in the Midlands) and Creative Estuary (in Kent and Essex).
Match fund a Creative Clusters Programme bid
Local authorities will need to offer financial support for a GSW University Alliance bid in the new round of the UKRI Creative Clusters Programme. Universities will also be required to put in 20 percent match proportionate to the size of their institutions and activity. This investment will increase the chance of success of the region capturing the £7-8 million funding from UKRI and, with it, the potential to leverage in private sector match.
This should:
⦁ Commit £1 million across three years to a successful cluster.
⦁ Engage with anchor companies. The AHRC says clusters need a ratio of one large company to 10 micro businesses to lead technical innovation, raise the ambition of small businesses and introduce them into their supply chains.170
Target interventions at growth subsectors and spillover with priority sectors
Not all subsectors are growing equally fast across the UK – and crafts is shrinking.171 It is likely that when subsectors in the GSW are small, even if healthy, they cannot grow much. To generate the best returns, we recommend interventions focus on subsectors that are large across the UK, are growing fast, or have the potential to grow fast in the GSW.
This should focus on:
⦁ IT, software and computer services because it underpins the development of technology for other creative industries subsectors, particularly by enabling the development of converging future screen technologies and virtual production, and drives spillovers to other priority sectors.
⦁ Advertising and marketing because it is one of the UK’s and the GSW’s largest, fastest-growing and most productive subsectors.
⦁ Music, performing and visual arts because it is one of the UK’s largest and most valuable subsectors. The GSW has unique and distinctive strengths here, particularly in music and performing arts, that include large organisations to anchor the subsector.
⦁ Film, TV, video, radio and photography because key agencies now in place have shown there is significant growth potential in the GSW in this high-value sector.
⦁ Architecture because it is vital to the green economy and energy security priority in the region. The GSW almost reaches the national architecture job share, while Devon exceeds it.
Improve access to finance
The GSW’s recent success in winning R&D grant funding and accessing loan and equity funds suggests innovation in its digital and creative industries businesses is growing – but there is more it can do to improve access to finance in the region. Our analysis shows only 14 creative industries companies in the GSW are large and 58 are medium, which strongly indicates that the region needs to attract – or grow – larger companies.
This should:
⦁ Create a clearer funding roadmap that bridges the gap between UKRI grants and large equity raises to build a pipeline of companies ambitious to scale up. This would create the large companies the region needs as anchors for micro businesses. A dedicated digital and creative equity and loan fund for companies located in the GSW would also attract companies into the region.
Designate Culture and Creative Zones and develop infrastructure
The GSW creative industries have many thriving virtual networks. For example, those in IT, software and computer services include Tech Cornwall, Tech Exeter and Silicon South (Dorset). However, Culture and Creative Zones (CCZs) located physically can target areas for regeneration and make the creative industries more visible. Investment in infrastructure is needed to address a significant lack of production-scale facilities in the GSW compared with other regions.
This should:
⦁ Create and name CCZs dedicated to the creative industries. These should be within the GSW’s 22 existing clusters (see 2. Clusters). They could be at village, town, city, or district level and could reflect particular subsectoral strengths.
⦁ Invest in mid-sized createch172 infrastructure. Three adaptable mid-size studios distributed across the region (for example, in Cornwall, Plymouth and Bournemouth) may be better than one facility that is expensive to hire and lengthy to travel to.
Invest in skills for people living in the region
Degree apprenticeships can help regions retain skills, as students are likely to be resident within their geographical area of study. GSW universities are developing creative industries degree apprenticeships. However, micro businesses’ work is often project-based and they are unable to take on apprentices on long-term contracts.
To tackle this, the GSW should:
⦁ Create a new flexi-job apprenticeship agency or work with an existing one. These agencies recruit and employ apprentices and place them with host businesses. The DfE has not announced another wave of agencies yet, but it is worth watching the space to see if they do, or collaborating with an existing agency.173
Support companies to reach wider markets
The GSW’s poor transport infrastructure, and the far-flung location of many GSW businesses, can make it slow and costly to meet potential customers face-to-face, both inside and outside the region (see 6. Potential: barriers to growth). Micro businesses may therefore need support to connect with national markets and supply chains, while more established businesses may need support to reach international markets. We recommend the following interventions:
This should:
⦁ Subscribe to flexible meeting spaces in London for SMEs by making hot desks and meeting rooms bookable in the capital, to level the playing field for GSW SMEs that do not have access.
⦁ Provide conference and travel bursaries for larger businesses to attend events and showcases in the UK and around the world.
Working together, we can ensure the creative industries in the GSW grow at least as fast as the sector nationally, with some subsectors growing faster. We can drive national recognition of the GSW region as an important rural and coastal creative industries cluster, then develop targeted interventions to ensure this vision becomes a reality.
STATISTICAL ANNEX
This statistical annex contains information on our research methodology, including definitions used, as well as tables underlying all figures, plus some additional figures and tables. Data cleaning work was conducted in R Studio version 2024.04.1+748, data analysis in R Studio and Google Sheets, and charts were produced in Flourish (flourish.studio). An interactive version of the charts can be accessed at bit.ly/creativegsw
1. METHODOLOGY
1.1
Definitions
1.1.1 The GSW region
The Great South West is an area of the south west of England stretching from Bournemouth to the Isles of Scilly. With a population of 3.2 million, it includes all of Devon, Cornwall, and Dorset, and most of Somerset, and the urban areas of Exeter, Plymouth and Bournemouth – but excludes Bristol and Bath. The GSW comprises the 15 local authority districts (LADs) shown in Table S1.
Table S1: The 15 local authority districts in the Great South West Region N
The GSW falls fully within the ITL1 region South West England (TLK) and comprises the ITL2 and ITL3 regions shown in Table S2.
Table S2: ITL2 and ITL3 regions in the GSW
1.1.2 Creative industries
Our analysis uses the Department for Culture, Media & Sport (DCMS) classification of the creative industries, which encompasses the nine subsectors shown in Table S3, along with their associated Standard Industrial Classifications 2007 (SIC07).
Table S3: Subsectors and SIC07 codes included in DCMS definition of the creative industries
Source: DCMS175
Subsector SIC07
Description
Advertising and marketing 7021 Public relations and communication activities
Advertising and marketing 7311 Advertising agencies
Advertising and marketing 7312 Media representation
Architecture 7111 Architectural activities
Crafts 3212 Manufacture of jewellery and related articles
Design and designer fashion 7410 Specialised design activities
Film, TV, video, radio and photography 5911 Motion picture, video and television programme production activities
Film, TV, video, radio and photography 5912 Motion picture, video and television programme postproduction activities
Film, TV, video, radio and photography 5913 Motion picture, video and television programme distribution activities
Film, TV, video, radio and photography 5914 Motion picture projection activities
Film, TV, video, radio and photography 6010 Radio broadcasting
Film, TV, video, radio and photography 6020 Television programming and broadcasting activities
Film, TV, video, radio and photography 7420 Photographic activities
IT, software and computer services 5821 Publishing of computer games
IT, software and computer services 5829 Other software publishing
IT, software and computer services 6201 Computer programming activities
IT, software and computer services 6202 Computer consultancy activities
Museums, galleries and libraries 9101 Library and archive activities
Museums, galleries and libraries 9102 Museum activities
Music, performing and visual arts 5920 Sound recording and music publishing activities
Music, performing and visual arts 8552 Cultural education
Music, performing and visual arts 9001 Performing arts
Music, performing and visual arts 9002 Support activities to performing arts
Music, performing and visual arts 9003 Artistic creation
Music, performing and visual arts 9004 Operation of arts facilities
Publishing 5811 Book publishing
Publishing 5812 Publishing of directories and mailing lists
Publishing 5813 Publishing of newspapers
Publishing 5814 Publishing of journals and periodicals
Publishing 5819 Other publishing activities
Publishing 7430 Translation and interpretation activities
The DCMS-defined creative industry sector overlaps with the cultural sector and with tourism, as Figure S4 shows.
1. Retail of music and video recordings, manufacture of musical instruments, reproduction of recorded media
2. Heritage
3. Arts, Museum activities.
4. Renting of sports goods, operation of sports facilities, other sport activities
5. Gambling
In addition, DCMS define ‘creative occupations’, which are distinct from the creative industries (see Table S5) and based on Standard Occupational Codes (SOC). People may work in creative occupations either inside or outside the creative industries, and not all creative industries jobs are defined as creative occupations. These are grouped into the same nine subsectors. In this report, we deal almost exclusively with jobs in the creative industries, not creative occupations.
Figure S4: Creative industries sector overlaps with other DCMS sectors176
Table S5: Creative occupations, as defined by DCMS
Source: DCMS177
Creative Occupations Group SOC (2010) Description
Advertising and marketing 1132
Advertising and marketing 1134
Marketing and sales directors
Advertising and public relations directors
Advertising and marketing 2472 Public relations professionals
Advertising and marketing 2473
Advertising and marketing 3543
Advertising accounts managers and creative directors
Marketing associate professionals
Architecture 2431 Architects
Architecture 2432 Town planning officers
Architecture 2435 Chartered architectural technologists
Architecture 3121 Architectural and town planning technicians
Crafts 5211 Smiths and forge workers
Crafts 5411 Weavers and knitters
Crafts 5441
Glass and ceramics makers, decorators and finishers
Crafts 5442 Furniture makers and other craft woodworkers
Crafts 5449 Other skilled trades not elsewhere classified
Design: product, graphic and fashion design 3421 Graphic designers
Design: product, graphic and fashion design 3422 Product, clothing and related designers
Film, TV, video, radio and photography 3416
Film, TV, video, radio and photography 3417
IT, software and computer services 1136
IT, software and computer services
Arts officers, producers and directors
Photographers, audio-visual and broadcasting equipment operators
technology and telecommunications directors
and systems designers
IT, software and computer services 2136 Programmers and software development professionals
IT, software and computer services 2137 Web design and development professionals
Publishing 2471 Journalists, newspaper and periodical editors
Publishing 3412 Authors, writers and translators
Museums, galleries and libraries 2451 Librarians
Museums, galleries and libraries 2452 Archivists and curators
Music, performing and visual arts 3411 Artists
Music, performing and visual arts 3413 Actors, entertainers and presenters
Music, performing and visual arts 3414 Dancers and choreographers
Music, performing and visual arts 3415 Musicians
1.2 Data processing
To conduct the original data research component of this report, we took the list of companies registered by Companies House as of 1 July 2024, filtered it to VAT-registered companies with a first-listed SIC code within the DCMS definition of the creative industries and with a registered address located within the GSW, then filtered it to active businesses. We included the few companies known to be foreign-owned. Here, we assumed that the first-listed SIC provided an accurate description of a company’s activities, which will be true in most but not all cases. We manually checked the large and medium-sized companies and removed 10 which had been misclassified. We then matched our list to company-level economic data from Data City (thedatacity.com), a reputable commercial data provider.
Our analysis uncovered 15,870 GSW-registered companies within the creative industries active in July 2024. Finally, we used each business’ registered postcode to add geographical data – such as local authority district, latitude and longitude information – from Find That Postcode (findthatpostcode.uk), which pulls in data from various reputable public sources.
Table S6: Data cleaning pipeline
1 Download company information from Data City
2 Download list of companies registered in GSW from Companies House 18,951 As of 1 July 2024 with at
3 Filter Companies House data to companies with a creative industry SIC code listed first
4 Match Data City data to Companies House data
first listed SIC is the most accurate description of a company’s activities. This may not be true in all cases.
House
238 companies were in Companies House data but not Data City
Of these 238 companies, 54 had a record in Data City with turnover and/or employee estimates. 2554 companies were in Data City but not Companies House. These were removed.
5 Add turnover and employee estimates 17,133 Estimates added from Data City for 54 companies
184 companies remain in Companies House data with no Data City data
6 Remove 184 companies with no Data City record 16,949 These companies have no turnover or employee estimates - just name, company number and location. They are likely inactive/shell companies.
7 Filter to active companies 15,881 Removed from pool: Active - Proposal to Strike off - 926 companies
Liquidation - 137 companies
Voluntary Arrangement - 4 companies
In Administration - 1 company
8 Remove obviously misclassified companies 15,871
9 Remove one company where Data City data had got shifted 15,870 companies analysed
136 companies selected for detailed check: top 10 by employees or turnover per subsector, plus all medium and large companies across all subsectors
10 companies appeared to have submitted an inaccurate SIC code and were removed
Data could not be put in correct columns because of uncertain information
City
1.3 Data limitations
1.3.1 Registered addresses
Our analysis takes the location of a business as its address registered with Companies House, but this does not capture the business activity of companies with branches located within the GSW but registered elsewhere. It also excludes the Tate St. Ives art gallery in Cornwall which, while iconic, is neither a company, nor registered in the GSW: it is an executive non-departmental public body sponsored by DCMS and an exempt charity.178 To the extent that this applies, our analysis will be an underestimation of the true amount of creative industries business activity happening in the region.
On the other hand, not all companies registered within the GSW will be operating there. This likely includes many of the several hundred companies registered at a small number of ‘care of’ addresses, usually by accountancy and business services firms, many located in Dorset and BCP. For example, 1,024 creative industries companies are located at a single address in Wimborne – 1 Cedar Office Park, home to at least two large accountancy firms (see Table S7). These two accountancy firms specialise in providing services, including a registered address, to companies owned by individual IT and software contractors. This contributes to the large number of IT, software and computer services companies registered in Dorset. Companies registered at these two addresses represent 28 percent of all companies registered in Dorset local authority district, 16 percent of employees and 11 percent of GVA. Intouch Accounting in Bournemouth is the registered home of 708 companies, nearly a quarter of the BCP total. The data for Dorset and BCP – and any insights around the extent to which clusters are located there – should therefore be treated with a large degree of caution as our numbers likely overestimate the true number of companies active in those districts. This issue will also affect the GSW-wide data to some extent, leading to some inevitable overcounting of businesses and overestimation of activity.
1.3.2 SIC codes
SIC codes are generally recognised to be outdated and do not often align well to the activities of creative digital companies.179 With self-declaration, accurate identification of a company’s activities is difficult. However, we manually checked the SIC codes of the largest companies against their websites to remove those that had obviously been classified as creative industries, when in fact they were not. Among these larger businesses, the share of misclassified companies was low (10 out of 136, or 7.4 percent). The available alternatives to SIC codes are also not perfect, and were not feasible to use in this study. For example, Data City’s Real Time Industrial Classifications (RTICs) had poor data coverage: only about 10 percent of the companies in our dataset had associated RTIC information in Data City at the time of research. SIC codes have the advantage of being those that are used nationally and longitudinally in other studies, as well as by DCMS.
1.3.3 Data gaps
Thirty-six percent of the companies in the Companies House dataset register no employees or turnover data on Data City, so we have no GVA data for them either. These 5,665 companies continue to be invisible to our economic analysis going forward, which is an important limitation of our study. It’s likely the pool of businesses for which we have employee data is not representative of all businesses – it is likely our data represents businesses that are more active or visible online, so Data City can scrape information on them. They may possibly be larger on average, since we can speculate that many of the businesses with no employee or turnover data are likely to be single-person limited companies. Overall, we have employee, turnover and GVA estimates for around two-thirds of the 15,870 businesses.
Table S7: Addresses with more than 100 registered businesses in our GSW dataset
SG Accounting, 1 Cedar Office Park, Cobham Road, Wimborne, BH21 7SB
Aardvark Accounting, 1 Cedar Office Park, Cobham Road, Wimborne, BH21 7SB
Lytchett House, 13 Freeland Park, Wareham Road, Poole, BH16 6FA
Intouch Accounting, Everdene House, Deansleigh Road, Bournemouth, BH7 7DU
1.4. Data analysis
1.4. 1 Location quotients
Location quotients (LQs) are a measure of the extent to which employment in a geographical area is over- or underrepresented relative to the national average. The formula for calculating LQ is:
LQ = (E / T) / (N / R)
where E represents the number of employees in a specific industry (or subsector) within the local area, T is the total number of employees in all industries within that area, N is the number of employees in the same industry at the national level, and R is the total number of employees in all industries nationally. An LQ greater than 1 indicates a higher concentration of employment in that area compared to the national average, while an LQ less than 1 suggests a lower concentration.
We calculated LQs for employment in the GSW relative to the Great Britain total, using ONS data for employed counts for 2022, overall and by subsector.180 We also calculated LQs for each subsector, using our Companies House data. Results of the location quotient analysis can be found in the Tables section below and in several figures in the main report, such as Figure 21.
1.4.2 Shift-share analysis
A shift-share analysis determines the share of regional economic growth that can be attributed to national, economic industry, and regional factors. It helps identify industries where a regional economy (like the GSW) has competitive advantages over a larger one (like that of Great Britain). We conduct several shift-share analyses for employment (see for example Figure 7) and plot the results as location quotient (see 4.1 above) against local share effect. Local share effect is defined as follows:
Local share effect = Industry-specific local growth rate - National growth effect - Industry mix effect
Here, the industry-specific local growth rate is the percent growth between year A and year B in a region in a particular industry, the national growth effect is the percent growth between years A and B nationally across all industries, and the industry mix effect is the national growth rate in an industry minus the national growth effect.
1.4.3 Cluster analysis
We mapped the registered company locations of all 15,870 GSW creative industries businesses. We then clustered their latitudes and longitudes using the HDBSCAN clustering algorithm, with a minimum number of companies per cluster of 100, using the dbscan package in R.181 The HDBSCAN algorithm was chosen because it has been used in other recent cluster research, such as The Innovation Clusters Map published by the Department for Science, Innovation & Technology (DSIT).182
Our analysis revealed 22 distinct creative industries clusters in the GSW of at least 100 companies each. This clustering was based purely on geographical proximity and not, for example, on travel time. One advantage of the HDBSCAN algorithm is that it does not require every company to be allocated a cluster. In total, 71 percent of our companies fall into a cluster and 29 percent do not. Clusters are centred around towns and cities but also include many businesses in surrounding rural areas. Table S8 shows the 22 clusters.
Table S8: The 22 geographical clusters uncovered in our research
Previous research has identified clusters in the GSW relevant to the creative industries. This includes the DSIT Innovation Clusters Map, which aims to help policymakers and investors identify the UK’s innovation clusters. Published in February 2024, it is currently based on data available in January 2023.183 The tool allows users to add their own map layers, based on five datasets. They include the 2018 Inter-Departmental Business Register (IDBR), which has 3.1 million business sites classified into 32 broad SIC code sectors, Innovate UK R&D funding applications (including 46 thousand collaborators and 111 thousand project funding applications), and Data City’s classification of 5 million businesses into 46 emerging industrial sectors, or Real-Time Industrial Classifications (RTICs).
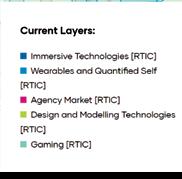
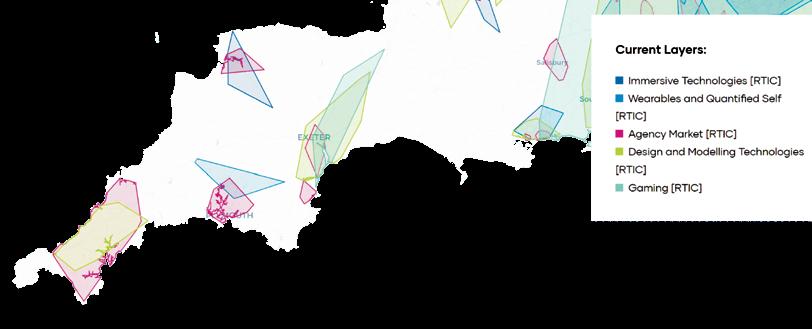

Filtering the data by RTICs relevant to the creative industries gives us another view of subsectoral clusters within the GSW. For example, the ‘Immersive Technologies’ RTIC (including VR, AR, 360 and MR companies) shows clusters in North Devon and BCP, while a ‘Wearables and Quantified Self’ cluster emerges north of Plymouth (defined by Data City as “companies creating and deploying wearable devices and fitness trackers”).184
‘Agency Market’, an RTIC made of “marketing, advertising, and creative agencies”, according to Data City,185 shows numerous clusters across the GSW, including a large one in Cornwall. Filtering the map instead by broad SIC code (based on IDBR data) shows Arts and Recreation clusters in BCP, Plymouth and Cornwall, and a number of Media Publishing clusters across the GSW.


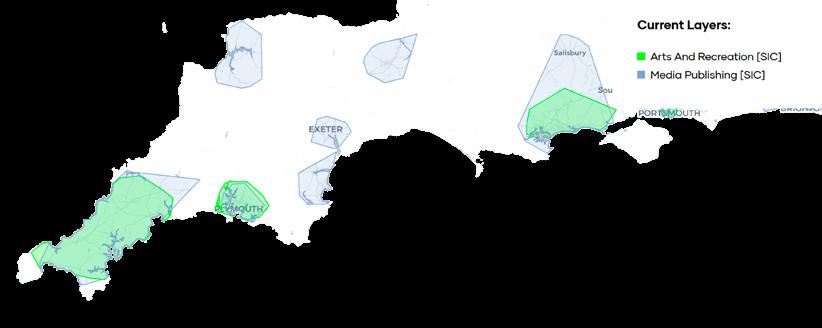
Figure S9: DSIT Innovation Clusters map filtered by Immersive, Wearables, Agency, Design and Modelling and Gaming
Figure S10: DSIT Innovation Clusters map filtered by Arts And Recreation and Media Publishing SICs
2. TABLES
2.1 Tables for figures in report
Table S11: UK GVA in 2022, creative industries compared to selected broad industry groups
Data for Figure 1. Source: DCMS (creative industries),186 ONS (all others).187 GVA in current prices.
Table S12: Index of monthly GVA (Jan 2019 = 100), creative industries and all UK sectors
Data for Figure 2. Source: DCMS188
Table S13: Skill level of UK creative industries jobs compared to all other industries, 2014 and 2023
Data for Figure 3. Source: ONS Annual Population Survey 189
Table S15: GVA by local authority district and company size, £ million
Data for Figure 6. Source: Our analysis of Companies House and Data City data
The underlying dataset for Figure 4 (map showing all GSW creative industries companies as of July 2024) can be accessed via https://public.flourish.studio/visualisation/19011802/
Table S14: Share of GVA, creative industries compared to selected broad industrial groups, GSW and UK
Data for Figure 5. Source: Our data (GSW creative industries), ONS (UK and GSW sectors),190 DCMS (UK creative industries).191 ONS and DCMS data is 2022, ours is 2024.
Table S16: Shift-share analysis for creative industry jobs by UK region
Data for Figure 7. Source: ONS Business Register and Employment Survey (BRES), accessed via Nomis
Table S17: Shift-share analysis for GSW jobs by industrial sector Data for Figure 8. Source: ONS BRES, accessed via Nomis.
Data for Figure 9. Source: ONS192 Data includes freelancers.
The underlying dataset for Figure 11 (map showing all GSW creative industries companies in 22 clusters) and an interactive version of the map can be found at https://public.flourish.studio/visualisation/19135626/
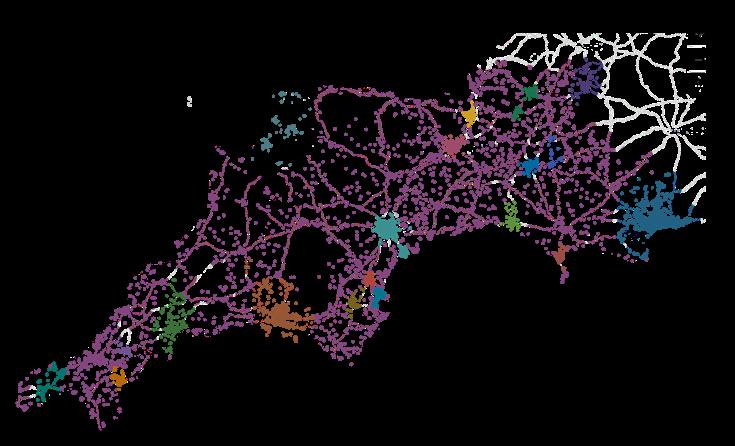
Frome Salisbury
Bournemouth
Yeovil Taunton
Barnstaple
Plymouth
Truro
Penzance
Exeter
Table S19: Key creative industries infrastructure in the GSW
Data for Figure 12. Source: Our research, institution websites. Type column codes are as follows:
⦁ Hub: Universities and further education (FE) colleges with significant digital and creative industries courses
⦁ NPO: Cultural and heritage organisations designated by Arts Council England as National Portfolio Organisations (NPO)193
⦁ Immersive: Immersive facilities such as Falmouth University’s Centre for Blended Realities194
⦁ Space: Fab labs,195 digital innovation labs and production spaces
⦁ Hub: Major work hubs
Full data including latitudes, longitudes and NPO funding, and an interactive version of the map can be found at https://public.flourish.studio/visualisation/19148939/
Source: Our research, institution websites
Size:
Hub Eagle Labs The Foundry, Poole BH15 1SZ
Hub Foundry Poole BH15 1SZ
Hub Little Keep Dorchester DT1 1SQ
Hub Factory Studios Boscombe, Bournemouth BH7 6HJ
NPO Activate Performing Arts Ltd The Little Keep, Barrack Rd, Dorchester DT1 1SQ
NPO Artsreach The Little Keep, Barrack Rd, Dorchester DT1 1SQ DT1 1SQ
NPO Barbican Theatre, Plymouth Castle St, Plymouth PL1 2NJ
NPO BCP Council Bourne Avenue, Bournemouth BH2 6DY
NPO Beaford Arts Bridge Chambers, the Strand, Barnstaple, Devon EX31 1HB
NPO Bernard Leach (St Ives) Trust Limited Higher Stennack, St.Ives TR26 2HE
NPO Beyond Face CIC C3 Apollo Court, Neptune Park, Plymouth PL4 0SJ
NPO Bournemouth Symphony Orchestra Lighthouse, 21 Kingland Road, Poole, Dorset BH15 1UG
NPO Bridport Arts Centre 9 South St, Bridport, Dorset DT6 3NR
NPO b-side Multimedia Festival CIC b-side project space, Outpost, 77 Fortuneswell, Isle of Portland DT5 1LY
NPO Burton Art Gallery and Museum Kingsley Road, Bideford, Devon EX39 2QQ
NPO Contains Art CIO East Quay, Watchet, Somerset TA23 0AQ
NPO Creative Kernow Ltd Krowji, West Park, Redruth, Cornwall TR15 3AJ
NPO Diverse City 3 Manwell Drive, Swanage, Dorset BH19 2RB
NPO Doorstep Arts 4 Palace Ave, Paignton TQ3 3HA
NPO Exeter City Council (Royal Albert Memorial Museum) Queen St, Exeter EX4 3RX
NPO Exeter City of Literature Exeter Phoenix, Gandy St, Exeter EX4 3LS
NPO Exeter Northcott Theatre Stocker Rd, Exeter EX4 4QB
NPO Exeter Phoenix Exeter Phoenix, Gandy St, Exeter EX4 3LS
NPO intoBodmin CIC 10 Lower Bore St, Bodmin PL31 2JX
NPO KARST 22 George Place, Millbay, Plymouth PL1 3NY
NPO Libraries Unlimited South West Castle St, Exeter EX4 3PQ
NPO Literature Works Plymouth University, Drake Circus, Plymouth PL4 8AA
NPO MAKE Southwest Riverside Mill, Fore St, Bovey Tracey, Newton Abbot TQ13 9AF
NPO Miracle Theatre Trust Ltd Treleigh Industrial Estate, Unit 4 Penrose House, Redruth TR16 4DE
NPO Newlyn Art Gallery Ltd New Rd, Newlyn, Penzance TR18 5PZ
NPO North Devon Council (Museum of Barnstaple and North Devon) The Square, Barnstaple, Devon
Landmark Theatres The Promenade, Ilfracombe
Octagon Theatre, Somerset Hendford, Yeovil
Data for Figure 13. Source: Our analysis of Companies House and Data City data
Table S21: Number of companies in our analysis by subsector and ITL3 region
Data for Figure 14. Source: Our analysis of Companies House and Data City data
Subsector Bournemouth, Christchurch and Poole
Isles
Scilly
Table S23: Percent of creative industries GVA by subsector, GSW compared to UK
Data for Figure 16. Source: Our analysis of Companies House and Data City data (GSW), DCMS (UK)196 Subsector
Table S22: Total turnover and GVA of companies in our analysis by subsector and company size, £
Data for Figure 15. Source: Our analysis of Companies House and Data City data
Subsector
Data for Figure 17, monthly GVA by subsector, can be accessed at https://public.flourish.studio/visualisation/19273500/ or at the source, DCMS.197
Table S24: GVA per employee by subsector in our analysis
Data for Figure 18. Source: Our analysis of Companies House and Data City data
Table S25: Employees by subsector and company size in our analysis
Data for Figure 19. Source: Our analysis of Companies House and Data City data
Table S27: Shift-share analysis for GSW jobs by creative industry subsector
Data for Figure 21. Source: ONS BRES via Nomis
Table S26: Employees by subsector and ITL3 region in our analysis
Data for Figure 20. Source: Our analysis of Companies House and Data City data
Subsector
Table S28: Location quotient by local authority district: advertising and marketing subsector
Data for advertising and marketing location quotient chart in
BRES accessed via Nomis
Data for the advertising and marketing subsector map can be accessed at https://public.flourish.studio/visualisation/19012518/
Source:
Table S29: Location quotient by local authority district: architecture subsector
Data for architecture location quotient chart in sector profile.
Source: ONS BRES accessed via Nomis
Table S31: Location quotient by local authority district: design and designer fashion
Data for design and designer fashion location quotient chart in sector profile.
Source: ONS BRES accessed via Nomis
Data for architecture subsector map can be accessed at https://public.flourish.studio/visualisation/19012768/
Table S30: Location quotient by local authority district: crafts subsector
Data for crafts location quotient chart in sector profile.
Source: ONS BRES accessed via Nomis
Data for design and designer fashion subsector map can be accessed at https://public.flourish.studio/visualisation/19012809/
Table S32: Location quotient by local authority district: film, TV, video, radio and photography subsector
Data for film, TV, video, radio and photography location quotient chart in sector profile.
Source: ONS BRES accessed via Nomis
Data for crafts subsector map can be accessed at https://public.flourish.studio/visualisation/19012799/
Data for film, TV, video, radio and photography subsector map can be accessed at https://public.flourish.studio/visualisation/19012842/
Table S33: Location quotient by local authority district: IT, software and computer services subsector
Data for IT, software and computer services location quotient chart in sector profile.
Source: ONS BRES accessed via Nomis
Table S35: Location quotient by local authority district: music, performing and visual arts subsector
Data for music, performing and visual arts location quotient chart in sector profile.
Source: ONS BRES accessed via Nomis
Data for IT, software and computer services subsector map can be accessed at https://public.flourish.studio/visualisation/19012852/
Table S34: Location quotient by local authority district: museums, galleries and libraries subsector
Data for museums, galleries and libraries location quotient chart in sector profile.
Source: ONS BRES accessed via Nomis
Data for music, performing and visual arts subsector map can be accessed at https://public.flourish.studio/visualisation/19012866/
Table S36: Location quotient by local authority district: publishing subsector
Data for museums, galleries and libraries subsector map can be accessed at https://public.flourish.studio/visualisation/19012858/
Data for publishing subsector map can be accessed at https://public.flourish.studio/visualisation/19012876/.
Table S37: Creative industries tax relief by scheme and year, 2006-07 to 2022-23, £ million
Data for Figure 22. Source: HMRC198
Table S39: Innovate UK grants to GSW-based organisations, 2004-05 to 2022-23
Data for Figure 24. Source: UKRI200
Table S38: Innovate UK grants in 2022-23, by local authority district
Data for Figure 23. Source: UKRI199
Data for Figure 25. Source: Arts Council
Table S41: Arts Council funding to GSW-based organisations by local authority district, £ per year 2018-26
Data for Figure 26. Source: Arts Council 202
Table S42: Creative industries employment and employment index, GSW and comparison regions, 2015-22
Data for Figure 27. Source: ONS BRES, accessed via Nomis
Table S43: Frontier Economics scores for GSW TTWAs and GSW TTWAs average – composite indicators only
Data for Figure 28. Source: Frontier Economics. 203 Indicator scores express differences from the average across all UK TTWAs on a 0-10 scale. Scores 2-8 are equal sized bands, covering 0.15 of a standard deviation. The bottom band captures areas where the indicator is more than 0.6 standard deviations below the average across all UK TTWAs. The top band captures areas where the indicator is more than 0.6 standard deviations above the UK average across TTWAs. Scores read from maps.
2.2 Additional figures and tables
Table S44: Frontier Economics scores for GSW TTWAs – all indicators
Source: Frontier Economics. 204 See notes for Table S42 above.
Figure S45: Creative industries employment index, GSW compared to London and rest of Great Britain, 2015-22
Employment index, 2015 = 100
Source: ONS BRES, accessed via Nomis
Table S46: Creative industries employment index, GSW compared to London and rest of Great Britain, 2015-22
Data for Figure S43. Source: ONS BRES, our calculations
S47: Percent of creative industries companies by subsector, GSW compared to UK
Table S49: The 14 large creative industries companies registered in the GSW
Companies House and Data City
Table S48: Percent of creative industries companies by subsector, GSW compared to UK Data for Figure S44. Source: Our analysis (GSW), DCMS (UK)205
Figure
Source: Ofcom206
The Creative Industries in the Great South West: Leading from The Edge - Driving Innovation, Skills and Business Growth report was part-funded by the Great South West Partnership and led by Falmouth University on behalf of the Great South West Creative Industries University Alliance (Arts University Bournemouth, Arts University Plymouth, Bournemouth University, Falmouth University, University of Exeter and University of Plymouth). It was conducted by Creative Industries specialist Joanne Evans, data journalist Miriam Quick and Fiona Waters of Waters Economics.

Cover Imagery ©Kevin Moir/PopTika/Shutterstock/Falmouth University