
How to Choose a Less Discriminatory Alternative
The FairPlay Framework for Picking a Fairer Model
Version 1.0 APRIL 2024
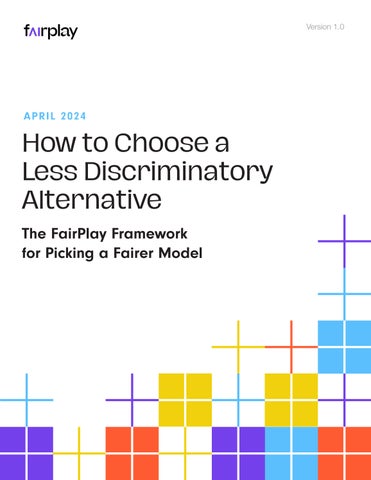
Historically, there have not been efficient ways to create Less Discriminatory Alternative (LDA) models

Now algorithms can build many potential LDA candidates
Today, because of access to cheap computation and massive amounts of data, it is possible to generate many variations of models, some of which will look more or less fair and accurate than others. As a consequence, lenders need a framework for comparing, selecting and validating models that will both perform within their risk tolerance and be fair.

How to Choose a Less Discriminatory Alternative | 2
The challenge is:
How do we tell if an LDA candidate should be adopted?
How to Choose a Less Discriminatory Alternative | 3
How to Choose a Less Discriminatory Alternative |
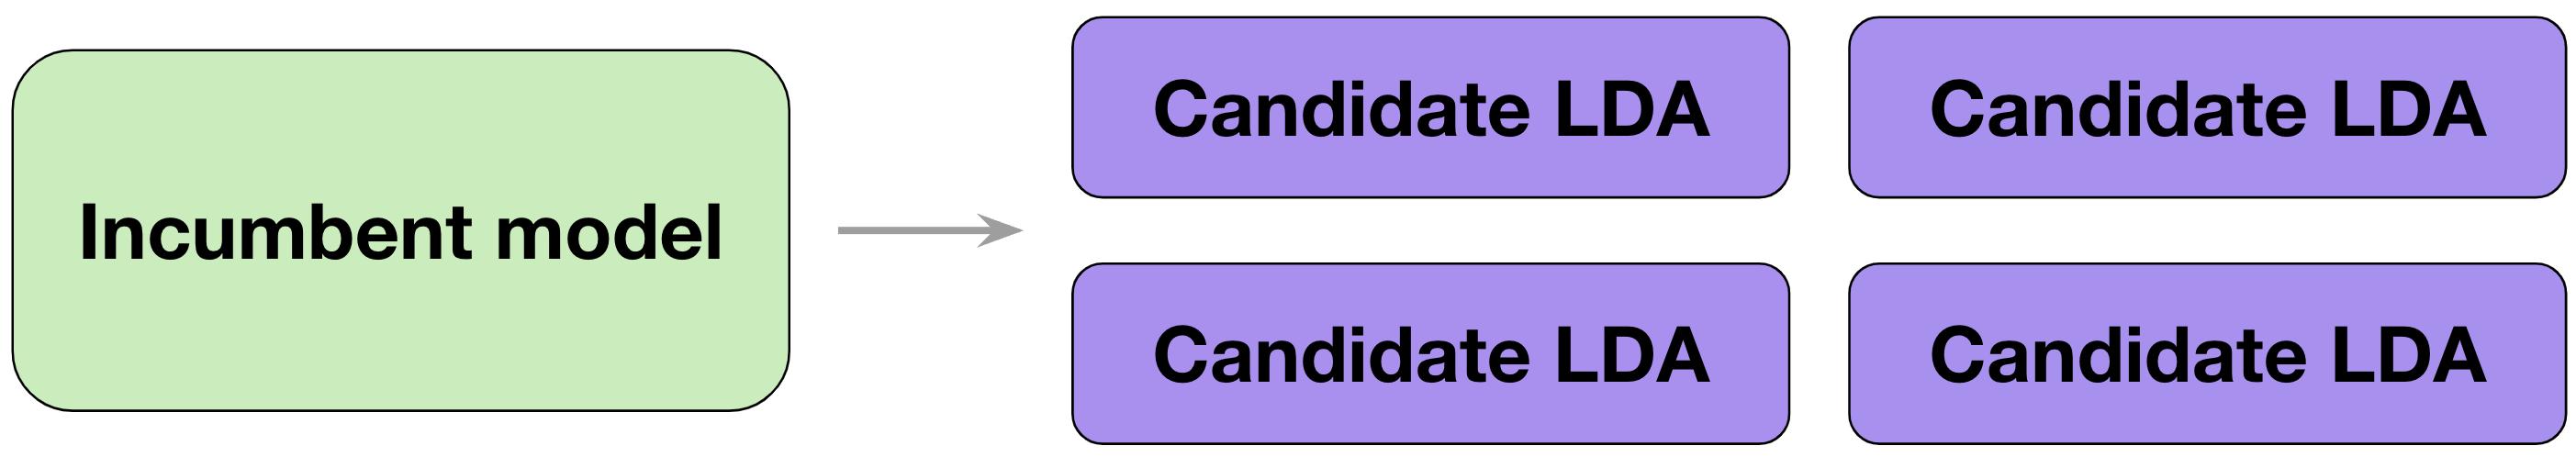
You might think picking an LDA is straightforward: any model whose performance falls within the blue quadrant is an LDA, right?
+ The question of identifying a fairer model that would perform within a financial institution’s risk tolerance turns out to be complicated.
+ The two dimensions we care most about are the business outcomes and the fairness outcomes, represented here by the Y and X axis respectively.
+ The business outcomes can be measured using statistical tests like Area Under the Curve (AUC) and Kolmogorov-Smirnov bias metric (Max KS).
+ The fairness outcomes can be measured using tests like Adverse Impact Ratio (AIR) and Standardized Mean Difference (SMD).
+ Let’s assume that lenders and insurance carriers want to select the model that will perform as well as possible on both dimensions.
+ If the purple dot represents the business and fairness outcomes of a lender’s incumbent model, any model in the shaded-blue region (of more accurate fairer models) is an LDA, right?
How to Choose a Less Discriminatory Alternative | 4