Urban Metabolism Rotterdam

Page 1

sustainable development of Rotterdam

Gemeente Rotterdam — IABR — FABRIC — JCFO — TNO

Ur ban Me­ tabo lism


How do the flows of goods, people, waste, biota, energy, food, freshwater, sand and air function in Rotterdam? What influence do these flows have on the quality of life in the city, and how do they relate to spatial developments? Can an insight into the metabolism of Rotterdam help us develop into a sustainable region? And what opportunities are there for a circular economy? This publication details the results of the IABR–PROJECT ATELIER ROTTERDAM. The analyses, the strategies developed and the specific design proposals detailed, provide answers to the questions posed above. The results obtained offer not only the municipality but also other parties in the city specific pointers for continuing to work on the metabolism of Rotterdam. The IABR–PROJECT ATELIER ROTTERDAM is a collaboration between the IABR and the Municipality of Rotterdam and is one of the focal points of IABR–2014–URBAN BY NATURE–. With IABR–2014–URBAN BY NATURE–, the International Architecture Biennale Rotterdam (IABR) is continuing along its path of research into our urban future, a path it set out on in 2003. We know that there is a huge increase in urbanization worldwide and that the way in which we construct our cities is failing to keep pace with this. We urgently need new ideas, new knowledge, new models and a new paradigm for what a city actually is. We need new techniques and new working methods, new forms of development, financing, organization and management. We need an agenda for the city. The IABR, in its role as a cultural organization, wants to make a modest yet idiosyncratic contribution to that agenda for the city. It is for this reason that it sets up a number of IABR–PROJECT ATELIERS for each edition of the biennale. In the

Ateliers, the power of design is deployed in order to work on urgent local and regional tasks and to add value to spatial policymaking. Each atelier is an open space that the IABR, in its role as a cultural organization, provides to authorities in particular and within which those authorities can subject their own tasks to an intensive, joint process of design-driven research. The cultural space therefore becomes a breeding ground for innovation. The idea is that new ways of thinking should then lead to new ways of doing things: the power of the design must be able to be used for actual innovation in practice. The IABR-Ateliers, which for many years now have served as successful catalysts for design innovation in practice in cities such as São Paulo and Istanbul, are now being used in the Netherlands and result not only in new visions and plans. The objective of each IABR-Project Atelier is to come up with specific project proposals, linked to a ‘toolbox for governance’: in other words, policy tools that government and stakeholders can then use in a practical way. The results obtained by an Atelier always form one of the focal points of the main exhibition of an edition of the biennale. The next step is the most important one: the local and regional authorities then actually start working with the results. The IABR–PROJECT ATELIERS are run by the IABR in its role as the lead partner in the Regional and Local Design Dialogue government programme instigated by the Actie Agenda Architectuur en Ruimtelijk Ontwerp (AAARO) programme within the Ministry of Infrastructure and the Environment. Their assignment is to stimulate the timely use of design and design-driven research for local and regional tasks.

Urban metabolism


Urban Metabolism

sustainable development of Rotterdam

Gemeente Rotterdam — IABR — FABRIC — JCFO — TNO

Ur ban Me­ tabo lism


Urban Metabolism

More and more people are living in everexpanding urban landscapes. These are areas where city and countryside gradually merge into one another. Rotterdam is also situated in such an urban landscape, the Rhine–Scheldt–Meuse delta. That landscape stretches from Amsterdam to Brussels to Cologne. Rotterdam is, with its port, ecologically and economically a central node.

established the IABR PROJECT ATELIER ROTTERDAM, with which the study of the metabolism of the port city began. Alongside Urban Development and the IABR, the PBL [Netherlands Environmental Assessment Agency], the Port of Rotterdam and the Rotterdam Climate Initiative were, from the beginning, actively involved in the design study that took place in the atelier. The study was conducted by FABRIC, James Corner

Preface Like all other deltas in the world, our delta is in transition. The deltas house the majority of the world’s population and are the main producers of food. However, they are extremely vulnerable to the impacts of climate change. They now face a major challenge: how can further economic growth be made sustainable? The sixth edition of the International Architecture Biennale Rotterdam, IABR– 2014–URBAN BY NATURE, for which Dirk Sijmons is the curator, starts from the position that we can solve global environmental problems if we solve the problems of the city. If we analyse, understand and learn to use the structure and metabolism of the city, we can work specifically on a resilient city, and thus a more sustainable future. We must learn to regard the city as our natural ecology and that is why IABR 2014, puts the relationship between city and nature on the agenda. The more we know about the relationship, the better grip we have in the designing, planning and management of our complex urban landscapes. Together with the municipality of Rotterdam, IABR therefore

Field Operations and TNO. This book maps out the results of the design study: the strategies developed and the concrete project proposals. It thus provides a strong impetus for sustainable urban development in Rotterdam, based on its metabolism. The results of the Project Atelier form one of the anchor points of the main exhibition of the IABR–2014–URBAN BY NATURE, which can be seen from 29 May to 24 August 2014 in the Kunsthal and the Natural History Museum Rotterdam. Then comes the most important step. The development strategies, which the Project Atelier has produced, must be effectively deployed. The new approach to urban planning, as proposed by the Project Atelier, must also be tested by means of the implementation of the projects. This must be done in the city itself and together with all stakeholders. George Brugmans, Astrid Sanson, Director Urban Quality / Managing Director Inner city Municipality IABR of Rotterdam


Urban Metabolism

iabr–Project Atelier Rotterdam p. 9

content Chapter 1

Urban Flows for a sustainable urban landscape p. 13 Chapter 2

Nine flows highlighted p. 19 Chapter 3

Four strategies to optimize flows in Rotterdam p. 77 Chapter 4

Results, ongoing actions and Follow-up p. 127 Colophon

p. 143


9

Urban Metabolism

The International Architecture Biennale Rotterdam has become a genuine Rotterdam tradition. IABR–2014–URBAN BY NATURE– is the 6th edition and the IABR has proven to be an innovative platform of and for Rotterdam, allowing research by design to outline new perspectives and opportunities for the city on the basis of topical subjects that have an impact on our policies. The editions of 2005, ‘The Flood’, and 2012, ‘Making City’, were respectively at the basis

Project Ateliers. The complexity of the city is exposed and studied, and new and unexpec­ ted relationships within the city are explored, offering urgent and relevant challenges and opportunities to the Rotterdam area. The research has led to a compelling analysis of our unique urban metabolism, resulting in a collection of spatial economic perspectives, ideas, and insights that will inspire us when building on a strong and sustainable future for the Rotterdam region.

URBAN METABOLISM IABR–Projectatelier Rotterdam of an innovative approach to water-related challenges (Rotterdam Waterstad 2030), and of new insights into the city’s densification capacity (Rotterdam: People make the inner­ city). Inspired by the Biennale, we in turn inspire others by translating acquired know­ ledge into visions and new plans for the city.

Urban Metabolism is a response to global

‘We know so little about what it really takes, about how urbanization actually works,’ said Pierre Belanger, landscape architect and associate professor at Harvard University’s Graduate School of Design. This sums up exactly why this biennale is urgent and topical, given the fact that the majority of the world population will soon be living in cities, including the Dutch and the residents of the Rotterdam region.

trends. These trends will have an impact on Rotterdam and create opportunities in the city. Across the globe, densely populated areas, not coincidentally often located in deltas such as ours, are searching for ways to realize a resilient economic future, pressured by global issues like resource scarcity, energy and food shortages, environmental issues, and climate change. Deltas are also highly competitive as attractive habitats, with fashionable labels like Eco City, Smart City, Sustainable City, and Climate Proof City. To attract and retain talent and industry, it is crucial to create an urban ‘ecosystem’ where authorities, know­ ledge institutes, businesses, and citizens effortlessly manage to relate to each other.

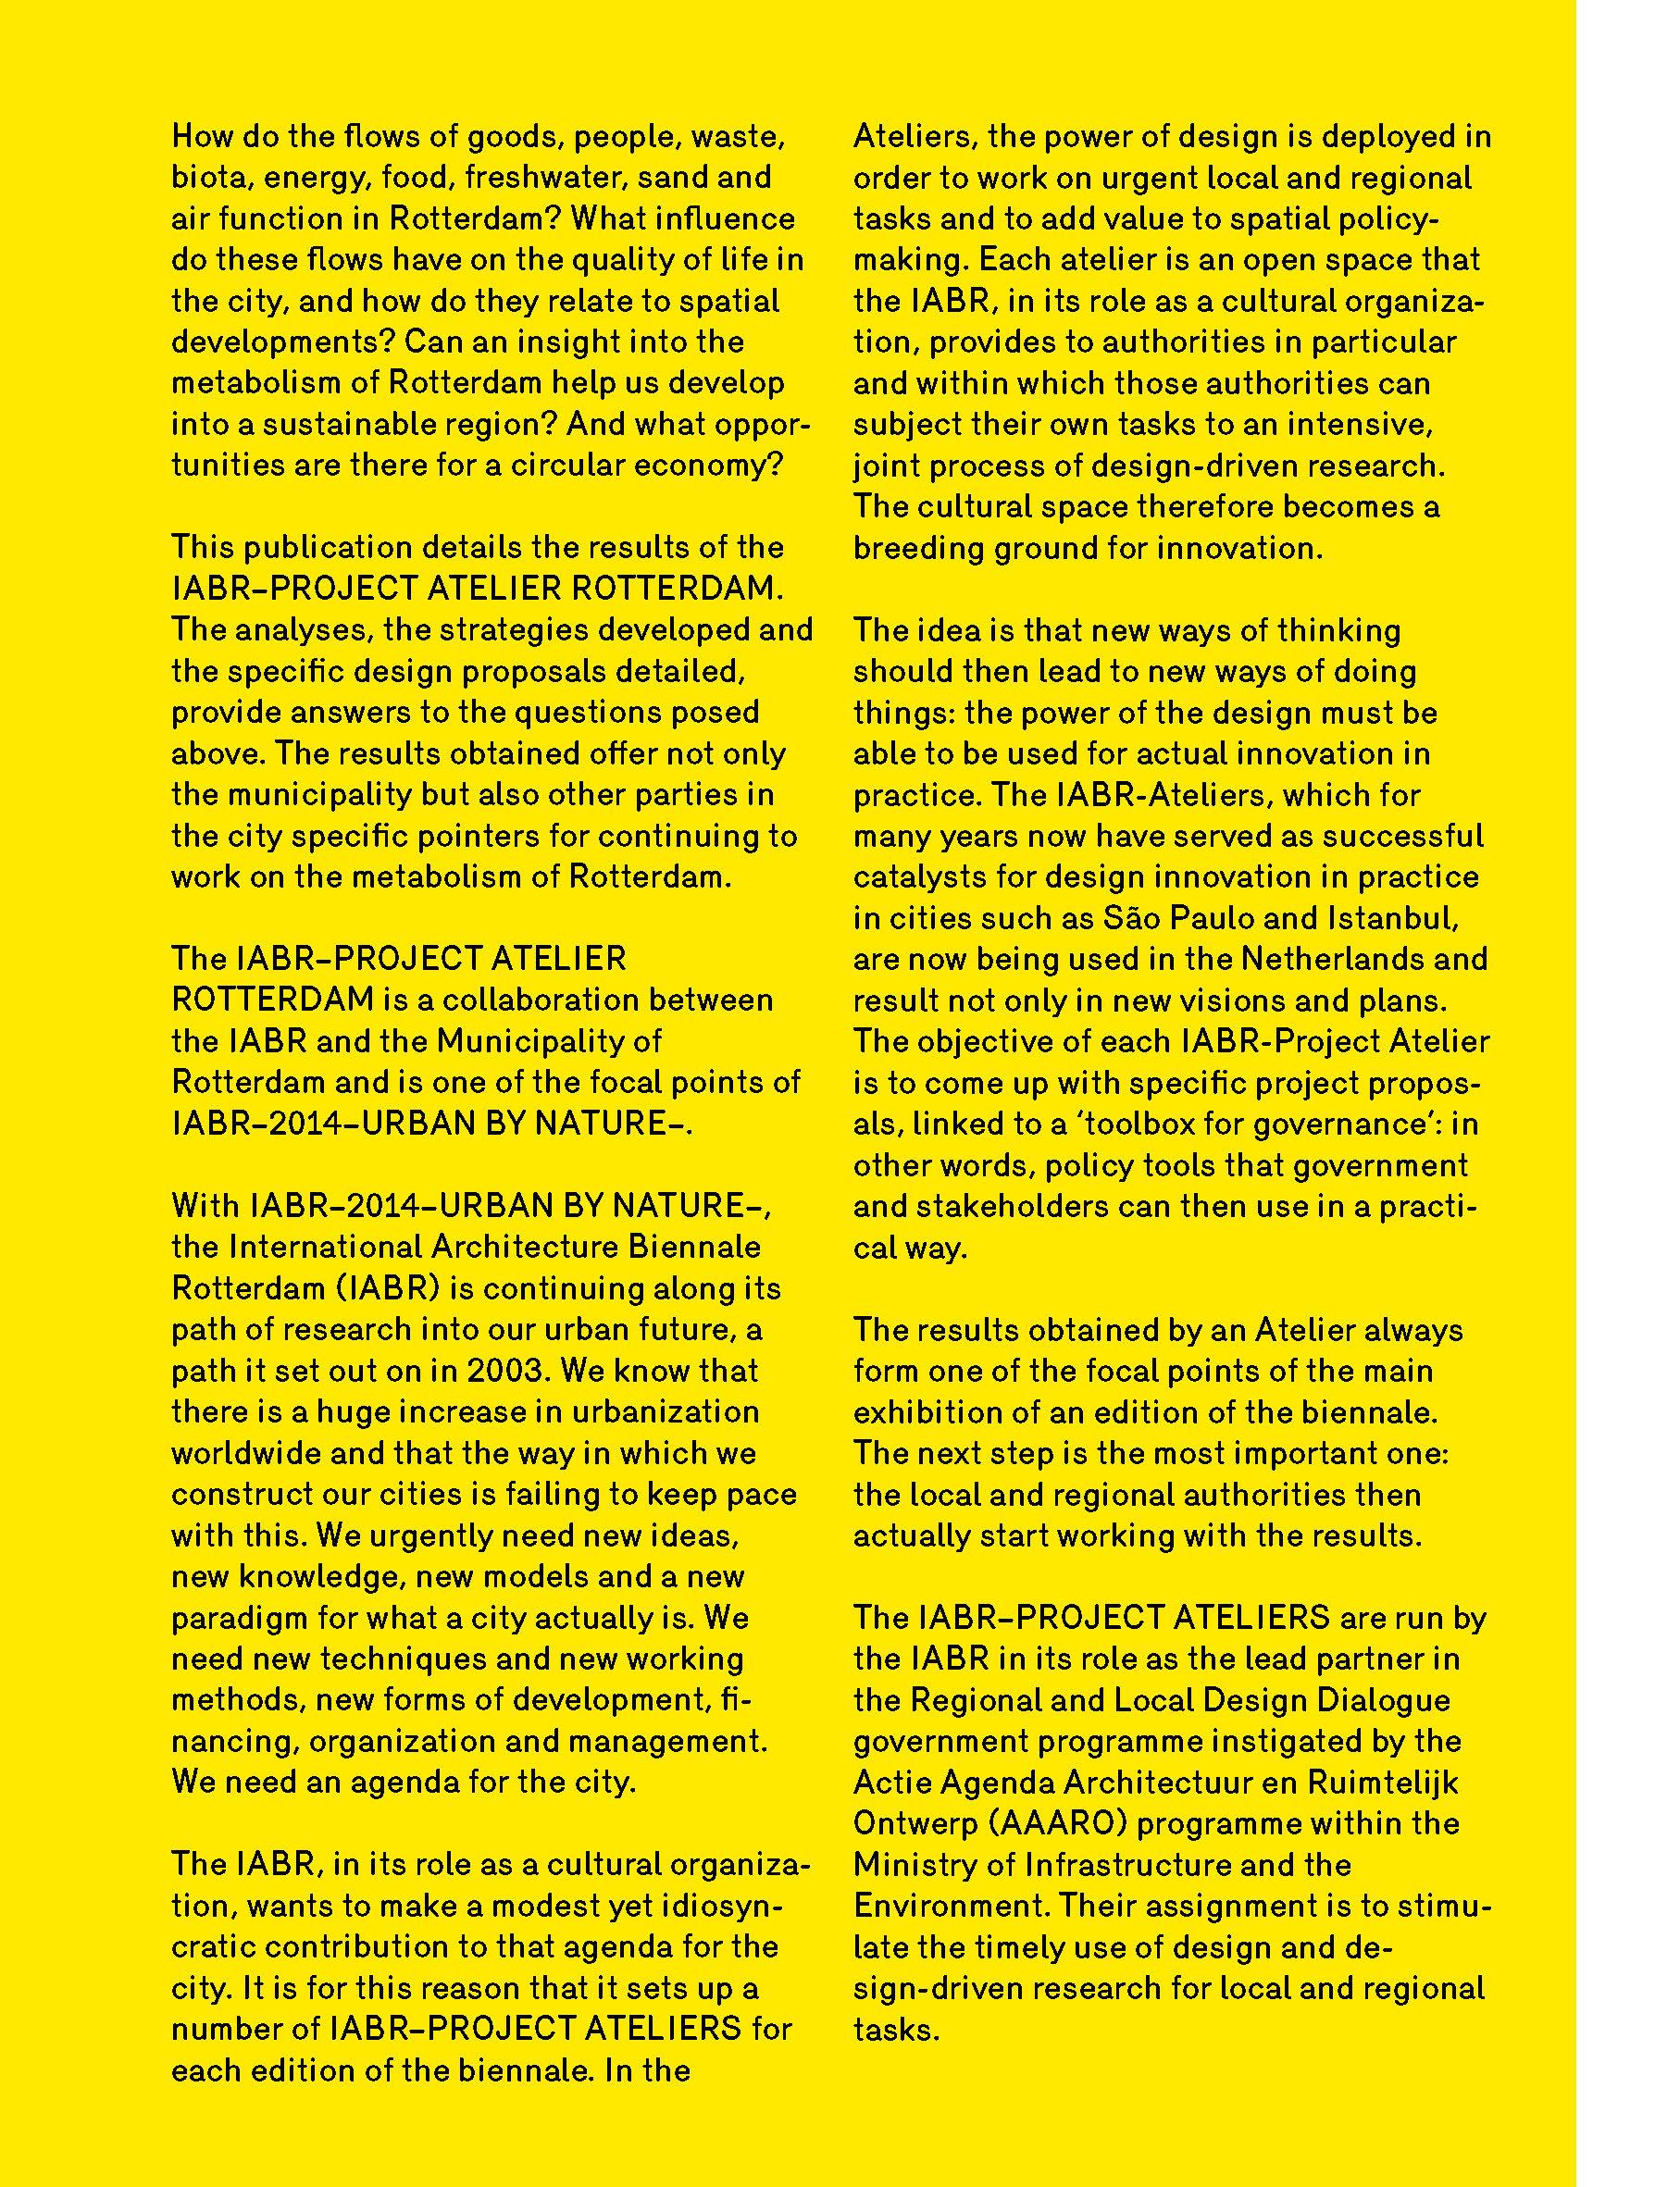
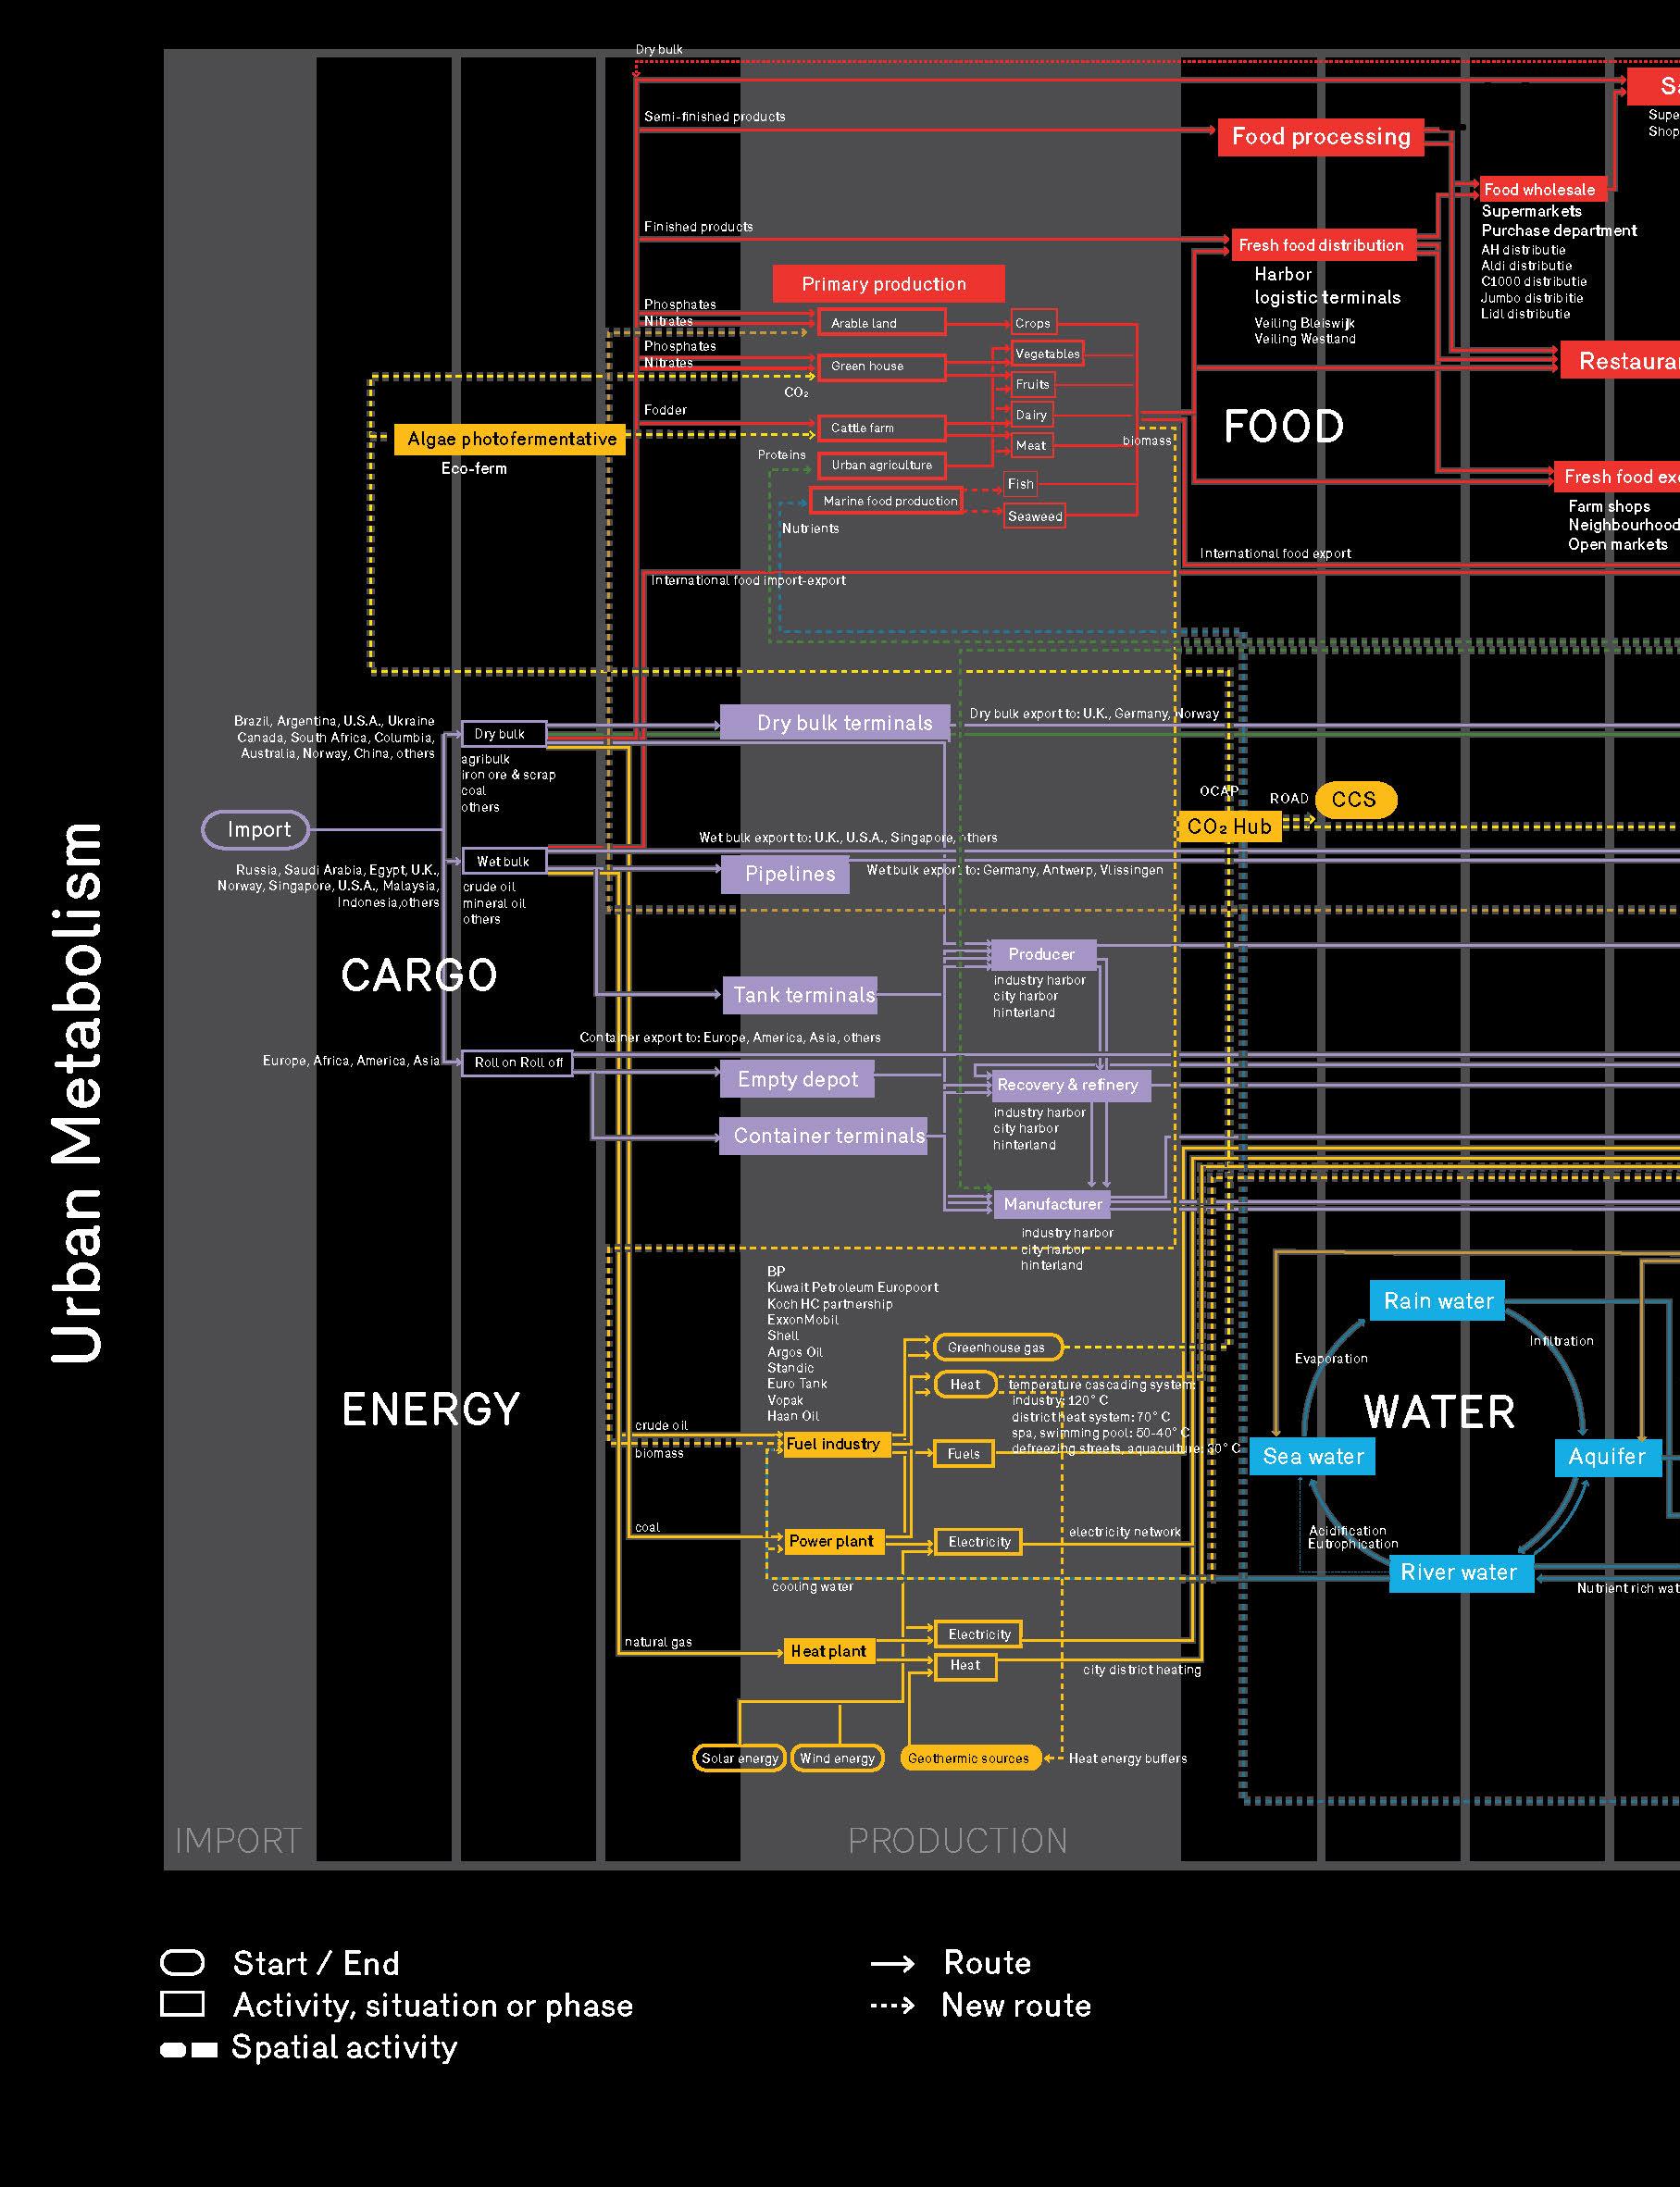
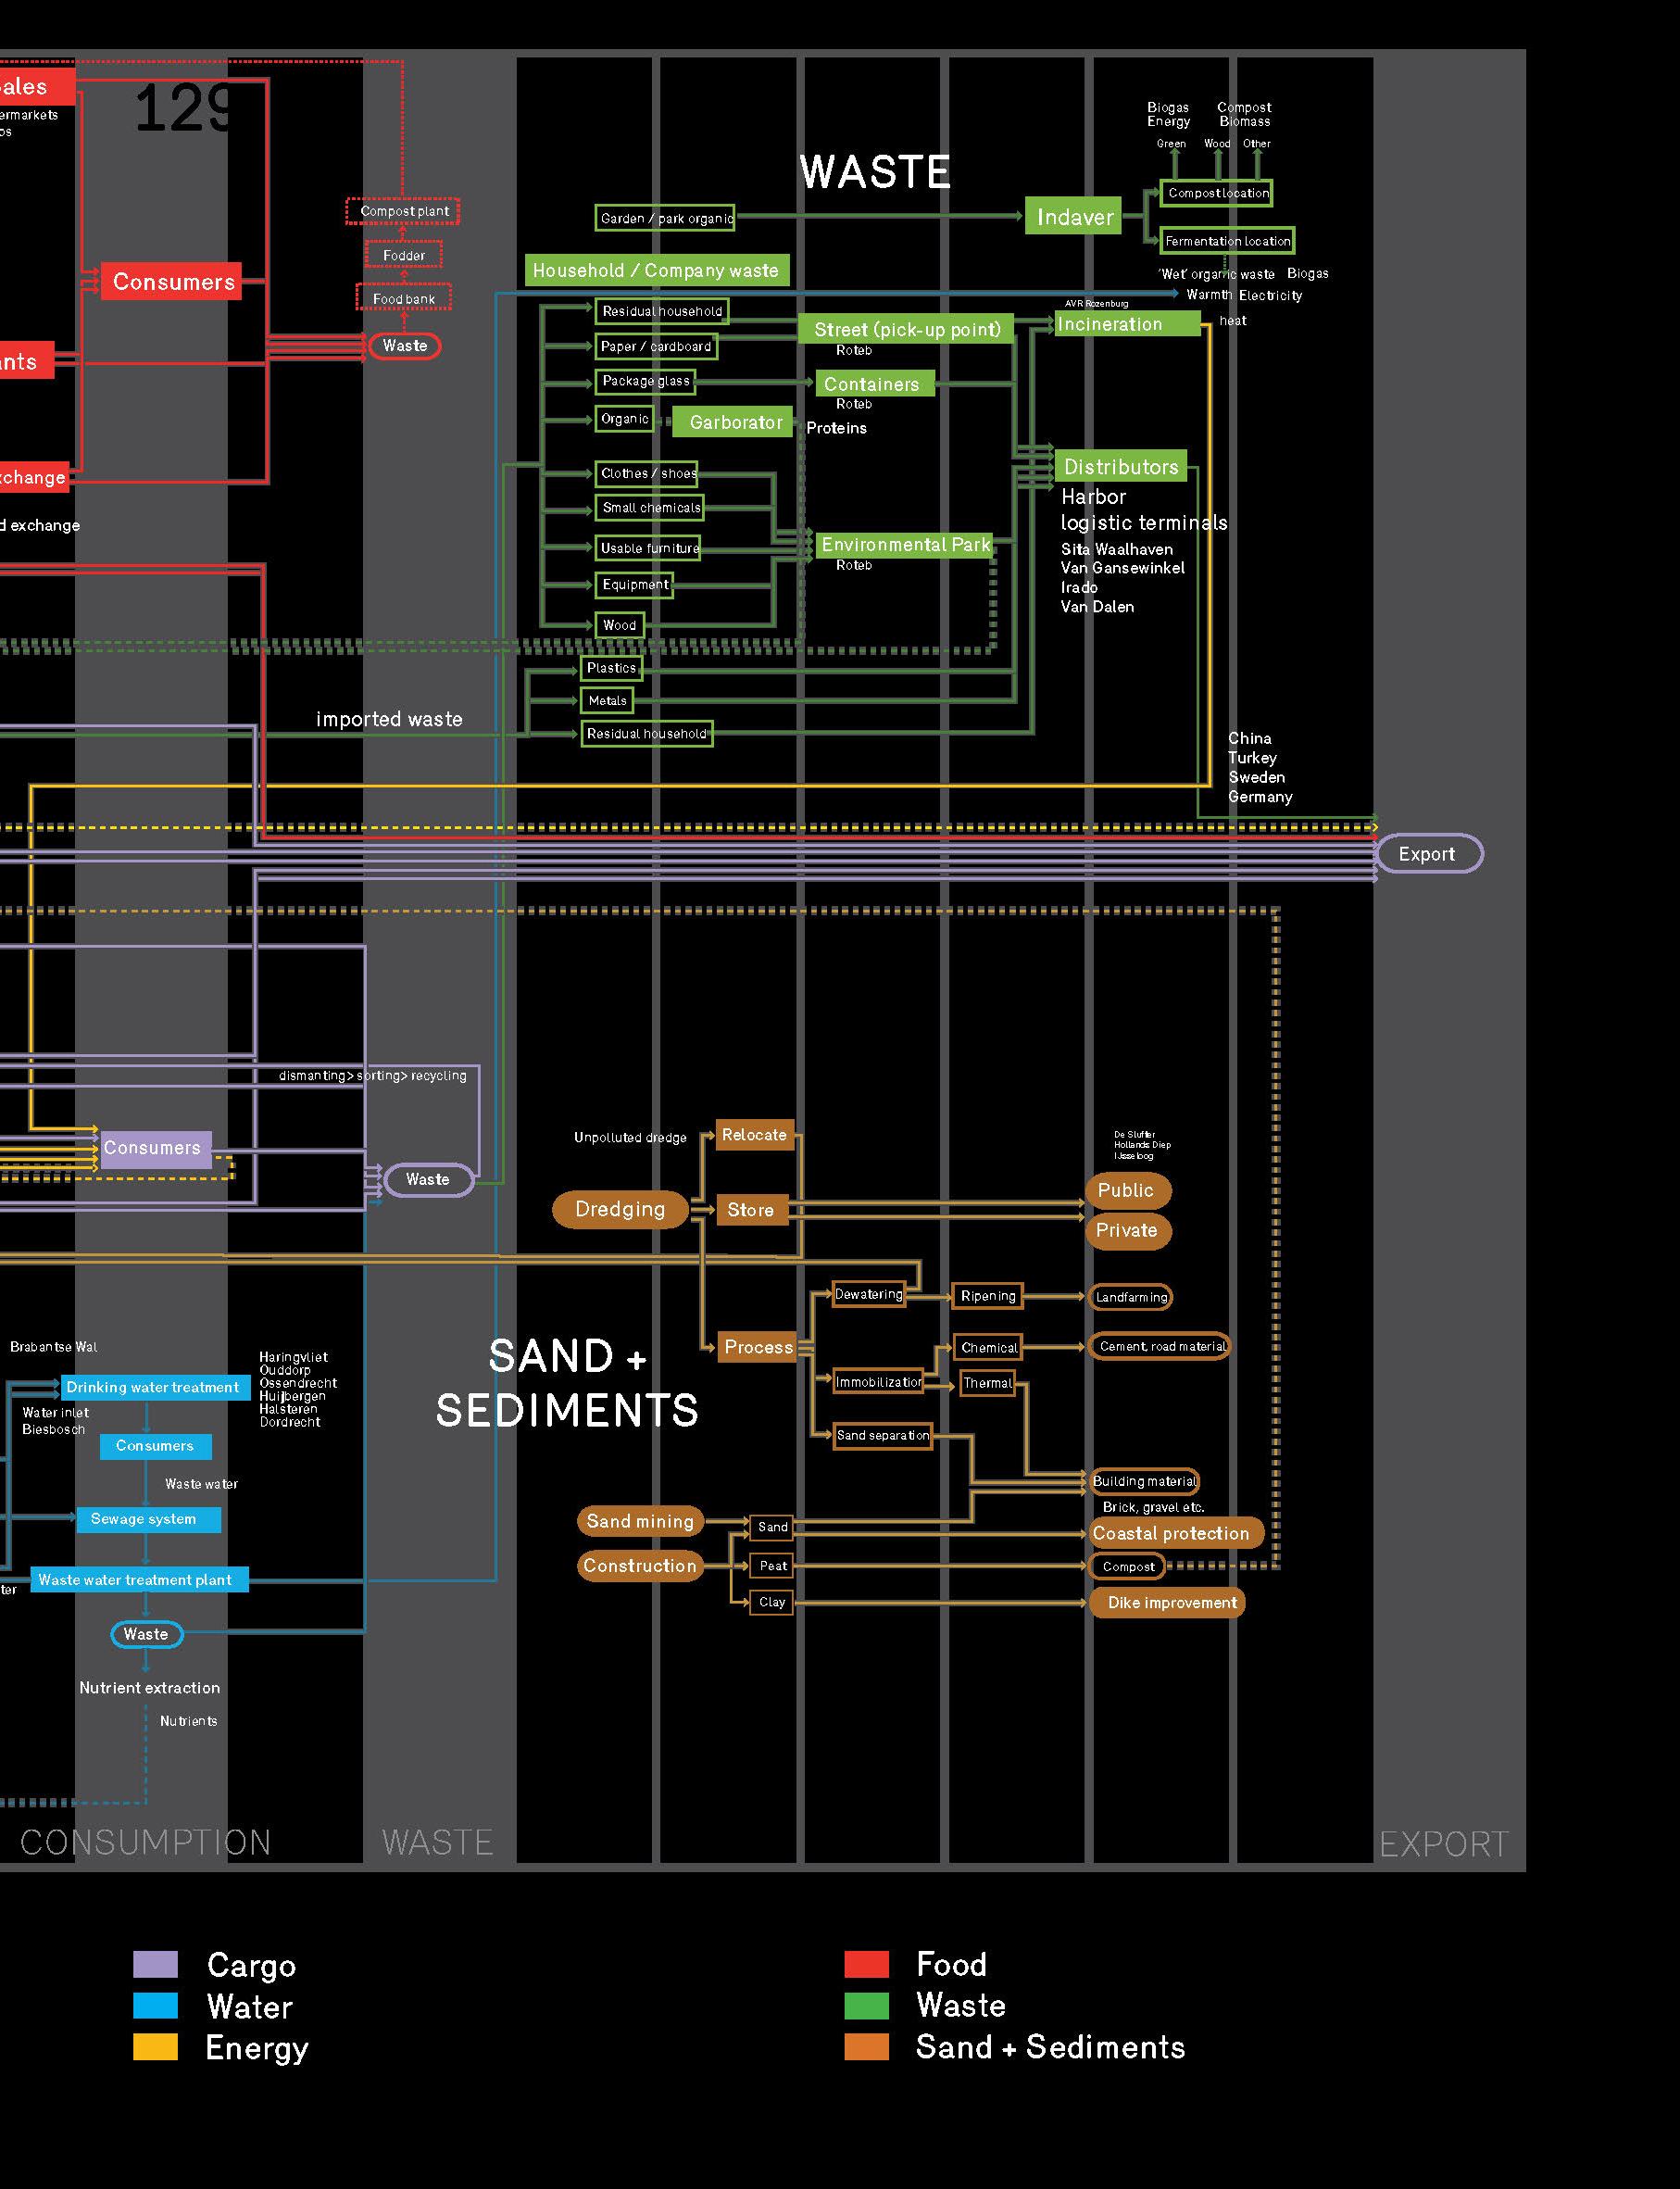
The IABR–Project Atelier Rotterdam, Urban Metabolism, is one of the three IABR–2014–

Global trends are developing towards circular economies. This implies a


10

Urban Metabolism

transformation of the current, linear economy, in which raw materials eventually end up as waste that is subsequently destroyed, into a circular economy, in which the recovery of raw materials is maximized and value destruction minimized. This development will generate new revenue models for the city. Increasing values of land, properties, and businesses in an everexpanding city and port are no longer selfevident. Spatially, the city will develop in a different way. In this changing environment, discovering and seizing opportunities requires an open mind. Rotterdam is aware of this challenge, and our spatial economic strategies and policies in conjunction with the Implementation Strategy Rotterdam (June 2013) provide it with spatial and economical direction. Our economic cluster approach focuses on the application of innovative technology as the key to economic and sustainable growth. Clean Tech, Medical, and Food are clusters we emphasize and which benefit especially from the influence of innovation because they positively impact a healthy urban environment. This way, the Implementation Strategy boosts the transition toward a circular economy. One of the keys to a circular economy is to stop thinking in terms of waste and start thinking in terms of commodities. As a result, opportunities for new investments arise; new jobs that are typical of Rotterdam are created and will transform the city spatially. Urban Metabolism adds a valuable approach to our thinking about the transition of the city and how to realize it. This transformation process is already underway in the region, particularly in areas where different economic clusters collaborate successfully. A striking example

is the heat network (for district heating) that is created by recovering the waste product heat and giving it back to Rotterdam’s inhabitants and businesses. The Port of Rotterdam also provides the important Dutch greenhouse sector of the Westland with CO2. Inseparably connected, the city, the port, the Westland and the river are in flux; they are in the making and will only become more important in the future. ‘Urban mining’, recovering raw materials, for instance from sewage, the river, or urban waste flows, can provide a real breeding ground for agriculture in the region, the Westland or urban agriculture, but can also become a source of materials for urban newbuild or provide us with a strong position in the future commodity market. In the distant future, a link with the pharmaceutical industry through the recovery of raw materials for medical products — the sewers are full of them — is likely. Partners in the wastewater chain are already actively involved in innovation with regard to the treatment of wastewater to extract raw materials. There is much to be learnt from the many innovative businesses in the region. Largescale commercial clusters such as the Westland or the Port of Rotterdam show competitive strength and innovative efficiency as they work toward closing their cycles ensuring the recycling of waste into new raw materials. They enter into new regional partnerships to strengthen their own position and secure their future —a future that is broader-based than that of traditional businesses. The Westland, for instance, is rapidly transforming from a food producer to a provider of plant products for, among other things, packaging and medical companies.

11 Of course, these motives apply to the city of Rotterdam as well. Many of the flows crossing the city (waste, heat, river sediment, and the cargo that transits through the port) are huge and will likely yield revenue models that combine sustainable and economic prospects for Rotterdam, and have a great impact on the spatial and functional transformation of the city. Just imagine: before too long, there will be a transition to a sustainable circular economic system with the port as a logistic hub for the import and export of raw materials, recycling of waste materials, coupled with an urban manufacturing industry that offers great opportunities for new business and employment. In the city, innovation facilitates the building or transforming of premises that no longer only consume energy, but also produce energy, coupled with local energy storage concepts or local raw materials production. These are actual, relatively short-term developments that are also addressed in the IABR–Project Atelier, developments that will affect the usability of the city and will drastically change its infrastructure. The city and its partners are already conducting 1:1 innovative experiments to develop knowledge in the field of sustainable urban development and its spatial consequences in the Heijplaat concept–houses project. The outcome of the IABR–Project Atelier consists of a series of inspiring visions, ideas, insights, and proposals for pilot projects. Two of these are the innovative development of the heat network that can be of great significance to the Rotterdam region, and the new prospects for the boulevards on the south bank — combining the facilitation of the manufacturing industry with the introduction of innovative, clean

public transportation concepts. They connect to existing networks or provide a refreshing perspective of the future of Rotterdam South. The Project Atelier thus provides a collection of spatial economic concepts that will boost the development of a circular economy system in an attractive Rotterdam region. The knowledge resulting from the Project Atelier is an incentive for a groundbreaking collaboration between all stakeholders involved in the Rotterdam area. We welcome the collaboration with stakeholders and businesses in Rotterdam, to share knowledge and space to forge new coalitions that will jointly work to achieve a healthy future of Rotterdam. After all, we all benefit from a strong, attractive and resilient Rotterdam. Ahmed Aboutaleb Mayor of Rotterdam


Urban Flows for a Sustainable Urban Landscape

In this chapter we will deal with a number of questions about urban (substance) flows. What exactly are substance flows, and how do they relate to urban metabolism? How can they contribute to a better quality of urban life, not only here and now, but also elsewhere and at a later stage? What are the views of the International Architecture Biennale Rotterdam (IABR–2014) on substance flows and urban metabolism, and how does this body of ideas contribute to the concrete implementation of urban tasks, as in the Project Atelier Rotterdam?

Chapter 1

Joris Laarman — Designer

The switch from an analogue to digital society has brought us on the eve of a new Industrial Revolution. The manufacturing and distribution systems of a vast majority of products will be completely overhauled.

Urban Metabolism

13


14

Urban Metabolism

We use the concept of urban metabolism to describe the urban system in organic (not artificial) terms, by drawing a parallel with the human body. Metabolism is therefore a key concept here: the metabolism of the urban landscape. How do the ingenious, interlocking flows and systems in this complex, interactive urban system work, which incessantly works to meet the needs of its residents?1 To make this urban metabolism visible, a num­ber of vital flows will be dealt with. This us­ually concerns physical flows, i.e. substance flows.2 In the final chapter a link will be created to information flows and value streams in order to be able to use this ap­ proach in daily practice. For the time being, we will concentrate on goods, people, waste, biota (inter alia plants and animals), energy, food, fresh water, air, sand and clay. Although people and energy cannot exactly be regarded as substance flows, in a way, it also concerns matter that flows from one location to another. We will also examine building materials, freight traffic and waste. For example, waste management is one of the main cost items of municipalities around the world.3 Therefore, these flows affect the everyday lives of individual city-dwellers and their basic needs. To some extent, there is even a one-on-one relationship with what our body’s metabolism requires. They also affect the operation of large urban constel­lations as a whole. Each of these flows is indispensable to the city’s functioning and well-being. However, these flows will not remain the same in the decades ahead in view of changing requirements and contexts. It will often be extremely difficult to allow them to take place whilst ensuring good quality and greater sustainability. This is an enormous yet concrete task, which will be of interest to designers and planners, but also to companies, investors, administrators and concerned citizens.

Although cities have previously been ­approached as a form of metabolism in the past, urban metabolism has really only ­broken through as a branch of science in the past decade, following a start in the seventies in environmental ecology. We can distinguish two different schools in the scientific field of urban metabolism: ­— An environmental school in the tradition of industrial ecology: How does urban metabolism work? How do the production and consumption chains fit together? What are their effects on the local economy, the quality of urban life and sustainability? For example, think of how raw materials and energy flow through the city.4 — A sociological school: What purpose does it serve? What life-forms can it sustain? How do the constituent parts fit together? In what social and political context does it exist? Are there behavioural differences between specific social groups? Largely as a result of the emergence of smart phones, an increasing amount of information is becoming available, about usage patterns. The spatial perspective has not yet received the attention it deserves: In what form can we best apply the characteristics and possibilities of substance flows to urban life by means of spatial design? This is why this school is the main focus of IABR–2014– URBAN BY NATURE. Urbanization and Sustainability The world population is expected to increase to nine billion people by 2050. Emerging economies are building at a fast rate. Whereas slightly over 10 per cent of the world population lived in cities in 1900, this figure is now 53 per cent. This is expected to increase to 70 per cent or higher by 2050.5 The average level of prosperity is also rising. The use of natural resources and fossil fuels and the consequences thereof (e.g. the

15 emissions of pollutants and the strain on nature, agricultural lands and biodiversity) increase as a result. At a time when climate change has become an established fact, there are a larger number of people who want more on a diminishing usable surface area, with a decreasing number of raw materials.6 Until now, we have not been able to create prosperity without adversely affecting our living environment. The effects can be felt around the world. An increasing number of city-dwellers are faced with problems connected with this. This also applies to Dutch cities! For instance, an increasing number of people are now spending 15% or more of their income on energy.7 A large part of this income can therefore not be used for personal development (e.g. education or sports). This income is therefore also not invested in the local economy. A transition to a sustainable urban community is therefore essential! A world, where it is possible to create prosperity with a positive effect on our living environment and communities. This is an enormous task. Decisions and choices at local and regional level can contribute to this to a great extent. But what does this mean specifically for the city? The city has its own dynamics. In this context, which buttons can we press to be this attractive and economically successful city, with a good quality of life, not only here and now, but also elsewhere and at a later stage? Urban by nature For the IABR 2014, curator Dirk Sijmons took the idea of the Anthropocene (“the Age of Man”), which was developed by geologist and Nobel laureate Paul Crutzen, as a point of departure. A revolutionary new concept. Crutzen suddenly realized that too many things had changed over the last few

centur­ies to still be able to talk about the Holocene as the current age: the Holocene has since been abandoned for a new era, where man intervenes on earth as a force of nature. Following on from this, Sijmons concluded that a new era had dawned, where it was no longer fruitful to separate man from nature, since town and nature overlap spatially and interact functionally. Rather than contrasting urban society with nature, Sijmons chooses to place nature in man, in society. He asks: What new terms can we use to talk about cities in the Anthropocene? And what new problem-solving approaches would come about if we were to try to consider the whole network of relationships between the two, as opposed to putting either people or things first? Thinking about urbanism has long had the character of thinking in terms of inner worlds, including the characteristic behaviour of passing on problems. Urban problems were preferably dealt with by dropping them elsewhere. However, this approach has become increasingly pointless since the human habitat coincides increas­ ingly with the urban landscape, within which urban problems will have to be solved . However, cities are interconnected by flows. Flows enter a city, are reused or stored (or not), and leave a city again. The metaphor of urban metabolism makes it clear that although cities can no longer pass on their problems, neither can they stand alone. Sijmons regards the following as the main tasks here: – Securing the access of city-dwellers to flows of daily necessities, such as water, food, communication and energy. In rapidly growing tropical towns, this literally makes the difference between life and death.


16

Urban Metabolism

Although such urgent, global urban problems seem to be far removed from the Netherlands, much will have to be done here in order to be able to guarantee the quality and availability of these amenities in the future in the face of global competition for scarce raw materials. Through in-depth knowledge of the urban flows and smart, draft strategies for the flows and their infrastructure based on efficiency and interaction, the urban landscape’s metabolism will be able to develop into a valuable planning instrument, as a result of which the circular economy will be able to develop. — Creating cohesion between urban flows. Every flow has its own infrastructure. Think of the electricity grid, water supply network, heat network and transport network. Substance flows do not necessarily have to be spatial by nature. According to Sijmons, they represent the process side of the urban landscape. Technically speaking, the individual infrastructures can be increasingly better designed and optimized. They can also be aligned further. For example, think of storing the electricity from solar panels in car batteries. The design of the infra­ structure itself should also be mentioned here (e.g. the “glow in the dark” roads conceived by Daan Roosegaarde and Heijmans, where oncoming traffic lights up the road markings at night so that no costly lighting is required). — Maximizing the positive effects on the quality of the living environment. Those who think in terms of flows can establish links. We can shorten and connect flows, we can make cycles come full circle and we can use the output of one flow as input for another. This is made possible by knowledge and data, although, according to Sijmons, it requires a different mode of perception and thought to extract opportunities from the

large amount of data on urban flows. However, with this knowledge and data, we can considerably improve the environmental performance, i.e. the effects of substance flows and production-consumption chains on the quality of the living environment. — Taking advantage of the urban landscape’s “spatial order”. This order is to a significant degree affected by the location of the infrastructure, such as mobility, utility and heat networks. Apart from innovation and optimizing existing networks or constructing new networks for densification (see 5th IABR: Making City),9 the design of the urban infrastructure can be deliberately used to drive large urban expansions. Where coordination between the construction of infrastructure and urban expansion is now often lacking in practice, smarter infrastructural planning will contribute to better spatial planning and an urban landscape which functions better and is ecologically more efficient.10 Globally, this concerns hundreds of billions of euros in investments in infrastructure in the decades ahead, which can be spent wisely or poorly, in an ad hoc or sustainable manner, comprehensively or per sector and with a low or high return. Today’s decisions will determine the city’s future environmental performance. It is therefore important to make sound decisions, which also take account of such matters as employment and innovation, based on a new and effective range of draft solutions. Urban Metabolism in the PROJECT ATELIER ROTTERDAM Can the concept of urban metabolism actually help us to implement the tasks facing us in cities, in this case Rotterdam? It is the key question which has been asked several times before. Rotterdam’s objectives are clear: a safe,

17 healthy, attractive and economically successful city, which is prepared for future challenges. This means, amongst other things, creating the conditions for a caring society, where we look out for one another. A community where talent development and career opportunities are provided for highly educated as well as less educated Rotterdam residents. In a high-quality living environment where there are opportunities for entrepreneurship. The city as the focus of the existing and new economy. A “breeding ground” for innovation, so that we can increase our competitiveness. But also to prepare the city for socially urgent issues, such as an ageing population, higher healthcare costs, climate change and progressively scarce raw materials. The transition from the current economic model to a more circular economy also requires structural changes. Can urban metabolism help here? In short: Yes. Chapters 3 and 4 give a glimpse of possible solutions. When we consider the theme of this biennale — Urban by Nature — we will also have to look beyond the boundaries of the municipality of Rotterdam and look for solutions where the city and the surrounding countryside are in balance, without passing on problems. However, how do we move from potentially endless and seemingly unconnected flows to a coherent idea about urban metabolism, which can be used to effect change? The Project Atelier Rotterdam worked out spatial designs for the region and (parts of the) city that take advantage of opportunities for a more efficient urban metabolism, which also creates added value in the region. As previously stated, urban metabolism is analogous to human metabolism, since the human body, just like a city, has a layered system of overlapping networks that facilitate flows. Think of the circulatory

system, the digestive tract, the lymphatic system, the nervous system or, for example, the skeleton. The flow of blood, nutrients, lymph, nerve signals and the regeneration of our skeletal system not only pertain to different networks, but also shows different rates of flow. Although the urban flow approach is very strong, instead of representing this flow merely as a single living organism —a human being— it would be interesting to regard the city as a complete ecosystem with substance flows, since the efficiency of an ecosystem does not result from the fact that there is no waste, but from the fact that there is always something being done with waste.11 TNO (the Netherlands Organisation for Applied Scientific Research) has carried out additional research into a number of substance flows in the Rotterdam region. Using what is referred to as “Material Flow Analysis” and “Life Cycle Analysis”, the flows were analyzed (from district to regional level) and the consequences of the urban flows were identified. This is important, since they can now be linked to urban human activity. In the next chapters the urban substance flows will be revealed, the effects on the living environment will be calculated and perspectives and initiatives will be presented so that the force of urban metabolism can be felt. 1 Sijmons D. , Urban by Nature, International Architectural Biënnale Rotterdam, 2014. 2 Kennedy C., Pincetl S., Bunje P., The study of urban metabolism and its application to urban planning and design. Environmental Pollution 159: 1965–1973, 2010. 3 Hoornweg D., Bhada-Tata P., Kennedy C., Waste Production must peak this century, Nature, vol 502 p. 615, 2013. 4 Barles S., Urban Metabolism of Paris and Its Region. Journal of Industrial Ecology, Vol. 13, Nr. 6, pp. 898-913, 2009. 5 Global Cities Indicators Facility, Policy snapshot no 2. collaboration with Philips, Cities and Ageing, 2013. 6 Tillie N., A sustainable city calls for a new synergy between top-down and bottom-up, Council for the Environment and Infrastructure. (Toekomst van de stad. p 41).,Raad van de Leefomgeving en Infrastructuur, 2012. 7 Municipality of Rotterdam, GIS data on income and energy costs.

8 Brugmans, G., Strien, J. (ed.) (2014) IABR—2014—URBAN BY NATURE— 9 Tillie N., Aarts M., Marijnissen M., Stenhuijs L., Borsboom J., Rietveld E., Doepel D., Visschers J., Lap S., (2012) Rotterdam people make the inner city, densification plus greenification = sustainable city, Mediacenter Rotterdam, 2012. 10 Newman P., Kenworthy J., Sustainability and Cities: Overcoming Automobile dependancy. Washington DC Island Press, 1999. 11 The idea that, in theory, ecosystems represent efficient and self-sufficient systems needs further qualification. It requires a continuous input of energy and nutrients in the form of sunlight, nitrogen, CO2 and oxygen in the air to maintain each ecosystem. Ecosystem cycles are only “closed” at the level of the biosphere, and also on this scale complete dependency on energy remains in the form of sunlight.


To be able to investigate how the concept of “urban metabolism” can contribute to the city’s sustainable development, nine vital substance flows were identified by the Project Atelier

substance flows were analyzed on two different scale levels: the catchment area of the Rhine and the city region of Rotterdam. Rotterdam appears to have a characteristic profile on both

Nine Flows Highlighted Rotterdam, namely: Goods, People, Waste, Biota (e.g. movements of plants and animals), Energy, Food, Fresh, Water, Sand & Clay, Air. The course of the various substance flows was examined, and a way was sought to increase —using these nine flows— Rotterdam’s environmental performance, quality of life and economic vitality. Where does waste occur, where can potential synergies be put to better use and how can waste and synergies be turned into opportunities for the city and region? To complete the picture as much as possible, the

scale levels. These profiles can be linked to current developments at local and global level, as a result of which opportunities arise for making the urban system more sustainable. An example is recovering phosphates (as opposed to importing them) from exhaustible resources, such as phosphate mines. This resulted in several perspectives for action being formed for each flow, which the Project Atelier eventually translated into four proposals for taking better advantage of flows in Rotterdam.

Chapter 2

— Chris van Langen, Director, Rotterdam Academy of Architecture and Urban Design

Studying the city as a metabolism of its own requires ‘metabolic’ thinking: cyclical, iterative, fuzzy, beyond denominations of ‘right’ and ‘wrong’. That is, thinking in design terms.

Urban Metabolism

18


20 Metabolism Rotterdam

21 CARGO IMPORT

TURNED INTO WASTE

FURTHER PROCESSED AND PRODUCED

EXPORT

Agricultural Products RESOURCES

IMPORT

TURNED INTO WASTE

FURTHER PROCESSED AND PRODUCED

EXPORT

417 kton

Agricultural Products

4.890 kton

Quarrying (excluding gas)

7.930 kton 4.816 kton

-2.187 kton

- kton

2.286 kton

3.114 kton

Quarrying (excluding gas)

WATER

Urban Metabolism

383.815 kton

Rain Water

Sewage Water (from rain and drinking water)

SEMIFINISHED PRODUCTS

691.860 kton

FINISHED PRODUCTS

Drinking Water

58.082 kton

58.082 kton

Petroleum Products

1.240 kton

Textile Petroleum Products Chemical Products Specific Building Materials Basic Metal Products Metal Products

195 kton

96 kton -52 kton

47 kton

590 kton 389 kton 195 kton 59 kton 42 kton

23 kton 9,0 kton 87 kton 0,1 kton 0,3 kton

-410 kton -178 kton -20 kton -52 kton -24 kton

157 kton 202 kton 88 kton 7,0 kton 18 kton

Petroleum Products Chemical Products Specific Building Materials Basic Metal Products Metal Products

1,0 kton 77 kton 100 kton 12 kton

0,7 kton 0,1 kton 0,1 kton 0,4 kton

-0,2 kton -36 kton -87 kton -4,9 kton

0,1 kton 41 kton 13 kton 2,8 kton

Electrotechnical and Electronic Products Machines Transport Furniture and Other Products

Electrotechnical and Electronic Products Machines Transport Furniture and Other Products

366.127 kton

600 kton

Petroleum Products

1.010 kton

2.850 kton Textile

Ground Water (from rain water)

58.082 kton

CARGO Cargo Transit

220.000 kton

220.000 kton

Cargo Transit

OTHER FLOWS IMPORT

TURNED INTO WASTE

FURTHER PROCESSED AND PRODUCED

EXPORT

ENERGY

Resources Semi-Finished Products Finished Products Energy Food Waste

14.060 kton 1.470 kton 190 kton 157.955 TJ 617 kton

5.833 kton - 1 177 kton 215,4 kton -736 kton 4,9 kton -128,1 kton

8.250 kton 519 kton 56,9 kton

179.343 TJ 68.492 TJ

47.104 TJ

523 kton

646 kton

Resources 20.396 TJ

Semi-Finished Products Finished Products Energy Food Waste

Gas

58.727 TJ

City District Heating

Flowchart of water, goods, energy, food and waste through Rotterdam. The width of the energy flows are based on natural gas equivalents (1 TJ = 0.0264 kt)

FOOD

Material flow analysis of the City of Rotterdam, Rotterdam baseline study. The region has a multitude of materials and energy that flows through the city: approximately 37 kilotons per person (more than 5,000 adult elephants) per year. By far the largest flow of all physical flows, is river water (98 per cent). The material flow of

Rotterdam covers 200,000 kilograms of material per year (of which 93 per cent immediately is exported from the area). This figure shows the relative size of the different physical flows through the region.

WASTE

67.500 TJ Electricity

58.727 TJ

992 TJ

Fuels

99.228 TJ

99.228 TJ

Meat and Fish

52 kton 139 kton

52 kton 139 kton

Cereal

111 kton

Diary

152 kton

111 kton 152 kton

Other Food

163 kton

Potatoes etc

67.500 TJ

69 kton

992 TJ

- kton - kton

- kton - kton

- kton

- kton

- kton

- kton

- kton

- kton 145 kton

Large Waste (excl the following)

375 kton

Small Waste (excl the following)

35 kton 17 kton 27 kton 47 kton

GFT Glass Construction and Demolition Waste Paper


22

23

The transit trade through the port of Rotterdam, one of the largest transit ports in the world, amounts to 220 million tonnes a year. However, the regional economic spinoff from the port of Rotterdam is considerably smaller than that of nearby ports (e.g. Antwerp, Hamburg, Le Havre, Helsinki). Although the transit trade through the port of Rotterdam is twice that of Antwerp, the Rotterdam’s employment rate appears to be only 17 per cent higher. Measured by the direct added value per tonne of transit cargo, that in Antwerp comes in approximately 10 per cent higher. The freight flows through Rotterdam therefore largely pertain to goods manufactured elsewhere which usually bypass the city. Furthermore, many companies in Dutch cities that are able to create added value have relocated to lowwage countries. International trends that have a significant impact on the physical quality of cities are:

the increase of scale in the retail sector and the decreasing popularity of fixed retail outlets; as a result of online shopping, consumer products are increasingly delivered directly at home. Shops are slowly disappearing from city streets as a result. Limited economic spin-off and a smaller role for the retail sector results in emptier city streets, with a reduced market and social value. Can this be turned around? Looking at the flow of goods, the question arises whether it is possible to use a small part of the enormous flow of goods which now largely bypasses the city more efficiently in order to create added value in the city itself?

Goods

Urban Metabolism

Goods


24

25

LEGEND

regio kaart 124%

N W

O

Z

5

50

100 km

Sources: http://www.eetbaarrotterdam.nl

Goods—region

Urban Metabolism

Container terminals Cargo hubs Shipping routes Cargo main flows


legend

Harbor bussiness in central Rotterdam Oil and oil products Chemicals, biofuels and edible oils Gas and power, coal and biomass Container terminal Ship intensity Motorway intensity N n

W O o

Z z

1: 100 000

Sources: Port of Rotterdam, http://changeyourperspective.com/, Municipality of Rotterdam, Rijkswaterstaat, Ministerie van Infrastructuur en Milieu, Economische verkenning Rotterdam 2013

Goods—city

Urban Metabolism

26 27


28

29

People have many different reasons for moving. The most common reasons have to do with work, education, family and friends, but also shopping, recreation, cultural and other facilities. One third of the world population will probably move from the countryside to the city in the decades ahead, seeking a better existence.1 It is therefore expected that over five billion people will live in cities by the year 2030. Entrepreneurial freedom and access to jobs are some of the important conditions on the way to this better existence. Car access to Rotterdam is good. An analysis of the city’s access structure – using the “space syntax” method – shows that there are residential areas and commercial districts in South Rotterdam where access for cyclists and public transport commuters is less self-evident. For instance, the east-west links in South Rotterdam for public transport commuters and cyclists are definitely

underdeveloped. Most commercial districts and training centres are situated to the north of the Maas, but access to the commercial districts in South Rotterdam is also inadequate for people without a car. This has resulted in a form of “mobility deprivation”. The question is: How can we improve regional and municipal access to work and education, particularly for South Rotterdam?

1 Saunders, D. (2011) Arrival City: The final migration and our next world.

People

Urban Metabolism

People


N

W

5

O

Z

50 100 km Sources: EU parlament studie 2007, Euroscientist.com, FABEC, EurRail, Global Finance, Universum Global, The world’s most attractive employers 2013\\, Innovation Cities, Eurostat, 4 International Colleges & Universities

People—region

Urban Metabolism

30 31

LEGEND

Main airport connections High speed train connections City indexes top 10 Top employers Universities Data Center Backbone Network Signal Strength strong 3G+4G-weak


legend

Signal Strength strong 3G+4G–weak Elementory school VMBO HAVO and VWO MBO University Reachable jobs within 45 min. Problematic neighborhood N

W O

Z

1: 100 000

Sources: http://waagsociety.github.io/mansholt/map/, http://www.portofrotterdam. com/, http://changeyourperspective.com/, http://www.planetware.com/, http://www. ah.nl/, http://www.nationsencyclopedia.com, http://www.rotterdamseoogst.nl/home/, http://www.eetbaarrotterdam.nl/, http://nl.sireh.com/co/r/rotterdam_companies/, TNO

People—city

Urban Metabolism

32 33


34

35

179%

Waste can be defined as “throwing away previously processed raw materials”. Because they are compacted or transformed, they do not look like raw materials. However, appearances can be deceptive. There is growing awareness that the city’s waste contains raw materials, disguised as consumer electronics or food. It may be worthwhile to use these raw materials more efficiently in a circular economy.2 Therefore, in theory, the city may be regarded as an enormous market-place of usable raw materials. An important observation, considering that Europe depends on other continents for a large number of raw materials, and that raw materials are becoming progressively scarce and expensive as a result of global population growth, rising levels of prosperity and the exhaustion of various resources. It is therefore useful to regard the city as a new “mine” for extracting essential raw materials. On average, Dutchmen throw away 530 kilos

a year. In Rotterdam, 49-75 kilos of this is fruit and vegetable waste, which is currently incinerated (for district heating). In addition to organic waste, 3.4 kilos of electronic waste is collected for each Rotterdam resident every year, a substantial part of which is mobile phones. 1 tonne of telephones yields 140 kg of copper, 3.14 kg of silver, 300 gm of gold, 130 gm of palladium and 3 gm of platinum. Because the techniques for recovering raw materials from household waste, sewage water and electronics are rapidly being developed, we are increasingly often able to recover raw materials from waste, i.e. “upcycling”. Just as it applies to recycling, the recovery of raw materials starts at home. However, the question is: How can we organize our living environment for this? 2 Bastein, T., E. Roelofs, E. Rietveld, A. Hoogendoorn (2013), Opportunities for a circular economy in the Netherlands, TNO Delft.

Waste

Urban Metabolism

Waste


36

37

LEGEND

N W

O

Z

5

50

100 km

Sources: European Environment Agency, Roteb

Waste—region

Urban Metabolism

Recycling of municipal waste 90%–10% Italian waste Package glass Paper and cardboard Metal Wood A+B Wood C Clean waste Maltha Coolrec Environmental park Second hand shop Glass company


39

legend Recyclation of household waste 100%–0% Organic waste per neighborhood 1400–20 ton/year Old paper and cardboard Glass packaging Discarded equipment Coarse garden waste

Metal Wood waste A+B Wood waste C Residual household waste Containers

AVR waste incinerationl Van Gansewinkel Van Gansewinkel Minerals Sita Sita Ecoservice Van Gansewinkel NL B.V.

Irado Roteb Service

N W

O

Z 1: 100 000

Sources: COS (Centrum voor Onderzoek en Statistiek), Agentschap NL, http://rtb.container-beheer.nl/burgerkaart.php, Roteb

Waste—city

Urban Metabolism

38


40

41

Rotterdam lies at a point where river, peat-meadow and dune landscapes converge. Because of the urbanization that has taken place over the past few decades, only a few “green” and “blue” structures are linked up. As a result of fragmentation and more intensive farming methods, many of the species monitored in the peat-meadow areas have decreased considerably in number.3 Other landscapes show a similar trend. The spatial reservations which businesses make for security reasons – or with a view to possible future expansions – create empty spaces in the port of Rotterdam. When these areas are left alone, spontaneous nature rehabilitation takes place there, with interesting types of plants, amphibians, reptiles and mammals. A similar situation occurs around power stations and below high-voltage lines. Because of regulations, no human activity may take place there. As a result, there are many square kilometres of empty space in

the region of Rotterdam that could well be used to strengthen nature in qualitative and quantitative terms. Because nature rehabilitation often meant that landowners had to deal with numerous restrictions in the past, many businesses have adopted a policy that prevents nature rehabilitation. However, changing insights, particularly on the side of environmental protection organizations, show that “temporary nature” can be very valuable. In other words, spontaneous nature rehabilitation and spatial reservations for future use are not necessarily mutually exclusive. In fact, it is more a matter of how the space that cannot be used for human activity can serve as a stepping-stone for biota without frustrating economic interests.

3 Ottburg, F., Schouwenberg, E., (2005) Nature in peat-meadow areas a matter of choice, Peat meadow shown 25 times, Alterra Wageningen

Biota

Urban Metabolism

Biota


N

W

5

O

Z

50 100 km Sources: ATKB Geldermalsen, 2001, Vismigratie Rijn-Maasstroomgebied– samenvatting op hoofdlijnen, Stroming, 2012, A green rhine corridor, Master Plan Migratory Fish Rhine, ICOR report no. 179, IKSR/CIPR/ICBR

Biota—region

Urban Metabolism

42 43

LEGEND

Rhine delta Rhine estuary Bird migration route Habitat directive protection area Bird directive protection area Eels migration route Migrating salmon from sea to river Migrating smolts from river to sea


legend

Adult fish from sea to river Young fish from river to sea Wintering birds Seal movement N

River gradient salt-sweet Park and forest Powerline W O

Z

1: 100 000

Sources: ATKB Geldermalsen, 2001, Vismigratie RijnMaasstroomgebied - samenvatting op hoofdlijnen, Stroming, 2012, A green rhine corridor, Centraal Bureau voor de Statistics

Biota—city

Urban Metabolism

44 45


46

47

On average, a Dutch household consumes 466 gigajoules of energy per year. The raw materials for this come from all over the world: coal from Australia, gas from the Netherlands and Russia, petroleum from Saudi Arabia, biofuel from Brazil and electricity from Germany. Modern coal-fired power stations realize a return of at most 46 per cent, i.e. 54 per cent of the raw materials are not converted into electricity but are released as residual products in the form of heat and carbon dioxide. When we add the residual heat from other industrial processes to this, we are talking about a large amount of residual heat: every year, more than twice the equivalent of all the energy generated on the Dutch side of the North Sea by wind turbines. Depending on various calculations and assumptions, we are talking about 80–160 petajoules. A large part of this excess energy is not yet used in district heating, but is discharged into the

surface water in the form of heat. The annual CO2 emissions in Rotterdam now amount to approx 29 megatonnes, over 85% of which comes from the manufacturing industry and energy generation in the portindustrial complex. It is a missed opportunity, both in economic and ecological terms, to continue to waste heat in this way. This was already recognized in 2007 by the Rotterdam Climate Initiative, which set itself the task of cutting CO2 emissions by 50 per cent in relation to 1990. If we wish to achieve the Kyoto carbon dioxide emission targets or the objectives of the province of South Holland, we will have to intervene. And as for heat, it is not likely that we will be allowed to discharge heat on this scale for very much longer. For example, it is already forbidden to discharge heat in the Copenhagen – Malmö – Helsingborg region. In other words, an important task for us as far as this substance flow is concerned is to take better advantage of the residual products of energy generation.

Energy

Urban Metabolism

Energy


48

49

LEGEND

Energie

N W

O

Z

5

50

100 km

Sources: Euroheat 2012–Heat Roadmap Europe 2050, http://www.green-x.at/RS-potdb/potdb-long_term_potentials.php

Energy—region

Urban Metabolism

European HOTspots heat surplus and demand Geothermal resources Light pollution Coal Gas Oil or gas pipeline Wind turbine park Wind energy (potential) Powerplants Global irradiation 1600 kWh/m2–1000 kWh/m2


50

51

legend Powerplants Heat source Powerline CO2 emitters Pipeline Windmills

Cretaceous aquifers, about 2 km. deep, 50% chance: 5 to <15 MW Trias aquifers, about 4 km. deep, 50% chance: 10 to> 20 MW

1 2 3 4 5 6

Maasvlakte, 80 MW, E.ON Maasvlakte, 1052 MW, E.ON AVR-Botlek, 124 MW. Rijnmond Energy, 820 MW. Galileistraat, 209 MW, E.ON Roca, 269 MW, E.ON.

7 Pergen, 300MW. 8 Enecogen, 830 MW. 9 Centrale Rotterdam, 300MW.

N W

O

Z 1: 100 000

Sources: Port of Rotterdam, NASA, Studio Marco Vermeulen, Agentschap NL

Energy—city

Urban Metabolism

Energie


52

53

When we talk about food, we largely refer to nutrients in this flow. Other aspects of this flow that affect daily practice will be dealt with in Chapter 4. Nutrients are essential materials for living organisms. Some of these nutrients (e.g. phosphates) are essential for our survival but, like fossil fuels, are exhaustible. In the agricultural sector alone, 28 million tonnes of phosphate are emitted (in the form of fertilizer) in the Netherlands every year, which is currently drained into groundwater and surface water.4 These nutrients are therefore not used, and often result in local over fertilization, thereby adversely affecting nature. However, valuable nutrients are lost at many other points along the entire food production-consumption chain. Approximately one third of all the nutrients are eventually lost during our food production. Because the largest part of the Northern European farmland drains directly or indirectly into the Rhine, this river represents Europe’s largest open-air

drainage channel of nutrients. All these unused nutrients flow to the sea through the port of Rotterdam, after which they can hardly be detected, except as a breeding ground for excessive algae growth. 582 tonnes of phosphorus are discharged in Rotterdam every year, half of which into the sewage system. Less than 2 per cent of this amount is recovered.5 According to the least optimistic estimates, global phosphate supplies will last us for approx fifty years. If we let these supplies drain into the sea, food production will eventually come under pressure. Phosphate prices are expected to rise. We can – and should – do something about this.

4 Smit, A. L., Curth-van Middelkoop, J. C., van Dijk, W., van Reuler, H., de Buck, A. J., and van de Sanden, P. A. C. M. (2010). A quantification of P flows in the Netherlands through agricultural production, industrial processing and households. Plant Research International, Wageningen University and Research Centre, Wageningen

5 Kirsimaa, K. Internship report City Of Rotterdam: Urban farming in Rotterdam: an opportunity for sustainable phosphorus management? Wageningen University and Research Center, 2013.

Food

Urban Metabolism

food


54

55

LEGEND Fertilizer input (soil) Chlorophyl concentration Nutrient catchment and transport Nutrient sink (consumption) Waste water treatment plant

Food—region

Urban Metabolism

Voedsel

N W

O

Z

5

50

100 km


56

57

legenda Wastewater treatment plant Phosphate per neighborhood Agriculture Nutrient loss in river

Urban agriculture Food processing company Water overflow Wastewater pump Incineration plant

R&D, Office

Unilever R&D Unilever R&D Unilever NV Unilever BV

Core areas

Spaanse Polder Waalhaven Groenpoort Barendrecht Lekhaven Merwedehaven

Soy and edible oils

ADM Soy EBS Agri EBS Agri RBT Agri

N

OIO Loders ADM Edible Oils Cargill Edible Oils

W

O

Z 1: 100 000

Sources: http://waagsociety.github.io/mansholt/map, http://www.portofrotterdam.com, http:// changeyourperspective.com, http://www.planetware.com, http://www.ah.nl, http://www. nationsencyclopedia.com, http://www.rotterdamseoogst.nl/home, http://www. eetbaarrotterdam.nl, http://nl.sireh.com/co/r/rotterdam_companies, TNO

Food—city

Urban Metabolism

Voedsel


58

59

The catchment area of the Rhine is the main water system in North-western Europe. The dynamics of the river, which is called “(the) Maas� in Rotterdam, has caused safety problems for centuries. Moreover, the nature of this river is changing. Until recently, the Rhine was a glacier river. However, over the past few decades, the river has increasingly changed into a rain-fed river. This means greater discharge peaks and lows. From a fairly constant average discharge of 2,300 m3/sec. to 18,000 m3/sec. for peaks and a mere 620 m3/sec. for lows. The probability that Rotterdam will be affected by flooding and floods has increased as a result. Moreover, the combined effect of sea level rise, deepening the New Waterway for shipping traffic, increasing discharge dynamics and the increased likelihood of dry periods make Rotterdam vulnerable to salination. This not only means an immediate threat to flora and fauna, which largely

depend on fresh water; it also poses a threat to the agricultural and horticultural sectors, and even to the city’s drinking-water production. The question is therefore: How can we guarantee the availability of sufficient fresh water in Rotterdam in the long term?

Fresh water

Urban Metabolism

fresh water


60

61

LEGEND

Urban Metabolism

Zoet water

N W

O

Z

5

50

100 km

Fresh water—region

Salt water Soil salinisation Saline and Sodic soils Annual precipitation River–outside Rhine catchment area River–Rhine catchment area


62

63

Fresh water—city

Urban Metabolism

Zoet water

legend River gradient salt-sweet Fresh water basins Primary pumps

Secondary pumps Overflow outlet points Salination (in m. below NAP)

N W

O

Z 1: 100 000


64

65

Rotterdam lies at a point where the coastal and river landscapes converge, where the watercourses are naturally shallow. Although, centuries ago, the dynamics of river and sea provided relatively secured access to the sea, the same dynamics now pose a threat to one of the largest deep-sea harbours in the world: siltation! Direct access to the port of Rotterdam is an important competitive advantage. Nevertheless, this sea link cannot be taken for granted. In fact, the route was diverted several times in Rotterdam’s past in order to secure access. Sea access seemed to be guaranteed since the digging of the New Waterway (towards the end of the 19th century). However, to accommodate the increasing draughts of ships, harbour activities shifted towards the West. Moreover, there is a constant need to dredge. To maintain the gateway to Rotterdam at a depth of at least 30 metres so that the port can continue to accommodate the largest ships in the world, over 20 million m3 are currently dredged from the port every

year. This amounts to a large daily transport of harbour sediments to the sea. The largest source of sediments used to be the catchment area of the Rhine but, as a result of restricting the flow of the river, the North Sea is now the main source of sand, which accumulates on the river bed and harbour basins (approx 14 million m3 from the sea, compared with approx 8 m3 from the Rhine). Dragging sand from the port to the sea is an endless and costly process. It is noteworthy that transport largely determines these costs, since transport costs make up 90% of the cost of depositing 1 (one) m3 of sediment into the sea. The question is: How long can we continue to work against the current, and would it not be wiser to use the natural process of land formation more strategically?

Sand & Clay

Urban Metabolism

Sand & Clay


66

67

LEGEND

1 2 3 4 5 6 7 8 8 10 11 12

Ameland Terschelling Vlieland Texel Noord-Holland Rijnland Delfland Maasvlakte Voorne Goeree Shouwen Walcheren

N W

O

Z

5

50

100 km

12,7 mln m3 2 mln m3 3 mln m3 30 mln m3 42 mln m3 1 6 mln m3 20 mln m3 10 mln m3 0,8 mln m3 3 mln m3 8 mln m3 16 mln m3

Sand & Clay—region

Urban Metabolism

Shallow delta and valley area Rhine river with old arms Flow directions in the Rhine delta Rhine fluvial process Tidal undercurrent and surface current Coastal aggradation Coastal erosion Sediment deposit area


69

legend Sea depth (-2 m. / -20m.) Disposal route Sediment dump site routes Ship road 0m. / 5m. Zones land subsidence

BNPO Top Europoort Oeverbos Plas van Heenvliet Broekpolder Geluidswal Heerlijkheid

Golfpark Rotterdam Parkstad Geluidswal Carnisselande RMO

Goeree (20 million m3 coastal protection) Voorne (0.85 million m3 coastal protection) Delfland/21 (3.2 million m3 coastal protection)

N W

O

Z 1: 100 000

Sources: http://www.ahn.nl, http://www.portofrotterdam.com, http://www.rijksbegroting.nl

Sand & Clay—city

Urban Metabolism

68


70

71

A pleasant urban living environment is to an important extent determined by the air (wind) flows, heat and the ground-level air quality. It is becoming increasingly clear that the ground-level air quality has a direct impact as far as our health is concerned. Major causes of air pollution on a European scale are: the manufacturing industry, motor traffic, shipping traffic and farming. Each source has its own distribution pattern. Motor traffic along arteries through and between cities. Shipping traffic causes deterioration in the so-called “background concentrations”, the “blanket” that hangs over a region. In the layer of air up to an altitude of 10 kilometres, the highest average concentrations of air pollution in Northwestern Europe can be found above Central England and the Ruhr Area. Inland and ocean-going vessels produce substantial emissions on shipping routes. These routes are therefore clearly marked on the particulate matter map of Europe. The distribution pattern for industry lies in an area surrounding the source, but often at

higher altitudes, sometimes also over cities. The effect of industry in the port area on the air quality has decreased considerably over the past few decades. There is nevertheless still much to be done. As in other major cities, there are a number of areas in Rotterdam where the number of healthy years of life of residents is lower than average in the Netherlands; in part, this is still a result of air pollution. For instance, monitoring calculations from the National Air Quality Cooperation Programme show that there are a number of persistent bottlenecks in Rotterdam, especially along busy throughroads. Therefore, there is a less positive side to the good vehicular access to the Rotterdam city centre. A map showing the emission of NOx makes this less perceptible but clear effect of motor traffic on the city air visible, since the main traffic arteries clearly stand out. The question is therefore: How can we organize access to Rotterdam in such a way that it will have a positive effect on the city’s air quality?

Air

Urban Metabolism

Air


72

73

LEGEND 500 largest NOx emitters Europe 500 largest SO2 emitters Europe Life expectancy Fine dust–road traffic Fine dust–domestic shipping Fine dust–international shipping

Air—region

Urban Metabolism

Lucht

N W

O

Z

5

50

100 km


74

75

Air—city

Urban Metabolism

Lucht

legend SO2 NOx Fine dust NO2 in μg/m3 (>50–25) Fine dust in μg/m3 (>40.0–16.0)

N W

O

Z 1: 100 000


77

Four Strategies to optimize flows in Rotterdam

The IABR–PROJECT ATELIER ROTTERDAM examined the question of how the ‘urban metabolism’ idea can contribute to increased sustainability in the development of the city. Kennedy et al.1 point out that up until now this has only been done in rare occasions and make a case for studies of urban material flows, becoming an integrated part of designs made by architects, engineers and planners for the

metabolism of a sustainable city. This challenge was picked up by the IABR–PROJECT ATELIER. This chapter will examine the results produced by the atelier and will show how various strategies can contribute to an urban metabolism that has fewer negative and more positive effects on the quality of life.

Chapter 3

— Andy van den Dobbelsteen, Professor Climate Design & Sustainability, Delft University of Technology

Energy = Space, Without those handy little packages of gas, oil and coal from below the surface, we can only get energy from sources on the surface. Because of the ‘low energy density’ above ground, this switch requires radical new ways of thinking in terms of urban planning and the development of the built-up environment.

Urban Metabolism

76


Various studies have indeed shown that there are many options open to cities for improving the efficiency of their material flows while decreasing the negative effects on sustainability. An analysis of material flows in Amsterdam,2 for example, showed, from an environmental quality and sustainability point of view, that the urban material flows of goods, building materials, food and electricity production are the most relevant in that city. Due to the ‘main port’ position of Rotterdam, the transportation of goods, raw materials and semi-finished products also plays an important role here and making this more sustainable can contribute to an improvement in local quality of life and reduce the impact on the environment. Spatial design and productionconsumption chains Various strategies can be implemented for improving urban metabolism and these can roughly be divided up into two approaches. Using the first approach, the geographical proximity of material flows and other flows is used and a conscious attempt is made to look for the synergy between the various flows by linking them to each other at local level or by making more exchanges between flows. Spatial design can make a significant contribution to this by creating the preconditions for combining flows and improving the way they relate to each other. In the second approach, the focus is on a different way of setting up material flows in the production-consumption chains that are a part of the urban metabolism. Rotterdam is a huge jumble of chains (such as the water, goods or energy chains) and these chains cannot be seen as being separate from each other but they can be optimized individually. In literature that examines the transition to a circular economy, “re-use, redesign,

innovation and substitution” are generally seen as being guiding principles for improving the sustainability of the use of materials in production and consumption chains (Ellen McArthur Foundation, 2012). In the design-driven research that was done within the Project Atelier Rotterdam, various design strategies for improving the relationship between flows were looked at, as well as strategies focused on more efficient production-consumption chains. This resulted in four principles that are applied to spatial design, namely the countering of waste through catalyzing high-value flows, the channelling of residual waste flows, the recovery of raw materials and the reduction of transport movements. Translated to the context of Rotterdam and in concrete terms, this means the following urban design strategies: Catalyzing ­ Re-Industrialisation, Channelling (Energy) Waste, Collecting Resources and Creating Biotopes.

1 Kennedy C., Pincetl S., Bunjue, P., The study of urban metabolism and its applications to urban planning and design. IIn: Environmental Pollution 159, pp. 1965–1973, 2011

2 Verstraeten-Jochemsen, J. , Rover, V. en de Vos-Effting, S., Kennis Investerings Project Stedelijke Ketens – Verkenning naar een methode om de footprint van een stad te bepalen. TNO, Utrecht, 2013.

Four strategies

Urban Metabolism

78


­â€” Jan Willem van der Schans, Wageningen University

The issue of food is the premier topic to return circular thinking to the city... For the city revolves around people, and people need to eat. Good food grows on good soil, requiring good water and nutrients. Also because of the ongoing urbanisation, these ingredients will become ever scarcer. Unless the city will start to think in terms of closed, organic cycles to replace the industrial-age notion of linear production chains.

Urban Metabolism

81

1

Collecting resources Obtaining raw materials from waste and food

Four strategies

80 STRATEGy


82

83

F

AWZI Harnaschpolder

Collecting resources—strategy 1

F

B

Urban Metabolism

AWZI Nieuwe Waterweg

C

A

Van Ganzewinkel minerals

D AWZI De Grote Lucht

Sita Ecoservice

AWZI Kralingseveer

AWZI Dokhaven

Avr afvalverwerking Van Ganzewinkel Sita

D

AWZI Hoogvliet

A

Collecting resources—region The extraction of raw materials from waste and food

At regional level, raw materials can be obtained by harvesting nutrients from the sea by cultivating shellfish or seaweed in nutrient-rich areas. When it comes to horticulture, there are opportunities for the production of bio-based materials in the

horticultural centers, Westland and Oostland. And e-waste can be collected and processed on a large scale.


84

Phosphates from manure wash out with ground water and end up in the big rivers

85 The Greenports are not only producing food products, but also medicine and bio-materials

River

Agriculture

Urban Metabolism

A

Fish Shelter 200m Windturbine

Biomaterial Cascading

A

Bio-based materials can be used in building construction and renovation, and can be easily recycled afterwards

Kelp Production

B

The seaweed is harvested and refined in the Rotterdam harbour into a range of products

Biomass Refinery

C Aquafarming Through agriculture alone, 28 million tons of phosphate are lost in the Netherlands on an annual basis. But valuable nutrients are also lost at many more points along the entire food production to consumption chain. Ultimately, most of the nutrients are washed out to sea, after which they can barely be traced. By using existing and planned ­offshore infrastructure on a larger scale to harvest not only energy but also nutrients from seawater using aquafarming techniques, it will be possible to recover these losses in the future.

Nearshore Transport

Bio-based grondstoffen Increasing numbers of discoveries are being made in the agricultural sector to show that plants are also suitable for non-food applications. The bio-based materials project links the production of organic materials in Westland and Oostland to the new, up-andcoming bio-based production of, for example, plastics, medicines and cosmetics. This really is a process of transformation that, alongside recycling and upcycling, is essential if we are to continue to meet our future needs for raw materials.

D

Collecting resources—strategy 1

Seaweed (kelps) in large aquafarming rings captures the nutrients and grows up to half a meter per day


86 G

Protein Collective Oude Noorden

Protein Collective Het Kasteel

Urban Metabolism

E

E

G

Protein Collective Katendrecht

G G

G

Protein Collective Carnisse

Protein Collective Beverwaard

Protein Collective De Hey

G

Collecting resources—city The extraction of raw materials from waste and food

Protein Collective Zuidwijk

G

Protein Collective Hordijkerveld

Recovering raw materials from the city is to a large extent dependent on collecting waste that has been segregated so that material flows do not mix. The segregation of waste is only successful if it is made very easy for people to do. For example, if vegetable and fruit waste can be washed down the drain,

and if e-waste becomes a part of daily shopping. Buildings, too, are an accumulation of materials flows in the city. A remedial option, such as large-scale, sustainable renovation instead of demolition and new build, can offer significant advantages from an urban metabolism point of view.

Collecting resources—strategy 1

G

87


Human faeces is rich of phosphates, a key part of articifial fertilizer, required for our food production

88

89 A garborator can shred kitchen waste, so it can be transported through the sewage system

Kitchen Garborator

Urban Metabolism

At the sewage water treatment plant, phosphates can be substracted...

... and finally is transported to the greenhouse industry through it’s canal system

Unused rainwater pipes can be used to grow larvae, which can serve as animal food in urban farming projects

Local Food Market

Sewage Treatment Plant

E Canals Proteine Tanks

F

Phosphate recovery Stocks of phosphate are finite, just as stocks of rare metals are. It is therefore important to recover phosphate from the five waste water treatments in the Rotterdam region using proven techniques.

Urban Farming

G

Unused Rainwater Pipe

Protein collectives By designing homes so that they make segregating waste more attractive (through the use of waste chutes and garburators for example), the vegetable and fruit waste in our household waste can be used for breeding insects as a source of protein. Appropriate sites for starting to set up

owners’ association-type protein collectives that meet their own protein needs might be places in Rotterdam with a segregated sewage system that could transport vegetable and fruit waste to a site in the district where the protein is produced and can be used for urban farming.

Collecting resources—strategy 1

Toilet


90

People can pick up their online order, or bring back old products

Everybody has unused electronics lying around the house

Impact

91 RENOVATION

The supermarket becomes an exchange point for old and new products

Less use scarce resources

100% 90%

De c cre wit onge asin hin sti g the on rin g

80%

O2 gC itin ions Lim miss e

Unused Appliances

FOOD CONSUMPTION IN THE ROTTERDAM REGION

70% 60% 50%

30% 20%

0%

Food consumption

Potatoes, vegetables and fruit Cereal

Climate change due to CO2 emissions Dairy Meat and fish

Extra jobs and employment Impact of housing renovation on eight relevant themes

Etsy Labs Marktplaats Academie

10

EMISSIONS CO2 PER KG FOOD

9 8

Neighbourhood Supermarket

CO2(kg)

Urban Metabolism

d de ad ical tra Ex onom e ec valu

L air imiti po ng llu tio n

10%

7 6 5 4 3 2 1 0

Meat and fish

Insects

Dairy

Cereal

Potatoes, vegetables and fruit

Insects are an alternative protein source, and emit around 2/3 less CO2 per kilo than meat and fish

Residues supermarket The supermarket at the centre of a local, easily accessible network, at which you can get back a deposit on your old smart phone and other forms of valuable waste, represents the next link in the collection and processing chain for valuable residues. This means that the food supplier for the local supermarket need not drive back to the distribution centre with an empty truck, but instead loads up with reusable materials that are then taken from the distribution centre to recycling centres in the port in large quantities.

Impact assessment for alternatives to protein from fish and meat There are many environmental gains to be made in the production of food. We eat approximately 510 kg of food per person per year. Meat and fish make up approximately 5% of this amount. At the same time, this 5% is responsible for approximately 50% of all carbon emissions from food. By opting for alternative sources of protein, such as protein from insects/larvae for example, the emission of carbon dioxide as the result of food production can be drastically reduced.

Traditionally, the building industry in particular also creates a lot of waste including packaging materials as well as plastic, wood and concrete. But more important is the energy we use for heat and electricity in built-up environments as these have a much greater impact on our environment. If the building sector in the Netherlands were to formulate the ambition to renovate half of the homes in Rotterdam, this would lead to considerable benefits for the environment.

Collecting resources—strategy 1

40%


­­— Minister Schultz van Haegen

We cannot live safely in our cities without nature. 
And our economy cannot prosper without it. 
We rely on nature to grow food. And we preserve our natural heritage because it adds value to cities and makes them attractive places to live. 
So when we look at our cities, we should always consider nature and its dynamics.

Urban Metabolism

93

2

CREATING BIOTOPES Improving urban nature by local use of freshwater, sand and clay

Four strategies

92 STRATEGy


95

C

B Urban Metabolism

C F

C

G G

B A

CREATING BIOTOPES—region Improving urban nature by local use of fresh water, sand and clay

H

D

B

H D

H

Rotterdam is situated in a delta. Besides safety the dynamic of sea and river lead to two other processes that pose a threat to the status quo. The first is silting, the second is salinization. The deepening of the port increases the inflow of saltwater during dry

G B

periods. And freshwater is quite simply ­essential for agriculture. By using the formative power of geological processes at strategic points, opportunities for the development of new natural environments arise.

Creating Biotopes—strategy 2

94


96

97

Fresh water supply

Water Storage

Pump

Private Storage

By storing rainwater from the city in the outskirts, salt intrusion can be countered in dry periods

Infiltration Zone

C

Urban Metabolism

City

B

Agriculture

A Ecological energy network Rotterdam lies at a strategic junction between river and coast landscapes. Currently, there are few green and blue structures that are fully connected to each other, meaning that 71 of the 100 monitored dune landscape species and 18 of the 28 monitored species in the peatland pasture are in decline. The reservations in terms of space made by businesses for safety reasons or with a view to possible expansion in the future mean that a lot of the empty space in the port cannot be used. This also applies to the 160-metrewide zones running under the high-voltage lines. But this remaining space can also function as a stepping stone for biota through designing these zones to be ecological connecting zones, or an Ecological Energy Network

Peak Storage

Peat River

D

Seasonal Storage Pump

C Water landscapes The current creed adhered to for water in the city (infiltrate – store – drain away), which focuses on surpluses, is tackled in design projects. Instead of throwing water away when it is in abundance, the water is saved up outside of the city ready for dry periods. By storing rainwater at sites around Rotterdam by using water squares and existing waterways, water can be brought back again during dry periods and urban green areas can be given freshwater so that irreversible salinization can be prevented. The new storage areas then also take on a recreational or ecological value. The wet environments that are created form the solution for the lack of natural water meadows around Rotterdam. A productive landscape can also be created from these, and they can also be used for recreational purposes.

Creating Biotopes—strategy 2

The 160 meter wide corridor underneath the powerlines can be used for ecology and recreation


Urban Metabolism

H

Harbour park Merwehaven

H H G

99

Harbour park Rijnhaven

Harbour park Maashaven

G

G Waterfront park De Veranda

Waterfront park Pernisse Waterkant

H

Harbour park Eemhaven

Waterfront park Stormpolder

G H

Waterfront park Donckse Griend

Harbour park Waalhaven

CREATING BIOTOPES—city Improving urban nature by local use of fresh water, sand and clay

Sedimentation is still seen as being waste that gets in the way of port activities. It is for this reason that more than 20 million cubic metres of sediment are dredged from the port every year, meaning daily transportation of dredgings from the port to the sea.

Transportation accounts for every 9 out of the 10 euros it costs to dredge one cubic metre. Local use of silt from the port could mean savings of € 7 per cubic metre.

Creating Biotopes—strategy 2

98


Instead of continuous dredging, sediments are trapped behind small dikes to create ecological floodplains

Landmining New Dike

Old Harbour Dynamic Floodplains Water Park

Impact

In order to tackle the problem of salinization, we need to let go of the current creed adhered to for water management (infiltrate - store - drain away). Instead of draining excess water off to the river or the sea as quickly as possible, we can also store it outside of the city so that the urban green areas can be supplied with freshwater from this buffer and salinization can be prevented. By collecting 1% of all rainfall in a seasonal

store, the equivalent of approximately 16 hours of rain can be stored for use during dry summers. In addition to being functional, the new storage areas are also of recreational and ecological value.

Sedimentation

NIeuwe Waterweg

Urban Metabolism

An olivine dike outside the Second Maasvlakte captures both CO2 and sediments, creating perfect conditions for oysters cultivation and for fish to reproduce

101

Creating Biotopes—strategy 2

100

G Sediments Sedimentation of underused harbour slips creates opportunities for an ecological waterfront

Maasvlakte 2

H Olivine Dike

Self-growing Maasvlakte Through targeted initiatives, sediment flows at sea can be used for creating safety and space for food production and, in the longer term, new port activities. Behind a new dyke, a combined process of natural land reclamation and oyster farming is taking place. The result in 30 years’ time will be a new Maasvlakte (port area) that has grown naturally. Sedimentation banks and land farming At strategic sites, port silt can also be used locally in order to ‘soften’ the steep banks of existing dykes. Areas can be set up for land farming immediately behind the dyke. While the dredgings steadily develop to become useable agricultural land in this way, during the process a dynamic natural environment can come into being.

Oyster Banks

DRINKING WATER

F

SEASONAL STORAGE

RAIN WATER SYSTEM

Docks If we allow unused docks to silt up in strategic places instead of continually removing dredgings, then new biotopes are created, forming the important links for migrating fish, among other things. But allowing docks to silt up is not only good for fish: it also brings opportunities for using the docks as ecological park landscapes with recreational value.

INFILTRATION IN SOIL, LAKES AND RIVERS

SURFACE WATER

RAIN AND SNOW NORTH SEA

MIXED SEWAGE

RWZI


— Pierre Bélanger Landscape architect and associate professor Harvard Graduate School of Design

We know so little about what it really takes, about how urbanization actually works.

Urban Metabolism

103

3

CHANNELING (ENERGY) WASTE The use of by-products of energy extraction

Four strategies

102 STRATEGy


105

E

E

Stadsverwarming Den Haag

Stadsverwarming Zoetermeer

B

Urban Metabolism

C

B

Greenport Oostland

Greenport Westland

CCS CO2-HUB Rotterdam

A

Powerplants E.ON & GDF SUEZ Tweede Maasvlakte

A

E

Harbour Europoort

A

Harbour Botlek

A

Stadsverwarming Rotterdam

Harbour Pernis

Ecologische verbinding IJsselmonde

CHANNELING (ENERGY) WASTE—region The use of by-products of energy extraction

In order to reduce the waste heat and the excess production of CO2, it is important to make better use of the by-products of industrial processes and the generation of electricity.3 Expanding the existing network to form a heating network on the scale of the South Wing of the Randstad conurbation,

will lead to a considerable reduction in CO2 emissions and in energy consumption by households. Another measure for reducing CO2 emissions is the expansion of the CO2 network that collects the emissions from power plants and supplies these to horticulture or stores them underground 3 De Rotterdamse EnergieAanpak Planning (REAP) elaborates further on this; see Chapter 4

Channeling (Energy) Waste—strategy 3

104


A

106

107 The OCAP pipeline brings the CO2 gas to greenhouse industries, where it is used to grow plants faster

Capturing the CO2 from emissions takes a lot of energy, but is technically already possible

Industry serves as a continous source of heat energy

B

CO2 Capture Regional Heat Network

B Greenhouses The geothermal sources also function as a heat hub, distributing various temperatures among local heat cascading networks

OCAP pipeline

Urban Metabolism

Geothermal Energy Sources

Rotterdam has the potential to become a main player in the future European CO2 trade market CO2 Treatment & Storage

Geothermal Energy Grid

E

By pumping pressured CO2 into Northsea gas fields, their revenues can be increased

Shipping Transport

Offshore Pipeline

C

Northsea Gas Platform

Heating network + geothermal heat The introduction of a heating network on the scale of the South Wing makes the individual production of heat by many businesses and households unnecessary. This not only means enormous savings in energy consumption, but also a considerable reduction in CO2 emissions. By linking the heating network to geothermal heat, a very stable network is created that can be developed in both a centralized and a decentralized way. This also makes optimum use of the location of Rotterdam in a unique geothermal heat zone.

D Organic Carbon dioxide for Assimilation of Plants A start has already been made on linking demand for CO2 to supply. The Organic Carbon dioxide for Assimilation of Plants project (OCAP) links CO2 production from the port to those requesting CO2 in areas with greenhouses, using a new and disused gas pipelines. As the supply of CO2 outstrips demand, an important addition to the project is the storage of CO2 in the ground,

a process known as Carbon Capture Storage (CCS). The many empty gas and oil fields at the bottom of the North Sea can be used for this purpose. They can be accessed relatively easily using pipelines from Rotterdam. In addition to storing CO2 in the place it originated from, ‘filling’ empty gas fields also means an increase in the yields from the existing fields as greater pressure can be used to ‘squeeze’ them until they are empty.

Channeling (Energy) Waste—stratgy 3

Geothermal wells both provide heat energy in winter and buffer industrial heat in summer


108

F

Heat Hub Spaanse Polder

F

Heat Hub Schiedam

HeatHub Tidemanplein

F Urban Metabolism

F

Heat Hub Noordereiland

Heat Hub Museumpark

F F

Heat Hub RDM Campus

F

Channeling (Energy) Waste—strategy 3

F

109

Heat Hub Laan op Zuid

Heat Hub Sluisjesdijk

F

F

Heat Hub Zuidplein

F

Heat Hub Slinge

CHANNELING (ENERGY) WASTE—city The use of by-products of energy extraction

F

Heat Hub Hillesluis

Heat Hub Zorgboulevard

The varied demand at neighborhood level and the presence of geothermal heat bring opportunities for creating a heating network that is stabilized by a grid of heat hubs. A smart grid for heat and cold is being worked towards with several suppliers and customers.4 What are known as temperature islands or (same temperature) heat zones can also be made,5

depending on the needs of the district. Rotterdam can also give substance to its sustainability ambitions by including more sustainable sources of energy, such as wind and solar power, in its energy mix.6 4 Rotterdam is a succesful pilotcity within the EU Celsius Cities project. www.celsiuscity. eu 5 Dobbelsteen, A. van den, Wisse, K., Doepel, D., Tillie, N., (2012). REAP2 – New Concepts for the Exchange of Heat in Cities, Proceedings of SASBE, Sao Paulo.

6 Carney, S. & Shackley, S. (2009). ‘The greenhouse gas regional inventory project (GRIP): designing and employing a regional greenhouse gas measurement tool for stakeholder use’, Energy Policy vol. 37, pp. 4293–4302.


110

Defrozen Bike Path Heavy Industry

New Housing

Impact

111

HEAT NETWORK Avoided emissions compared to total by extension to all households

CO2- NETWORK Avoided emissions compared to total by CO2 capture at coal power plants

3.773

1.276

Heat Exchange

hectares of forest

hectares of forest

Greenhouses

= 50 hectares of forest

= 50 hectares of forest

= CO2-emissions from electricity usage by all households in the city region

= CO2-emissions from gas usage by all households in the city region

Geothermic Energy

Impact A heating network on the scale of the South Wing of the Randstad makes the production of heat by businesses and households to a large extent unnecessary, thereby saving on energy consumption and reducing CO2 emissions. By connecting half of the households in Rotterdam to a heating network, the

L air imiti po ng llu tio n

L air imiti po ng llu tio n Extra jobs and employment

d de ad ical tra Ex onom e ec valu

d de ad ical tra Ex onom e ec valu

Heat hubs Heat hubs form the couplings between residual heat from the port and geothermal heat at depths of 2 and 4 km. The hubs also control the cascading of the various demands for heat from the immediate environment. This means an extension to the technical facility already used in Rotterdam South. The new version of the heat hub also has a public function with innumerable possible uses, from watchtower to year-round public spaces and district sports.

Less use scarce resources

O2 gC itin ions Lim miss e

De c cre wit onge asin hin sti g the on rin g

Less use scarce resources

CO2 NETWORK

De c cre wit onge asin hin sti g the on rin g

HEAT NETWORK

This figure shows the relative potential of renewable energy sources and heat sources for a different economic environment. (c) TNO

F

O2 gC itin ions Lim miss e

Urban Metabolism

Office Buildings

Extra jobs and employment

amount of CO2 emitted by housing would be reduced by between 70 and 80%. This is the same amount as is stored by 5000 hectares of woodland. This also offers the possibility to provide relatively cheap energy, to a economically weaker section of the population of Rotterdam, often living in homes that in terms of structure and energy are mediocre.

Channeling (Energy) Waste—stratgy 3

Pre-war Housing


— Chris van Langen, Director, Rotterdam Academy of Architecture and Urban Design

Design is ideally placed to critically interrogate reality and to unfold till now uknown perspectives and thinking.

Urban Metabolism

113

4

CATALYZING RE-INDUSTRIALIZATION Boosting the quality of flows of goods, people and air

Four strategies

112 STRATEGy


115

A Greenport Hub Westland

Urban Metabolism

A

Greenport Hub

CATALYZING RE-INDUSTRIALIZATION—region Boosting the quality of flows of goods, people and air

By making better use of a small proportion of the huge flow of goods in order to generate added value, Rotterdam has the potential to grow to become the logical business location for a new, clean, small-scale and therefore flexible manufacturing industry. A manufac­ turing industry of this kind could be an

obvious partner for the already successful German ‘Industrie 4.0’ programme, which brings together factories, machines and products digitally. At regional level, improvements to the public transport network can facilitate the mobility of people.

Catalyzing Re-industrialization—strategy 4

114


117

The regional Lightrail connects the cities and the greenports

In the Plant Laboratory scientists work out new biobased resources

Urban Metabolism

Expertise Offices

Greenhouses

Experience Center

Regional public transport ring plus knowledge axes By designing the missing link in the existing public transport network at a regional level, a light rail ring is created. This modification makes a substantial flow of people possible. By setting up the zone around the Delftse Schie and the connection between Westland and Oostland into a development area for knowledge and innovation, two knowledge axes are created, connected by the light rail ring, and linking the knowledge from Rotterdam to the expertise already present in Westland and Oostland.

Regional Lightrail

The Development Zone is designated for new innovative industries

A

Catalyzing Re-industrialization—strategy 4

116


118

Cargo Hub Spaanse Polder

E

People Hub Central Business district

Urban Metabolism

B C

119

D

C C

C

cargo hub

FEIJENOORD

D

Harbour Boulevard Brielselaan

F

people hub

RDM CAMPUS

G B

E City Boulevard Putselaan

City Boulevard Pleinweg

Data Campus Waalhaven

H Cargo Hub Waalhaven

Data Boulevard Pandrecht

E

G People Hub Zuidplein

H

D

City Boulevard Strevelsweg

people hub

ZUIDPLEIN

Data Boulevard Zuidwijk

CATALYZING RE-INDUSTRIALIZATION—city Boosting the quality of flows of goods, people and air

A logical place for new activity is Rotterdam Zuid. The gaps appearing in the urban fabric through the disappearance of retail trade can be filled with new forms of manufacturing industry and craft activities. By reindustrializing three existing city

boulevards, work can be brought to the people, rather than the other way around. As freight traffic both by road and by water plays an important role in Rotterdam, the optimization of logistics can result in great economic and ecological benefits.

Catalyzing Re-industrialization—strategy 4

Cargo hub

Spaanse Polder


120

121

Rooftop Sports Park

Catalyzing Re-industrialization—strategy 4

Cargo Hubs are strategically located between the highways and the river’s edges

Urban Metabolism

Open-air Market

Distribution Center

Water Transport Pick-up Point

Transfer Hub

e-loop for people and cargo In order to reduce the motorized freight traffic that currently passes right through the city centre, this flow is directed away with the design of a new inner ring road – the e-loop. Three cargo hubs in Spaansepolder, near to the Feyenoord Stadium and in the Waalhaven, connect up the e-loop, the motorway network and water. At these points, loads are transferred within a dense distribution network that comprises boats, bicycles, electric delivery vans, cargo lockers and pick-up points. But the e-loop not only forms the backbone for goods. People hubs at the main railway station, Zuidplein and the RDM campus ensure that people, too, will make intensive use of this ring for small-scale electric transport.

E


123

The City Boulevard is always crowded with busy entrepreneurs and wairy tourists

Urban Metabolism

Industry in Plinths

Streetlife

Small Businesses Shared-space Street

Re-industrialization boulevards By seizing the opportunity left behind by the departing retail trade and making use of the capacity in the urban fabric, space for a mixed urban environment comes into being. Through the use of designs for changing both the street profile (into shared space streets) and the zoning plan (a mixture of functions for the first two storeys), three city boulevards are being made for reindustrialization: one port boulevard (Brielselaan), one city boulevard (Pleinweg – Strevelsweg) and one data boulevard (Slinge). Think in terms of 3D printing, data processing, innovative storage, etc.

H

Catalyzing Re-industrialization—strategy 4

122


125

CARGO HUBS

L air imiti po ng llu tio n Extra jobs and employment

The impact of cargo hubs in six relevant themes

+2% -8%

+10%

Climate change due to CO2 emissions

-5%

Causing resource scarcity

25.000 car fuel tanks equivalent

2.500

hectares of forest carbon sequestration

The impact of introduction logistics network with Cargo Hubs

-8% -11%

Jobs and employment

Turnover and economic value added

Causing traffic congestion

3.500

â‚Ź140,-

170.000

extra jobs in logistics

per inhabitant extra turnover

less cargo rides in the morning

Air pollution in the city region

250

million cigarettes

Catalyzing Re-industrialization—strategy 4

De co crea wit nge sin hin sti g the on rin g

Less use scarce resources

O2 gC itin ions Lim miss e

Rotterdam is able to respond to the drastic changes in our economy by using part of the huge freight cargo flow through the city for the development of small-scale, clean industries and crafts. In addition to having economic and social benefits, the introduction of this city-centre logistics system with cargo hubs for facilitating this development has positive effects on our traffic in particular, and therefore our energy consumption. If all of the freight and other traffic travels to the city centre through this network, this also brings ecological benefits. This results in a considerable reduction in the use of raw materials, the reduction of CO2 emissions, improvements in air quality, an increase in employment, more turnover per inhabitant and reduced congestion

124

d de ad ical tra Ex onom e ec valu

Urban Metabolism

Impact


Chapter 4

—Professor Patricia McCarney, President of the World Council on City Data and Global Cities institute

Global Cities Indicators Facility at the University of Toronto compared rankings that had been applied to seven prominent world cities, it turned out that only six of the 1,200 indicators being applied were exactly the same.

Urban Metabolism

126 127

Results, ongoing actions and follow-up

The IABR–PROJECT ATELIER in which the nine material flows have been researched and analysed provides inspiration for Rotterdam’s urban development. Building up a circular economy in the region, with its high quality of life, is part of this.


Dry bulk

Semi-finished products

Food processing

Finished products

Fresh food distribution

Harbor logistic terminals

Primary production

Phosphates Nitrates

Arable land

Phosphates Nitrates

Vegetables

Green house

Fodder Proteins

Biogas Energy

Compost plant

AH distributie Aldi distributie C1000 distributie Jumbo distribitie Lidl distributie

Fermentation location

Fodder

Consumers

Household / Company waste

Food bank

Waste

Restaurants

biomass

Meat

Fish

Marine food production

Seaweed

Nutrients

International food export

Street (pick-up point)

Paper / cardboard

Warmth Electricity

Incineration

heat

Roteb

Containers

Package glass

Garborator Garborator

Fresh food exchange

Clothes / shoes

Farm shops Neighbourhood exchange Open markets

Small chemicals

Roteb

Proteins

Environmental Park

Usable furniture

International food import-export

‘Wet’ organic waste Biogas AVR Rozenburg

Residual household

Organic

Urban agriculture

Other

Compost location

Indaver

Garden / park organic

Compost Biomass Wood

Green

WASTE

Food wholesale Supermarkets Purchase department

FOOD

Dairy

Cattle farm

Eco-ferm

129

Sales Supermarkets Shops

Fruits

CO2

Algae photofermentative

Veiling Bleiswijk Veiling Westland

Crops

128

Roteb

Equipment Wood

Distributors Harbor logistic terminals Sita Waalhaven Van Gansewinkel Irado Van Dalen

Plastics

Urban Metabolism

Brazil, Argentina, U.S.A., Ukraine Canada, South Africa, Columbia, Australia, Norway, China, others

Import

Dry bulk terminals

Dry bulk agribulk iron ore & scrap coal others

OCAP

Wet bulk

Pipelines

crude oil mineral oil others

CARGO

ROAD

CO2 Hub

Wet bulk export to: U.K., U.S.A., Singapore, others

Russia, Saudi Arabia, Egypt, U.K., Norway, Singapore, U.S.A., Malaysia, Indonesia,others

imported waste

Dry bulk export to: U.K., Germany, Norway

Metals

Residual household

China Turkey Sweden Germany

CCS

Export

Wet bulk export to: Germany, Antwerp, Vlissingen

Producer industry harbor city harbor hinterland

Tank terminals Container export to: Europe, America, Asia, others

Europe, Africa, America, Asia

Roll on Roll off

Empty depot

Recovery & refinery

Container terminals

industry harbor city harbor hinterland

dismanting> sorting> recycling

Unpolluted dredge

Consumers

Relocate

De Slufter Hollands Diep IJsseloog

Waste

Manufacturer

Dredging

Public

Store

Private

industry harbor city harbor hinterland

ENERGY

crude oil biomass

BP Kuwait Petroleum Europoort Koch HC partnership ExxonMobil Shell Greenhouse gas Argos Oil Standic Euro Tank temperature cascading system: Heat Vopak industry: 120° C Haan Oil district heat system: 70° C spa, swimming pool: 50-40° C Fuel Fuelindustry industry defreezing streets, aquaculture: 30° C Fuels

Dewatering

Rain water Infiltration Evaporation

Brabantse Wal

Drinking water treatment

WATER

Water inlet Biesbosch

Aquifer

Sea water

Haringvliet Ouddorp Ossendrecht Huijbergen Halsteren Dordrecht

Consumers

SAND + SEDIMENTS

Process

Power Power plant plant

Electricity

electricity network

River water

cooling water

natural gas

Heat plant

Nutrient rich water

Landfarming

Cement, road material

Thermal

Sand separation

Building material

Sewage system

Acidification Eutrophication

Chemical Immobilization

Waste water coal

Ripening

Waste water treatment plant

Brick, gravel etc.

Sand mining

Sand

Construction

Peat Clay

Coastal protection Compost

Dike improvement

Waste

Electricity Heat

city district heating

Nutrient extraction Nutrients

Solar energy

IMPORT Start / End Activity, situation or phase Spatial activity

Wind energy

Geothermic sources Geothermic sources

Heat energy buffers

PRODUCTION Route New route

CONSUMPTION Cargo Water Energy

WASTE

EXPORT Food Waste Sand + Sediments


130 This chapter investigates which material flow initiatives and activities already contribute to this goal, and what further opportunities present themselves. In addition, the ­realisation a circular economy and a more sustainable urban metabolism will be massively boosted if a number of preconditions can be met: a thorough awareness of what material flows are and what effects they have, ­exchanging information as (open) data, and visualising material flows and their effects to

A new Urban Metabolism for Rotterdam Metabolic thinking requires switching ­between different scales, between strategy and spatial design, intermediate flow and associated infrastructure. Instead of incoherent optimizations here or there on waste reduction, it is a better idea to develop a new, integrated perspective in which economy, ecology and spatial diversification are ­coupled to city, nature and landscape. The

131 chain and nutrients from the water that are used as a raw material in the food chain. The four strategies have particular impact on the energy use of the city. All measures have an impact on the energy consumption: cargo hubs reduce the consumption of gasoline and diesel, sustainable renovation reduces gas consumption in homes, renewable energy creates more local production of electricity and district heating reduces the demand for gas.

help to reduce raw material shortages, mainly by reducing the use of fossil fuels for heat, electricity or transport. Ongoing Actions and follow up Rotterdam is not starting from scratch. The IABR–PROJECT ATELIER ROTTERDAM has presented a wealth of opportunities that connect to the ambitions held by the various parties involved in the city. Parties that range from waste processing companies to IT

1,2

0,8

Renovatie Duurzame warmte 0,4

Duurzame electriciteit Logistieke centra

0,2

Voor

obtain a better picture of what opportunities present themselves and what synergies may exist between them all contribute. For the City of Rotterdam, the IABR–2014–URBAN BY NATURE–, meeting also provides an opportunity to offer a venue and connect ideas, initiatives and activities wherever possible. The starting shot will be the first meeting with local partners on the 25th of June 2014. Innovation, new working relations, new revenue models and unexpected coalitions will shape a future in which more sustainable material flows will create more added value in a region.

Het veroorzaken van files

Het veroorzaken van grondstofschaarste

Omzet en toegevoegde economische waarde

Banen en werkgelegenheid

Klimaatverandering door CO2-emissies

0

four strategies proposed in Chapter 3 provide direction for a new urban metabolism for the city, but what is the effect on our Quality of life? TNO has calculated the impact of the proposals. IMPACT By drawing the flows together in one chart one gains insight into potential sites where chains can be closed. Such as waste heat from industry that can serve as input for geothermal sources, so that even after thirty years they can still be functional. Also exchange between flows have huge potential: Existing examples like CO2 from the energy

TJ

0,6

Luchtverontreiniging in de stadsregio

Urban Metabolism

Consumption

Import

1

Production

Export

200000 180000 160000 140000 120000 100000 80000 60000 40000 20000 0 Before

Electricity

After

Fossil gas

Before

Heat

After

Before

After

Before

After

Fuels

The combined effect of the four strategies is also visible in the area of raw material shortages, CO2 emissions, local air quality and congestion. In addition, seemingly small changes in flows have much effect: in total, 1% more jobs are expected and that means 6,000 jobs: the same as an average multinational. Eighteen percent more revenue caused by the 4 strategies, equals to 750 million euros. CO2 emissions are reduced by a quarter and airpollutants even with a third, the latter as a result of a new transport system. According to the models the volume of traffic at key junctions in the city will be reduced by a quarter. Finally, all projects

firms and from projects initiated by residents to the design agencies like those united as the Rotterdamse Metabolisten. The initiatives already under way in the city provide us all with a great position to start up follow-up activities. In the below, we will succinctly go into a number of flows and themes in which multiple flows come together for which many opportunities exist. What is already being done? What opportunities and challenges have presented themselves, and which parties will focus their efforts on them? The environmental performance of the material flows, the effects of these flows on the quality of the living environment, forms an


132

Urban Metabolism

important guideline. How can we and all parties interested in the city positively influence them? Goods The production and transport of goods has a highly negative effect on the quality of our living environment on the local level. As was shown in Chapter 2, many goods just pass through Rotterdam, without adding value to the city. However, this is likely to change: the outlook is that mass production will gradually be exchanged for local production of goods, meant for the local market and in close proximity to the end users. The socalled Digital Manufacturing process, which includes 3D printing, is a promising development in this respect. For 3D printers are becoming increasingly cheaper and are able to create all sorts of innovative products. Additional advantages of this process are the reduced material costs, as less residual waste is produced, decreased costs of marketing and transaction through the use of social media, decreased cost of transport and increased supply speeds due to manufacturing taking place close to the end users. The involvement of the consumer with the product is also increased. Ideas of connecting 3D printing to the circular economy already abound: waste products and residual waste can be collected and processed as a resource for the 3D printers to use. The processing of residual waste into powders used for 3D printing is a promising activity for the many chemical companies established in the city and region of Rotterdam. McKinsey1 distinguishes two developments in digital manufacturing. First, the digital production of relatively simple consumer items for the local market, the consumers themselves partly being responsible for

determining the result. This development will create a sizeable market for small and medium-sized businesses, providing a lot of employment opportunities, emphatically also for moderately and poorly educated personnel. Second, digital technology will be used in the production of industrial high-tech products (3D printing, sensoring, nanotech, robotics, internet of things, etc.) These two tracks of development can influence and strengthen each other. A good example is cooperation within the production chain and the exchange between thinkers and doers, which is already taking place on the RDM Campus, where the manufacturing industry meets innovation. Such cooperation also boosts employment opportunities of personnel of all educational and skill levels. The previous chapter detailed a number of interesting opportunities on the urban spatial level to boost this development in the city. The e-loop and re-industrialisation boulevards, for instance, are directly connected to a dense and environmentally friendly transportation network and to buildings that are or will come to be empty. The Platform Digital Manufacturing Foundation was established in Rotterdam to explore and promote these new developments. Energy Making the switch to a sustainable system of energy provision is an important part of every urban metabolism, as the transition to a more sustainable energy system will heavily contribute to lower CO2 emissions, an improved air quality, and the long-term guaranteed supply and affordability of energy. However, making the switch is a massive undertaking. The Rotterdam Climate Initiative2 promotes this transition, working with various parties to see it realised. In addition to having the city become climate proof by 2025,

133 Rotterdam aims to have CO2 emissions reduced by 50% in 2025 as compared to the 1990 levels. To this reason, the City of Rotterdam is working with the Rotterdam Energy Approach and Planning (REAP).3 This approach integrates different scales on in steps and links planning to energy: 1. Reduce energy demand; 2 Reuse of energy waste flows; 3. Use renewable energy sources This may in term result in reducing or avoiding the use of fossil-based energy. Extensive programmes are in place to help realise all three targets, focusing on topics as diverse as biorefining, electric mobility and building insulation. In this text, we will only consider the topic of residual heat in some detail. The heating network of Rotterdam’s city centre dates from 1949. In realising a sustainable provision of heating and cooling in the future, increasingly making use of residual heat, important developments have been taking place in Rotterdam these past few years, including the formation of the Warmtebedrijf Rotterdam, the completion of the ‘Nieuwe Warmteweg’ 26km pipeline construction, and the work of a similar pipeline in Rotterdam North. Right now, houses, commercial and business properties equal to 60,000 private residences that are connected to the network. The City of Rotterdam and its private partners have been working on expanding and consolidating the heating network for some years now, in the industrial parks, the builtup environment and in the wider region. The ambition for the future of the most important stakeholders4 is to have an additional number of houses and commercial buildings equal to 50,000 private residences in the next ten years, and up to 150,000 in 2030 —or about half the total number of houses in

Rotterdam. One challenge in this respect is connecting existing buildings to the heating network instead of keeping them connected to the gas grid. In addition, efforts are made to make more sustainable use of existing energy sources and to start making use of new and more sustainable sources like geothermal, biomass and solar energy. This transition requires the installation of a smart grid of heating and cooling networks involving multiple heating and cooling suppliers and customers. As this in turn requires liaising between all parties, smart provision adjustment data are crucial. An example of the practical use of such data is the ‘Heat Hub’,5 a ‘heating switch’ between the Nieuwe Warmteweg residual heat pipeline and the existing heating network that also serves to store residual heat so as to attain optimum efficiency of the heating network. De Rotterdam, the new, multifunctional building on the Wilhelmina Pier, too, makes use of the innovative exchange of residual heat. In addition to the actions taken with respect of heating and cooling networks on the level of the city, the Warmtebureau Zuid Holland and its partners are working on a more sustainable provision of heating and cooling on the provincial level. Food Other studies into urban metabolism have highlighted the relatively large size of the flow of food in the urban metabolism, as well as its major influence on the quality of life.6 The flow of ‘food’ in the Rotterdam region is highly diverse. Particular to Rotterdam is the proximity of representatives of the entire food production chain to the city: both the Westland glasshouses and the port are close to the city, while Rotterdam itself is home to urban farmers. Innovation is prevalent in all links of the food production chain, and this is


Urban Metabolism

134 already having a visible effect on the production and consumption of food in the city. The basins of the former Tropicana swimming pool, for instance, are now used for the small-scale cultivation of oyster mushrooms on coffee grounds. Another example is formed by the local urban farmers united in the ‘Uit Je Eigen Stad’ project. They employ the so-called aquaponic system: fish excretions are broken down into nutrients for water plants by micro-organisms in a pond, the plants in turn clean the water. This type of small-scale business cases are currently being optimised and treated as more than just hobby projects, allowing for their further development into commercial business ideas. Finally, over the last municipal council period, the number of city farming projects has grown from one to over a hundred. The development of the ‘Raw Materials Library’ in the Westland glasshouses and horticultural industries is a different sort of development altogether. Each of the roughly 2,000 crops grown in the region is analysed and catalogued as to their use as raw materials. These crops can then be used, not only as food, but also as raw materials for a wide variety of other products, including packagings, insect pest control lures, medicines and dyes. The production of all these materials close to the city offers a wealth of new business opportunities for a great many entrepreneurs. Another example of the exchange of material flows in the city, referred to before, is the use by the Westland greenhouses of the residual heat and CO2 generated in the port. The future will see the transition from oil refining to the refining of protein from plant materials. Biorefining is already taking place on the small scale. An additional advantage is that the Westland companies will need both university and vocationally schooled

employees, which are available in Rotterdam in large numbers. Finally, on the consumption end of the food production chain, the city produces large amounts of organic waste. This waste is not just produced by residents, but also at the markets and in the food-processing companies in Spaansepolder. The investigation into the possibilities to make use of this organic waste as a material flow for food production, but also for purposes like biogas generation, has just begun. Is much to be gained by the small-scale processing of the waste for use in the many communal kitchen gardens? Or should we aim for a larger-scale processing for use by the neighbourhoods or the agricultural companies outside Rotterdam? Van Timmeren7 points out the importance of social cohesion for these sorts of initiatives and states that, depending on the actual situation, they should be carried out on the neighbourhood and borough levels. Taking this point of view, a follow up question would be: what would a transformed neighborhood or the garden city of the 21st city look like? Waste water chain Various urban metabolism flows, including foods and fresh water, come together in the waste water chain. Over the past few decades, the Rotterdam waste water chain has successfully been optimized and turned into a system able to process wastes as efficiently and quickly as possible. This improvement was financially made possible through the levying of taxes and waste collection levies. It is now a welloiled, albeit expensive, machine, flushing out the finite and ever rarer resources and raw materials or sluicing them towards the waste incineration plants.

135 The radical step of thinking in terms of circular systems (from wastes to resources) has visibly turned the waste water chain around. The development of knowledge to transform the system from one of waste treatment into a sort of ‘raw materials factory’ is in full swing. The IABR–PROJECT ATELIER ROTTERDAM has put the recovery of phosphates by waste water treatment plants on the agenda as an example.8 Until recently, phosphates were considered waste materials, and we paid to have it removed. But now, we try to recover it from the waste flows for use in the food production chain. In this way, we still have a source of phosphates, even if the phosphate mines are depleted. In other words, this is also simply a source of money! The knowledge to develop new revenue models to commercialise our waste treatment chain as a source of raw materials, is already present. Both central and decentral solutions can be found. We have, up to the present day, always had a centrally regulated waste water treatment system. The development of any longterm vision of the Rotterdam waste water treatment chain needs to include an investigation into both central and decentral solutions in transforming the chain into a more sustainable one in the future. Materials like phosphates and, in term, nitrates, cellulose, plastic and perhaps even hormones can be recovered centrally and be turned into the financial pillar of the system. On the decentral level, biogases may perhaps be captured at the level of the individual house or block of houses. Or we can think of the cultivation of proteins based on the collective collection of organic wastes. These are all practical solutions and innovations. Solutions realistic enough to make concrete business plans related to housing construction, redevelopment and area development. The follow-up question would be if these innovations are

viable solutions for existing neighbourhoods. Effects of the flows on the living environment Various parties in Rotterdam are responsible for measuring the effects of the flows on the quality of the living environment, including the DCMR environmental protection agency, the municipality’s Traffic and Transport department, and the Port of Rotterdam Authority. These agencies are pioneering the collection and use of real-time data on the material flows, for instance having the actual state of the quality of the air or of the flow of traffic available at all times. The City of Rotterdam and the BSR Rotterdam Urban Nature Agency also keep data on the city’s biota. These are important data in this context. For the presence of certain species of organisms is a measure of the purity of the air, the water and the soil, and of the vitality of the urban ecosystem. An increasingly more impressive amount of studies have shown the positive effects of urban ecosystems on the quality of urban life,9 as urban plant and animal life helps regulate the water cycle and air temperature and reduce the urban heat island effect, in turn decreasing the incidence of asthma and bolstering the residents’ immune system. In addition, the existence of an urban ecosystem is beneficial to psychological health as it provides recreational opportunities (Haase et al. 2014). In view of the effects of the flows, it is of importance that we in the coming years more attention should be given to the ecosystem services, including its economic effects (TEEB, the Economics of Ecosystems and Biodiversity). This approach considers the city to form an ecosystem of itself, paying particular attention to the quantitative substantiation of its direct relation to topics like public health and the economy. Various EU


136

Urban Metabolism

workshops have been held in Rotterdam to further investigate this.10 The Ministry of Economic Affairs, too, has had these relationships charted for a number of cities in the Netherlands. The availability of measurement data is crucial in this respect. Further analysis of the impact of the ecosystem is of great importance for improving the quality of urban life. Based on the results of the investigations carried out and workshops held in Rotterdam , three follow-up steps were proposed: 1. Scaling things up by making use of the knowledge gained from successful projects like the riverbank greening project and urban agriculture; 2. Encouraging local initiatives to make school yards and neighbourhoods greener; 3. Setting up a platform in cooperation with the government to further develop a green infrastructure and knowledge of the public health and economic effects of the urban ecosystem. ‘Smart City Planner’ co-creation and World Council on City Data Administrators, citizens, companies and NGOs all need answers to tackle the challenges presented by the modern age. Data that are easy to understand, reliable, accessible and often even real-time are a requirement for taking local action. The City of Rotterdam possesses large amounts of data12 Dwhich may serve various purposes in this connection. One example would be the data available that form the basis for administrators to create a safety index, for developers to be awarded a BREEAM label, for the creation of city indexes, and form benchmarks for so-called ‘hackatons’. A new phenomenon which has specialists create useful end-user software and apps in a short time, using open data. This March, Rotterdam held the Cleanweb Hackaton, on the topic of

energy consumption, the first time something like it was held in the Netherlands. Using of these data in co-creation with local players, the ‘Smart City Planner’ developed: a kind of city dashboard with a series of area profiles with scalable maps. The actual state of affairs of twelve themes is made available for each of Rotterdam’s ninety neighbourhoods or for the city as a whole by means of spider diagrams. The twelve themes are all related to spatial development, sustainability and social economic issues. Digital maps allow for the quick zooming in an out between the neighbourhood (or even smaller) and the city-wide levels. The Smart City Planner massively speeds up the policy-making process and allows for the creation of an agenda for consultations between the government, citizens, investors and other stakeholders. Internally, the City of Rotterdam started making use of this approach for nearly all area-related agendas in 2013. All this started with the Interreg IVb project Music. We are currently busy integrating the approach with other municipal instruments like neighbourhood profiles and budget allocations. Proper monitoring, enforcement, learning from the experiences of other cities, collaboration, developing new products and boosting local economies all require the availability of standardised data. This also applies to the data exchanged between cities. Up until a few years ago, cities and international standards had little to do with one another. However, a lot is currently going on as concerns ISO standards relating to cities. The first ISO standard on city services was published on 15 May 2014.13 In addition, Rotterdam is one of the foundation partners of the Toronto-based World Council on City Data. This is, in the words of Professor Maarten Hajer, Director of the Netherlands Environmental Assessment Agency: ‘The

137 first open data platform employing validated urban statistics.’ An interesting follow-up step would be to assess what these developments mean for cities, industry, infrastructure, investments and the very collection of data in cities. Open Data Discussions on open data are (always) about the open data of other parties (Jan Willem van Eck, ESRI) So (open) data are vital to the application of the concept of urban metabolism to the city. But data alone are not information or knowledge and in no way form solutions in themselves. The simple fact of the matter is that we have way too many data. The introduction and use of apps and machines generating a massive flow of data production, statisticians and policy makers are having an ever harder time sifting through the data to collect the right information and knowledge. ‘Big data’, as this massive pile of raw data is referred to, is therefore to be more than exclusively an IT issue: dealing with big data is to happen where IT meets environmental, spatial and socio-economic agendas. And, as Microsoft argues, dealing with data requires a ‘people first approach’. It is about providing additional information, knowledge and value on the basis of validated data. IBM recently presented evidence that the climate and weather data made available for free in the US since the 1970s currently generate 30 billion dollars in revenue annually in that country. GPS data, made freely available in 1983, are even estimated to be worth 90 billion dollars. What’s more, both sets of data are key to the development of ever more practical products and solutions. Rotterdam last year put the solar power module14 online in its ‘energy atlas’. The next step will be to launch an (open) data platform that will

provide access to all sorts of validated data. Natural progression towards IABR–2016–THE NEXT ECONOMY IABR–2014–URBAN BY NATURE explored the relationship between spatial design and the ecological agenda. It provided us with a new way to look at the city. Urban Metabolism is directly linked to the circular economy and the quality of the living environment. In the preceding text we detailed what is already going on with regard to various flows, and how this research biennale has provided direction to the follow-up actions. By offering a platform, we hope to stimulate the creation of new initiatives and the further development of existing ones. In researching the material flows, the vital role of proper data to inform, gather knowledge and take action once again came to the fore. ‘Open’ data will remain an important theme in measuring the quality of the living environment and boosting the circular economy. These themes will be even more important to the city in view of the next research ­biennale, IABR–2016–THE NEXT ECONOMY, set to focus on the relationship between spatial design and the (development) of the economy. IABR–2016–THE NEXT ECONOMY will investigate the road towards the ‘next economy’ – an economy based on finding a balance between thinking and acting, between knowledge & services and material production, between heavy industry and small businesses, between formal (e.g. banking industry) and informal (e.g. crowd funding, sharing) financing, between ageing and rejuvenating, and between profit and prosperity; an economy driven by interdisciplinary research, circular thinking, and clean energy. An Economy that is adaptive and resilient, able to detect and seize


138

Urban Metabolism

opportunities. The key question is that of how design research can contribute to creating a new socio-economic paradigm that establishes the city itself as a kind of lever for the optimum and sustainable social and economic performance of its residents. Let us use our newly drawn agenda and the framework of the municipal coalition agreement to make Rotterdam an even more attractive and economic successful city in the two years to come!

1 Disruptive Technologies: Advances that will transform life, business and the global economy”, McKinsey Global Institute, May 2013. 2 www.rotterdamclimateinitiative.nl 3 Tillie N., Dobbelsteen A. van den, Doepel D., Jager W. de, Joubert M. & Mayenburg D. (2009); ‘Towards CO2 Neutral Urban Planning - Introducing the Rotterdam Energy Approach and Planning (REAP)’, Journal of Green Building, Vol. 4, No. 3 (103-112). 4 Refer to the declaration of intent for the heating and cooling networks in the built-up environment signed by a number of involved public and private parties (including Woonbron, Havensteder, Eneco, Nuon, E.On, WBR, the Port of Rotterdam Authority, the Province of Zuid-Holland, STEDIN and the City of Rotterdam). 5 Rotterdam Smart City Project http:// www.celsiuscity.eu/demonstrators/ system-integration/4ro1-rotterdam-heat-hub. 6 Verstraeten-Jochemsen. J., Rovers, V., Vos, S., de (2013). Kennis Investerings Project Stedelijke Ketens - Verkenning naar een methode om de footprint van een stad te bepalen. TNO, Utrecht. 7 J. Verstraeten-Jochemsen, V. Rovers, S. de Vos (2013) Kennis Investerings Project

Stedelijke Ketens - Verkenning naar een methode om de footprint van een stad te bepalen. TNO, Utrecht. 8 Tillie, N., Kirsimaa, K., Dobbelsteen, A., van den, Sijmons, D.,(submitted 2014) Urban Agriculture in Rotterdam: potentials for a liveable, low carbon city and sustainable Phosphorus flows. 9 Haase, D., McPhearson, T., Frantzeskaki, N., and Kaczowroska, A., (2014), Ecosystem Services in Urban Landscapes: Practical Applications and Governance Implications – the URBES approach, UGEC Viewpoint, No.10, Page 21, March 2014, www.ugec.org. 10 www.urbesproject.org en www.themusicproject.eu 11 Frantzeskaki, N., Tilie, N., (2014), The dynamics of urban ecosystem governance in Rotterdam, The Netherlands, AMBIO, 43(10), pp.542–555 (DOI 10.1007/ s13280-014-0512-0 12 www.rotterdam.nl/onderzoek 13 ISO 37120 Indicators for city services, by the ISO committee for sustainable communities (TC268), Rotterdam participating as pilot and expert through NEN. 14 Initiative van het Global Cities Institute en Global Cities Indicators Facility met Professor Patricia McCarney en Helen Ng

139


Rotterdam’s new urban metabolism Four Strategies to design with flows

Designing the city on the basis of its urban metabolism requires shifting between regional and local scales; between strategic design and spatial design; between flows and the associated infrastructure. The many proposals, ideas, and projects are represented by four integrated strategies and

share a new and integrated perspective in which economic, ecological, and spatial diversification is coupled with a comprehen­ sive reading of city, nature, and landscape.

Four Strategies for a new metabolism for Rotterdam

141

Urban Metabolism

140


142

143

Urban Metabolism

colophon This publication was made possible thanks to contributions from: The Municipality of Rotterdam, IABR, FABRIC, TNO (Netherlands Organization for Applied Scientific Research) and Interreg IVb / MUSIC, as part of the IABR–Project Atelier Rotterdam: Urban Metabolism, within the context of IABR–2014–URBAN BY NATURE , 29 May–23 August 2014 in the Kunsthal and the Rotterdam Museum of Natural History.

Publication focus group Astrid Sanson (Director Urban Quality / Rotterdam Inner city), Paula Verhoeven (Director Urban development and Sustainability), Annemieke Fontein (Head of Landscape Architecture, Municipality of Rotterdam), George Brugmans (General Manager, IABR), Marieke Francke (IABR)

Editing Nico Tillie, Olv Klijn, Eric Frijters, Judith Borsboom, Martin Looije

Commissioning parties IABR and the Municipality of Rotterdam

Text Contributions Nico Tillie (Municipality of Rotterdam, Delft University of Technology), Eric Frijters, Olv Klijn (FABRIC), Dirk Sijmons, George Brugmans and Marieke Francke (IABR), Judith Borsboom (TNO), Sander Klaassen, Annemieke Fontein, Hans Scheepmaker (Municipality of Rotterdam) Translation Tolk en Vertaalcentrum Nederland (TVcN)

Projectatelier Rotterdam Urban Metabolism

Municipality of Rotterdam team Astrid Sanson, (Director Urban Quality / Rotterdam Inner city), Annemieke Fontein, (Head of Landscape Architecture), Sander Klaassen, (Project Leader), Emiel Arends, Hendrik Jan Bosch, Fatna Boutahar, Martin Guit, Roland van der Heijden, Nico Tillie, Marije ten Kate (Municipality of Rotterdam) IABR Team Dirk Sijmons, Atelier Manager Marieke Francke, Project Leader Yonca Özbilge, Project Assistant George Brugmans, General Manager


Urban Urban Metabolism Metabolism

144 Design-driven research FABRIC: Eric Frijters, Olv Klijn, Rens Wijnakker, Bas Driessen, Victor Fernandez, Roxana Florescu, Simone Ierardi, Olga van Lingen, Jack Lipson, Andrea Ng, Li Shuyang, Veronika Trnovská. James Corner Field Operations: James Corner, Richard Kennedy, Megan Born, Aaron Kelly, Veronica Rivera, Sanjukta Sen Partners Port of Rotterdam Authority (Isabelle Vries, Bram van der Staaij), Netherlands Environmental Assessment Agency (Ton Dassen, Arjen Harbers, Anton van Hoorn, Hans van Amsterdam), Rotterdam Climate Initiative (Paula Verhoeven, Fred Akerboom) External advice and research Pierre Bélanger (Harvard University Graduate School of Design), Lisa Diedrich (Swedish University of Agricultural Sciences), Jacco Verstraeten-Jochemsen, Judith Borsboom, Bart Jansen, Harm ten Broeke, Elmer Rietveld (TNO), Jan Willem van der Schans (LEI-WUR) Experts from Urban Planning and City Management at the Municipality of Rotterdam Cor Luijten, Joep van Leeuwen, Joost Martens, Will Clerx, Rogier Bruining, Joke Klumper, Erik Trouwborst, Jos Streng, Petra van der Lugt, Marianne de Snoo, Joost van Maaren, Jorg Pieneman, John Jacobs, Olaf Velthuijsen, Kees de Vette, Erica Koning, Christian Veldhuis, Carel Andriessen Maps and drawings FABRIC Photography Joep Boute, Peter Schmidt (Municipality of Rotterdam / RSO), Bram Lamens (Pixelclass) comissioned by Warmtebedrijf Rotterdam (p. 49)

The editors have done all in their capacity to determine the copy rights of the photos. Should you have questions regarding this pelase take up contact. Graphic design Eva Heisterkamp en Johanna Bayerlein Publication project leader Birsen Hofmans, Municipality of Rotterdam Print Mediacenter Rotterdam © 2014 ISBN/EAN 978-90-822436-1-1 With thanks to Niki Frantzeskaki (Drift, Erasmus University), Kerli Kirsimaa and the URBES project team, www.urbesproject.org, BIODIVERSA, Hans Scheepmaker, Hetty van Rhijn, Mieke van Leeuwen, Miriam van Lierop, Cleo Pouw, Astrid Madsen, Wouter Verhoeven, Martine Brouwer, Warmtebedrijf Rotterdam, Chris Kennedy, Daniel Hoornweg, Patricia McCarney, Helen Ng, Global Cities Institute, World Council on City Data, Carol Hol, Chris van Langen, EU project SUPURBFOOD www.supurbfood.eu with Jan Willem van der Schans Contact Nico Tillie; nmjd.tillie@rotterdam.nl Sander Klaassen; ah.klaassen@rotterdam.nl


sustainable development of Rotterdam

urban Metabolism


Issuu converts static files into: digital portfolios, online yearbooks, online catalogs, digital photo albums and more. Sign up and create your flipbook.