12 minute read
Mind the gap


The knowledge gap between understanding ocular surface shape and contact lens shape is narrowing quickly as of late, which is contributing to a better understanding of on-eye soft lens fitting characteristics and the future of the modality. It seems that one little gap needs to be closed: the gap in between the ocular surface and the back surface of the contact lens. By Eef van der Worp
A popular Netflix documentary ‘The Social Dilemma’ sheds a completely new light on social media and how this can be used in the future – an eye-opening film that perhaps everyone should see. In our soft lens arena, we are facing an equally interesting ‘dilemma’ as discussed here previously in GlobalCONTACT. In short: eye care practitioners do not ‘fit’ soft lenses; at best, they select one. But based on what? That is the big question. In line with the mentioned documentary, new technology could be a game changer for this dilemma.
Advertisement
WORKBENCH
Let’s start at the beginning. What do we know about the ocular surface and its shape? Parts of this have been covered in GlobalCONTACT before, as most of this research stems from studies done on scleral shape with the sole purpose of fitting scleral lenses. Based on different methods including optical coherence tomography (OCT), profilometry and Scheimpflug technology, the overall sagittal height (OC-SAG) over a 15 mm chord in the horizontal meridian is thought to be in the 3750-micron range. Some Placido disc topographers are also capable of fairly accurately estimating the OC-SAG based on extrapolation from measured corneal data. The chord or diameter of 15 mm is chosen and generally accepted as the ‘workbench’ for soft lens fitting, because a typical soft lens is in the 14.2 mm range and allows for about 0.2 or 0.3 mm of movement on each side. But what about individual variation within each eye? A number of recent studies looked at the amount of difference within
different (semi-)meridians of the normal eye. Consejo et al looked at anterior scleral regional variation between Asian and Caucasian populations using the Eye Surface Profiler (Eaglet Eye). They used 6 mm , 7 mm , 8 mm and 9 mm distances from the centre in 121 eyes. Looking at the 7 mm data (approximately our desired 7.5 mm half-chord, for our purposes), it showed that the maximum difference between the eight meridians (in the 0°, 45°, 90°, 135°, 180°, 225°, 270° and 315° directions) was 240 microns based on the averages of all eyes. So, this suggests that 240 microns is the amount of ‘relative flexure’ that a soft lens must go through to fully conform to the anterior ocular surface shape in different meridians/segments.
FLEX
‘To flex’ is a slang term meaning ‘to show off’. Wouldn’t it be nice if we could measure the amount of OC-SAG variation within one eye? Then we could really ‘show off’ and better predict soft lens flexure on-eye. A practical question in conjunction with this is: can we measure just the horizontal OC-SAG (as this is by far the easiest to measure) to predict the overall OC-SAG value? In considering horizontal versus vertical differences in eye dimensions, we are typically ‘stuck’ in thinking about corneal diameter and visible iris diameter (VID). Our current understanding is that the vertical VID is substantially smaller compared to the horizontal one (HVID). Hence, the common advice is to measure the oblique VID (to be in between, as an artificial average). Does this translate to OC-SAG? The difference in the Consejo paper between the average horizontal OC-SAG (H/OC-SAG) and the vertical (V/OC-SAG) of all eyes was 60 microns over a 7 mm half-chord. The difference between the average H/OC-SAG meridian and the average OC-SAG of all eyes was only 20 microns. This looks promising, but remember that these are all average values. If the OC-SAG is sometimes smaller and sometimes bigger, then the average would artificially generate a low number.
INDIVIDUAL EYES
Markus Ritzmann published a paper in Contact Lens & Anterior Eye a number of years ago looking into the same matter using OCT imaging (Zeiss Visante). On 39 normal healthy subjects, he too looked at eight meridians at a distance of 7.5 mm from the centre. The difference among eyes was 118 microns. His average values show comfortably low numbers for average values similar to the Consejo paper; the difference between H/ OC-SAG and V/OC-SAG was only 13 microns, and it was only 5 microns between H/OC-SAG and the overall average OC-SAG. Going back to the original Ritzmann source data, though, and analysing individual eyes rather than mean values as was suggested by Consejo, a slightly different picture is painted: the average eye shows 227 microns of difference (with a standard
THERE IS A LOWERING OF THE SAGITTAL HEIGHT VALUE WHEN THE LENS IS APPLIED TO THE EYE, POSSIBLY IN THE 180-MICRON RANGE BASED ON THEORETICAL CALCULATIONS.
deviation (SD) of ± 74 microns). E.g., this is the amount of relative ‘flex’ in microns of a soft lens on the eye. The minimum difference on an individual eye was 90 microns, but the maximum difference was up to 390 microns for another eye. It appears that some eyes have substantially higher OC-SAG values horizontally than vertically, but equally often it is the other way around. This explains the low ‘mean difference’ reported earlier. Comparing H/OC-SAG and V/OC-SAG in absolute terms, the difference is 109 microns (SD ± 79), with a range of 0-255 microns. For the H/OC-SAG compared to the average overall OC-SAG, this is a 79-micron difference (SD ± 49 micron), with a range of 8-190 microns. What this seems to imply is that you can measure H/OC-SAG with a given instrument, but you have to take into account that this number is ‘somewhat’ off: roughly 100 microns on average, but more for some individual eyes, of course. Hence, ideally you would measure the average OC-SAG in 360 degrees to calculate the actual average ocular surface shape. Having said that, soft lenses are very forgiving and flexible, and the clinical significance of a 100-micron variation is up for debate. To emphasise that differences between eyes and individuals exist, Consejo et al did find differences between Asian eyes and Caucasian eyes in that the Asian anterior sclera was found to be flatter than in Caucasians.
TOOLS
What do we know about our ‘tools’ – the lenses that we have in our arsenal – to fit that ocular surface? First and foremost, the new CLEAR publications on evidence-based contact lens practice by the BCLA group state that: ‘Ideally the lenses’ sagittal height (CL-SAG) should be matched to corneal sagittal height’. Please note that sagittal ‘height’ is used for both the ocular surface and for the lens (not ‘depth’). The paper also states that these SAG values for lenses are not widely available. A new study recently published in Contact Lens & Anterior Eye by a team at Pacific University explores the CL-SAG of 44 commercially available daily disposable and reusable lenses in spherical and toric variations. As we speak, new lenses are
being analysed by Ben Coldrick at Optimec in the UK with the is830 instrument. What all lenses analysed, recently and in the past, have in common is that the lenses (per ISO standards) are measured at room temperature or 20°C. However, if the lens goes on the eye, the temperature actually rises to a mean of 34°C. One would expect that number to be dependent on environmental circumstances (e.g., cold or warm weather), but it appears that outside conditions are only responsible for just a few degrees of difference in on-eye temperature – hardly clinically relevant, it seems.
A HOT TOPIC
But making the transition from room temperature to eye temperature does make a huge difference in lens shape. It may be surprising for eye care practitioners to learn that the average lens ‘shrinks’ on-eye. By how much is the question. A landmark paper by Graeme Young et al in 2016 looked at the effect of temperature on soft lens diameter. To determine the difference, they calculated the ‘shrink factor’ by taking the on-eye temperature diameter and dividing that by the room temperature diameter. He looked at 24 different lenses: the shrink factor on average was 0.982 (a 2% difference), varying between 0.997 and 0.950 (depending on material). This is for diameter – what does this mean for CL-SAG? Could the shrink factor used for diameter be applied to CL-SAG too? A small study by Coldrick and Richards presented as a poster at the Global Specialty Lens Symposium (GSLS) in 2016 looked at both diameter and CL-SAG versus temperature change. Although this was a small pilot study, with a large variation of lens materials, thicknesses and powers, the shrink factor for diameter was 0.968, and this was in line with the shrink factor for CL-SAGs (0.966). The range in shrink factor was 0.991 and 0.941 for that potpourri of different lenses. This shows that temperature indeed is a factor to take into account. The exact magnitude is to be determined, though. The new lenses currently being analysed are going to be measured at 20°C and at 34°C to get a better understanding of this. If we would use – hypothetically – the shrink factor found by Young of 2% (although variance up to 5% seems possible) and use the average of all spherical lenses in the Pacific study of 3666 microns over its labelled diameter, then this would mean a roughly 75-micron difference to take into account for the change from room to on-eye temperature.
CLOSING THE GAP
So, on the contact lens side, the gap in knowledge is closing too. But what happens if a soft lens goes on the eye? There is not enough room in this article to cover that in detail – more on that in future editions of GlobalCONTACT – but the essence is that the lens has to be substantially ‘steeper’ than the ocular surface to create an acceptable lens fit. If the CL-SAG matches the OC-SAG, the lens moves too much, influenced by tear film and eyelid/blinking and even gravity forces. How much steeper? In Graeme Young’s landmark publications on mathematical modelling of soft lens fitting and the inter-relationship between diameter, base curve and lens fit – the term ‘edge strain’ was coined. The optimal or ideal ‘edge strain’ supposedly is 2.7%, according to Young. Simplified, this means that a lens has to be steeper than the ocular surface to create the ‘right’ amount of flexure, and thus the right amount of grip, for a good lens fit to be achieved. In that case, the on-eye lens diameter increases by 2.7% after flexure. In essence, according to Young, there is a lowering of the sagittal height value when the lens is applied to the eye. With a typical optimally fitting lens (i.e., an edge strain 2.7%), the sagittal height of the lens decreases by approximately 5% on-eye. Going back to the mentioned Pacific database of all spherical lenses (average CL-SAG of 3666 microns) and after applying a temperature shrinkage factor of 2% to that, a further 5% on-eye decrease would be in the 180-micron range. One other factor that is mentioned regarding soft lens fitting is that there could be something ‘lost,’ as the lens does not per se fully align with the ocular surface. In other words, there could be a ‘post-lens gap’ between CL-SAG and OC-SAG, after flexure. Recent OCT studies have shown the post-lens gap to be extremely low, though; up to a few microns – less than the thickness of a red blood cell, typically – and this factor therefore appears to be a neglectable one.
F-FACTOR
Bringing it back to our terminology in contact lens practice, this edge strain and relative steepness of the lens could therefore be transformed into a ‘flex-factor’ describing the amount of flexure of a given lens on the ocular surface. One would want ‘a number’ to add to the OC-SAG to come up with the optimal lens of first choice. However, this depends on a number of variables including the exact material of the lens, the thickness of the lens and external factors such as tear film and eyelid forces. The term fitting factor therefore could prove to be more practical than flex-factor. But in essence, this factor might not be that easy to uncover and may prove to be a pain in the butt to nail down, as it is dependent on material and many other
factors. Hence, the F-factor, in a way, almost seems like it would be the best term. But no matter how you look at it, ‘F-factor’ seems to be the appropriate term for this final piece of the puzzle. Mind the gap. It’s the missing piece of the puzzle.
See the Pacific website via the URL and QR code for full access (and future updates and additions).
Sources:
• Consejo A, Wu R, Abass A. Anterior Scleral Regional Variation between Asian and Caucasian Populations. J Clin Med. 2020 Oct 25;9(11):3419. • Ritzmann M, Caroline PJ, Börret R, Korszen E. An analysis of anterior scleral shape and its role in the design and fitting of scleral contact lenses. Cont Lens Anterior Eye. 2018 Apr;41(2):205-213 • Van der Worp Eef, Matthew Lampa, Beth Kinoshita, Mari J. Fujimoto,
Benjamin J. Coldrick, Patrick Caroline. Variation in sag values in daily disposable, reusable and toric soft contact lenses. Cont Lens
Anterior Eye. Jan 2021. DOI: https://doi.org/10.1016/j.clae.2020.11.006 • Wolffsohn JS, Dumbleton K, Huntjens B, Kandel H, Koh S, Kunnen CME, Nagra M, Pult H, Sulley AL, Vianya-Estopa M, Walsh K,
Wong S, Stapleton F. CLEAR - Evidence-based contact lens practice.
Cont Lens Anterior Eye. 2021 Apr;44(2):368-397. doi: 10.1016/j. clae.2021.02.008. Epub 2021 Mar 25. PMID: 33775383. • Young G. Mathematical model for evaluating soft contact lens fit.
Optom Vis Sci. 2014; 91:e167–76. • Young G. The inter-relationship of soft contact lens base curve radius, diameter and fit. ECLSO meeting, Izmir (Turkey). Oct 2015. • Young G, Potts M, Sulley A.The Effect of Temperature on Soft
Contact Lens Diameter. Eye Contact Lens. 2016; 42(5):298-302
Eef van der Worp, BOptom, PhD, FAAO, FIACLE, FBCLA, FSLS is an educator and researcher. He received his optometry degree from the Hogeschool van Utrecht in the Netherlands (NL) and has served as a head of the contact lens department at the school for over eight years. He received his PhD from the University of Maastricht (NL) in 2008. He is a fellow of the AAO, IACLE, BCLA and the SLS. He is currently adjunct Professor at the University of Montreal University College of Optometry (CA) and adjunct assistant Professor at Pacific University College of Optometry (Oregon, USA). He lectures extensively worldwide and is a guest lecturer at a number of Universities in the US and Europe.
Advertisement
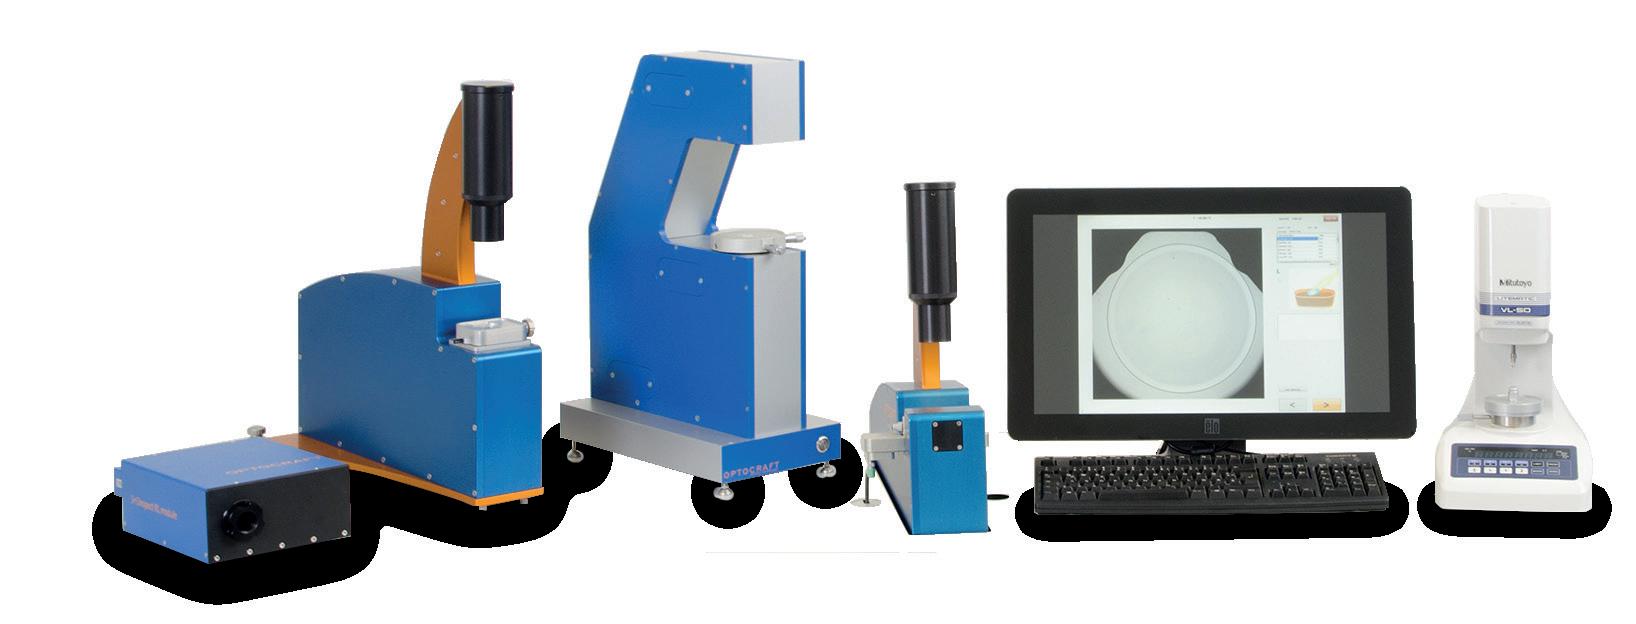
Fast, reliable and objective measurement of contact lenses!
Refractive data
Power map with 0.040mm physical resolution

Multifunctional cuvette
Easy and fast loading of CL Temperature control to ±0.1 °C
High quality imaging system
Lens diameter, sag, haptic recognition Visualisation of defects
Made in Germany. Tel. +49 9131 69 15 00 email sales@optocraft.de