
Long Range Transportation Plan
PUBLIC ENGAGEMENT SUMMARY
Access 2050 Hillsborough TPO ii Table of Contents 1 Project Overview ........................................................................................................ 2 1.1 Introduction ...................................................................................................................2 1.2 Public Outreach Purpose 3 1.3 Public Engagement Strategy Overview ............................................................................4 2 Stakeholder Identification ........................................................................................... 7 2.1 Interagency and Elected Official Identification.................................................................7 2.2 Community Stakeholders ...............................................................................................9 2.3 Audience Demographic Identification 11 3 Public Engagement Strategy ....................................................................................... 14 3.1 Project Survey ..............................................................................................................14 3.2 Community Events.......................................................................................................15 3.3 Community Conversations ...........................................................................................17 4 Delivery Methods....................................................................................................... 21 4.1 Branding and Website Development .............................................................................22 4.2 Email Blasts .................................................................................................................23 4.3 Media Reach 24 4.4 Social Media Campaign and Targeted Advertising .......................................................... 26 4.5 Rack Cards, Posters, and Banners 29 4.6 Videos and Promotional Materials ................................................................................30 4.7 Partner Promotional Toolkit ..........................................................................................33 4.8 Staff Outreach Toolkit 35 5 Equity Considerations ................................................................................................ 37 5.1 Outreach for Targeted Geographic Areas 37 5.1.1 Description and List of Transportation Disadvantaged Target Areas ......................... 37 5.1.2 Partner Organizations ...........................................................................................39 5.2 Outreach for Targeted Demographic Groups 40 5.2.1 Seniors .................................................................................................................40
College Students and Young Adults ....................................................................... 42 5.2.3 People with Limited English Proficiency ................................................................. 43 5.2.4 People with Disabilities .........................................................................................45 5.2.5 Parents and Families 47
5.2.2
6.3.1
6.4.2
Access 2050 Hillsborough TPO iii 5.2.6 Low-Income Citizens ............................................................................................49 6 Outreach Results ....................................................................................................... 54 6.1 Survey Questions and Format .......................................................................................54 6.1.1 Survey Screen 2: Priorities 55 6.1.2 Survey Screen 3: Funding Sources ......................................................................... 56 6.1.3 Survey Screen 4: Major Projects............................................................................. 57
Survey Screen 5: Wrap Up and Demographic Questions ......................................... 58 6.2 Survey Results .............................................................................................................59 6.2.1 Cumulative Survey Data 59 6.2.2 Survey Screen 2: Priorities .....................................................................................60 6.2.3 Survey Screen 3: Funding Sources ......................................................................... 62 6.2.4 Survey Screen 4: Major Projects............................................................................. 68 6.2.5 Survey Screen 5: Wrap Up and Demographic Questions ......................................... 74 6.3 Public Comments and Trends 82
6.1.4
Public Transit ........................................................................................................82
Reduce Congestion...............................................................................................83
Road Widening .....................................................................................................83 6.3.4 Reduce Crashes ...................................................................................................84 6.3.5 Improve Bicycle and Pedestrian Infrastructure 84 6.3.6 Development Concerns ........................................................................................84 6.3.7 Transportation Infrastructure Maintenance ............................................................ 85 6.3.8 Provide Alternatives to Driving ...............................................................................85 6.4 Comparison to 2045 LRTP Survey Results ..................................................................... 85
Reduce Congestion 86
6.3.2
6.3.3
6.4.1
Development Priorities..........................................................................................86
Focus on Bike/Walk Modes ....................................................................................86 6.4.4 Use New Technology 86 7 Summary and Next Steps ........................................................................................... 89
6.4.3
Access 2050 Hillsborough TPO iv
Figure 1-1 Hillsborough TPO Leadership at Commissioner Myers Town Hall ....................................3 Figure 1-2 Timeline of Outreach Activities......................................................................................5 Figure 2-1 TPO Staff Presenting at Sun City Center .........................................................................9 Figure 3-1 Hillsborough TPO hosts two -day Access2050 Survey Kickoff Event ............................... 15 Figure 3-2 TPO Staff Presentation at Sun City Center Community Meeting 17 Figure 3-3 Map of Community Outreach Events ...........................................................................18 Figure 3-4 Access 2050 Social Media Posts from Local Partners ................................................... 19 Figure 4-1 TPO Staff at Tampa Heights Junior Civic Association Sunday Dinner 21 Figure 4-2 Access 2050 Branding Guide and Logo ........................................................................ 22 Figure 4-3 Screenshot of Access 2050 Website............................................................................22 Figure 4-4 Screenshot of Access 2050 Website............................................................................23 Figure 4-5 ABC Action News Covering Access 2050 24 Figure 4-6 Tampa Bay Business Journal Coverage of Access 2050 ................................................ 25 Figure 4-7 Osprey Observer Coverage of Access 2050 .................................................................. 25 Figure 4-8 83 Degrees Media Coverage of Access 2050 25 Figure 4-9 Access 2050 Instagram Posts .....................................................................................26 Figure 4-10 Plan Hillsborough Facebook Posts............................................................................. 27 Figure 4-11 Plan Hillsborough X (Twitter) Posts 27 Figure 4-12 Targeted Social Media Advertisement 28 Figure 4-13 Access 2050 Rack Cards, Posters, and Banners ......................................................... 29 Figure 4-14 How to Take the Access 2050 Survey Video ................................................................ 30 Figure 4-15 Zoo Tampa Outreach Event Video Series - How Transportation Affects Manatees 31 Figure 4-16 Zoo Tampa Outreach Event Video Series - How Transportation Affects Panthers .......... 31 Figure 4-17 Zoo Tampa Outreach Event Video Series - How Transportation Affects Black Bears ..... 31 Figure 4-18 ACCESS 2050 Survey Promo Video 1 - Your Voice is The Key 32 Figure 4-19 ACCESS 2050 Survey Promo Video 2 - Your Voice is The Key ....................................... 32 Figure 4-20 Partner Promotional THEA - ACCESS 2050 Survey ...................................................... 33 Figure 4-21 Partner Promotional City of Plant City - ACCESS 2050 Survey ..................................... 34 Figure 4-22 Partner Promotional Wimauma CDC - ACCESS 2050 Survey 34 Figure 4-23 Partner Promotional University Area CDC - Slow Roll Access 2050 ............................. 35 Figure 4-24 TPO Staff at Wimauma Community Event with Enterprising Latinas ............................ 35 Figure 5-1 Access 2050 Table at MOSI 37 Figure 5-2 Map of Transportation Disadvantaged Target Areas in Hillsborough County................... 38 Figure 5-3 Residents at Sun City Center Community Meeting ....................................................... 40 Figure 5-4 Concentrations of Adults Age 65+ 41 Figure 5-5 HART Rider Taking Survey 42 Figure 5-6 Concentrations Residents with Limited English Proficiency .......................................... 44 Figure 5-7 Participants Filling out Large Print Paper Surveys ......................................................... 45 Figure 5-8 Concentrations of Persons with a Disability 46 Figure 5-9 A Family Shows Off Their Safety Materials at the ZooTampa Access2050 Event ............. 47 Figure 5-10 Concentrations of Youth Ages 10-17 .......................................................................... 48 Figure 5-11 Wimauma Resident Filling Out Access 2050 Survey during Outreach Event 49
List of Figures
List of Tables
Access 2050 Hillsborough TPO v Figure 5-12 Concentrations of Low-Income Households .............................................................. 50 Figure 6-1 Survey Screen 1 ..........................................................................................................54 Figure 6-2 Survey Screen 2..........................................................................................................55 Figure 6-3 Survey Screen 3 56 Figure 6-4 Survey Screen 4..........................................................................................................57 Figure 6-5 Survey Screen 5..........................................................................................................58 Figure 6-6 Cumulative Daily Responses 59 Figure 6-7 Platform Breakdown ...................................................................................................60 Figure 6-8 Distribution of rankings for each given priority.............................................................. 62 Figure 6-9 Responses to Community Investment Tax Scenarios ................................................... 63 Figure 6-10 Responses to Gas Tax Scenarios 64 Figure 6-11 Responses to Transit Service Property Tax Scenarios .................................................. 65 Figure 6-12 Responses to Express Toll Lane Scenarios ................................................................. 66 Figure 6-13 Responses to Scenarios That Include Other Funding Scenarios 67 Figure 6-14 Percent of Yes and No Votes on Interchange Projects ................................................. 69 Figure 6-15 Percent of Yes and No Votes on Transit Projects ......................................................... 70 Figure 6-16 Percent of Yes and No Votes on Widening Projects 72 Figure 6-17 Percent of Yes and No Votes on Managed Lane Projects 73 Figure 6-18 Responses per Home Zip Code .................................................................................75 Figure 6-19 Responses per Work/School Zip Code ....................................................................... 76 Figure 6-20 Age Ranges of Survey Respondents 77 Figure 6-21 Race/Ethnicity of Survey Respondents ...................................................................... 78 Figure 6-22 Survey Responses by Gender ....................................................................................79 Figure 6-23 Survey Responses by Annual Household Income 80 Figure 6-24 Survey Responses by Employment Status ................................................................. 81 Figure 6-25 TPO Staff Member Showing the Survey at Marion Transfer Center ............................... 83 Figure 6-26 USF Student Ambassadors at UACDC Slow Roll Outreach Event ................................ 84
Table 2-1 Hillsborough County Partners, Agencies, and Elected/Appointed Officials .......................7 Table 2-2 Agency Stakeholders Who Hosted Events, Conversations, or Shared Information ............9 Table 2-3 Hillsborough County Cities, Communities, and Census Designated Places ................... 10 Table 2-4 Hillsborough County CRAs 10 Table 2-5 Hillsborough County Population Growth ................................................................... 11 Table 2-6 Hillsborough County Employment Growth ................................................................ 11 Table 2-7 Hillsborough County Race/Ethnicity Demographics (2020) 12 Table 2-8 Hillsborough County Age Demographics (2020) ......................................................... 12 Table 4-1 Access 2050 Email Blast Data ......................................................................................23
5-1 Organizations Contacted and Events Attended in TDTAs ................................................ 39
6-1 Cumulative Survey Data 59 Table 6-2 Responses and Comments by Question ....................................................................... 60 Table 6-3 Number and Percent of Responses by Platform ............................................................ 60
Table
Table
Table
Table
Table
Table
Table
List of Acronyms
ADA - Americans with Disability Act
BPAC - Bicycle Pedestrian Advisory Committee
BRT - Bus Rapid Transit
CDC – Community Development Corporation
CR – County Road
EJ – Environmental Justice
EPA – Environmental Protection Agency
HART - Hillsborough Area Rapid Transit
HOA – Homeowner’s Association
LEP - Limited English Proficiency
LRTP – Long Range Transportation Plan
MOSI - Museum of Science and Industry
List of Appendices
Appendix A: Stakeholder Contact List
Appendix B: Branding Guide
Appendix C: Critical Mention Report
Appendix D: Social Media Analytics Report
NEMP – Northeast Master Plan
QR - Quick Response
SR – State Road
TDTA – Transportation Disadvantaged Target Areas
THAN - Tampa Homeowners Association of Neighborhoods
THEA – Tampa Hillsborough Expressway Authority
TPO – Transportation Planning Organization
UACDC – University Area Community
Development Corporation
USF – University of South Florida
Access 2050 Hillsborough TPO vi Table 6-4 Rankings for Each Transportation Priority ...................................................................... 61 Table 6-5 Responses to Community Investment Tax Scenarios..................................................... 63 Table 6-6 Responses to Gas Tax Scenarios ..................................................................................64 Table 6-7 Responses to Transit Service Property Tax Scenarios 65
6-8 Responses to Express Toll Lane Scenarios .................................................................... 66
Table
6-9 Responses to Scenarios That Include Other Funding Scenarios ..................................... 67
6-10 Number and Percentage of Yes and No Votes on Interchange Projects 68 Table 6-11 Number and Percentage of Yes and No Votes on Transit Projects ................................. 69 Table 6-12 Number and Percentage of Yes and No Votes on Widening Projects ............................. 71
6-13 Number and Percentage of Yes and No Votes on Managed Lane Projects ..................... 72
Table
Table
6-15 Respondents by Age 77
6-16 Race/Ethnicity of Survey Respondents ........................................................................ 78
6-17 Survey Responses by Gender .....................................................................................79
6-18 Survey Responses by Annual Household Income 80
6-19 Survey Responses by Employment Status ................................................................... 81
Table
PROJECT OVERVIEW 1

1 Project Overview
1.1 Introduction
The Hillsborough Transportation Planning Organization (Hillsborough TPO) worked diligently to develop and execute an impactful public engagement strategy to ensure that residents were able to complete the Long Range Transportation Plan (LRTP) survey to provide their input about the future of transportation in Hillsborough County, Florida. As the agency that serves the transportation planning needs across Hillsborough County, Florida, the Hillsborough TPO is mandated by federal and state law and focuses on policymaking and funding allocation. The Hillsborough TPO is directly responsible for ensuring federal and state money is spent on transportation projects and programs that are based on an ongoing, cooperative, and comprehensive planning and public outreach process. Through meaningful public engagement, the Hillsborough TPO establishes priorities for short- and long-term multimodal transportation needs across Hillsborough County, including the cities of Tampa, Temple Terrace, and Plant City. 1
The transportation planning services provided by the Hillsborough TPO are essential for continued economic growth and development in Hillsborough County. These services lay the foundation for effective transportation systems and infrastructure that provide access to essential services, employment, and education for all residents, workers, and visitors to Hillsborough County, including many underserved groups such as senior citizens, those with disabilities, persons with low incomes, and those without access to or the ability to operate a personal vehicle. The transportation system also supports the tourism industry, a key economic driver for Hillsborough County, further underscoring the importance of the LRTP process.
The Hillsborough TPO went to great care to ensure that the survey reached residents across all demographic and geographical groups by using a variety of communication methods including inperson presentations, pop -up events, partner outreach, social media posts and other digital outreach efforts, as well as television and print media outreach methods. Extensive collaboration and stakeholder engagement made it possible to reach a wide audience that fairly represented the people living in Hillsborough County today.
1Hillsborough TPO
Access 2050 Hillsborough TPO 2
1.2 Public Outreach Purpose
Hillsborough County has experienced rapid growth over the last two decades, with a 23% population increase since 2010. 2 Another 29% increase in population is projected by 2045. 3 In addition, the county encompasses the entire spectrum of urban landscapes, from the dense urban core of Downtown Tampa to suburbs, undeveloped wilderness, farmland, and very low-density rural areas. As the population of Hillsborough County grows, many neighborhoods will experience significant changes in density, land use, and neighborhood character. These changes will necessitate appropriate and proportional changes to transportation systems and infrastructure. These facts indicate a need to review all aspects of the transportation system in Hillsborough County to ensure that all citizens have access to necessary services, educational and economic opportunities, and recreational activities. The Hillsborough TPO plays a vital role in ensuring this access and maintaining the continued economic growth and quality of life for Hillsborough County residents, workers, and visitors to advance their mission to safely connect all people to places and opportunities.
The purpose of the Long Range Transportation Plan, called Access 2050, is to ensure Hillsborough County’s transportation network is able to meet the evolving needs of Hillsborough County. The first step in achieving this purpose has been to gain input from the community on what their priorities are for the future of transportation in Hillsborough County. Public outreach methods were implemented to encourage Hillsborough County residents, workers, employers, and visitors to indicate transportation issues, funding sources, and projects that are most important to them. The information gained from this public outreach provided a foundation which will allow TPO staff to make informed decisions about funding sources and project prioritization Ultimately, Hillsborough TPO staff will use this input gathered through public outreach to set goals, objectives, and policies in the next phase of the Long Range Transportation Plan that will guide transportation decisions through 2050.
2 US Census QuickFacts, Hillsborough County, FL
3 Florida Office of Economic and Demographic Research
Access 2050 Hillsborough TPO 3
Figure 1-1
Hillsborough TPO Leadership at Commissioner Myers Town Hall
1.3 Public Engagement Strategy Overview
The Hillsborough TPO is committed to using meaningful public engagement to establish priorities for short- and long-term multimodal transportation needs for Tampa, Temple Terrace, Plant City, and unincorporated Hillsborough County. Effective public participation is essential to the successful implementation of Access 2050, and necessary to ensure that the needs of Hillsborough County’s many unique and diverse communities are adequately addressed. The feedback and ideas provided through all public engagement opportunities will directly help to inform the decisions made throughout the next phase of the Long Range Transportation Plan process.

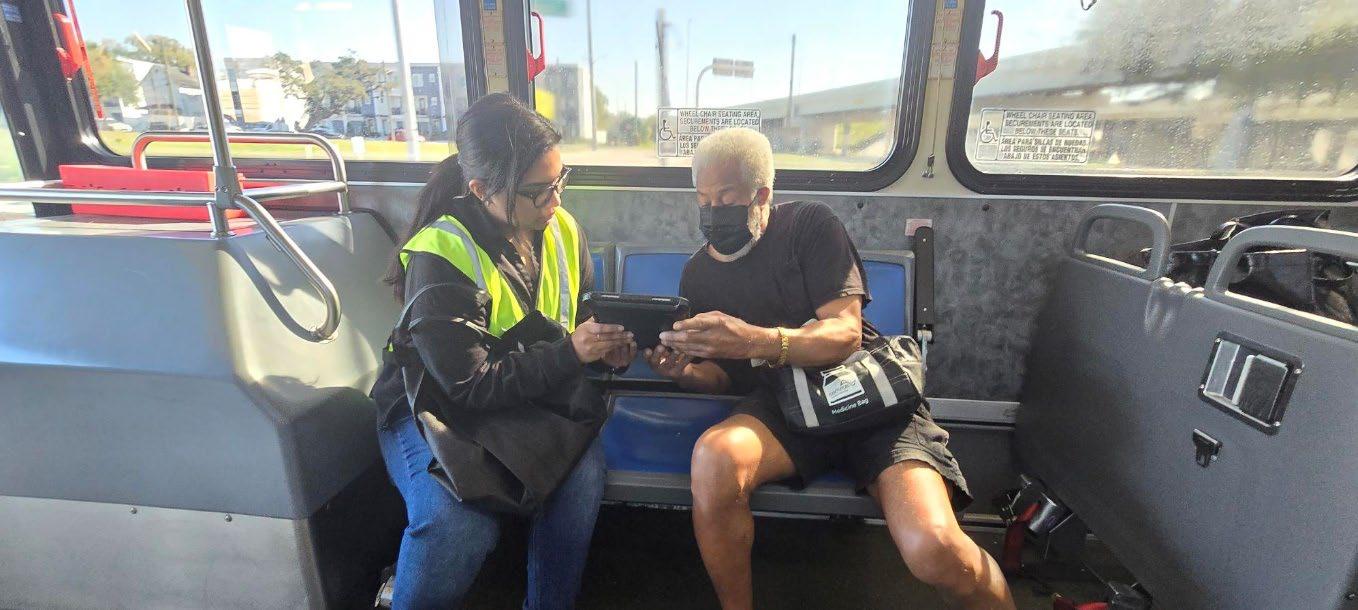
HART Transit Ride-Alongs
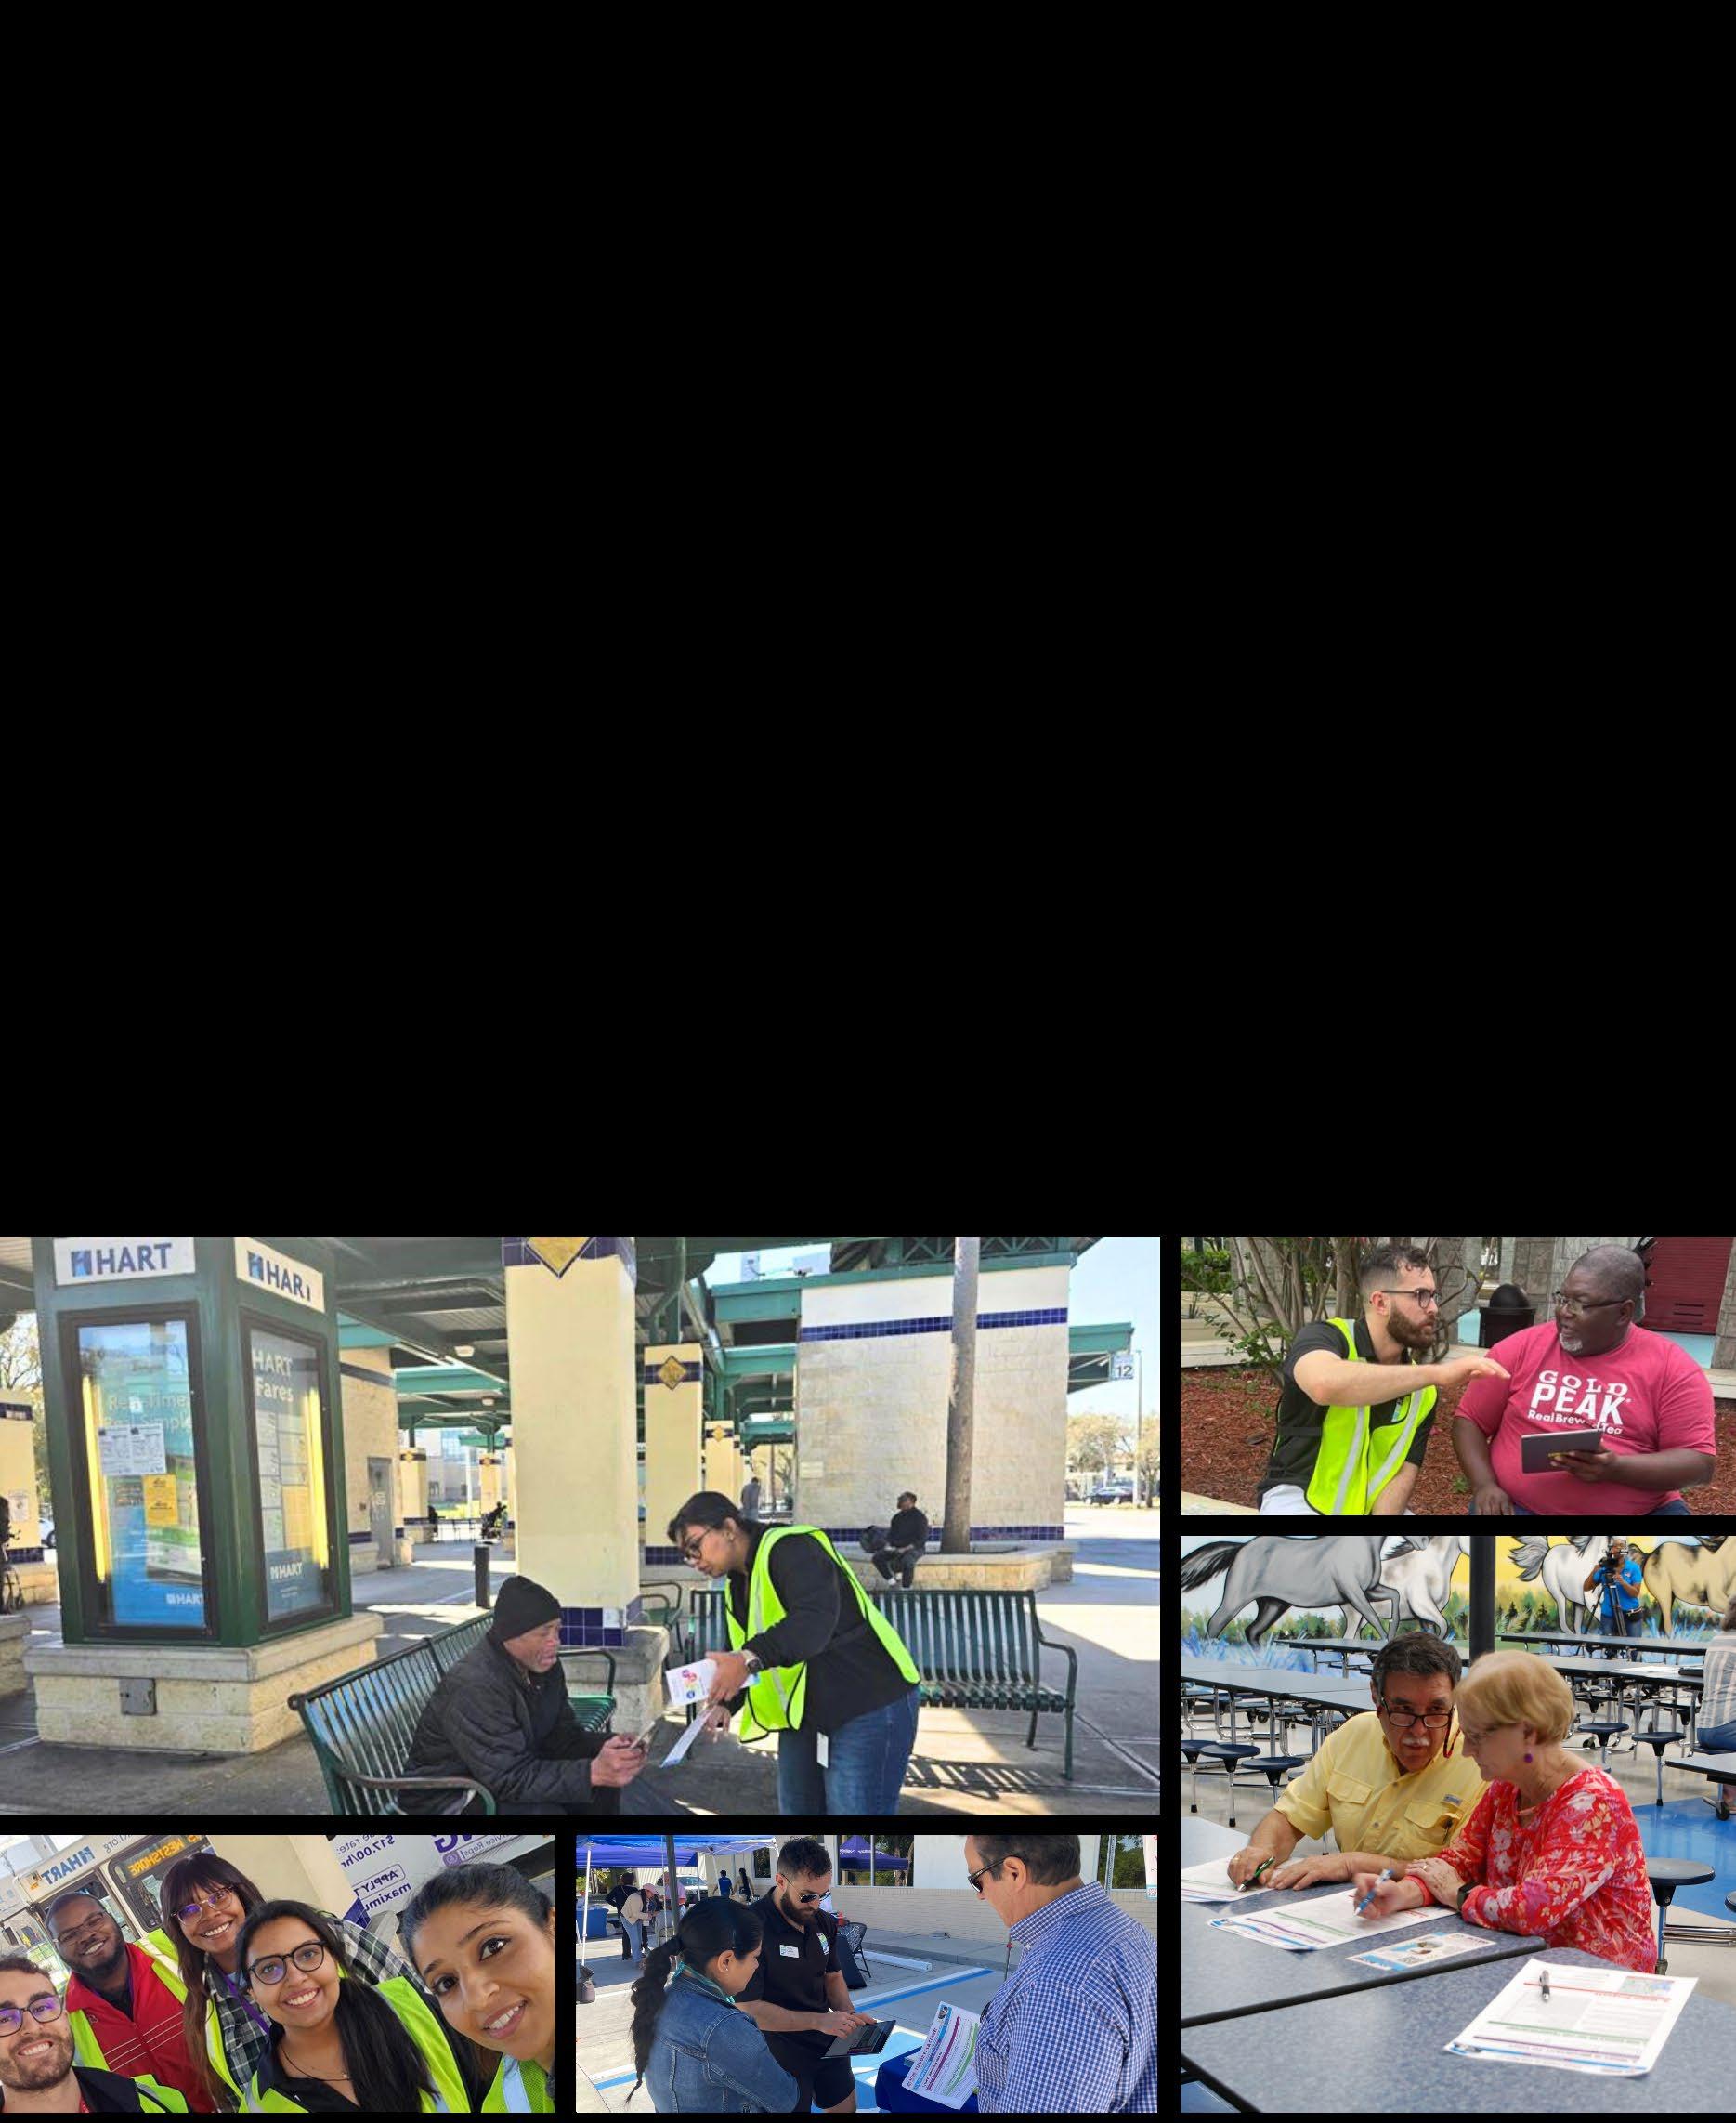
The team utilized innovative strategies to promote Access 2050 surveys, conducting multiple Ride-Alongs aboard Hillsborough Area Regional Transit buses. They distributed flyers and giveaways at transit centers and even developed an advertisement to play on buses during daily commutes. These efforts significantly boosted participation across the county, reaching diverse demographics and ensuring broad representation in the surveys.

Access 2050 Hillsborough TPO 4
To ensure that all residents, workers, visitors, and other stakeholders had the opportunity to provide meaningful input, voice their ideas, and come to a consensus for Access 2050, this engagement strategy offered multi-layered public participation. Hillsborough TPO, Atkins, and EXP staff members created a public survey and participated in community conversations, stakeholder presentations, and community/pop-up events. This approach aligned with the Hillsborough TPO’s commitment to “meet people where they are” to ensure a fully inclusive public engagement and planning process.
To start off the plan, an online, interactive survey was developed providing community members the opportunity to weigh in at their convenience, on any device, and at any location where they have access to the internet. The online survey was also available in Spanish, and printed versions were created in multiple languages. ADA compliant printed copies and large font additions were also available.
Throughout the entire process, the team attended community events and participated in “community conversations” with the public. These events included neighborhood association meetings, county committee meetings, town halls, bus rides, and more. This helped to ensure that those without access to the internet or digital devices were still able to provide meaningful feedback through multi-lingual, hard copy surveys and in-person interviews as needed. The team also developed a continuous marketing strategy, including news releases, social media campaigns, and other delivery methods, which Hillsborough TPO staff implemented to spread the word about public participation opportunities.
The timeline for the complete engagement process is outlined in Figure 1-2 including the planning phase, online public survey window, and a summary of activities completed.
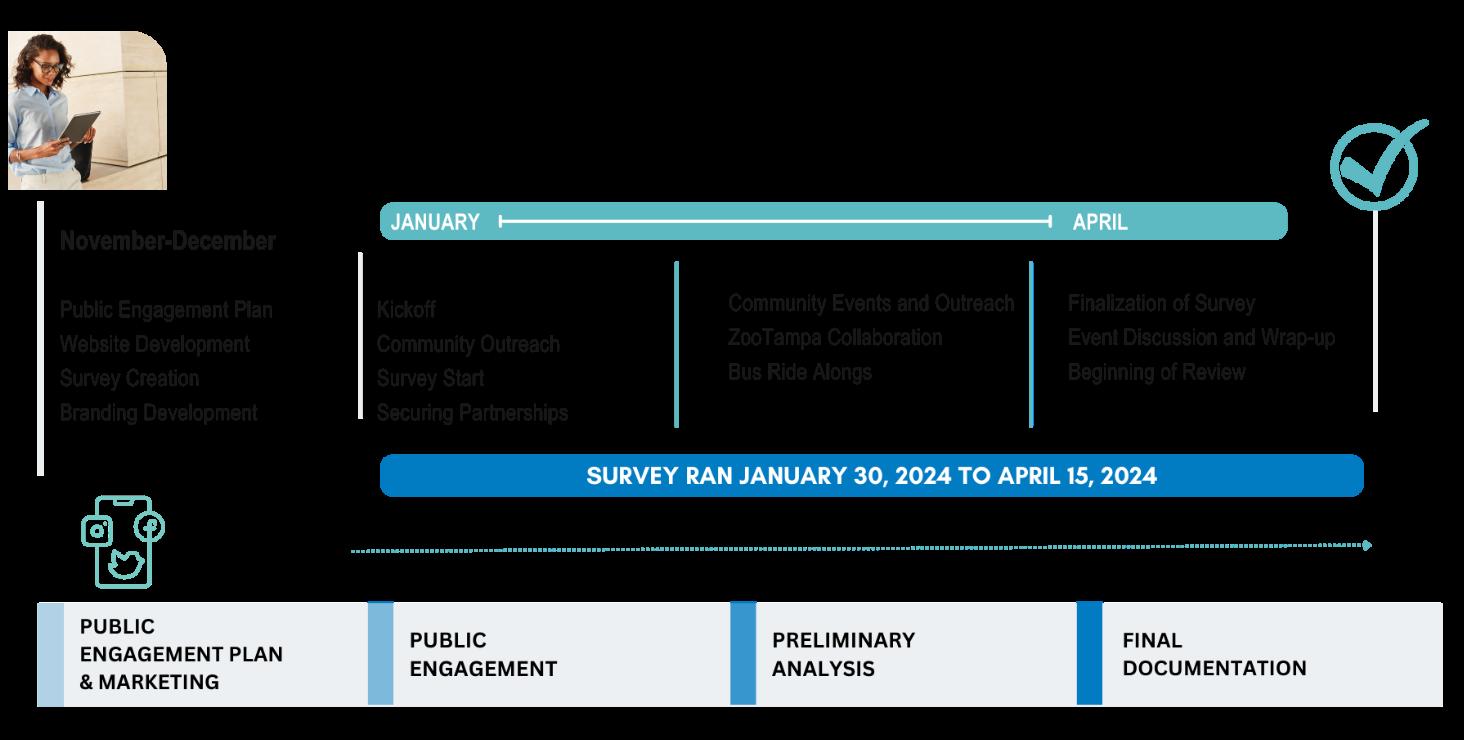
Access 2050 Hillsborough TPO 5
Figure 1-2 Timeline of Outreach Activities
STAKEHOLDER IDENTIFICATION
2
2 Stakeholder Identification
2.1 Interagency and Elected Official Identification
The following local, regional, state, and/or federal agencies were invested in this project due to jurisdictional review or expressed interest. Agencies were contacted directly by Hillsborough TPO staff throughout the Public Engagement Process. This list was updated throughout the study process as other public agencies were identified. All governmental agencies identified and contacted throughout the process are listed in Table 2-1
Table 2-1
Hillsborough County Partners, Agencies, and Elected/Appointed Officials
Florida Department of Economic Opportunity
Enterprise Florida
State
Federal
Agency for Persons with Disabilities
Florida Department of Transportation
Department of Transportation
Economic Development Administration
Federal Transit Administration
Federal Highway Administration
Tampa Bay Chamber of Commerce
Hillsborough Area Regional Transit
Tampa Bay Regional Planning Council
Tampa Bay Area Regional Transportation Authority
Regional
Hillsborough County
Port Tampa Bay
Tampa Aviation Authority
Tampa-Hillsborough Expressway Authority
Tampa International Airport
Hillsborough County Planning Commission
Hillsborough County Public Schools
Department of Economic Development
Department of Public Works
Hillsborough Transportation Planning Organization
Florida Department of Health in Hillsborough County
Department of Zoning and Land Use
Department of Human Services
Access 2050 Hillsborough TPO 7
Municipalities
Native American Tribes
Municipal and County Delegation
Florida State Senators for Local Districts
City of Tampa City of Temple Terrace
City of Plant City
Seminole Tribe of Tampa
Bonnie M. Wise, County Administrator, Hillsborough County Hillsborough County Board of County Commissioners, Ken Hagen, Chair
Senator Danny Burgess, District 23
Senator Jay Collins, District 14
Senator Darryl Rouson, District 16
Senator Jim Boyd, District 20
Representative Linda Chaney, District 61
Representative Michele Rayner-Goolsby, District 62
Representative Dianne Hart, District 63
Representative Susan L. Valdes, District 64
Florida State Representatives for Local Districts
Representative Karen Gonzalez-Pittman, District, 65
Representative Traci Koster, District 66
Representative Fentrice Driskell, District 67
Representative Lawrence McClure, District 68
Representative Daniel Antonio Alverez Sr., District 69
Representative Laurel Lee, District 15
Representative Kathy Castor, District 14
Representative Mike Beltran, District 70 Federal Delegation
Representative Vern Buchanan, District 16
Senator Marco Rubio
Senator Rick Scott
Access 2050 Hillsborough TPO 8
2.2 Community Stakeholders
Stakeholders are persons who could be directly impacted by possible changes to the Hillsborough TPO Access 2050 Long Range Transportation Plan. This includes residents, businesses, community organizations, HOAs, educational institutions, hospitals, senior citizens, disabled citizens, others with limited access to transportation, tourism representatives, and other stakeholders in and around Hillsborough County. Stakeholders also include communities which could be impacted by Right of Way acquisition for major highway or fixed guideway transit projects. Agencies from across Hillsborough County were identified and contacted to share information about Access 2050.
Stakeholders
Armory Gardens Civic Association Plan Hillsborough
Carver City/Lincoln Gardens Civic Association Plant City Chamber of Commerce
City of Tampa-Green Team Seminole Tribe of Tampa
Commissioner Myers Town Halls Strawberry Festival Enterprising Latinas Sun City Center
Greater Palm River Point CDC Tampa Downtown Partnership
Hampton Terrace Neighborhood Association Tampa Preservation Group
Hillsborough Area Rapid Transit (HART) TDP Transportation Committee
Hillsborough County BPAC Transportation Disadvantaged Coordination Board
Hillsborough County Cattlemen’s Association University Area CDC (UACDC)
Hillsborough County Farm Bureau Vanasse Hangen Brustlin, Inc.
Hillsborough County Parks & Recreation Visit Tampa Bay
Hillsborough County Public Schools Department of Defense
Keystone Civic Association Westchase Community Association Museum of Science and Industry (MOSI) Westshore Alliance Transportation Committee
National Federation of the Blind of Florida (Tampa Chapter) Zoo Tampa
Access 2050 Hillsborough TPO 9
Table 2-2 Agency Stakeholders Who Hosted Events, Conversations, or Shared Information Agency
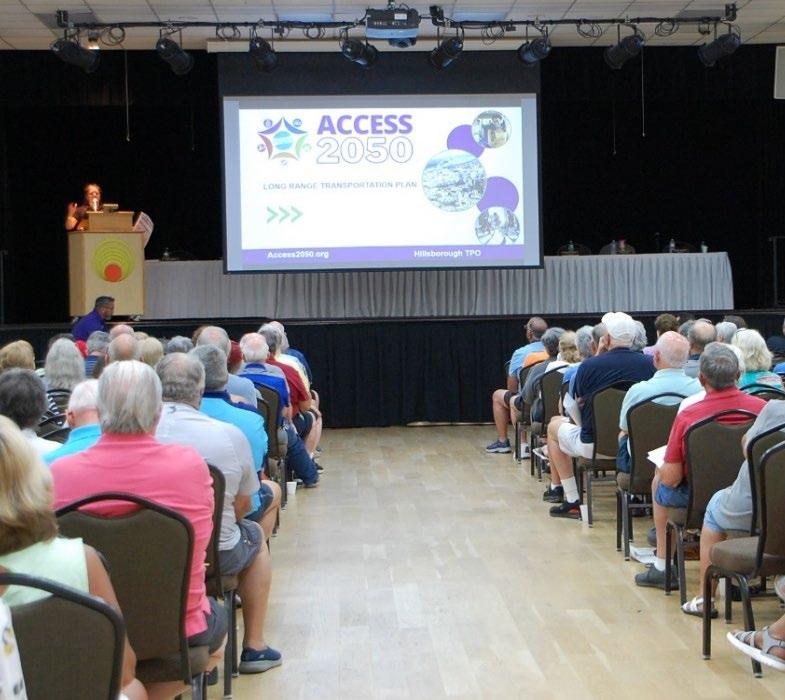
Figure 2-1 TPO Staff Presenting at Sun City Center
Stakeholders who hosted a presentation, pop -up event, or dispersed Access 2050 information are listed above in Table 2-2. A list of incorporated cities, local communities, and census designated places was compiled to ensure all geographic regions were reached, shown in Table 2-3. A complete list of agencies the team reached out to is available in Appendix A
Table 2-3 Hillsborough County Cities, Communities, and Census Designated Places
Communities
Apollo Beach Plant City
Balm Riverview
Brandon Ruskin
Carrollwood-Northdale Seffner
Citrus Park Sun City Center
Dover Sydney
Durant Tampa
Gibsonton Temple Terrace
Lithia Thonotosassa
Lutz Valrico
Mango Wimauma
Odessa
Additionally, Hillsborough County includes Community Redevelopment Areas (CRAs) which help foster and sustain civic engagement in Hillsborough County. These organizations are important partners in the Long Range Transportation Plan because they often represent underserved areas and have existing relationships with disadvantaged residents, many of whom rely on public transportation to access necessities and opportunities. These CRAs also represent important activity centers throughout the county and were able to provide valuable insight into transportation needs across Hillsborough County. These CRAs are identified in Table 2-4.
CRAs
Temple Terrace CRA
East Tampa CRA
Ybor City CRA
City of Plant City CRA
Address
11250 North 56th Street
Temple Terrace, FL 33617
306 E Jackson St Tampa, FL 33602
2015 East 7th Avenue
Tampa, FL 33605
302 W Reynolds Street
P.O. Box Drawer C Plant City, FL 33563
Access 2050 Hillsborough TPO 10
Table 2-4 Hillsborough County CRAs
2.3
Audience Demographic Identification
The strategic public engagement plan meticulously integrated audience demographics, encompassing factors such as age, race, income, and various other socio-economic indicators, to ensure inclusivity and resonance across diverse voices. By comprehensively understanding the demographic landscape, the plan adeptly tailored its outreach initiatives to effectively reach and engage all segments of the population. From targeted social media campaigns tailored to specific demographic groups to community events designed to address the unique concerns of various communities, every facet of the plan was finely calibrated to foster genuine dialogue and representation. Through this nuanced approach, the plan not only facilitated broader participation but also fostered a sense of belonging and empowerment among all demographics, amplifying their voices in the decision-making process.
Hillsborough County’s population currently encompasses nearly 1.5 million people and is expected to grow to nearly 2 million people by 2050. Tables 2-5 and 2-6 show the expected population and employment growth based on projection trends. Currently, 33,094 (6.0%) households are without access to a car and 190,472 residents (12.9%) are below the poverty level. 30.5% of the population speaks a language other than English at home, with 12.8% of households meeting the definition for Limited English Proficiency (LEP), and 7.9% are persons with a disability. 21.5% of the population is under 18 years of age with 15.1% being 65 years over. 35.5% have a college degree or higher. 4 A breakdown of the race/ethnicities and ages for Hillsborough County is outlined in Tables 2-7 and 2-8 below.
Access 2050 Hillsborough TPO 11
Table 2-5 Hillsborough County Population Growth 5
Access 2050 Hillsborough TPO 12
White Black Native American Asian Hispanic Other/Mixed Race Population 678,977 223,899 2,189 59,511 427,400 52,383 Percent of Population 47.0% 15.5% 0.2% 4.1% 29.6% 3.6%
Table 2-7 Hillsborough County Race/Ethnicity Demographics (2020) 7
Ages 0-18 Ages 18-44 Ages 45-64 Ages 65 & Over Population 322,797 727,754 369,690 205,565 Percent of Population 19.9% 44.8% 22.7% 12.6% 7
8
Table 2-8 Hillsborough County Age Demographics (2020) 8
US Census
US Census
PUBLIC
3
ENGAGEMENT STRATEGY
3 Public Engagement Strategy
The following activities were conducted throughout the public engagement process to gain input from local partners, stakeholders, and the public to identify potential changes to the Long Range Transportation Plan. These activities were designed to create an opportunity for all audiences to provide meaningful feedback and ideas that will help guide each step of the development of an inclusive and representative Access 2050 Long Range Transportation Plan.
3.1 Project Survey
The Hillsborough TPO developed a MetroQuest public survey which was live from January 30, 2024 to April 15, 2024. The team ensured that the survey was not only easily comprehensible to the public but also user-friendly, and seamlessly navigable, ensuring a smooth experience from start to finish. Surveys were incentive-based, allowing participants who provided an Email to be entered to win an array of prizes including Bad Bunny and Kane Brown concert tickets, a $100 Publix gift card, Tampa Bay Bucs sports tickets, a Museum of Science & Industry Family 4-Pack, and a Zoo Tampa VIP Experience.
The survey was strategically designed to captivate participants with engaging visuals, vibrant colors, and interactive features, transcending the traditional text-based format. These design enhancements were thoughtfully implemented to ensure clarity, offer guidance on survey components, and foster greater participation in the planning process. Participants were encouraged to ask questions and subscribe for email updates, enabling them to remain informed about upcoming events and opportunities to actively contribute their perspectives throughout the overall Long Range Transportation Plan process
To maximize accessibility, the survey was made available in both digital and paper formats, accommodating individuals without internet access, those who needed ADA compliant options, or those who preferred traditional methods. Additionally, recognizing the diverse demographic landscape of Hillsborough County, the survey was provided in both English and Spanish, allowing residents with Limited English Proficiency to provide their ideas and feedback to help shape the future of their communities.

Access 2050 Hillsborough TPO 14
Collectively, a diverse cohort of 4,635 individuals participated in the Access 2050 survey, demonstrating a remarkable commitment to shaping the future. Their combined efforts yielded nearly 150,000 data points, each offering a unique perspective on their ideas for the future of transportation. Additionally, the Access 2050 website served as a bustling hub, attracting over 40,000 visits from curious individuals eager to explore and contribute. To dive deeper into these insights, see the comprehensive analysis presented in Chapter 6 of this document.
3.2 Community Events
Hillsborough TPO and EXP staff members hosted and/or attended community events to encourage the community to take the survey and get involved in Access 2050. These events took place for a few hours on different days of the week. Staff members ensured that these events happened at multiple locations across Hillsborough County, especially those within underserved communities and/or those in the High Injury Network. At these events, staff members set up a table or booth, or otherwise established a presence. Staff engaged in dialogue about the LRTP with event attendees and encouraged them to take the survey using the format of their choosing. Staff members were readily available to provide explanations or assistance throughout the survey process, whether utilizing their own devices or those provided by the staff, ensuring seamless navigation for all participants. This dedicated support ensured that everyone could effortlessly navigate the survey, thereby facilitating the smooth completion of Access 2050 and the provision of vital information.

The team attended the following community events throughout the survey engagement period:
• 1/30-1/31, Kickoff at County Center
• 2/27, Commissioner Myers Town Hall, Florida State Fairgrounds
• 2/28, HART Bus Ride Along, Marion Transit Center
• 2/28, Hampton Terrace Neighborhood Association
• 2/29, Plant City NEMP Map Update Open House
• 3/4, Strawberry Festival Luncheon
• 3/5, Commissioner Myers Town Hall, Sumner High School, South Hillsborough County
• 3/6, Tampa Downtown Partnership
• 3/6, HART Bus Ride Along, University Area CDC
• 3/9, Greater Palm River Point CDC
• 3/11-3/22, Zoo Tampa
Access 2050 Hillsborough TPO 15
Figure 3-1 Hillsborough TPO hosts two-day Access2050 Survey Kickoff Event
• 3/11-3/19, Museum of Science and Industry
• 3/13, HART Bus Ride Along, Marion Transit Center
• 3/13, City of Tampa-Green Team
• 3/21, Vanasse Hangen Brustlin, Inc. Offices
• 3/26, Commissioner Myers Town Hall, Progress Village
• 3/27, HART Bus Ride Along, Marion Transit Center
• 3/28, Bike Month University Slow Roll, University Area CDC
• 4/2, Commissioner Myers Town Hall, All People’s Life Center, Tampa
• 4/3, HART Bus Ride Along, Marion Transit Center
• 4/3, Tampa Downtown Partnership
• 4/6, Keystone Civic Association
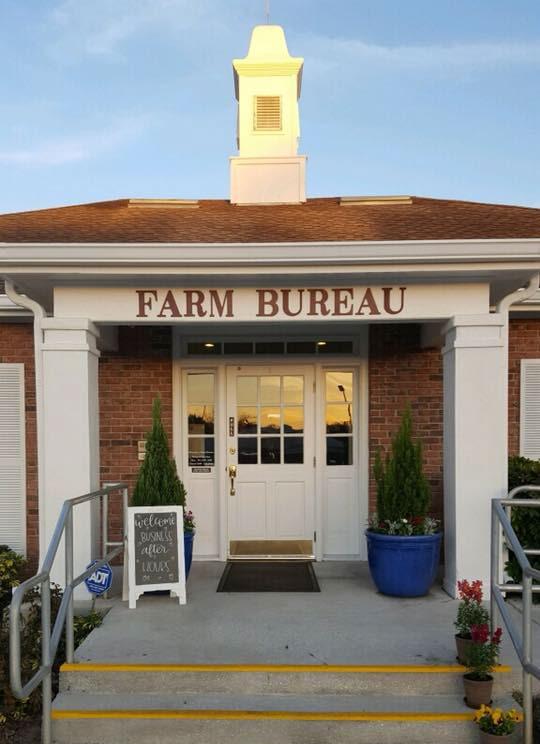
• 4/8, Farm Bureau of Hillsborough County Board Meeting
• 4/11, Plant City Chamber of Commerce
• 4/13, Hillsborough County Parks & Rec-Community Baby Shower, University Area CDC
• 4/13, Enterprising Latinas, Inc. Community Wellness Fair, Wimauma
• 4/19, Hillsborough County Cattlemen’s Association

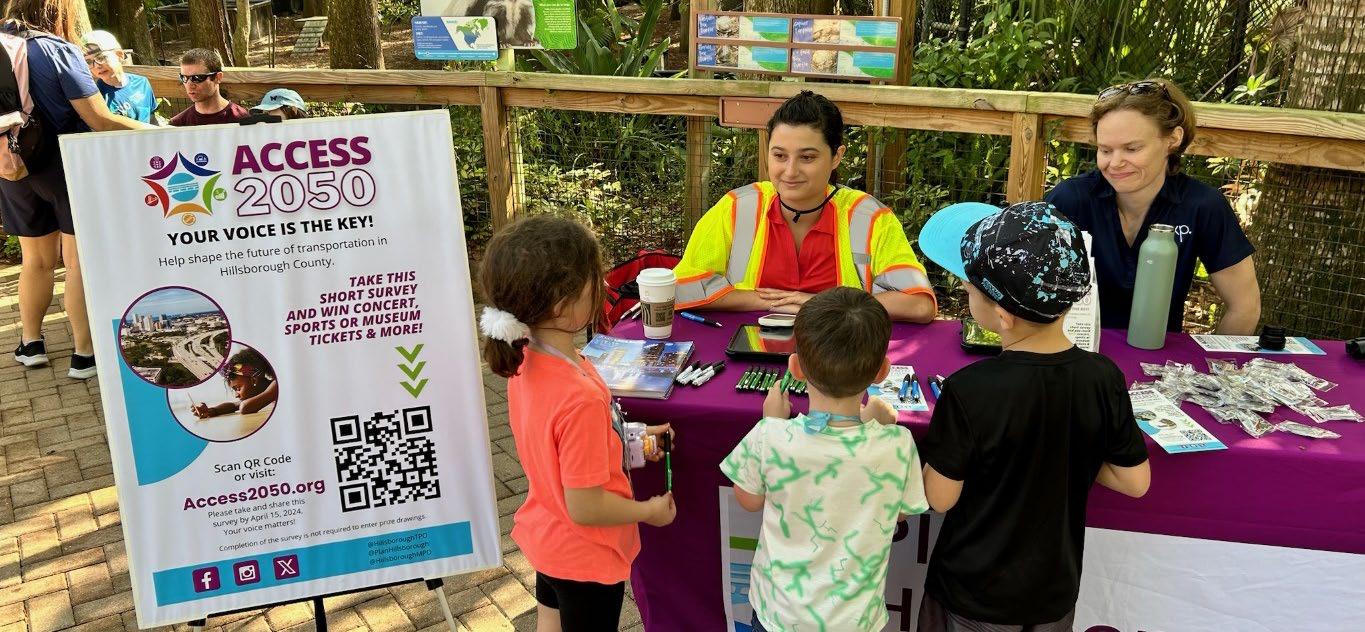
Zoo Tampa Video Series & Outreach Events
During spring break, the team spent two weeks at Zoo Tampa, where they conducted a captivating video series about how transportation affects wildlife in Florida, the Zoo Tampa staff, and Zoo Tampa as a whole. They engaged in insightful interviews with various directors and knowledgeable staff, delving into the impact of Access 2050 on our panthers, manatees, black bears, wildlife corridors, and HART transit systems. Additionally, they conducted extensive outreach at the zoo each day for a total of 10 days during Spring Break, providing safety materials and rack cards, connecting with thousands of individuals of all ages and backgrounds, with a particular focus on seniors, youth, and families.
Access 2050 Hillsborough TPO 16
3.3 Community Conversations
EXP prepared materials for Hillsborough TPO staff to attend community conversations and present at stakeholder meetings, such as chamber meetings, Tampa Homeowners Association of Neighborhoods (THAN), and other community groups as requested, to encourage the community to take the survey and get involved in Access 2050. These events were more formal meetings and often included a formal presentation from Hillsborough TPO staff about Access 2050. This allowed staff to get direct feedback from specific community groups and disseminate information directly to groups with an interest in the LRTP process. During these meetings and presentations, staff asked groups to encourage their members to participate in the survey and share it with the community.
Hillsborough TPO staff facilitated and attended the following community conversations and presentations:
• 2/7, Westshore Alliance Master Plan Committee
• 2/23, Transportation Disadvantaged Coordinating Board (TPO Committee)
• 2/28, Bicycle Pedestrian Advisory Committee (BPAC)
• 3/6, Westshore Alliance Transportation Committee
• 3/12, Westchase Government Affairs Committee
• 4/9, Tampa Downtown Partnership Transportation Committee
• 3/23, National Federation of the Blind of Florida, Tampa Chapter
• 3/25, Armory Gardens Civic Association
• 3/26, Tampa Preservation Group
• 3/27, Sun City Center Community Meeting
• 4/4, Carver City/Lincoln Gardens Civic Association
To encourage survey responses from a variety of demographic groups and geographic locations, Hillsborough TPO, Atkins, and EXP staff members attended community events, participated in community meetings, and gave presentations around Hillsborough County.
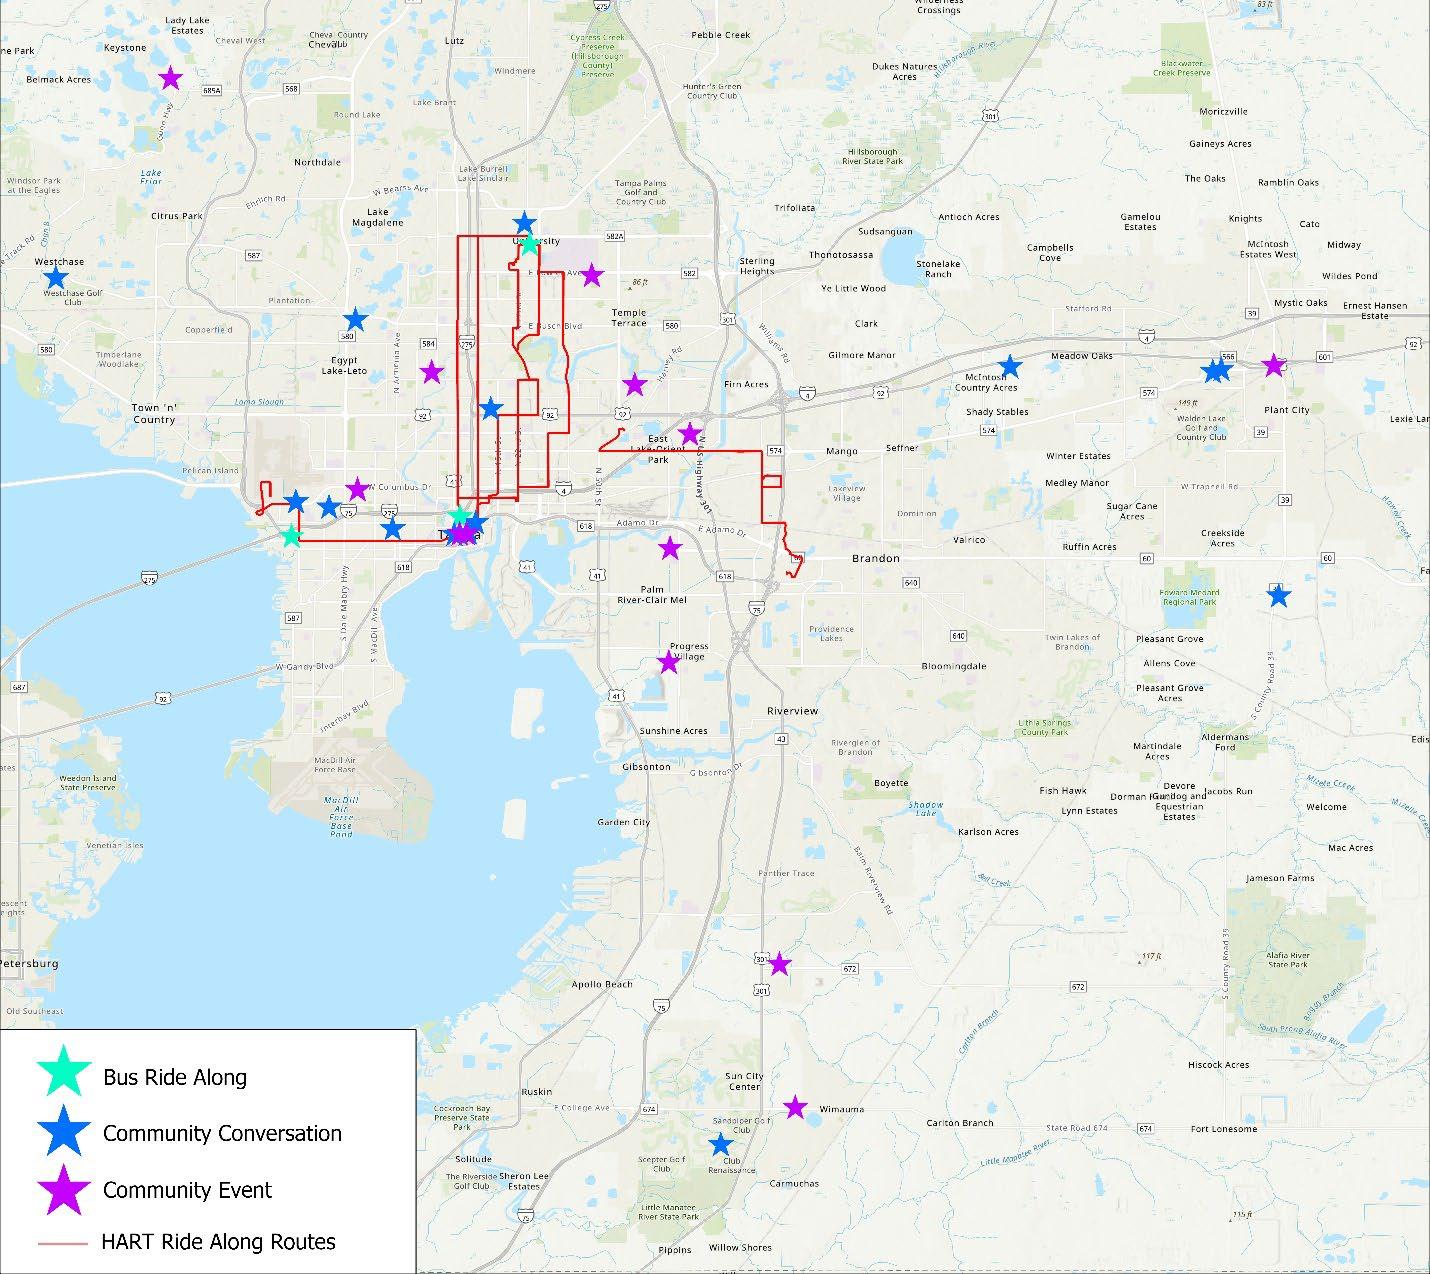
These events are discussed in detail in Sections 3.2 and 3.3. A map of these events is shown in Figure 3-1.
Access 2050 Hillsborough TPO 17
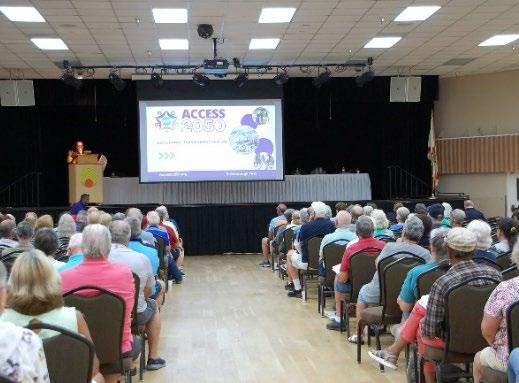
Figure 3-2 TPO Staff Presentation at Sun City Center Community Meeting

Hillsborough County Agricultural Partnerships
The team forged strong partnerships with key agricultural organizations, including the Hillsborough County Farm Bureau, the Hillsborough Cattleman’s Association, and the Hillsborough County Extension Office. Together, they conducted numerous presentations targeting local farmers, ranchers, and stakeholders across the county. Additionally, these stakeholders amplified the survey outreach by disseminating information through their extensive email networks, effectively reaching hundreds of typically hard-to -access individuals.
Access 2050 Hillsborough TPO 18
Figure 3-3 Map of Community Outreach Events
In addition to the organizations listed above, the team reached out to all the organizations listed in Appendix A. These organizations were first contacted by email. If no response was received, they were contacted two more times by email. If no response was received to the emails, two phone calls were made to attempt to contact the person or organization. Overall, a total of 5 attempts were made to contact each organization or partner. Also, several organizations responded that they did not have an opportunity for a presentation or a community event, but they were able to disseminate information and links to the online survey
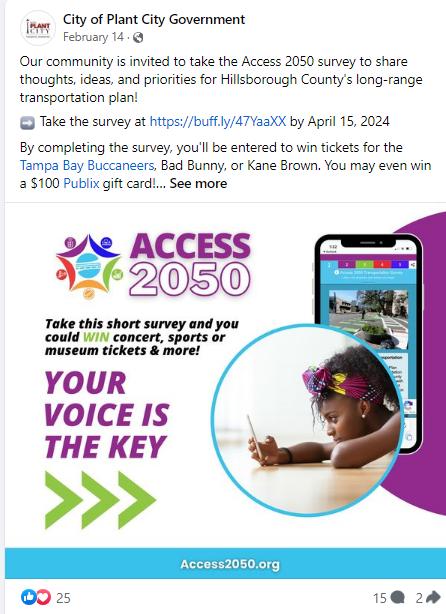
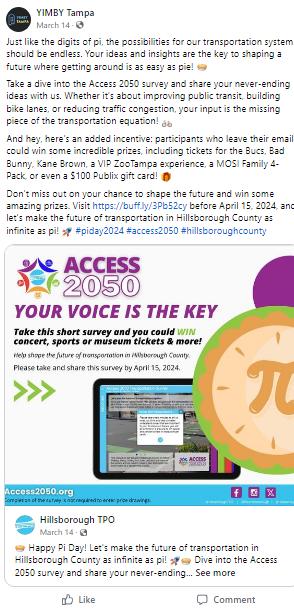
In addition to partners that participated in community events and presentations, the following organizations disseminated information about Access 2050 to their email blast list, included the information in a newsletter, and/or posted on social media utilizing the Partner Promotional Toolkit.
Hillsborough County
Seminole Tribe of Florida-Tribal Community Development
YIMBY Tampa
Tampa International Airport
University of South Florida
Florida Department of Health Centers
Hillsborough County Public Works
City of Plant City
City of Temple Terrace

City of Tampa
Progress Village Civic Council
Commissioner Myers’ Newsletter
Tampa Bay PIO Network
Bike/Walk Tampa
Sidewalk Stomper
Visit Tampa Bay
MacDill Air Force Base
Hillsborough County Public Schools


Access 2050 Hillsborough TPO 19
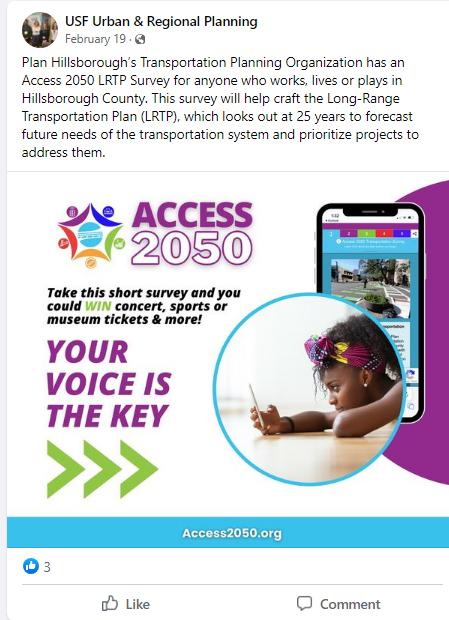
Figure 3-4 Access 2050 Social Media Posts from Local Partners
DELIVERY METHODS
4
4 Delivery Methods
A variety of delivery methods were used to reach and engage with multiple audiences. These opportunities for public feedback complied with requirements set forth in Title VI of the Civil Rights Act of 1964 and the Americans with Disability Act (ADA) Because 12.8% of the Hillsborough County population had Limited English Proficiency (LEP) and 29.6% of the population identified as Hispanic, the team developed collaterals, including the website, survey, posters, and social media posts in both English and Spanish. Other languages were available upon request.
The team created collateral packages for each public outreach event to ensure that public engagement initiatives stayed on track.
These delivery methods included:
Access 2050 Website
Email blasts
News releases
Media relations
TV/Radio
Social media campaigns
Targeted Facebook ads
News ads
Flyers
Rack cards
Oversized display boards
Partner marketing resources
Airport Wi-Fi login page
The team created graphics and content for email blasts, news releases, social media posts, targeted Facebook ads, and any partner marketing resources such as newsletters for elected officials. Tampa International Airport included the link to take the survey on their Wi-Fi login page, exposing countless travelers to the Access 2050 survey. The team created content to pitch news stories to local media partners and coordinate TV/Radio shows to continue to spread the word about public participation opportunities. In addition, the team developed flyers, rack cards, oversized maps and display boards, and other graphic needs for engagement activities as needed. Hillsborough TPO staff purchased all targeted social media and news ads, as well as participation prizes or incentives. In addition, the team put together a marketing package for partners and media to easily disseminate and share information about Access 2050.
Access 2050 Hillsborough TPO 21
Figure 4-1 TPO Staff at Tampa Heights Junior Civic Association Sunday Dinner
4.1 Branding and Website Development


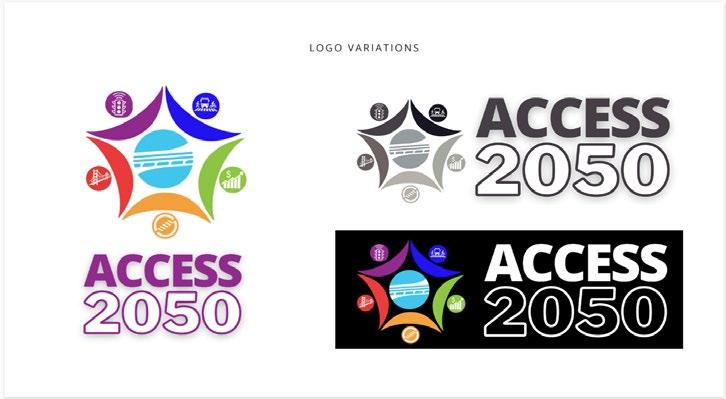
Prior to public engagement, the team created a logo and branding guide for the Access 2050 Long Range Transportation Plan to create a distinct, easily recognizable identity for this project that would reach more residents and stakeholders. This consisted of a slogan, logo, color design, graphics for the website, social media posts, and email blasts using the Hillsborough TPO branding guidelines and best practices. The logo had 5 colors, 5 people, and 5 icons representing the 5 areas of Access 2050 including resiliency, choices, safety, smart cities, and economic development. The 5 people surrounding the Hillsborough TPO logo focus on connecting people with access to opportunity. The complete branding guide and all logo options can be found in Appendix B.
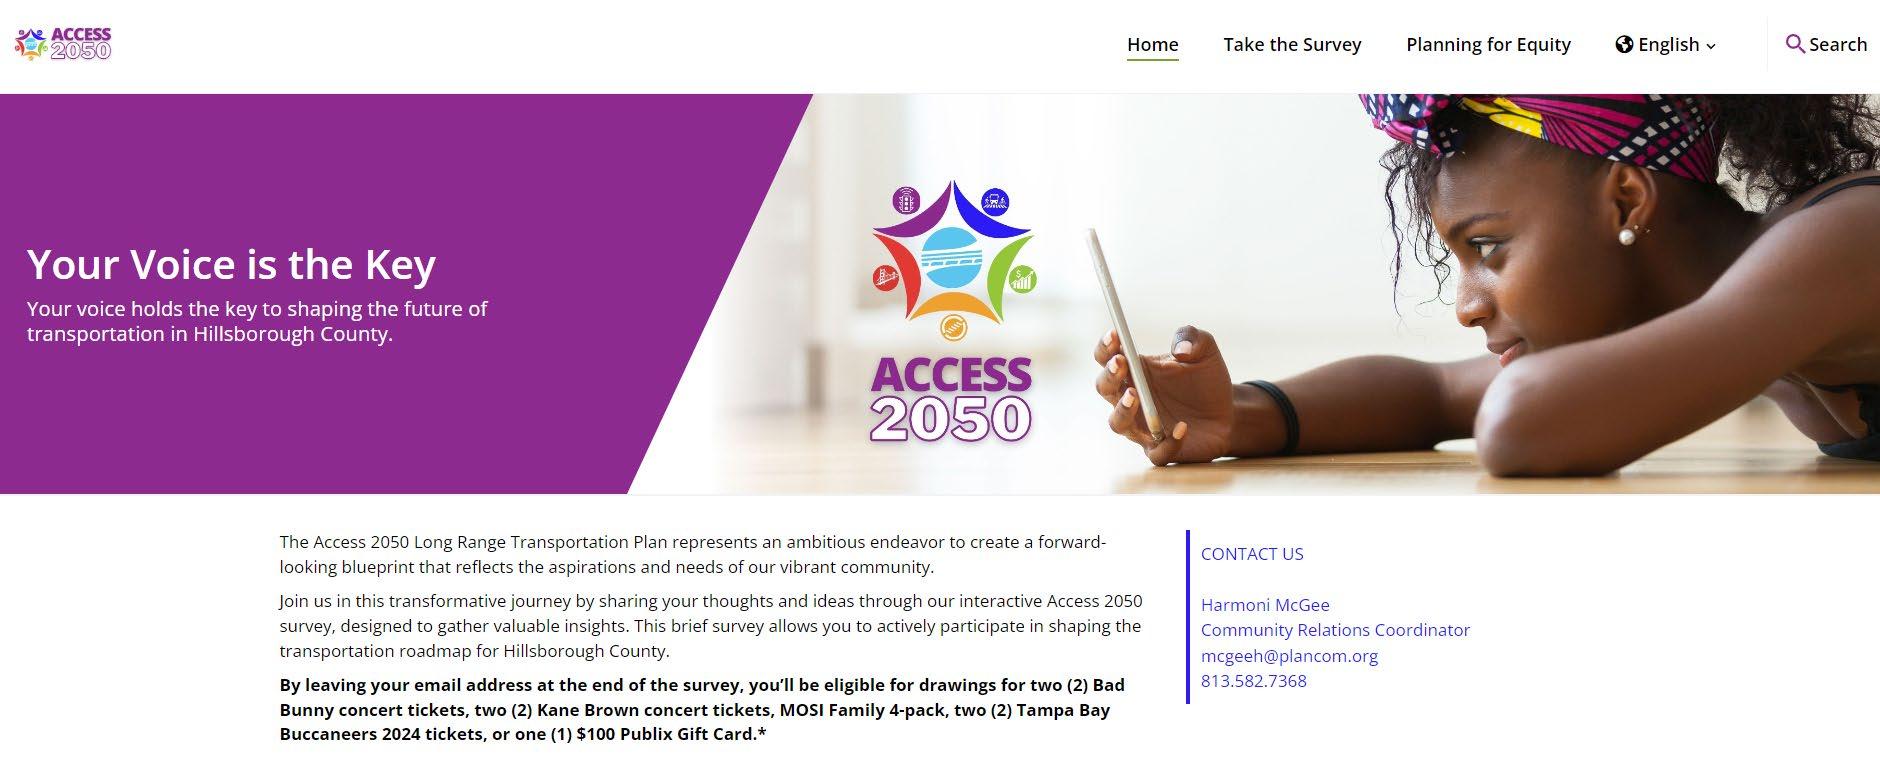
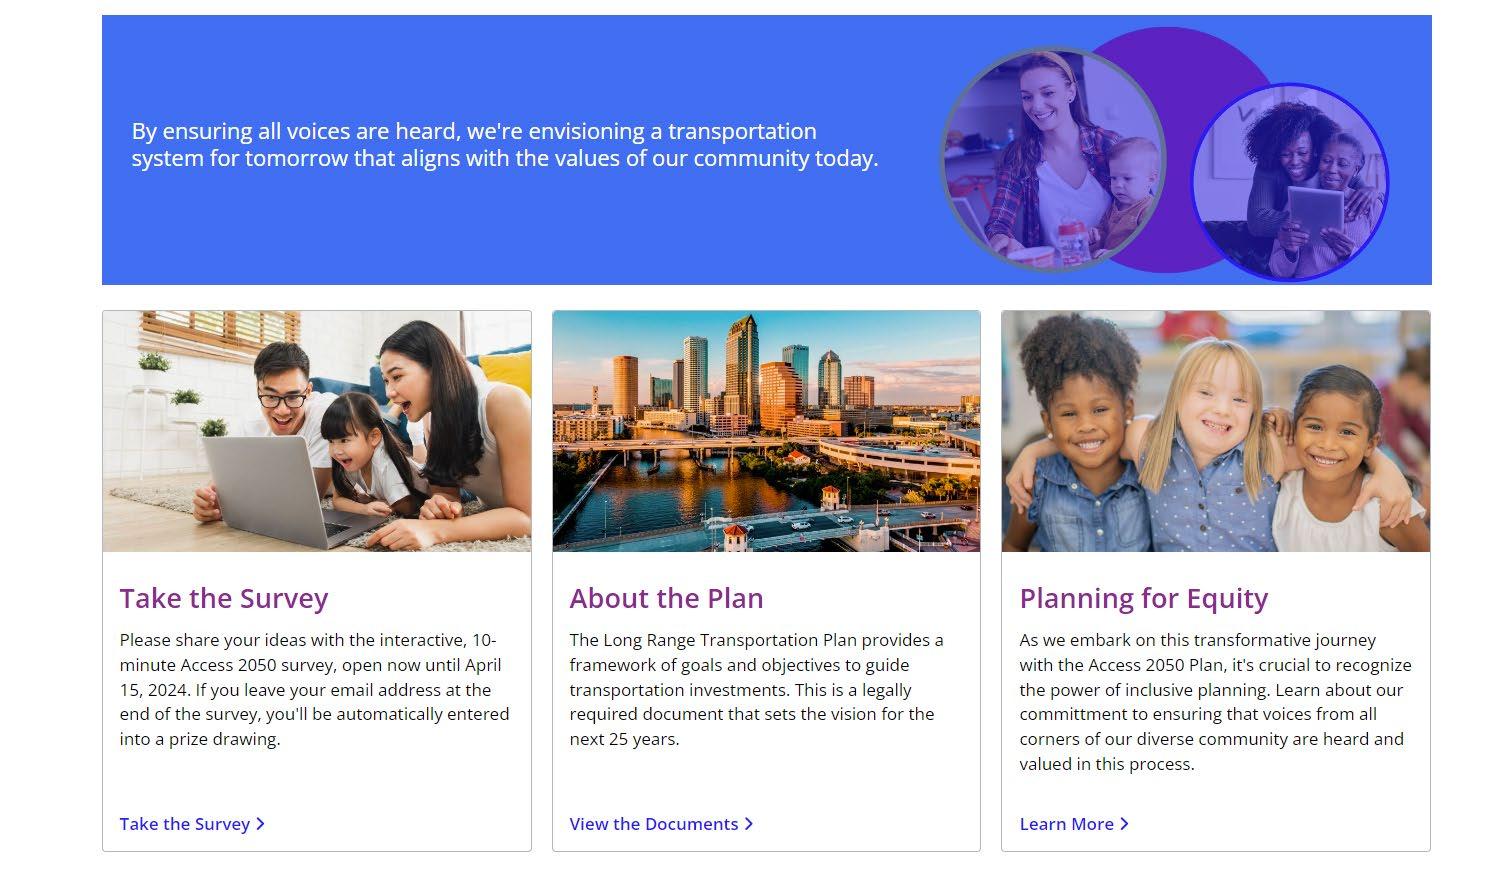
Furthermore, the team established a tailored website leveraging the Social Pinpoint platform, seamlessly integrating the MetroQuest survey within its framework. Designed with user-friendliness in mind, the website served as a comprehensive resource hub, providing the public and stakeholders with convenient access to essential updates regarding the Access 2050 Long Range Transportation Plan. This intuitive platform ensured that information pertinent to the plan's progress was readily available, catering to the diverse needs and preferences of its audience.

Access 2050 Hillsborough TPO 22
Figure 4-3 Screenshot of Access 2050 Website
Figure 4-2 Access 2050 Branding Guide and Logo

4.2 Email Blasts
Throughout the outreach period, five email blasts were sent out with information about Access 2050. Email blasts went out to municipalities, partner agencies, HOAs, neighborhood associations, and all interested residents who provided their contact information. Table 4-1 shows the number of emails sent in each campaign, their open rates, and click rates.
Access 2050 Hillsborough TPO 23
Figure 4-4 Screenshot of Access 2050 Website
Press Release 2/8/2024 Survey 2/17/2024 HOA 3/5/2024 Survey Video 3/5/2024 Final 4/1/2024 Sent 93 20609 1461 20657 17526 Open rate 27.5% 42.3% 37.9% 39.4% 37.2% Click rate 2.5% 5.8% 0.9% 2.9% 2.8%
Table 4-1 Access 2050 Email Blast Data
4.3 Media Reach
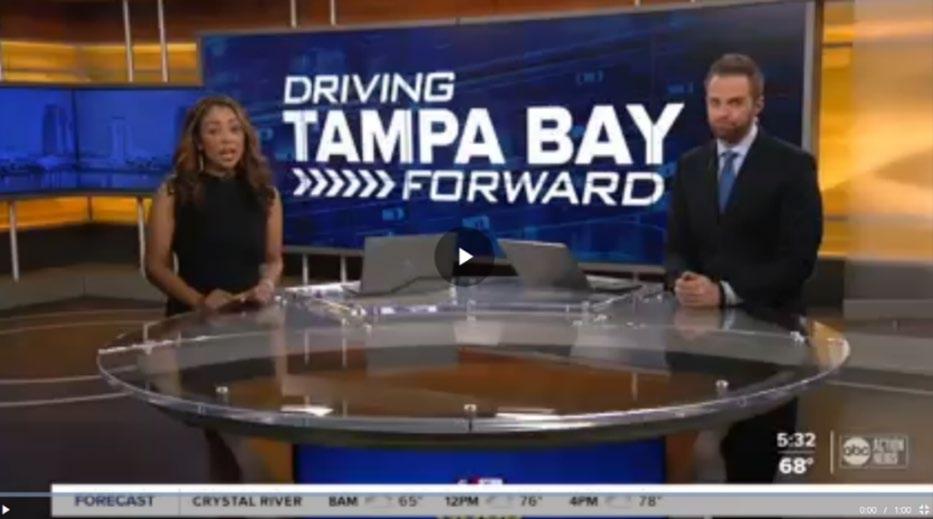
Media coverage for Access 2050 was widespread, reaching a local TV audience of 62,517 viewers. The value of the local TV publicity was $11,804, representing significant savings in advertising costs to spread the word about the survey. Moreover, online and print media reached an audience of 605,421 viewers, realizing $13,602 in advertising cost savings. Thirteen media coverage clips were collected in the Critical Mention report, which can be found in Appendix C Figures 4-5, 4-6, 4-7, and 4-8 show screenshots of media coverage from various outlets.


Access 2050 Hillsborough TPO 24
Figure 4-5 ABC Action News Covering Access 2050


Access 2050 Hillsborough TPO 25
Figure 4-6 Tampa Bay Business Journal Coverage of Access 2050
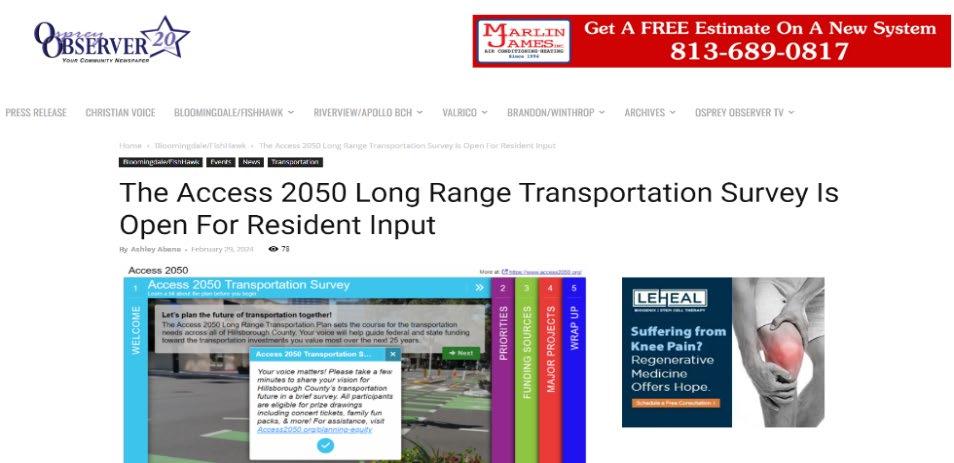
Figure 4-7 Osprey Observer Coverage of Access 2050
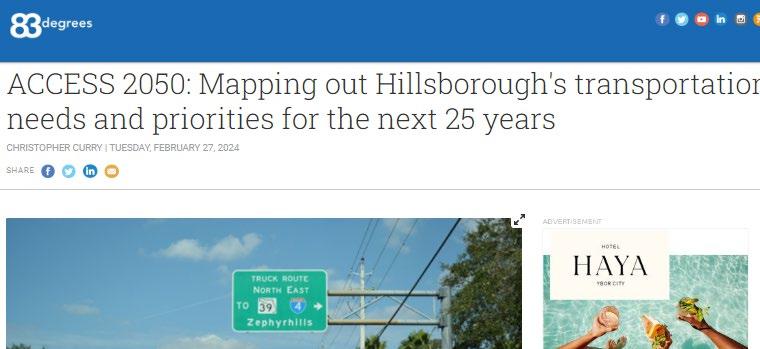
Figure 4-8 83 Degrees Media Coverage of Access 2050
4.4
Social Media Campaign and Targeted Advertising
Employing a strategic approach, the team orchestrated a dynamic social media initiative comprising targeted advertisements and supplementary digital marketing collateral. This multifaceted campaign actively engaged audiences by prompting them to voice their perspectives on the future of transportation in Hillsborough County. Under the unified banner of #Access2050, the campaign effectively amplified the visibility of the survey.
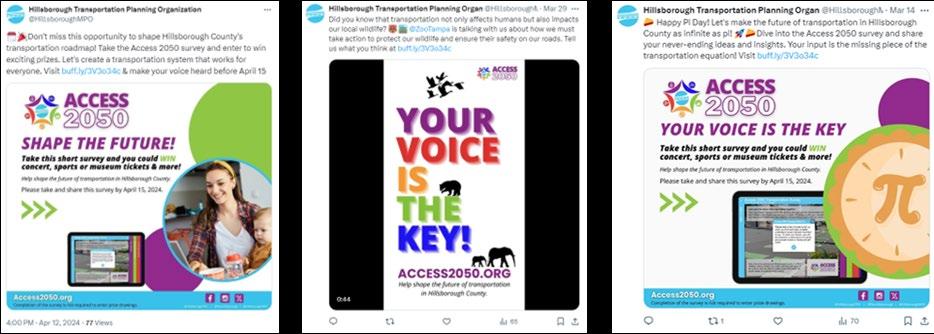
Harnessing the expansive reach of digital platforms, the team disseminated this campaign across multiple channels, including the Hillsborough Transportation Planning Organization's (TPO) Facebook page, X (formerly Twitter), Instagram, LinkedIn, and YouTube. Additionally, distribution extended to the online presence of Plan Hillsborough and Vision Zero, ensuring comprehensive coverage across various digital landscapes.
Through strategic coordination, each platform served as a conduit for the campaign's messaging, inviting audiences to share their insights on the future of transportation while promoting the #Access2050 survey. This concerted effort aimed to foster widespread participation and dialogue surrounding the Access 2050 Long Range Transportation Plan, reinforcing a collective commitment to shaping the region's transportation future.
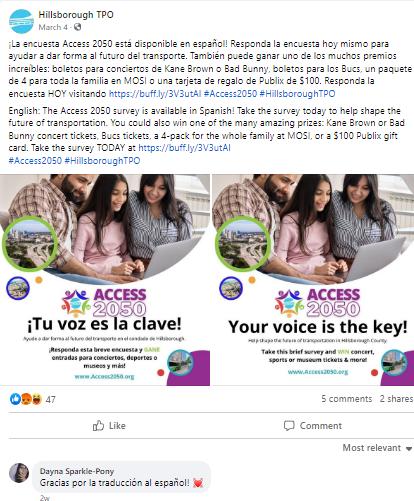
Moreover, the team curated bilingual social media content in both English and Spanish, meticulously crafted with a variety of visual elements including graphics, photographs, and videos. This diverse array of media assets was tactically employed to resonate with various demographics and communities across the local landscape, ensuring broad-reaching engagement and inclusivity. Figures 4-9, 4-10, and 4-11 show screenshots of posts made on various platforms.
Access 2050 Hillsborough TPO 26
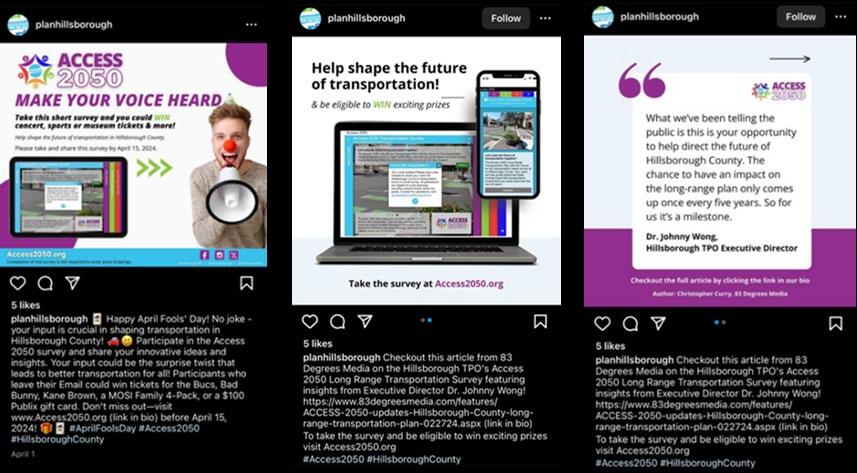
Figure 4-9 Access 2050 Instagram Posts
Acknowledging the inherent complexities of navigating social media's reach limitations, the team adopted a proactive approach, relying on meticulous data analytics to drive their engagement strategy. This entailed not only monitoring the performance of their content but also delving into audience insights to understand the diverse demographics and geographic nuances that characterized their target population.
As the campaign unfolded, the team remained agile and adaptable, consistently refining their approach to better resonate with their audience and address emerging needs. This adaptability was not merely a matter of tweaking content but involved a deeper understanding of shifting trends, audience preferences, and areas of underrepresentation.
As the team identified specific demographics and geographic regions that were not adequately reached by their initial efforts, they pivoted their strategy, leveraging targeted advertisements and tailored messaging to bridge these gaps and foster meaningful engagement.
Access 2050 Hillsborough TPO 27
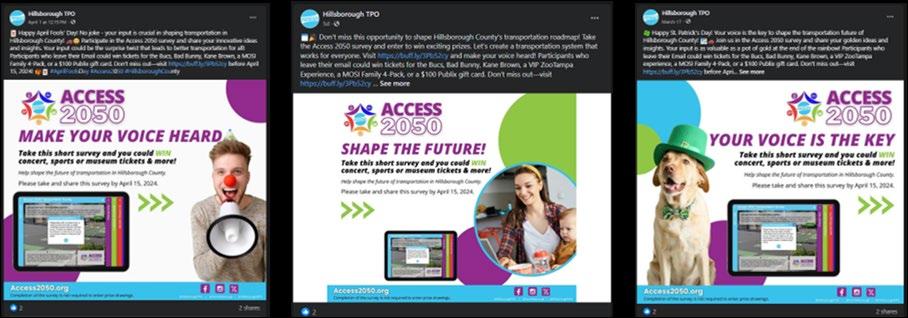
Figure 4-10 Plan Hillsborough Facebook Posts
Figure 4-11 Plan Hillsborough X (Twitter) Posts


By constantly refining their approach based on realtime data and feedback, the team ensured that their social media campaign remained not just relevant but impactful.
Employing Meta's targeted advertising capabilities, three distinct ads were strategically deployed to engage specific audiences.
The inaugural ad, titled "Let’s build an accessible tomorrow, today!...", reached 1,515 viewers and garnered 1,700 impressions during its display period from 3/18/2024 through 3/25/2024.
Targeting Spanish-speaking individuals, the second ad, "¡La encuesta Access 2050 está disponible en...", reached 1,235 viewers, with 1,351 impressions during its campaign from 4/3/2024 through 4/10/2024.
Finally, the third ad promoted the University Area Slow Roll event, reaching 758 viewers and accumulating 1,014 impressions during its showcase from 3/18/2024 through 3/27/2024.
These targeted advertisements were carefully crafted to ensure no voice went unheard, as evidenced by the comprehensive data analytics and strategic deployment across diverse demographics and communities. The team’s commitment to amplifying the voices of all stakeholders underscored every decision and action taken, making their campaign a testament to the power of inclusivity in digital engagement.
An example of these advertisements can be found in Figure 4-12. The full data analytics report can be found in Appendix D.

Access 2050 Hillsborough TPO 28
Figure 4-12 Targeted Social Media Advertisement
4.5 Rack Cards, Posters, and Banners
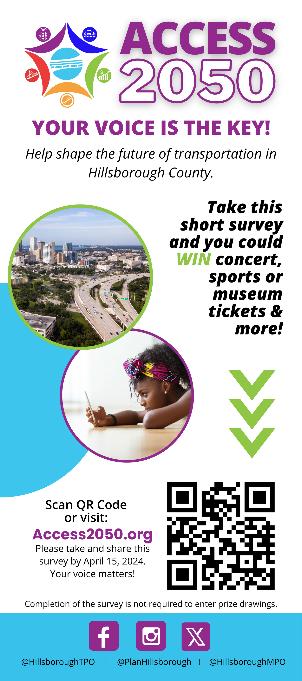
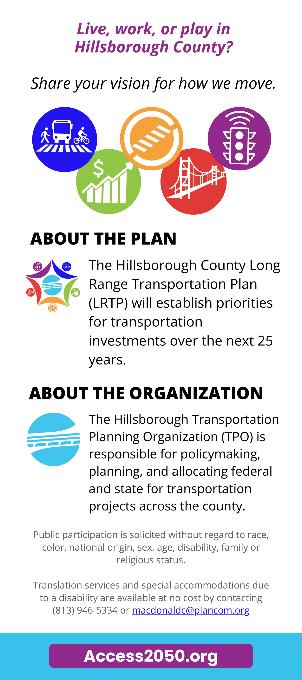
The team crafted user-friendly rack cards containing educational materials aimed at informing the public about the survey's significance and various avenues for involvement. Moreover, large posters and banners, featuring QR codes for swift access, were printed to facilitate engagement for attendees at events. These tangible resources served as effective tools to disseminate information and encourage active participation in shaping the future of transportation. Figure 4-13 shows the rack card, poster, and banner developed for Access 2050.

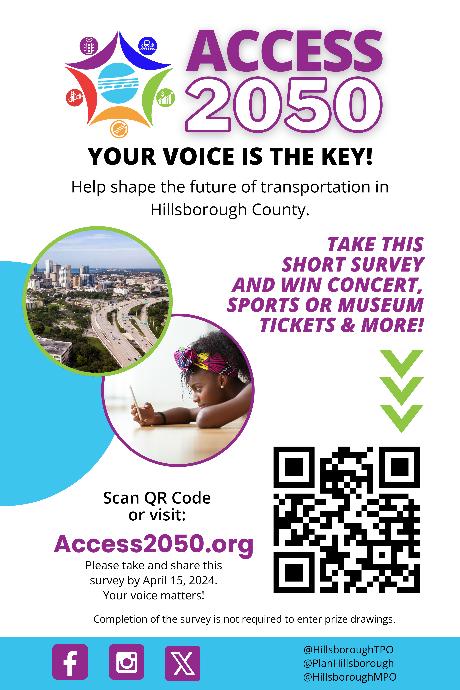


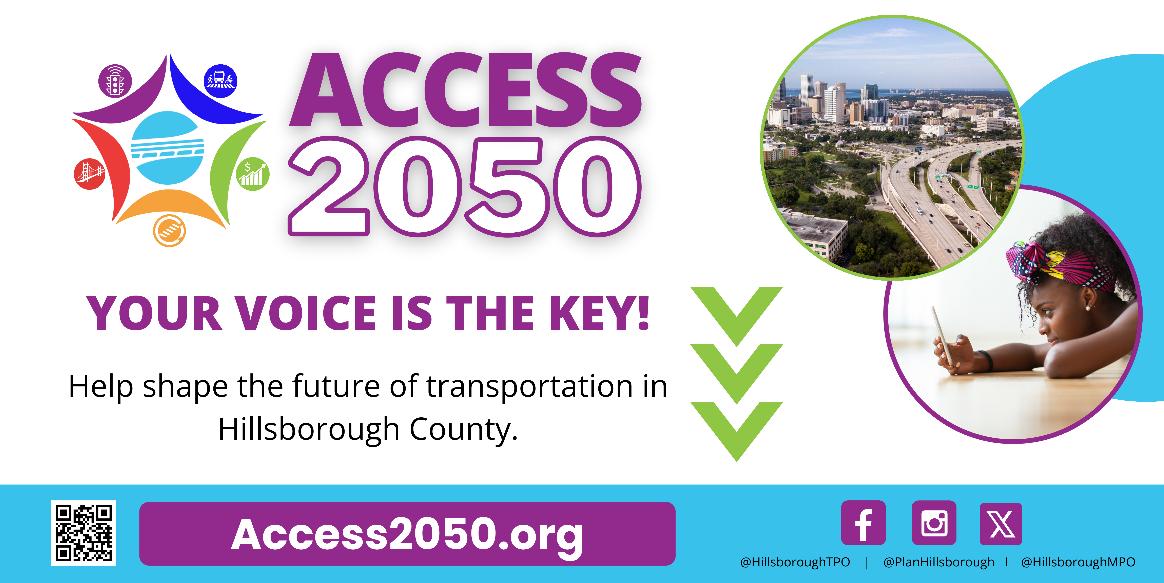
Access 2050 Hillsborough TPO 29
Figure 4-13 Access 2050 Rack Cards, Posters, and Banners
4.6 Videos and Promotional Materials
Incorporating videos into a comprehensive outreach strategy is paramount for several reasons. Firstly, videos have a unique ability to capture attention and convey complex information in a visually compelling and easily digestible format. This makes them particularly effective in engaging diverse audiences, including those with varying levels of literacy or language proficiency. Moreover, videos have a higher likelihood of being shared on social media platforms, thus extending the reach of the message to a wider audience. Additionally, videos offer a dynamic medium for storytelling, allowing organizations to evoke emotions, spark curiosity, and inspire action in ways that traditional text-based content may not achieve. By harnessing the power of visuals, sound, and narrative, videos can create lasting impressions and foster deeper connections with the audience, ultimately enhancing the effectiveness of the outreach efforts.
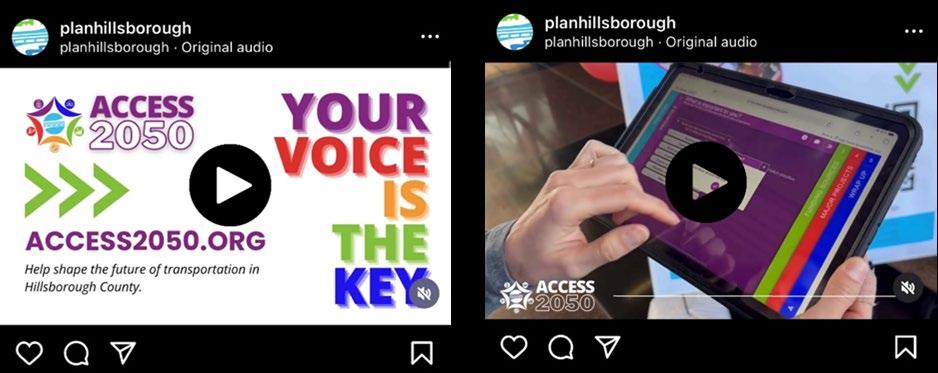
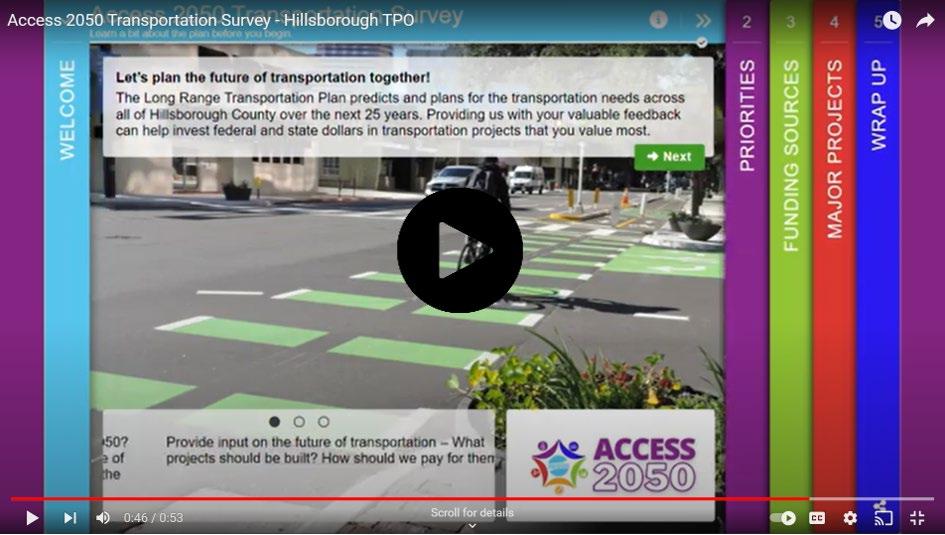
An informative instructional video was produced, featuring the Hillsborough TPO Director, guiding participants through the survey process with ease and clarity. This effort launched a comprehensive video campaign to bolster awareness and engagement with Access 2050. This included the creation of two compelling promotional videos, strategically crafted to elucidate the significance of participating in the survey and amplifying individual voices.
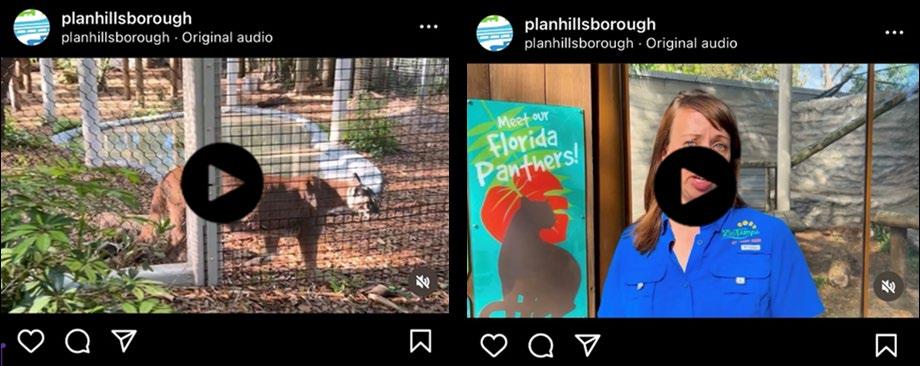
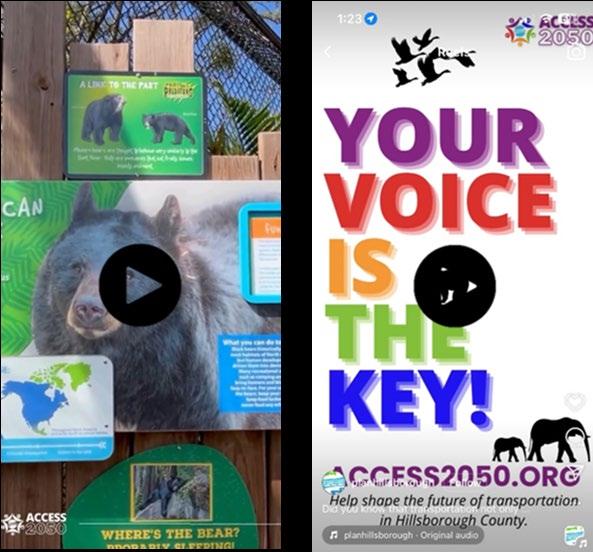
In an innovative partnership with Zoo Tampa, the team embarked on a captivating video series delving into the intricate relationship between transportation and wildlife in Florida. These videos shed light on vital topics such as wildlife corridors and the indispensable role of transit in facilitating both human mobility and environmental conservation efforts. Through visual storytelling, this collaborative endeavor not only raised awareness but also fostered a deeper appreciation for the interconnectedness of transportation and Zoo Tampa. Screenshots of each video can be seen in Figures 4-14 through 4-19.
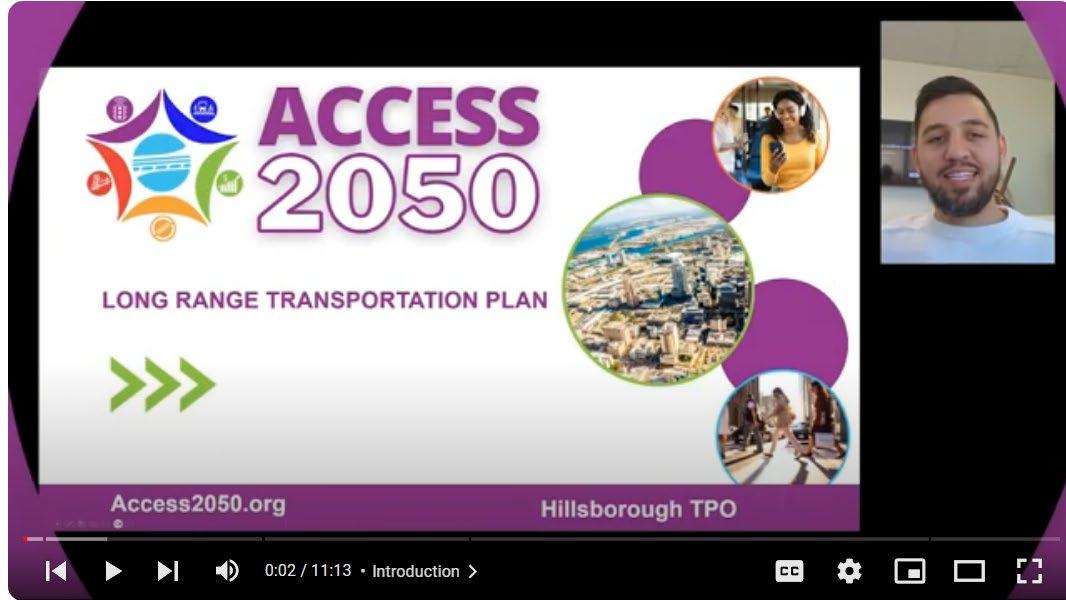

Access 2050 Hillsborough TPO 30
Figure 4-14 How to Take the Access 2050 Survey Video

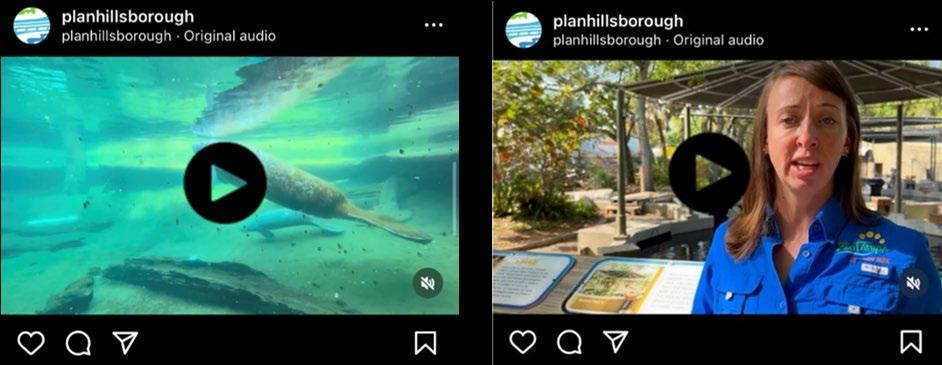


Access 2050 Hillsborough TPO 31
Figure 4-15 Zoo Tampa Outreach Event Video Series - How Transportation Affects Manatees
Figure 4-16 Zoo Tampa Outreach Event Video Series - How Transportation Affects Panthers
Figure 4-17 Zoo Tampa Outreach Event Video Series - How Transportation Affects Black Bears


Access 2050 Hillsborough TPO 32
Figure 4-18 ACCESS 2050 Survey Promo Video 1 - Your Voice is The Key
Figure 4-19 ACCESS 2050 Survey Promo Video 2 - Your Voice is The Key
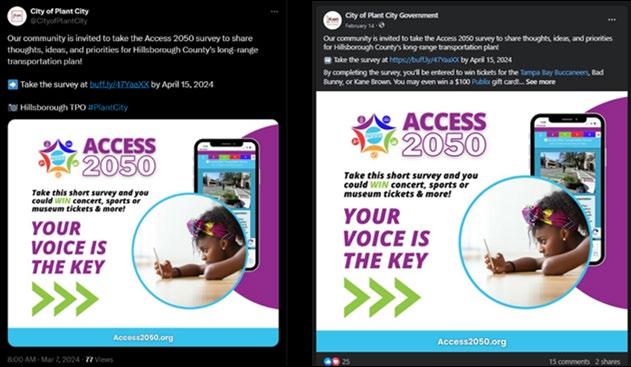
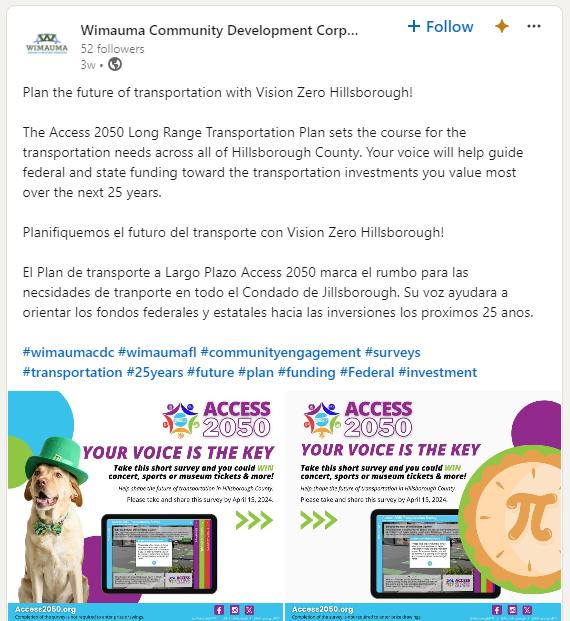
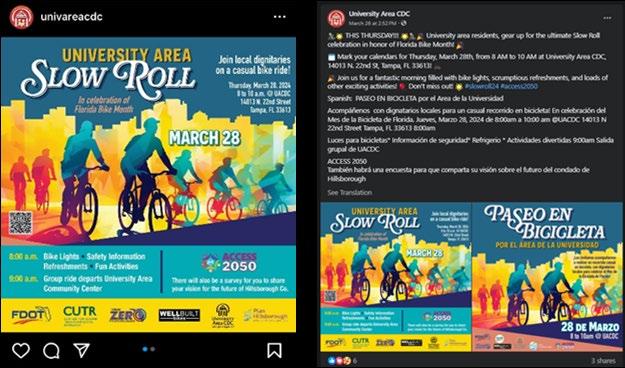
4.7 Partner Promotional Toolkit
In crafting a comprehensive outreach strategy, the team developed a Partner Promotional Toolkit designed to empower partners and stakeholders in amplifying the campaign's message. This toolkit comprised a diverse array of promotional materials curated to facilitate seamless dissemination of information. From captivating social media graphics and suggested content to engaging promotional videos, graphic banners, newsletter assets, and informative rack cards, every element was thoughtfully crafted to resonate with the target audience and inspire action.
Furthermore, recognizing the invaluable role of partnerships in maximizing outreach, the team prioritized collaboration with key stakeholders. By equipping partners with tailored resources and facilitating seamless communication channels, the campaign leveraged the collective influence and networks of these collaborators. Through coordinated efforts and mutual support, partners played a pivotal role in extending the campaign's reach, fostering community engagement, and amplifying its impact. This collaborative approach not only ensured broader dissemination of information but also fostered a sense of ownership and investment among stakeholders, resulting in a more robust and effective campaign overall. Partner social media posts can be seen in Figures 4-20 through 4-23

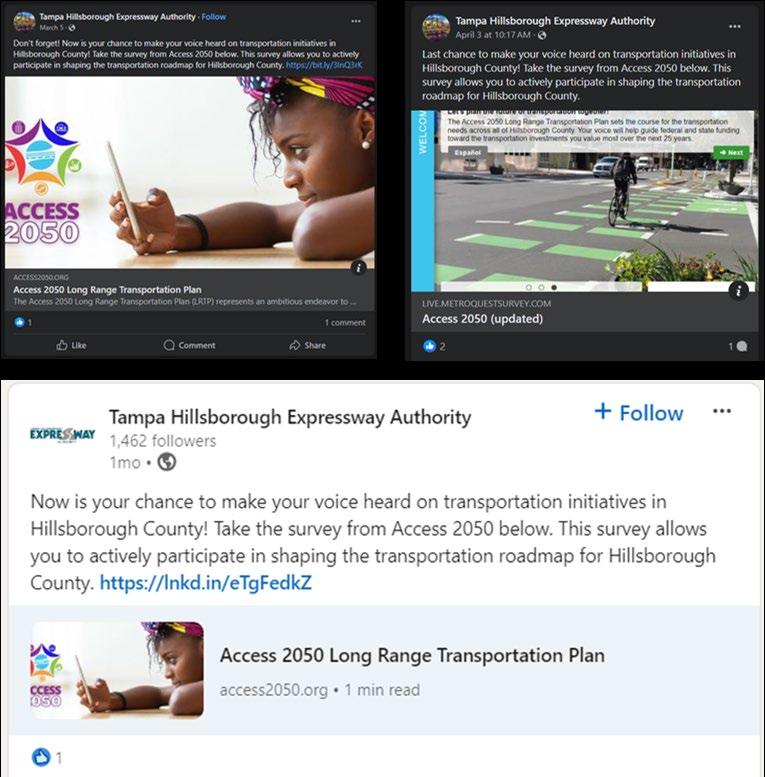
Access 2050 Hillsborough TPO 33
Figure 4-20 Partner Promotional THEA - ACCESS 2050 Survey


Access 2050 Hillsborough TPO 34
Figure 4-21 Partner Promotional City of Plant City - ACCESS 2050 Survey
Figure 4-22 Partner Promotional Wimauma CDC - ACCESS 2050 Survey

4.8 Staff Outreach Toolkit
In fostering a cohesive and impactful outreach effort, the team devised a comprehensive Staff Outreach Toolkit tailored for Hillsborough TPO personnel. This toolkit served as a versatile resource kit, equipping staff members with the necessary tools and guidance to effectively disseminate information and maintain consistency in messaging. Included within were dynamic PowerPoint slides, informative rack cards, fact sheets, QR codes for easy access to digital resources, and thoughtfully curated giveaways. Moreover, recognizing the importance of preparedness and cohesion, the team provided ongoing training and mentorship to ensure that all team members were well-versed in delivering the Access 2050 message with uniformity and clarity. To streamline coordination and maximize efficiency, an interactive scheduling tool was developed, facilitating seamless assignment of roles and responsibilities for presentations and events across the community. Through this concerted effort, the team fostered a culture of alignment and empowerment among staff members, enabling them to effectively champion the campaign's objectives and engage with stakeholders.
Access 2050 Hillsborough TPO 35
Figure 4-24 TPO Staff at Wimauma Community Event with Enterprising Latinas
Figure 4-23 Partner Promotional University Area CDC - Slow Roll Access 2050
EQUITY CONSIDERATIONS
5
5 Equity Considerations
In its pursuit of inclusive engagement, the Hillsborough TPO committed to proactively targeting demographic groups and geographic regions within Hillsborough County that are traditionally underserved by conventional public outreach methods. These communities often face challenges such as limited transportation options, restricted access to digital platforms, or a perceived lack of influence in decision-making processes. To address these challenges, innovative outreach approaches were employed during public engagement efforts, specifically tailored to engage with these hard-to -reach demographics and areas. Moreover, recognizing the power of partnerships in amplifying outreach efforts, the TPO collaborated with a network of partner organizations spanning various geographic regions and demographic groups. These partners played a pivotal role in disseminating information about Access 2050, highlighting the importance of public input, and legitimizing the engagement process for targeted communities. Through these concerted efforts, the TPO endeavored to ensure that all voices within Hillsborough County were heard and valued in shaping the future of transportation planning.
5.1 Outreach for Targeted Geographic Areas
The Hillsborough TPO meticulously identified geographic areas within Hillsborough County that have historically been marginalized or overlooked in local government and planning initiatives, warranting targeted outreach efforts. By closely examining these areas, the TPO can strategically partner with location-specific organizations possessing deep -rooted connections within their respective communities. These partnerships extend to community centers, religious institutions, and educational establishments, leveraging their established rapport to amplify outreach efforts. Such collaborations not only enhance the reach of outreach methods to underserved geographic regions and demographic populations but also serve to validate the public engagement process for residents who may harbor skepticism about the value of their input in decisionmaking processes.
5.1.1

Description and List of Transportation Disadvantaged Target Areas
The Hillsborough TPO has identified 13 Transportation Disadvantaged Target Areas (TDTAs). These communities have been identified because they have been underrepresented in the transportation planning process, underserved by transportation investments, or have been disproportionately impacted by transportation projects. The 13 TDTAs identified meet Environmental Justice (EJ) Area criteria enacted by Executive Order 12898. Some boundaries were altered based on updated data and staff knowledge of the areas.
Access 2050 Hillsborough TPO 37
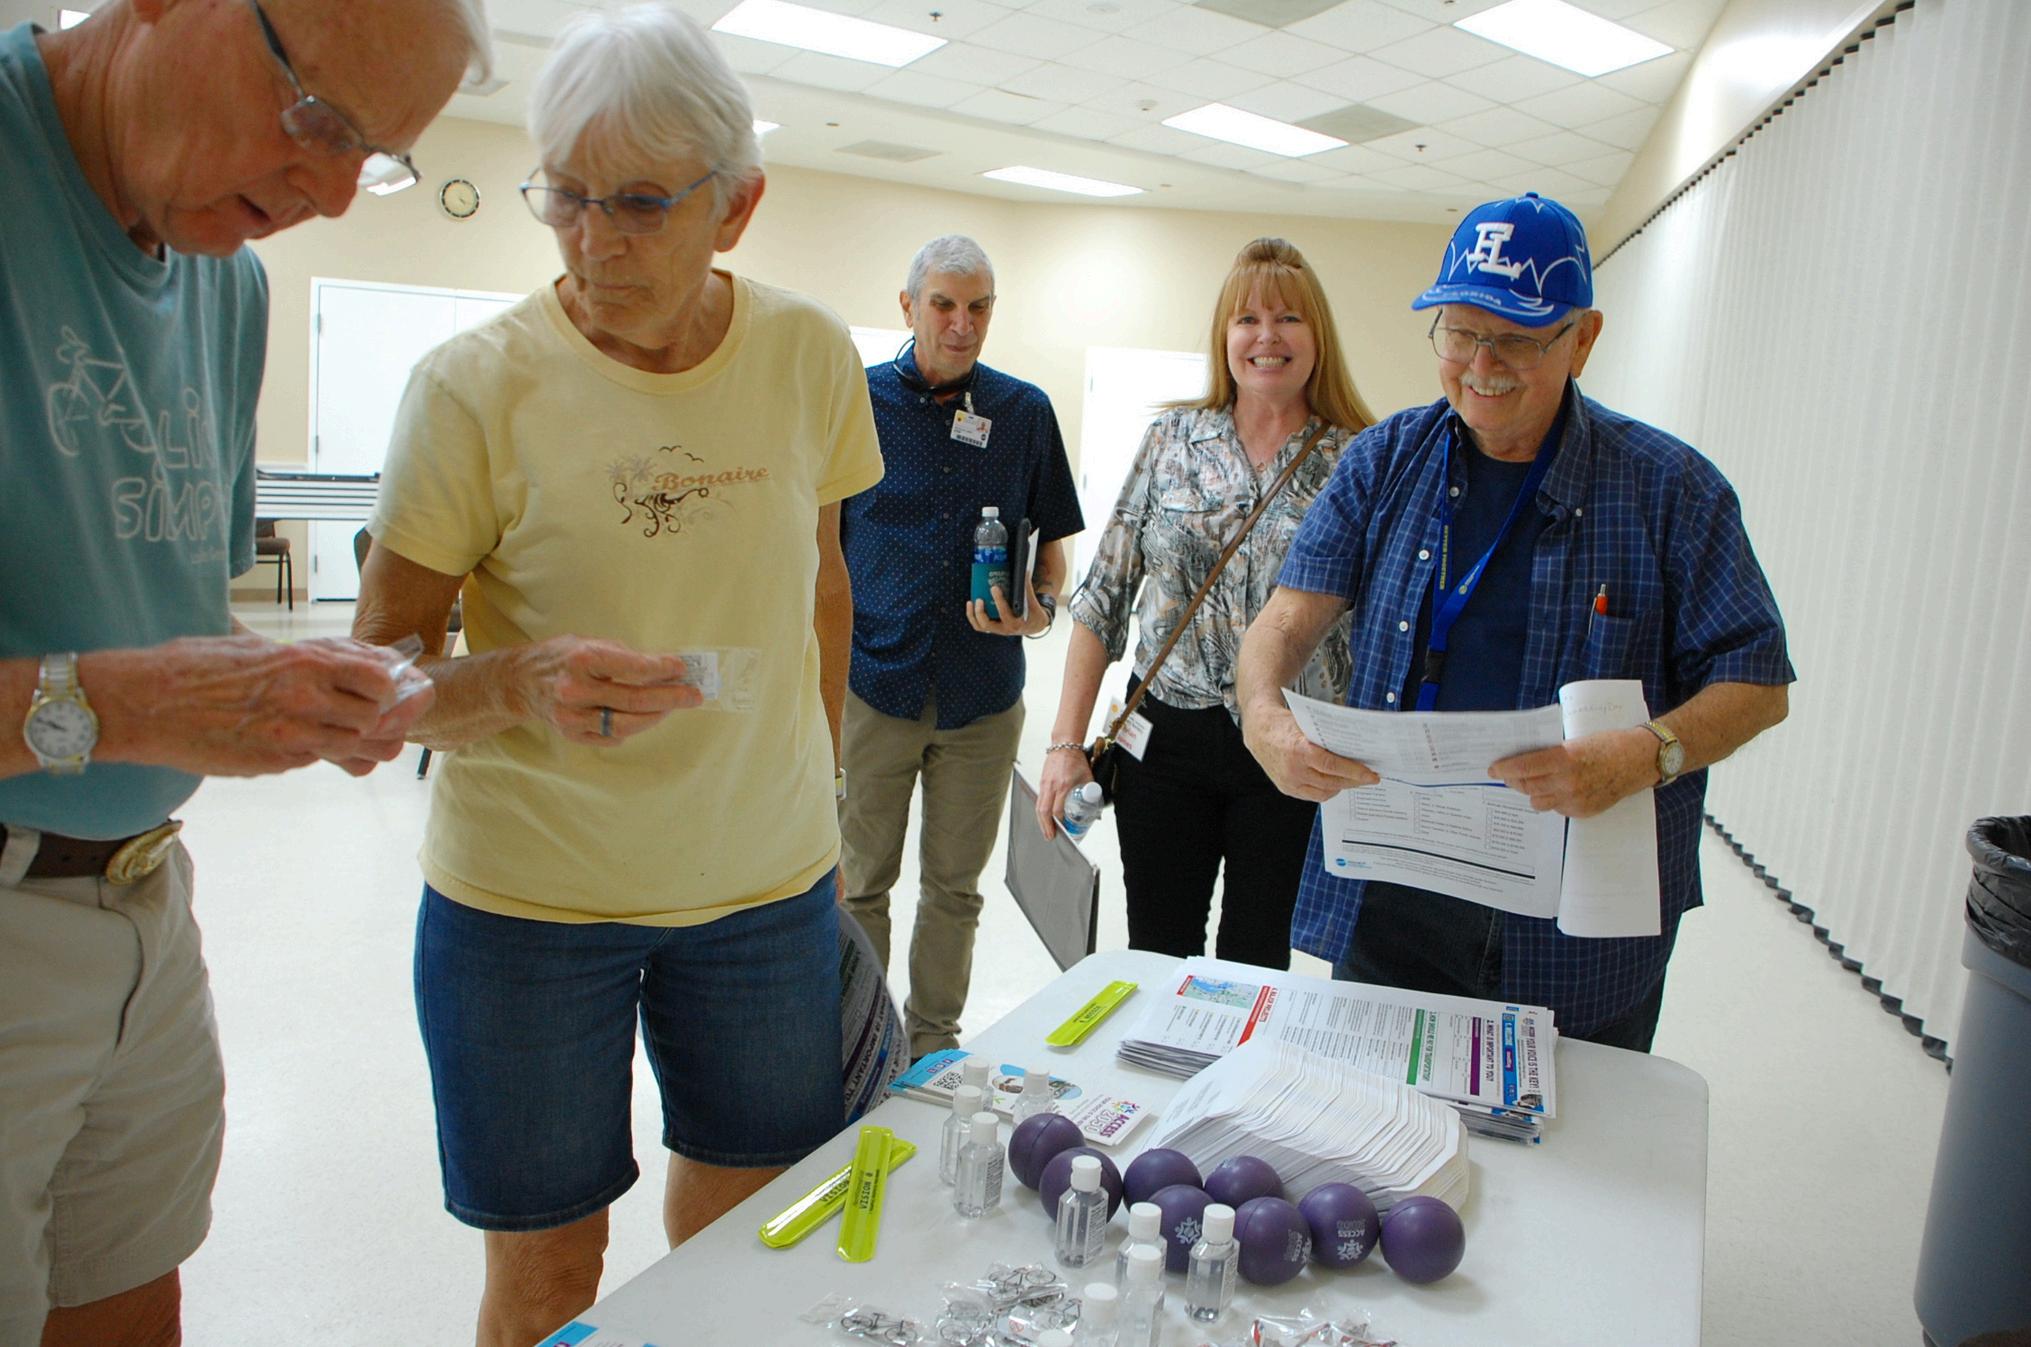
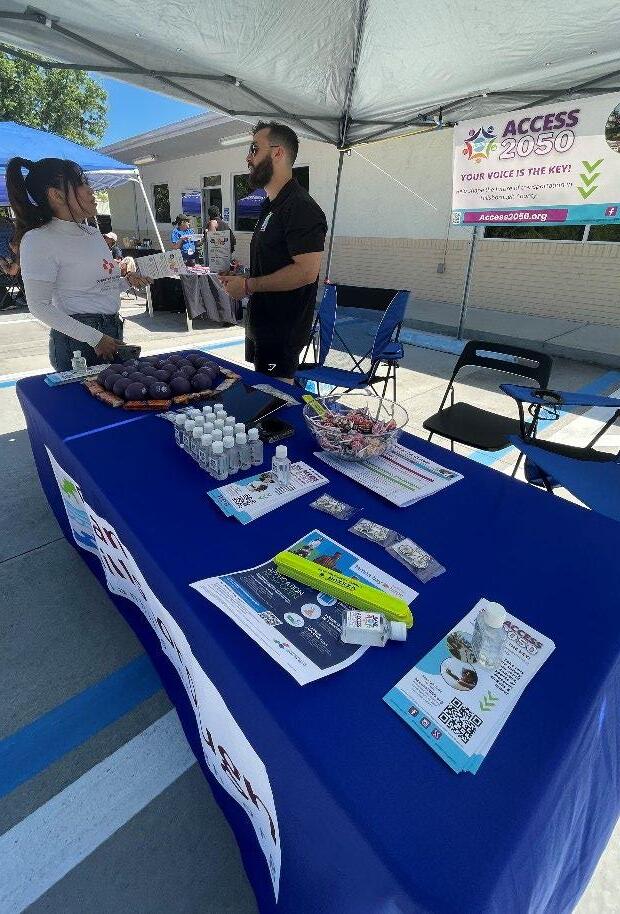
Figure 5-1 Access 2050 Table at MOSI
The following EPA Socioeconomic Indicators were used to determine if a census tract is disadvantaged. Figure 5-2 is a map of TDTAs identified by Hillsborough TPO.
Percent low-income
Percent unemployment
Percent limited English proficiency
Percent less than high school education
Percent under age 5
Percent over age 64
Percent people of color
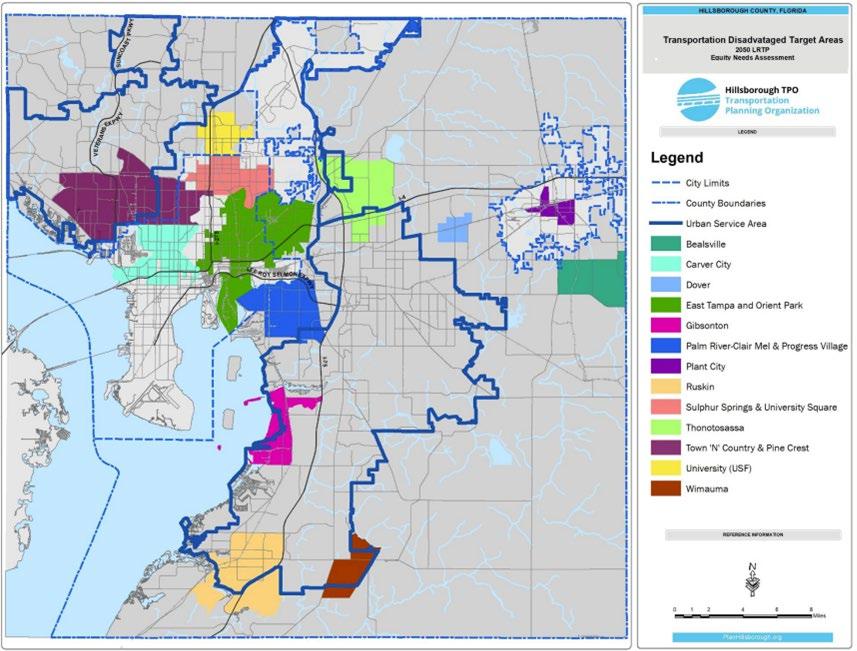
The following is a list of all 13 TDTAs identified by Hills borough TPO:
Bealsville
Carver City
Dover
East Tampa and Orient Park
Gibsonton
Palm River-Clair Mel & Progress Village
Plant City
Ruskin
Sulphur Springs and University Square
Thonotosassa
Town ‘N’ Country & Pine Crest
University (USF)
Wimauma
Access 2050 Hillsborough TPO 38
Figure 5-2 Map of Transportation Disadvantaged Target Areas in Hillsborough County
5.1.2 Partner Organizations
Table 5-1 lists partner organizations that were contacted to assist outreach efforts in and around each of the 13 identified TDTAs. The team contacted representatives from these organizations to offer presentations at meetings, tables at community events, or to inform the organization about Access 2050 and how they could help encourage participation in their communities.
Table 5-1 Organizations Contacted and Events Attended in TDTAs
Bealsville
Hillsborough County Cattlemen’s Association 4/19/24
Carver City Carver City/Lincoln Gardens Civic Association 4/4/24
Armory Gardens Civic Association 3/25/24
Dover Farm Bureau of Hillsborough County 4/8/24
East Tampa and Orient Park
Gibsonton
Palm River-Clair Mel and Progress Village
Hampton Terrace Neighborhood Association 2/28/24
Commissioner Myers Town Hall 2/27/24
Commissioner Myers Town Hall 4/2/24
HART Bus Ride Along, Marion Transfer Center 2/28/24
HART Bus Ride Along, Marion Transfer Center 3/13/24
HART Bus Ride Along, Marion Transfer Center 3/27/24
HART Bus Ride Along, Marion Transfer Center 4/3/24
Commissioner Myers Town Hall 3/25/24
Commissioner Myers Town Hall 3/26/24
Greater Palm River Point CDC 3/9/24
Plant City Plant City NEMP Map Update Open House 2/29/24
Strawberry Festival Luncheon 3/4/24
Plant City Chamber of Commerce 4/11/24
Hillsborough County Farm Bureau 4/8/24
Ruskin Enterprising Latinas, Inc 4/13/24
Sulphur Springs and University Square
Zoo Tampa 3/11-15, 3/18-19, 3/21, 3/22
Thonotosassa Commissioner Myers Town Hall 2/27/24
Town ‘N’ Country and Pine Crest
Westchase Community Association 3/12/24
Zoo Tampa 3/11-15, 3/18-19, 3/21, 3/22
University (USF) MOSI 3/11-15, 3/18, 3/19
Bike Month University Area Slow Roll 3/28/24
HART Bus Ride Along, University Area CDC 3/6/24
Hillsborough County Parks & Rec-Community Baby Shower, UACDC 4/13/24
Wimauma
Enterprising Latinas, Inc 4/13/24
Access 2050 Hillsborough TPO 39
TDTA Organization/Event Dates
5.2 Outreach for Targeted Demographic Groups
Throughout the public engagement process, the Hillsborough TPO has worked diligently to identify and engage demographic groups who are challenging to reach through traditional, broad scale outreach efforts. These groups face barriers to participation in municipal government efforts including limited time, limited transportation options, lack of access to the internet and other common mass communication methods, and limited English proficiency. Identified demographic groups are examined in the following subsections and specific outreach methods targeted to each group are listed.
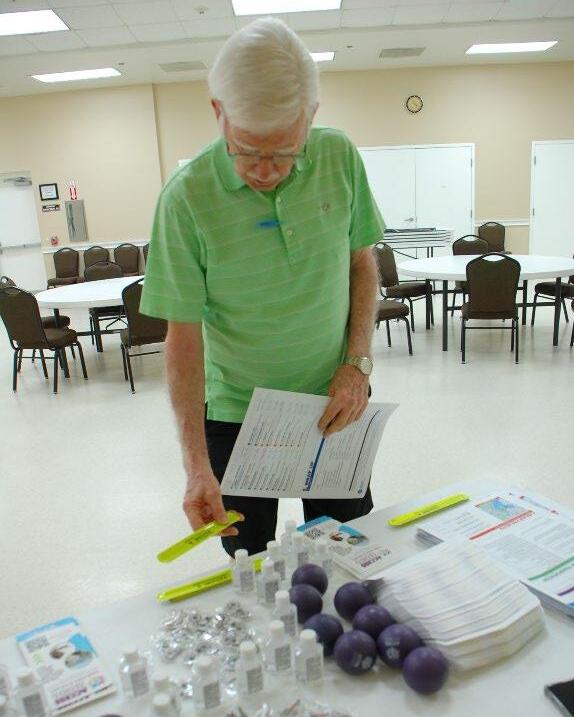
5.2.1
Seniors
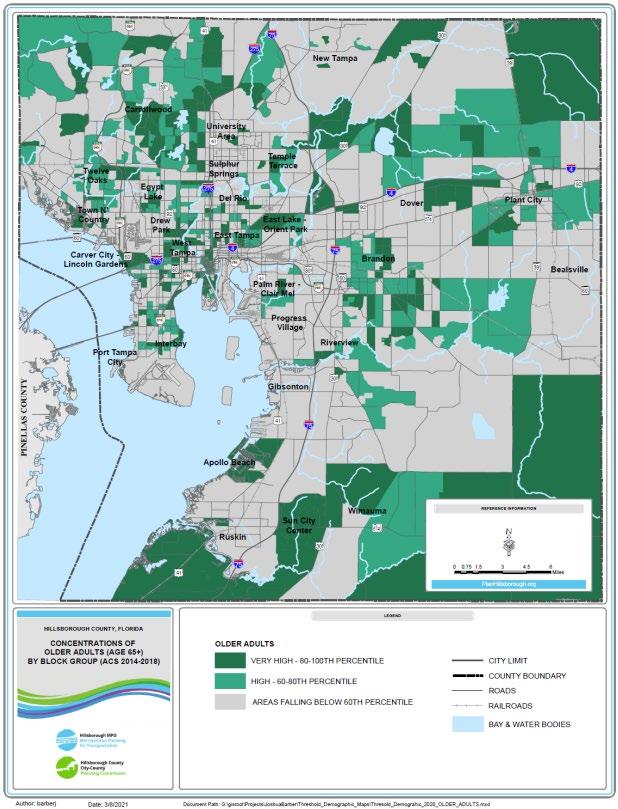
Seniors are more likely than other groups to be retired or engaged in part-time or volunteer work. Some seniors may be unwilling or unable to drive, and thus have limited transportation options, causing them to rely on other methods for transportation. While they may have resources, such as the internet and devices, they may be uncomfortable using them and prefer in-person outreach methods. Figure 5-4 shows where concentrations of adults age 65+ are in Hillsborough County.
During the public outreach phase, the following outreach methods were implemented to reach seniors across Hillsborough County
Websites
TV and Radio News Facebook
In-Person Community Presentations
Flyers
Mailers
Pop -up Events
Access 2050 Hillsborough TPO 40
Figure 5-3 Residents at Sun City Center Community Meeting
5-4 Concentrations of Adults Age 65+
Access 2050 Hillsborough TPO 41
Figure
Additionally, Hillsborough TPO staff attended events or gave presentations to the following partner organizations targeted to a high concentration of seniors:
Florida State Fairgrounds Town Hall with Commissioner Myers
Greater Palm River Point CDC, Spring Break Bash
HART Bus Ride Along
Vanasse Hangen Brustlin, Inc., Open House
National Federation of the Blind of Florida, Presentation
Sun City Center, Presentation
5.2.2 College Students and Young Adults
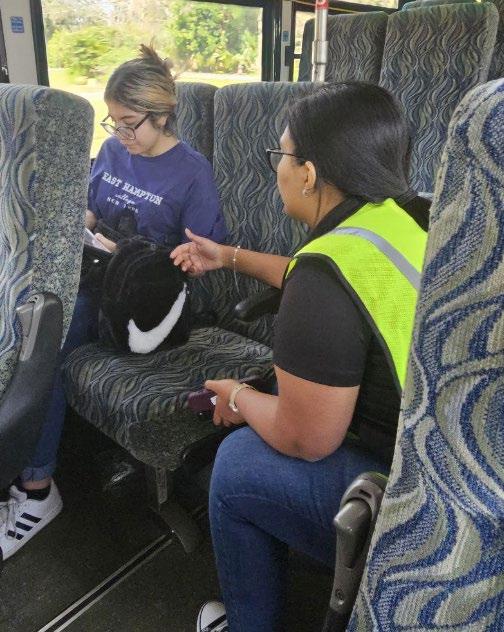
Young adults and college students are often difficult to reach as they are usually focused on school, socializing, and early career consideration. In Hillsborough County, the University of Tampa, University of South Florida, and Hillsborough Community College are the primary institutions of higher education. The schedules of young adults are often highly variable, and many do not have access to a car, sometimes by choice. They have limited incomes which limit funds for items such as gas, food, etc. This group often has access to the internet and digital devices needed for socializing and coursework. Young adults have spent their lives connected to the internet are constantly bombarded by social media, surveys, ads, etc. and, while many are interested in the welfare and progress of their community, it is difficult to find time to get involved with local government.
Focusing on reaching this category by “meeting them where they are” is especially important.
During the public outreach phase, the following outreach methods were implemented to reach college students and young adults across Hillsborough County:
Website
Social Media (Instagram, TikTok)
Videos
Contests
Pop -up Events Targeting Young Adults
Bike Rides
Additionally, Hillsborough TPO staff attended events or gave presentations to the following partner organizations targeted to a high concentration of college students and young adults.
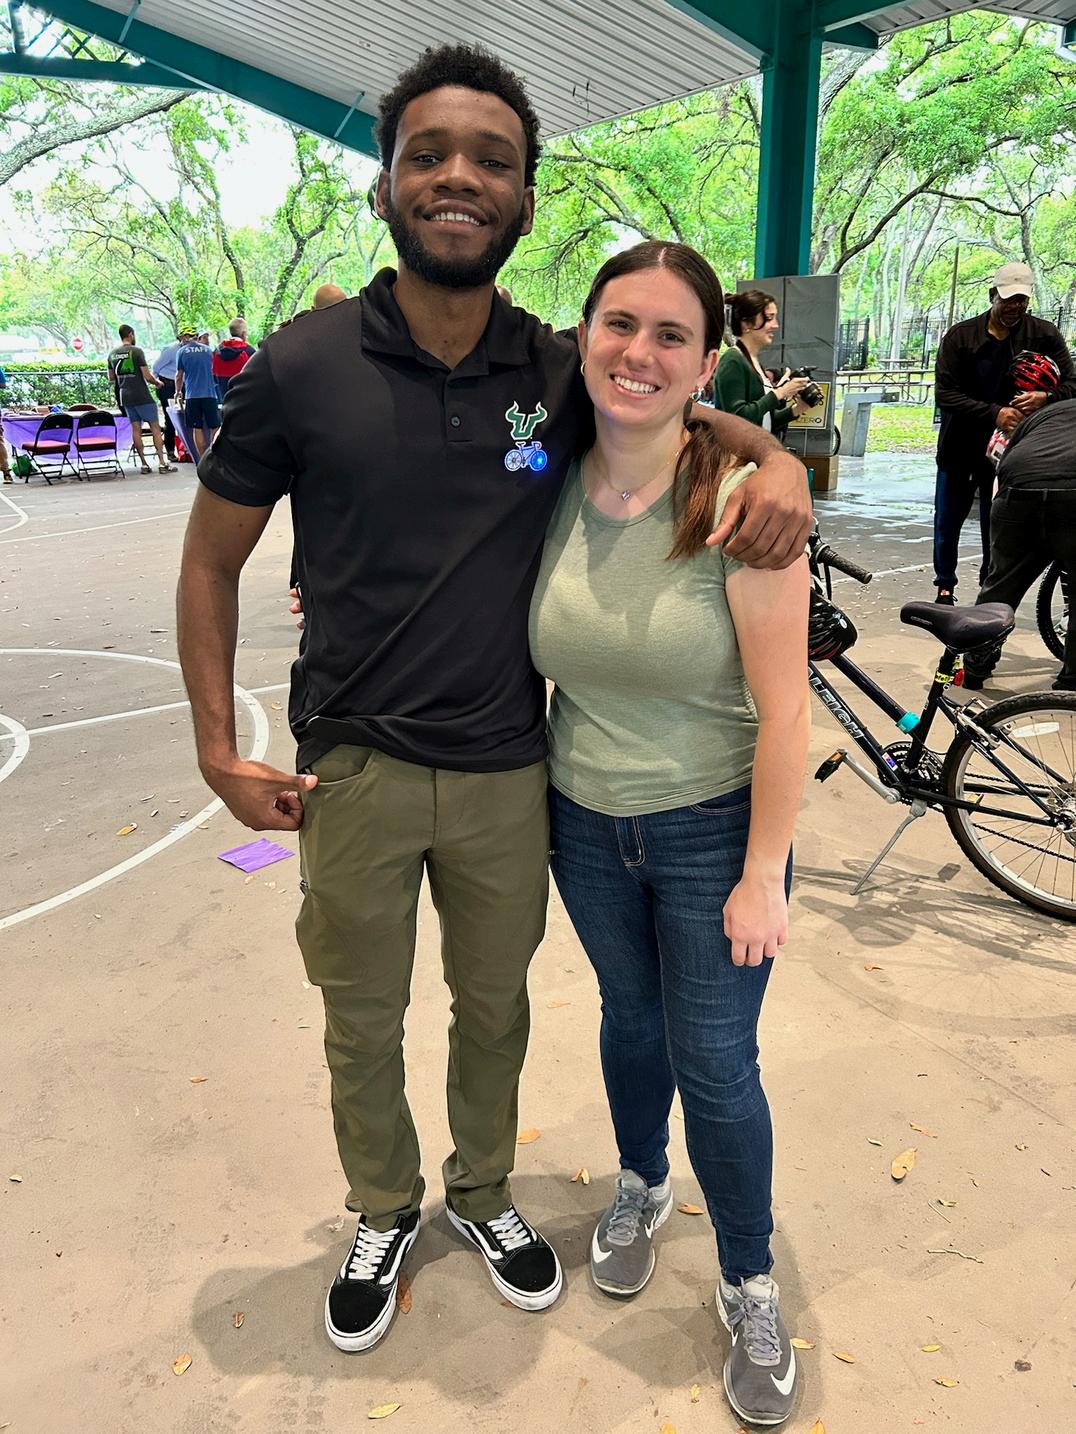
Bike Month University Area Slow Roll
Zoo Tampa
MOSI
Sunday Dinner Enterprising Latinas
Access 2050 Hillsborough TPO 42
Figure 5-5 HART Rider Taking Survey
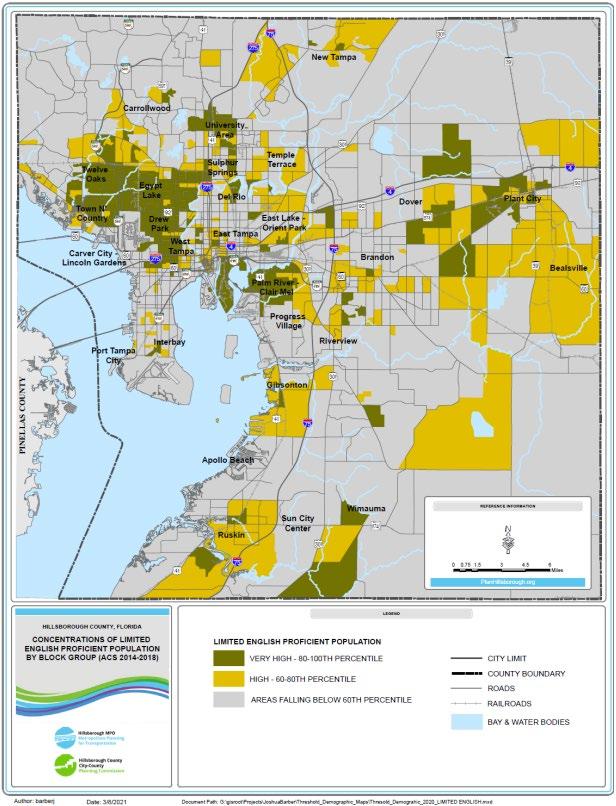
5.2.3 People with Limited English Proficiency
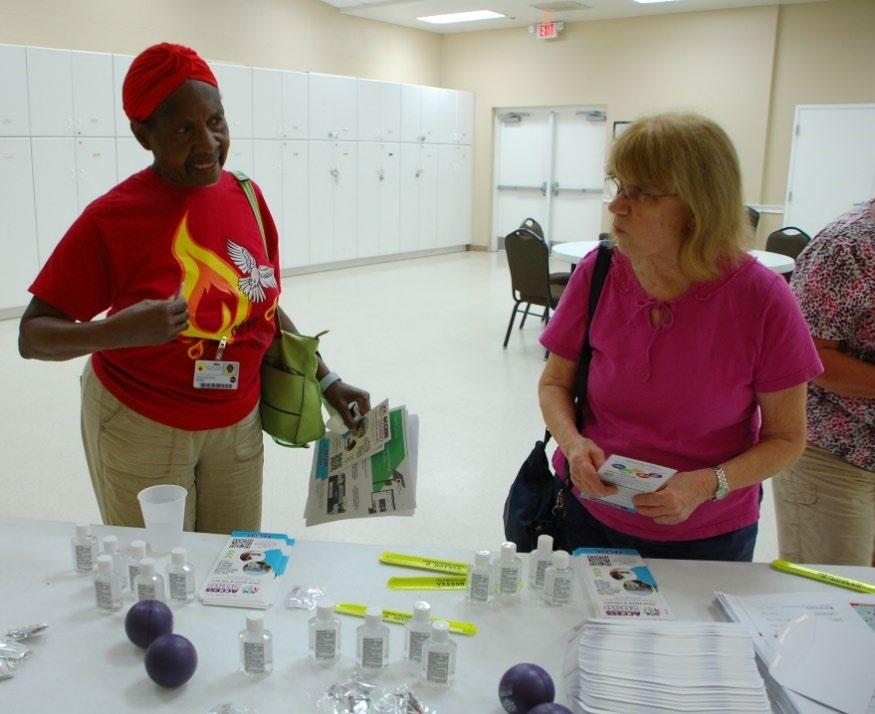
It is often difficult for persons Limited English Proficiency (LEP) to participate in community outreach events and interpret outreach material. Some limited English speakers may have less education, fewer transportation options, and fewer financial resources for gas, internet, digital devices, etc. Those with digital devices can often participate virtually with assistance from translation technologies. However, in-person participation can be challenging, especially when an applicable translator is not available. Hillsborough TPO and EXP staff members translated all print media into Spanish. Also, to help reach Limited English Proficient communities, the Hillsborough TPO partnered with organizations that work with these communities and could help spread the word about the survey.
During the public outreach phase, the following outreach methods were implemented to reach those with limited English proficiency across Hillsborough County.
Translated Website
Social Media with Spanish Translations
Translated Videos
Community Presentations and Events
Coordination with Advocacy Groups and Community Centers that Target LEP Citizens
Figure 5-6 shows neighborhoods in Hillsborough County with concentrations of residents with limited English proficiency.
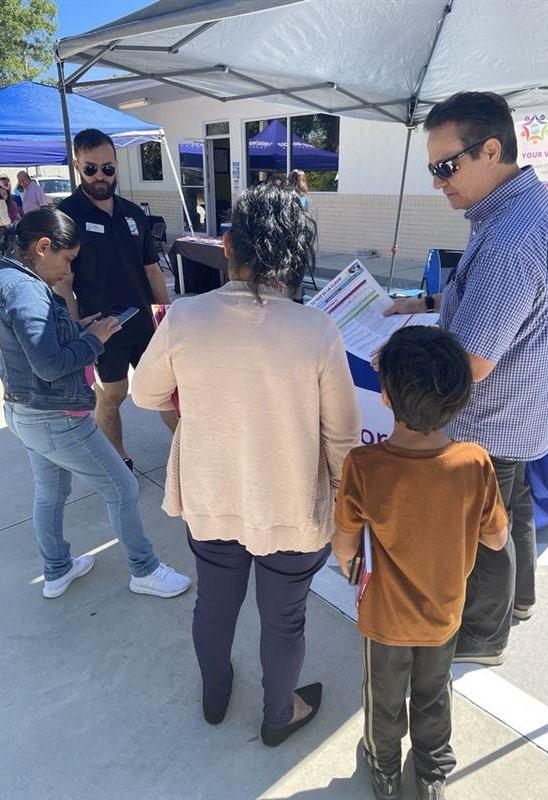
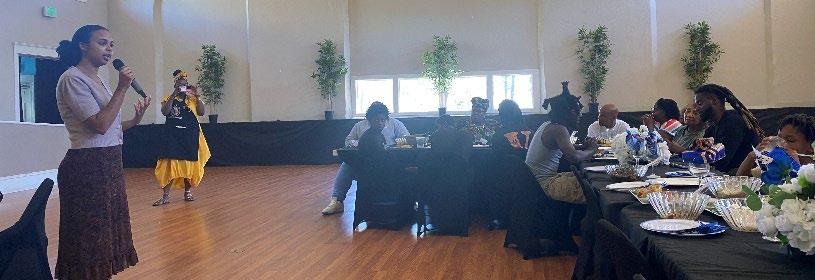
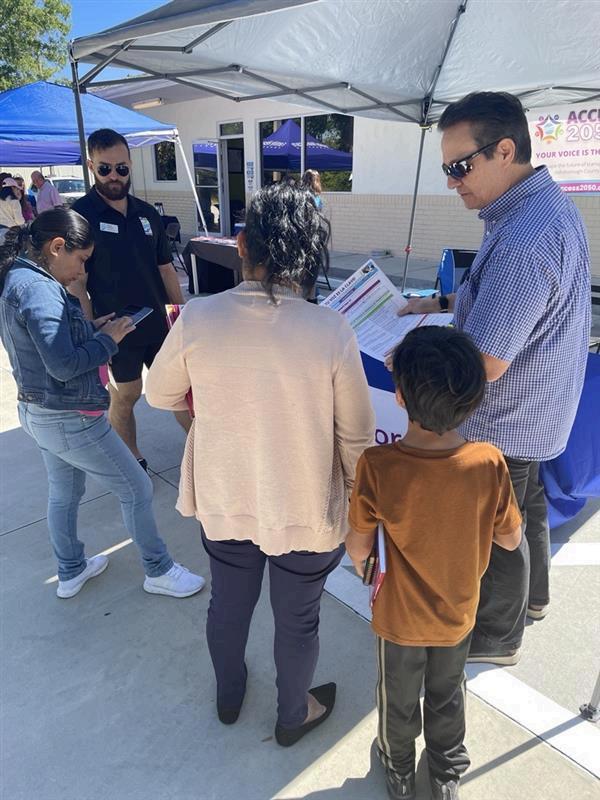
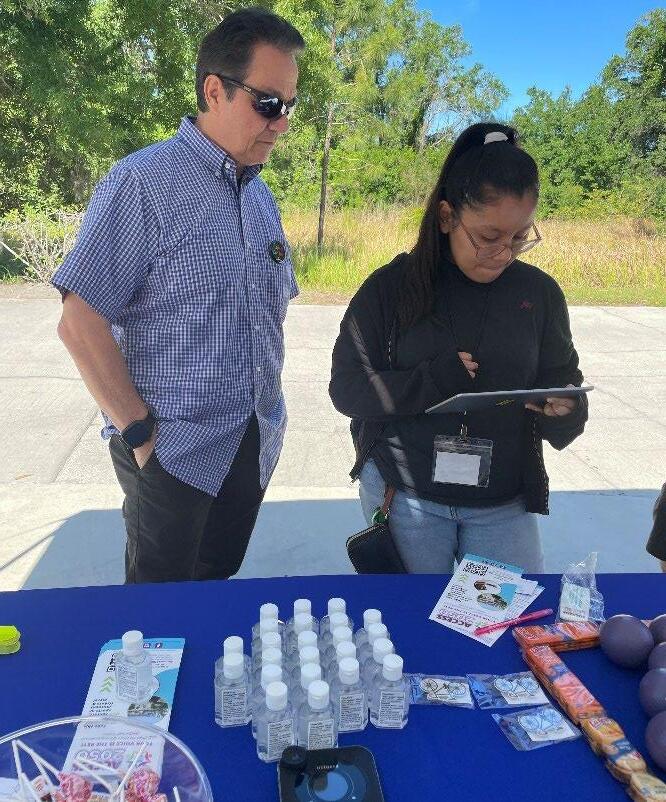
The team had the opportunity to participate in an event hosted at the Community Opportunity Center in Wimauma, a neighborhood facing economic challenges, alongside the non-profit organization Enterprising Latinas. During this gathering, complimentary tickets to Zoo Tampa were distributed to individuals who completed the Access 2050 survey.
The team assisted a family with Limited English Proficiency in completing the survey and presented them with Zoo Tampa tickets. The family expressed their long-standing desire to take their children to the zoo, a dream they couldn't fulfill due to financial constraints. Now, thanks to the tickets and their participation in the survey, they eagerly anticipated sharing this unforgettable experience with their children while contributing to the betterment of their community through the Access 2050 survey.
Access 2050 Hillsborough TPO 43
Wimauma Community Opportunity Center Event
Access 2050 Hillsborough TPO 44
Figure 5-6 Concentrations Residents with Limited English Proficiency
Additionally, Hillsborough TPO staff attended events or gave presentations in the following areas with a high concentration of residents with limited English Proficiency.
Florida State Fairgrounds Town Hall with Commissioner Myers
HART Bus Ride Along
Greater Palm River Point CDC
Zoo Tampa
Bike Month University Area Slow Roll
Carver City Lincoln Gardens Civic Association
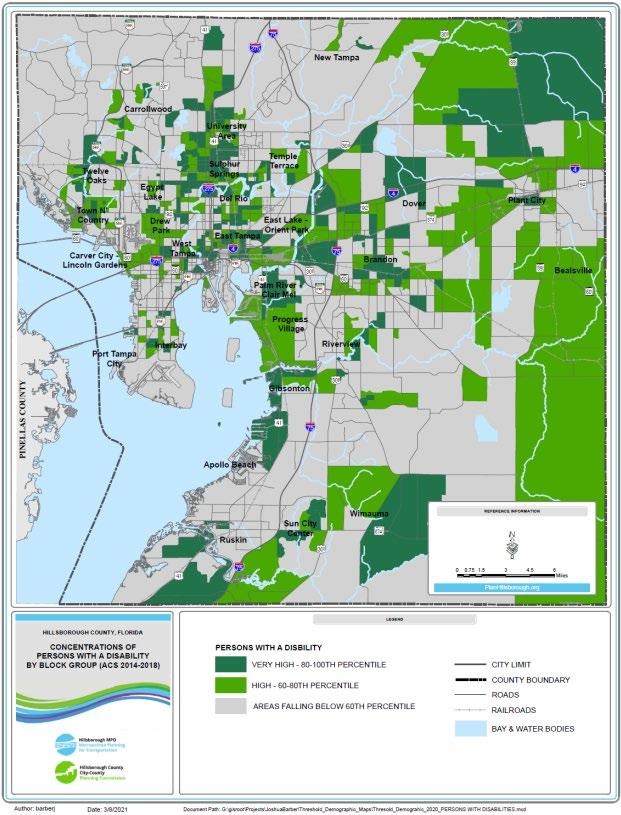
5.2.4 People with Disabilities
It is important that all persons with disabilities, including those with visual and hearing impairments, are considered in the creation of the LRTP engagement strategy. These citizens may have limited transportation options and resources and are often reliant on caretakers for transportation. This limits their ability to attend inperson community events or meetings. They may also have specialized assistive technology that can prove beneficial so long as digital outreach elements, such as websites, surveys, videos, documents, etc. are digitally compliant. To reach people with disabilities, it is vital to partner with community groups who work with this population as they can often help ensure materials are ADA compliant and translate information into braille for persons who are visually impaired. Figure 5-8 shows census block groups where people with disabilities are concentrated in Hillsborough County.
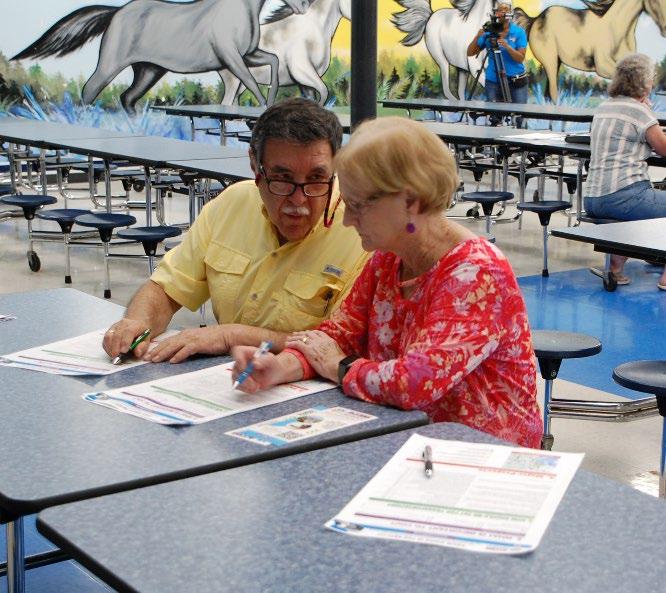
Figure 5-7 Participants Filling out Large Print Paper Surveys
During the public outreach phase, the following outreach methods were implemented to reach people with disabilities across Hillsborough County.
Transportation Disadvantaged Groups
Website
News Releases Social Media Community Presentations Targeting People with Disabilities
Additionally, Hillsborough TPO staff attended events or gave presentations in the following areas with a high concentration of residents with disabilities.
All People’s Life Center Town Hall with Commissioner Myers
National Federation of the Blind of Florida (Tampa Chapter)
HART Bus Ride Along
Sun City Center Carver City/Lincoln Gardens Civic Association
Greater Palm River Point CDC New Horizons
Access 2050 Hillsborough TPO 45
Access 2050 Hillsborough TPO 46
Figure 5-8 Concentrations of Persons with a Disability
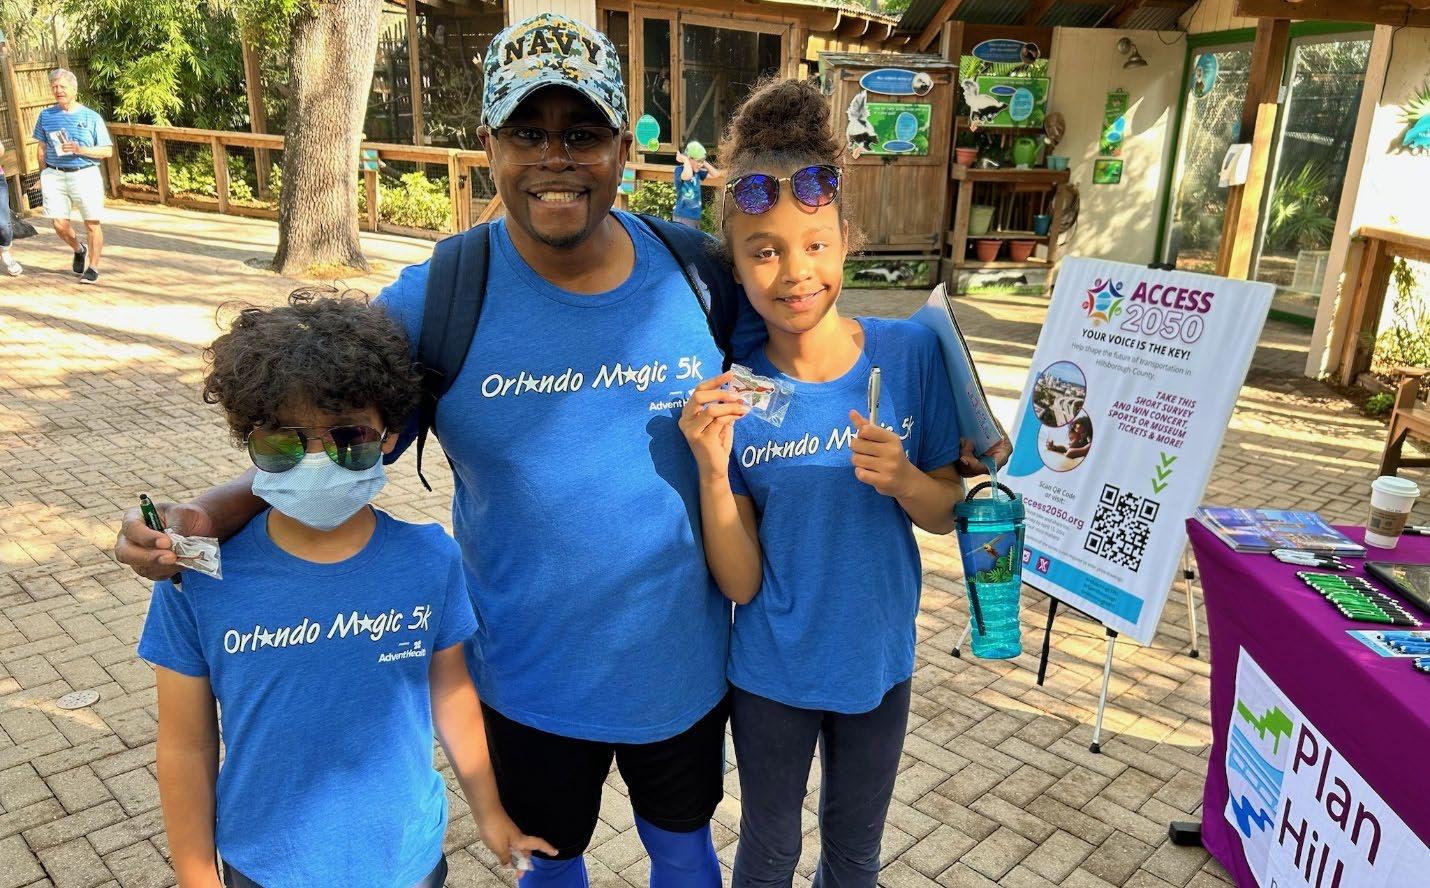
5.2.5 Parents and Families
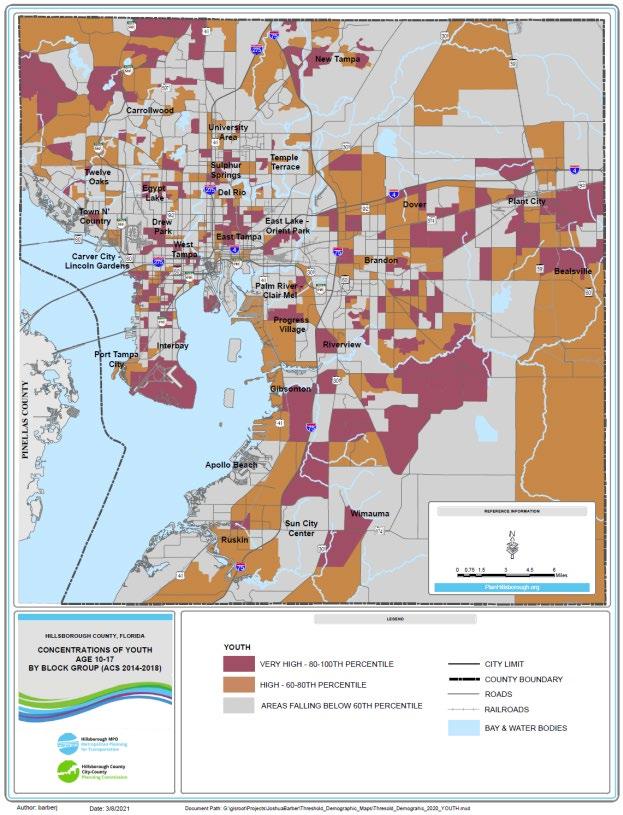
Parents and families are often focused on day-to -day concerns like work, school, extracurricular activities, financial management, etc. This group understands the importance of getting involved with local government and often feels direct impacts. However, because of time constraints, they need outreach that will accommodate their needs. They generally have access to cars, internet, digital devices, etc., but are often unable to take the time out to attend in-person public meetings. Therefore, the most effective outreach methods for parents and families provide convenient ways to be involved. Focusing on short, digital surveys that have an interactive component can provide excellent feedback from any location. In-person events such as sports and other community events provide opportunities to encounter families. Figure 5-9 shows where youth aged 10-17 are concentrated in Hillsborough County, indicating a concentration of parents and families in these areas.
During the public outreach phase, the following outreach methods were implemented to reach parents and families across Hillsborough County.
Website News Releases
Social Media
Email Blasts
Newsletters
Public Meetings with Children’s Activities
TV/Radio Shows
Community Events Targeted to Families
Contests
School District Emails
Access 2050 Hillsborough TPO 47
Figure 5-9 A Family Shows Off Their Safety Materials at the ZooTampa Access2050 Event
Access 2050 Hillsborough TPO 48
Figure 5-10 Concentrations of Youth Ages 10-17
Additionally, Hillsborough TPO staff attended events or gave presentations in the following areas with a high concentration of residents with parents and families.
MOSI
Zoo Tampa
Florida State Fairgrounds Town Hall with Commissioner Myers
HART Bus Ride Along
Hampton Terrace Neighborhood Association
5.2.6 Low-Income Citizens
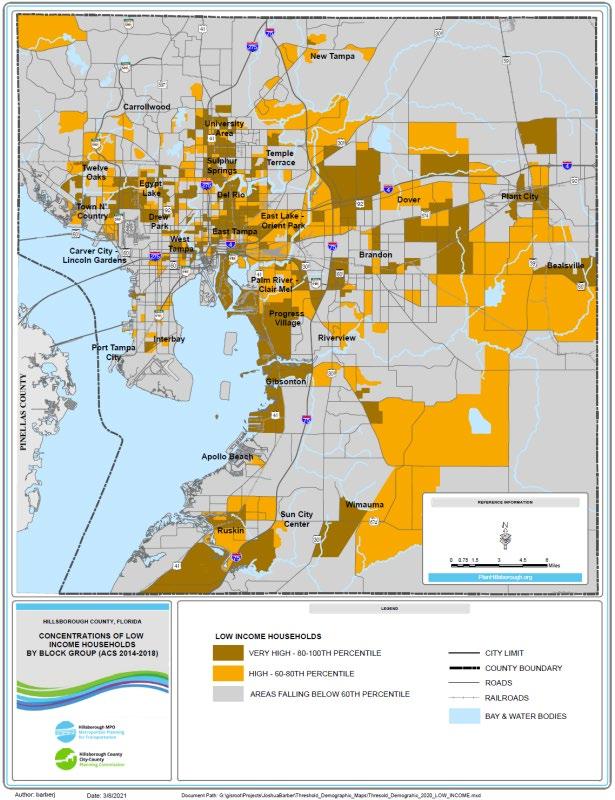
Low-income citizens face multifaceted barriers to becoming involved in local government outreach activities. This group often has limited access to the internet, making it difficult to reach them and difficult for them to participate through online methods. People with low incomes often work long hours with variable schedules that include evening, night, and weekend hours. Because of this, members of this demographic group have limited availability to attend evening community events and meetings and it is difficult to plan events that “work for everyone”. Many residents with low incomes also have limited access to transportation and rely on public transportation or friends, relatives, or employers for essential transportation needs. To reach citizens with low incomes, it is important to “meet them where they are” by planning in-person events at locations in lowincome neighborhoods that are easily accessible, such as a local community center, and varying the times of day when these events are held.
Plant City NEMP Map Update Open House
Strawberry Festival Luncheon
Greater Palm River Point CDC
Westchase Community Association
Armory Gardens Civic Association
Carver City Lincoln Gardens Civic Association
During the public outreach phase, the following outreach methods were implemented to reach parents and families across Hillsborough County.
News Releases
Social Media
Newsletters
TV/Radio Shows
Coordination with Community Resource Centers
Road signs
Contests
Access 2050 Hillsborough TPO 49
Figure 5-11 shows where low-income households are concentrated in Hillsborough County.
Figure 5-11 Wimauma Resident Filling Out Access 2050 Survey during Outreach Event
Access 2050 Hillsborough TPO 50
Figure 5-12 Concentrations of Low-Income Households
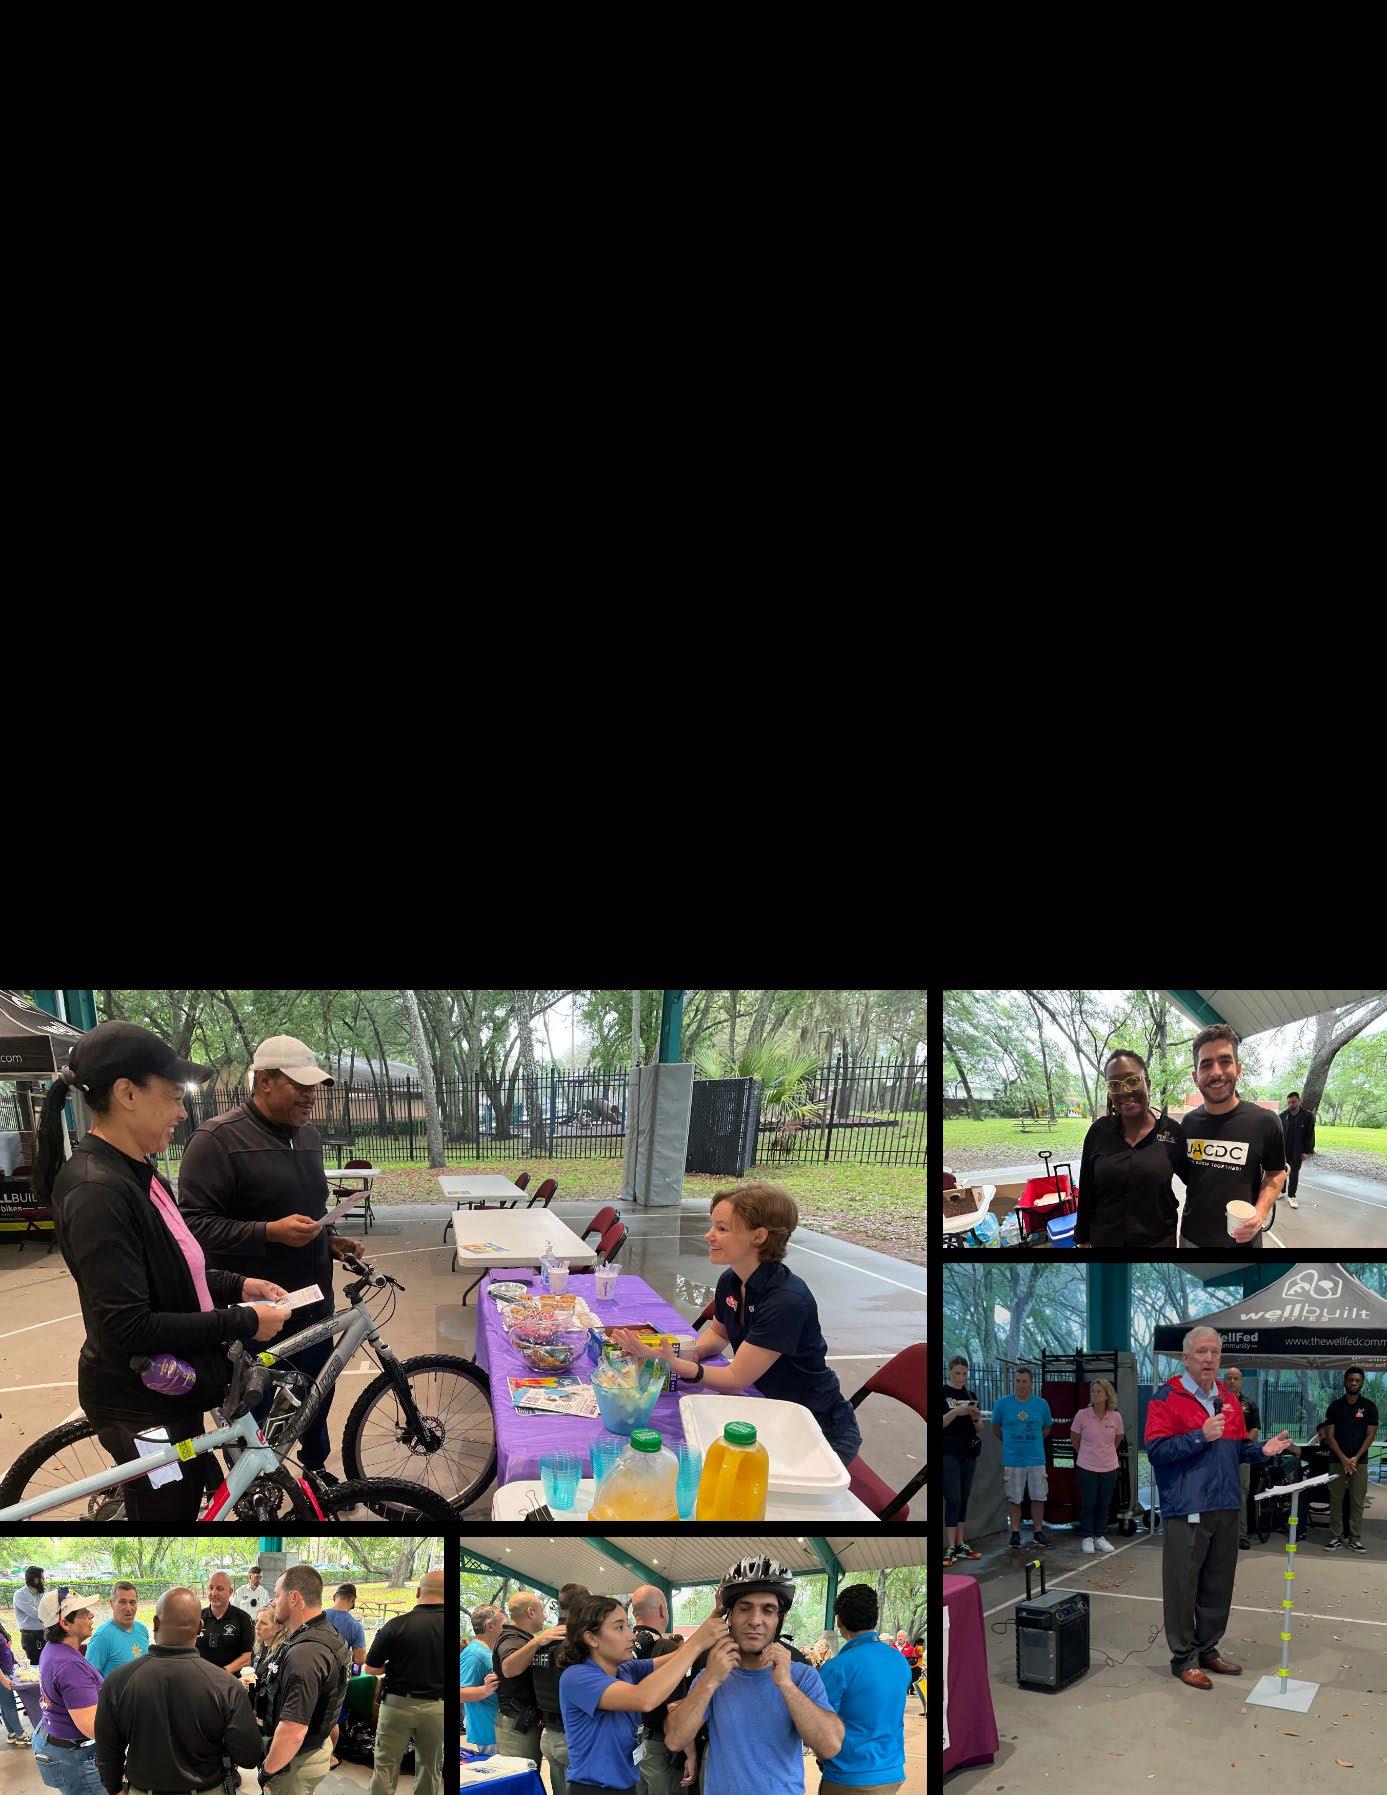
Additionally, Hillsborough TPO staff attended events or gave presentations in the following areas with a high concentration of residents with low incomes.
Florida State Fairgrounds Town Hall with Commissioner Myers
HART Bus Ride Along
Hampton Terrace Neighborhood Association
Plant City NEMP Map Update Open House
Plant City Town Hall with Commissioner Myers
Carver City/Lincoln Gardens Civic Association
Bike Month University Slow Roll
Access 2050 Hillsborough TPO 51
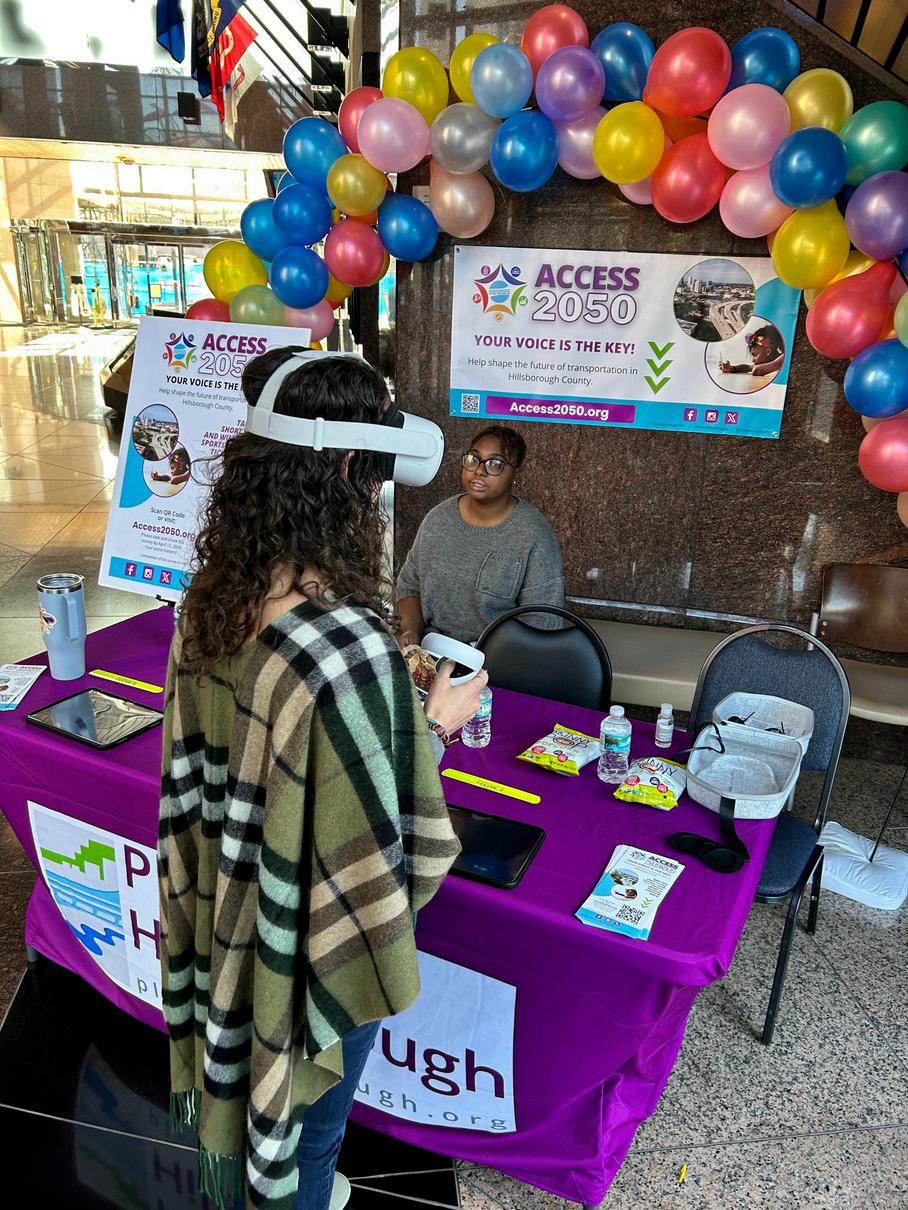
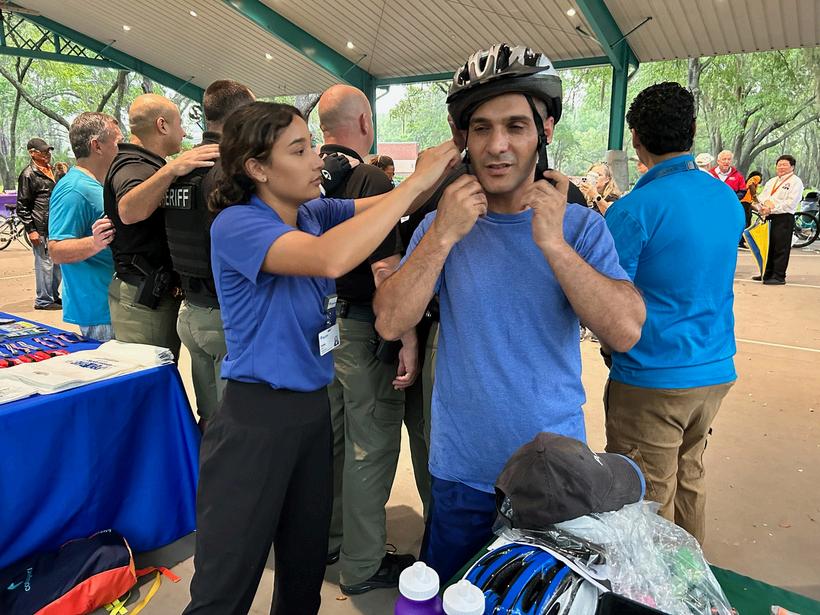
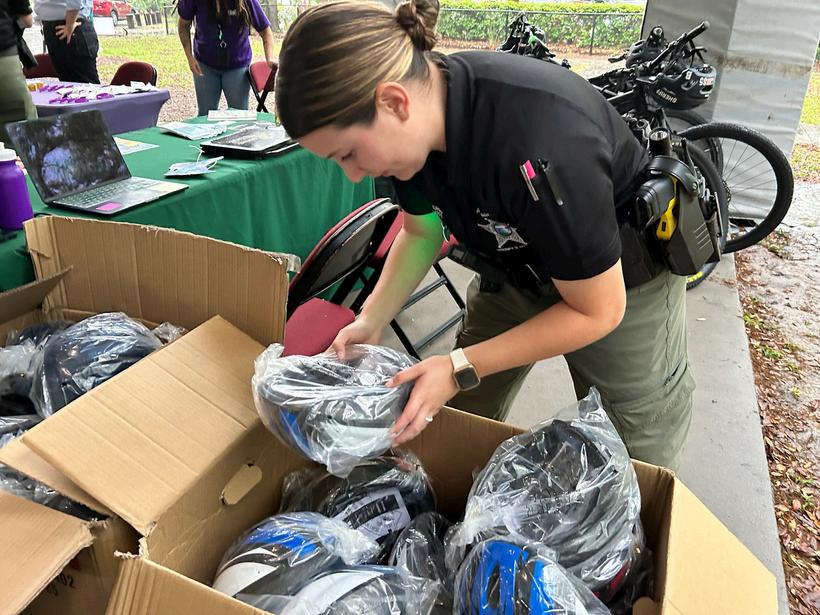
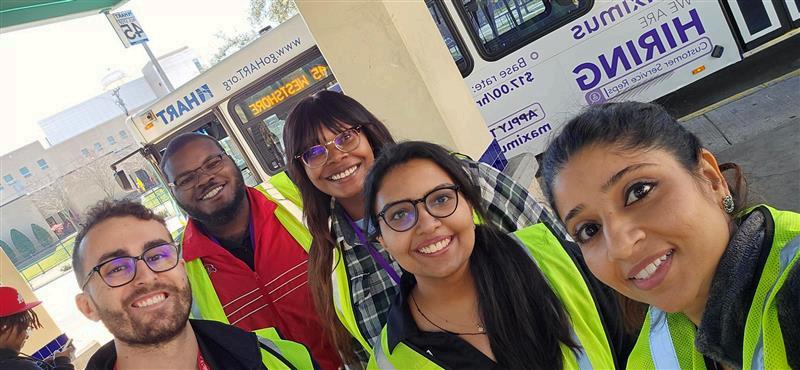
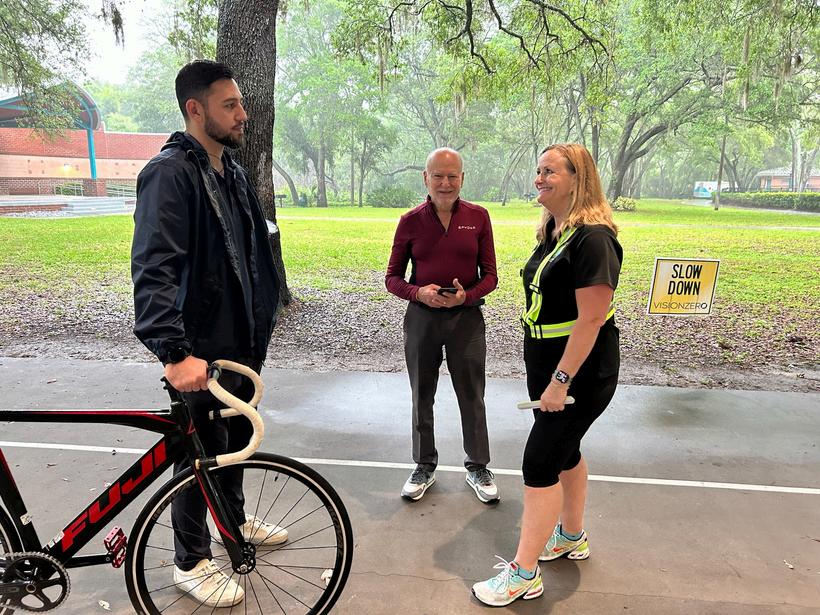
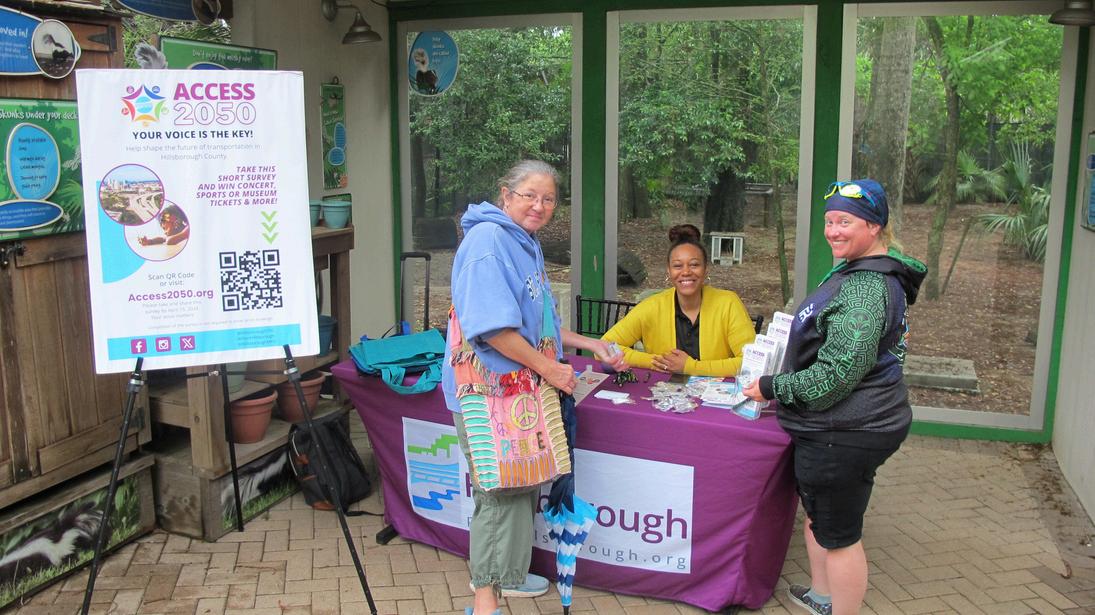
OUTREACH RESULTS
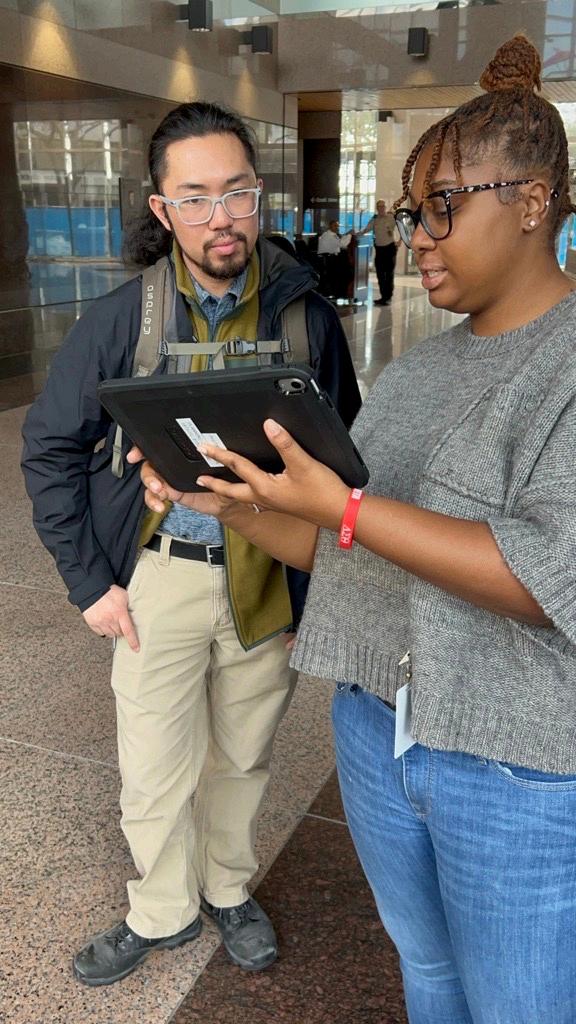
6
6 Outreach Results
The public survey was the primary method for public outreach. Hillsborough TPO, EXP, and Atkins staff members all worked together to develop the survey, with the Hillsborough TPO giving final approval. The survey opened on January 30, 2024 and was available until April 15, 2024.
6.1 Survey Questions and Format
The survey was organized into five screens The first screen shared the purpose of the survey and gave instructions on how to complete it. It also included a link to a Spanish version.

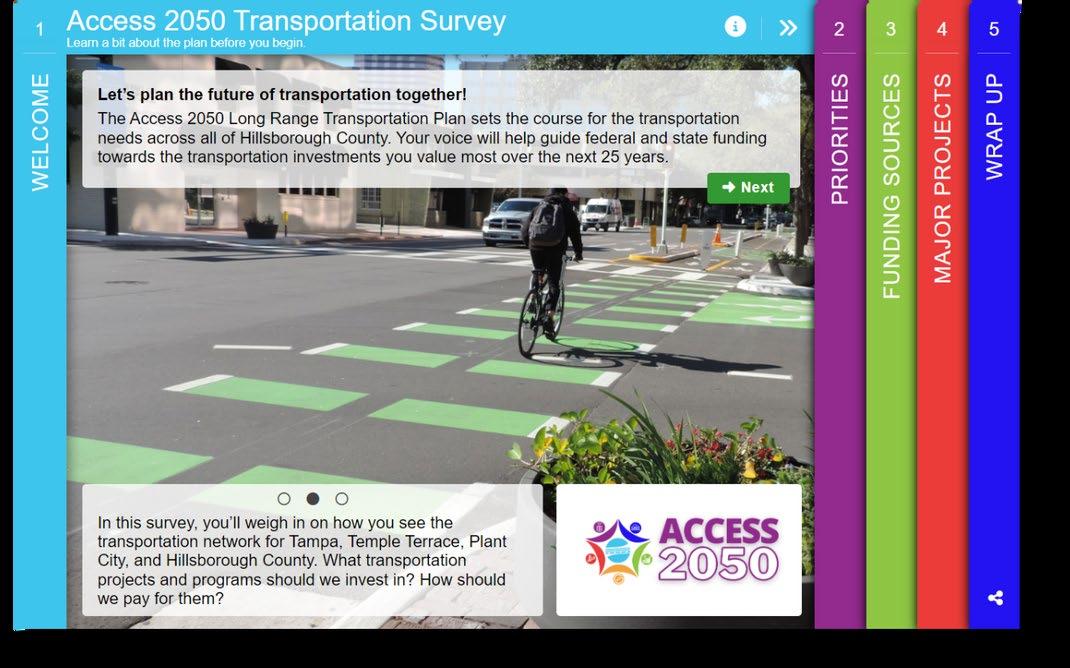
Access 2050 Hillsborough TPO 54
Figure 6-1 Survey Screen 1
6.1.1 Survey Screen 2: Priorities
The second page of the survey asked respondents to rank the following transportation subjects in order of priority. Respondents were asked to choose their five top priorities and rank them from first to fifth. Respondents were not required to choose five options. On this page, there was also an option to leave a comment
Improve existing bus service
New, faster transit
Extend or add lanes to major roads
Build more trails and sidepaths
Maintain and/or repair roads and bridges
Reduce traffic jams
Reduce crashes

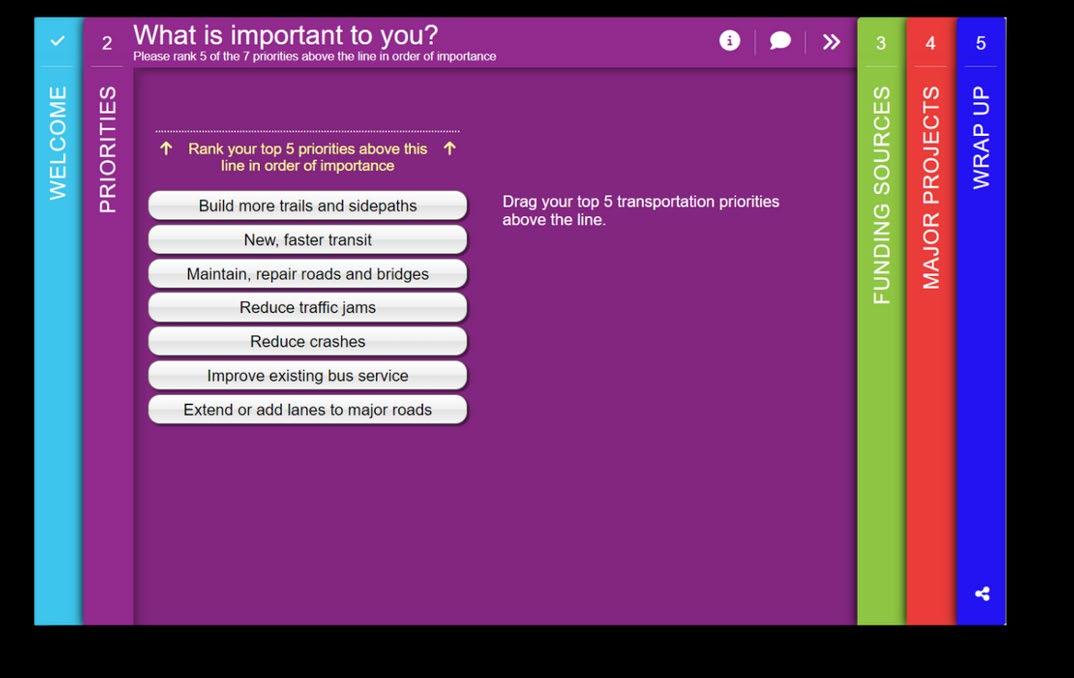
Access 2050 Hillsborough TPO 55
Figure 6 2 Survey Screen 2
6.1.2 Survey Screen 3: Funding Sources
The third page of the survey asked respondents to give their opinions on transportation funding sources. On each page, they had the option to indicate approval or disapproval for allowing the funding source to expire, renewing the existing funding source, or increasing the funding source. Respondents were not required to give an opinion on each tax and had the ability to skip questions. They also had the ability to leave comments on each funding source. Opinions were given on the following funding sources:
Community Investment Tax
Gas Tax
Transit Service Property Tax
Express Toll Lanes
Other Funding Sources
Other Funding Sources included the following:
Replace gas tax with a fee based on mileage driven
Increase the existing $48 driver license fee
Create an additional fee to use rideshare services like Uber/Lyft
Create an electric vehicle fee to use public charging stations

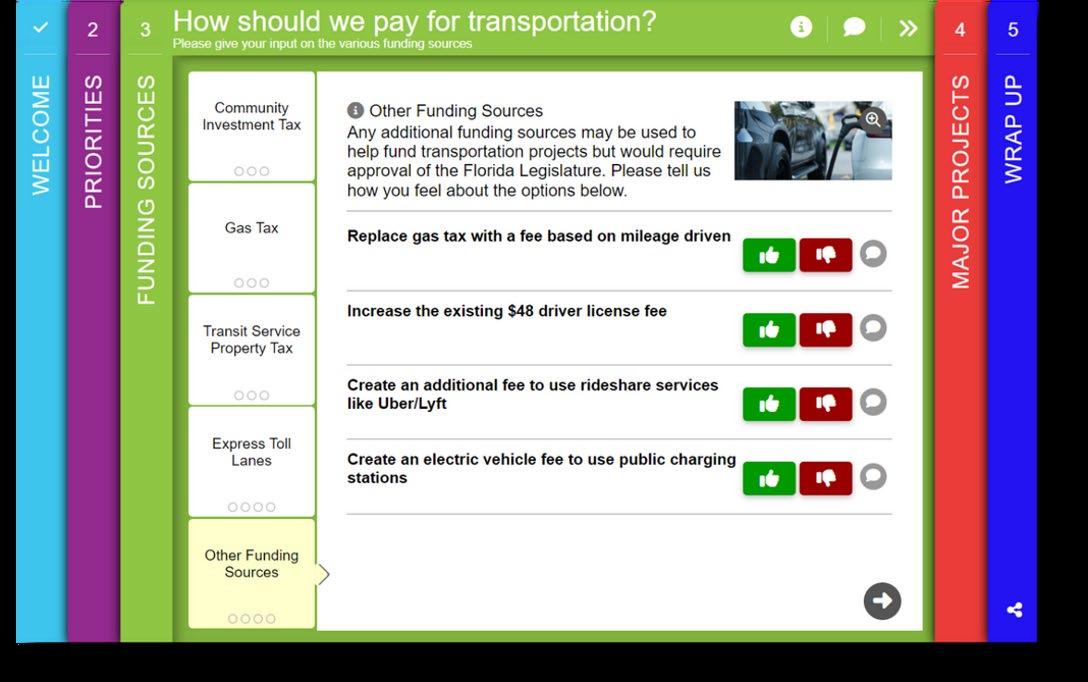
Access 2050 Hillsborough TPO 56
Figure 6-3 Survey Screen 3
6.1.3 Survey Screen 4: Major Projects
On page 4 of the survey, respondents were presented with a map of Hillsborough County with several proposed transportation projects. Respondents were asked to indicate whether each project should be a priority or not and had the ability to leave comments on each specific proposed project. It was not a requirement that each question be answered. The following proposed projects were presented on the survey:
New I-75 interchange near Ft. Hamer
Reconstruct interchange at I-75 and US-301
New interchange at I-75 near Harney Rd.
New interchange at I-275 near US-41
E/W Metro Rapid bus service
connecting communities from Westshore/Airport to Temple Terrace
CSX South Tampa multimodal corridor
Downtown Tampa, USF, Brandon premium transit
Streetcar extension
Regional passenger transit
USF to Brandon BRT
I-275 managed lanes
Gandy Bridge replacement connecting to Selman Expressway
Suncoast Parkway widening
I-75 North managed lanes
I-4 managed lanes
I-57 South managed lanes
I-275 widening
US 301 elevated extension
Balm Rd. widening
Lithia Pinecrest Rd. widening
SR-60 widening
CR-39 widening
US-92 widening

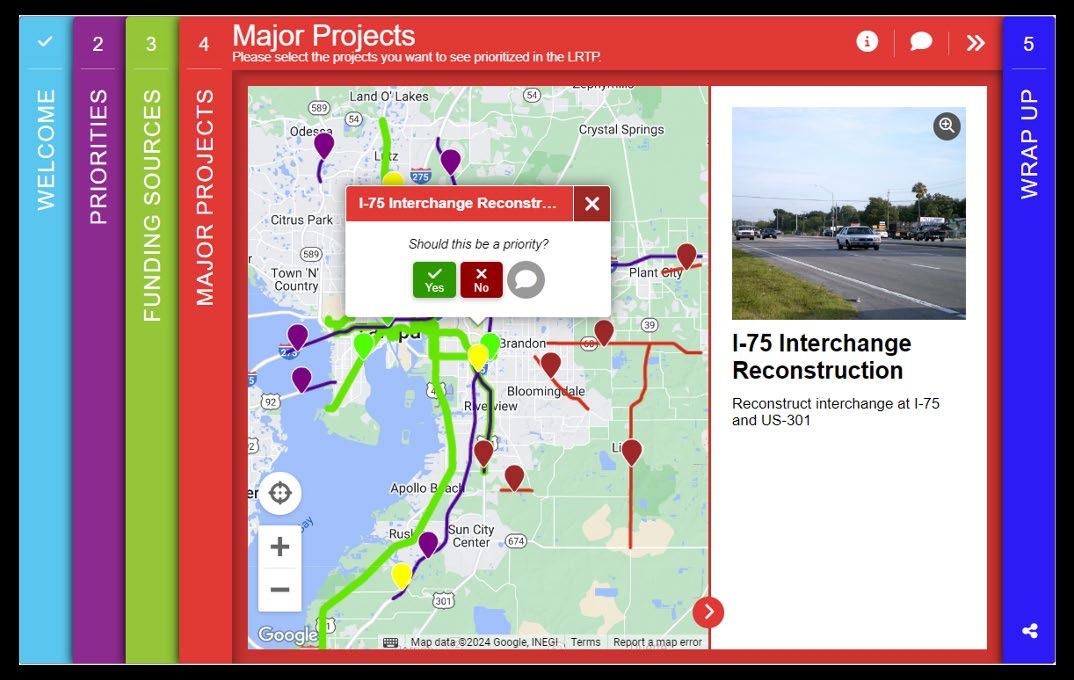
Access 2050 Hillsborough TPO 57
Figure 6-4 Survey Screen 4
6.1.4 Survey Screen 5: Wrap Up and Demographic Questions
Page 5, the final page of the survey, allowed respondents the option to give anonymous, nonidentifiable demographic and locational information. This page also indicated that respondents could participate in prize drawings, which required an email address to be entered. Links were available to the Access 2050 website and to a list of project partners. No responses were required on this page. The following demographic and locational information was requested on this page.
Home Zip Code
Work/school Zip Code
Age
Race/Ethnicity
Gender
Annual Household Income
Employment Status
Email Address
This information was requested solely for data analysis purposes. Zip codes will be used to identify trends in survey responses based on geographic areas. Demographic information will be used to identify trends in survey responses based on demographic groups.

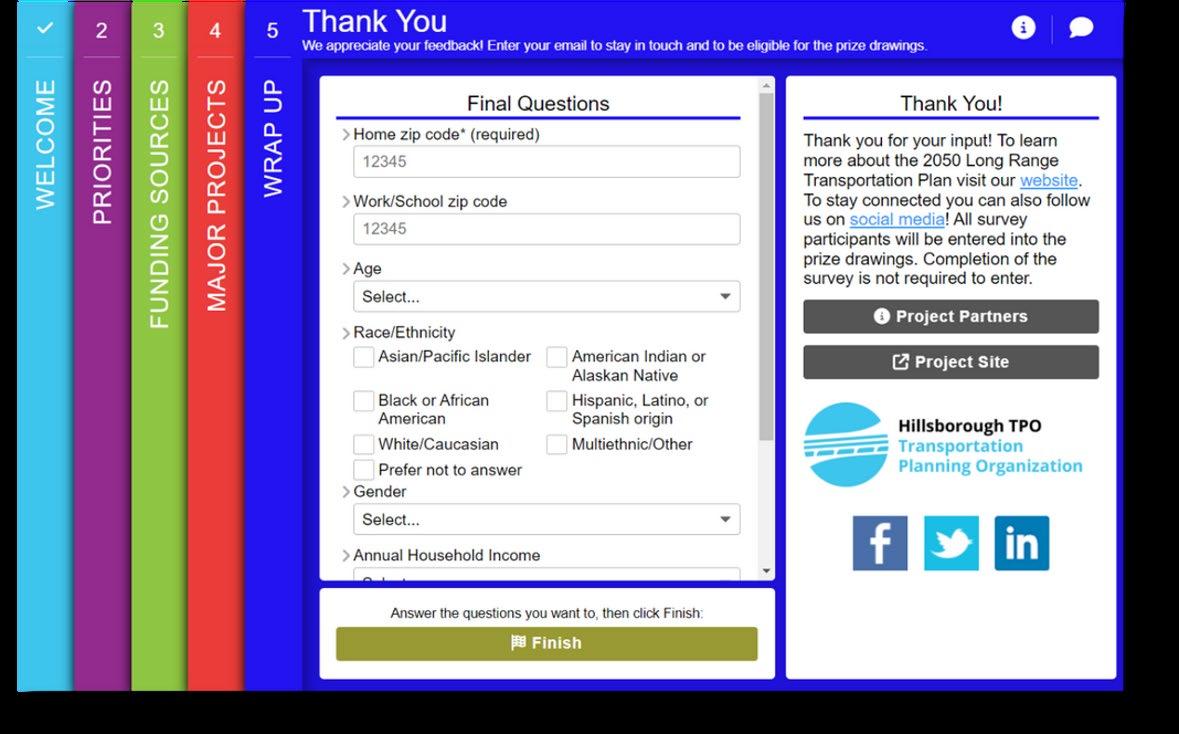
Access 2050 Hillsborough TPO 58
Figure 6-5 Survey Screen 5
6.2 Survey Results
The survey opened on January 30, 2024 and closed to the public on April 15, 2024. The following survey data was collected from MetroQuest, the website that hosted the survey, on April 16, 2024 to ensure all responses were recorded. MetroQuest hosted 2 separate surveys, one in English and one in Spanish. The following information includes data from both surveys.
6.2.1 Cumulative Survey Data
Table 6-1 summarizes the cumulative data from both the Spanish and English surveys. Over 99% of respondents used the English survey. There were 4,635 total participants out of a total of 40,074 visits to the survey website. MetroQuest defines participants as visitors who submitted data, while visits are from those who visited the survey website but did not submit any data. This gives an overall participation rate of 11.57%.
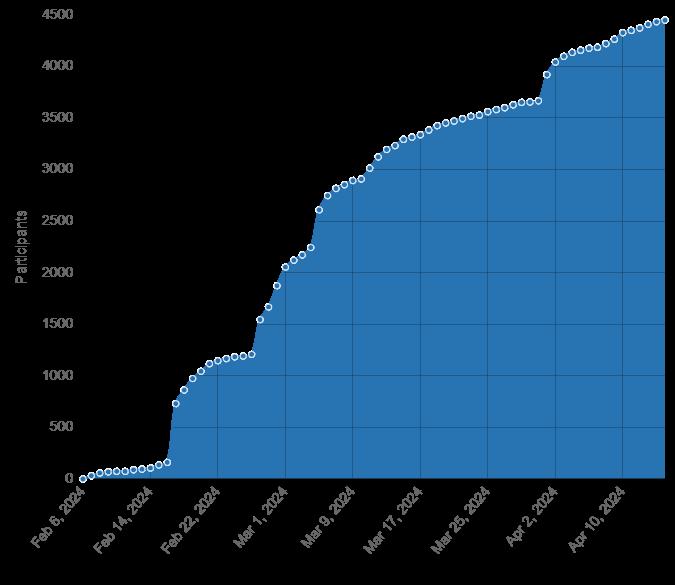
Access 2050 Hillsborough TPO 59
Data Point English Survey Spanish Survey Combined Total Total Participants 4,609 26 4,635 Total Visits 39,954 120 40,074 Participation Rate 11.53% 21 67% 11.57% Total Data Points 148,782 570 149,352 Total Comments 2,137 6 2,143
Table 6-1 Cumulative Survey Data
Figure 6-6 shows the cumulative survey responses by day
Figure 6-6 Cumulative Daily Responses
Table 6-2 shows the total number of responses received by screen. The survey questions were presented on screens 2, 3, and 4 of the survey. Screen 1 was an introduction to the survey with some instructions and screen 5 asked for optional demographic and locational information.
Table 6-2 Responses and Comments by Question
Survey Question
Screen 2: What is important to you?
Screen 3: How should we pay for transportation?
Rankings 91 Rankings
Rankings 412 Comments 6 Comments 418 Comments
Ratings 196 Ratings
Ratings 791 Comments 0 Comments 791 Comments
Screen 4: Major Projects 49,211 Answers 145 Answers 49,356 Answers 927 Comments 0 Comments 927 Comments
Figure 6-7 shows the responses based on whether a web browser or mobile phone was used to submit survey data. The calculated numbers of responses on the web and via mobile are summarized in Table 6-3.
Table 6-3 Number and Percent of Responses by Platform
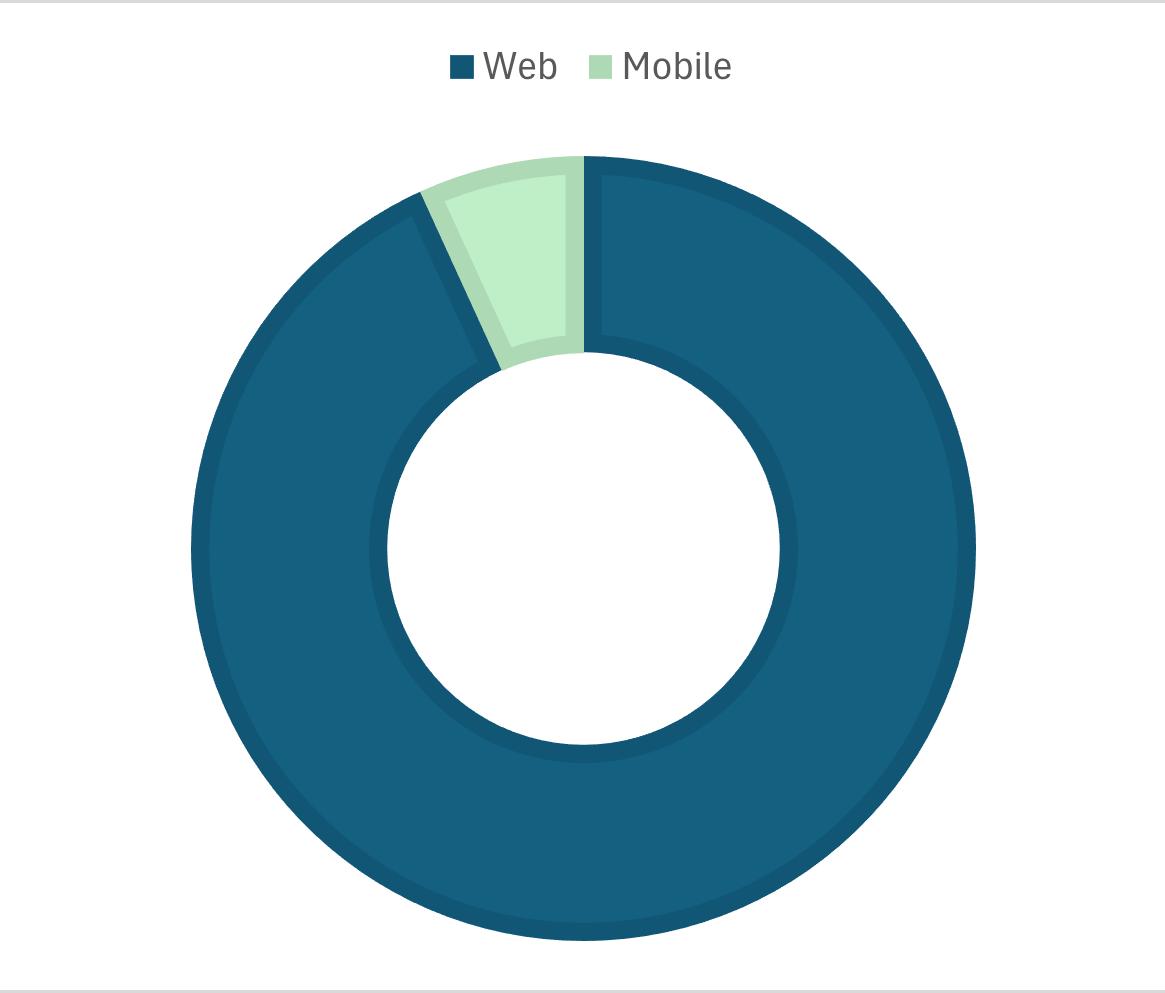
6.2.2
Survey
Screen 2: Priorities
On screen 2 of the survey, respondents were given seven potential transportation priorities and were asked to choose five priorities and rank them in order of importance from 1-5, with one indicating their highest priority. Table 6-4 shows the number of respondents who ranked each
Access 2050 Hillsborough TPO 60
English Survey Spanish Survey Combined Total
19,037
19,128
56,671
56,475
Platform English Survey Spanish Survey Overall Web 4,303 Surveys 19 Surveys 4,322 (93%) Mobile 315 Surveys 7 Surveys 322 (7%)
Figure 6-7 Platform Breakdown
priority at each level and the average ranking for each priority. Priorities are listed in order from highest priority to lowest priority. It should be noted that the lower the number of the average rank, the higher a priority it was for survey respondents.
Access 2050 Hillsborough TPO 61
Table
Rankings for Each Transportation Priority Ranked 1 (top) Ranked 2 Ranked 3 Ranked 4 Ranked 5 Average Rank Newer, faster transit 1024 558 423 435 560 2.65 Reduce Traffic Jams 805 830 700 563 468 2.72 Maintain, Repair Roads and Bridges 736 686 812 735 515 2.89 Extend or add lanes to major roads 352 503 499 805 375 3.14 Reduce Crashes 471 506 619 729 591 3.16 Improve existing bus service 243 429 343 337 471 3.20 Build more trails and side paths 312 380 451 466 696 3.37
6-4
Figure 6-8 visualizes the distribution of how respondents prioritized each of the five transportation priorities.
Figure 6-8 Distribution of rankings for each given priority
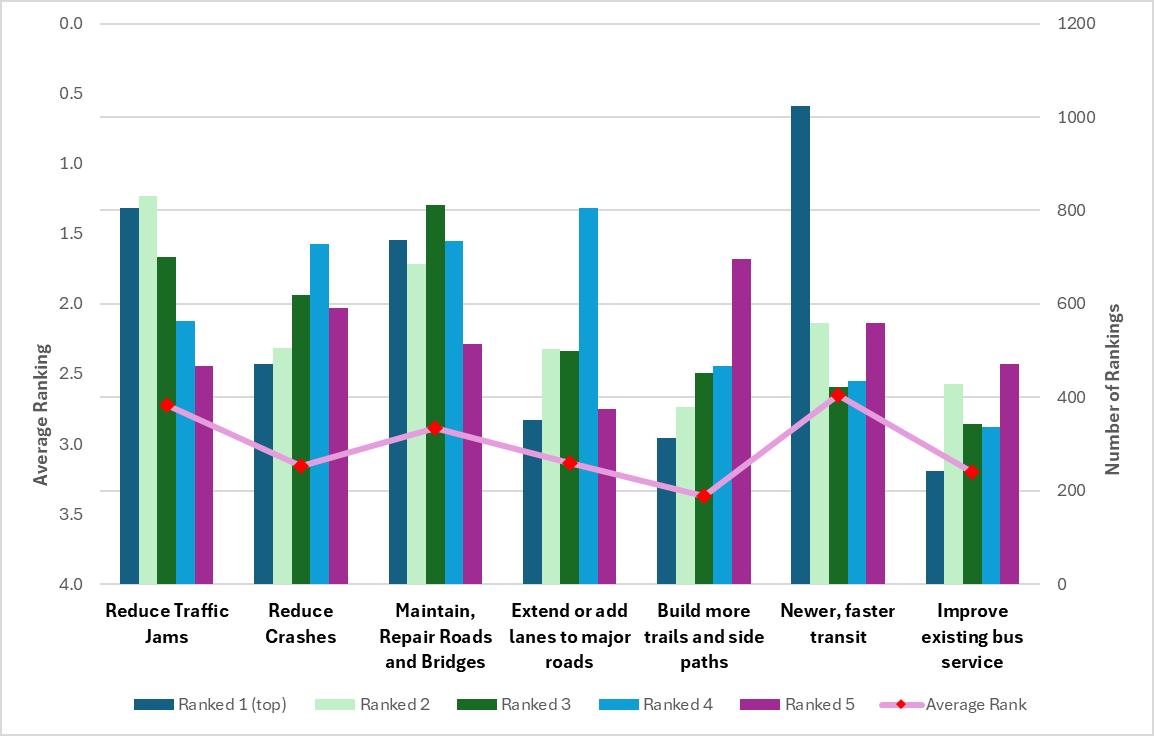
6.2.3 Survey Screen 3: Funding Sources
Screen 3 asked respondents to give approval (thumbs up) or disapproval (thumbs down) on options for several funding sources. The following data shows how respondents indicated their support, or lack thereof, of the given funding sources. All averages calculated in this section use a “thumbs up” as the number 1 and a “ thumbs down” as the number 2. Therefore, an average closer to 1 indicates more people supported the funding scenario. An average closer to 2 indicates fewer people supported the scenario.
6.2.3.1 Community Investment Tax
The following data from both the English and Spanish surveys show the responses to the funding scenarios that include the Community Investment Tax. Table 6-5 summarizes these responses.
“Not seeing the impact of this tax on the condition of our roads. Let it expire.”
Access 2050 Hillsborough TPO 62
“Out of all the taxes, this one has such a large local impact in a positive way. How can you oppose that especially when its consumption based.”
Table 6-5 Responses to Community Investment Tax Scenarios
The scenario that received the most “yes” responses was to renew the existing half- cent tax. Renewing the tax and increasing it to one cent received slightly more “yes” than “no” votes, while allowing the existing half-cent tax to expire received far more “no” votes. Figure 6-9 visualizes the results.
Access 2050 Hillsborough TPO 63
Yes % Yes No % No Average (Y=1; N=2) Allow existing half-cent tax to expire 812 23.3% 2678 76.7% 1.77 Renew existing half-cent tax 2932 77.7% 840 22.3% 1.22 Renew tax and increase to one cent 1893 52.1% 1737 47.9% 1.48
23.3% 77.7% 52.1% 76.7% 22.3% 47.9% ALLOW EXISTING HALFCENT TAX TO EXPIRE RENEW EXISTING HALFCENT TAX RENEW TAX AND INCREASE TO ONE - CENT
Figure 6-9 Responses to Community Investment Tax Scenarios
Percent Yes Percent No
6.2.3.2 Gas Tax
The following data from both the English and Spanish surveys show the responses to the funding scenarios that include the Gas Tax. Table 6-6 summarizes these responses.
Table 6-6 Responses to Gas Tax Scenarios
The scenario that received the most “yes” responses was to maintain the gas tax at 7 cents/gallon. Both allowing the gas tax to expire and increasing the gas tax received notably more “no” votes than “yes” votes. Figure 6-10 shows the distribution of votes on the gas tax scenarios.
Figure 6-10 Responses to Gas Tax Scenarios
6.2.3.3
Transit Service Property Tax
The following data from both the English and Spanish surveys show the responses to the funding scenarios that include the Transit Service Property Tax. Table 6-7 summarizes these responses.
Access 2050 Hillsborough TPO 64
Yes % Yes No % No Average (Y=1; N=2) Allow existing 7-cent/gal tax to expire 724 22.8% 2449 77.2% 1.77 Maintain tax at 7-cents/gal 2795 79.5% 721 20.5% 1.21 Renew and increase to 12cents/gal 938 29.3% 2260 70.7% 1.71
22.8% 79.5% 29.3% 77.2% 20.5% 70.7% ALLOW EXISTING 7CENT/GAL TAX TO EXPIRE MAINTAIN TAX AT 7CENTS/GAL RENEW AND INCREASE TO 12 - CENTS/GAL
Percent Yes Percent No
“Transit costs should be borne by all users of transit, not by property owners. Increase sales tax or increase tolls instead.”
Table 6-7 Responses to Transit Service Property Tax Scenarios
The survey responses indicate that respondents are mostly in favor of keeping the current Transit Service Property Tax rate. About 2/3 of respondents were opposed to increasing the tax rate to $1/$1K assessed home value. Respondents were strongly opposed to increasing the tax rate to $3/$1K assessed home value. Figure 6-11 shows a graph of this information.
“I am OK with [increasing] even to a $10 property tax because we need these improvements, including, and more importantly than anything else, public transport so badly.”
Access 2050 Hillsborough TPO 65
Yes % Yes No % No Average (Y=1; N=2) Maintain tax at fifty-cents per $1K of assessed home value 2412 69.9% 1041 30.1% 1.30 Increase to $1 per $1K of assessed home value 1116 34.9% 2086 65.1% 1.65 Increase to $3 per $1K of assessed home value 480 15.4% 2629 84.6% 1.85
69.9% 34.9% 15.4% 30.1% 65.1% 84.6% MAINTAIN TAX AT FIFTYCENTS PER $1K OF ASSESSED HOME VALUE INCREASE TO $1 PER $1K OF ASSESSED HOME VALUE INCREASE TO $3 PER $1K OF ASSESSED HOME VALUE Percent Yes Percent No
Figure 6-11 Responses to Transit Service Property Tax Scenarios
6.2.3.4 Express Toll Lanes
The following data from both the English and Spanish surveys show the responses to the funding scenarios that include Express Toll Lanes. Table 6-8 summarizes these responses.
Table 6-8 Responses to Express Toll Lane Scenarios
Add new toll lanes on existing highways to manage congestion
While more people supported adding new toll lanes to existing highways, the overall responses were relatively evenly distributed. Fewer people were in favor of converting existing lanes to toll lanes, with 2/3 of respondents indicating disapproval of this scenario. There was support for keeping toll prices the same at all times, with over 2/3 of respondents indicating approval of this scenario. Finally, more respondents disapproved of increasing toll prices as traffic increases, with 2/3 of respondents indicating a lack of support for this scenario. Figure 6-12 shows the distribution of answers for each scenario.
Access 2050 Hillsborough TPO 66
Yes % Yes No % No Average (Y=1; N=2)
1869 56.5% 1439 43.5% 1.44 Convert existing lanes to toll lanes to manage congestion 1088 33.8% 2128 66.2% 1.66 Toll prices remain the same at all times 2327 70.3% 983 29.7% 1.30 Toll prices increase as traffic levels increase 1098 33.9% 2139 66.1% 1.66
56.5% 33.8% 70.3% 33.9% 43.5% 66.2% 29.7% 66.1% ADD NEW TOLL LANES ON EXISTING HIGHWAYS CONVERT EXISTING LANES TO TOLL LANES TOLL PRICES REMAIN THE SAME AT ALL TIMES TOLL PRICES INCREASE AS TRAFFIC LEVELS INCREASE Percent Yes Percent No
Figure 6-12 Responses to Express Toll Lane Scenarios
6.2.3.5 Other Funding Sources
The following data from both the English and Spanish surveys show the responses to the funding scenarios that include other funding sources. Table 6-9 summarizes these responses.
Table 6-9 Responses to Scenarios That Include Other Funding Scenarios
Respondents leaned toward disapproval of other funding sources to varying degrees, except for creating a fee for electric vehicles to use public charging stations, which had support of about 2/3 of respondents. Figure 6-13 shows the distribution of responses to questions regarding other funding sources.
Figure 6-13 Responses to Scenarios That Include Other Funding Scenarios
REPLACE GAS TAX WITH A FEE BASED ON MILEAGE DRIVEN
INCREASE THE EXISTING $48 DRIVER LICENSE FEE CREATE AN ADDITIONAL FEE TO USE RIDESHARE SERVICES
Percent Yes
Percent No
CREATE AN ELECTRIC VEHICLE FEE TO USE PUBLIC CHARGING STATIONS
Access 2050 Hillsborough TPO 67
Yes % Yes No % No Average (Y=1; N=2) Replace gas tax with a fee based on mileage driven 941 29.0% 2299 71.0% 1.71 Increase the existing $48 driver license fee 1244 38.0% 2033 62.0% 1.62 Create an additional fee to use rideshare services like Uber/Lyft 882 27.4% 2332 72.6% 1.73 Create an electric vehicle fee to use public charging stations 2186 65.7% 1140 34.3% 1.34
29.0% 38.0% 27.4% 65.7% 71.0% 62.0% 72.6% 34.3%
6.2.4 Survey Screen 4: Major Projects
On screen 4, respondents were asked to give a “thumbs up” or “thumbs down” on 23 proposed major projects. These projects included road widenings, improved or additional transit, new interstate interchanges, managed lanes, and reconstruction projects. The tables and figures in this section include data from both the Spanish and English surveys. The 23 projects can be grouped into the following categories:
Interchange Projects
Transit Projects
Widening Projects
6.2.4.1 Interchange Projects
Managed Lane Projects
Other Major Projects
There were four projects that proposed new interstate interchanges or reconstruction of existing ones. These include:
New I-75 Interchange near Harney Rd.
New I-75 Interchange near Ft. Hamer
New I-275 Interchange near US-41
I-75 Interchange Reconstruction at US-301
Table 6-10 shows the number of votes and percentages of respondents in favor of and opposed to the proposed projects
Table 6-10 Number and Percentage of Yes and No Votes on Interchange Projects
Overall, support for new interchanges was evenly split. For the I-75 interchanges, a new one near Harney Road was split almost evenly, while the one near Ft. Hamer received slightly more votes against a new interchange. A new interchange on I-275 near US-41 received 57.6% of votes in favor. Finally, the I-75 interchange reconstruction at US-301 received support from 64.4 % of respondents.
Reviewing comments on the proposed interchange projects, two contrasting themes emerged Many emphasized the need for improvements on our local interstates, while others pointed out that these projects rarely improve the transportation conditions they are meant to address, and often make them worse As a subcategory of this second theme, many indicated that, because these projects would just make things worse, that money should be spent elsewhere, particularly on transit or multimodal projects.
Figure 6-14 visualizes the percentage of votes in favor of and opposed to each proposed project in order from most in favor to least.
Access 2050 Hillsborough TPO 68
Interchange Projects Total Percent Yes No Yes No New I-75 Interchange near Harney Road 1017 997 50.5% 49.5% New I-275 Interchange near US-41 1200 882 57.6% 42.4% New I-75 Interchange near Ft. Hamer 953 1049 47.6% 52.4% I-75 Interchange Reconstruction at US-301 1400 780 64.2% 35.8%
Figure 6-14 Percent of Yes and No Votes on Interchange Projects
Percent Yes Percent No
6.2.4.2 Transit Projects
There were six projects that proposed new, improved, or extended transit services. These include:
Downtown Tampa, USF, Brandon Premium Transit
Regional Passenger Transit
USF to Brandon Bus Rapid Transit
E/W Metro Rapid
Streetcar Extension
CSX South Tampa Multimodal Corridor
Table 6-11 shows the number of votes in favor of and opposed to the proposed projects.
Table 6-11 Number and Percentage of Yes and No Votes on Transit Projects
All proposed transit projects received strong support from survey respondents. Tampa-USFBrandon Premium transit, Regional Passenger Transit, and the CSX South Tampa Multimodal Corridor all received support from ¾ or more of respondents. An extension of the streetcar, which currently runs from downtown Tampa to the Ybor City neighborhood, received support from 72.3%
Access 2050 Hillsborough TPO 69
Transit Projects Total Percent Yes No Yes No Downtown Tampa, USF, Brandon Premium Transit 1580 501 75.9% 24.1% Regional Passenger Transit 1568 514 75.3% 24.7% USF to Brandon Bus Rapid Transit 1301 640 67.0% 33.0% E/W Metro Rapid 1462 624 70.1% 29.9% Streetcar Extension 1639 616 72.7% 27.3% CSX South Tampa Multimodal Corridor 1607 527 75.3% 24.7%
64.2% 57.6% 50.5% 47.6% 35.8% 42.4% 49.5% 52.4% I - 75 RECONSTRUCTION AT US - 301
275
US - 41
NEW
I -
NEAR
NEW I - 75 NEAR HARNEY ROAD
NEW I - 75 NEAR FT. HAMER
of respondents. Finally, the E/W Metro Rapid Bus Service, which would connect communities from the Westshore/Airport area to Temple Terrace, and the USF to Brandon Bus Rapid Transit (BRT) option both received more than 2/3 support from respondents.
Comments on these projects gave specific ideas on these proposed projects and how they might be best utilized, emphasizing that all major activity nodes in the Tampa Bay region should be connected to each other. Many comments simply stated that regional transit is needed across the Tampa-St. Pete-Clearwater metro area Many commenters emphasized the need for rail over BRT as a means of getting cars off roads and connecting suburban areas to Downtown Tampa or other major employment centers. Finally, while most comments were supportive, there were comments that were unsupportive of specific proposed projects and transit in general, with many saying that it is a waste of money or that it wouldn’t be used.
Figure 6-15 visualizes the percentage of votes in favor of and opposed to each proposed project in order of most in favor to least.
REGIONAL PASSENGER TRANSIT
6.2.4.3 Widening Projects
CSX SOUTH TAMPA MULTIMODAL CORRIDOR
STREETCAR EXTENSION E/W METRO RAPID USF TO BRANDON BUS RAPID TRANSIT
Percent Yes Percent No
There were seven projects that proposed road widening in seven locations around Hillsborough County. These include:
SR-60 from Valrico to Polk County
CR-39
Lithia Pinecrest
Balm Road
US-92 from Park Rd. to Polk County
I-275
Access 2050 Hillsborough TPO 70
Figure 6-15 Percent of Yes and No Votes on Transit Projects
75.9% 75.3% 75.3% 72.7% 70.1% 67.0% 24.1% 24.7% 24.7% 27.3% 29.9% 33.0% DOWNTOWN
PREMIUM
TAMPA, USF, BRANDON
TRANSIT
Table 6-12 shows the number of votes in favor of and opposed to the proposed projects.
Table 6-12 Number and Percentage of Yes and No Votes on Widening Projects
Respondents tended toward disapproval of road widening projects, with the notable exception of Interstate 275, which received a 61.4% approval rating and the US-301 extension which received support from 62.4% of respondents. The US 301 extension received support from more than 3/5 of respondents. However, in the comments on this proposed project, many people asserted that this would not solve the issue and would negatively impact businesses and residents along the US 301 corridor in Riverview. Finally, a common theme from the comments was that this money would be better spent improving public transit options along the US 301 corridor.
Widening SR-60 from Valrico to the Polk County line and widening Lithia Pinecrest Rd. were both evenly split The remaining projects received significantly more “no” votes than “yes” votes.
Figure 6-16 visualizes the percentage of votes in favor of and opposed to each proposed project in order from most in favor to least.
Access 2050 Hillsborough TPO 71
Widening Projects Total Percent Yes No Yes No US-301 Elevated Extension 1372 826 62.4% 37.6% I-275 1351 848 61.4% 38.6% SR-60 1119 1051 51.6% 48.4% Lithia Pinecrest Road 1093 1045 51.1% 48.9% US-92 823 1114 42.5% 57.5% Balm Road 798 1253 38.9% 61.1% CR-39 794 1298 38.0% 62.0%
Figure 6-16 Percent of Yes and No Votes on Widening Projects
Yes Percent No
6.2.4.4 Managed Lane Projects
There were four projects that proposed managed lanes on I-75, I-4, and I-275. These include:
New I-75 North Managed Lanes
New I-75 South Managed Lanes
New I-275 Managed Lanes
I-4 Managed Lanes
Gandy Bridge
Suncoast Parkway Widening
Table 6-13 shows the number of votes in favor of and opposed to the proposed projects
Table 6-13 Number and Percentage of Yes and No Votes on Managed Lane Projects
Access 2050 Hillsborough TPO 72
Managed Lane Projects Total Percent Yes No Yes No I-4 1746 656 72.7% 27.3% I-275 1644 782 67.8% 32.2% Gandy Bridge 1369 915 59.9% 40.1% I-75 South 1244 911 57.7% 42.3% I-75 North 1214 954 56.0% 44.0% Suncoast Parkway Widening 736 1398 34.5% 65.5% 62.4% 61.4% 51.6% 51.1% 42.5% 38.9% 38.0% 37.6% 38.6% 48.4% 48.9% 57.5% 61.1% 62.0% US - 301 ELEVATED EXTENSION I - 275 SR - 60 LITHIA PINECREST ROAD US - 92 BALM ROAD CR - 39
Percent
Managed lane projects received overall support from survey respondents. Managed lanes on I-4 received support from almost ¾ of responses. Managed lanes on northern I-75 received the least support but were still supported in 56% of all responses. Suncoast Parkway widening received the greatest proportion of “no” votes at 65.5%. Those in favor of widening roads cited frequent congestion on local interstates while those against widening cited many instances where widening did not help the problem of congestion, and often made the problem worse in the long term.
While a few comments on these projects supported toll lanes, many comments were against tolls, asserting that tolls don’t reduce congestion and that they contribute to urban sprawl. Additionally, many commenters said they were okay with toll lanes, but not if it meant highway widening ; only if existing lanes were converted. Finally, a significant number of comments indicated that better mass transit, particularly in the median of existing interstates, would be a more effective way of reducing congestion.
Figure 6-17 visualizes the percentage of votes in favor of and opposed to each proposed project in order from most in favor to least.
Percent Yes Percent No
Access 2050 Hillsborough TPO 73
72.7% 67.8% 59.9% 57.7% 56.0% 34.5% 27.3% 32.2% 40.1% 42.3% 44.0% 65.5% I - 4 I - 275 GANDY BRIDGE I - 75 SOUTH I - 75 NORTH SUNCOAST PARKWAY WIDENING
Figure 6-17 Percent of Yes and No Votes on Managed Lane Projects
6.2.5 Survey Screen 5: Wrap Up and Demographic Questions
Screen 5 asked respondents to voluntarily give non-identifiable demographic and locational information. The results of this section are summarized below. All of the tables in this section include a column titled “Percent of Identified”, which is a percentage of those who chose to identify the requested demographic information. All tables in this section also include a column titled “Percent of Total”, which gives the percentage out of all 4,635 survey respondents.
6.2.5.1
Zip Codes
2,879 (62.1%) respondents gave their home zip codes, 2,538 of which were located at least partially in Hillsborough County. 2,239 (48.3%) gave their work or school zip code, 1,954 of which are located at least partially in Hillsborough County. 341 respondents gave home zip codes outside of Hillsborough County, with most coming from around Florida and a few from out of state. 285 respondents gave work/school zip codes outside of Hillsborough County. Most were located in the counties surrounding Hillsborough, but a few were from the rest of Florida or out of state.
The distribution of home zip codes are shown in Figure 6-19 and work/school zip codes are shown in Figure 6-20. When examining these maps, it is important to remember that only 62.1% of respondents identified their home zip code and 48.3% identified their work/school zip code.
Access 2050 Hillsborough TPO 74
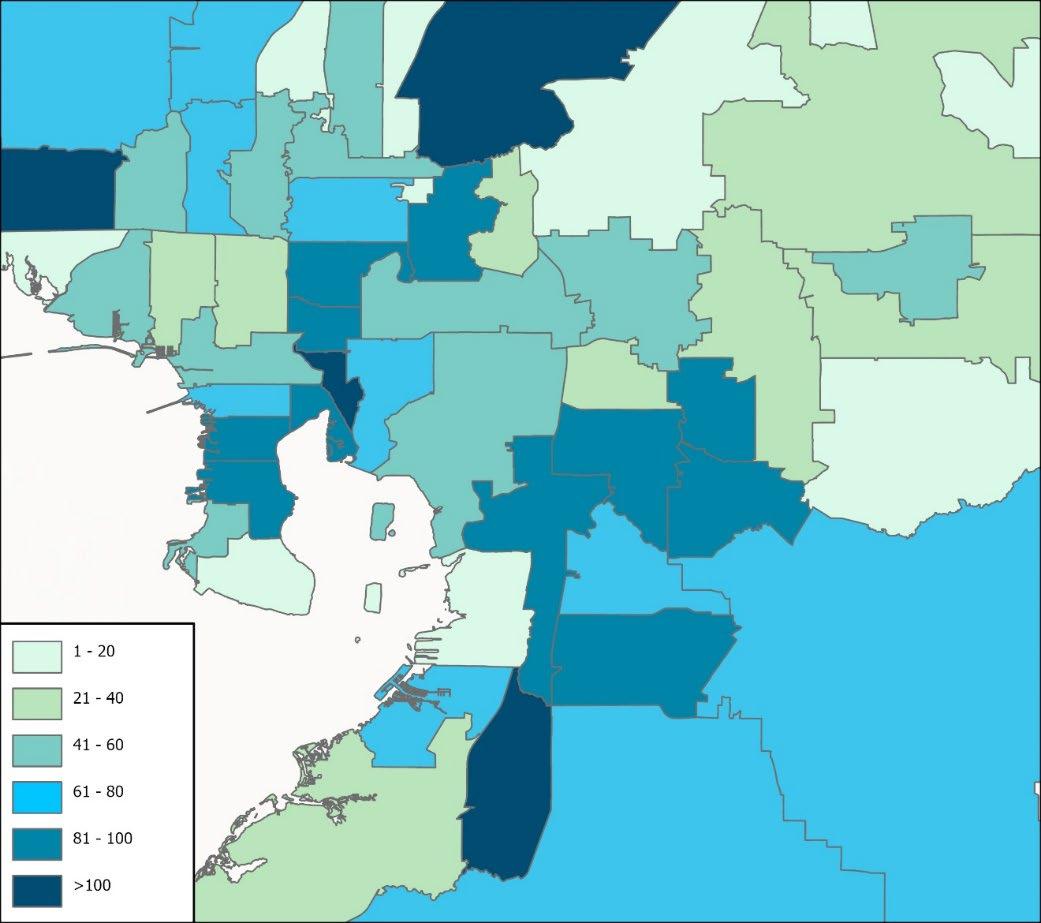
Access 2050 Hillsborough TPO 75
Figure 6-18 Responses per Home Zip Code
6-19 Responses per Work/School Zip Code
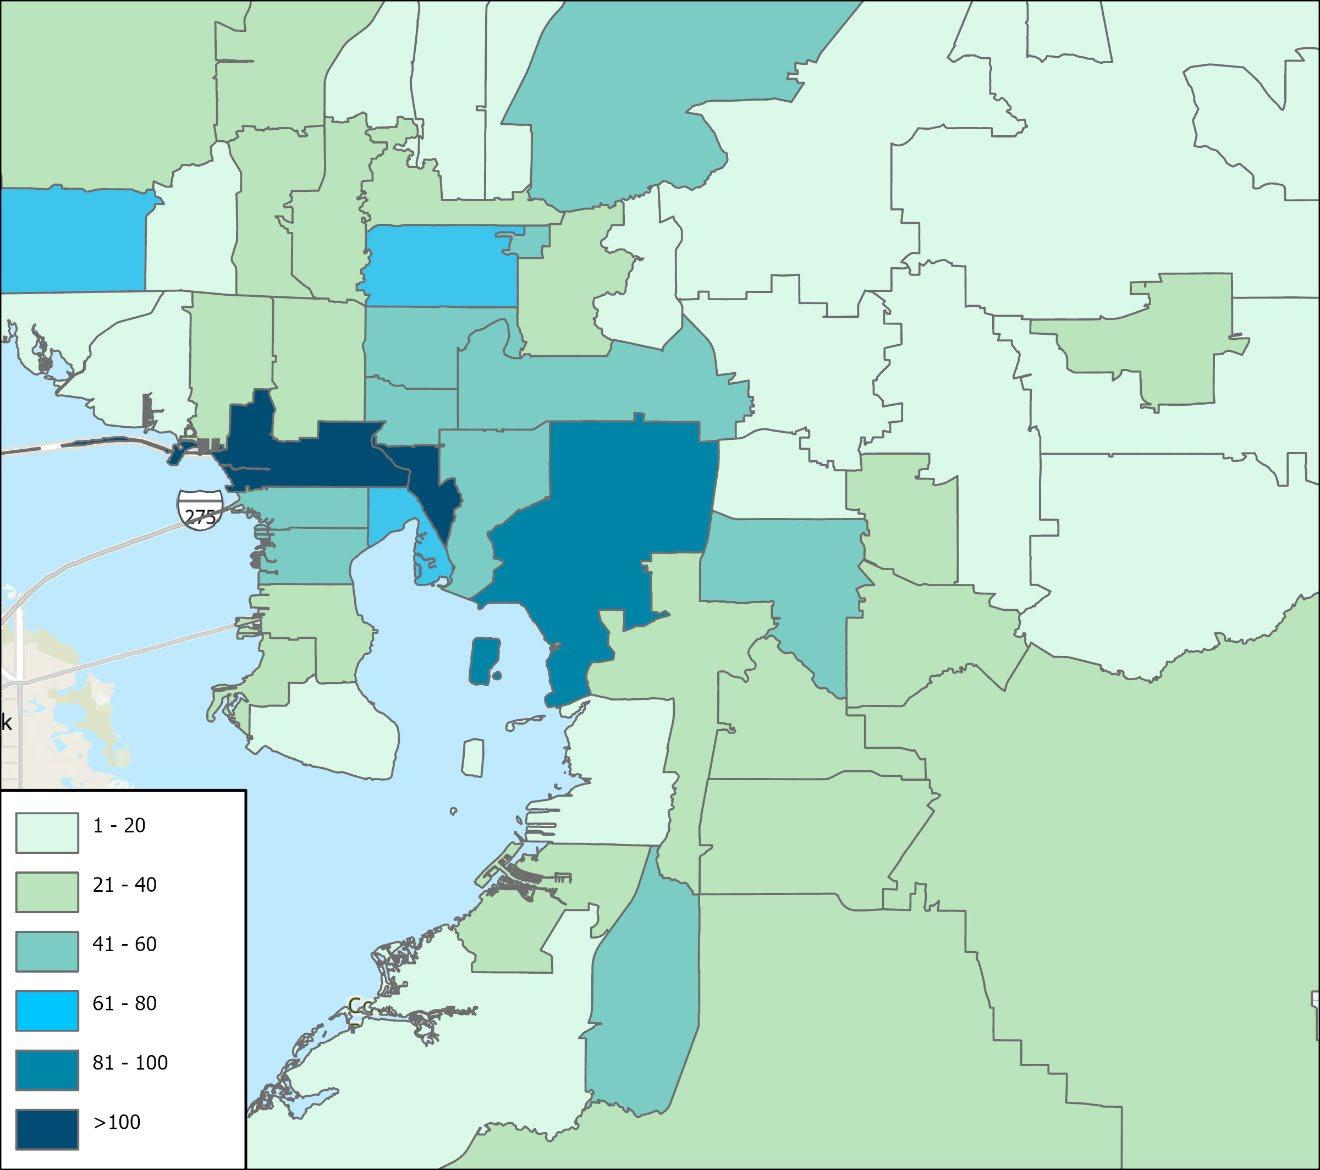
Access 2050 Hillsborough TPO 76
Figure
6.2.5.2 Age
2,880 (62.1%) respondents chose to disclose their age range. Table 6-15 shows the age distribution of those who elected to disclose their age range. The largest age group of respondents was those 45 to 64, followed by those over age 65, and then those between 35 and 44. The smallest age group was those under age 18. Figure 6-21 compares the reported age ranges from the survey with 2020 Census data for Hillsborough County.
Table 6-14 Respondents by Age
Answer
Figure 6-20 Age Ranges of Survey Respondents
18 - 24 25 - 34 35 - 44 45 - 64 65+
Survey Hillsborough
Access 2050 Hillsborough TPO 77
Total Percent of Identified Percent of Total <18 8 0.3% 0.2% 18-24 87 3.1% 1.9% 25-34 415 14.8% 9.0% 35-44 543 19.3% 11.7% 45-64 1,114 39.6% 24.0% 65+ 646 23.0% 13.9% No
1,822 N/A 39.3%
0.3% 3.1% 14.8% 19.3% 39.6% 23.0% 21.5% 9.4% 14.8% 14.2% 24.9% 15.1%
<18
6.2.5.3 Race/Ethnicity
A total of 3,001 (64.7%) respondents identified their race and/or ethnicity. The largest racial/ethnic group was Whites/Caucasians at 65%, with the smallest group being American Indian/Alaska Natives. Full results are listed in Table 6-16. Figure 6-22 compares the reported races/ethnicities from the survey with 2020 Census data for Hillsborough County.
Table 6-15 Race/Ethnicity of Survey Respondents
Figure 6-21 Race/Ethnicity of Survey Respondents
Survey Hillsborough
Access 2050 Hillsborough TPO 78
Race/Ethnicity Total Percent of Identified Percent of Total Asian/Pacific Islander 96 3.6% 2.1% American Indian or Alaskan Native 22 0.8% 0.5% Black or African American 213 7.9% 4.6% Hispanic, Latino, or Spanish origin 334 12.4% 7.2% White/Caucasian 1,951 72.5% 42.1% Multiethnic/Other 74 2.8% 1.6% No Answer 1,945 N/A 41.9%
72.5% 7.9% 3.6% 3.6% 12.4% 2.8% 52.6% 16.3% 0.5% 4.9% 29.3% 26.5% WHITE BLACK AIAN AAPI HISPANIC/ LATINO OTHER/ MULTIRACIAL
6.2.5.4 Gender
2,830 (61.1%) respondents chose to identify their gender. Most identified as either male or female, with a very small number identifying as non-binary or “other”. Table 6-17 lists this data and Figure 6-23 shows the graph comparing survey responses by gender with 2020 Census data for Hillsborough County.
Table 6-16 Survey Responses by Gender
Figure 6-22 Survey Responses by Gender
Access 2050 Hillsborough TPO 79
Gender Total Percent of Identified Percent of Total Male 1,270 46.9% 27.4% Female 1,417 52 3% 30.6% Non-Binary 17 0.6% 0.4% Other 3 0.1% 0.1% No Answer 1,928 N/A 41.6%
46.9% 52.3% 0.6% 0.1% 49.3% 50.7% 0.0% 0.0% MALE FEMALE NON - BINARY OTHER Survey Hillsborough
6.2.5.5 Annual Household Income
2,246 (48.5%) respondents chose to disclose their annual household income range. The largest income group was those earning $100,000 to $199,999 per year. Earners in both the $55,000$99,000 and over $200,000 ranges were also well represented. Those earning less than $55,000 made up a little less than 20% of respondents. Table 6-18 lists this information and Figure 6-24 compares the reported income tiers from the survey with 2020 Census data for Hillsborough County.
Survey Hillsborough
Access 2050 Hillsborough TPO 80
Annual Household Income Total Percent of Identified Percent of Total $39,999 or less 212 9.4% 4.6% $40,000 to $54,999 223 9.9% 4.8% $55,000 to $99,999 590 26.3% 12.7% $100,000 to $199,999 762 33.9% 16.4% $200,000 or more 459 20.4% 9.9% No Answer 2,389 N/A 51.5%
Table 6-17 Survey Responses by Annual Household Income
9.4% 9.9% 26.3% 33.9% 20.4% 26.8% 10.6% 26.3% 25.0% 11.3% <$39,999 $40,000$54,999 $55,000$99,999 $100,000$199,999 >$200,000
Figure 6-23 Survey Responses by Annual Household Income
6.2.5.6 Employment Status
2,653 (57.2%) respondents chose to disclose their employment status. The largest group was those who were employed full-time. Retirees were also well represented. People who were employed part-time, those who are unemployed, and students made up small percentages of survey respondents. Table 6-19 lists this data and Figure 6-25 compares the reported employment statuses from the survey with 2020 Census data for Hillsborough County.
Table 6-18 Survey Responses by Employment Status
Access 2050 Hillsborough TPO 81
Employment Status Total Percent of Identified Percent of Total Employed Full-Time 1,789 67.4% 38.6% Employed Part-Time 153 5.8% 3.3% Currently Unemployed 68 2.6% 1.5% Retired 597 22.5% 12.9% Student 46 1.7% 1.0% No Answer 1,982 N/A 42.8%
73.2% 2.6% 22.5% 1.7% 66.1% 3.9% 20.4% 7.8% EMPLOYED (FT OR PT) UNEMPLOYED RETIRED STUDENT
Figure 6-24 Survey Responses by Employment Status
Survey Hillsborough
6.3
Public Comments and Trends
Upon reviewing the comments and numerical data from the public survey, several trends emerged. For the purposes of this report, these trends will be broken into two categories: transportation network and funding.
Comments and survey data regarding the state of the transportation network can be placed into the following categories:
Public Transit
Reducing Congestion
Road Widening
Reducing Crashes/Improving Safety
6.3.1 Public Transit
Improve Bicycle/Pedestrian Infrastructure
Concerns with Development Patterns
Maintenance of Existing Infrastructure
“I want to be able to get anywhere without needing a car. And I want to be able to do it safely without worrying about a car hitting me. The less crossways the better! And please no painted bike paths. Separate them with concrete or parked cars.”
Of all comments given in the survey, the need for significant improvements in Hillsborough County’s public transportation system was the most noted. Hundreds of comments across all screens in the survey indicated the need for improved public transportation and indicated that this was a missing piece in the overall transportation network. Comments asserted that improved transit would address many of our transportation issues in Hillsborough County and the surrounding region, including congestion and safety. Of all major projects proposed in the survey, these were the most supported by survey respondents and all transit projects received support by large margins. See subsection 6.2.4.2 for overall survey results on specific transit projects.
There were many specific public transit recommendations that were repeated throughout the comments. Regional rail was mentioned often. Commenters indicated the need for rail lines that connect the entire Tampa Bay Metro Area, with many asserting that rail connections were needed as far as Orlando. Within the Tampa Bay Metro Area, respondents indicated the need to connect major activity hubs, like the airport, University of South Florida, Brandon, Downtown Tampa, and South Hillsborough, using either Bus Rapid Transit or, more commonly, rail or monorail networks. Frequent comments pointed out that our highways and arterials often have large medians which could support the construction of elevated rail or monorail systems along major corridors.
“Introducing real, comprehensive light rail to the area would be revolutionary. Major corridors like Dale Mabry Hwy and Hillsborough Ave with a light rail line along them would help engage more people in public transit and allow for hybrid use of rail and bus lines to get from a park and ride close to home to, and around, downtown with ease. All without a car.”

Access 2050 Hillsborough TPO 82
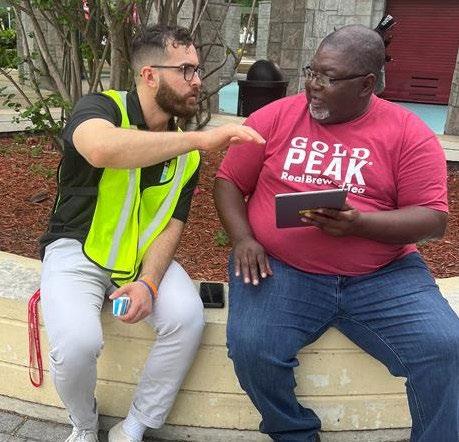
Another important trend regarding public transit was the need to make it more efficient, safer, and more comfortable. Many indicated that they would like to use transit, but that the frequency is too low to make it a truly viable option. Others indicated that they would be more likely to use transit if it was cleaner and safer.
It should be noted that, when asked about the Transit Service Property Tax (see subsection 6.2.3.3), respondents overwhelmingly rejected increases to the tax, but were overwhelmingly in favor of keeping the tax at the current rate.
6.3.2 Reduce Congestion
Reducing congestion around the region was a top priority. Public transit was frequently cited as a method that could address this issue. Many comments also encouraged the use of transportation technologies that would make intersections flow more efficiently. Several comments also indicated that constructing elevated roads on top of existing roads could ease through traffic, particularly on regional highways for those who want to pass through the area without stopping.
6.3.3 Road Widening
Most comments regarding road widening were against the idea. Commenters frequently cited studies that show road widening does not address congestion issues in the long term. Additionally, many mentioned specific examples of road widening projects around the country that either did not fix the problem or made congestion worse in the long term.
“Please do not! The more you add lanes, the more cars are going to be on the road. Investments in public transit, not roads, is one of the surest ways to boost economic growth. It reduces travel times for all people, but especially low-income populations.”

Concerns were also raised that road widening projects would require residents to lose their homes and businesses to be forced out of their location. This possibility caused respondents to raise concerns about how widening projects would affect the character of local communities.
There were some comments that supported widening projects. Many of comments generally gave specific intersections or corridors where widening may help.
“Major roads need to grow with amount of traffic.”
Access 2050 Hillsborough TPO 83
Figure 6-25 TPO Staff Member Showing the Survey at Marion Transfer Center
6.3.4 Reduce Crashes
Numerical data and comments submitted by survey takers often emphasized the need to reduce crashes, with many comments asserting that this would be one method for reducing congestion Comments in this category were often focused on intersection improvements, as this is where many crashes occur. Frequent comments said that adding roundabouts at appropriate intersections would help reduce crashes or increase safety. Others encouraged adding red light cameras, especially on arterial roads with high speed limits. Finally, many comments emphasized the potential for modern transportation technologies to improve safety.
6.3.5 Improve Bicycle and Pedestrian Infrastructure

“Yes! Vision Zero supports this initiative, and we should reduce crashes as much as possible. Including Pedestrians & Bicycles.”


Commenters frequently recommended improvements to bicycle and pedestrian infrastructure. Firstly, this was recommended as a way to reduce congestion, particularly on short trips. Many commenters indicated that they would be more likely to take short trips on foot or bicycle if the infrastructure was more comprehensive. Several more indicated they would enjoy commuting via bicycle if improvements were made. The chief complaint in this area was that the current bicycle and pedestrian network is very disconnected, with sidewalks or bike lanes ending abruptly and not leading anywhere. If improvements in connectivity were made, many indicated they would be much more likely to use these modes of transportation. Also, several commenters indicated safety as a reason they don’t bike or walk. Protected bike lanes and walking paths were repeatedly recommended as methods for improving safety. It should be noted that, on screen 2, this improvement was ranked overall as the lowest priority.
6.3.6
Development Concerns
While not directly related to transportation, it is important to note that many comments discussed the effect that overdevelopment is having on our transportation network. Frequent comments brought up how large subdivisions are being constructed, particularly far out in the suburbs, which empty onto arterial roadways that are not able to handle the additional traffic and have no access to public transportation. Several comments recommended withholding approval for new
Access 2050 Hillsborough TPO 84
Figure 6-26 USF Student Ambassadors at UACDC Slow Roll Outreach Event
developments until the local transportation infrastructure is able to handle the increased demand. Many comments also suggested mixed-use, walkable developments to reduce the need for overall car dependence.
6.3.7 Transportation Infrastructure Maintenance
Many comments were made about the state of existing transportation infrastructure and the need for maintenance before new construction. Frequent comments mentioned potholes and mentioned specific areas with poor road conditions. These comments emphasized that we should not build new infrastructure that needs to be maintained until we are able to take care of the infrastructure we already have.
6.3.8 Provide Alternatives to Driving
The “It’s Time Hillsborough” summary indicates that 74% of survey respondents endorsed expansions of local and regional public transit. Many specific ideas were mentioned including a regional rail system, BRT lines, and a water ferry. Other statistics from this summary include 82% support for statewide rail service and 81% support for regional rail and bus expansion.
6.4 Comparison to 2045 LRTP Survey Results
As previously mentioned, the LRTP process is conducted every five years. The 2045 LRTP, entitled “It’s Time Tampa Bay,” had a regional survey that reached over 10,000 respondents, while its Hillsborough-focused survey, “It’s Time Hillsborough,” reached 5,219 participants during its survey window. Furthermore, the 2045 LRTP attended 34 events, 20 group presentations, and rode on 6 bus routes.
Even without the regional efforts and additional outreach support, Access 2050 reached far beyond its original goal with 4,635 participants. For the Access 2050 survey, the team attended 45 events, 11 group presentations, and rode 5 bus routes, exceeding the amount of outreach done within the previous LRTP.
The public survey conducted as part of Access 2050 showed clear trends about the public’s priorities for transportation improvements. To provide context to these results, the team reviewed the public survey results from the Hillsborough County 2045 LRTP. 9 The following priorities were listed in the summary of the 2045 outreach and compared to the priorities from the current public survey.
9 Hillsborough County 2045 LRTP
Access 2050 Hillsborough TPO 85
6.4.1
Reduce Congestion
In the 2045 LRTP, 75% of survey respondents ranked “reducing traffic jams” as their highest priority. The current Access 2050 survey ranked “reduce traffic jams” as the second highest priority after “newer, faster transit”. In the 2050 survey, 72.6% of respondents ranked this as one of their top priorities
6.4.2
Development Priorities
Three priorities from the 2045 LRTP focused on development patterns and how they affect the transportation network. The first was “strengthen downtowns”. The report mentions that this does not just apply to formal downtowns, like downtown Tampa, but rather focuses on activity nodes throughout the region. Respondents of the 2045 survey recommended developing these areas to be more walkable and accessible for multiple transportation modes. This was echoed in the 2050 survey where respondents mentioned several regional activity nodes that should be connected, including Downtown Tampa, Downtown St. Petersburg, Brandon, South Hillsborough, USF, and Tampa International Airport.
Respondents to the 2045 survey also recommended reinvesting in established neighborhoods and minimizing outward growth. This was echoed in the 2050 survey when many respondents pointed out how outward sprawl creates more traffic congestion and renders public transit unfeasible. This recommendation ties into the previous recommendation as many comments recommended focusing on mixed-use medium and high- density development in important activity nodes which would reduce congestion and make transit more feasible.
6.4.3
Focus on Bike/Walk Modes
73% of respondents from the 2045 survey ranked improved bicycle and pedestrian infrastructure as a top priority, emphasizing that a more well- connected bike/pedestrian network would give an alternative to driving that doesn’t currently exist. These recommendations were also emphasized in the Access 2050 survey, with many indicating that, because the bike/pedestrian network is so disconnected, walking or cycling is not a feasible alternative to driving. Further, many commenters said that they would prefer biking or walking on shorter trips, but the lack of connectedness of sidewalks, sidepaths, and bike lanes makes this an unsafe alternative. Finally, respondents from both surveys emphasized that an important reason they don’t use cycling or walking as a transportation mode is because it is not safe. Many comments recommended protected bike lanes and separated sidewalks and walking paths.
6.4.4
Use New Technology
The final priority listed in the 2045 LRTP summary was “use new technology”. While not a principal trend in the numerical data or comments, many comments from the Access 2050 survey recommended incorporating modern transportation technologies to reduce congestion and improve safety.
Access 2050 Hillsborough TPO 86
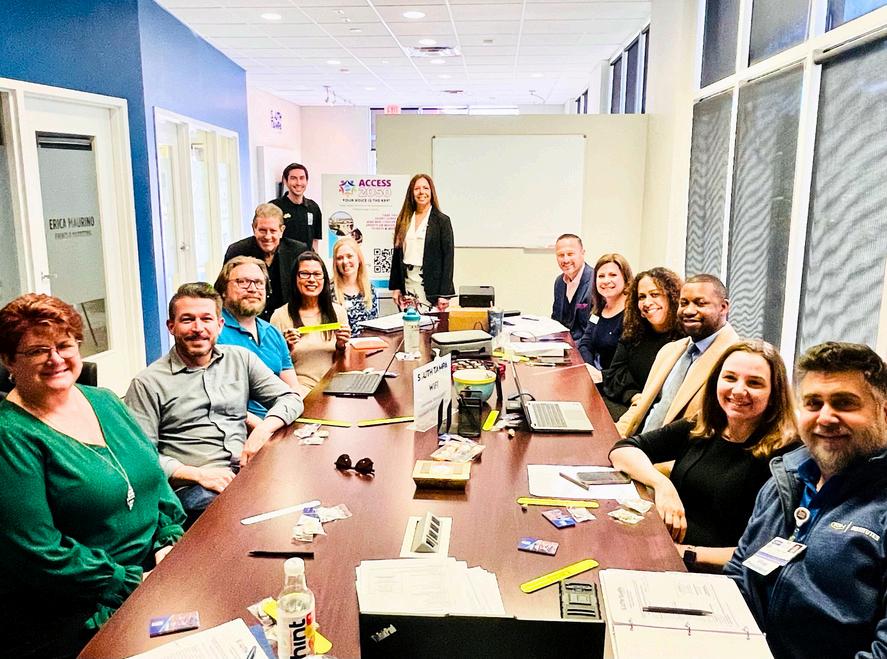
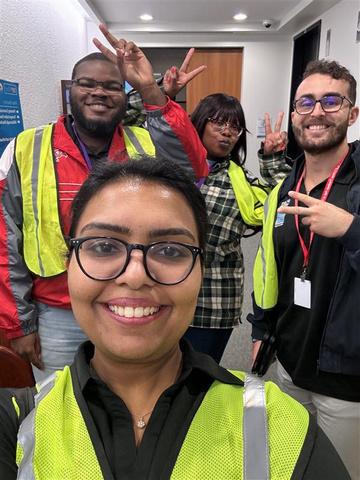
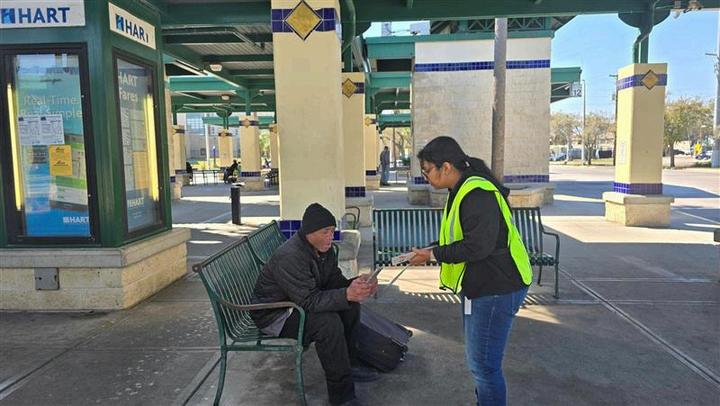

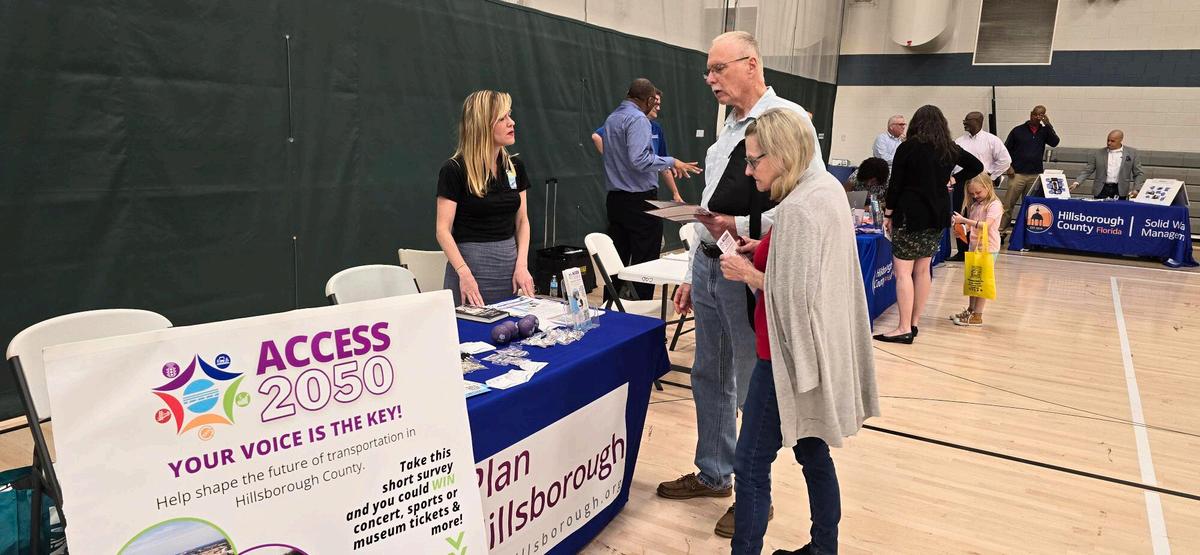
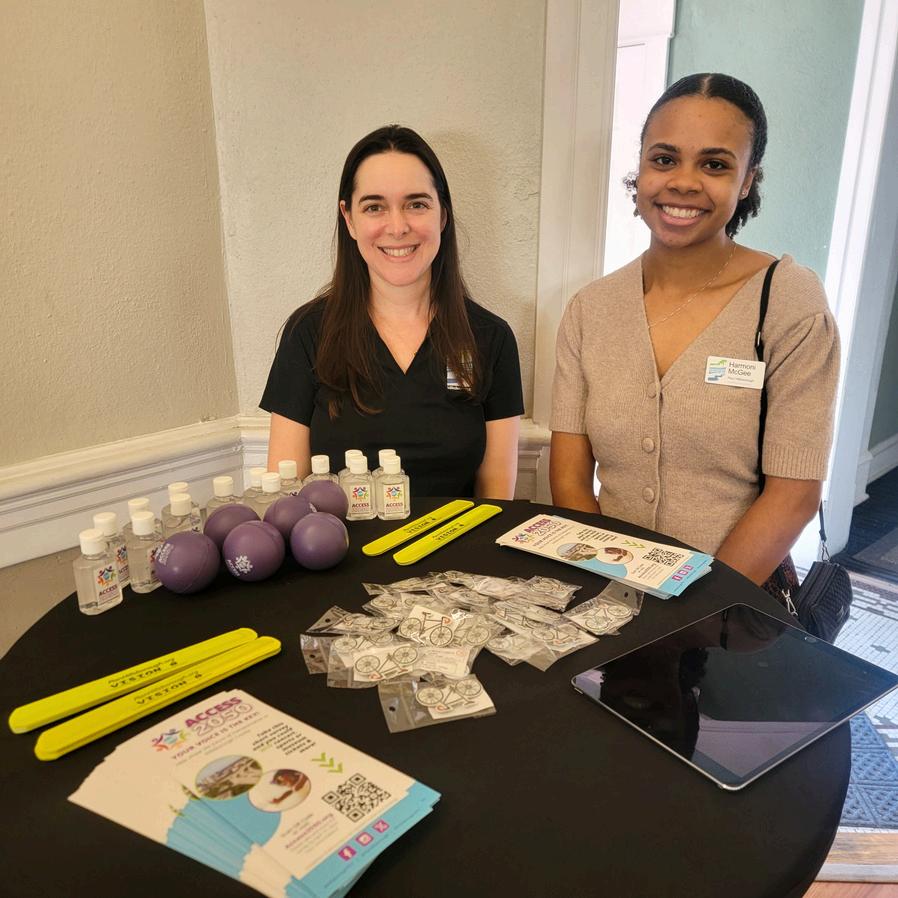
SUMMARY AND NEXT STEPS
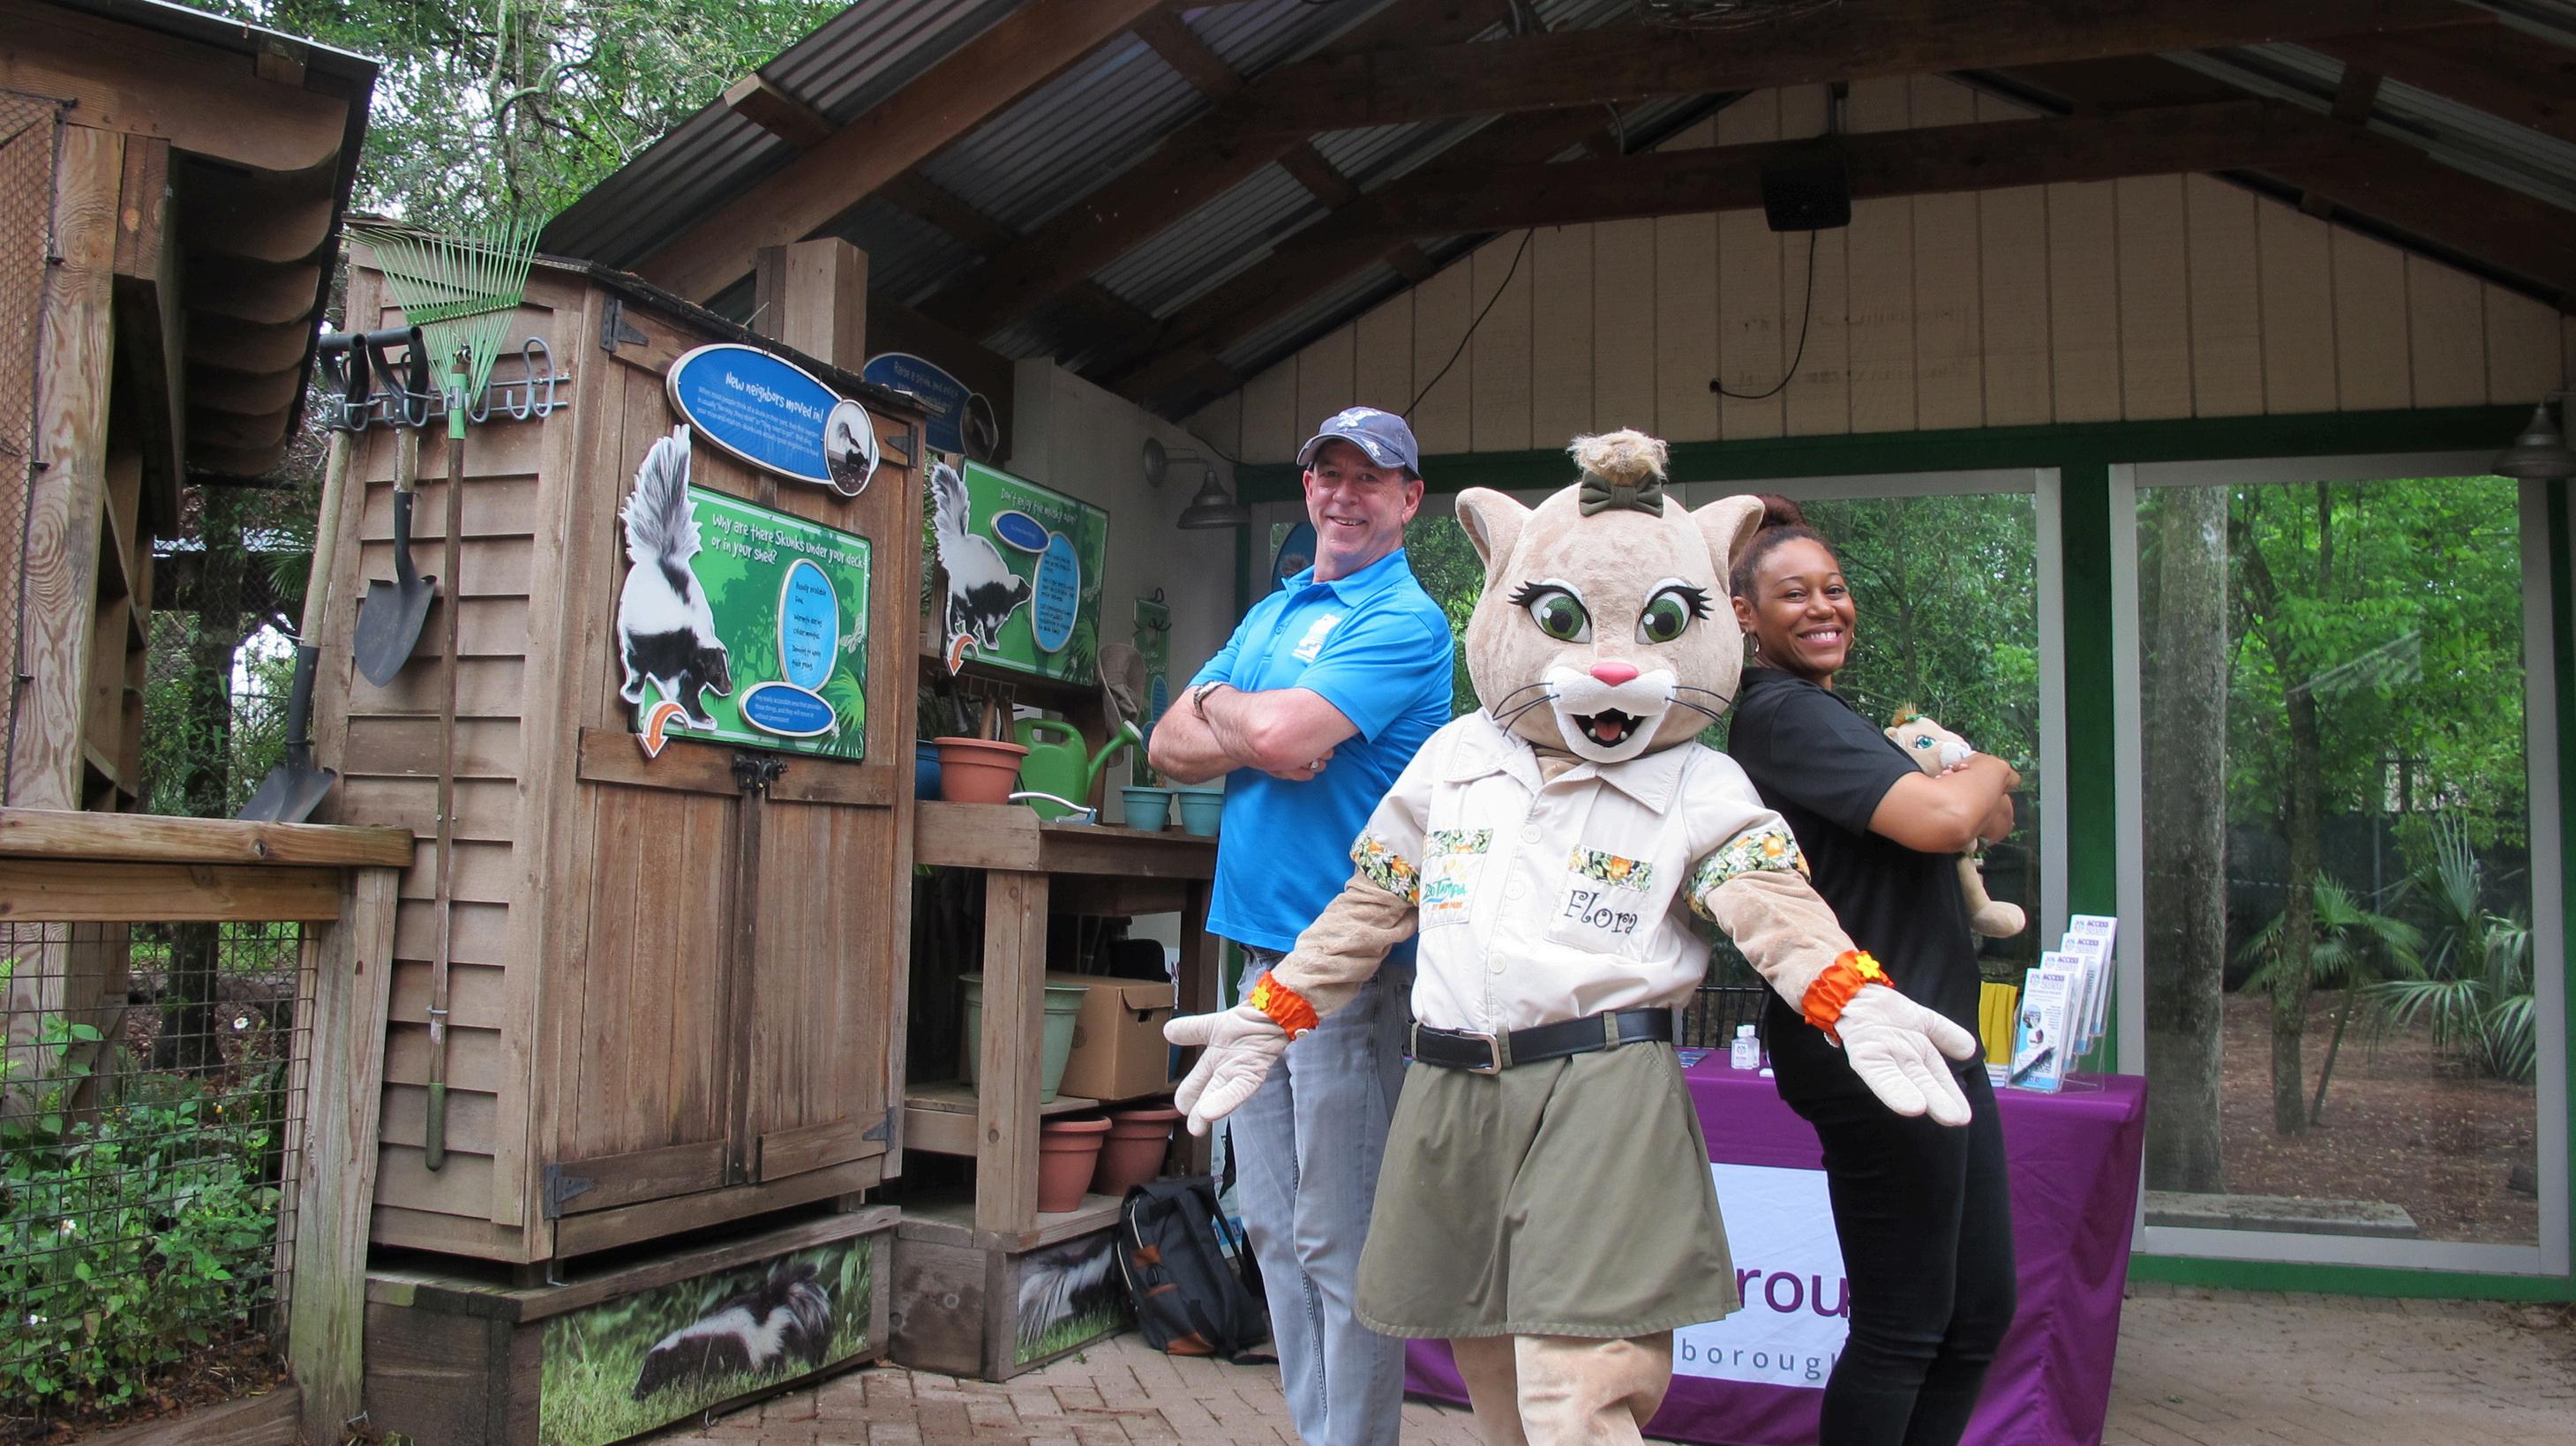
7
7 Summary and Next Steps
The concerted efforts of our team and esteemed community partners have been pivotal in fostering robust public engagement for Access 2050, thereby garnering a wealth of invaluable input to shape the future of transportation in Hillsborough County. Employing a multifaceted approach inclusive of community dialogues, stakeholder presentations, and a series of dynamic community/pop -up events, this strategic engagement strategy diligently cultivated an inclusive platform for dialogue and participation. Our comprehensive outreach campaign, characterized by strategic branding initiatives, targeted social media campaigns, vibrant community engagement events, and extensive coverage across various media platforms, has effectively engaged a diverse audience spanning the entirety of our region.
The deliberate and methodical outreach endeavors were undertaken with the explicit aim of reaching all voices within our community. Through meticulous planning and execution, we ensured that underrepresented groups were provided with equitable opportunities to contribute their perspectives. This inclusive approach was central to our commitment to capturing the diverse array of viewpoints that enrich our understanding of the community's transportation needs and priorities.
The outcome of these endeavors is reflected in the impressive participation of 4,635 individuals, a testament to the effectiveness of our outreach efforts in ensuring broad representation. Notably, nearly one quarter of participants identified "New, Faster Transit" as their top priority, followed closely by "Reducing Traffic Jams" and "Maintaining Roads and Bridges." These insights underscore the nuanced interplay of technological advancements, demographic shifts, environmental considerations, and the imperative for a forward-thinking transportation plan that addresses the multifaceted needs of our community.
In the subsequent phases of our process, the Hillsborough TPO will conduct a rigorous feasibility analysis based on the survey results, identifying priority projects that should be slated for future funding. This analysis, meticulously integrated into the final LRTP, will be complemented by additional stakeholder feedback, thereby ensuring that all public input directly informs our decision-making process. The finalized documentation will be made available for public review by September 2024 and formally adopted by the Hillsborough TPO Board on October 16, 2024, reaffirming our unwavering commitment to transparency, inclusivity, and responsiveness to the needs of our community.
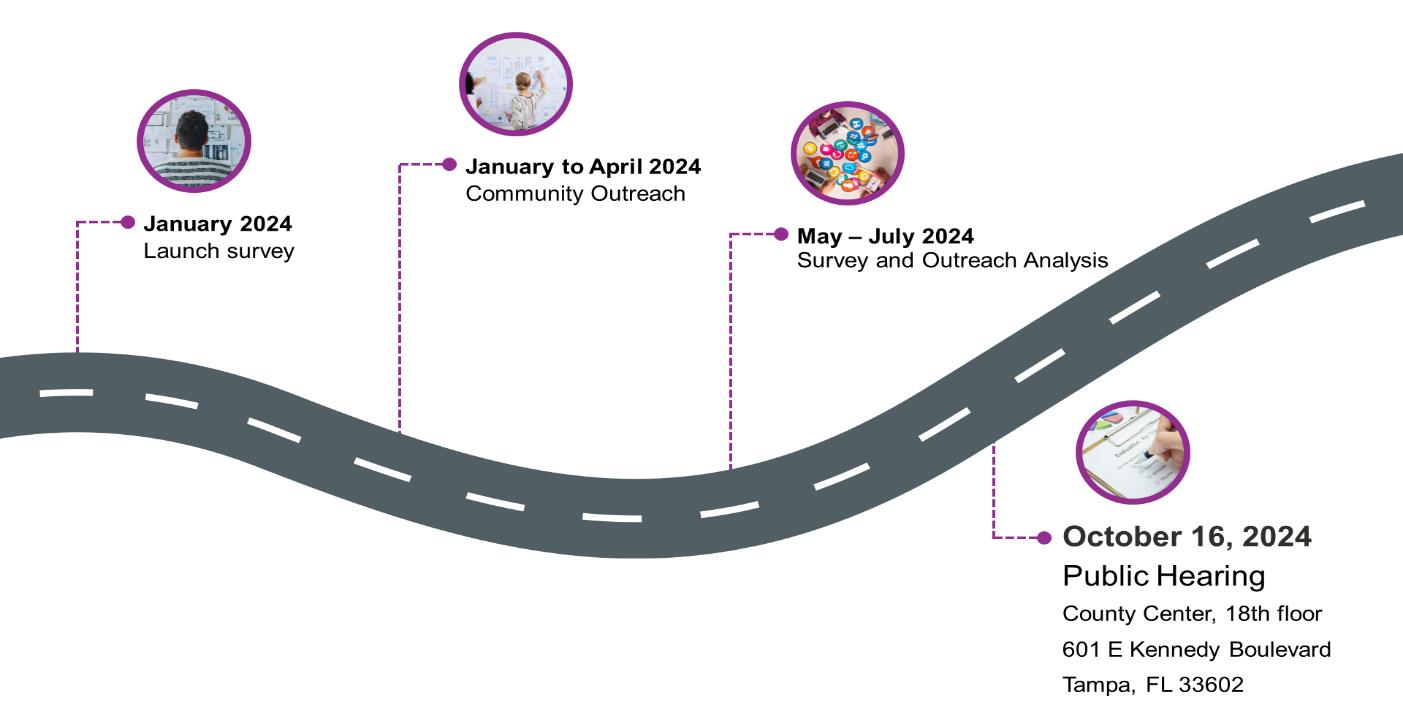
Access 2050 Hillsborough TPO 90

Prepared By

EXP U.S. Services Inc.
