If you want to buy this or Any Other Test Bank or Solution Manual contact us At.
VOCABULARY. Define each term or phrase in the space provided or on a separate sheet of paper.
1)
A finite quantity of resources that is available to meet society's needs.
2)
The rate of exchange of pairs of consumption goods or services to leave utility or satisfaction unchanged.
3)
The consumption bundle that maximizes total utility and is feasible as defined by the budget constraint.
4)
Reflects what a $1 today would have purchased in goods and services in a particular base period.
5)
The schedule that shows how many units of a good that the consumer will purchase at different income levels, all other factors constant.
6)
Marginal utility declines as more of a good or service is consumed during a specified period of time.
7)
Defined by the income available for consumption and the prices that a consumer faces.
SHORT ANSWER. Write the word or phrase that best completes each statement or answers the question. 8
A measure of the response of consumption of a good or service to changes in the price of another good or service. 8)
VOCABULARY. Define each term or phrase in the space provided or on a separate sheet of paper.
9)
Decrease (increase) in price of a product means the consumer can afford to buy more (less) of the product.
10)
The value of food expenditures contributed by firms beyond the farm gate.
11)
A graph of the locus of consumption bundles that provide a consumer a given level of satisfaction.
12)
Branch of economics that focuses on the economic actions of individuals or specific groups of individuals.
13)
A branch of economics that focuses on the broad aggregates, such as the growth of gross domestic product, the money
supply, the stability of prices, and the level of employment.
14)
The economic sacrifice of not doing something else or foregoing another opportunity.
15)
The level of output per unit of input.
16)
Goods for which consumption falls (rises) when income increases (decreases).
17)
As disposable income of a consumer increases, the percentage of income spent for food decreases if all other things remain constant.
18)
Shift in the demand curve caused generally by changes in the prices of complements or substitutes, income, and tastes and preferences.
19)
A mathematical or functional representation of the satisfaction a consumer derives from a consumption bundle.
20)
A measure of the relative response of consumption of a good or service to changes in price.
21)
Personal income after the payment of tax obligations.
22)
Substitution of a product for another because the price of the former has declined or increased.
23)
The assumption that all other factors that might affect demand are held constant during the time period.
24)
A measure of the relative response of demand to income changes.
SHORT ANSWER. Write the word or phrase that best completes each statement or answers the question. Using the graph, please fill in the blanks for the following questions.
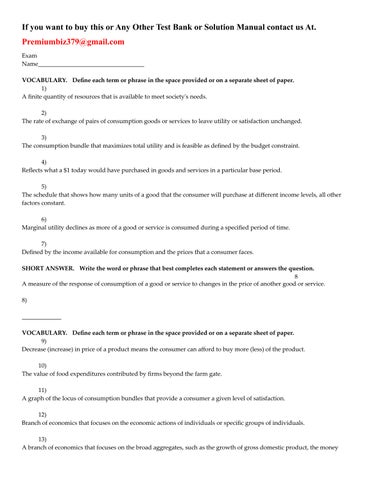
If the price of hamburgers is $1.25, what is size of the budget represented by the budget constraint BA?
What happened to cause the budget constraint to shift from line BA to line DB?
What happened to cause the budget constraint to shift from line BA to line BG?
Can we determine a demand schedule for tacos from this graph?
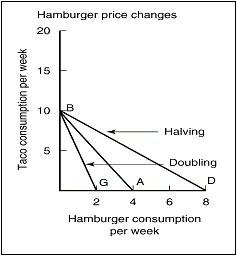
Given this graph, please fill in the blanks for the following questions. Point A on the graph was said to represent consumer equilibrium.
Point B does not represent consumer equilibrium because:
Point C does not represent consumer equilibrium because:
Point D does not represent consumer equilibrium because:
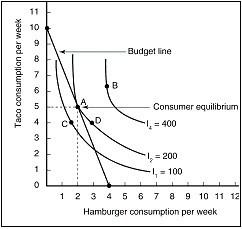
Given the graph depicted, please fill in the blanks for the following questions.
The overall elasticity of this demand curve can be categorized as ________.
An increase in the quantity coming onto this market will result in a(n) ________ in revenue to producers of this product.
This increase in quantity coming onto the market will result in a ________ the demand curve.
Use this data to fill in the blanks for the following questions.
The Dixie Chicken sells 1,500 Freddie Burger platters per month at $3.50 each. The own price elasticity for this platter is estimated to be -1.30.
If the Chicken reduces the price of the platter by 50 cents:
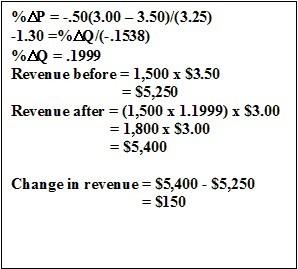
How many platters will the Chicken sell?
Use this data to fill in the blanks for the following questions. The own price elasticity of demand for rice was said to be -.1467 while the income elasticity for rice was said to be -.3664. Given this information, please complete the following blanks:
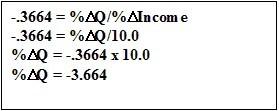
A 10 percent increase in income would cause the demand for rice to ________ by ________ percent.
Use this data to fill in the blanks for the following questions. The cross price elasticity for beef with respect to chicken is 0.0572. The cross price elasticity for chicken with respect to beef, however, is 0.2927.
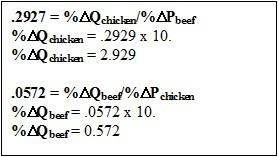
If the price of beef rose 10 percent, the demand for chicken would ________.
If the price of chicken rose by 10 percent the demand for beef would ________ by only ________ percent.
MULTIPLE CHOICE. Choose the one alternative that best completes the statement or answers the question. 4
Hill's Pet Nutrition, Inc. of Topeka, Kansas has three alternatives for manufacturing pet foods:
Alternative 1: Manufacture cat food alone and obtain a profit of $20 million.
Alternative 2: Manufacture dog food alone and obtain a profit of $30 million.
Alternative 3: Manufacture both dog food and cat food and obtain a profit of $45 million. The opportunity cost of the firm is:
49) ______ A)
$45 million.
$15 million.
$20 million.
$30 million.
Economic reasoning that is true for one individual but not for society as a whole is referred to as: 50) ______ A) Generalization.
Fallacy of composition. C) Specialization.
None of the above.
The Latin phrase, ceteris paribus, means: 51)
Everything else the same, or holding all other factors constant.
B)
The rational consumer maximizes satisfaction.
C)
Agricultural economics is an applied social science.
Let the buyer beware.
The U.S. economy represents what kind of economic system?
The output produced in bushels and the price of this output ($/bushel) for Robert Holden over the last three years are as follows:
Assume that the only source of income for Robert Holden is from the production of this output. The best year in terms of real income for Robert Holden was:
According to the chart below, which bundle is preferred?
food and fiber industry today accounts for roughly what percent of GDP in the United States?
11%
The GDP for the U.S. economy in the year 2000 was in the range of: 56)
$9 to $10 trillion.
$7 to $8 trillion. C)
$11 to $12 trillion.
$13 to $14 trillion.
Which of the following is true?
57)
If the cross-price elasticity of demand between two goods is negative, then the two goods are complements.
B)
The law of demand states that as the price of a commodity rises, the change in consumer surplus is negative.
C)
The law of diminishing marginal utility states that total utility declines as more of a good is consumed.
D)
If the income elasticity of demand for a good is greater than 0, then the good is labeled as inferior.
Consider the graph shown when answering the following question.
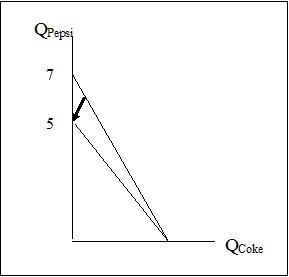
The counter-clockwise rotation of this diagram may be best explained as:
The price of Coca-Cola rose.
Total income for the consumer fell. C)
The price of Pepsi fell.
The price of Pepsi rose.
Suppose the index of prices received by farmers for 2000 was 1.02 and the base year of this index was 1995. Then: 59) ______ A)
Relative to 2000, farm prices were 102% higher in 1995. B)
Relative to 1995, farm prices were 2% higher in 2000. C)
Relative to 2000, farm prices were 2% higher in 1995. D)
Relative to 1995, farm prices were 102% higher in 2000.
Data for Wilson's Lamb Slaughtering Plant are given below:
Let the base year be 1.0 in 1998. What is the output index for 1999?
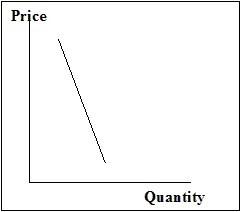
Consider the graph shown when answering the following question.
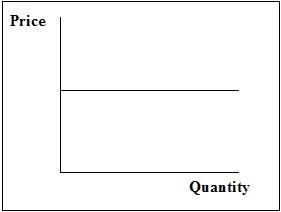
The graph depicts:
A perfectly elastic demand curve.
A perfectly inelastic demand curve.
Scarcity 2)
Marginal Rate of Substitution 3)
Consumer equilibrium 4)
Purchasing power 5)
Engel curve 6)
Law of diminishing marginal utility 7)
Budget constraint 8)
Cross-price elasticity 9)
Income effect 10)
Marketing margin 11)
Indifference curve 12)
Microeconomics 13)
Macroeconomics 14)
Opportunity cost 15)
Productivity 16)
Inferior good 17)
Engel's law 18)
Change in demand 19)
Utility function 20)
Own-price elasticity 21)
Disposable income 22)
Substitution effect
23) Ceteris paribus 24)
Income elasticity 25) $5.00 26) price of hamburgers fell in half 27) price of hamburgers doubled 28) no 29) exceeds the budgeted constraint 30) utility not maximized 31) costs more than combination at point A 32) inelastic 33) decrease 34) movement along 35) change in quantity demanded 36) 1,800 platters 37) up by $150 38) better 39) elastic 40) decrease, 3.664 41) .1476 42) inferior 43) decrease, 3.664 44) increase 45) increase, 0.572 46) FALSE 47) TRUE 48) FALSE