
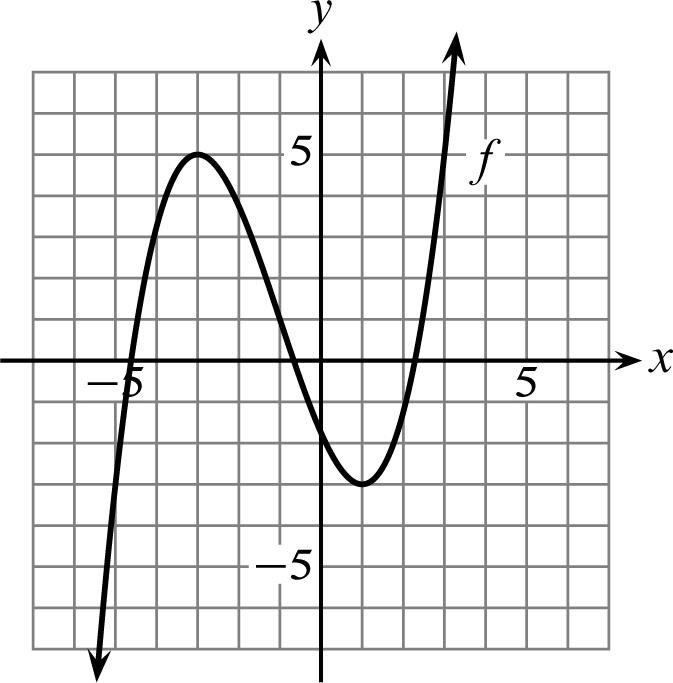
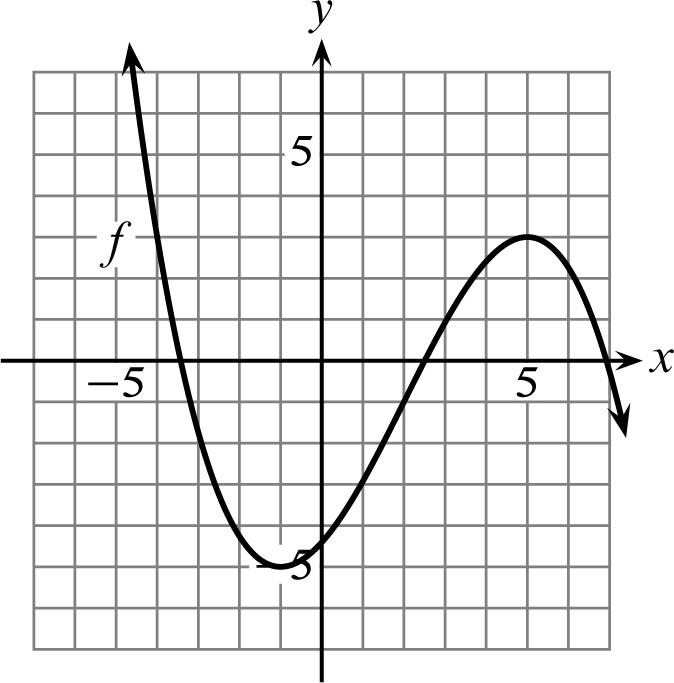
7. Use the graph of f to evaluate (2). f 7. _____

(A) 1 (B) 2.5 (C) 3 (D) 4.8
8. Find the domain of = + 1 (). 3 fx x 8. _____ (A) =− {|3} xx (B) ≤− {|3} xx (C) >− {|3} xx (D) ≠− {|3} xx
9. Find the midpoint of the line segment joining the points (5.3,6.1) and (2.8, 1.1). 9. _____ (A) (1.25,2.5) (B) (4.05,3.6) (C) (0.4,0.85) (D) (5.7,195)
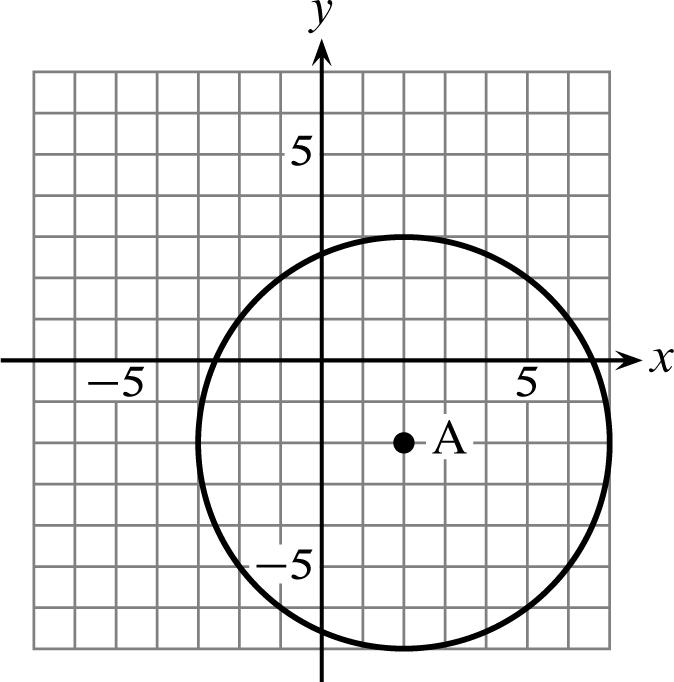
10. Find the equation of the circle. 10. _____
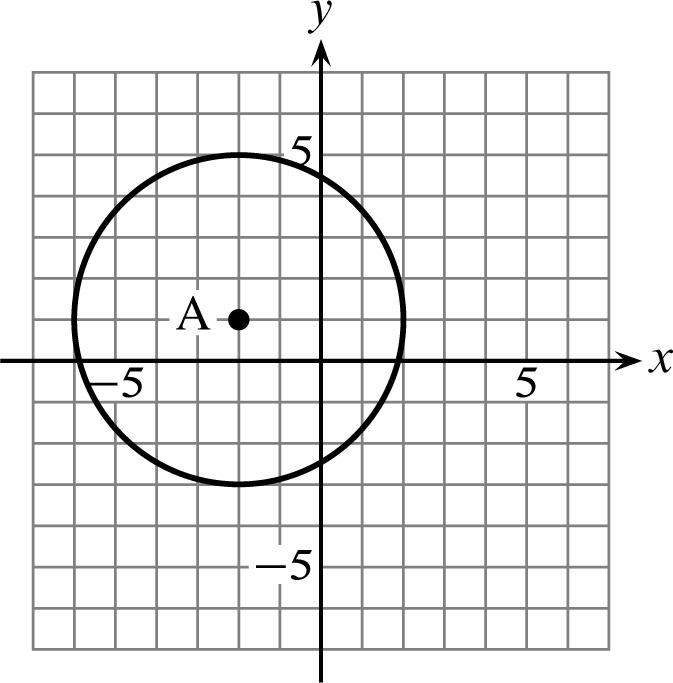
(A) −++= 22 (2)(1)4 xy (B) ++−= 22 (2)(1)16 xy (C) ++−= 22 (2)(1)4 xy (D) −++= 22 (2)(1)16 xy
11. Find the distance between the points (12.1, 13.5) and (5.6,10.1) to the nearest tenth. 11. _____ (A) 53.8 (B) 29.5 (C) 41.3 (D) 9.9
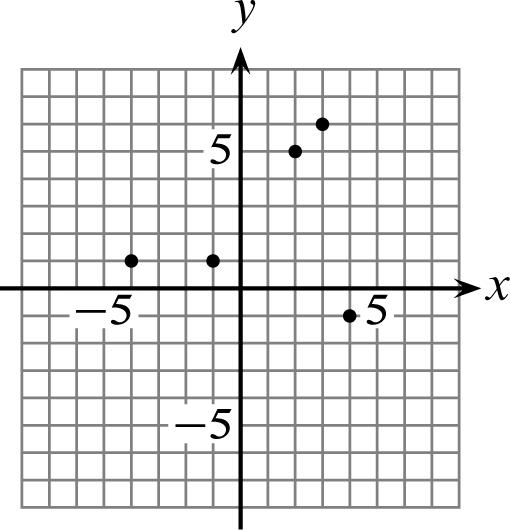
12. Find the domain and range of the relation 12. _____
=−−−−− {(5.2, 1.6), (3.5,2.9), (4.9, 3.2), (6.5,1.0), (2.1, 6.1)}. S (A) =−−−D{5.2, 1.6, 3.5,2.9,4.9} (B) =−−D{1.6,2.9, 3.2,1.0, 6.1} =−−R{3.2, 6.5,1.0,2.1, 6.1} =−−−R{5.2, 3.5,4.9, 6.5,2.1} (C) =−− D{1.5,6.0, 1.2, 9.4, 1.7} (D) =−−−D{5.2, 3.5, 4.9, 6.5,2.1} =−− R{4.9,1.4,6.2, 1.2, 4.1} =−−R{1.6,2.9, 3.2,1.0, 6.1} Test Page 2
13. In 1980 the population of Juneau, Alaska was 19,528 and in 2000 it was 30,711. 13. _____ Use the midpoint formula to estimate Juneau’s population in 1990.
(A) 11,183 (B) 25,120 (C) 22,366 (D) 29,292
14. The data displayed in the table are linear. State the slope m of the line passing 14. _____ through the data points.
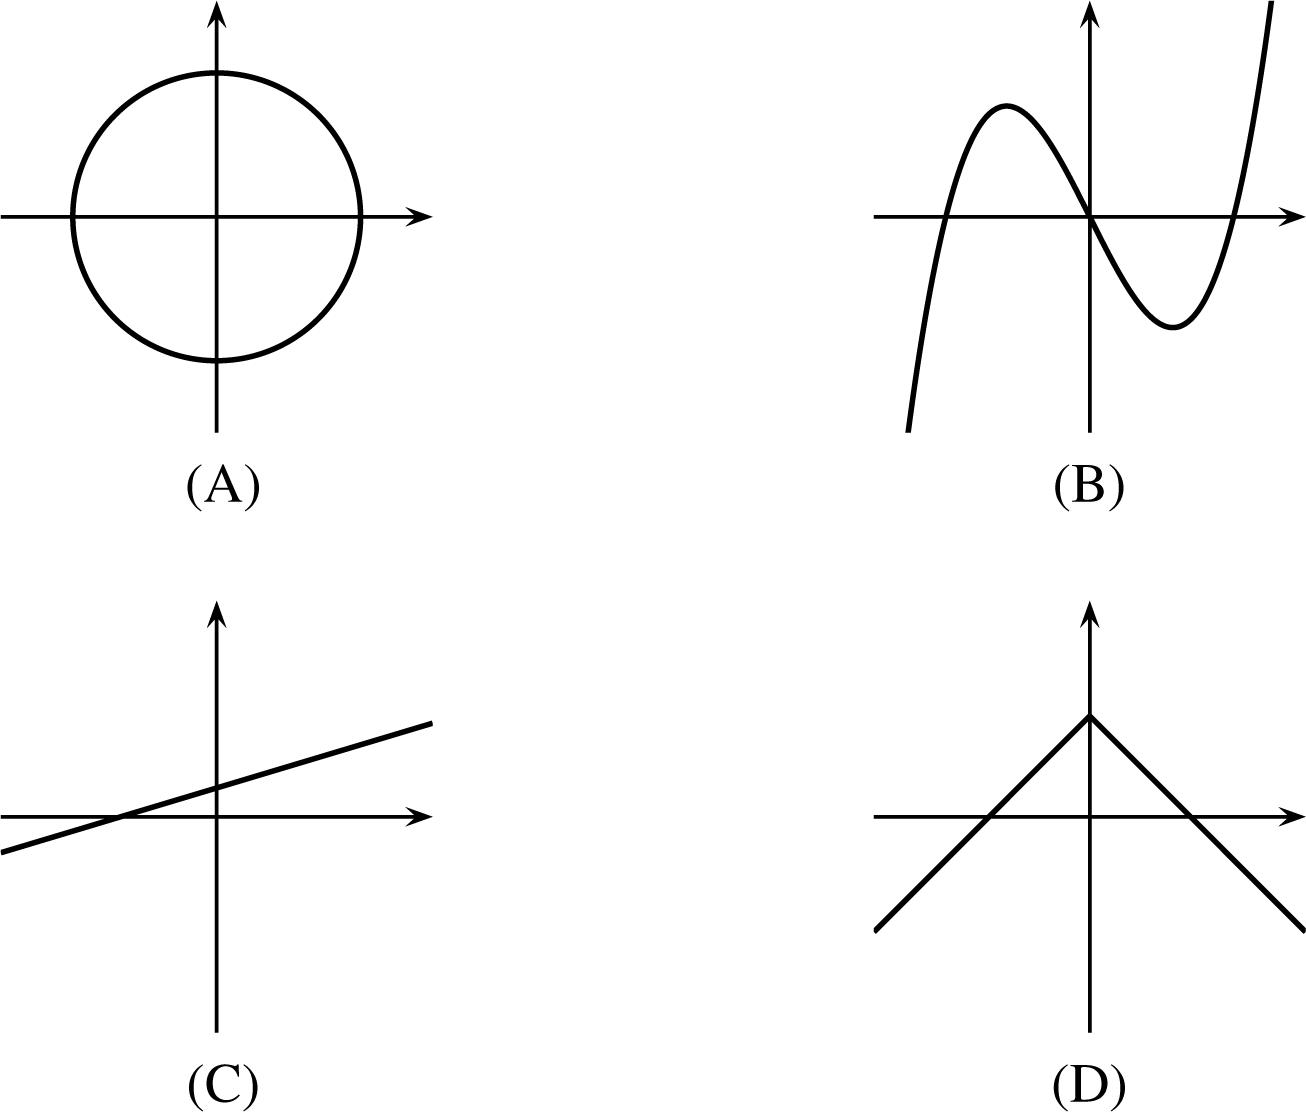
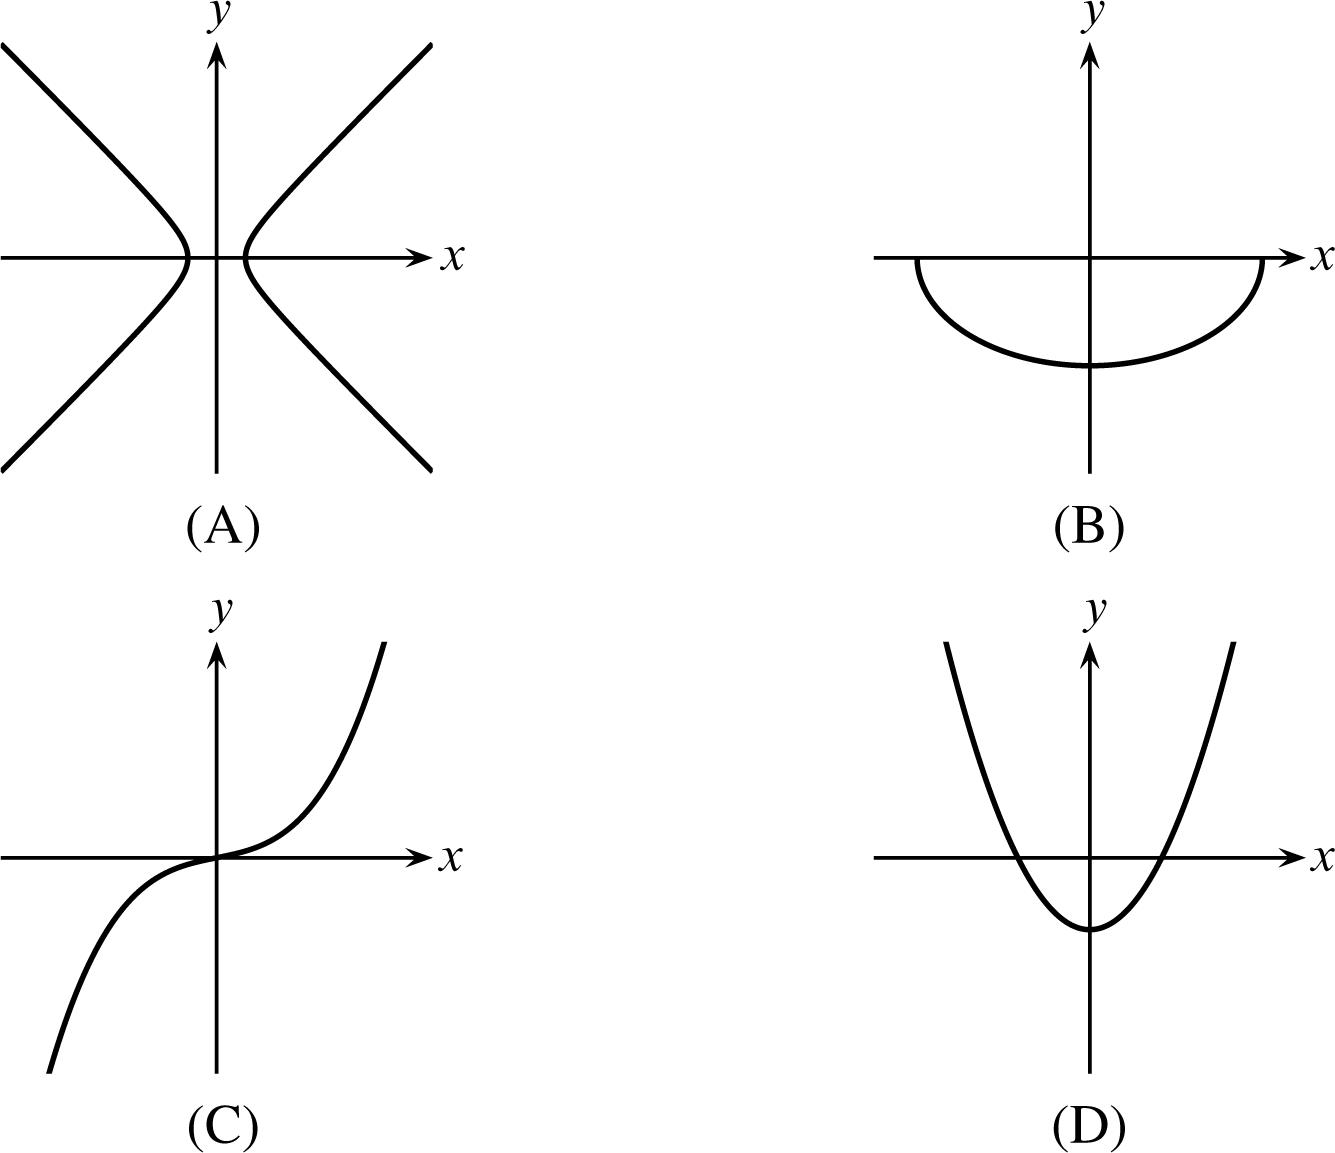
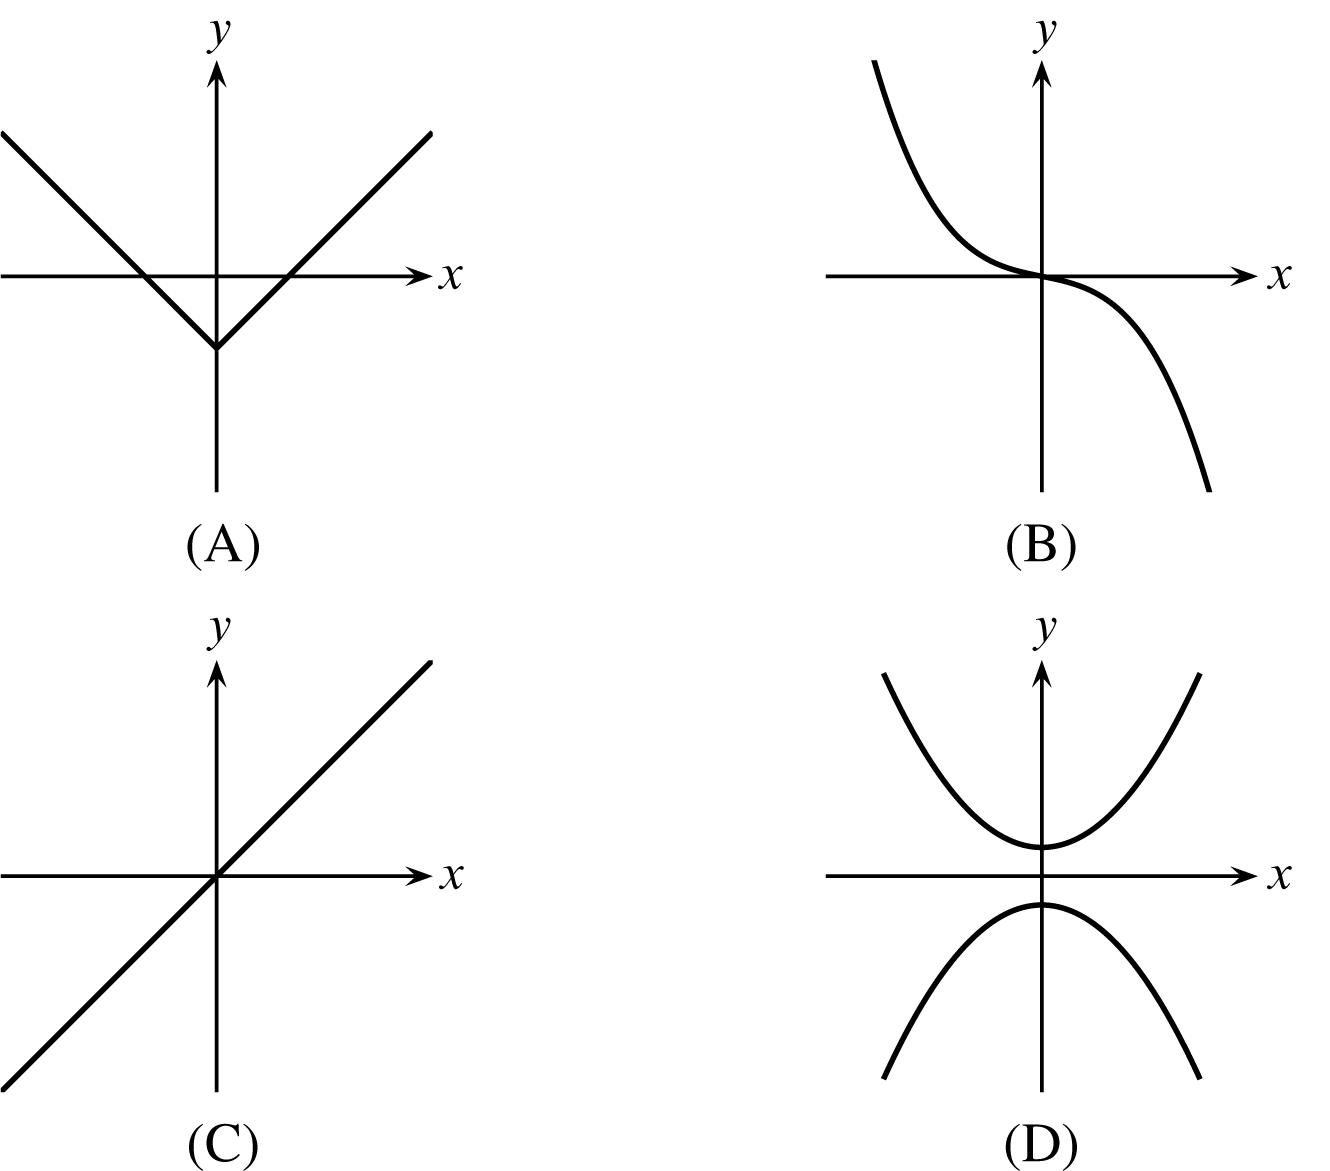
15. Which of the following is not the graph of a function? 15. _____
16. Write a symbolic representation (formula) of a function g that computes 16. _____ the number of dollars in x dimes.
(A) = () 10 x gx (B) = ()10 gxx (C) = () 0.10 x gx
= 10 ()gx x
17. The function P defined by 17. _____
models the number of diagnostic machines produced by a medical equipment manufacturer yearly, where = 0 t corresponds to the first year of production, 1996. Find the average rate of change in the number of machines produced per year between 2000 and 2005.
(A) 85 machines/year (B) 17 machines/year (C) 9 machines/year (D) 4009 machines/year
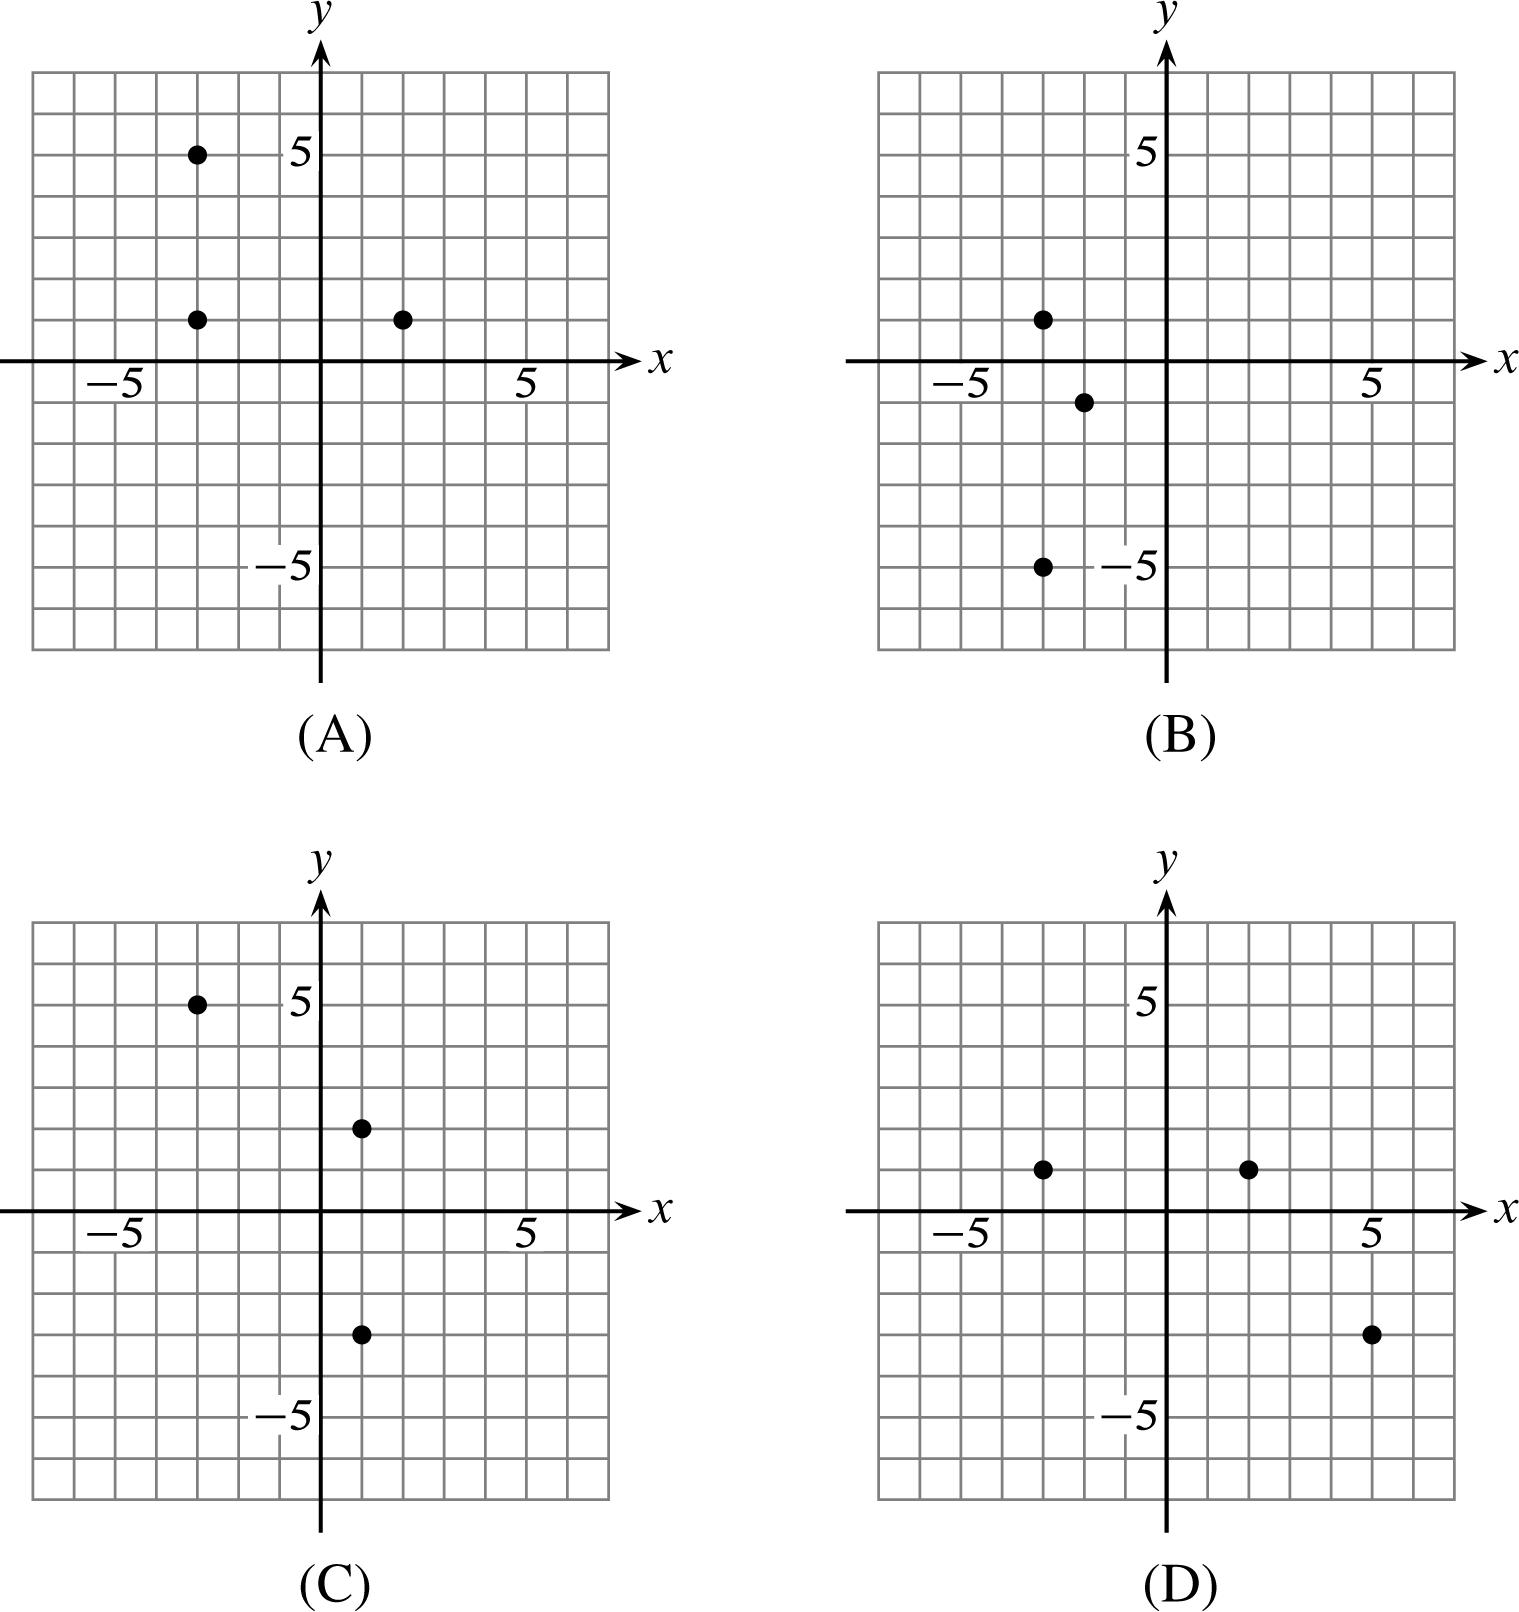
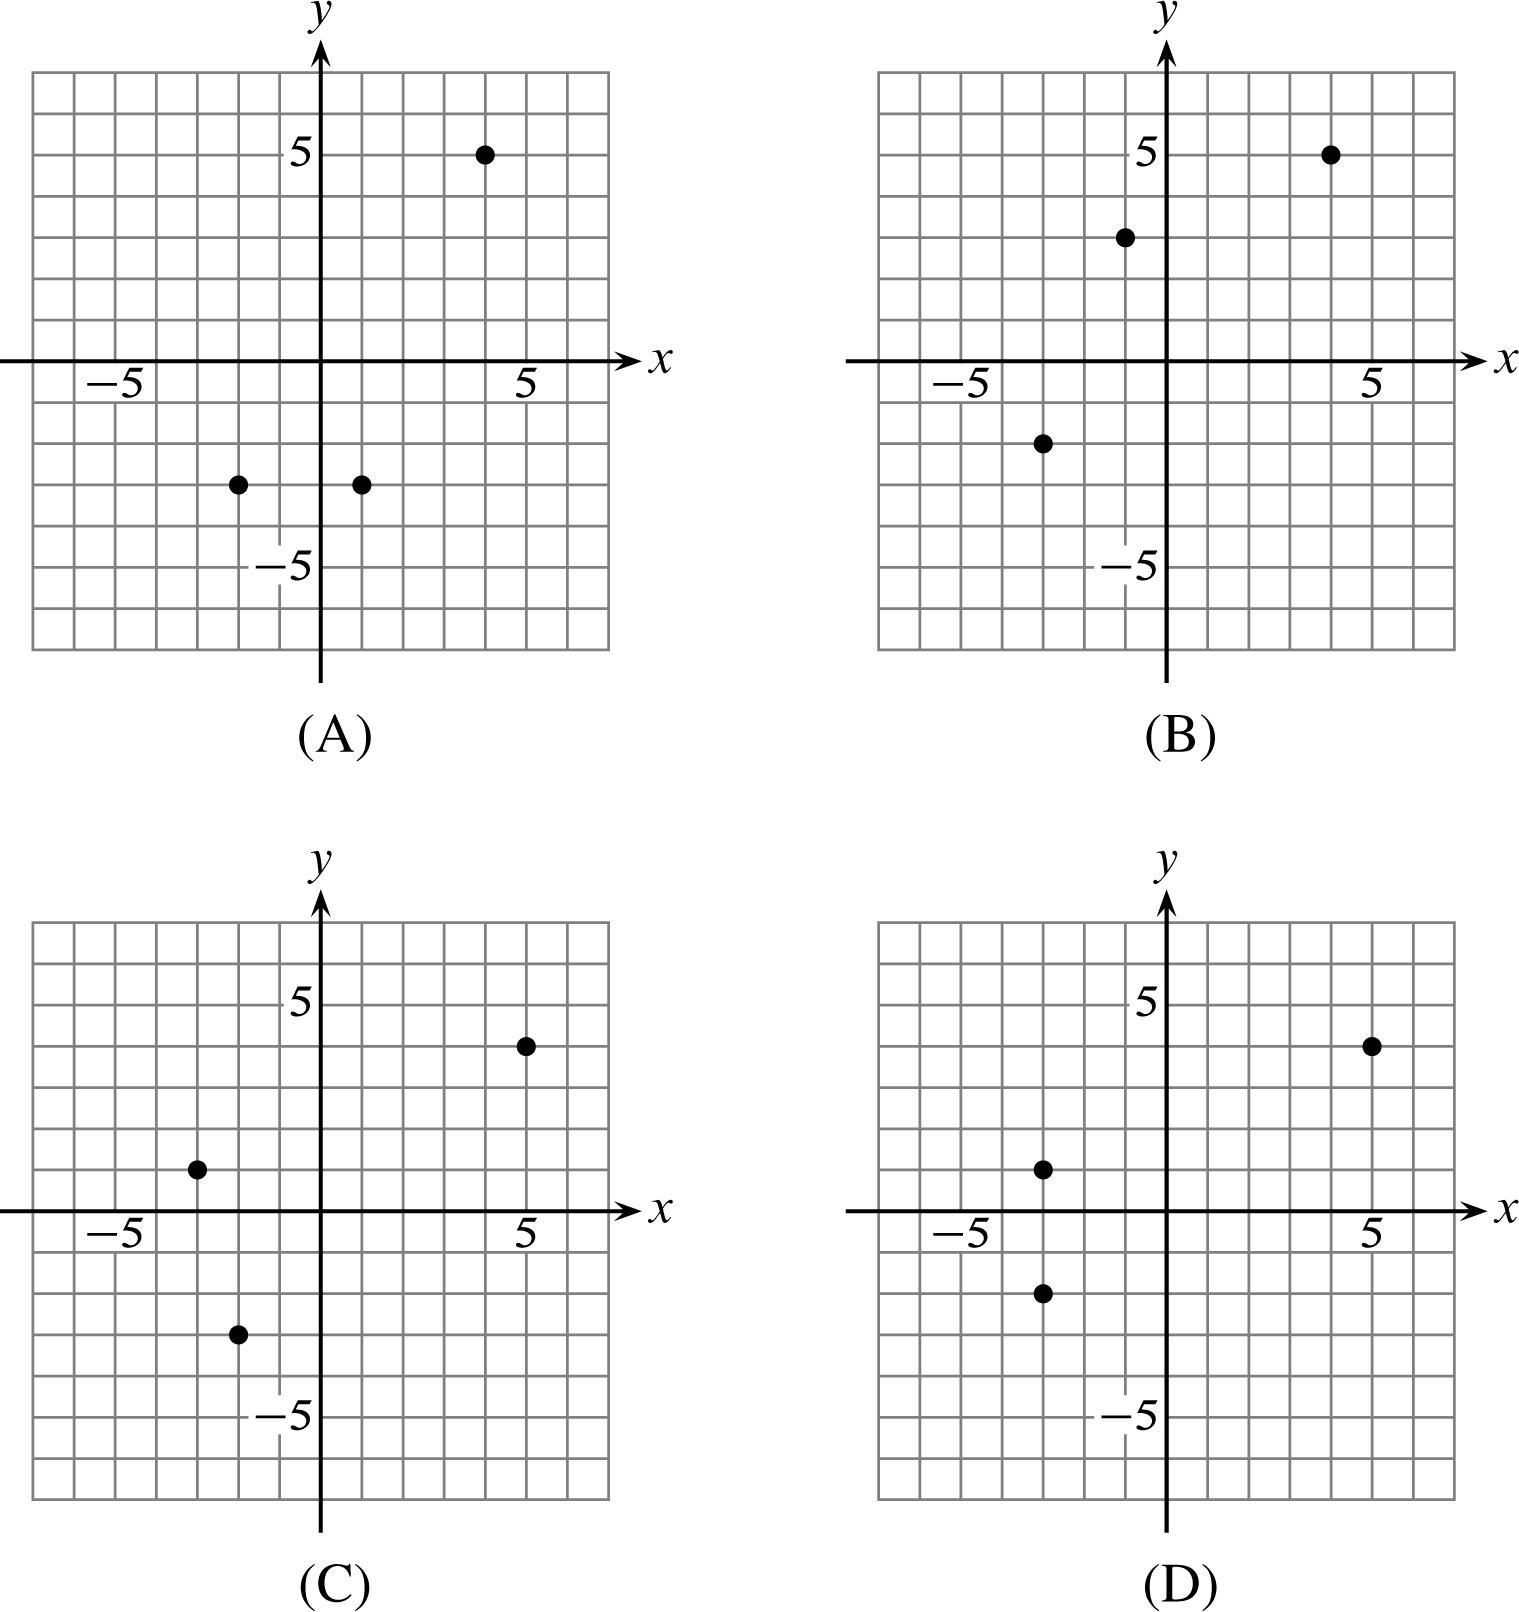
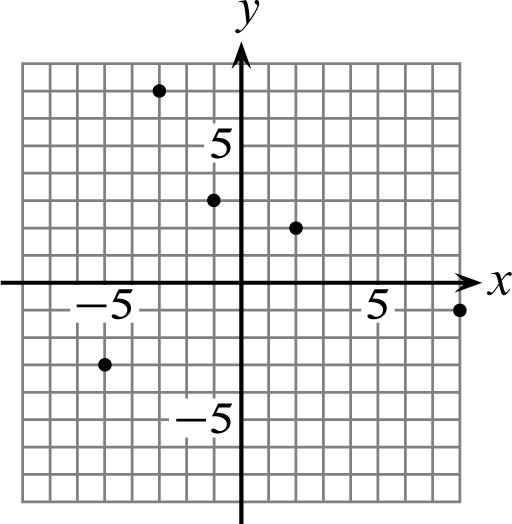
18. Plot the relation {(3, 1), (2, 1), (5,3)} in the xy-plane. 18. _____
19. The table shows the Pizzazz-Zee corporation’s monthly income for the first 6 months 19. _____ of last year in thousands of dollars. Find its median monthly income for this period to the nearest thousand dollars.
(A) $185,000
(B) $554,000 (C) $200,000 (D) $280,000
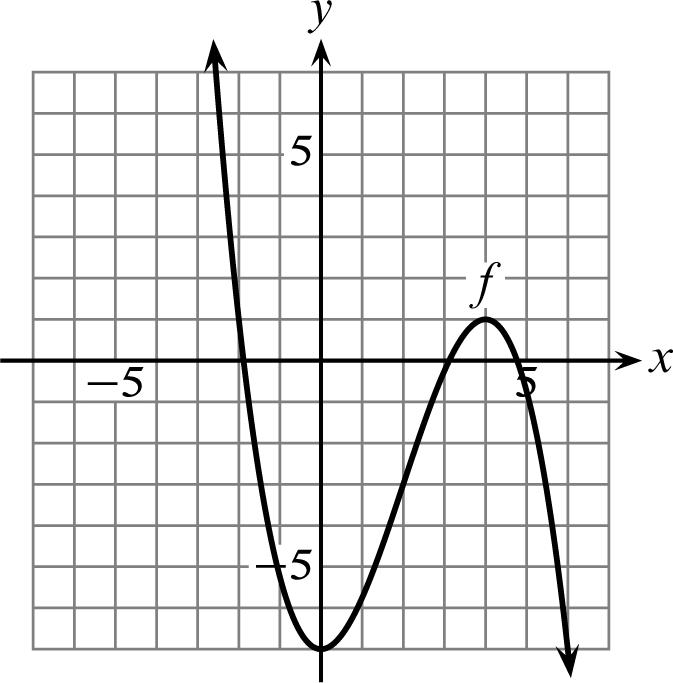
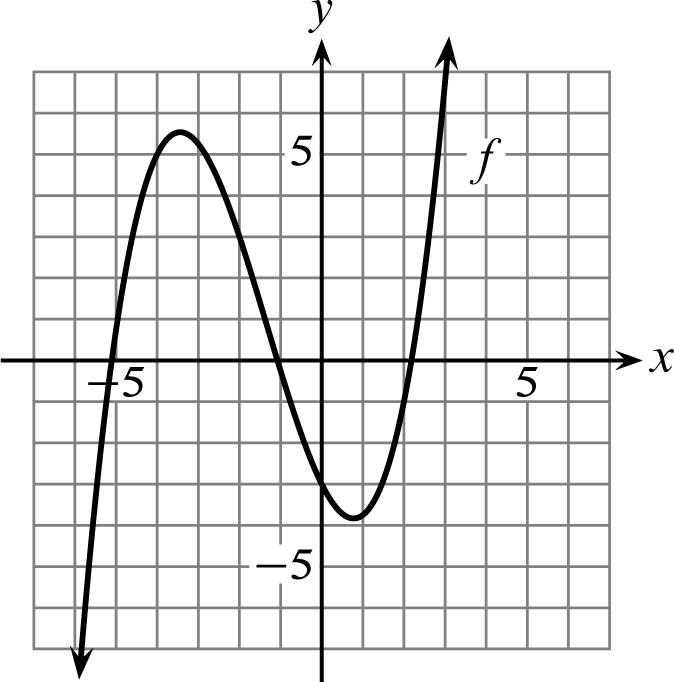
20. Use the graph to determine the intervals on which f is increasing and where it is 20. _____ decreasing.
(A) Increasing: −∞−∞ (,5][3,) Decreasing: [3,1]
(B) Increasing −∞−∞ (,3][1,) Decreasing: [3,1]
(C) Increasing: −∞ [3,) Decreasing: −∞ [5,)
(D) Increasing: ∞ [1,) Decreasing: −−∞ [3,)
1. Let a function f be represented symbolically by =− 2 ()9.fxx Find (5). f 1. _____ (A) 34 (B) 16 (C) 19 (D) 1
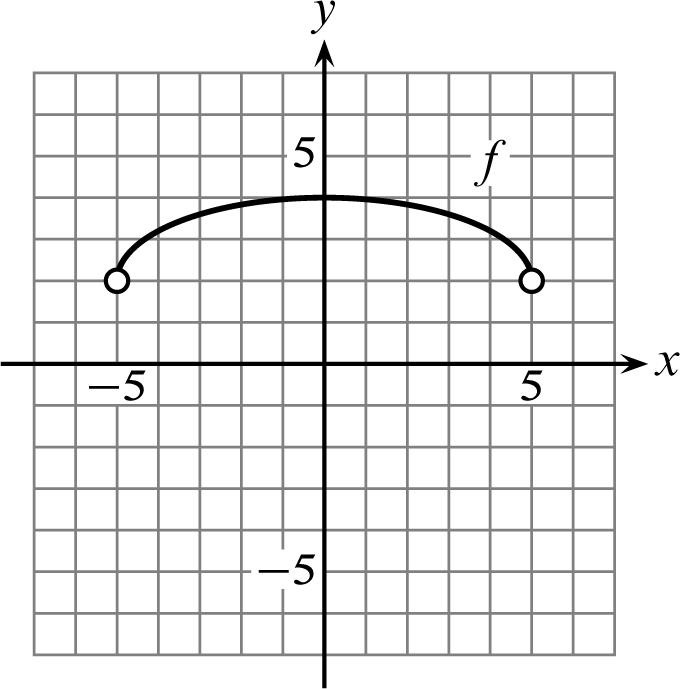
2. Use the graph of f to determine its domain. 2. _____
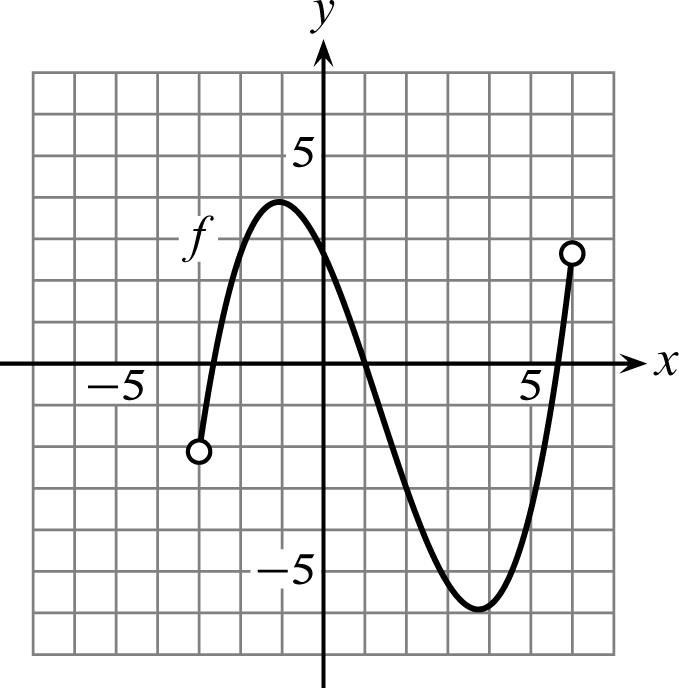
(A) 5 −≤≤ {|6} xx (B) −<< {|36} xx (C) All real numbers (D) −<< {|2.75.7} xx
3. Lake Mead, formed by the construction of the Hoover Dam, covers × 7.59108 3. _____ square feet and contains a total volume of × 1.371011 cubic feet of water. Find the average depth of Lake Mead.
(A) 180.5 feet (B) 1,805 feet (C) × 3 1.80510feet (D) 18.05 feet
4. If possible, find the slope of the line passing through (2.1,5.3) and (5.6,10.9). 4. _____ (A) 1.6 (B) 0.625 (C) undefined (D) 1.6
5. Determine which set of ordered pairs does not represent a function. 5. _____ (A) {(1,2),(2,0), (3,0), (4,4)} (B) {(1,4), (2, 0), (3, 0), (4, 2)} (C) {(4,1), (0,2), (0,3), (4, 4)} (D) {(1,1), (2,0), (3,0), (4,4)}
6. The table displays the monthly rainfall for Hilo, Hawaii, for the last six months 6. _____ in a typical year. Find the mean monthly rainfall to the nearest tenth of an inch for these six months.
Month Jul Aug Sep Oct Nov Dec
(A) 48.7 in. (B) 7.6 in. (C) 24.4 in. (D) 8.1 in.
13. In 1980 the population of Albuquerque, New Mexico was 332,920 and in 13. _____ 2000 it was 448,362. Use the midpoint formula to estimate Albuquerque’s population in 1990.
(A) 386,353 (B) 351,298 (C) 115,442 (D) 390,641
14. The data displayed in the table are linear. State the slope m of the line passing 14. _____ through the data points.
15. Which of the following is not the graph of a function? 15. _____
16. Write a symbolic representation (formula) of a function g that computes the 16. _____ number of dimes in x dollars. (A) = ()0.10 gxx
17. The function P defined by 17.
models the number of diagnostic machines produced by a medical equipment manufacturer yearly, where = 0 t corresponds to the first year of production, 1998. Find the average rate of change in the number of machines produced yearly between 2000 and 2005.
(A) 23 machines/year (B) 10,013 machines/year (C) 115 machines/year (D) 13 machines/year
18. Plot the relation {(3,1), (3,2), (5,4)} in the xy-plane. 18. _____
19. The table shows the Pizzazz-Zee corporation’s income for the first 6 months 19. _____ of last year in thousands of dollars. Find its median monthly income for this period to the nearest thousand dollars. Month
(A) $239,000
(B) $258,000 (C) $208,000 (D) $920,000
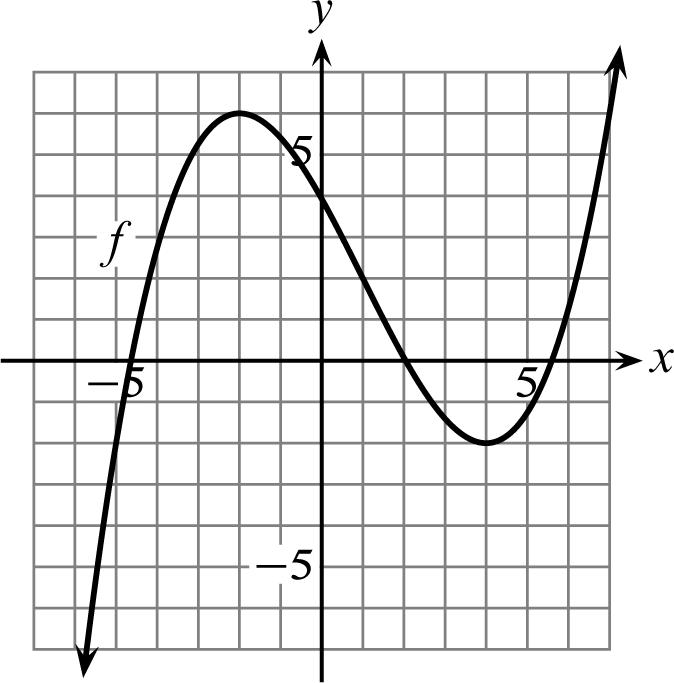
20. Use the graph to determine the intervals on which f is increasing and which it is 20. _____ decreasing.
(A) Increasing: [7,1]
Decreasing: [ ∞−−∞ (,7]1,)
(B) Increasing: −∞ [7,)
Decreasing: −∞ [1,)
(C) Increasing: [0,4]
Decreasing: −∞∞ [,0][4,)
(D) Increasing: −∞ [0,)
Decreasing: ∞ [4,)
1. Let a function f be represented symbolically by =− 2 ()6.fxx Find (4). f 1. ____________
2. Use the graph of f to determine its domain. 2. ____________
3. Lake Roosevelt, formed by the construction of the Grand Coulee Dam, 3. ____________ covers × 3.98108 square feet and contains a total volume of × 2.511010 cubic feet of water. Find the average depth of Lake Roosevelt to the nearest tenth of a foot.
4. If possible, find the slope of the line passing through (1.7,5.3) and 4. ____________ (0.1, –9.8).
5. Determine which set of ordered pairs does not represent a function. 5. ____________ (A) {(1,2),(2,4),(3,0),(4,2)} (B) {(1,8), (2,2), (3,0), (4,4)} (C) {(1,1), (2,2), (1,3), (0,4)} (D) {(1,4), (2,4), (3,4), (4,4)}
6. The table displays the monthly rainfall for Tampa, Florida, for the 6. ____________ first six months in a typical year. Find the mean monthly rainfall to the nearest hundredth of an inch for these six months.
7. Use the graph of f to evaluate (2). f 7. ____________
16. Write a symbolic representation (formula) of a function f that computes the 16. ____________ number of ounces in x pounds.
17. The function P defined by 17. ____________
Pttt models the number of diagnostic machines produced by a medical equipment manufacturer yearly, where = 0 t corresponds to the first year of production, 1993. Find the average rate of change in the number of machines produced yearly between 1995 and 2000.
18. Plot the relation 18. ____________
(1,3), (5,3), (8,1), (2,2)}
in the xy-plane.
19. The table shows the Pizzazz-Zee corporation’s income for the first 6 months 19. ____________ of last year in thousands of dollars. Find its median monthly income for this period to the nearest thousand dollars.
20. Use the graph to determine the intervals on which f is increasing and 20. ____________ on which it is decreasing.
10. Find the equation of the circle. 10. ____________
11. Find the distance between the points (1.81. 8.13) and (5.11, 2.94) to the 11. ____________ nearest hundredth.
12. Find the domain and range of the relation 12. ____________
{(4.8,2.1), (5.2,1.9), (1.7,4.3), (2.2,3.9), (4.9,1.1)}. S
13. In 1980 the population of Portland, Oregon was 368,148 and in 2000 it 13. ____________ was 529,209. Use the midpoint formula to estimate Portland’s population in 1990.
14. The data displayed in the table are linear. State the slope m of the line 14. ____________ passing through the data points.
15. Which of the following is not the graph of a function? 15. ____________
16. Write a symbolic representation (formula) of a function f that computes the 16. ____________ number of pounds in x ounces.
Page 3
17. The function P defined by 17. ____________
()0.53.525 Pttt models the number of diagnostic machines produced by a medical equipment manufacturer yearly, where = 0 t corresponds to the first year of production, 1997. Find the average rate of change in the number of machines produced per year between 2000 and 2005.
18. Plot the relation 18. ____________
(2.5), (1,1), (3,6), (4,1)} S in the xy-plane.
19. The table shows the Pizzazz-Zee corporation’s income for the first 6 months 19. ____________ of last year in thousands of dollars. Find its median monthly income for this period to the nearest thousand dollars. Month Jan Feb Mar Apr
20. Use the graph to determine the intervals on which f is increasing and 20. ____________ on which it is decreasing.
D
C
D
D
A
B
A
C
A
B 11. B
D 13. B 14. C 15. A 16. A 17. B 18. D 19. C 20. B
B
B
A
A
C
D
B
C
D
A
D
B
D
A
A
C
A
D
A
C
Test 1 Solutions
{|5< < 5} xx
–2.5
≤ {|9} xx
(5.1, –0.8)
502,759
= 5 2 m
C 16. f(x) = 16x
16 machines/year
14. =− 1 4 m
15. D 16. = () 16fxx
17. 9 machines/year 18.
19. $258,000
19. $132,000 20. Increasing: −∞−∞ (,2][4,) Decreasing: [–2, 4] 1. –14 2. −≤≤ {|41} xx 3. 126.5 feet 4. 1.5 5. D 6. 4.47 in. 7. 0 8. ≥− {|3} xx 9. (1.65, 3.9) 10. −++= 22 (2)(2)25 xy 11. 8.65
20. Increasing: [–1, 5] Decreasing: −∞−∞ (,1][5,)
Copyright © 2010 Pearson Education, Inc. Publishing as Addison-Wesley.