Exercises 1.1
1. Right 2, up 3 x y (2, 3)
Chapter 1
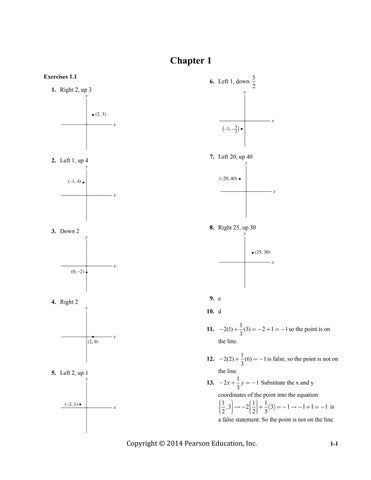
6. Left 1, down 5 2 x y –1, – ( ) 5 2
2. Left 1, up 4 x y (–1, 4)
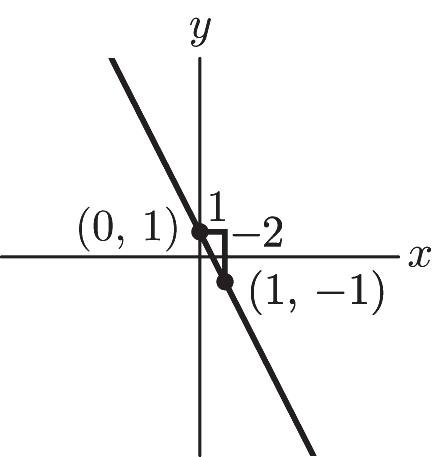
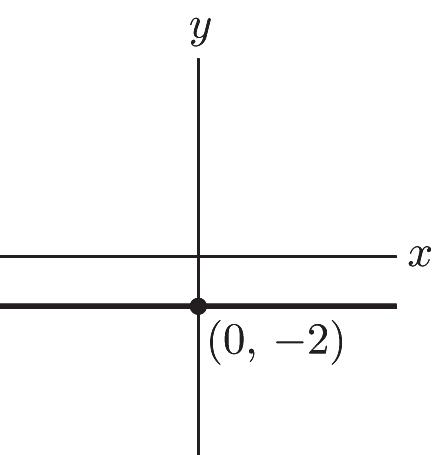
3. Down 2 x y (0, –2)
4. Right 2 x y (2, 0)
5. Left 2, up 1 x y (–2, 1)
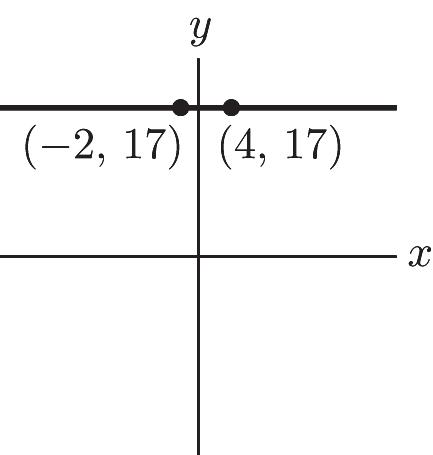
7. Left 20, up 40 x y (–20, 40)
8. Right 25, up 30 x y (25, 30)
9. e 10. d
11. 1 2(1)(3)211 3 -+=-+=- so the point is on the line.
12. 1 2(2)(6)1 3 -+=- is false, so the point is not on the line
13. 1 21 3 xy -+=- Substitute the x and y coordinates of the point into the equation: () 111 ,3231111 223 æöæö çç÷÷-+=--+=çç÷÷ çç÷÷ èøèø is a false statement. So the point is not on the line.
Chapter 1: Linear Equations and Straight Lines
14. 11 2(1)1 33 æöæö çç÷÷ -+-=çç÷÷ çç÷÷ èøèø is true so the point is on the line.
15. m = 5, b = 8
16. m = –2 and b = –6
17. y = 0x + 3; m = 0, b = 3
18. 22 0;,0 33 yxmb =+==
19. 14721 71421 23 xy yx yx += =-+ =-+
20. 3 3 3 xy yx yx -= -=-+ =-
21. 35 5 3 x x = =
22. 12 –10 23 21 10 32 3 15 4 xy yx yx += =+ =+
23. 048 48 2 x x x =-+ = =
x-intercept: (2, 0)
y = –4(0) + 8 y = 8 y-intercept: (0, 8)
24. 0 = 5 no solution
x-intercept: none
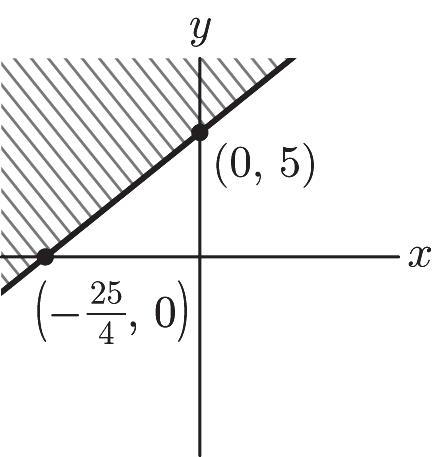
When x = 0, y = 5 y-intercept: (0, 5)
25. When y = 0, x = 7
x-intercept: (7, 0)
0 = 7
no solution
y-intercept: none
26. 0 = –8x
x = 0
x-intercept: (0, 0)
y = –8(0)
y = 0
y-intercept: (0, 0)
27. 1 0–1 3 x = x = 3
x-intercept: (3, 0) 1 (0)–1 3 y = y = –1
y-intercept: (0, –1) x y (3, 0) (0, –1)
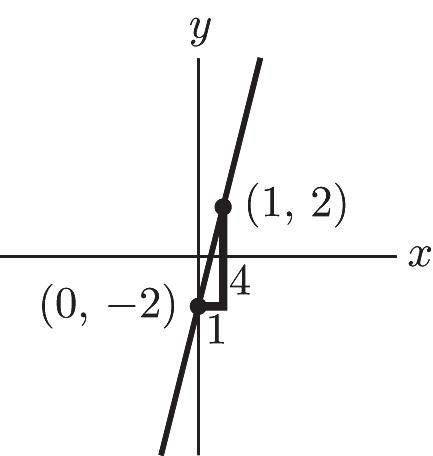
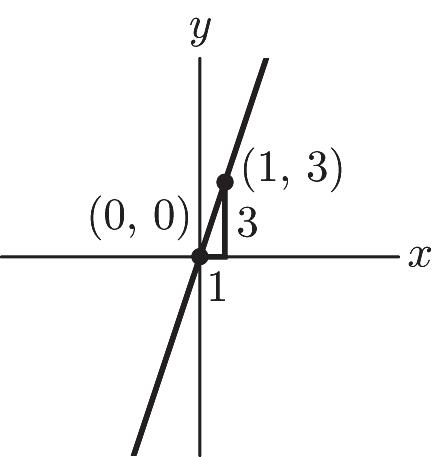
28. When x = 0, y = 0. When x = 1, y = 2. x y (1, 2) (0, 0)
Copyright © 2014 Pearson Education, Inc.
ISM: Finite Math
29. 5 0 2 = no solution
x-intercept: none
When x = 0, 5 2 y =
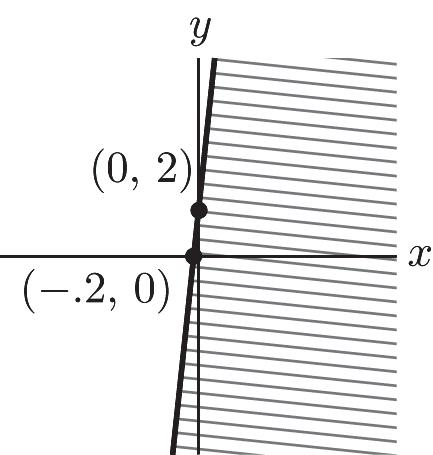
y-intercept: 5 0, 2 æö ÷ ç ÷ ç ÷ ç èø x y 5 2 0, ( )
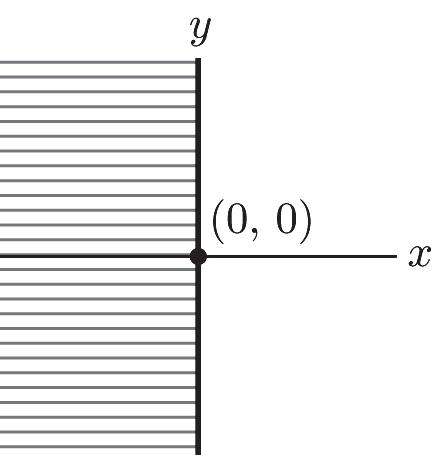
30. The line coincides with the y-axis. x y x = 0
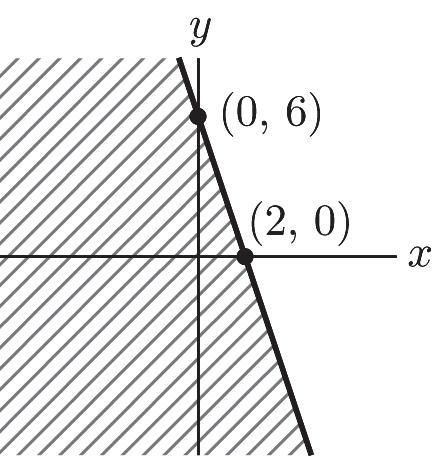
31. 34(0)24 8 x x += =
x-intercept: (8, 0)
3(0)424 6 y y += =
(0, 6)
y-intercept: (0, 6) x y (8, 0)
Chapter 1: Linear Equations and Straight Lines
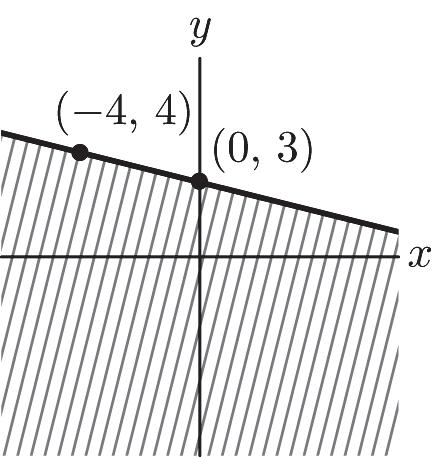
32. 03 3 x x += =
x-intercept: (3, 0) 03 3 y y += =
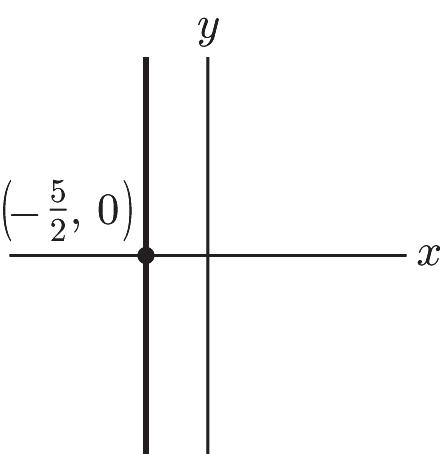
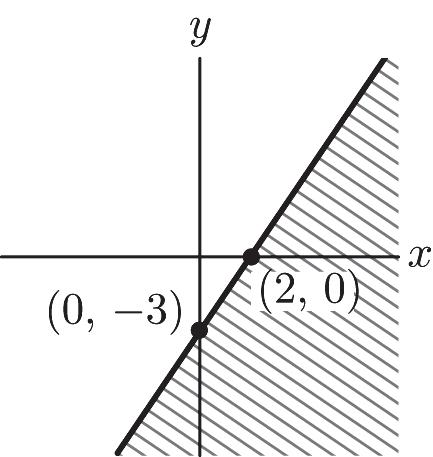
y-intercept: (0, 3) x y (0, 3) (3, 0)
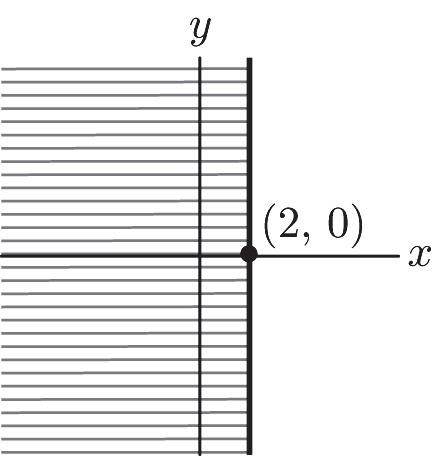
33. 5 2 x =-
34. 11 (0)1 23 2 x x -==x intercept (–2, 0) 11 23(0)1 3 y y -== y intercept (0, 3)
Copyright © 2014 Pearson Education, Inc.
Chapter 1: Linear Equations and Straight Lines
35. 236 326 2 2 3 xy yx yx += =-+ =-+
a. 4612 6412 2 2 3 xy yx yx += =-+ =-+ Yes
b. Yes
c. 3 3 2 3 3 2 2 2 3 x y yx yx ==-+ =-+ 2 – 2 3 yx=+ Yes
d. 620 6226 xy yxx --= =-=-+
No
e. 22 2––2 33 yxx ==+
Yes
f. 1 1 xy yx += =-+ No
36. 1 –51 2 1 –5–1 2 11 –105 xy yx yx = =+ = a. 1 2–1 5 1 21 5 105 xy yx yx = -=-+ =No
b. 52 52 12 55 xy yx yx =+ ==No
c. 25100 1052 11 25 xy yx yx -+= -=-+ =No
d. .1(2) .1.2 11 105 yx yx yx ===Yes e. 102 102 11 105 yx yx yx -===Yes f. 1.525 5.51 11 105 x y yx yx +=+ ==Yes
Copyright © 2014 Pearson Education, Inc.
ISM: Finite Math
37. a. 3 3 xy yx += =-+
m = –1, b = 3
3L
b. 22 22 22 xy yx yx -=-=-=+
m = 2, b = 2 1L
c. 33 33 1 1 3 xy yx yx =+ ==1 , 3 m = b = –1
2L
38. a. No; 5 + 4 ≠ 3
b. No; 2 ≠ 1 – 1
c. Yes; 2(2) = 1 + 3 and 2(4) = 5 + 3
39 3072yx=+
a. When x = 0, y = 72. This is the temperature of the water at time = 0 before the kettle is turned on.
b. 30(3)72 162 y yF =+ = o
c. Water boils when y = 212 so we have 2123072. x =+ Solving for x gives 2 3 4 x minutes or 4 minutes 40 seconds.
40. a. x-intercept: 3 41,0 5 æö ÷ ç ÷ ç ÷ ç èø y-intercept: (0, 130) x y (0, 130) 41, 0 ( ) 3 5
Chapter 1: Linear Equations and Straight Lines
b. In 1969 there were 130,000 square miles of rain forest.
c. 25 80–130 8 x æö ÷ ç =+ ÷ ç ÷ ç èø x = 16 1969 + 16 = 1985
d. 2007196938 -= 25 (38)130 8 11.25 y y æö ÷ ç =-+ ÷ ç ÷ ç èø = There were 11,250 square miles of rain forest remaining in 2007.
41. a. x-intercept: 1 –33,0 3 æö ÷ ç ÷ ç ÷ ç èø y-intercept: (0, 2.5) x y (0, 2.5) –33 , 0 ( ) 1 3
b. In 1960, 2.5 trillion cigarettes were sold.
c. 4 = .075x + 2.5 x = 20 1960 + 20 = 1980
d. 2020 – 1960 = 60 y = .075(60) + 2.5 y = 7 7 trillion
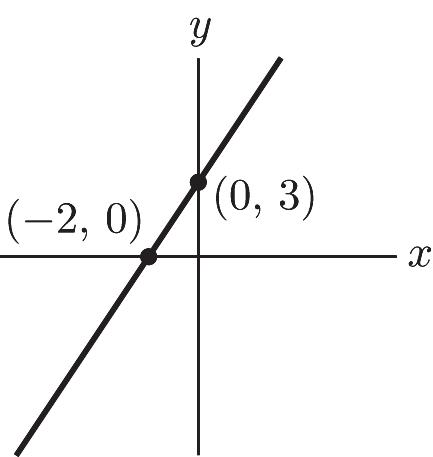
42. a. x-intercept: (–12.17, 0) y-intercept: (0, 14)
b. In 2000 the income from ecotourism was $14,000.
Copyright © 2014 Pearson Education, Inc.
Chapter 1: Linear Equations and Straight Lines
c. 20 = 1.15x + 14
x ≈ 5.22
2000 + 5.22 = 2005.22 The year 2005.
d. 2016 – 2000 = 16 y = 1.15(16) + 14 y = 32.4
$32,400
43. a. x-intercept: (–11.3, 0) y-intercept: (0, 678)
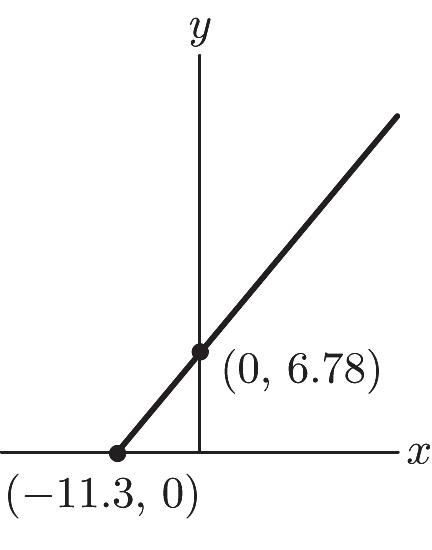
b. In 1997 the car insurance rate for a small car was $678.
c. 2000 – 1997 = 3 y = 60(3) + 678 y = 858
$858
c. 1180301000 18030 6 x x x =+ = = The balance will be $1180 after 6 years.
45. a. In 2000, 3.9% of entering college freshmen intended to major in biology.
b. 2011200011 -= 0.2(11)3.9 6.1 y y =+ =
6.1% of college freshmen in 2011 intended to major in biology. The actual value is close to the predicted value.
c. 5.30.23.9 7
200072007 x x =+ = +=
In 2007, the percent of college freshmen that intended to major in biology was 5.3.
46. a. In 2000, 9.7% of college freshmen smoked.
b. 200420004 -= 0.65(4)9.7 7.1 y y =-+ =
7.1% of college freshmen smoked in 2004.
d. 157860678 15
1997152012 x x =+ = += The year 2012
44. a. x-intercept: 100 ,0 3 æö ÷ ç - ÷ ç ÷ ç èø y-intercept: (0, 1000)
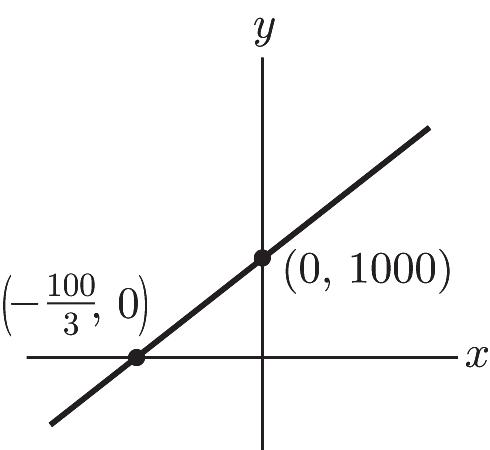
b. 30(2)1000 601000 1060 y y y =+ =+ =
$1060 will be in the account after 2 years.
©
c. 4.50.659.7 8
200082008 x x =-+ = +=
In 2008, the percent of college freshmen that smoked was 4.5.
47. a. 200820008 -= 787(8)10600 16896 y y =+ =
$16,896 will be the approximate average tuition in 2008.
b. 2400078710600 17
2000172017 x x =+ » +=
In 2017, the approximate average cost of tuition will be $24,000.
48. a. 200720007 -= 556(7)11522 15414 y y =+ = 15,414 bachelor degrees in mathematics and statistics were awarded in 2007. b. 2200055611522 19 2000192019 x x =+ » += In 2019, there will be approximately 22,000 bachelor degrees in mathematics and statistics awarded.
49. 8(0) 8 ymxb mb b =+ =+ = 0(16)8 1 2 m m =+ =1 8 2 yx=-+
50. .9(0) .9 ymxb mb b =+ =+ = 0(.6).9 1.5 m m =+ =1.5.9yx=-+
51. y = mx + b
5 = m(0) + b b = 5 0 = m(4) + 5 5 –4 m = 5 –5 4 yx=+
52. Since the equation is parallel to the y axis, it will be in the form x = a. Therefore the equation will be x = 5.
53. On the x-axis, y = 0.
54. No, because two straight lines (the graphed line and the x-axis) cannot intersect more than once.
55. The equation of a line parallel to the y axis will be in the form x = a.
56. y = b is an equation of a line parallel to the xaxis.
57. 23 xy-=-
58. 105 xy ⋅+⋅=
59. 103 xy ⋅+⋅=-
60. 34 xy -+=-
61. 2 5 3 2315 xy xy +=+=-
62. 5 4 6 2465 xy xy -= -=
63. Since (a,0) and (0,b) are points on the line the slope of the line is (b-0)/(0-a) = -b/a. Since the y intercept is (0,b), the equation of the line is (/) ybaxb =-+ or .aybxab =-+ In general form, the equation is bx + ay = ab.
64. If (5, 0) and (0, 6) are on the line, then a = 5 and b = 6. Substituting these values into the equation bx + ay = ab gives 6x + 5y = 30.
65. One possible equation is 9. yx=-
66. One possible equation is 10. yx=+
67. One possible equation is 7. yx=+
68. One possible equation is 6. yx=-
69. One possible equation is 2. yx=+
70. One possible equation is .yx =
71. One possible equation is 9. yx=+
72. One possible equation is 5. yx=-
73 a. y = –3x + 6
Math Chapter 1: Linear Equations and Straight Lines Copyright © 2014 Pearson
Chapter 1: Linear Equations and Straight Lines
76 a. 2y + 5x = 8. So y = –2.5x + 4.
b. The intercepts are (0, 4) and (1.6, 0).
c. When x = 2 then y = –1.
b. The intercepts are at the points (2, 0) and (0, 6)
c. When x = 2, y = 0
74 a. y = .25x – 2
b. (0, –2) and ( 8,0) are intercepts
c. When x = 2, y = –1.5.
75. a. 329 329 2 3 3 yx yx yx -= =+ =+
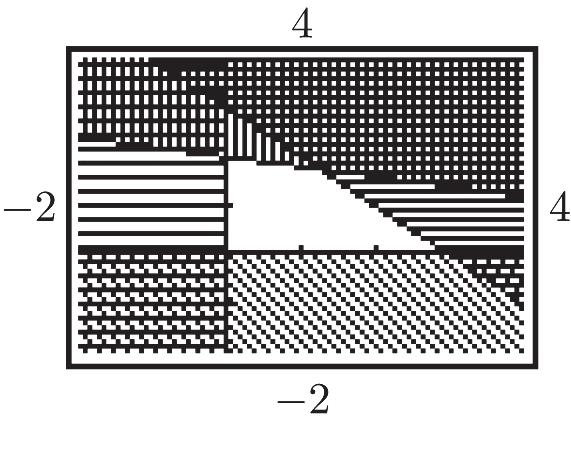
77. 2y + x = 100. When y = 0, x = 100, and when x = 0, y = 50. An appropriate window might be [-10, 110] and [-10,60]. Other answers are possible.
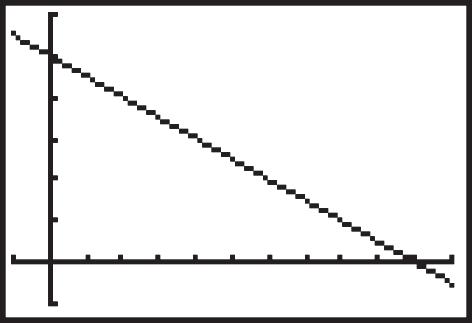
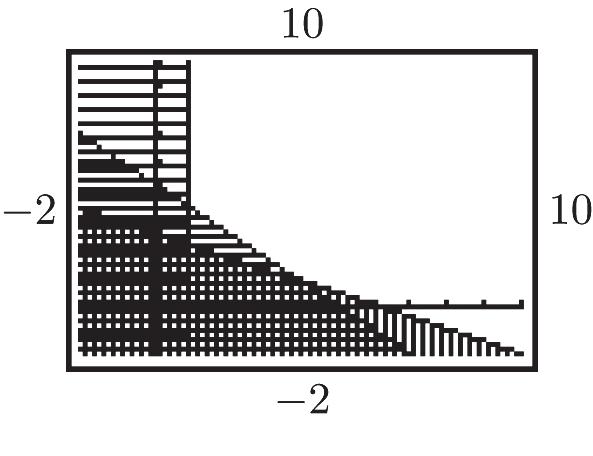
78. x – 3y = 60. When x = 0, then y = - 20 and when y = 0 x = 60. An appropriate window might be [-40, 100] and [-40 , 20] but other answers are equally correct.
Exercises 1.2
False
True
True
False
b. The intercepts are at the points (–4.5, 0) and (0, 3).
c When x = 2, y = 4.33 or 13 / 3.
ISM: Finite Math
6. 3x – 7 ≤ 2 3x ≤ 9 x ≤ 3
7. –5x + 13 ≤ –2 –5x ≤ –15 x ≥ 3
8. –x + 1 ≤ 3 –x ≤ 2 x ≥ –2 (d)
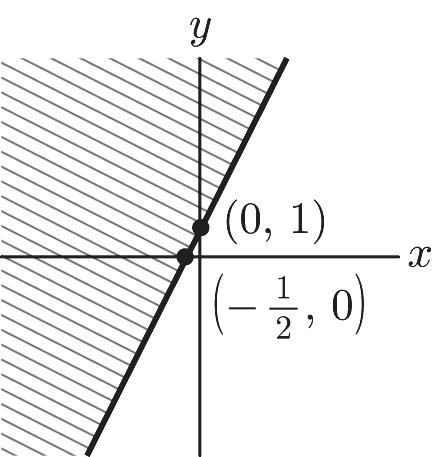
9. 2x + y ≤ 5 y ≤ –2x + 5
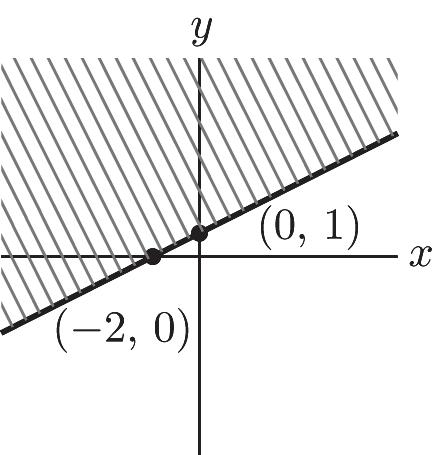
10. –3x + y ≥ 1 y ≥ 3x + 1 11. 1 5–6 3 1 56 3 1518 xy yx yx £
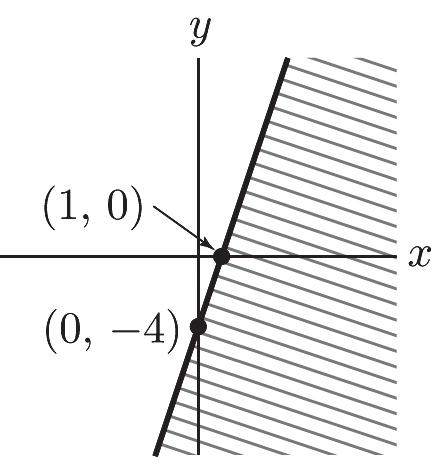
12. 1 ––1 2 1 – ––1 2 1 1 2 xy yx yx £ £ ³+ 13. 43 3 –4 x x ³³
14. –2x ≤ 4 x ≥ –2
15. 3(2) + 5(1) ≤ 12 6 + 5 ≤ 12 11 ≤ 12 Yes
16. –2(3) + 15 ≥ 9 –6 + 15 ≥ 9 9 ≥ 9
Yes
17. 0 ≥ –2(3) + 7 0 ≥ –6 + 7 0 ≥ 1
Chapter 1: Linear Equations and Straight Lines
1 6(4)3
19. 5 ≤ 3(3) – 4 5 ≤ 9 – 4 5 ≤ 5 Yes
20. –2 ≥ –3 Yes 21. 7 ≥ 5 Yes
22. 0 ≤ 7 Yes
x y
x y
x y
Copyright © 2014 Pearson Education, Inc.
Chapter 1: Linear Equations and Straight Lines
31. 412 1 – 3 4 xy yx +³ ³+
32. 4x – 4y ≥ 8 y ≤ x – 2
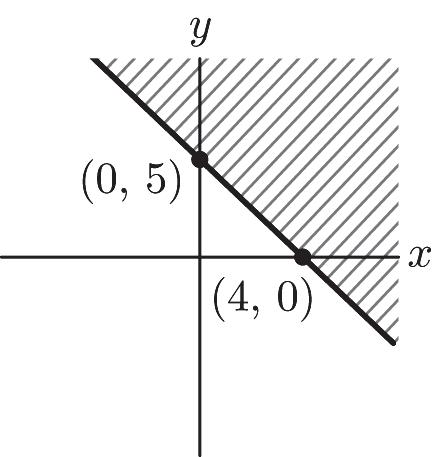
33. 4x – 5y + 25 ≥ 0 4 5 5 yx£+
34. .1y – x = .2 y ≥ 10x + 2
35. 11 –1 23 3 3 2 xy yx £ ³-
ISM: Finite Math
36. 1 321 2 1 1 2 yxyx yx +£++ £+
37. .5.42 1.255 xy yx +£ £-+
38. 1 22 2 44 yxy yx -³³-
39. 24 0 yx y ì £- ï ï í ï ³ ï î
Chapter 1: Linear Equations and Straight Lines
40. 1 1 3 0 yx x ì ï ï ³-+ ï í ï ï ³ ï î
41. 22 33 xy xy ì +³ ï ï í ï -³ ï î 1 1 2 33 yx yx ì ï ï ³-+ ï í ï ï £- ï î
42. 3624 36 xy xy ì +³ ï ï í ï +³ ï î 1 – 4 2 –36 yx yx ì ï ï ³+ ï í ï ï ³+ ï î
Copyright © 2014 Pearson Education, Inc.
Chapter 1: Linear Equations and Straight Lines ISM: Finite Math
ì +£ ï ï ï ï +£ í ï ï ï ³³ ï î 1 – 2 5 – 3 0,0 yx yx xy
43. 510 3 0,0 xy xy xy
ì ï ï £+ ï ï ï ï ï £+ í ï ï ï ³³ ï ï ï ï î
44. 26 5 1 xy xy x ì +³ ï ï ï ï +³ í ï ï ï³ ï î 1 – 3 2 – 5 1 yx yx x ì ï ï ³+ ï ï ï ï ï ³+ í ï ï ï ³ ï ï ï ï î
45. 6(8)3(7)96 8718 2(8)6(7)72 80,70 ì +£ ï ï ï ï +£ ï ï í ï +£ ï ï ï ³³ ï ï î 6996 1518 5872
80,70 ì £ ï ï ï ï £ ï ï í ï £ ï ï ï ³³ ï ï î Yes
46.
6(14)3(3)96 14318 2(14)6(3)72 140,30 ì +£ ï ï ï ï +£ ï ï í ï +£ ï ï ï ³³ ï ï î 9396 1718 4672 140,30 ì £ ï ï ï ï £ ï ï í ï £ ï ï ï ³³ ï ï î Yes
47. 6(9)3(10)96 91018 2(9)6(10)72
90,100 ì +£ ï ï ï ï +£ ï ï í ï +£ ï ï ï ³³ ï ï î 8496 1918 7872 90,100 ì £ ï ï ï ï £ ï ï í ï £ ï ï ï ³³ ï ï î No
48. 6(16)3(0)96 16018 2(16)6(0)72 160,00 ì +£ ï ï ï ï +£ ï ï í ï +£ ï ï ï ³³ ï ï î 9696 1618 3272 160,00
ì £ ï ï ï ï £ ï ï í ï £ ï ï ï ³³ ï ï î Yes
49. For x = 3, y = 2(3) + 5 = 11. So (3, 9) is below.
50. 3x – y = 4 y = 3x – 4
For x = 2, y = 3(2) – 4 = 2. So (2, 3) is above.
51. 7450 47 –55 xy yx -+= =
For x = 0, 477 (0)––. 555 y ==
So (0, 0) is above.
Copyright © 2014 Pearson Education, Inc. 1-12
ISM: Finite Math
52. 25 15 –22 xy yx =+ =
For x = 6, 151 (6)–. 222 y == So (6, 1) is above.
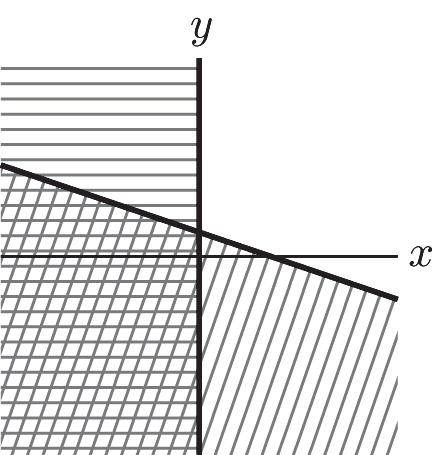
53. 844 21 xy yx -= =840 2 xy yx -= = 2–1 2 yx yx ì ³ ï ï í ï £ ï î
54. e
55. d
56. d
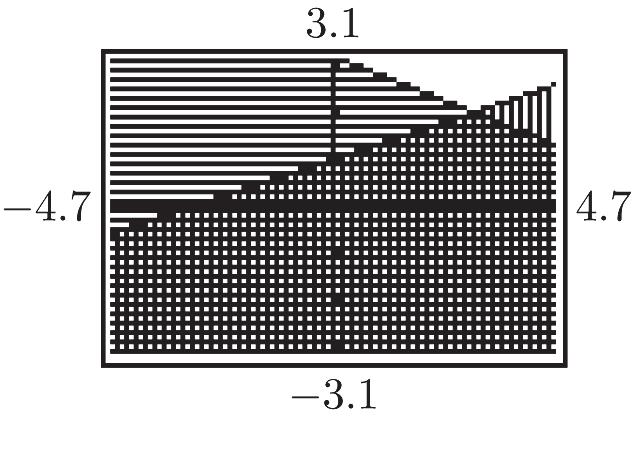
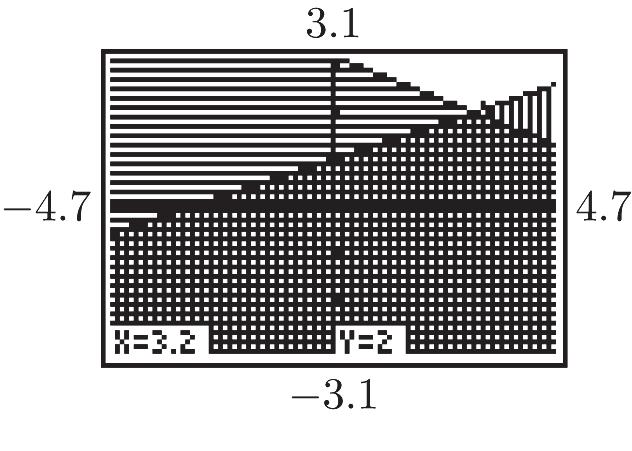
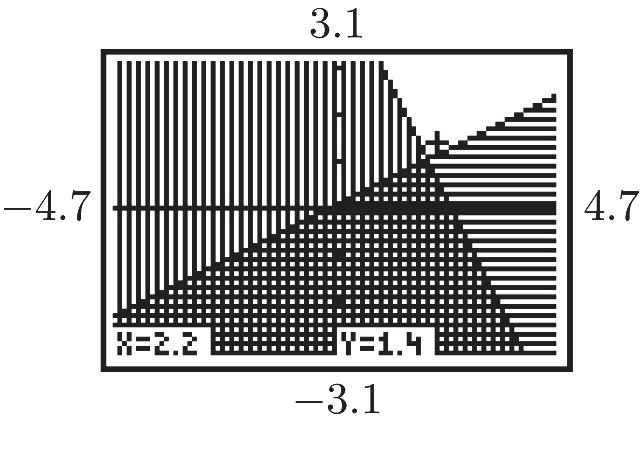
57. 427 7 2–2 xy yx -= = a.
(3.6, 3.7)
b. Below, because (3.6, 3.7) is on the line.
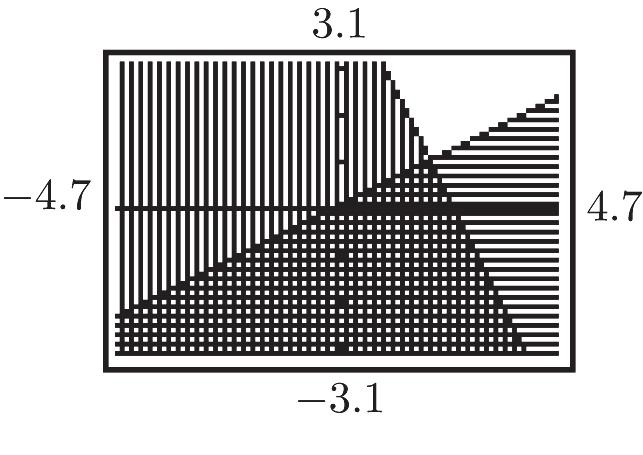
58. 211 111 –22 xy yx += =+
a. (6, 2.5)
b. Above, because (6, 2.5) is on the line.
Chapter 1: Linear Equations and Straight Lines
Exercises 1.3
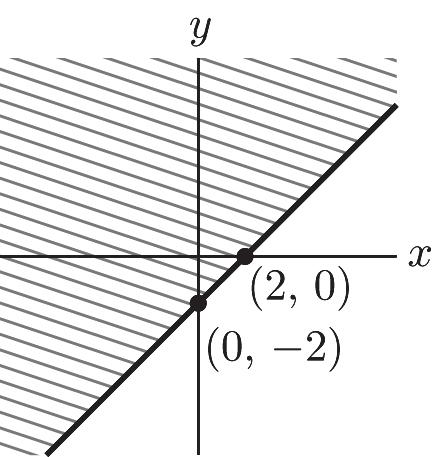
1. 4x – 5 = –2x + 7 6x = 12 x = 2 y = 4(2) – 5 = 3 (2, 3)
2. 3x – 15 = –2x + 10 5x = 25 x = 5 y = 3(5) – 15 = 0 (5, 0)
3. x = 4y – 2 x = –2y + 4 4y – 2 = –2y + 4 6y = 6 y = 1 x = 4(1) – 2 = 2 (2, 1)
4. 233 3 xy y ì -= ï ï í ï = ï î 3333(3)6 2222xy=+=+= (6, 3)
Copyright © 2014 Pearson Education, Inc.
Chapter 1: Linear Equations and Straight Lines
5. 1 (12)–13 3 y == (12, 3)
6. 233 6 xy x ì -= ï ï í ï = ï î 22 –331(6)–13yx=== (6, 3)
ISM: Finite Math
7. 63(4)6 3(6)2(4)10
ì -=- ï ï í ï -= ï î –6–6 1010 ì = ï ï í ï = ï î Yes
8. 1 4(12)1 3 1212 ì ï ï =- ï í ï ï = ï î 43 1212 ì = ï ï í ï = ï î No
9. 27 3 yx yx ì =-+ ï ï í ï =- ï î 273 310 10 3 xx x x -+=-== 101 –3 33 y == 101 , 33xy==
10. 1 – 2 2 – 6 yx yx ì ï ï =+ ï í ï ï =+ ï î 1 – 2–6 2 1 4 2 8 xx x x +=+ = = y = –(8) + 6 = –2 x = 8, y = –2
11. 51 –22 –2–4 yx yx ì ï ï = ï í ï ï = ï î 51 – –2–4 22 xx = 97 –22 x = 7 –9 x = 722 –2––4–99 y æö ÷ ç == ÷ ç ÷ ç èø 722 – ,–99xy== 12. 1 – 3 2 3–12 yx yx ì ï ï =+ ï í ï ï = ï î 1 – 33–12 2 7 – –15 2 30 7 xx x x += = = 1306 –3 277 y æö ÷ ç =+= ÷ ç ÷ ç èø 306 , 77xy== 13. 3 2318 x xy ì = ï ï í ï += ï î 22 – 336–(3)64yx=+=+= A = (3, 4) 2 2318 y xy ì = ï ï í ï += ï î 33 – 229–(2)96xy=+=+=
B = (6, 2)
Copyright © 2014 Pearson Education, Inc. 1-14
ISM: Finite Math
14. 1 – 7 3 0 yx x
ì ï ï =+ ï í ï ï = ï î 1 – (0)77 3 y =+=
A = (0, 7) 1 – 7 3 – 9 yx yx
ì ï ï =+ ï í ï ï =+ ï î 1 – 7–9 3 2 2 3 3 xx x x +=+ = = y = –(3) + 9 = 6
B = (3, 6) – 9 –319 yx yx ì =+ ï ï í ï =+ ï î –x + 9 = –3x + 19 2x = 10 x = 5
y = –(5) + 9 = 4
C = (5, 4) –319 0 yx y ì =+ ï ï í ï = ï î 3190 319 19 3 x x x -+= -== 19 ,0 3 D æö ÷ ç = ÷ ç ÷ ç èø
15. A = (0, 0) 2 1 3 2 yx yx
ì = ï ï ï í ï =+ ï ï î 1 23 2 xx=+ x = 2
y = 2(2) = 4
Chapter 1: Linear Equations and Straight Lines
D = (5, 0)
16. 0 214 x xy ì = ï ï í ï += ï î
y = –2x + 14 = –2(0) + 14 = 14
A = (0, 14)
214 3224 xy xy
ì += ï ï í ï += ï î –214 3 – 12 2 yx yx
ì =+ ï ï ï í ï =+ ï ï î 3 –214–12 2 1 ––2 2 4 xx x x +=+ = =
y = –2(4) + 14 = 6
B = (4, 6) 3224 212 xy xy
ì += ï ï í ï += ï î 3 – 12 2 1 – 6 2 yx yx
B = (2, 4) 1 3 2 5 yx x ì ï ï =+ ï í ï ï = ï î 111 (5)3 22 y =+= 11 5, 2 C æö ÷ ç = ÷ ç ÷ ç èø
ì ï ï =+ ï ï ï í ï ï =+ ï ï ï î 31 – 12–6 22 6 6 xx x x +=+ -== 1 – (6)63 2 y =+=
C = (6, 3)
212 0 xy y ì += ï ï í ï = ï î
x = –2y + 12 = –2(0) + 12 = 12
D = (12, 0)
Copyright © 2014 Pearson Education, Inc.
Chapter 1: Linear Equations and Straight Lines ISM: Finite Math
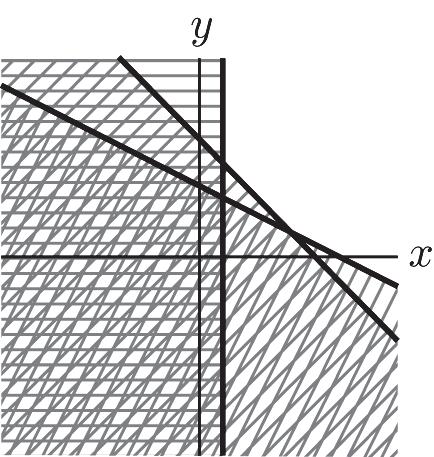
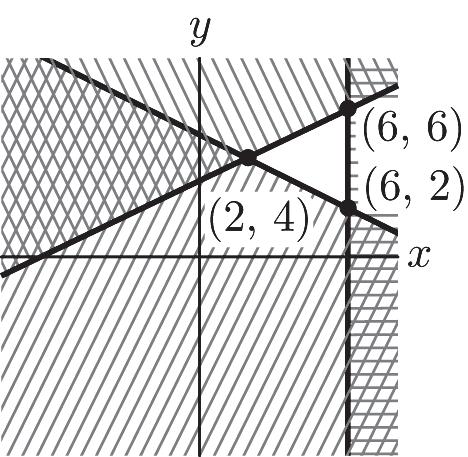
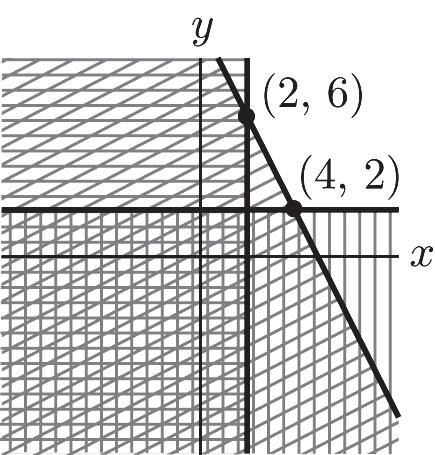
17. 2–6 210 6 yx xy x ì £ ï ï ï ï +³ í ï ï ï £ ï î 1 3 2 1 – 5 2 6 yx yx x ì ï ï £+ ï ï ï ï ï ï ³+ í ï ï ï ï £ ï ï ï ï î 1 3 2 (2,4) 1 –5 2 yx yx ì ï ï =+ ï ï ï í ï ï =+ ï ï ï î 1 –5 (6,2) 2 6 yx x ì ï ï =+ ï í ï ï = ï î 1 3 (6,6) 2 6 yx x ì ï ï =+ ï í ï ï = ï î 18. 210 2 2 xy x y ì +³ ï ï ï ï ³ í ï ï ï ³ ï î –210 2 2 yx x y ì ³+ ï ï ï ï ³ í ï ï ï ³ ï î –210 (2,6) 2 yx x ì =+ ï ï í ï = ï î –210 (4,2) 2 yx y ì =+ ï ï í ï = ï î
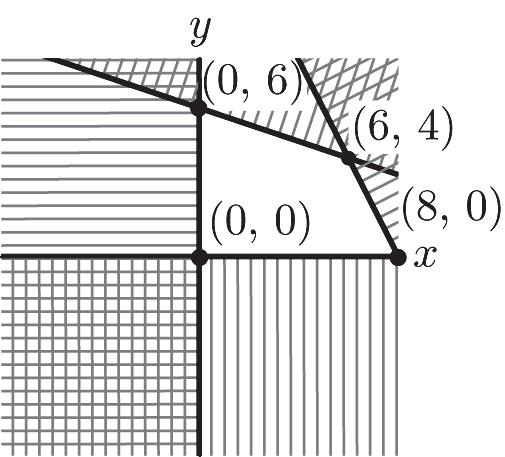
19. 318 216 0,0 xy xy xy ì +£ ï ï ï ï +£ í ï ï ï ³³ ï î 1 – 6 3 –216 0,0 yx yx xy
ì ï ï £+ ï ï ï ï ï £+ í ï ï ï ³³ ï ï ï ï î 1 –6 (6,4) 3 –216 yx yx
ì ï ï =+ ï í ï ï =+ ï î 1 –6 (0,6) 3 0 yx x ì ï ï =+ ï í ï ï = ï î –216 (8,0) 0 yx y ì =+ ï ï í ï = ï î 0 (0,0) 0 x y ì = ï ï í ï = ï î
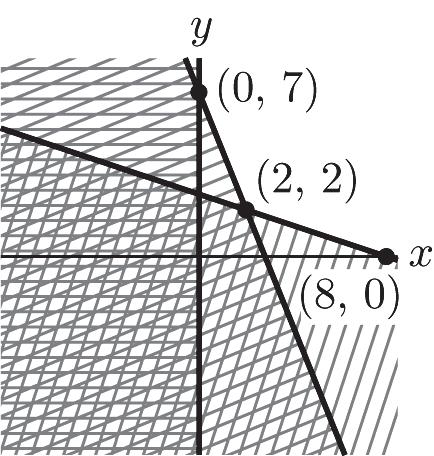
20. 5214 38 0,0 xy xy xy
ì +³ ï ï ï ï +³ í ï ï ï³³ ï î 5 – 7 2 18 –33 0,0 yx yx xy ì ï ï ³+ ï ï ï ï ï ï ³+ í ï ï ï ï ³³ ï ï ï ï î 5 –7 2 (2,2) 18 –33 yx yx
ì ï ï =+ ï ï ï í ï ï =+ ï ï ï î 5 –7 (0,7) 2 0 yx x ì ï ï =+ ï í ï ï = ï î
Copyright © 2014 Pearson Education, Inc. 1-16
ISM: Finite Math
Chapter 1: Linear Equations and Straight Lines
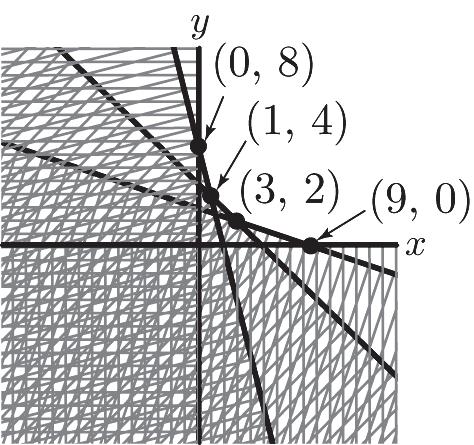
21. 48 5 39 0,0 xy xy xy xy ì +³ ï ï ï ï +³ ï ï í ï +³ ï ï ï ³³ ï ï î –48 – 5 1 – 3 3 0,0 yx yx yx xy ì ³+ ï ï ï ï ³+ ï ï ï í ï ³+ ï ï ï ï ï ³³ ï î –48 (1,4) –5 yx yx ì =+ ï ï í ï =+ ï î –5 (3,2) 1 –3 3 yx yx ì =+ ï ï ï í ï =+ ï ï î 1 –3 (9,0) 3 0 yx y ì ï ï =+ ï
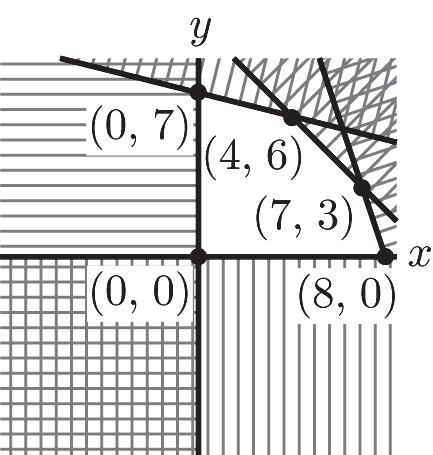
í ï ï = ï î –48 (0,8) 0 yx x ì =+ ï ï í ï = ï î 22. 428 10 324 0,0 xy xy xy xy
ì +£ ï ï ï ï +£ ï ï í ï +£ ï ï ï ³³ ï ï î 1 – 7 4 – 10 –324 0,0 yx yx yx xy ì ï ï £+ ï ï ï ï ï £+ í ï ï £+ ï ï ï ï ³³ ï î 1 –7 (0,7) 4 0 yx x
ì ï ï =+ ï í ï ï = ï î 1 –7 (4,6) 4 –10 yx yx
ì ï ï =+ ï í ï ï =+ ï î –10 (7,3) –324 yx yx
ì =+ ï ï í ï =+ ï î –324 (8,0) 0 yx y ì =+ ï ï í ï = ï î 0 (0,0) 0 x y ì = ï ï í ï = ï î
Copyright © 2014 Pearson Education, Inc. 1-17 18 –(8,0) 33 0 yx y ì ï ï =+ ï í ï ï = ï î
23. a. .0001(19,500).05
$2.00 p =+ =
b. .0001(0).05
$.05 p =+ = No units will be supplied for $.05 or less.
24. a. .001(31,500)32.5
$1.00 p =-+ =
b. .00132.50 32,500units q q -+£ ³
Chapter 1: Linear Equations and Straight Lines ISM: Finite Math
25. .0001.05 .00132.5 pq pq ì =+ ï ï í ï =-+ ï î .00010.05.00132.5 .001132.45 29,500units qq q q +=-+ = = .0001(29,500).05 $3.00 p p =+ =
26. 1 13 300 .0319 pq pq =+ =-+ 1 13.0319 300 1 6 30 180 books qq q q +=-+ = = .03(180)19 $13.60 p p =-+ =
27. a. .156.925 5.80.156.925 1.125.15 7.5 pq q q q
Demand will be 7.5 billion bushels and supply will be 11 billion bushels
b. The equilibrium point occurs when supply is the same as demand. Therefore, .156.925.23.6 .353.325 9.5 qq q q
To find the equilibrium price, substitute the value into either equation. .15(9.5)6.925 1.4256.925
Equilibrium occurs when 9.5 billion bushels are produced and sold for $5.50 per bushel.
28. a. 2.219.36 16.502.219.36 2.862.2 1.3 pq q q q
1.59 16.501.59 7.501.5 5 pq q q q
Demand will be 1.3 billion bushels and supply will be 5 billion bushels
b. The equilibrium point occurs when supply is the same as demand. Therefore, 2.219.361.59 3.710.36 2.8 qq q q
To find the equilibrium price, substitute the value into either equation.
2.2(2.8)19.36 6.1619.36 13.20 p p p
Equilibrium occurs when 2.8 billion bushels are produced and sold for $13.20 per bushel
29. Let C = F, then ()
Therefore, when the temperature is 40,o it will be the same on both temperature scales.
Copyright © 2014 Pearson Education, Inc. 1-18
ISM: Finite Math
30. a. 9 (5)32 5 41 F F =+ = 2(5)30 40 F F =+ = The two temperatures differ by 1 degree.
b. 9 (20)32 5 68 F F =+ = 2(20)30 70 F F =+ = The two temperatures differ by 2 degrees.
c. 9 23032 5 1 2 5 10 CC C C +=+ = =
When the temperature is 10 degrees Celsius, the two formulas will give the same Fahrenheit temperature.
31. Let x = numbers of shirts and y = cost of manufacture.
120030 50035 y x y x ì =+ ï ï í ï =+ ï î 12003050035 5700 140 x x x x +=+ -== 120030 120030(140) 12004200 5400 yx y y y =+ =+ =+ =
The manufactures will charge the same $5400 if they produce 140 shirts.
Chapter 1: Linear Equations and Straight Lines
32. Let x = hours working and y = hours supervising. 40 1215504 xy xy ì += ï ï í ï += ï î –40 4168 –55 yx yx ì =+ ï ï ï í ï =+ ï ï î 4168 –40–55 132 55 32 xx x x +=+ -== y = –32 + 40 = 8 Working: 32; supervising: 8
33. Method A: .45.01 yx =+ Method B: .035 yx = Intersection point: .45.01.035 .45.025 18 x x x x += = =
For a call lasting 18 minutes, the costs for either method will be the same, .035(18)63. y == The cost will be 63cents.
34. Let x = numbers of miles towed and y = cost of the tow.
503 602.5 y x y x ì =+ ï ï í ï =+ ï î 503602.5 0.510 20 x x x x +=+ = = 503 503(20) 5060 110 yx y y y =+ =+ =+ =
The two companies will charge the same $110 if they tow a car 20 miles.
Copyright © 2014 Pearson Education,
Chapter 1: Linear Equations and Straight Lines
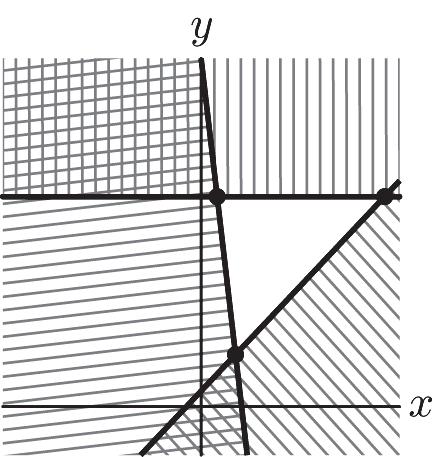
33 5
Based on the above points of intersection, the base of the triangle is 514 -= and the height is 3. Therefore the area of the triangle, in square units, is:
ï ï =-+
ï ï ï =+
3 6 4 1 1 2 0 yx yx x
ï ï ï = ï ï ï ï î 3 6 4 (4,3) 1 1 2 yx yx ì ï ï =-+ ï ï ï í ï ï =+ ï ï ï î 3 6 (0,6) 4 0 yx x ì ï ï =-+ ï í ï ï = ï î 1 1 (0,1) 2 0 yx x ì ï ï =+ ï í ï ï = ï î
Based on the above points of intersection, the base of the triangle is 615 -= and the height is
4. Therefore the area of the triangle, in square units is: ()() 1 2 1 54 2 10 Abh A A = = =
37. Let x = weight of first contestant y = weight of second contestant 700 2275 xy x y ì += ï ï í ï =+ ï î 700 2275 y x yx ì =- ï ï í ï =- ï î 7002275 9753 325 pounds xx x x -== = Answer (c) is correct.
38. Let x = number of 32” TVs sold y = number of 40” TVs sold 5 28040015600 yx xy ì =+ ï ï í ï += ï î 5 7 39 10 yx yx ì =+ ï ï ï í ï =-+ ï ï î 7 539 10 17 34 10 20 TV sets xx x x +=-+ = = 205 25 TV sets y =+ = Total = 20 + 25 = 45 TV sets Answer (d) is correct. 39. 10 10 –10 –10 (3.73, 2.23)
ISM: Finite Math
Chapter 1: Linear Equations and Straight Lines
(1.69, 3.38)
41. – 4–5 3–24.2 xy xy
ì ï ï =+ ï ï ï í ï ï = ï ï ï î
ì = ï ï í ï = ï î 15 44 3 – 2.1 2 yx yx
(2.68, 1.92)
ì += ï ï í ï += ï î 25 –33 41 55 yx yx
42. 235 –451 xy xy
ì ï ï =+ ï ï ï í ï ï =+ ï ï ï î –10 –10 10 10 (1, 1)
43. – 33 .43.2 xy xy
b. (3, 2)
c.
ì +³ ï ï í ï +³ ï î 1 1 3 –.43.2 yx yx
d. –(3.2)3(2)3 .4(3.2)23.2
ì +³ ï ï í ï +³ ï î 2.83 3.283.2 ì ³ ï ï í ï ³ ï î No
44. 25 – 20 xy xy ì +³ ï ï í ï £ ï î 25 1 2 yx yx ì ³-+ ï ï ï í ï ³ ï ï î
a.
b. (2, 1)
c.
ì ï ï ³+ ï í ï ï ³+ ï î a.
d. Yes
Copyright © 2014 Pearson Education,
Exercises 1.4
2 3 m = 2. y = 0x – 4 m = 0
3. y – 3 = 5(x + 4) y = 5x + 23 m = 5
Chapter 1: Linear Equations and Straight Lines ISM: Finite Math Copyright © 2014 Pearson Education, Inc.
9. The slope of a vertical line is undefined.
10. The slope of a vertical line is undefined.
ISM: Finite Math
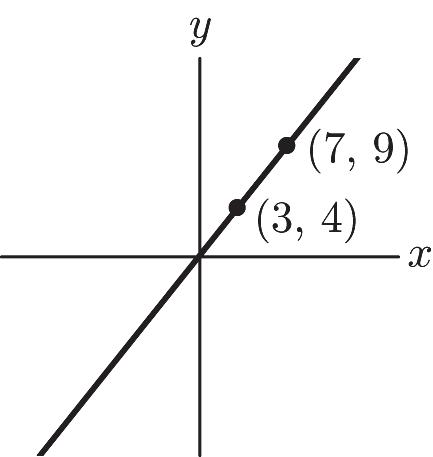
16. 1 2 1 12 m == 1 – 1(–3) 2 11 22 yx yx = =-
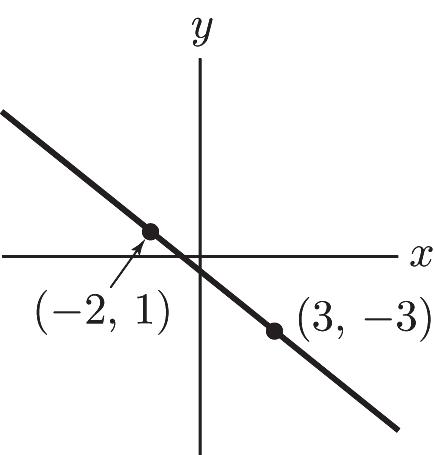
17. 0–2 –2 2–1 m ==
y – 0 = –2(x – 2) y = –2x + 4
18. 1 2 2– 3 1–(–1)4 m == 3 – 2(–1) 4 35 44 yx yx = =+
19. 11 ––44 m == 1 – 2(–2) 4 13 42 yx yx = =+
20. 1 3 m = 1 – 3(–5) 3 14 33 yx yx = =+
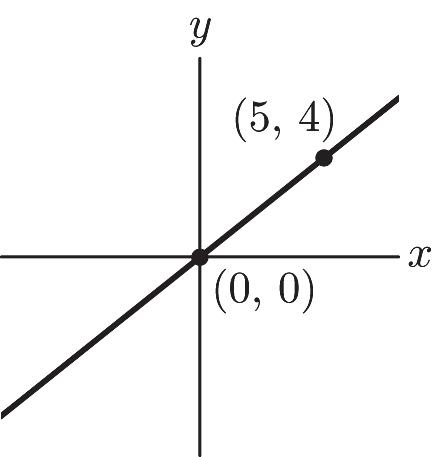
21. m = –1 y – 0 = –1(x – 0) y = –x
22. 1 2 1 – 2 –m ==
y – (–1) = 2(x – 2) y = 2x – 5
23. m = 0 y – 3 = 0(x – 2) y = 3
24. m = 1.5
y – 0 = 1.5(x – 0) y = 1.5x
Chapter 1: Linear Equations and Straight Lines
25. 3 – 6(–5) 5 3 3 5 yx yx = =+ y-intercept: (0, 3)
26. 4–4 0 0–1 m ==
27. Let y = cost in dollars. y = 4x + 2000
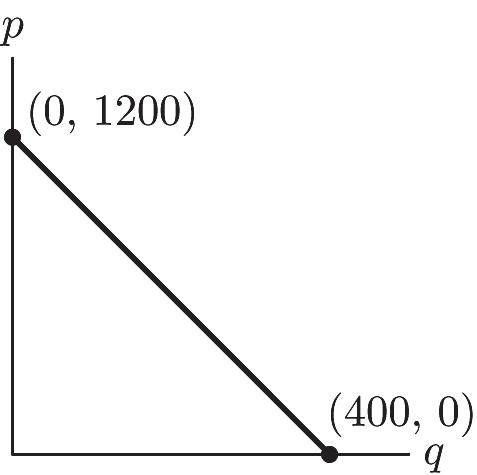
28. a. p-intercept: (0, 1200); at $1200 no one will buy the item.
b. 0 = –3q + 1200 q = 400 units q-intercept: (400, 0); even if the item is given away, only 400 will be taken.
c. –3; to sell an additional item, the price must be reduced by $3.
d. p = –3(350) + 1200 = $150
e. 30031200 300 items q q =-+ =
f.
29. a. Let x = altitude and y = boiling point. 212–202.8 .00184 0–5000 m ==212.00184(0) .00184212 yx yx -=-=-+
b. .00184212 .00184(29029)212 158.6F yx y y o »-+ »-+ »
Copyright © 2014 Pearson Education, Inc.
Chapter 1: Linear Equations and Straight Lines
30. a. 172–124 4 80–68 m == 1244(68) 4148 cF cF -==-
b. 1 37, 4 Fc=+ so add 37 to the number of chirps counted in 15 seconds 1 of a minute. 4 æö ÷ ç ÷ ç ÷ ç èø
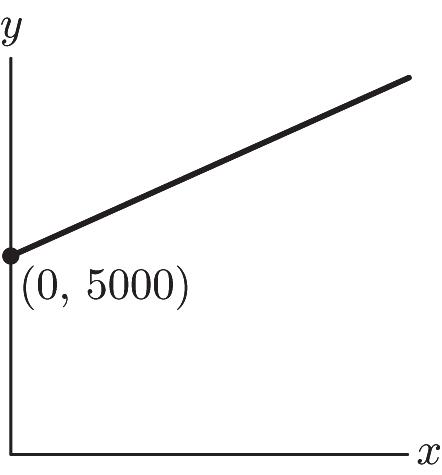
31. a. Let x = quantity and y = cost. 9500–6800 90 50–20 m == 680090(20) 905000 yx yx -==+
b. $5000
c. $90
d.
32. a. y = 40(100) + 2400 = $6400
b. 3600 = 40x + 2400 x = 30 coats
c. y = 40(0) + 2400 = $2400 (0, 2400); even if no coats are made there is a cost for having the ability to make them.
d. 40; each additional coat costs $40 to make.
33. a. 100(300) = $30,000
b. 6000100 60 coats x x = =
c. y = 100(0) = 0 (0, 0); if no coats are sold, there is no revenue.
d. 100; each additional coat yields an additional $100 in revenue.
34. a. Profit = revenue – cost y = 100x – (40x + 2400) y = 60x – 2400
b. (0, –2400); if no coats are sold, $2400 will be lost.
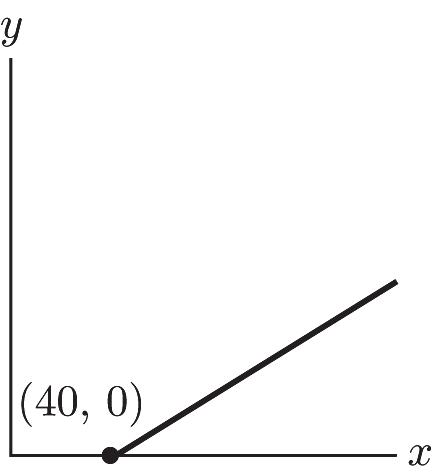
c. 0 = 60x – 2400 x = 40 (40, 0); the break-even point is 40 coats. Less than 40 coats sold yields a loss, more than 40 yields a profit.
d. 60; each additional coat sold yields an additional $60 profit.
e. y = 60(80) – 2400 = $2400
f. 6000 = 60x – 2400 x = 140 coats
g.
35. a.
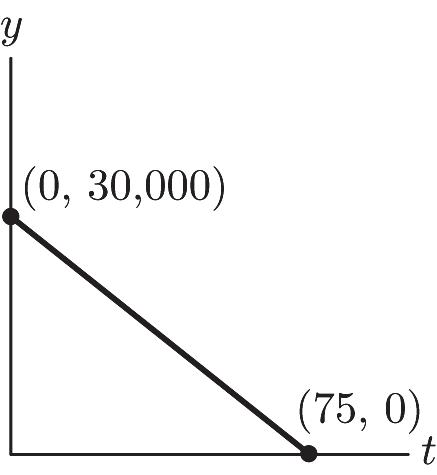
b. On February 1, 31 days have elapsed since January 1. The amount of oil y = 30,000 –400(31) = 17,600 gallons.
c. On February 15, 45 days have elapsed since January 1. Therefore, the amount of oil would be y = 30,000- 400(45) = 12,000 gallons.
d. The significance of the y-intercept is that amount of oil present initially on January 1. This amount is 30,000 gallons.
e. The t-intercept is (75,0) and corresponds to the number of days at which the oil will be depleted.
ISM: Finite Math
36. a.
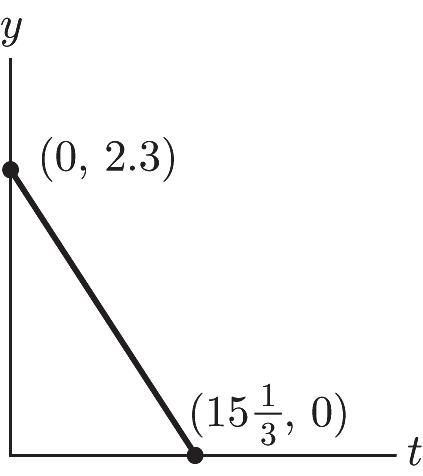
b. y = 2.3 – .15(15) = $.05 million
$50,000
c. (0, 2.3); $2.3 million is the amount of cash reserves on July 1.
d. 0 = 2.3 – .15t 1 15 3 t = 1 15,0; 3 æö ÷ ç ÷ ç ÷ ç èø the cash reserves will be depleted after 1 15 3 days.
e. y = 2.3 – .15(3) = $1.85 million
f. .8 = 2.3 – .15t t = 10
After 10 days, on July 11
37. a. 0.10220yx=+
b. 0.10(2000)220 420 y y =+ =
c. 5400.10220 $3200 x x =+ =
38. Each unit sold yields a commission of $5. In addition, she receives $60 per week base pay.
39. 1 –, 2 m = b = 0 1 –2 yx =
40. m = 3, b = –1 y = 3x – 1
Chapter 1: Linear Equations and Straight Lines
41. 1 –3 m = 1 – (–2)–(–6) 3 1 3 yx yx = =-
42. m = 1 y – 2 = 1(x – 1) y = x + 1
43. 1 2 m = 1 – (–3)(–2) 2 1 4 2 yx yx = =-
44. m = –7 y – 0 = –7(x – 5) y = –7x + 35
45. 2 –5 m = 2 – 5–(–0) 5 2 5 5 yx yx = =-+
46. m = 0 y – 4 = 0(x – 7) y = 4
47. 3–(–3) –1 –1–5 m == y – 3 = –1[x – (–1)] y = –x + 2
48. 2–11 4–22 m == 1 1(–2) 2 1 2 yx yx -= =
49. –1–(–1) 0 3–2 m == y – (–1) = 0(x – 2) y = –1
Copyright © 2014 Pearson Education, Inc.
Chapter 1: Linear Equations and Straight Lines
50. –2–0 –2 1–0 m == y = –2x
57. a. x + y = 1 y = –x + 1 (C)
51. 457 (3,1) 239 xy xy
ì += ï ï - í ï -= ï î (1)2(3) 126 27 yx yx yx --=+==-
52. 431 (4,5) 1 7 2 xy xy ì -= ï ï ï í ï += ï ï î 53(4) 5312 317 yx yx yx -=--=-+ =-+
53. Changes in x-coordinate: 1, –1, –2
Changes in y-coordinate are m times that or 2, –2, –4: new y values are 5, 1, –1
54. Change in x coordinates are 1, 2, –1. Change in y coordinates are m times that or –3, –6, 3. New y values are –1, –4, 5.
55. The slope is 1 4Changes in x coordinates are 1, 2, –1. Changes in y coordinates are m times the x coordinate changes. New y coordinates are 533 ,, 424
56. Changes in x-coordinate: 1, 2, 3
Changes in y-coordinate are m times that: 12 ,,1 33 y-coordinates: 1728 2,2,213 3333 +=+=+= 78 ;;3 33
b. x – y = 1 y = x – 1 (B)
c. x + y = –1 y = –x – 1 (D)
d. x – y = –1 y = x + 1 (A)
58. 4.8–3.6 12; 4.9–4.8 m == y – 6 = 12(x – 5) y = 12x – 54 b = –54
59. One possible equation is 1. yx=+
60. One possible equation is 1. yx=-+
61. One possible equation is 5. y =
62. One possible equation is 2. x =
63. One possible equation is 2 3 y x =-
64. One possible equation is 6 5 y x =
65. 212–329 100–05 m == 9 – 32(–0) 5 9 32 5 FC FC = =+
66. Let x = years B.C. and y = feet. 8–41 2100–1500150 m == 1 –4(–1500) 150 1 6 150 1 (3000)614 150 yx yx y ft = ==-=
67. Let 1995 correspond to x = 0. So in 2009, x = 14. When x = 0 , tuition is 2848. When x = 14, tuition is 6695. Using (0,2848) and (14,6695) as ordered pairs, find the slope of the line containing these points: 669528483847 14014=.
Since the y-intercept is 2848, the equation becomes 3847 2848. 14 yx=+ Therefore, in 2002 when x =7, the tuition should approximately be () 3847 728484771.50. 14 y =+=
68. Let 1990 correspond to x = 0. So in 2009, x = 19. When x = 0 , enrollment is 5.2 million. When x = 19, enrollment is 7.5 million. Using (0,5.2) and (19,7.5) as ordered pairs, find the slope of the line containing these points: 7.55.22.323 19019190==. Since the y-intercept is
5.2, the equation becomes 23 5.2. 190 yx=+ Therefore, the enrollment was at 6 million:
23 5.2 190
23 65.2 190
6.6 yx x x =+ =+ = Since x is the number of years after 1990, the enrollment was 6 million around 1997.
69. Let x = number of pounds tires are under inflated. When x = 0, the miles per gallon (y) is 25. When x = 1, mpg decreases to 24.5. The equation is 1 25 2 yx=-+ . Thus, when x = 8 pounds the miles per gallon will be 1 (8)2521 mpg 2 y =-+=
70. The slope is 1,382,600921,700 46090 10= . The equation is y = 46090x + 921,700. When x = 4 (2012), y = 46090(4) + 921,700 =1,106,060.
Chapter 1: Linear Equations and Straight Lines
71. Let 1991 correspond to x = 0 and 2009 correspond to x = 18. Then, the two ordered pairs are on the line: (0, 249,165) and (18,347,985). The slope of the line is 347,985249,165 5490 180=The equation of the line is therefore 5490249,165.yx=+ In the year 2014, x = 23, so the number of Bachelor’s degrees awarded can be estimated as 5490(23)249,165375,435. y =+=
72. The slope is 4929481837 93= . The equation is 37 4818. 3 yx=+ Find x when y = 5100. We have 37 51004818. 3 x =+ Solving for x gives x about 22.9 years or in the year 2024.
73. Let 2010 correspond to x = 0 and 2012 correspond to x = 2. Then, the two ordered pairs are on the line: (0, 2.5) and (2,3.5). The slope of the line is 3.52.5 .5. 20=The equation of the line is therefore .52.5.yx=+ In the year 2011, x = 1, so the cost of a 30-second advertising slot (in millions) can be estimated as .5(1)2.5$3 million. y =+=
74. The slope is 5003000 625 40=-. The equation is 6253000.yx=-+
75. The slope is 3.43 .4 65= -
3.4(5) 3.42 .41 ppmqq pq pq pq
Copyright © 2014 Pearson Education,
Chapter 1: Linear Equations and Straight Lines ISM: Finite Math
76. The slope is 3.13.1 .2 4.55.5==-
3.2(5) 3.21 .24 ppmqq pq pq pq
77. 9–5 2 42 m ==y – 5 ≤ 2(x – 2) y ≤ 2x + 1
78. y ≥ 4x + 3
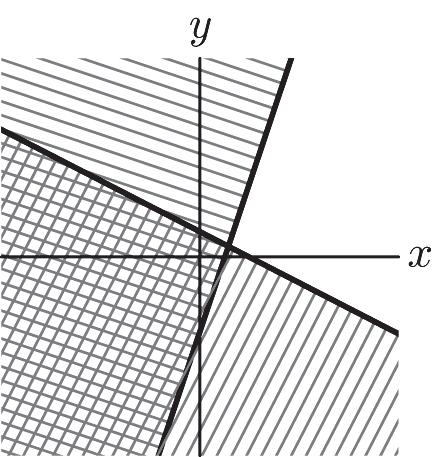
80. 1 3–41 –2–02 m == 1 –4 2 yx=+ 2 1–3 –1 4–2 m == 1(4) 5 yx yx -=-=-+ 3 1–0 1 4–3 m == 3 yx=1 –4 2 –5 –3 0,0 yx yx yx xy
81. 1 4–3 1 2–1 m == 2 –1–4 –5 3–2 m == 12mm ¹
79. 1 8–53 2–(–2)4 m == 3 –8(–2) 4 313 42 yx yx = =+ 2 1–87 –523 m ==7 –1–(–5) 3 738 33 yx yx = =-+ 3 1–54 –5–(–2)7 m == 4 –1–(–5) 7 427 77 yx yx = =-+ 313 42 738 –33 427 –77 yx yx yx
82. Set two slopes equal: 7–5–7 2–13–2 27 9 k k k = ==
Copyright © 2014 Pearson Education, Inc. 1-28
ISM: Finite Math
83. Set slopes equal: –3.1–12.4–0 2–3.8–(–1) 4.11 22 8.22 10.2 a a a a ==-==
84. Make slopes negative inverses of each other: 2.4–0 3.8–(–1) –3.1–11 –2–4.1 2 2 4.142 .05 a a a a ==-
85. Solve mxbmxb +=+¢¢ (–)––, –mmxbb bb x mm ¢¢ = ¢ = ¢ which is defined if and only if mm ¢ ¹
86. 11 : lymx = 22 : lymx = So the vertical segment lies on x = 1. Then 222 1 1 ma+= 222 2 1()mb+-=
Add equations and rearrange: 2222 12 – ()2abmm++= 1l and 2l are perpendicular if and only if 22222 121212 (–)–2 abmmmmmm +==+ or 2222–()–21212 abmmmm ++=
Substitute: 12 2–2 mm =
Therefore, the product of the slopes are –1.
87. Let x = Centigrade temperature y = Fahrenheit temperature 21232 1.8 1000 1.832 1.8(30)3286F m yx y===+ =+= Answer (b) is correct.
88. Let x = weight y = cost
Chapter 1: Linear Equations and Straight Lines
38511 60020 11 5 20 11 (20)5$16 20 m yx y===+ =+=
The answer is (c).
89. Let x = number of T-shirts profit = revenue – cost
65,00012.50(825,000)
90,0004.50 20,000 xx x x =-+ = =
So 20,000 T-shirts must be produced and sold. Answer (d) is correct.
90. Let x = number of units profit = revenue – cost 2,000,000130(1001,000,000) 3,000,00030 100,000 units xx x x =-+ = = Answer (e) is correct.
91. 8004(150) 200 bikes q == revenue = 150(200) = $30,000 Answer (d) is correct.
92. 220025(8) 2000 cameras n == revenue = 8(2000) = $16,000 Answer (c) is correct.
93. Let x = variable costs For 2008: profit = revenue – cost 400,000100(50,000)(50,000600,000)
50,0004,000,000
$80 per unit x x x =-+ = = For 2009: Let y = 2009 price profit = revenue – cost 400,00050,000 [80(50,000)600,000200,000]
5,200,00050,000
$104 y y y =++ = = Answer (d) is correct.
Chapter 1: Linear Equations and Straight Lines
94. Let x = variable costs
For 2008: profit = revenue – costs
95
96.
97.
300,000100(50,000)(50,000800,000)
50,0003,900,000
$78 per unit x x x =-+ = = For 2009: Let y = 2009 price profit = revenue – cost
5,200,00050,000 $104 y y y =++ = = Answer (d) is correct.
300,00050,000 [78(50,000)800,000200,000]
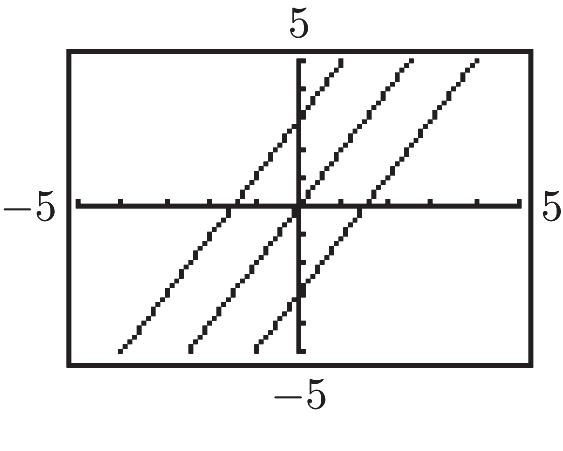
From left to right the lines are y = 2x + 3, y = 2x, and y = 2x – 3.
The lines are distinguished by their y-intercepts, which appear as b in the form y = mx + b.
No, do not appear perpendicular 10 –10 –1515
Do appear perpendicular
98.
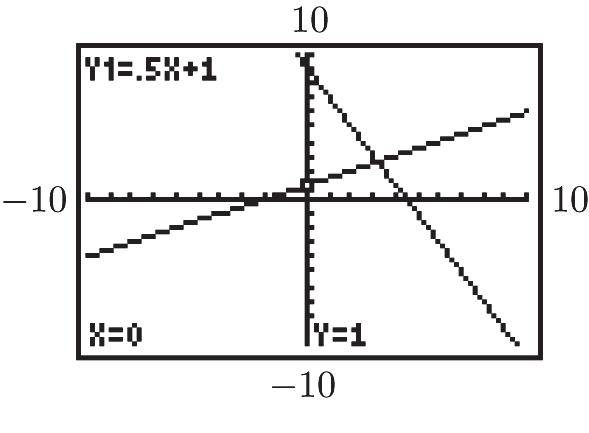
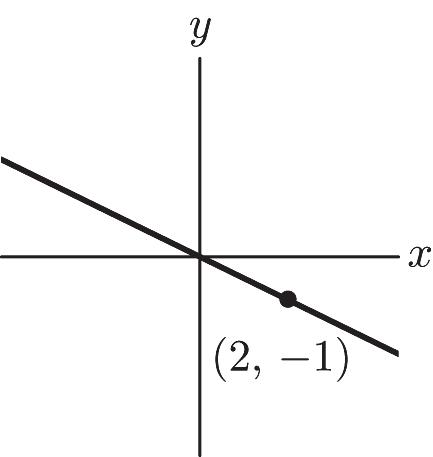
Since the slope equals 1 2 - , moving 2 units to the right requires moving 1 21 2 æö ÷ ç ⋅-=÷ ç ÷ ç èø unit up, or 1 unit down.
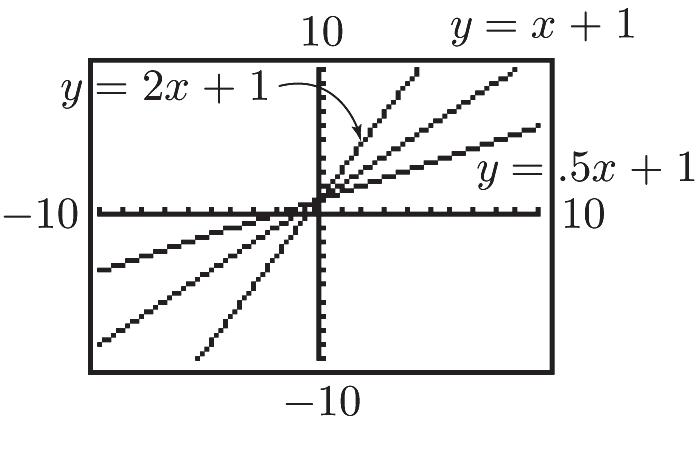
The steeper the line, the greater the slope m in y = mx + b form.
99.
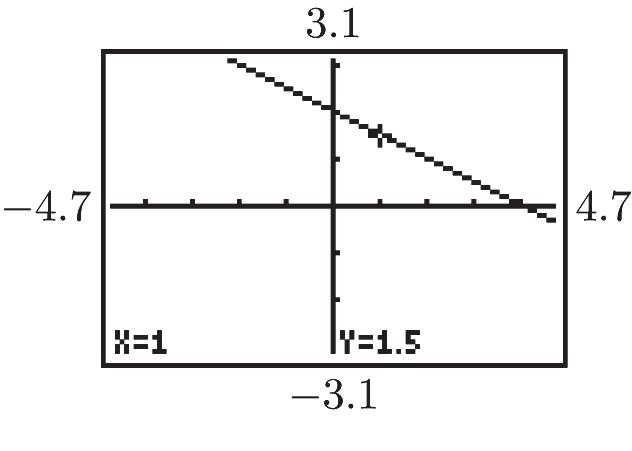
Since the slope equals 0.7, moving 2 units to the right requires moving 2.71.4 ⋅= units up.
Exercises 1.5 1.
Data Point Point on Line Vertical Distance (1, 3) (1, 4) 1
(2, 6) (2, 7) 1 (3, 11) (3, 10) 1
(4, 12) (4, 13) 1 2222 11114 +++=
2. Data Point Point on Line Vertical Distance
(1, 11) (1, 10) 1
(2, 7) (2, 8) 1
(3, 5) (3, 6) 1
(4, 5) (4, 4) 1 E = 2222 11114 +++=
Copyright © 2014 Pearson Education, Inc. 1-30
ISM: Finite Math
3. 22 1 [1.1(1)3–3]1.21 E =+=
22 2 [1.1(2)3–6].64 E =+=
22 3 [1.1(3)3–8]2.89 E =+=
22 4 [1.1(4)3–6]1.96 E =+= E = 1.21 + .64 + 2.89 + 1.96 = 6.70
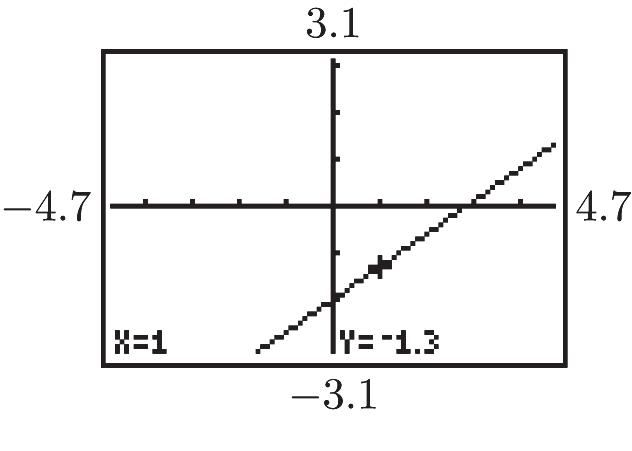
4. 22 1 [–1.3(1)8.3–8]1.00 E =+=
22 2 [–1.3(2)8.3–5].49 E =+=
22 3 [–1.3(3)8.3–3]1.96 E =+=
22 4 [–1.3(4)8.3–4].81 E =+=
22 5 [–1.3(5)8.3–2].04 E =+=
Chapter 1: Linear Equations and Straight Lines
6.
Chapter 1: Linear Equations and Straight Lines
7. 6,18,45,xyxy ååå=== 2 14 x = å
2 345–618 4.5 314–6 m == ⋅ 18–(4.5)(6) –3 3 b ==
y = 4.5x – 3
8. 7,15,28,xyxy ååå===
2 21 x = å
2 328–715 –1.5 321–7 m == ⋅
15–(–1.5)(7) 8.5 3 b ==
y = –1.5x + 8.5
9. 10,26,55,xyxy ååå===
2 30 x = å
2 455–1026 –2 430–10 m == ⋅ 26–(–2)(10) 11.5 4 b ==
y = –2x + 11.5
10. 10, 28,77,xyxy ååå===
2 30 x = å
2 477–1028 1.4 430–10 m == ⋅
28–(1.4)(10) 3.5 4 b ==
y = 1.4x + 3.5
11. a. 12, 7,41,xyxy ååå===
2 74 x = å
2 241–127 .5 274–12 m ==-
7–(.5)(12) 6.5 2 b== .56.5yx=-+
b. 4–31 .5 5–72 m ==-=3.5(–7) .56.5 yx yx -==-+
c. The least–squares error for the line in (b) is E=0.
12. The least–squares error for the line E=0.
13. a. 7, 20,90,xyxy ååå=== 2 37 x = å 2 290–720 1.6 237–7 m ⋅⋅ == 20–(1.6)(7) 4.4 2 b == 1.64.4yx=+
b. 2 [1.6(4)4.4–5]33.64 E =+=
14. a. 10, 19,104,xyxy ååå===
2 52 x = å 2 2104–1019 4.5 252–10 m == ⋅ 19–(4.5)(10) 13 2 b ==4.513yx=-
b. 2 [4.5(1)13–6]210.25 E =-=
15. a. Let x represent city and y represent highway, then 179, 167,7537,xyxy ååå===
2 8067 x = å 2 47537–179167 1.12335 48067–179 m == ⋅ 167–(1.12335)(179) 8.51982 4 b ==1.123358.51982yx=-
b. 1.12335(47)8.51982 44.28 mpg y y == c. 471.123358.51982 49.42 mpg x x ==
16. a. Let x represent stores and y represent sales, then 18.142, 12,046,66475.541,xyxy ååå===
2 97.244363 x = å 2 466475.541–18.14212046 790.638 497.244363–18.142 m == ⋅ 12046–(790.638)(18.142) 574.437 4 b ==790.638574.437yx=-
b. 790.638(4)574.437 2588.115 million $2,588,115,000 y y y == =
c. 1500790.638574.437 2.624 thousand 2624 x x x == =
Copyright © 2014 Pearson Education, Inc.
17. a. y = .338x + 21.6
b. .338(1100) + 21.6 = 393.4 About 393 deaths per million males
18. a. y = 2648.1x – 2436.8
b. 2648.1(2.04) – 2436.8 = 2965.324 About 2965 average miles per automobile
c. 11,8682648.12436.8 5.40 x x =»
About $5.40
19. a. Let x be the number of years after 1985, then y = 0.423x + 19.2
b. .423(23) + 19.2 = 28.929 About 28.9%
c. 32.42319.2 30.26 x x =+ » The year 2015
20. a. Let x be the number of years after 2000, then y = .24x + 12
b. .24(5) + 12 = 13.2 13.2 million
c. 170.2412 20.83 x x =+ = The year 2021
21. a. y = .1475x + 73.78
b. .1475(30) +73.78 = 78.205 About 78.2 years
c. .1475(50) +73.78 = 81.155 About 81.2 years
d. .1475(90) +73.78 = 87.055
About 87.1 years (This is an example of a fit that is not capable of extrapolating beyond the given data)
22. a. y = –1.274x + 5.792
b. The higher the independence, the lower the inflation rate.
c. –1.274(.6) + 5.792 = 5.0276
About 5.0%
d. 6.8 = –1.274x + 5.792 x ≈ –.791
About –.8
23. a. Let x be the number of years after 2000, then y = .028x + .846
b. .028(9) + .846 ≈ 1.098
About $1.10
c. 1.35.028.846 18 x x =+ =
The year 2018
24. a. y = 1.60x + 321.6
b. The year 2000 is 32 years after the base year of 1968, therefore: 1.60(32) + 321.6 = 372.8 372.8; It is close to the actual value.
c. 4011.60321.6
49.625 x x =+ »
The year is 50 years after 1968 or 2018.
Chapter 1 Fundamental Concept Check
1. To determine the x-coordinate (y-coordinate), draw a straight line through the point perpendicular through the x-axis (y-axis) and read the number on the axis.
2. The graph is the collection of points in the plane whose coordinates satisfy the equation.
3. ,axbyc += where both a and b are not 0.
4. ymxb =+ or x a =
Chapter 1: Linear Equations and Straight Lines
5. The y-intercept is the point at which the graph of the line crosses the y-axis. To find the yintercept, set 0 x = and solve for y. Then the yintercept is the point (0, solution for y).
6. The x-intercept is the point at which the graph of the line crosses the x-axis. To find the xintercept, set 0 y = and solve for x. Then the xintercept is the point (solution for x, 0).
7. See the tinted box on page 5.
8. If ab < then ,, acbcacbc +<+-<acbc (when c is positive), and acbc > (when c is negative).
9. General forms: or cxdyecxdye +£+³ where c and d are not both 0. Standard forms: ,,, and .ymxbymxbxaxa £+³+£³
10. Put the inequality into standard form, draw the related linear equation, and cross out the side that does not satisfy the inequality.
11. The collection of points that satisfy every inequality in the system.
12. First put the two linear equations into standard form. If both equations have the form y = something, equate the two expressions for y, solve for x, substitute the value for x into one of the equations, and solve for y. Otherwise, substitute the value of x into the equation containing y and solve for y
13. The slope of the line ymxb =+ is the number m. It is a measure of the steepness of the line.
14. Plot the given point, move one unit to the right the m units in the y-direction (up if m is positive and down if m is negative), plot the second point, and draw a line through the two points.
15. 11(),yymxx -=- where ( ) 11 , x y is a point on the line and m is the slope of the line.
16. First calculate the slope 21 21 . yy m x x=Then, use m, either of the two points, and the point-slope formula to write the equation for the line.
17. One slope is the negative reciprocal of the other.
18. They are the same.
19. The straight line that gives the best fit to a collection of points in the sense that the sum of the squares of the vertical distances from the points to the line is as small as possible.
Chapter 1 Review Exercises
ISM: Finite Math
7. 3(1) + 4(2) ≥ 11 3 + 8 ≥ 11 11 ≥ 11 Yes
8. 2–1 213 xy xy ì = ï ï í ï += ï î 2–1 113 –22 yx yx ì = ï ï ï í ï =+ ï ï î 113 2–1–22 515 22 3 xx x x =+ = = y = 2(3) – 1 = 5 (3, 5)
9. 2107 17 –510 xy yx -= = 1 5 m = 1 – 16(–15) 5 1 13 5 yx yx = =+
10. y = 3(1) + 7 = 10
11. (5, 0)
12. 13. 3–21 224 xy xy ì = ï ï í ï += ï î 31 22 –224 yx yx
Chapter 1: Linear Equations and Straight Lines
=+ ï î 31 – –224 22 749 22 7 xx x x =+ = = y = –2(7) + 24 = 10 (7, 10) 14. 2728 2–0 8 yx yx y ì +³ ï ï ï ï ³ í ï ï ï£ ï î 7 – 14 2 1 2 8 yx yx y ì ï ï ³+
15. 1 – 9(–4) 2 1 7 2 yx yx = =+ b = 7 (0, 7)
16. The rate is $35 per hour plus a flat fee of $20.
17. 1 0–2 –2 2–1 m == 2 1–0 1 3–2 m == 12mm ¹ No
18. –2–02 ,–2 0–33 mb=== 2 – 2 3 yx =
Copyright © 2014 Pearson Education, Inc.
Chapter 1: Linear Equations and Straight Lines ISM: Finite Math
19. 730 2730 530 6 xy yy y y += -+= = = Answer (d) is correct.
20. 23 32yx£+
21. 8.6–(–1) 2.4 6–2 m == 12.4(2) 2.45.8 yx yx +³³-
22. 1.22.4.6 4.8–1.62.4 xy yx
ì += ï ï í ï = ï î –.5.25 1 .5 3 yx yx ì =+ ï ï ï í ï =+ ï ï î 1 –.5.25.5 3 5 .25 6 .3 xx x x +=+ -= =1 (–.3).5.4 3 y =+=
23. – 1 23 yx yx
ì =+ ï ï í ï =+ ï î 123 32 2 –3 xx x x -+=+ -= = 25 ––1 33 y æö ÷ ç =+= ÷ ç ÷ ç èø 25 –, 33 æö ÷ ç ÷ ç ÷ ç èø 5 3 2 3 –1 2 –5 ––1 m == 2 – 1–(–1) 5 27 55 yx yx = =-+
24. 23(2)0 56 6 5 xx x x +-³ ³ ³
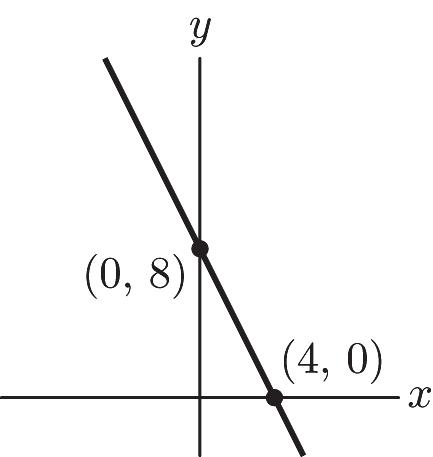
25. 1 4 2 28 xy yx += =-+
m = –2
y-intercept: (0, 8)
0 = –2x + 8 x = 4
x-intercept: (4, 0)
26. 520 1 xy xy
ì += ï ï í ï += ï î 5 –2 – 1 y x yx ì ï ï = ï í ï ï =+ ï î 5 – –1 2 3 1 2 2 3 xx x x =+ -= =25 ––1 33 y æö ÷ ç =+= ÷ ç ÷ ç èø
Substitute 2 –3 x = and 5 3 y = in 231 25 2––31 33 19 1 3 xy-= æöæö çç÷÷ = çç÷÷ çç÷÷ èøèø -= No
Copyright © 2014 Pearson Education, Inc. 1-36
ISM: Finite Math
27. 231 324 xy xy ì -= ï ï í ï += ï î 21 –33 3 – 2 2 yx yx
ì ï ï = ï ï ï í ï ï =+ ï ï ï î 1 2 1 – m m =
28. a. x + y ≥ 1 y ≥ –x + 1 (C)
b. x + y ≤ 1 y ≤ –x + 1 (A)
c. x – y ≤ 1 y ≥ x – 1 (B)
d. y – x ≤ –1 y ≤ x – 1 (D)
29. a. 4x + y = 17 y = –4x + 17
3L
b. y = x + 2 1L
c. 2311 211 –33 xy yx += =+ 2L
Chapter 1: Linear Equations and Straight Lines
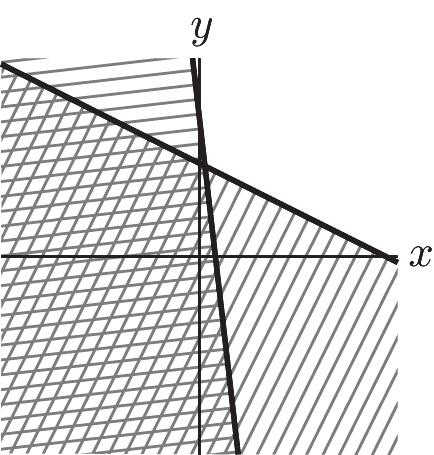
30. 3 2 11 –5 7 – ,5 4–08 mb=== 7 – 5 8 yx=+ 2 1 18 –7 m m == 38 – (–4) 27 843 714 yx yx = =7 – 5 8 843 –714 0,0 yx yx xy ì ï ï £+ ï ï ï ï ï ï ³ í ï ï ï ï ³³ ï ï ï ï î 843 0–714 x = 43 16 x = 43 ,0 16 æö ÷ ç ÷ ç ÷ ç èø
31. Supply curve is p = .005q + .5 Demand curve is p = –.01q + 5 .005.5 .015 pq pq ì =+ ï ï í ï =-+ ï î .005.5.015 .0154.5 300 units qq q q +=-+ = = p = .005(300) + .5 = $2
32. 0 0 x y ì ³ ï ï í ï ³ ï î (0, 0) 0 550 y xy ì ³ ï ï í ï +£ ï î 0 –550 y yx ì ³ ï ï í ï £+ ï î 0 = –5x + 50 x = 10 (10, 0)
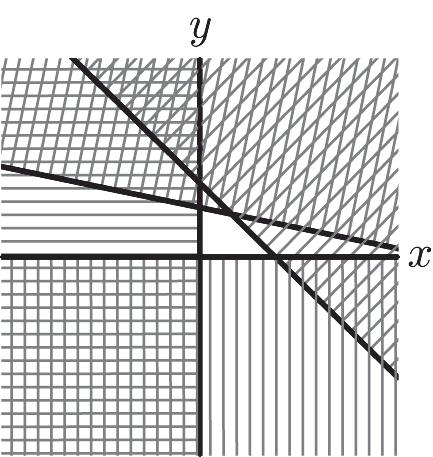
550 2333 xy xy ì +£ ï ï í ï +£ ï î –550 2 – 11 3 yx yx ì £+ ï ï ï í ï £+ ï ï î 2 –550–11 3 13 39 3 9 xx x x +=+ -== y = –5(9) + 50 = 5 (9, 5)
Copyright © 2014 Pearson Education, Inc.
Chapter 1: Linear Equations and Straight Lines
î 28 0 xy x
³-
³ ï î 2y – 8 = 0 y = 4 (0, 4)
33. a. In 2000, 8.9% of college freshmen intended to obtain a medical degree.
b. 2011200011 -= 0.1(11)8.9 10 y y =+ =
10% of college freshmen in 2011 intended to obtain a medical degree. It is close to the actual value.
c. 9.3.18.9 4 200042004 x x =+ = += In 2004, the percent of college freshmen that intended to obtain a medical degree was 9.3.
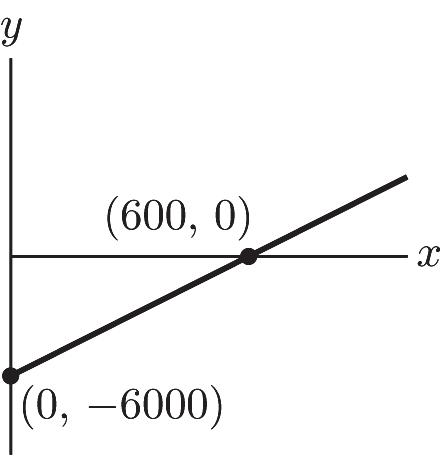
34. a. m = 10 400010(1000) 106000 yx yx -==-
b. 0 = 10x – 6000 x = 600 x-intercept: (600, 0) y-intercept: (0, –6000)
c.
35. a. A: y = .1x + 50 B: y = .2x + 40
b. A: .1(80) + 50 = 58 B: .2(80) + 40 = 56 Company B
c. A: .1(160) + 50 = 66 B: .2(160) + 40 = 72 Company A
d. .1x + 50 = .2x + 40 –.1x = –10 x = 100 miles
36. a. 1.44–.93 .046 110 m ==.93.046(0) .046.93 yx yx -==+
b. 1.27.046.93 7.39 x x =+ » The year 2000 + 7 = 2007
37. x ≤ 3y + 2 12 –33yx ³
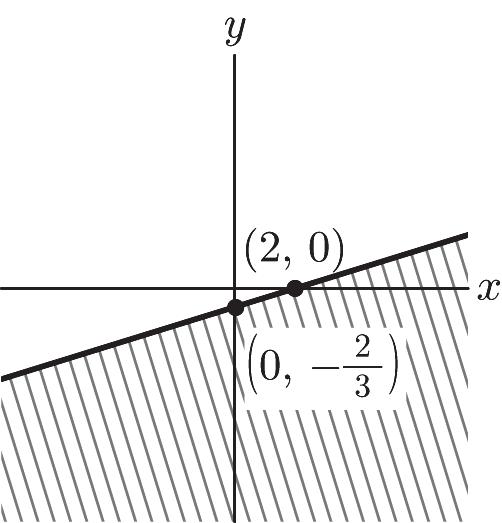
ISM: Finite Math
38. .03200.05100 .02100 $5000 xx x x +=+ -==
39. 11 5–05 ,5 0–(–4)4 mb=== 5 5 4 yx=+ 22 0–22 – ,2 5–05 mb=== 2 – 2 5 yx=+ 33 0–(–3)3 ,–3 5–05 mb=== 3 – 3 5 y x = 44 –5–05 – ,–5 0–(–2)2 mb=== 5 – –5 2 yx = 5 5 4 2 – 2 5 3 – 3 5 5 – –5 2 yx yx yx y
ì ï ï £+ ï ï ï ï ï ï £+ ï ï ï í ï ï ³ ï ï ï ï ï ï ï ³ ï ï î
40. 11 2–02 – ,2 0–33 mb=== 2 – 2 3 yx=+
The other lines are x = –2, x = 4, and y = –3. 2 – 2 3 –2 4 –3 yx x x y ì ï ï £+ ï ï ï ï ï ³ í ï ï £ ï ï ï ï ³ ï î
Chapter 1: Linear Equations and Straight Lines
41. (0, 483,600) ; in 2018: (10, 647,500) 647,500483,600 16390 100 m==483,60016390(0)
16,390483,600 yx yx -==+
For the year 2014, x=6: 16390(6)483,600581,940. y =+=
42. Slope of line is –282.77. Equation of line is: y = –282.77x + 105,384. In 2014, x = 18 so y = 100,294.
43. Let x = 0 correspond to year 2000. Then y = 20.4. When x = 10, y = 17.0. The rate of change (slope) = (17.0 – 20.4)/(10 – 0) = –.34.
The equation of the line that predicts the percentage of market is y = –.34x + 20.4. When x = 8, y = 17.7%.
44. a. y = .936x + 10.8
b. .936(77.5) +10.8 = 83.34 About 83.3 years
c. 84.5.93610.8 78.74 x x =+ » About 78.7 years
45. a. y = .2075x + 2.43
b. .2075(14) +2.43 =5.34 About 5.3%
c. 5.75.20752.43 16 x x =+ = 16 years after 1999 or 2015
46. a. y = .152x – 3.063
b. .152(160) – 3.063 = 21.257 About 21 deaths per 100,000
c. 22 = .152x – 3.063 x ≈ 164.888 About 165 grams
47. Up; the value of b is the y-intercept
48. Counter - Clockwise
49. When the line passes through the origin.
Copyright © 2014 Pearson Education, Inc.
Chapter 1: Linear Equations and Straight Lines
50. A line with undefined sloe is a vertical line and a line with zero slope is a horizontal line.
51. a. No; A line that is parallel to the x axis and is not the x axis will not have an x intercept.
b. No; A line that is parallel to the y axis and is not the y axis will not have a y intercept
52. Answers will vary.
Chapter 1 Project
1. p = –.4q + 400
2. p = –.4(350) + 400 = $260 Revenue = 260(350,000) = $91,000,000
3. 300.4400 250 thousand cameras q q =-+ = Revenue = 300(250,000) = $75,000,000
4. 1000q(–.4q + 400) = –400q 2 + 400,000q
5. Cost = 100,000q + 8,000,000
6. On your graphing calculator, set the window values to: :[0,1000] x and :[0,100,000,000] y and graph both equations. The graph intersects at x ≈ 27.69, y ≈ 10,768,890, and x ≈ 722.31, y ≈ 80,231,110.
7. The break-even point is q ≈ 27.69. That is, when 27,690 cameras are sold.
8. The company will make a profit when 27.69 < q < 722.31.