Chapter 3
Problem 3.1
a.) Equilibrium approach
Substitute (4) and (5) into (3):
Quasi
substitute (8) and (9) into (3):
Problem 3.2 * r values are the same as k values all are rate constants
Combine (3) + (4):
Substitute (3) and (5) into (2):
Substituting (ES) in terms of E
LetV
Divide top and bottom by (r-1 + r2) and let
Problem 3.3
a)
b)
Problem 3.4.
At low substrate concentrations So< 150 mg/l substrate inhibition is negligible.
V0 = Vm0 So / (Km + So) or 1/V0 = 1/ Vm + Km/Vm (1/S0)
For S0 < 150 mg/l Plot 1/V0 versus 1/S0
Slope = Km/Vm0 = 13.8 y-intercept = 1/ Vm = 0.023
Then, Vm = 43.5 mg/l-h and Km = 600 mg/l
At high substrate concentrations above 150 mg/l , substrate inhibition is significant.
V0 = Vm0/ (1+ S0/Ksı) or 1/V0 = 1/Vm0 + S0/Vm Ksı
For S0 > 150 mg/l plot 1/V0 versus S0
Slope = 1/ Vm0Ksı = 2.59x 10⁻³ Then, Ksı = 8.9 mg/l
Low Ksı indicates severe substrate inhibition.
Problem 3.5.
Plot 1/V versus 1/S at different inhibitor concentrations
Since the lines intercept at the same point on y-axis inhibition is competitive (Constant Vm, increased Km).
For I = 0 , No inhibitor : From the intercept on y axis , 1/Vm = 0.2 and Vm = 5 mM/h
And from the intercept on X-axis, - 1/Km = -1.2 and Km = 0.83 mM
From 1/V versus 1/S plot for I = 1.3 mM and S0 = 0.50 mM V = 1.3 mM/h
Then, V = Vm S/ (Km(1+I/Ksı)) + S , 1.3 = 5(0.5)/ (0.83(1+1.3/Kı) + 0.5 )
Then Kı = 1.82 mM
Problem 3.6 .
a. V = Vm (1 + A/KA) S /(Ks + S) = Vm (1+A/KA) / (1+Ks/S)
Define Vm(1+ A/KA) = Vapp and plot Vapp versus activator (A or M0) concentration
Slope = 9.2x 10-3 = Vm/KA and y –intercept = Vm = 0.04 ml/h
Then, KA = 4.35 ug/l
b. V= Vm (1+ KA) = 0.04(1+60/4.35) = 0.59 ml/h
Problem 3.7.
a. V = KL (S0 - Ss) = Vm Ss / (Km+ Ss)
Ss = S0 – V/KL Calculate Ss at different RPMs RPM
Ss(mg/l)
b. V = Vm Ss/ (Km+ Ss) or 1/V = 1/Vm + Km/Vm (1/Ss)
Plot 1/V versus 1/Ss at different RPMs
1/Ss
y- intercept: 1/Vm = 0.02 Vm = 50 mg/l
Slope : Km/Vm = 0.42 Then, Km = 21 mg/l
Problem 3.8
Plot 1/V versus 1/S (Lineweaver – Burk plot)
SinceKm,app> Km the inhibitor is competitive.

Problem 3.10
Plot 1/V versus 1/S
a.) For E0 = 1.6 g/L
Km = 0.0246 mmol/ml at 30°C Km = 0.0238 mmol/mlat 49.6°C
b.) m 1mmol V3.31 0.302ml.min
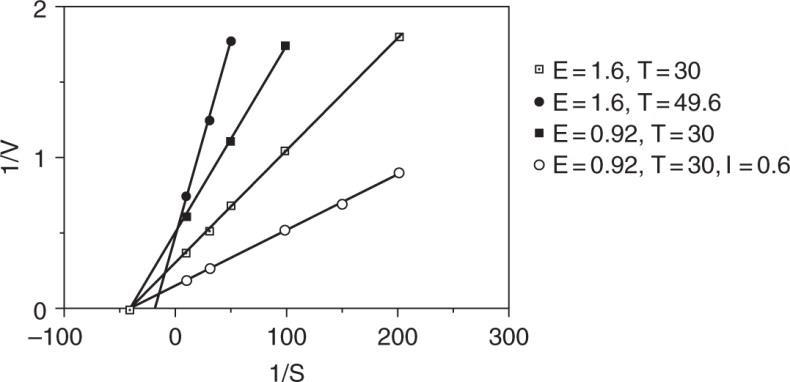
c.) The inhibitor is competitive.
Problem 3.11
Michaelis-Menten Kinetics:
10% of the crude protein was ATPase.
Problem 3.12
At steady – state: reaction rate = mass transfer rate
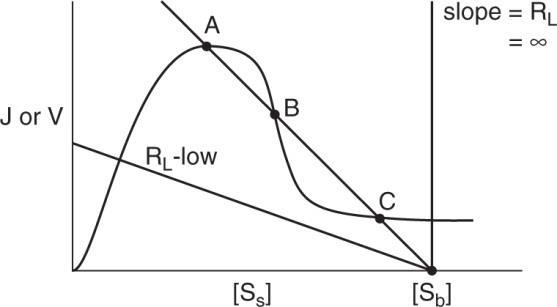
Solving graphically,
a.) For [Sb] when the enzyme is inhibited and kL has an intermediate value, multiple steady states are possible.
Multiple steady – states occur as the enzyme changes from being reaction controlled to being diffusionally controlled.
b.) Yes. Diffusional limitations can decrease the substrate concentration such that it is no longer inhibitory. Thus the apparent reaction rate will be greater than the intrinsic reaction rate for [SS] less than [Sb
Problem 3.13
By inspection,Vmax = 125 μmol/min, Km = 20 μmol/L
Plot V versus V/[S](Eadie- Hofstee) where y-int = Vm, x-int. = Vm/Km and slope = - Km.
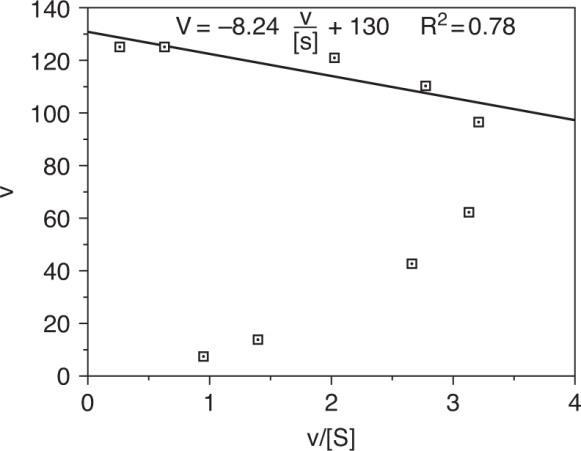
Plotting the date and using the data points for high substrate concentration, Vm = 130 μmol/min, Km = 8.24 μmol/L
From the plot it is obvious that the data do not fit into Michaelis – Menten kinetics at low substrate concentrations.
Some of the error may be attributed to the method since both axes contain v. However, there are two possible explanations for the deviations from Michaelis – Menten Kinetics:
(i) the enzyme is immobilized, thus diffusional effects become important (ii) there might be unspecific binding of substrate to the enzyme thus requiring a critical substrate concentration for the reaction to follow Michaelis – Menten Kinetics.
Problem 3.14
a.) Plot [P] versus t data for both cases.
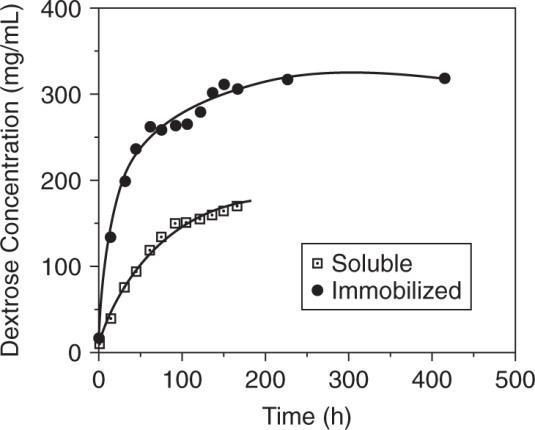
Obtain rates by taking tangents at specific time points.
dP vslopeoftangent dt
Obtain the amount of substrate present for both cases by a mass balance.
2 MW 180 18 HOStarchdextrose
amount of dextrose formed (0.1) = amount of H2O used (180) (0.1) = 18
starch remaining = S0 – (dextrose formed – H2O used) = S0 – 0.9 ∆ P
Using initial time data, a plot of 1/V versus 1/S can be made.
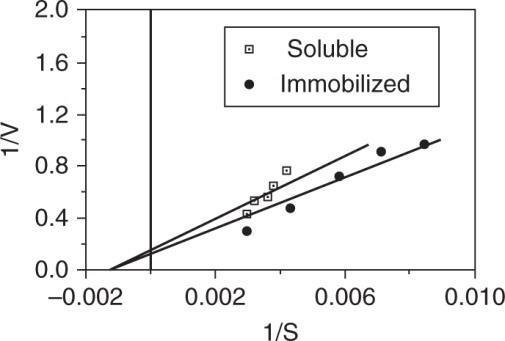
Soluble:
mLminunitenzyme
1mgK575 0.00174mL
Immobilized:
K575mgmL 0.00174
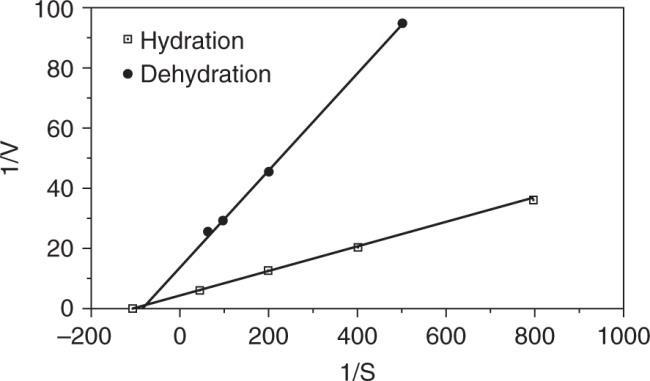
b.) Plot In Vm versus 1/T for both cases.
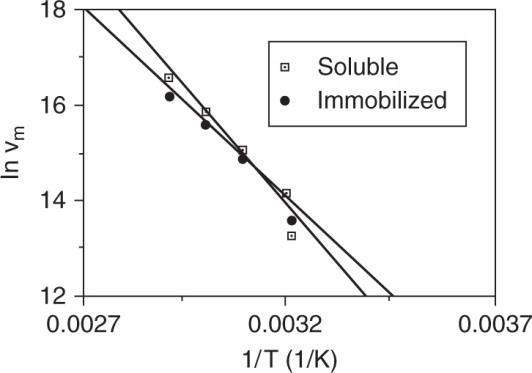
Immobilized: lnVm = 35.65 – 6582 (1/T)
c.) Since Km (soluble) = Km (apparent) there is no diffusional limitation.
Problem 3.15
In vitro batch reactors represent a closed system of constant volume, thus Michaelis-Menten Kinetics and the quasi-steady-state approximation will not describe the system when E0 ≈ S0 However, intracellular enzyme reactions are open systems where there is a continuous supply and depletion of substrate and product provided by the interaction of cellular compartments and the intracellular and extracellular environments. E0 and S0 may be the same, but the concentrations may be orders of magnitude different either in different organelles or inside versus outside the cell.
Problem 3.16
Harry’s reasoning is wrong. The soluble enzyme is reaction controlled while the immobilized enzyme may experience diffusional limitations. Thus the substrate is consumed more slowly giving rise to a larger apparent half-life. The large particle size may result in an unused or “reserved” catalytic capacity.
Problem 3.17
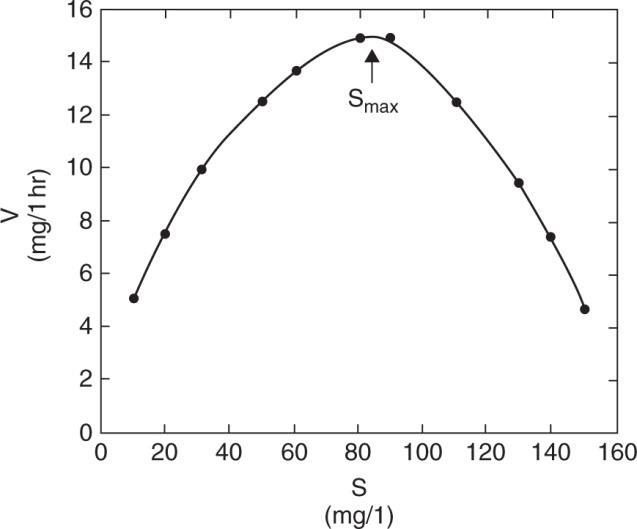
(a) Plot of V us. S indicates that this is substrate inhibition
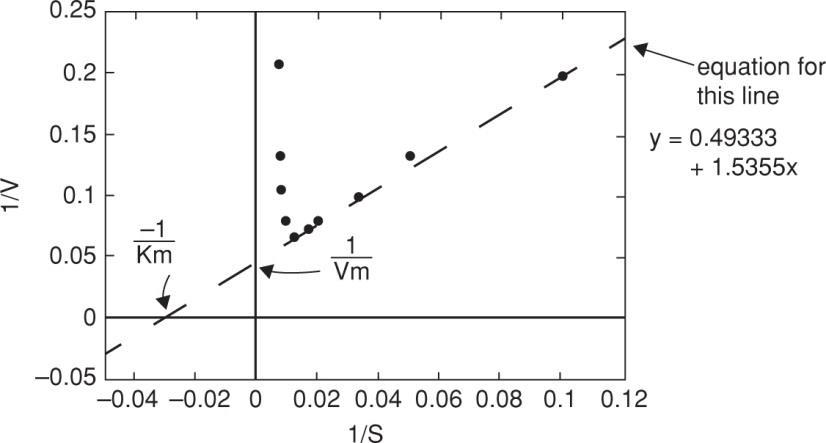
(b) Vm andK' m are determined from low substrate concentration where inhibition is not ineffect: mm
1Vis at x01V0.049333 V20.3mglh
1Kis at y000.0493331.53551K
0.0493331K31.1mgl 1.5355K
Determine KSI from maximum reaction rate; which is determined by setting
From plot,
(c) Rate of reaction at S = 70 mg/l?
Since inhibition effect is observed at this substrate, we must use (eg) 3.34
Problem 3.18
reaction rate with diffusion Effectivenesslimitation factor = reaction rate with no diffusion limitation
We are given the reaction rate with diffusion limitation. To determine the reaction rate with no diffusion limitation, lets look at what happens to the rate as the particle gets smaller, and diffusional limitations are minimized. Aplot of Rate vs. particle size indicates that the rate reaches a maximum at small particle size (0.1cm). At this size there is no diffusion limitation, and the rate is N 200 mg/l hr

(a) Effectiveness factor at
b. Assume negligible film resistance, so Sbulk = Ssurface Determine rate u/o diffusional limitation from effectiveness factor:
Plot 1/V vs 1/S to obtain the following:
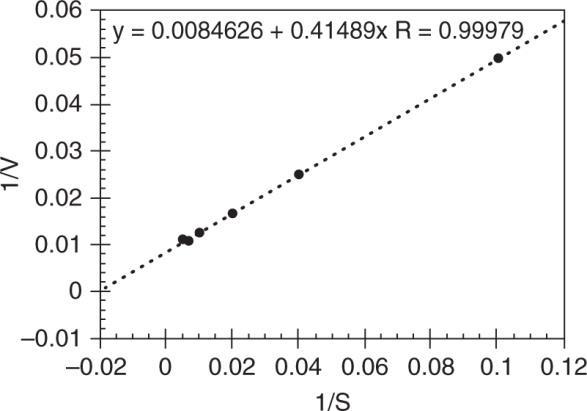
mm1/Visatx0: y0.0084626 V118.2mguA/lh
1/Km is at y = 0: 0 =0.0084626 + 0.41489 (–1/Km) m m 0.00846261
Problem 3.20
(a) Plot 1/V vs 1/S for all cases to determine the type of inhibition
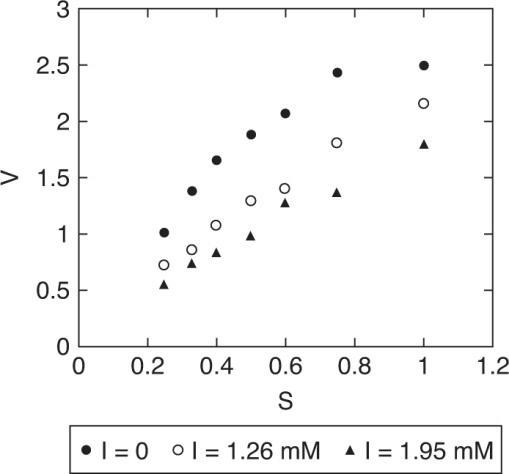
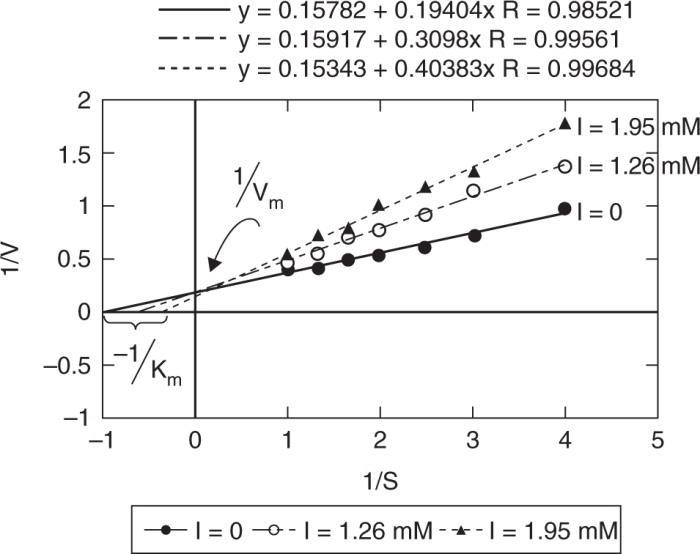
Vmax is the same, regardless of inhibition, but as I increases, –1/Km decreases (apparent), that is an increased value of Km,app, resulting in a reduction in reaction rate. This is characteristic of Competitive Inhibition
(b) Determine Vm, Km, KI
Vm, Km can be determined from the I = 0 case.@ I = 0 (1/V) = 0.15782 + 0.19404 (1/S)
KI must be determined from the I > 0 case
We would expect that KI is the same at different concentrations of inhibitor. The differences in the two values shown here are due to experimental error.
Problem 3.22
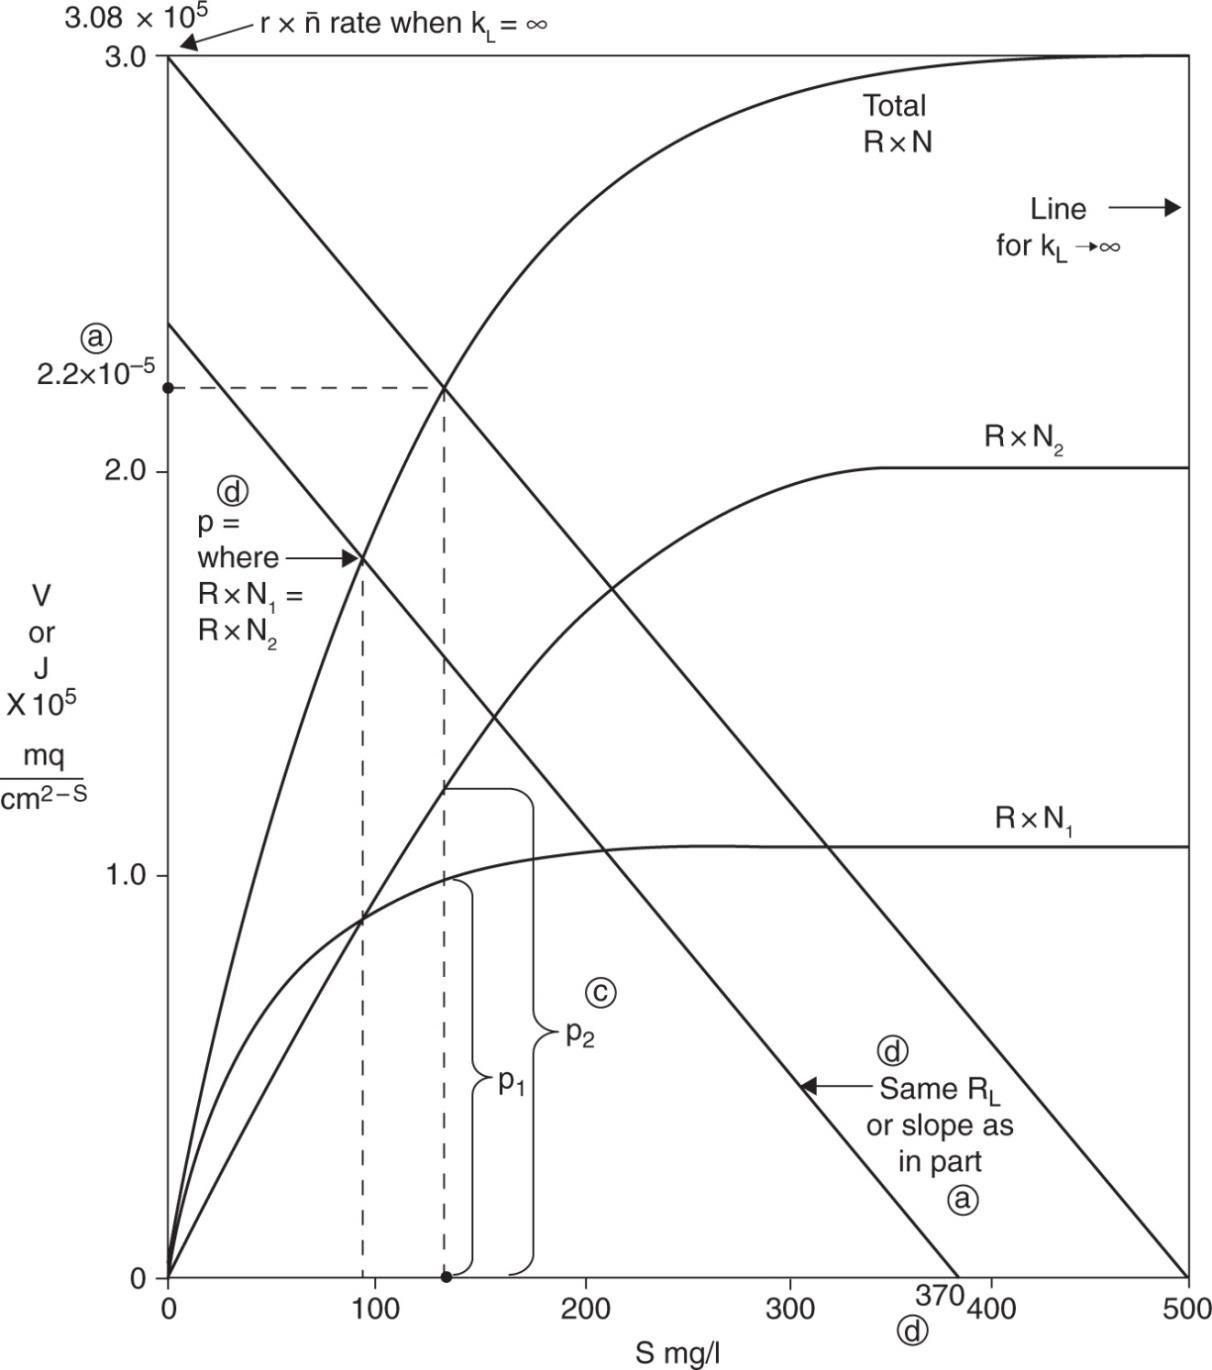
a) Use the graphical technique: Given where

Make total reaction rate curve →Vtot = 2.2.10 – 5 mg/cm2 S
b) 52 52 observed rate2.210mgcmS0.71 rate if no diffusional limitation3.0810mgcmS
c)
d) Sbulk = 370 mg/L