2Effects of pregnancy and lactation on thyroid hormones, insulin, and metabolic blood parameters
ripheral monodeiodination1,2, contributing to an extreme variability of the physiological range, which is of course very meaningful in each particular study.
As dairy cattle become more productive, it is important to study other traits to determine how they have responded to selection for yield. Among other traits of interest and importance are hormone concentrations in blood. The physiological pathways by which the hypothalamic-pituitary-ovarian axis is informed about the energetic status of the animal are complex, and involve several metabolites and hormones, such as THs and insulin17. A role of these hormones in regulating steroidogenesis has been reported18, but data regarding their effect on reproductive function are limited and controversial19. Significant changes of T4 and insulin were recently described, with higher values at the end of pregnancy than at >60-120 d or in nonpregnant cows. Along the lactation phase, T4 initially decreased, reaching the lowest values at >60-120 d, and then increased until the end of lactation16.
The increase in insulin concentration from peak to mid lactation was previously recorded, and correlation between insulin and milk production has been strong or slightly negative17,20 When peak and midlactation data were pooled for analysis, stage of lactation significantly affected also T 4 concentration, correlated negatively with milk yield17. These results may vary because hormone concentrations in ruminants are affected by many environmental factors.
During pregnancy, the maternal body also undergoes major adaptations in the systems regulating glucose homeostasis to cope with the increased demand for glucose, providing a constant supply across the placenta for the successful growth and development of offspring21. As part of these changes, insulin concentrations are elevated during pregnancy and lower in lactation; moreover, maternal tissues such as muscle and fat become relatively insulin-resistant, thereby impeding glucose uptake and favoring increased delivery of glucose to the fetus21 At the end of pregnancy and in early lactation, all dairy cows experience a transient state of a decreased response to insulin in the peripheral tissues22. This homeorhetic adaptation represents a mechanism to preserve a sufficient glucose supply for the fast-growing fetus and the mammary gland to ensure milk production22.
The aim of the present study was to evaluate the plasticity of endocrine and metabolic responses of non-pregnant, pregnant, and lactating cows of Modicana dairy cows, a local breed reared in Sicily with a semi-extensive system.
MATERIALS AND METHODS
Animals and Breeding
The experimental protocol was approved by the Ethical Committee of the Department of Veterinary Science, University of Messina, Italy (code 041/2020). The research complied with guidelines of Good Clinical Practices (EMEA, 2000) and the Italian and European regulations on animal welfare (Directive 2010/63/EU).
The present study included 10 healthy multiparous Modicana dairy cows, randomly selected from a large group of 100 animals, bred under the traditional semi-extensive farming system in the same commercial farm located in Ragusa, Italy (36°53’47» N, 14°42’24.8» E, 500 mt above sea level). Animals were raised in accordance with an approved UE disciplinary
method called “QS Sicilia”, which contributes to recovering agroindustrial by-products by including up to 10% of olive cake in dairy cow feed. For this reason, animals were fed with the same diet composed of ad libitum meadow hay and an average of 10 kg/head/day of concentrate integrated with 8% of dried and pitted olive cake (DM 95.6; CP 10.4; EE 15.9; NDF 49.4; ADF 39.4; ADL 23.1; ash 3.7; starch 1.5% as feed); the concentrate (5 kg/head/meal) was administered at 7:00 a.m. and 2:00 p.m. every day. Water was ad libitum. Pasture was available in spring and autumn (for a minimum of 6 h during daylight, from 8:00 a.m. to 2:00 p.m.), but not in summer. The indoor housing was a free-stall barn equipped with automatic system fans and sprinklers that were activated during the hot season.
Inclusion criteria for enrolled cows were: (i) a physiological cyclicity during the previous breeding seasons, (ii) the absence of reproductive diseases, and (iii) the absence of any systemic or local inflammatory process and/or related antibiotic or antiinflammatory pharmacologic treatment within a month before the start of sampling and throughout the whole experimental period.
Enrolled animals were homogeneous for age (3.2 ± 1.8 years), body condition score (2.9 ± 0.3 at the time of the first sampling), lactation stage (40 ± 22 d at the time of the first sampling), and average milk production (15 ± 2 kg/head/day). The non-pregnant phase was defined as the time interval between parturition and the following conception. All included cows were inseminated and became pregnant at about 71-165 d of lactation.
Samples
The whole sampling was carried out over the course of one year, from February 2021 to February 2022. At the time of the first sampling, all the cows were at 40 ± 22 d of lactation. Blood sampling was carried out at the same time point (from 7 a.m. to 8 a.m., before total mixed ration distribution) through venipuncture from the jugular into 10 mL tubes containing clot activator and separating gel (Terumo Corporation, Tokyo, Japan,). Blood samples were centrifuged for 10 min at 2000 g; the supernatant serum was collected and stored at -20 °C until analyses.
Serum thyroid stimulating hormone (TSH), total and free triiodothyronines (T3, fT3) and thyroxines (T4, fT4), insulin, and glucose concentrations were assessed using a human homologous solid-phase, two-site chemiluminescent immunometric assay (Immulite® 2000, Siemens Medical Solutions, Diagnostics, Erlangen, Germany), according to the manufacturer’s instructions. All assays were validated for linearity using cows’ serum prior to use. The intra- and inter-assay coefficients of variation (CVs) were the following: for TSH, 5.5% and 9.5% at TSH concentrations of 0.2 and 2.35 ng/mL; for T3, 12% and 5.5% at T3 concentrations of 73 ng/dL and 171 ng/dL; for fT3, 9.1% and 5.4% at fT3 concentrations of 3.2 pg/dL and 13 pg/dL; for T4, 11.1% and 5.6% at T4 concentrations of 1.8 g/dL and 16 g/dL; and for fT4, 3.0% and 10.2% at fT4 concentrations of 4.82 ng/dL and 0.51 ng/dL, 1.56% and 4.07% at insulin concentrations of 16.54 and 45.804 IU/mL. The sensitivity of the assay was 0.01 ng/mL for TSH, 19 ng/dL for T3, 1.0 pg/mL for fT3, 0.3 µg/dL for T4, 0.11 ng/dL for fT4, and 0.5 µIU/mL for insulin concentrations.
Serum glucose, triglycerides, and total cholesterol were assessed by automated spectrophotometry (BT 3500, Biotecnic Instruments S.p.a., Roma, Italy) using the colorimetric enzymatic method by GOD/POD/PAP, CHOD/POD/PAP, and
GPO/POD/PAP kits for glucose, total cholesterol, and triglycerides dosage, respectively.
2.4. Statistical Analyses
The software used for the statistical analyses of the data was JMP®, Version 16 (SAS Institute Inc., Cary, NC, USA). Appropriate descriptive statistics were generated for all analysed variables. Prior to analyses, data were subject to normality and homoscedasticity by Kolmogorov-Smirnov or Levene’s test and logarithmic transformations were applied where necessary. ANOVA and post hoc Tukey-Kramer tests were used to identify significant (p < 0.05) differences among the different 60day phases of lactation and pregnancy. The correlation between all the variables was expressed by Pearson’s correlation coefficient (r).
RESULTS
Pregnant and Non-Pregnant Dairy Cows
Table 1 reports circulating thyroid-stimulating hormone (TSH), total and free triiodothyronines (T3, fT3) and thyroxines (T4, fT4), insulin, glucose, triglyceride, and total cholesterol concentrations of non-pregnant cows and along the first half of pregnancy. The blood analytes that resulted significantly affected by the pregnancy phase were also represented in Figure 1.
T4 concentrations were significantly higher at 0-25 and >100 d than in non-pregnant animals (P = 0.0193, Figure 1A). Preg-

nant cows showed a constant trend of TSH and T3 concentrations from 0-25 d of pregnancy to >100 d, with the highest values in nonpregnant cows (P = 0.1588 and 0.6104, respectively). Higher, but not significant, fT3, fT4 and total cholesterol concentrations were observed at 26-100 d than the rest of pregnancy and non-pregnancy period (P = 0.9919, 0.8384, and 0.8135, respectively). Circulating triglycerides concentrations showed a constant trend in both pregnant and nonpregnant cows (P = 0.9538). Pregnant cows also showed significantly higher insulin concentrations at 26-100 d than the rest of pregnancy and non-pregnancy (P = 0.0001, Figure 1B), and lower glucose concentrations at >100 d than non-pregnancy (P = 0.0075, Figure 1C).
Non-pregnant dairy cows showed significant and positive correlations between T3; T4 (r = 0.5328; P = 0.040), fT3; T3 (r = 0.54; P = 0.002), fT4: T4, and T4: glucose (r = -0.5216; P = 0.0461). Pregnant dairy cows, instead, showed a significant and positive correlation between fT4 and fT3 (r = 0.7798; P = 0.0006).
Lactating Phases
The circulating TSH, T3, fT3, T4, fT4, insulin, glucose, triglycerides, and total cholesterol concentrations of lactating cows are reported in Table 2. The graphical representation of the variables significantly affected by the lactation phase can be found in Figure 2.
A variable but not significant trend was observed for THs along the whole lactation. Modicana cows showed a constant trend of TSH from 0-240 d, with the lowest values at >240 d of lac-
D. La Fauci et al. Large Animal Review 2023; 29: 1-73
Glucose (mg/dl) 57.87±6.5050.83±4.5852.50±6.9546.80±5.63 0.008 Insulin (mUI/ml) 0.60±0.190.78±0.081.12±0.050.60±0.14 0.0001 Triglycerides (mg/dl) 18.40±2.1618.17±2.4018.00±3.4118.80±2.050.95 Total cholesterol (mg/dl) 143.53±47.64145.67±36.91148.00±28.52126.20±31.570.81 TSH (ng/ml) 0.16±0.060.11±0.040.10±0.040.11±0.060.16 T3 (ng/dL) 73.32±13.7362.42±20.1169.88±21.8963.98±27.790.61 fT3 (pg/ml) 2.11±0.552.10±0.592.16±0.442.05±0.860.99 T4 (mg/dl) 3.81±0.885.30±1.294.51±1.235.33±1.39 0.02 fT4 (ng/ml) 1.04±0.311.15±0.601.22±0.351.10±0.380.84
Figure 1 - Boxplots of the blood parameters significantly affected by the gestation phase: T4 (A), insulin (B), and glucose (C).
Gestation phaseNon-pregnant0 - 25 d26 - 100 d> 100 dP-value
Table 1. Mean values ± standard deviation of serum parameters assessed in Modicana cows at different pregnancy phases.
Table 2. Mean values ± standard deviation of serum parameters assessed in Modicana cows at different lactation phases. Lactation phase0 - 60 d61 - 120 d121 - 180 d180 - 240 d> 240 dP-value
tation (P = 0.1739); a tendency of T3 concentrations to increase from 0 to 120 d, with a constant lowest trend in the following phases (P = 0.3467); an opposite trend was observed for T4 concentrations, with the lowest values at 0-60 d and the highest at >240 d (P = 0.2684); circulating fT3 and fT4 concentrations were variable along the whole lactation as well (P = 0.1971 and 0.2603, respectively). Similarly, triglycerides and total cholesterol were not significantly affected by the lactation phase (P = 0.7725 and 0.8549, respectively), even if the highest values were found at >240 d for both of them.
Significant lowest insulin concentrations were found at <60 d and the highest at >240 d (P = 0.0282, Figure 2A), whereas the opposite trend was obtained for glucose (P = 0.0150, Figure 2B). Lactating dairy cows showed significant correlations between T4: T3 (r = 0.3647; p = 0.0244), T3: fT3 (r = 0.3872; P = 0.0163), T4: fT4 (r = 0.5121; P = 0.001), and T3: glucose (r =0.4306; P = 0.0070).
DISCUSSION
The results obtained from the Modicana cows enrolled in the
present study for serum THs, glucose, insulin, and lipid concentrations were in line with those recorded for bovine species by different authors23-25
In particular, T4 concentration peaked in the first 25 days of pregnancy and then tended to decrease; however, the lowest values were observed in non-pregnant cows. This might happen as a consequence of the consistently increased metabolic rate of the mother, mirroring the increasing demands for THs aimed at neonatal development during a phase in which the embryo/fetus lacks its own functional thyroid tissue and is, therefore, dependent on maternal TH supply3. It is, in fact, well known that fetuses of ruminants synthesize endogenous THs only from the 2nd half of pregnancy26,27
Our results support that the THs have an active and pivotal metabolic effect, as previously recorded in pregnant goats28, camels29, mares30,31, donkeys32, and frequently in cosmopolitan dairy cows16, suggesting their essential role as being part of a generalized development rather than a result of any specific developmental function. In addition, it is possible to presume that the regulation of THs originating from the mother potentially plays a role in placental development and function, influencing the fetal development, both at the beginning of preg-
4Effects of pregnancy and lactation on
and metabolic blood parameters
thyroid hormones, insulin,
Glucose (mg/dl) 59.14±6.4757.33±6.0251.11±5.1349.44±8.5050.25±3.20 0.02 Insulin (mUI/ml) 0.58±0.170.88±0.170.73±0.170.73±0.281.12±0.00 0.03 Triglycerides (mg/dl) 18.29+2.5017.44±2.1318.11±3.1018.56±3.9419.75±2.360.77 Total cholesterol (mg/dl) 130.14±56.51153.00±36.18141.78±45.05150.78±37.35154.50±68.380.85 TSH (ng/ml) 0.17±0.060.12±0.040.13±0.070.11±0.060.09±0.050.17 T3 (ng/dL) 72.24±9.3781.34±14.2668±19.2662.26±30.7763.93±17.780.35 fT3 (pg/ml) 2.08±0.422.18±0.352.31±0.611.69±0.582.17±0.910.20 T4 (mg/dl) 3.76±1.094.75±1.484.47±0.624.99±1.505.14±0.800.27 fT4 (ng/ml) 1.05±0.441.27±0.341.10±0.291.06±0.611.57±0.430.21
Figure 2 - Boxplots of the blood parameters significantly affected by the lactation phase: insulin (A) and glucose (B).
nancy (<25 d) and again at >100 d, ensuring both substrate utilization and energy balance, as previously observed in goats33 The prevailing high metabolic priority is expected to be related to guarantee maximal placental growth, differentiation, and vascularization during the early phase of pregnancy, but also during the advancing of pregnancy (>100 d) when the development of production-oriented tissues, such as muscle, occurs. Moreover, other additional explanations may be related to the development of placentomes in cows, which are present at 4060 d, and the placenta expansion, which occurs during the first half of gestation34. Recently, the report of Steinhauser et al.2 carried out on sheep described a variety of TH transporters that may be present in the placenta, moving and transporting different forms of THs. On these bases, it is hypothesized that the abundance of T4 may play a key role in protecting the fetus from deficiencies of THs over the first period of gestation.
The breed may play an unknown but physiologically important role during the different pregnancy periods, presumably due to innate endocrine and metabolic differences, contributing to guarantee the homeostatic responsiveness35. This suggests that some cows may innately have higher circulating concentrations of THs and/or be able to better maintain thyroid hormone levels during early pregnancy, making them more suited to support the normal growth of the fetus while it is not able to synthesize endogenous THs26,27.
Circumstantial evidence suggests that fT4 is the major secretory product of the thyrocyte and circulating fT3 mainly comes from 5’deiodinase activity in peripheral tissues36. It is therefore feasible that the non-significant changes of both fT3 and fT4, but also the constant trend of T3, observed in pregnant cows along different periods could be due either to the homeostatic alternation of peripheral deiodinases’ activities approaching the pregnancy or to their constant but dynamic secretory synthesis, as corroborated by the existence of a significant and positive correlation between fT3 and fT4 With respect to the absence of significant differences in total and free iodothyronines along the different lactation phases, the significant positive correlations between T3:fT3 and T4:fT4 values observed in lactating cows are consistent with other physiological periods, such as growing, pregnancy, and nonpregnancy, reporting that changes of total iodothyronine concentrations often follow those of the free forms28,37. These active metabolic priorities were corroborated by the existence of a significant negative correlation between T4 and glucose in non-pregnant cows, and positive between T3 and glucose in lactating dairy cows, acknowledging the active metabolic role of THs. Thus, the diminished or increased energy intake in both non-pregnant or pregnant and lactating dairy cows could be due to different THs’ sensitivity, involved in the regulation of metabolic effects.
With regard to the analyzed energetic substrates, Koch et al.38 observed in Holstein dairy cows a shift in substrate utilization, from fat to glucose, that might contribute to reducing circulating glucose concentrations along the late pregnancy and early lactation, specifically at three weeks before and after parturition; this metabolic change, with a consequent decrease of endogenous heat production, preserves the hepatic gluconeogenesis for fetal growth as well as maturation for the resting pregnancy. Even though temporally different, a similar metabolic condition was also observed in Modicana dairy cows around mid-gestation (>100 days), thus confirming a homeorhetic adaptation to the advanced of gestation,
characterized by a reduced glucose utilization; this trend may temporarily change the metabolic requirements to cope with an intensive lactogenesis/galactopoiesis phase, represented in early lactation by a significant glucose increase just at <60 d. Likewise, the evidence of the higher insulin concentrations recorded at 26-100 d of pregnancy than all the other examined pregnancy and non-pregnancy phases, is in line with its marked excite-anabolic roles, when the metabolic T4 role resulted poorly represented. It is then reasonable to assume that, taken together, the significantly increased involvement of both T4 (<25 and >100 d of pregnancy) and insulin (26100 d of pregnancy) suggest their metabolic contribution throughout the whole physiological period. So, on this basis, it is possible to presume that insulin would act as an «anabolic effect» at the time when T4 is low.
On the other hand, in non-pregnant cows, the existence of significant and positive correlations between T3:fT3, T4:fT4, fT3:fT4, and T4:T3 showed the involvement of total and free THs in baseline energy expenditure conditions, obtained activating the carbohydrate, protein, and lipid metabolism. Specifically, at the end of pregnancy and approaching the lactation, dairy cows generally showed a reduced sensitivity to insulin effect in the peripheral tissues, preserving a sufficient glucose store for the fast-growing both of fetus and mammary gland tissues21,39. Partially in line with literature data, it is possible to presume that these tissues use most of the available glucose over the remainder of pregnancy, as confirmed by its lowest concentrations recorded at >100 d. Nevertheless, approaching the lactation, the mammary gland of Modicana cows probably appears protected and/or less sensitive to insulin effects, as supported by the significantly highest glucose concentration just at <60 d of lactation, with concomitant lowest insulin concentrations at the same time. This glucose increase confirms that during early lactation, gluconeogenesis and glycogenolysis are typically increased to provide glucose for milk lactose production40,41. Moreover, the low insulin concentration observed in this first phase of lactation probably favors the partitioning of nutrients between mammary and non-mammary tissues in a period of great energy utilization and reserve mobilization for the start of milk production, thus reducing the possible problems caused by nutrient deficiencies in body tissues. It must also be noted that, during lactation, the water metabolism to the mammary gland through the vascular system is physiologically increased, thus causing possible hemodilution of the insulin, as previously observed in lactating cosmopolitan dairy cows and ewes for many hormonal, hematological, and biochemical parameters16,42.
Taken together, these homeorhetic adaptations in early lactation confirm that glucose is the most important substrate for milk production22 and the most essential fuel and precursor for both immune cells and mammary epithelial cells43, and that insulin is a trigger of glucose uptake by peripheral cells. Hence, it is possible to conclude that the prioritization of mammary supply during early lactation is a physiologic principle in all mammals. Moreover, as previously recorded by Bossaert et al.44, it is well known that the insulin-independent glucose utilization by lactating mammary gland leads to greater glucose clearance, supporting the related nutrient fluxes to the mammary gland45,46, making difficult to provide clear conclusions about peripheral insulin sensitivity.
D. La Fauci et al. Large Animal Review 2023; 29: 1-75
CONCLUSIONS
In this study, we added knowledge on dairy cows’ endocrine and metabolic patterns, showing dynamic and physiological crosstalk between functional periods and related adaptive responses in this peculiar podolian-derived breed, not comparable in environmental, productivity and genetic conditions with other highly productive dairy cows. The genetic selection of cosmopolitan dairy breeds carried on in the last 30 years has primarily focused on prioritizing milk production over other physiological functions, thus exacerbating the adaptative metabolic changes occurring during milk synthesis and secretion39. This fact contributed to extreme variability of physiology of pregnancy and lactation, which accounts for the frequently not comparable data obtained from different breeds of the same species.
Modicana’s milk production can be considered good in terms of quality, when compared with other dairy cow breeds, but low in terms of yield. However, when the breeding environment is taken into consideration, Modicana cows result rather productive despite the high utilization of poor pastures and byproducts. To study local breeds adapted to particular conditions even from a physiological point of view can help optimize their management as well as better understand the mechanisms that promote optimal pregnancy and lactation. Our results aim to encourage further research on these main topics, for developing genetic improvement and improving environmental conditions where Modicana is reared, which could be a useful biodiversity in relation to climate change and its ability to adaptability.
Acknowledgements
The authors wish to thank Azienda Agricola Cilone and the responsible Rosario Tumino for guesting the in-field trials.
Funding
This study was funded by P.O. FESR SICILIA 2014/2020. Obiettivo Tematico 1-Ricerca, Sviluppo Tecnologico e Innovazione Obiettivo specifico 1.1-Incremento dell’attività di innovazione delle imprese Azione 1.1.5-Sostegno all’avanzamento tecnologico delle imprese attraverso il finanziamento di linee pilota e azioni di validazione precoce dei prodotti e di dimostrazione su larga scala. Project BIOTRAK. Grant number 08SR1091000150 - CUP G69J18001000007 (Principal investigator: Prof. Luigi Liotta).
References
1. Meyerholz M.M., Mense K., Linden M., Raliou M., Sandra O., Schuberth H.-J., Hoedemaker M., Schmicke M. (2016). Peripheral Thyroid Hormone Levels and Hepatic Thyroid Hormone Deiodinase Gene Expression in Dairy Heifers on the Day of Ovulation and during the Early Peri-Implantation Period. Acta Vet. Scand. 58:52.
2. Steinhauser C.B., Askelson K., Hobbs K.C., Bazer F.W., Satterfield M.C. (2021). Maternal Nutrient Restriction Alters Thyroid Hormone Dynamics in Placentae of Sheep Having Small for Gestational Age Fetuses. Domest. Anim. Endocrinol. 77:106632.
3. Schermer S.J., Bird J.A., Lomax M.A., Shepherd D.A., Symonds M.E. (1996). Effect of Fetal Thyroidectomy on Brown Adipose Tissue and Thermoregulation in Newborn Lambs. Reprod. Fertil. Dev. 8: 995-1002.
4. Cicatiello A.G., Di Girolamo D., Dentice M. (2018). Metabolic effects of the intracellular regulation of thyroid hormone: old players new concepts. Front. Endocrinol. (Lausanne). 9.
5. Pucci E., Chiovato L., Pinchera A. (2000). Thyroid and lipid metabolism. Int. J. Obes. 24:109-12.
6. Mullur R., Liu Y.-Y., Brent G.A. (2014). Thyroid hormone regulation of metabolism. Physiol. Rev. 94:355-382.
7. Fiore E., Gianesella M., Arfuso F., Giudice E., Piccione G., Lora M., Stefani A., Morgante M. (2014). Glucose infusion response on some metabolic parameters in dairy cows during transition period. Arch. Anim. Breed. 57: 1-9.
8. Aguayo-Mazzucato C., Zavacki A.M., Marinelarena A., Hollister-Lock J., El Khattabi I., Marsili A., Weir G.C., Sharma A., Larsen P.R., Bonner-Weir S. (2013). Thyroid hormone promotes postnatal rat pancreatic -cell development and glucose-responsive insulin secretion through MAFA. Diabetes. 62:1569-1580.
9. Oppenheimer J.H., Schwartz H.L., Lane J.T., Thompson M.P. (1991). Functional relationship of thyroid hormone-induced lipogenesis lipolysis and thermogenesis in the rat. J. Clin. Invest. 87: 125-132.
10. Dussault J.H., Hobel C.J., Distefano J.J., Erenberg A., Fisher D.A. (1972). Triiodothyronine turnover in maternal and fetal sheep. Endocrinology. 90 1301-1308.
11. Fowden A.L., Mapstone J., Forhead A.J. (2001). Regulation of glucogenesis by thyroid hormones in fetal sheep during late gestation. J. Endocrinol. 170: 461-469.
12. Fiore E., Piccione G., Gianesella M., Praticò V., Vazzana I., Dara S., Morgante M. (2015). Serum thyroid hormone evaluation during transition periods in dairy cows. Arch. Anim. Breed. 58: 403-406.
13. Fiore E., Giambelluca S., Morgante M., Piccione G., Vazzana I., Contiero B., Orefice T., Arfuso F., Gianesella M. (2017). Changes in thyroid hormones levels and metabolism in dairy cows around calving. Acta Vet. Brno. 67: 318-330.
14. Alameen A.O., Abdelatif A.M. (2012). Metabolic and endocrine responses of crossbred dairy cows in relation to pregnancy and season under tropical conditions. Am. J. Agric. &, Environ. Sci. 12: 1065-1074.
15. Vanjonack W.J., Johnson H.D. (1975). Effects of moderate heat and milk yield on plasma thyroxine in cattle. J. Dairy Sci. 58: 507-511.
16. Fazio E., Bionda A., Chiofalo V., Crepaldi P., Lopreiato V., Medica P., Liotta L. (2022). Adaptive responses of thyroid hormones insulin and glucose during pregnancy and lactation in dairy cows. Animals 12: 1395.
17. Bonczek R.R., Young C.W., Wheaton J.E., Miller K.P. (1988). Responses of somatotropin insulin prolactin and thyroxine to selection for milk yield in holsteins. J. Dairy Sci. 71: 2470-2479.
18. Spicer L.J., Alpizar E., Echternkamp S.E. (1993). Effects of insulin insulinlike growth factor i and gonadotropins on bovine granulosa cell proliferation progesterone production estradiol production and(or) insulinlike growth factor i production in vitro. J. Anim. Sci. 71: 1232-1241.
19. Huszenicza G.Y., Kulcsar M., Rudas P. (2002). Clinical endocrinology of thyroid gland function in ruminants. Vet Med Czech. 47: 199-210.
20. Hart I.C., Bines J.A., Morant S. V., Ridley J.L. (1978). Endocrine control of energy metabolism in the cow: comparison of the levels of hormones (prolactin growth hormone insulin and thyroxine) and metabolites in the plasma of high- and low-yielding cattle at various stages of lactation. J. Endocrinol. 77: 333-345.
21. Ladyman S.R., Brooks V.L. (2021). Central actions of insulin during pregnancy and lactation. J. Neuroendocrinol. 33: e12946.
22. De Koster J.D., Opsomer G. (2013). Insulin resistance in dairy cows. Vet. Clin. North Am. Food Anim. Pract. 29: 299-322.
23. Mutinati M., Rizzo A., Sciorsci R.L. (2013). Cystic ovarian follicles and thyroid activity in the dairy cow. Anim. Reprod. Sci. 138: 150-154.
24. Paulíková I., Seidel H., Nagy O., Tóthová C., Konviná J., Kadaši M., Ková G. (2017). Thyroid hormones insulin body fat and blood biochemistry indices in dairy cows during the reproduction/production cycle. Folia Vet. 61: 43-53.
25. Nixon D.A., Akasha M.A., Anderson R.R. (1988). Free and total thyroid hormones in serum of holstein cows. J. Dairy Sci. 71: 1152-1160.
26. Segar J.L., Volk K.A., Lipman M.H.B., Scholz T.D. (2013). Thyroid hormone is required for growth adaptation to pressure load in the ovine fetal heart. Exp. Physiol. 98: 722-733.
27. Forhead A.J., Fowden A.L. (2014). Thyroid Hormones in Fetal Growth and Prepartum Maturation. J. Endocrinol. 221: R87-R103.
28. Liotta L., Bionda A., Quartuccio M., De Nardo F., Visalli R., Fazio E. (2021). Thyroid and lipidic profiles in nicastrese goats (capra hircus) during pregnancy and postpartum period. Animals 11: 2386.
29. Abo El-Maaty A.M., Elgabry M.A.I, Gabr F.I., Ezzo O.H. (2015). Thyroid and sex hormones in serum of pregnant and non pregnant camels (camelus dromedaries). Egypt. J. Vet. Sci. 46: 41-53.
6Effects of pregnancy and lactation on thyroid hormones, insulin, and metabolic blood parameters
30. Fazio E., Medica P., Trifiletti C., Ferlazzo A. (2016). The outcome of the first stages of pregnancy on mares’ bloodstream thyroid hormones. Theriogenology. 86: 1036-1041.
31. Fazio E., Medica P., Cravana C., Bruschetta G., Ferlazzo A. (2016). Seasonal thyroid and lipid profiles in thoroughbred pregnant and nonpregnant mares (Equus Caballus). Theriogenology. 85: 1582-1589.
32. Fazio E., Medica P., Cravana C., Ferlazzo A. (2012). Total and free iodothyronines profile in the donkey (Equus Asinus) over a 12-month period. Acta Vet Brno. 81: 225-30.
33. Riis P.M., Madsen A. (1985). Thyroxine concentration and secretion rates in relation to pregnancy lactation and energy balance in goats. J Endocrinol. 107: 421-7.
34. Reynolds L.P., Borowicz P.P., Vonnahme K.A., Johnson M.L., Grazul-Bilska A.T., Wallace J.M., Caton J.S., Redmer D.A. (2005). Animal models of placental angiogenesis. placenta. 26: 689-708.
35. Lopreiato V., Minuti A., Trimboli F., Britti D., Morittu V.M., Cappelli F.P., Loor J.J., Trevisi E. (2019). Immunometabolic status and productive performance differences between periparturient simmental and holstein dairy cows in response to pegbovigrastim. J. Dairy Sci. 102: 9312-9327.
36. Kelly G.S. (2000). Peripheral metabolism of thyroid hormones: A review. Altern Med Rev. 5: 306-333.
37. Fazio E., Medica P., Cravana C., Messineo C., Ferlazzo A. (2007). Total and free iodothyronine levels of growing thoroughbred foals: Effects of weaning and gender. Livest Sci. 110: 207-13.
38. Koch F., Lamp O., Eslamizad M., Weitzel J., Kuhla B. (2016). Metabolic response to heat stress in late-pregnant and early lactation dairy cows: Implications to liver-muscle crosstalk. PLoS One. 11: e0160912.
39. Pascottini O.B., Leroy J.L.M.R., Opsomer G. (2020). Metabolic stress in the transition period of dairy cows: Focusing on the prepartum period.
Animals.10: 1419.
40. Loor J.J., Dann H.M., Everts R.E., Oliveira R., Green C.A., Janovick Guretzky N.A., Rodriguez-Zas S.L., Lewin H.A., Drackley J.K. (2005). Temporal gene expression profiling of liver from periparturient dairy cows reveals complex adaptive mechanisms in hepatic function. Physiol. Genomics 23: 217-226.
41. Graber M., Kohler S., Kaufmann T., Doherr M.G., Bruckmaier R.M., van Dorland H.A. A field study on characteristics and diversity of gene expression in the liver of dairy cows during the transition period. J. Dairy Sci. 93: 5200-5215.
42. Brito M.A., González F.D., Ribeiro L.A., Campos R., Lacerda L., Barbosa P.R., Bergmann G. (2006). Composição do sangue e do leite em ovinos leiteiros do sul do brasil: Variações na gestação e na lactação. Ciência Rural. 36: 942-948.
43. Habel J., Sundrum A. Mismatch of glucose allocation between different life functions in the transition period of dairy cows. Animals 10: 1028.
44. Bossaert P., Leroy J.L.M.R., De Vliegher S., Opsomer G. (2008). Interrelations between glucose-induced insulin response metabolic indicators and time of first ovulation in high-yielding dairy cows. J. Dairy Sci. 91: 3363-3371.
45. Gross J.J., Bruckmaier R.M. (2019). Invited review: Metabolic challenges and adaptation during different functional stages of the mammary gland in dairy cows: perspectives for sustainable milk production. J. Dairy Sci.102: 2828-2843.
46. Karis P., Jaakson H., Ling K., Bruckmaier R.M., Gross J.J., Pärn P., Kaart T., Ots M. (2020). Body condition and insulin resistance interactions with periparturient gene expression in adipose tissue and lipid metabolism in dairy cows. J. Dairy Sci. 103: 3708-3718.
D. La Fauci et al. Large Animal Review 2023; 29: 1-77
MASOUD
† Department of Plant Production, University of Torbat Heydarieh, Postal Box 9516168595, Torbat Heydarieh, Iran.
‡ Department of Animal Science, University of Jiroft, Postal Box 7867155311, Jiroft, Iran.
§ Department of Animal Science, Shaid Bahonar University of Kerman, Postal Box 7616913439, Kerman, Iran.
SUMMARY
Numerous studies have examined the association between prolactin gene polymorphisms with different traits of milk production in cow, often with conflicting results. This study was performed to investigate the association between PRL/Rsa I polymorphism and milk production by meta-analysis of various published research results. In this meta-analysis the Metafor package of R software was used to analyze the data. Based on these results, the overall effect of this gene on milk production is 0.533 with a 95% confidence interval between 0.179 to 0.887 and animals with AA genotype have higher production than animals with BB genotype (P <0.01). Subgroup analysis revealed that this difference in the function of genotypes is related to non-Holstein cows, so that cows with AA genotypes are better than BB genotype (0.66, CI 0.113 1.119, I2=80.04%), while this difference is not significant for Holstein cows (0.37, CI -0.035 0.779, I2=41.08%). It was also found that in additive, dominance, codominance, and recessive models when Holstein cows were studied, the difference in animal performance with different PRL/Rsa I genotypes was not significant. Based on these results, no association was found between PRL/Rsa I polymorphism with fat percentage and milk protein percentage in the studied populations. It is suggested that instead of focusing on variants on this gene as direct markers for the selection of dairy cows, the effect of this gene in combination with other genes in the framework of genomic selection should be considered.
KEY WORDS
Genetic model, milk traits, PRL gene, systematic review.
INTRODUCTION
Genetic selection of livestock based on traits to improve production and reproduction performance is a time-consuming process that is only possible for livestock with production records. Therefore, a suitable solution to improve these traits is to search for molecular markers in or around genes that are directly or indirectly involved in milk production or reproductive function to use genomic information along with phenotypic records for accurate estimation of breeding values. In dairy cows, one of the most important goals of selection is to increase both milk productivity and composition. Through molecular techniques and determining the basic genes affecting production traits in livestock, the efficiency of breeding programs can be enhanced1.
Candidate genes for a particular trait are sequenced genes whose biological activity is known. Based on the candidate gene hypothesis, much of the genetic diversity of quantitative traits is
Corresponding Author: Masoud Alipanah (m.alipanah@torbath.ac.ir).
due to the diversity of functions of genes directly involved in physiology or production. Single nucleotide polymorphisms (SNPs) are believed to occur in some genes and may affect the gene product or at least the DNA marker of the underlying regions of the genome2. For more than fifty years, many studies have been conducted on different forms of genes affecting the economically important traits of cow’s milk3. Genes encoding milk proteins and hormones are good candidates for locally effective trait markers in milk production due to their crucial biological functions. Among various hormones regulating the milk production process in cattle, prolactin is of great importance4. Prolactin (PRL) gene (ENSBTAG00000015274.4) is a polypeptide hormone synthesised and secreted from the specialised cells of the anterior pituitary gland. It is essential for the initiation and maintenance of lactation, and it is also mainly responsible for the synthesis of milk proteins, lactose, lipids, and all other major components of milk1,5,6. In mammals, prolactin is responsible for the onset and maintenance of lactation, the growth of the mammary glands, and lactogenesis. Given the effects described above, it can be hypothesized that the DNA variants in this gene could be used as potential genetic markers for milk yield in cattle7. The bovine PRL gene is located on chromosome 23 and comprises five exons and four introns, spanning a 10
ALIPANAH†1, ZAHRA RODBARI‡, ALI ESMAILIZADEH§, IMAN YOUSEFI JAVAN†, FAEZEH QARARI†
M. Alipanah et al. Large Animal Review 2023; 29: 9-149
N
The relationships between PRL/Rsa I polymorphism in prolactin gene and milk production in cattle: A Meta-analysis
relationships between PRL/Rsa I polymorphism in prolactin gene and milk production in cattle: A Meta-analysis
kb genomic segment and it encodes a 199 amino acid mature protein in BTA238. It has a molecular weight of approximately 22-kDa. It is a single-chain polypeptide of 198 amino acids and involved in many endocrine activities9. Many researchers reported that the PRL gene is highly polymorphic and had an association with milk production traits10. A non-synonymous A G transition mutation in exon-3 of bovine PRL gene genotyped by Rsa I restriction endonuclease enzyme, has become a prevalent genetic marker for several production and reproduction traits11. Two allelic variants (A and B) have been distinguished at the DNA level, based on Rsa I polymorphism. The PRL/Rsa1 locus had a significant effect on milk production and fat percentage in dairy cattle10,12,13,14.
Based on the statistical and mathematical principles, meta-analysis is a systematic review of quantitative research. Integrating the results from different studies with a single subject, compared to the findings of an individual research, allows for a more accurate and reliable estimation. The challenge for biologists is to discover ways to analyze scattered data to help them understand the complex dynamic system of life. Meta-analysis is a statistical method for integrating data from different surveys with related hypotheses, which is a valuable way to increase the analytical power of individual surveys. In this regard, new and powerful tools have been developed for the analysis of expressive data.
One of the most important goals of meta-analysis studies is to provide an accurate and valid result, by increasing the sample size due to the combination of different studies and hence reducing the confidence interval of these measurements and solving problems resulting from controversial results of previous studies15
The term meta-analysis is used to refer to the statistical analysis of a large set of results from individual studies to integrate findings16. Like any statistical method, meta-analysis has its pros and cons but is now one of the standard tools for providing a clear, objective and repetitive summary of research findings in the social sciences, medicine, education, and other fields17. According to the many studies that have been conducted on the prolactin gene mutation (PRL/RsaI) on different breeds of cattle, which have led to different and sometimes contradictory results, it seems that it is necessary to summarize the effect of this mutation on the production of milk, fat, and protein based on more data. Therefore, this meta-analyze was performed to investigate the association between polymorphism studies of PRL/Rsa I polymorphismwith milk production and the dependent traits of fat percentage and protein percentage.
MATERIALS AND METHODS
Published scientific papers on the relationship between PRL/Rsa I polymorphism and milk production in cattle were retrieved from several databases (Web of Science, Science Direct, and Google Scholar); out of which a sample consisting of 98 original research papers published between 2000 and 2020 was selected. This number was selected by refining and finally, 21 articles were selected for the subsequent analysis. All selected articles met all three inclusion criteria including 1) examining the relationship between PRL/Rsa I polymorphism and milk production. 2) Investigation of three genotypes (AA, AB, and BB). 3) Existence of mean report, and standard deviation or standard error for milk production, milk fat percentage, and
milk protein percentage traits for each genotype. All necessary information from selected articles was entered in a table. This table included information about the characteristics of the corresponding author(s), year of publication, country, breed, the number of animals tested, the number of genotypes observed, average milk production for each genotype, standard deviation from the mean and significant level of relationship. Before statistical analysis, this information was arranged according to the corresponding author to prevent errors. In the cases with no standard deviation, the standard deviation value was calculated using the following equation:
where, SE stands for the standard error of the genotype and n represents the number of records for each genotype. The mean standardized difference was obtained using the following equation18:
In this equation, 1 and 2 are the means of the two groups compared and SDpooled is the cumulative standard deviation of both groups obtained from the following equation:


where, n1 and n2 are the sample size and S1 and S2 are the standard deviations in each group.
Statistical Analysis:
Metafor statistical package of R software was used to analyze the data in this meta-analysis. The collected data were divided into three groups based on the breed of cattle, including Holstein, other breeds (Jersey, Gir, Conkraj, Sahiwal, and Dioni) and the combination of these two groups, the results of this analysis are presented in Table 4. Four different genetic models (AA vs BB additive model, AA + BB vs AB co-dominant model, AA + AB vs BB dominance model, and AA vs AB + BB recessive model) were used to evaluate the relationship between PRL/Rsa I polymorphism and milk production.
Heterogeneity between studies was calculated using the I2 parameter whose value varies between zero and 100; that is I2 less than 50 indicates low heterogeneity and I2 above 50 indicates high heterogeneity. A random model should be used for the analysis of studies with high heterogeneity19
The genotypic and allelic frequencies of PRL/Rsa I polymorphisms in the various studies used in this survey are shown in Table 1.
RESULTS
The results of the meta-analysis for the association between PRL/Rsa I polymorphism and milk production based on four genetic models including additive, dominant, co-dominant, and recessive are presented in Tables 2-4.
The relationship between polymorphism of PRL/Rsa I and milk production: The results of the heterogeneity test based on I2 and the number of studies used in Meta-analysis show that almost all models have a high heterogeneity, even using a random model. Although animal grouping into two groups of Hol-
10The
Table 1 - Allelic and genotypic frequencies of PRL/Rsa I polymorphismin different studies for meta-analysis.
NoYearBreedTotal Genotype FrequenciesAllele Frequencies

stein cows and other breeds reduces the level of heterogeneity, in most cases heterogeneity is still high (Table 2).
An additive model: Comparison of genotypes in this model (AA genotype versus BB genotype) indicates that the average yield of milk production in animals with AA, and BB genotypes are 5999.12, and 3907.17 liters; respectively. Supplementary Table 1 presents the results of the meta-analysis with an additive model for the relationship between the PRL gene, and milk production. Based on these results, the overall effect of this gene on milk production is 0.533 with a 95% confidence interval between 0.179 to 0.887 and animals with AA genotype have higher production than animals with BB genotype (P <0.01). But based on I2, there is significant heterogeneity between observations and hence, the results should be evaluated more carefully. With separate analysis for Holstein cows and non-Holstein cows, it is determined that this difference in the function of genotypes is related to non-Holstein cows so that cows with AA genotypes are better than BB genotype (0.66, CI 0.113 1.119, I2=80.04%) While this difference is not significant for Holstein cows (0.37, CI -0.035 0.779, I2=41.08%).
Dominant model: In this model, animals with AA + AB genotype were compared with animals with BB genotype of PRL/Rsa I polymorphism. Animals in the AA + AB genotypic group with an average of 5914.60 liters have a better performance than the animals of the BB genotype group with an average of 3097.17. However, the results of the meta-analysis show no significant difference between the two groups, the estimation of the dominant model effect was 0.043 (95% con-
fidence interval between 0.303 and 0.389). But in this model, there was also heterogeneity between different studies (I 2 = 86.25) and of course a very low number of animals with BB genotype can also be the reason for the lack of significant differences in the model. When the analysis was performed with a random model, the performance difference was significant (P <0.01).
Co-dominant model: In this model, animals with AB genotype were compared with animals with AA + BB genotype. Animals in AA + BB, and AB genotypic groups showed an average of 5309.51 and 5224.04 litter, respectively. But there was no significant difference. A significant difference was observed between two genotypic groups when the analysis was performed on breeds other than Holstein (P <0.05).
Recessive model: In this model, animals with AA genotype were compared with animals with AB + BB genotype of PRL/RsaI polymorphism. AA genotypic group animals with an average of 5337.40 liters showed better performance than the animals of the AB + BB genotype with an average of 5228 liters, but the difference was not significant. A significant difference was observed when the analysis was performed on breeds other than Holstein (P <0.05).
Relationship between PRL/Rsa I polymorphism and milk fat percentage:
The results of the heterogeneity test based on I2 and the number of studies used in the meta-analysis show that heterogeneity levels are high in dominant and codominant, and moderate in additive, and recessive models.
M. Alipanah et al. Large Animal Review 2023; 29: 9-1411
12007Holstein72360.50300.4260.08510.71210.290.0002P>0.05 22007Holstein98590.60380.3910.01780.80200.200.0996P>0.05 32002Holstein9006570.732350.2680.017750.861250.140.0235P>0.05 42002Holstein6004260.711660.2880.015090.85910.150.0168P>0.05 52002Holstein3662550.701040.2870.023070.84590.160.0075P>0.05 62005Jersey185170.09800.43880.48570.311280.690.0002P>0.05 72005Jersey147130.09630.43710.48450.311020.690.0002P>0.05 82005Jersey9160.07370.41480.53250.27660.730.0010P>0.05 92005Holstein2421720.71690.2910.012070.86350.140.0578P>0.05 102005Holstein1621170.72440.2710.011390.86230.140.0399P>0.05 112005Holstein94690.73240.2610.01810.86130.140.0155P>0.05 122008Holstein7201330.185720.79150.024190.583010.420.6610P>0.05 132019Holstein1501080.72410.2710.011290.86210.140.0385P>0.05 142017Gir20090.051660.83250.13920.461080.540.5678P>0.05 152017Kankrej100130.13700.70170.17480.48250.250.2131P>0.05 162008Kankrej51170.33180.35160.31260.51250.490.1213P>0.05 172008Kankrej51170.33180.35160.31260.51250.490.1213P>0.05 182088Kankrej51170.33180.35160.31260.51250.490.1213P>0.05 192008Kankrej51170.33180.35160.31260.51250.490.1213P>0.05 202015Sahiwal126750.60390.31120.10950.75310.250.0734P>0.05 212012Dioni7270.10420.58230.32280.39440.610.0567P>0.05
NumbernAA%AAnAB%ABnBB%BBA%AB%BP
Table 2 - Estimate of PRL/Rsa I polymorphism effect with a different model on the milk yield.
Based on the results presented in Table 3, the overall effect of this gene on milk fat percentage is -0.17 with confidence intervals of 95% between -0.73 and 0.38 and animals with BB genotype have a higher fat percentage of animals with AA genotype, although this difference is not statistically significant. In random models and separate analyzes for Holstein cows and other breeds, there was no significant difference in the effect of PRL/RsaI polymorphism on milk fat percentage.
Additive model: A comparison of genotypes in this model (AA genotype versus BB genotype) shows that the average percentage of milk fat in animals with AA genotype and BB genotype were 4.11 and 4.97%; respectively.
Dominant model: In this model, the percentage of milk fat in cows with BB genotype was compared with that of cows with AA + AB genotype. the results revealed that BB genotypic with an average of 4.97% have better performance than animals of the genotype AA + AB with an average of 4.11%. The results of the meta-analysis show no significant difference between the two groups. The estimation of the dominant model was 0.038 (95% confidence interval between 0.143 and 0.219). In this model, there was also heterogeneity between the population of different studies (I2 = 45.74). Fewer number of animals with BB
genotype can explain the lack of significant differences in the model. When the analysis was done with a random model, there was no significant difference in the percentage of milk fat between the groups.
Co-dominant model: In this model, Animals with AA + BB genotypic group with an average of 4.17% compared to animals with genotype AB with an average of 4.11 had better performance, but no significant difference was observed.
Recessive model: In this model, animals with AA genotype were compared with animals with AB + BB genotype. AA, and AB+BB genotype groups have an average of 4.11 and 4.24, respectively, but there was no significant difference.
The relationship between polymorphism of PRL/Rsa I and milk protein percentage:
The results of the heterogeneity test based on I2 and the number of studies used in the meta-analysis show that heterogeneity levels were high in co-dominance and dominance models, but suitable homogeneity was observed in additive and recessive models.
Additive model: A comparison of genotypes in this model (AA genotype versus BB genotype) indicates that the average percentage of milk protein in animals with AA and BB genotypes
12The relationships between PRL/Rsa I polymorphism in prolactin gene and milk production in cattle: A Meta-analysis
Additive AA vs BB37830.5330.1810.1790.8870.00370.900 Random37830.0930.3250.544-0.7300.77661.250 Holstein26580.3720.2070.035-0.7790.07341.080 Other breeds11250.6560.2770.1131.1190.01880.040 Dominant AA+AB vs BB37830.0430.1760.303-0.3890.80886.250 Random3783-0.8280.339-1.493-0.1630.01581.500 Holstein26580.6340.332-0.0161.2840.05077.070 Other breeds1125-0.1870.167-0.5140.1390.26181.500 Co-dominant AA+BB vs AB45290.2590.184-0.1010.6180.15995.940 Random45290.4690.363-0.2431.1810.19795.770 Holstein34040.0540.256-0.4470.5550.83497.150 Other breeds11250.5200.2480.0341.0060.03691.570 Recessive AA vs AB+BB45290.2830.171-0.0530.6180.09994.310 Random45290.4730.338-0.1891.1340.16195.770 Holstein34040.0890.227-0.3560.5340.69696.390 Other breeds11250.5640.2410.0911.0370.01981.080
ModelNumberEstimateSMD1 Ci.lCi.up-valueI2 1Standardized mean difference Additive AA vs BB5113-0.1730.284-0.7290.3830.54291.67 Random51130.480.862-1.212.170.57883.94 Holstein4205-0.0910.241-0.5630.3820.70681.33 Other breeds908-0.3260.786-1.8661.2130.67896.32 Co-dominant AA+BB vs AB5113-0.0080.044-0.0950.0780.8537.4 Random5113-0.0020.054-0.1040.1080.96744.1 Holstein42050.0010.046-0.0890.0910.97829.63 Other breeds908-0.0350.139-0.3070.2370.864.69 Dominant AA+AB vs BB51130.0380.092-0.1430.2190.68245.74 Random5113-0.0120.125-0.2580.2330.92246.47 Holstein4205-0.0140.108-0.2250.1980.89921.09 Other breeds9080.1160.196-0.2680.4990.55477.12 Recessive AA vs AB+BB51130.0020.042-0.0810.0850.96523.36 Random51130.0030.047-0.0890.0950.99827.22 Holstein420500.044-0.0860.0860.99923.33 Other breeds9080.020.153-0.2790.3190.89641.2
ModelNumberEstimateSMD1 Ci.lCi.up-valueI2 1Standardized mean difference
Table 3 - Estimate of PRL/Rsa I polymorphism effect with a different model on the milk fat percentage.
were 3.25 and 3.67; respectively. The results of meta-analysis with the additive model for the relationship between the PRL gene and the percentage of milk protein are presented in Table 2. According to the results, the overall effect of this gene on the protein percentage of milk is 0.569 with a 95% confidence interval between -0.27 and 1.14. The animals with BB genotype have a higher performance compared to those with AA genotype, although this difference isn’t significant. In random models and separate analyzes for Holstein cows and other breeds, there was no significant difference in the effect of PRL/Rsa I polymorphism on the percentage of milk protein.
Dominance Model: In this model, the percentage of milk fat compared, animals with BB genotype versus animals with AA + AB gene of PRL/Rsa I. there is a significant difference between the animals in genotypic group AA + AB with an average of 3.32% compared to the animals of the genotype BB (P<0.05).
Although in the analysis of this model, the effect of the dominant model was 0.196 (95% confidence interval between 0.002 and 0.398). In this model there was also heterogeneity between different studies (I2 = 42.93). When the analysis was repeated with a random model, there was no significant difference.
Co-dominant model: This model compares AA + BB, and AB genotypes. There was no significant difference between animals in the AA + BB genotype group with an average of 3.28% protein milk and the genotypic group AB with an average of 3.31% protein milk.
Recessive model: In this model, animals with AA genotype were compared with animals with AB + BB genotype of PRL/Rsa I gene. Animals in the AA genotypic group with an average of 3.25% showed lower yield compared to the animals of the AB + BB genotype group with an average of 3.27%, but the difference was not significant.
Most studies on the correlation between the polymorphisms of genes and different production traits in certain breeds are constrained to a limited number and in certain areas. And sometimes the abundance of some genotypes is slightly observed, which accompanies the general conclusion about the relationship between the multiplexing of the study gene and traits with doubt. It has been suggested that in these cases, with cumulative data and with meta-analysis assistance, comparisons can be compared with the larger number of samples in such a way that the results may be more comprehensive20
DISCUSSION
Most studies1,13,21,22,23 have shown that the A allele and AA genotype had the highest frequency for the PRL gene in most of cattle breeds. Although studies have shown that the BB genotype in the Holstein breed is rare, the BB genotype has a higher abundance in other breeds1,14,24,25. These findings may reflect the negative effect of Holstein cow selection criteria on the frequency of the B allele, while other breeds, especially local breeds, show a higher frequency of allele B and the BB genotype. Contrary to the clear effect of selection on reducing the frequency of B alleles and BB genotype, in the effect of this allele and genotype on milk production, regardless of the breed of cows, has been suggested in various results. While others14,21 showed that Holstein cows with BB genotype produced more milk compared to two AA and AB genotypes; in other research1,2,26,27,28 AA genotype has been reported as the main cause of the increased milk production performance and milk fat and in some studies there is no significant difference between PRL/RsaI genotypes for milk production or other traits7,23,25 In various studies29,30,31 while the AA genotype had a better performance for milk production (P <0.05), no difference has been reported between PRL/RsaI polymorphism with fat and protein percentage in the Holstein breed of different parts of the world. A similar result was obtained for Russian Simmental cows23
Some other studies13,32 have maintained that Holstein cows in Poland with BB genotype had the lowest milk and milk fat percentage compared to two other genotypes of PRL/Rsa I; this result may be attributed to the negative correlation between milk production and fat percentage. While the percentage of protein does not show a significant difference between the three genotypes. In a study1, it was observed that Holstein cows in Poland AA have the highest milk production, while the BB genotype had the lowest percentage of protein.
In previous studies, animal with BB genotype were associated with higher annual milk yield while there were not significant differences for milk fat and milk protein percentage, the same results were observed in comparison with PRL/Rsa I genotypes for indigenous breeds Gir, and Kankrej 24. In other studies33, genotyped animals for the PRL/RsaI did not have any significant difference for milk production traits, milk fat percentage,
M. Alipanah et al. Large Animal Review 2023; 29: 9-1413
Additive AA vs BB47860.5690.43-0.2741.4130.18695.93 Random47860.750.496-0.2211.7220.1395.66 Holstein41780.750.522-0.2741.7440.15195.81 Other breeds608-0.0520.618-1.2641.160.93392.6 Co-dominant AA+BB vs AB47860.0480.06-0.070.1650.42862.25 Random47860.090.063-0.0330.2140.15257.28 Holstein41780.0850.055-0.0220.1910.12146.2 Other breeds608-0.1560.222-0.5990.2720.46278.72 Dominant AA+AB vs BB47860.1960.0990.0020.3980.04842.93 Random47860.2120.125-0.0320.4560.08941.98 Holstein41780.2030.135-0.0620.4670.13345.58 Other breeds6080.1260.088-0.0460.2990.15259 Recessive AA vs AB+BB47860.1840.12-0.0520.420.12690.27 Random47860.2260.137-0.0420.4940.09991.07 Holstein41780.2270.142-0.0520.5050.11192.63 Other breeds6080.0290.198-0.360.4170.88552.96
ModelNumberEstimateSMD1 Ci.lCi.up-valueI2 1Standardized mean difference
Table 4 - Estimate of PRL/Rsa I polymorphism effect with different model on the milk protein percentage.
relationships between PRL/Rsa I polymorphism in prolactin gene and milk production in cattle: A Meta-analysis
and milk protein percentage.
CONCLUSION
In this study, the relationship between PRL/RsaI polymorphism and milk production, milk fat percentage, and milk protein percentage were investigated according to different models. The results of this meta-analysis showed that in order to study the relationship between prolactin gene polymorphism and milk production, an additive model is more suitable than other models. While there is no correlation between prolactin gene polymorphism and fat percentage and milk protein percentage. By comparing the frequencies of the PRL/RsaI in Holstein cows in different parts of the world with other breeds of dairy cows, it can be found that the selection for milk production increases the AA genotype and, as compared to other milk breed cattle, with lower or local milk production. It is due to pressure selection on this gene. According to these results, PRL/Rsa I is not a very important gene affecting milk production, fat percentage, and protein percent of milk. Therefor, instead of focusing on this gene as a candidate gene for the milk yield and milk composition in dairy cattle, the effect of this gene in combination with other genes, in the framework of genomic selection should be considered.
Disclosures
The authors declare no real or perceived conflicts of interest.
References
1.Dybus A., Grzesiak W., Kamieniecki H., Szatkowska I., Sobek Z., Błaszczyk P., Czerniawska-Piatkowska E., Zych S., Muszyska M. (2005). Association of genetic variants of bovine prolactin with milk production traits of Black-and-White and Jersey cattle. Arch Anim Breed, 48(2):149156. doiI.org/10.5194/aab-48-149-2005.
2.Brym P., Kaminski S., Wojcik E. (2005). Polymorphism within the bovine prolactin receptor gene (PRLR). Anim Sci Pap, 23(1):61-66.
3.Ozdemir M. (2020). A Prl/RsaI Polymorphism in Exon 3 and 4 of Prolactin Gene in Dairy Cattle. Pak J Zoo, 52(1):1-4. doi.org/10.5194/aab61-197-2018.
4.Lien S., Sundvold H., Klungland H., Vage D I. (1997). Two novel polymorphisms in the bovine obesity gene (OBS). Anim Genet, 28:245.
5.Pearce S., Mostyn A., Alves-Guerra M.C., Pecqueur C., Miroux B., Webb R., Stephenson T., Symonds M.E. (2003). Prolactin, prolactin receptor and uncoupling proteins during fetal and neonatal development. Proc Nutr Soc, 62(2):421-427.
6.Horseman N.D., Zhao W., Montecino-Rodriguez E., Tanaka M., Nakashima K., Engle S.J., Smith F., Markoff E., Dorshkind K. (1997). Defective mammopoiesis, but normal hematopoiesis, in mice with a targeted disruption of the prolactin gene, 1997, EMBO J, 16 (23):6926-6935.
7.Akkaya M., Akyuz B.L.A.L. (2019). Investigation of the Relationship between GHRH and PRL Genes Polymorphisms and Milk Yield in Holstein Cattle Breed Reared in Turkey. J Agric Nat, 22(5):763-771. doi:10.18016/ksutarimdoga.vi.530786.
8.Uddin R.M., Babar M.E., Nadeem A., Hussain T., Ahmad S., Munir S., Ahmad F.J. (2013). Genetic analysis of prolactin gene in Pakistani cattle. Mol biol rep, 40(10), 5685-5689.
9.Hani H.A., Al-Bazi, W.G.M., MUHAMMED H.A. (2021). Association of prolactin genepolymorphism with some biochemical and lactation traits in dairy cow in Karbbala province. Turk J Physiother Rehabil, 32:3.
10.Karuthadurai T., Chakravarty A.K., Kumaresan A., Das D.N., Selvan A.S., Chandrasekar T., et al. (2021). Genetic polymorphism in prolactin gene and its effect on test day milk production traits in Sahiwal cattle. Indian J Anim Res, 1: 7.
11.Bangar Y.C., Magotra A., Patil C.S., Jindal N. (2021). Meta-analysis of Ge-
netic Structure and Association of Prolactin Gene with Performance Traits in Dairy Cattle in India. Biochem Genet, 59(3): 668-677.
12.Mitra A., Schlee P., Balakrishnan C.R., Pirchner F. (1995). Polymorphisms at growthhormone and prolactin loci in Indian cattle and buffalo. J Anim Breed Genet, 112(16), 71-74.
13.Wojdak-Maksymiec K., Kmic M., Strzalaka J., Judyma U.D., (2008). Prolactin gene polymorphism and somatic cell count in dairy cattle. J Anim Vet Adv, 7(1):35-40.
14.Sacravarty G., Vadodaria V.P., Joshi C.G. (2008). Prolactin Gene Polymorphism and its Association with: Economic Traits in Kankrej Cattle. Indian. J Dair Sci, 61(4):273-276.
15.Field, A. P. (2005). Is the meta-analysis of correlation coefficients accurate when population correlations vary? Psychological methods, 10(4), 444.
16.Glass G.V. (1976). Primary, secondary, and meta-analysis of research. Edu res, 5(10):3-8.
17.Del Re A.C. (2015). A practical tutorial on conducting meta-analysis in R. Quant Meth Psych, 11(1):37-50. doi: 10.20982/tqmp.11.1. p37.
18.Cohen J. (1988). Statistical power analysis for the behavioral sciences. Lawrence Erlbaum, Hillsdale, NJ.
19.Mahmoudi P., Rashidi A., Rostamzadeh J., Razmkabir M. (2019). Association between c. 1189G> A single nucleotide polymorphism of GDF9 gene and litter size in goats: A meta-analysis. Anim. reprod. Sci. 209:106140. doi.org/10.1016/j.anireprosci. 2019.106140.
20.Akcay A., Daldaban F., Celik E., Arslan K., Akyuz B., (2020). Meta-analysis of allele and genotype frequency of growth hormone (bGH) gene AluI polymorphism, which is effective on milk yield in Holstein cattle. J Facult Vet Med, Kafkas Unıv, 26(5): 687-695. doi: 10.9775/kvfd.2020.24256
21.Alipanah M., Kalashnikova L., Rodionov G. (2007). Association of prolactin gene variants with milk production traits in Russian Red Pied cattle. Iran J Biotech, 5(3):158-161.
22.Thuy N.T.D., Thu N.T., Cuong N.H., Ty L.V., Nguyen T.T.B., Khoa D.V., (2018). Polymorphism of PIT-1 and prolactin genes and their effects on milk yield in Holstein Frisian dairy cows bred in Vietnam. Russ J Genet, 54(3):346-352.
23.Pavlova N., Dodokhov V., Filippova N., Khaldeeva M., Kurtanov H., Stepanov N. (2019). The analysis of polymorphism of kappa-casein, Blactoglobulin and Prolactin genes among Yautian cattle and its influence on milk production. J Agric Environ, 2(10): doi.org/10.23649/ jae.2019.2.10.1
24.Patel J.B., Chauhan J.B. (2017). Polymorphism of the prolactin gene and its relationship with milk production in Gir and Kankrej cattle. J Nat Sci Biol Med, 8(2):167. doi.org/ 10.4103/jnsbm.JNSBM.303.16.
25.Singh U., Deb R., Kumar S., Singh R., Sengar G., Sharma A. (2015). Association of prolactin and beta-lactoglobulin genes with milk production traits and somatic cell count among Indian Frieswal (HF× Sahiwal) cows. Biomark genom med, 7(1):38-42. doi.org/10.1016/j.bgm.2014.07.001.
26.Ghasemi N., Zadehrahmani M., Rahimi G., Hafezian S.H. (2009). Associations between prolactin gene polymorphism and milk production in montebeliard cows. Int J Genet Mol Biol, 1(3):048-051. doi.org/ 10.5897/IJGMB.9000010.
27.Alfonso E., Rojas R., Herrera J.G., Ortega M.E., Lemus C., Cortez C., Ruiz J., Pinto R., Gomez H. (2012). Polymorphism of the prolactin gene (PRL) and its relationship with milk production in American Swiss cattle. African Journal of Biotechnology, 11(29):7338-7343. doi: 10.5897/AJB11.1485
28.Oguzkan SB., Bozkurt A.S. (2019). A study on the effect of Prolactin gene variants on milk production traits of Holstein cattle. Russ J Genet, 55(4):480-486. doi.org/ 10.1134/S1022795419040082.
29.Dong C.H., Song X.M., Zhang L., Jiang J.F., Zhou J.P., Jiang Y.Q. (2013). New insights into the prolactin-RsaI (PRL-RsaI) locus in Chinese Holstein cows and its effect on milk performance traits. Genet Mol Res, 12(4):5766-5773. doi.org/10.4238/2013.22.3.
30.Patel J.B., Chauhan J.B. (2017). Polymorphism of the prolactin gene and its relationship with milk production in Gir and Kankrej cattle. J Nat Sci Biol Med, 8(2):167-170
31.Plivachuk O., Dubin O., Dyman T. (2015). Effect of prolactin gene polymorphism on milk production traits in Ukrainian black-and-white dairy cattle. Technol product proc prod, 116(1):57-60.
32.Gilmanov K.K., Vafin R.R., Tyulkin S.V. (2021). Influence of complex genotypes of GH and PRL genes on milk productivity and milk quality of cows. IOP Conf Ser: Earth Environ Sci, 699)1):012036. doi:10.1088/17551315/699/1/012036.
33.Rhinocon J.C., Lopez-Herrera A., Echeverri J.J. (2013). Effect of two single nucleotide polymorphisms on milk yield and composition. Genet Mol Res, 12(2):995-1004. doi.org/10.4238/2013.
14The
Prediction of pregnancy stage by ultrasonography in the Sarda sheep: a preliminary study
GIULIA FENU1, GIUSEPPE ARGIOLAS1, MICHELE PAZZOLA2,*
1 Sementusa Association, 09040 Senorbì (SU) via Torino 13/b, Italy
2 Department of Veterinary Medicine, University of Sassari, via Vienna 2, 07100 Sassari, Italy
SUMMARY
Measures of foetal growth during gestation have been published for several goat and sheep breeds to calculate the estimated gestational stage. Up to date, no study is available in the literature for the Sarda sheep. The aim of this study was to investigate, by ultrasonography, the foetal and placental morphometry in the Sarda sheep. A total of 256 ultrasonographic images were achieved from six ewes from day 24 of pregnancy (D24) to D92. The crown to rump length in cm (CRL) was recorded and, using visual scales score, foetal ossification (1 = absence; 2 = a few; 3 = several ossifications) and development of placental cotyledons (1 = absence; 2 = visible but immature; 3 = mature) were categorised. The data regarding CRL were analysed using a MIXED procedure while aspects of ossification and cotyledons using the Fisher’s exact test. The effect of the pregnancy stage on CRL was statistically significant (p < 0.001) and all the stages were differentiable each other. The least squares means of CRL spanned from 1.33 (D24 to D30) to 9.85 cm (D55 to D60). The effects of parity and lambing rate on CRL were not significant and the total variance attributable to the random effect of the single sheep was negligible. Based on the aspect of both ossification and cot yledons, it was possible to differentiate pregnancy stages between D31 to D50. These results are useful for veterinarians, in the field of reproductive management of Sarda sheep farms, to provide a consistent prediction of the date of lambing.
KEY WORDS
Ewe, foetus, echography, lambing.
INTRODUCTION
The ultrasound technique has been used for decades in veterinary medicine, particularly in the management of clinical disorders and reproductive systems of companion 1 and livestock species 2,3,4. Overall, ultrasonography is a safe process both for the examined animal and the veterinarian and nowadays, because of the marketing of modern and transportable equipment, it can be easily performed on the field 5 .
Ultrasonographic examination to manage reproduction and pregnancy diagnosis in small ruminants farming is well recognized 6. In meat sheep farming and productions, ultrasound diagnosis has improved the flock management, and the procedure is also performed to predict sheep carcass performances 5,7. Nevertheless, the method is now an essential part of health planning and farm productivity, mainly for reproductive improvement and pregnancy diagnosis as highlighted by Scott 5 and Meinecke-Tillmann 8. Also, field veterinarians in the sector of dairy sheep farming are often asked to predict breeding and reproductive potential of rams 9,10, pregnancy stage and lambing date of sheep when oestrus and breeding dates are unknown. This allows to cull unproductive animals, get an early lambing, a longer season of milk production and finally a better farm management 11-13. Moreover, information about
Corresponding Author: Michele Pazzola (pazzola@uniss.it)
pregnancy and stage of pregnancy allow to optimize pharmacological treatments, avoiding teratogenic molecules, and the efficacy of vaccine prophylaxis 11-13
In the sector of dairy sheep, the countries of Southern Europe are the leading in terms of heads, productions and economic profit 14. Sardinia is an insular region of Italy in the middle of the Mediterranean Sea where about 3 million dairy sheep are reared using the semi-extensive methods 15 and the local breed, the Sarda. The Sarda is the most common dairy sheep breed in Italy with 180,000 animals and 700 herds officially recorded in the flock book 16 and it is also appreciated in North African and East European countries 15. Measures of foetal growth during gestation have been published for small ruminant species, from several goat and sheep breeds to calculate, via predictive equations, the estimated gestational stage 3. Up to date, no study is available in the literature relating to a precise morphometric assessment of the foetal staging in the Sarda sheep. The aim of this preliminary study is to investigate, by means of ultrasonography and the resultant on-field traits, the embryonal and foetal (foetal from this point), and placental morphometry in the Sarda sheep and provide a suitable tool to predict pregnancy stages.
MATERIALS AND METHODS
Specific authorization was released for the procedures of the present study from the Animal Ethics and Welfare Committee
G. Fenu et al. Large Animal Review 2023; 29: 15-2015
l
16Prediction of pregnancy stage by ultrasonography in the Sarda sheep: a preliminary study
at the University of Sassari, Italy (Organismo Preposto al Benessere e alla Sperimentazione Animale, OPBSA) with the protocol number 0004372/2021. Sheep used for the present study belonged to a private commercial farm located in south-west Sardinia, with a flock of about 600 sheep of Sarda breed. The farmer joined the study on a voluntary basis.
At the farm, oestrus synchronization and ultrasonographic examination of ewes were performed under the control of the veterinarian (the first author of the present study, G.F.) and were part of the routine procedures to improve reproduction and production traits. In detail, the flock was submitted to oestrus synchronization using the following scheme, as recommended by the manufacturers and the common methods for oestrus synchronization in sheep 17:
i) 14 days before rams were allowed to join the flock: insertion of a 20 mg fluorogestone acetate intravaginal sponge per each ewe (Crono-Gest spugne 20 mg, MSD Animal Health S.r.l., Segrate, Italia);
ii) 12 days after sponges’ insertion, i.e. two days before rams were allowed to join the flock: removal of intravaginal sponges and intramuscular injection of 350 IU/ewe PMSG (Folligon MSD Animal Health S.r.l.; Segrate, Italia);
iii) day 0 (D0): the day rams were allowed to join the flock (1 ram/25 ewes). The D0 has been accounted as the day of fecundation.
Six pregnant ewes of Sarda breed were randomly chosen from the flock and used for the present study: five were of second pregnancy with an average age of 1.7 years; and one was of third
pregnancy and 2.9 years old. Ewes were weighed using a static scale (model D440; manufacturer Società Cooperativa Bilanciai, Modena, Italy). Ultrasonographic images were achieved using an ultrasound scanner (Eco3Vet Expert PW Doppler, Multimage s.r.l., Cavaria Varese, Italy). Images were collected during the pregnancy from day 24 after rams were allowed to join the flock (D24) until the day foetuses were too large to be visualized within a single image enclosed in the scanner’s screen. During the first stage of pregnancy, about up to D40, the scanner was equipped with a 7.5 MHz linear probe and the transrectal examination was used. Later, from D40 to the end of the trial, transabdominal examinations were performed using a 5.0 MHz micro-convex probe.
Ultrasound examinations were performed with ewes standing in the milking parlour, and it took about one minute per each ewe to achieve a useful ultrasound image. A layer of ultrasound gel was always used both for transrectal and transabdominal examinations to prevent mucosal or skin irritations.
Ultrasound examinations were performed during the sampling sessions with the following sequence: daily from D24 to D58 (35 sampling sessions); on D63; on D70; on D77; on D84; on D92. Images were saved as electronic files during sampling session and later examined to achieve the following traits:
- the length of foetuses in cm, namely the crown to rump length, CRL, measured from the rostral point of the cranium to the caudal point of trunk 3;
- foetal ossification as a measure of fetal development 3,18 using a visual scale score (1 = absence; 2 = a few, i.e. two or less;
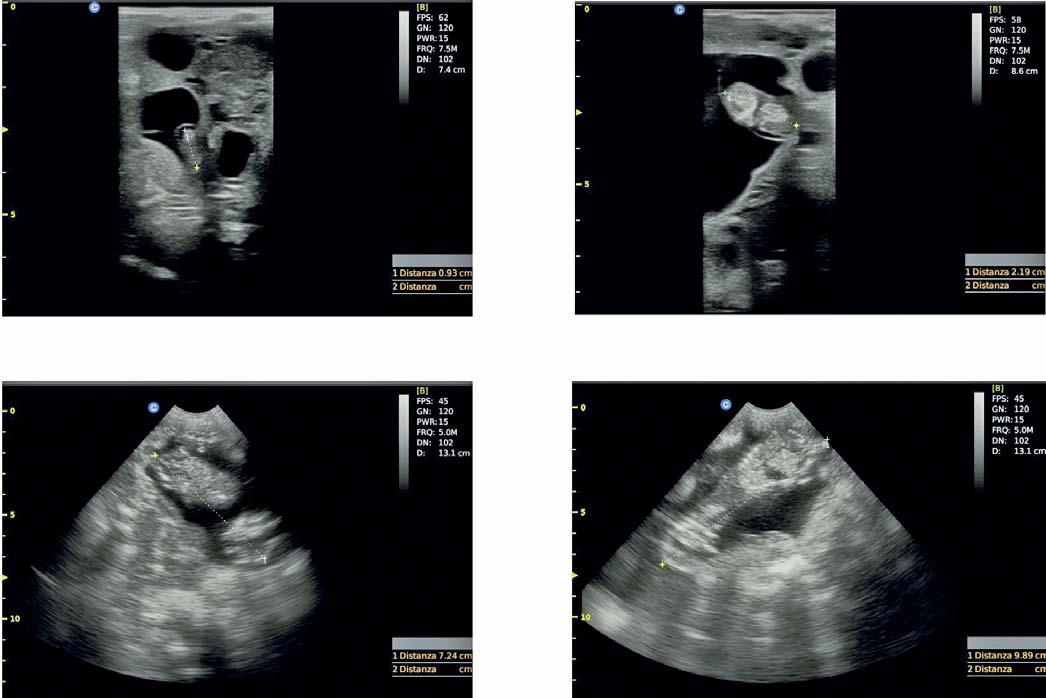
Figure 1 - Ultrasound images of Sarda sheep foetuses with measurement of crown-rump length according to pregnancy stage: (A), on day 24 of pregnancy (D24); (B), D34; (C): D52; (D), D58.
(A)(B) (C)(D)
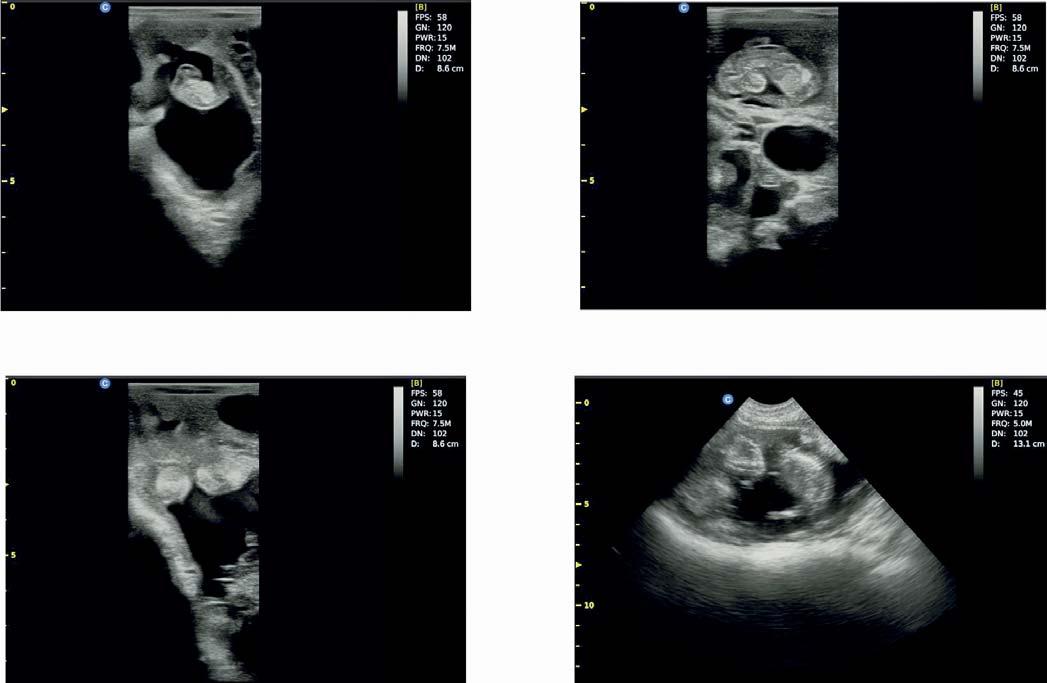
according to pregnancy stage: (A), absence of both ossification and cotyledons on day 28 of pregnancy (D28); (B),
few ossifications and immature cotyledons on D37; (C): immature cotyledons on D42; (D), several ossifications and mature cotyledons on D47.
Scale score of ossification: 1 = absence; 2 = a few, i.e. two or less; 3 = several ossifications, i.e. three or more ossifications); scale score of placental cotyledons: 1 = absence; 2 = visible but immature; 3 = mature, i.e. placental cotyledons which are more echogenic and brighter than immature ones and appear as ‘C-shaped’.
3 = several ossifications, i.e. three or more ossifications); - and development of placental cotyledons as a measure of pregnancy stage using a visual scale score (1 = absence; 2 = visible but immature; 3 = mature, i.e. placental cotyledons which are more echogenic and brighter than immature ones and appear as ‘C-shaped’ 9,19).
In order to have a practical and rapid tool to measure embryofetal length on the field, the CRL was computed considering the shortest distance, without using a caliper and without considering the curvature of the dorsal spine (Figure 1). Similarly, foetal ossification and development of placental cotyledons were assessed using a practical evaluation, i.e. the visual scale scores as represented in Figure 2.
In the case of ewes with multiple pregnancy, CRL, foetal ossification and placental cotyledons were achieved from the first foetus observed by the ultrasound probe, which was assumed to be representative of the twins or triplets. Finally, lambing dates were recorded, and lambs weighed using a static scale (model D440; manufacturer Società Cooperativa Bilanciai) at the age of 15 days.
The achieved traits were grouped into classes (stages) of 5 or more sampling days: stage 1, from 24 to 30 days of pregnancy (D24 to D30); stage 2 (D31 to D35); stage 3 (D36 to D40); stage 4 (D41 to D45); stage 5 (D46 to D50); stage 6 (D51 to
D55); stage 7 (D56 to D60); stage 8 (D61 or more, i.e. to D92). The data of 207 observations regarding CRL between D24 and D60 were analysed using a MIXED procedure and the following model:
Yhijkl = + PSh + Parityi + LRj + Ewek + ehijkl where Yhijkl is the CRL; is the overall intercept of the model; PSh is the fixed effect of the hth classes of pregnancy stage above reported (7 classes; class 1: D24 to D30; class 2: D31 to D35; class 3: D36 to D40; class 4: D41 to D45; class 5: D46 to D50; class 6: D51 to D55; class 7: D56 to D60); Parityi is the effect of the ith order of ewes’ pregnancy computed as covariate (two classes; second and third pregnancy); LRj is the effect of the jth lambing rate computed as covariate (three classes; single, twin and triplet); Ewek is the random effect of the kth ewe (6 different ewes); ehijkl is the error. Differences among least square means (LSmeans) of the classes were estimated by the Bonferroni test.
Data regarding foetal ossification and development of placental cotyledons between D24 and D92 were likewise grouped into the above reported classes of pregnancy stage and analysed using the Fisher’s exact test.
Statistical analyses were performed using the SAS software (version 9.4, SAS Institute Inc., Cary, NC) and the effects declared significant at p < 0.05.
G. Fenu et al. Large Animal Review 2023; 29: 15-2017
Figure 2 - Ultrasound images of Sarda sheep foetuses with different scores of foetal ossification and development of placental cotyledons
a
(A)(B) (C)(D)
18Prediction of pregnancy stage by ultrasonography in the Sarda sheep: a preliminary study
RESULTS
Mean live weight of ewes was 48.2 kg (range: 45.5 - 50 kg), in line with the characteristics reported in the flock book 16. The mean duration of pregnancy, calculated on the basis of D0 (the day rams joined the synchronized ewes), was 146.8 days with minimum and maximum durations of 145 and 151 days, respectively. No abortion was recorded, and all the foetuses detected by ultrasonography were born. The weights of lambs at the age of 15 days were between the minimum and maximum values of 5.2 and 7.2 kg, average 6.2 kg.
Table 1 summarizes the descriptive statistics of the 216 CRL records of the foetuses recorded by ultrasonography from D24 to D77 of pregnancy.
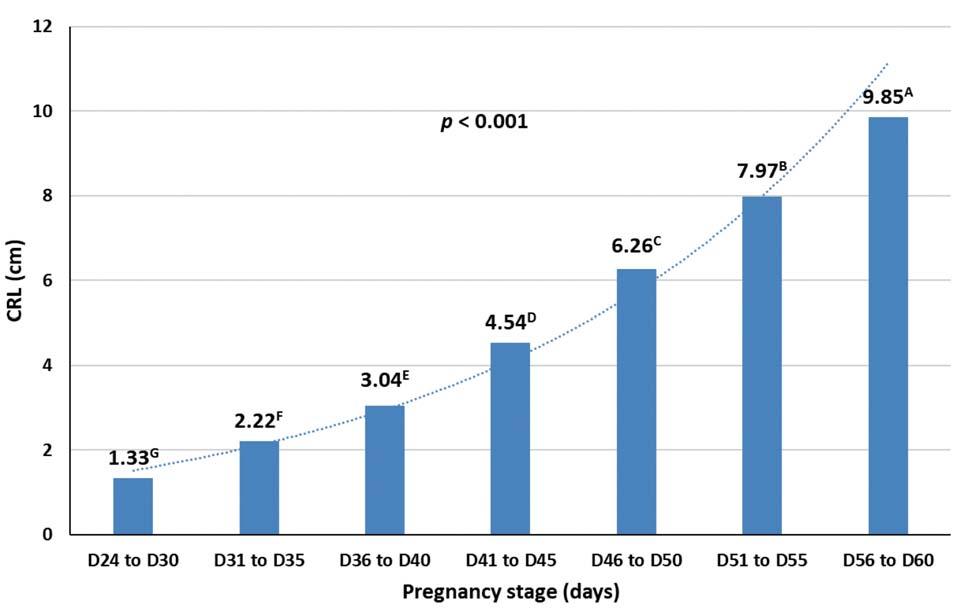
As regard the number of records for the different classes of pregnancy order, 172 records were achieved from 5 ewes of second pregnancy, and 35 records from 1 ewe of third pregnancy; as regard the lambing rate, 102 records from 3 ewes with single lamb, 72 records from 2 ewes with twin lambs and 33 records from 1 ewe with triplets.
Ultrasound images with measurement of CRL throughout the stages of pregnancy are reported in Figure 1.
D24 to D30361.380.321.20 - 1.570.701.85 D31 to D35302.290.312.09 - 2.491.762.80 D36 to D40303.110.312.91 - 3.322.573.72 D41 to D45304.610.604.41 - 4.813.605.65 D46 to D50306.330.516.12 - 6.535.697.68 D51 to D55308.040.757.84 - 8.247.009.49 D56 to D60219.930.669.68 - 10.179.0011.4 D61 to D77912.981.3112.61 - 13.3511.5015.09
Pregnancy stage CRL (cm) nmeanSD95% CIminmax SD: standard deviation; 95% CI: 95% confidence interval; min e max: minimum and maximum values.
Table 1 - Descriptive statistics of crown-rump length (CRL, n = 216) of foetuses from six Sarda sheep according to the pregnancy stage from day 24 (D24) to day 77 (D77).
Figure 3 - Graphic representation of crown-rump length (CRL, n = 207) of foetuses from six Sarda sheep according to the pregnancy stage from day 24 (D24) to day 60 (D60), with least squares means compared by the Bonferroni test.
A-G least squares means with different superscript are different at p < 0.001.
Table 2 - Aspect of foetal ossification and placental cotyledons using visual scale scores from foetuses of six Sarda sheep, according to the pregnancy stage from day 24 (D24) to day 92 (D92), with respective comparisons between stages and results of Fisher’s exact test (n = 256).
Pregnancy
OssificationCotyledons stage nabsencefewseveralComparison andabsenceimmaturematureComparison and Fisher’s exact testFisher’s exact test
D24 to D30424200-4200-
D31 to D35303000D24-30 vs. D31-353000D24-30 vs. D31-35 NSNS
D36 to D40306240D31-35 vs. D36-4013170D31-35 vs D36-40 ******
D41 to D45300246D36-40 vs. D41-4502010D36-40 vs D41-45 ******
D46 to D50300030D41-45 vs. D46-500030D41-45 vs D46-50 ******
D51 to D55300030D46-50 vs. D51-550030D46-50 vs D51-55 NSNS
D56 to D60300030D51-55 vs. D56-600030D51-55 vs D56-60 NSNS
D61 to D92300030D56-60 vs. D61-920030D56-60 vs D61-92 NSNS
Significance level: NS = non significant; *** = p < 0.001.
Scale score of ossification: 1 = absence; 2 = a few, i.e. two or less; 3 = several ossifications, i.e. three or more ossifications); scale score of placental cotyledons: 1 = absence; 2 = visible but immature; 3 = mature, i.e. placental cotyledons which are more echogenic and brighter than immature ones and appear as ‘C-shaped’.
Because of the small number of suitable images, the 9 data of CRL recorded in the stage D61 to D77 were not considered in the statistical model. The result of the Mixed model procedure, analysing 207 CRL records, provided a statistically significant result for the effect of the pregnancy stage (p < 0.001; Figure 3), but not significant for the effect of both the covariates. Indeed, p-values for parity and lambing rate were respectively at 0.316 and 0.342. Finally, 2.21% of the total variance was attributable to the random effect of the single sheep. Results from the analysis carried out with Fisher’s exact test on 256 records regarding ossification of the foetuses and placental cotyledons, measured by the respective visual scale score, are reported in Table 2.
Based on the aspect of both ossification and cotyledons, it was possible to differentiate stage D31-D35 from D36-D40, D36D40 from D41-D45, and D41-D45 from D46-D50. The pregnancy stage D24-D30 was indistinguishable from D31-D35, and similarly D46-D50 from the successive ones, until D92.
Ultrasound images with different scores of foetal ossification and development of placental cotyledons stage during the pregnancy stages are reported in Figure 2.
DISCUSSION
After D60 the achievement of CRL was ever more difficult, as also reported by Jones and Reed 3 (2017), and D77 was the last day a foetus was framed in a single image of the scanner’s screen. Mean data are in agreement with those reported by Valasi et al. 19 for the sheep species.
The descriptive statistics of the 216 data regarding CRL (Table 1), even if achieved from a small number of sheep, could be the starting point for next studies related to the detection
of the probable stage of pregnancy and predict the lambing date referred to the Sarda sheep breed. The practical discussion of the results represented in Figure 3 indicates that it was always possible to discriminate the CRL of the foetuses of Sarda sheep throughout all the stages of pregnancy. In addition, the influence on CRL attributable to the parity, the lambing rate and the individual ewe were almost null. This last result allows to estimate the stage of the foetus regardless of the other phenotypic effects of the examined ewe, as the parity, multiple pregnancy and the individual animal. As regard the method in the case of ewes with multiple pregnancy, the choice to achieve measures and data from the first foetus, as representative of the other foetuses, could be debatable and a source of bias if during the pregnancy twins or triplets have different growth and development. Nevertheless, this is what can be experienced by a field-veterinarian using ultrasound equipment in routine examinations of large flocks and when a short time is available to achieve data and measures.
The visual assessment of ossification and cotyledons from our study are in line with Valasi et al. 19, who reported an evident ossification of many districts by day 50 of pregnancy, and a definite identification of cotyledons after 37 days of pregnancy, when those are C-like shaped. The measurement of cotyledons’ diameter has been proposed as an instrument to predict pregnancy stage in sheep 19 but other authors have demonstrated the inconsistency of results 20. Nevertheless, we consider that the visual assessment of cotyledons using a scale score is more immediate and useful than the precise measurement of placental structures. This could be beneficial and convenient in the case of on-field examinations of flocks with a large number of animals.
The results obtained in this research can be considered, to our knowledge and the most common scientific databases and search engines, the first publication on foetal staging in the ear-
G. Fenu et al. Large Animal Review 2023; 29: 15-2019
20Prediction of pregnancy stage by ultrasonography in the Sarda sheep: a preliminary study
ly period of pregnancy in the Sarda sheep breed. In a previous study regarding the Sarda sheep, Ferrari et al. 21 have shown that, using an ultrasound device equipped with a linear probe and the transrectal examination, pregnancy can be diagnosed at the 16th day pregnancy, in 100% of the sheep at the 20th day, and that the measurement of the embryonic diameter can be acquired from the 21st day. Also, Aziz and Lazim 22 have reported that a 3.5 MHz convex probe via the transabdominal technique is useful to obtain a diagnosis of pregnancy in 100% of cases from the 40th day of pregnancy for the Awassi sheep. The same authors 22, and Scott 5 with regard to meat-specialized sheep, have reported that early diagnosis is crucial for the correct management of the farm economy, since it allows the separation of pregnant and non-pregnant sheep, and related operations, such as the correct drying off of ewes 9 and dietary management of the groups 23. In agreement with those reports and the findings of the present study, the foetal staging of Sarda sheep based on the ultrasonographic measurement of the foetus, the observation of its ossification and the cotyledons could allow to predict the date of lambing in the case that the time of mating has not been monitored and registered 18,19 .
CONCLUSIONS
Lambing management is a critical moment to flock management, and farmers frequently request to veterinarians, especially those involved in diagnostic imaging in the reproductive field, a prediction of the date of lambing. Prediction of the pregnancy stage in the Sarda sheep could be achievable with a high level of reliability, regardless of the possible influence of the individual sheep, parity, and multiple pregnancy. Data of the present study are useful for veterinarians working in sheep farms rearing the Sarda, to provide a consistent prediction of the date of lambing.
Acknowledgements
The authors thank the farmer for joining the study.
Conflict of interest statement
The authors declare that there are no conflicts of interest. This article is inspired by the thesis of the first author, Giulia Fenu [Title of the thesis: Studio ultrasonografico dell’evoluzione morfometrica nella stadiazione fetale della pecora Sarda (in Italian language: Ultrasonographic survey of morphometric foetal stadiation in the Sarda sheep), Specialization School in Animal Health, farming and productions, Department of Veterinary Medicine, University of Sassari, Italy, June 2021]. The thesis is accessible as a hard copy at the library of the University of Sassari and as electronic file at the online library (http://eprints.uniss.it), and it has not been published elsewhere.
References
1.Root C.R., Spaulding K.A. (1994). Diagnostic imaging in companion animal theriogenology. Semin Vet Med Surg (Small Anim), 9: 7-27.
2.Haibel G.K. (1990). Use of ultrasonography in reproductive management of sheep and goat herds. Vet Clin North Am Small - Food Anim Pract, 6: 597-613.
3.Jones A.K., Reed S.A. (2017). Benefits of ultrasound scanning during gestation in the small ruminant. Small Rumin Res, 149: 163-171.
4.Stieger-Vanegas S.M., McKenzie E. (2021). Abdominal imaging in small ruminants: liver, spleen, gastrointestinal tract, and lymph nodes. Vet Clin North Am Small - Food Anim Pract, 37: 55-74.
5.Scott P.R. (2017). Use of ultrasonographic examination in sheep health management - A general appraisal. Small Rumin Res, 152: 2-9.
6.Scott P.R. (2012). Applications of diagnostic ultrasonography in small ruminant reproductive management. Anim Reprod Sci, 130: 184-186.
7.Van Der Merwe D.A., Brand T.S., Steyn S., Hoffman L.C. (2022). Using ultrasound to predict fat deposition in growing lambs of different South African sheep breed types. Small Rumin Res, 210: 106670.
8.Meinecke-Tillmann S. (2017). Basics of ultrasonographic examination in sheep. Small Rumin Res 152: 10-21.
9.Crilly J.P., Politis A.P., Hame, K. (2017). Use of ultrasonographic examination in sheep veterinary practice. Small Rumin Res, 152: 166-173.
10.Hedia M.G., El-Belely M.S. (2021). Testicular morphometric and echotextural parameters and their correlation with intratesticular blood flow in Ossimi ram lambs. Large Anim Rev, 27: 77-82.
11.Sale S., Spezzigu A., Bua, S. (2013). Gestione riproduttiva nell’allevamento ovino in Sardegna. (In Italian: Reproduction management of sheep farming in Sardinia). Summa Animali da reddito 1: 24-26.
12.Spezzigu A.; Sale S.; Bua S. (2013). Ultrasonografia e management aziendale nei piccoli ruminanti (In Italian: Ultrasonography and farm management in small ruminants). Summa Animali da reddito 1: 11-17.
13.Gootwine E. (2021). Management of dairy animals, sheep: reproductive management. In: Encyclopedia of Dairy Sciences, Eds. McSweeney P., McNamara J., 3rd ed., vol. 2, 46-52, Academic Press, San Diego, CA, USA.
14.Ramos M., Juarez M. (2011). Sheep milk. In: Encyclopedia of Dairy Sciences, Eds. Fuquay J.W., Fox P.F., McSweeney P., 2nd ed., vol. 1., 494-502, Academic Press, San Diego, CA, USA.
15.Carta A., Casu S.M, Salaris S. (2009). Invited review: Current state of genetic improvement in dairy sheep. J Dairy Sci, 92: 5814-5833.
16.DAD-IS (2022). Domestic Animal Diversity Information System maintained and developed by FAO, Rome, Italy. Available at https://www.fao.org/dad-is last access January 13 2022.
17.Skliarov P., Pérez C., Petrusha V., Fedorenko S., Bilyi D. (2021). Induction and synchronization of oestrus in sheep and goats. J Cent Eur Agric 22: 39-53.
18.Barbagianni M.S., Ioannidi K.I., Vasileiou N.G.C., Mavrogianni V.S., Orfanou D.C. (2017). Ultrasonographic examination of pregnant ewes: From early diagnosis of pregnancy to early prediction of dystocia. Small Rumin Res, 152: 41-55.
19.Valasi I., Barbagianni M.S., Ioannidi K.S., Vasileiou N.G.C., Fthenakis G.C., Pourlis A. (2017). Developmental anatomy of sheep embryos, as assessed by means of ultrasonographic evaluation. Small Rumin Res 152: 56-73.
20.Stankiewicz T., Błaszczya B., Udała J., Chundekkad P. (2020). Morphometric measurements of the umbilical cord and placentomes and Doppler parameters of the umbilical artery through ultrasonographic analysis in pregnant sheep. Small Rumin Res 184: 106043.
21.Ferrari M.V., Catone G., Giardina P., Petralia P., Ferrari L.D.R (2009). Transrectal ultrasonography for early pregnancy determination in Sarda breed lambs. Arch Vet Sci 14: 198-203.
22.Aziz D.M., Lazim E.H. (2012). Transabdominal ultrasonography in standing position for pregnancy diagnosis in Awassi ewes. Small Rumin Res 107: 131-135.
23.Vouraki S., Skourtis I., Psichos K., Jones W., Davis C., Johnson M., Riaguas Rupérez L., Theodoridis A., Arsenos G. (2020). A decision support system for economically sustainable sheep and goat farming. Animals 10: 2421.
FRANCESCO DI MUZIO1, MARIA COSTANZA GALLI2, ORAZIO PAOLUZZI1, MARTINA CROCIATI1,3,*, LAKAMY SYLLA1
1 Department of Veterinary Medicine, University of Perugia, Via S. Costanzo 4, 06126 Perugia, Italy
2 Department of Animal Medicine, Production and Health, University of Padova, Viale dell’Università 16, 35020 Legnaro, Italy
3 Centre for Perinatal and Reproductive Medicine, University of Perugia, 06122 Perugia, Italy
SUMMARY
This study was undertaken to examine the effects of grouping sows immediately after weaning or 4 weeks after insemination on i) the occurrence of skin injuries and ii) reproductive parameters such as weaning-to-service interval and pregnancy and culling rates. At weaning (T0), 106 sows were allocated to multiple group housing (MG, n = 41) or to individual stalls (CG, n = 65). Sows from CG remained in individual stalls until 28 days after service, in compliance with the Council Directive 2008/120/EC, and were then mixed into static groups. The occurrence, localization and severity of skin injuries and lameness were recorded 24 h after allocation (T1) and 7 days later (T2). Sows were artificially inseminated on natural estrus, between T1 and T2. At T1, 20 of 41 (49%) sows in MG displayed cutaneous lesions. Skin injuries were localized in the regions of the head (20%) and rear legs (2%), while 24% of sows showed multiple localization; 3% of the MG sows were lame. Any lesion was recognized in CG at T1. At T2, the percentage of injured sows in MG decreased to 27%, while 1 sow from CG displayed a superficial skin lesion on the rear leg. Most MG sows showed multiple injuries (10%) and lameness (7%). Overall, 15 sows were culled for replacement, but Group had no effect on the culling rate. Among the remaining sows, 87 were inseminated with an overall 74.7% pregnancy rate (72.9% and 75.9% in MG and CG, respectively, difference p>0.05). According to the multivariable logistic regression, any factor significantly affected the pregnancy rate in MG and CG sows. These results suggested that housing sows after weaning in the multiple group with a reduced number of herd mates induced a stress due to competition for establishing hierarchy, even if this condition was quickly overcome and no negative effects of group housing were observed on the weaning-to service interval and pregnancy rate.
KEY WORDS
Sow; group housing; small group; fertility; skin injuries; social behavior.
INTRODUCTION
The interest in animal welfare and management in intensive breeding systems is growing in importance due to its implication for health, quality and ethics in food production1-4
Individual housing represents one of the main issues in intensive breeding systems, since it is related to behavioral deviations; these conditions often lead to injuries, pain and frustration, with decreased welfare and farm net return5,6. Moreover, European citizens have recently brought to the attention of the European Commission the “End the cage” initiative, which led to review the legislation concerning cage using in animal husbandry. Insufficient space allocation/animal and dynamic grouping are a key-factor in pig industry due to the social behavior and interaction pattern of this species; wild pigs, especially females, live in small groups and spend most of time in research for food, moving in a wide territorial area7-9. Space restriction and mixing social groups in intensive farming systems increase aggressive behavior and stress; the social hierarchy is more unstable in pigs kept in overcrowded conditions than in pigs kept in larger
Corresponding Author: Martina Crociati (martina.crociati@unipg.it).
spaces. Major causes of negative and aggressive interaction between co-specifics include competition for feed and water access, mixing in different age and weight groups10. This condition negatively affects fertility and productive performance, thus determining economic losses7. Prolonged release of cortisol and catecholamines induces weight loss and immune-depression, and has been related to reduced estrus behavioral signs and to fetal losses, abortion and stillbirth in sows8,11. Since the reproductive efficiency is one key-factor for positive farm net return, improving sow’s welfare and management should be prioritized in intensive pig industry.
The Directive 2008/120/EC establishes that sows could be kept in individual stalls for up to one month after weaning, then they must be moved to multiple housing until entering the farrowing area. The same Directive also allows sows to be directly moved into group housing after weaning, as multiple housing represents a valuable option to ensure greater space allocation per animal and the expression of social behavior. Some studies reported that group housed sows better display estrous behavior than animals in single stalls7,8, while other authors suggested that mixing and social stress could suppress estrus in subordinate or ill animals12. It is also reported that fighting and injuries could compromise the reproductive performance of sows, that is increasing pregnancy loss and return to estrus, thus mak-
F. Di Muzio et al. Large Animal Review 2023; 29: 21-2621
O
Does social competition affect the reproductive performance of sows moved to group housing after weaning?
social competition affect the reproductive performance of sows moved to group housing after weaning?
ing farmers less compliant in implementing new management strategies in this species13
This study was undertaken to examine the effects of grouping sows immediately after weaning or 4 weeks after insemination on i) the occurrence of skin injuries and ii) reproductive parameters such as weaning-to-service interval and pregnancy and culling rates.
MATERIALS AND METHODS
Animals and husbandry
The study was conducted in 2020 in a 160-sow farrow-to-finish farm in Perugia district, Italy. Ethic review and approval was not applicable according to the directive 2010/63/EU since the procedures were performed during routine health check, it did not require us housing animals and the procedures involved on-farm routine, non-invasive practices.
Pre-pubertal Grand-parents sows were regularly purchased and inseminated artificially to produce Parents sows. These were artificially inseminated after estrus detection with farmowned boars, which were registered into the “Prosciutto di Parma” Consortium herd book. The average litter size of the farm was 13.06 ± 2,67 live piglets/sow. Piglets were weaned at 28 days of life and reared in separated areas of the same farm for fattening until 9 -10 months old when they reach 160 -170 Kg body weight, for the production of “Prosciutto di Parma” protected geographical indication (PGI) meat.
Experimental design
A total of 106 primiparous (n = 25) and multiparous (n = 81) Parents (Landrace x Large White)sows were included in the study from spring to summer 2020 and were divided into 4 replicates, each one consisting of approximately 26 animals. Ill sows were excluded from the study. At weaning, sows were allocated to one of the two treatments described below. Groups were homogenous for sows’ back fat thickness (BF, 13.93 ± 2.02 mm), measured by ultrasonography at the level of the right inter-costal space. Groups were constituted as follows:
i)MG, multiple group (n=41): sows were transferred to the group-housing system immediately after weaning, mixed into static group
ii)CG, control group (n=65): sows remained in individual stalls until 28 days after service, in compliance with the Council Directive 2008/120/EC, and were then mixed into static groups
All sows were maintained in their treatment group until approximately 110 d of gestation, when they were moved into farrowing crates.
Three time points characterized the experiment as follows: the day of transfer of sows to group-housing (MG) or individual stall (CG) after weaning (T0), 24 h (T1) and 7 days (T2) later. At T2 all sows were already artificially inseminated.
Housing and Feeding
The sows in the MG treatment were housed in groups of 56 sows/pen, provided with a floor space allocation of approximately 2.50 m2/sows. The floor was fully slatted. Drinking water was ad libitum, with three nipple drinkers per pen. One block of wood on a chain, one chain and a ball were provided as enrichment. The sows in the CG treatment were in-
dividually housed in 2.35 x 0.6 m (trough included) stalls with a fully slatted floor, which contained an individual nipple drinkers and horizontal bars. One block of wood on chain and one chain were provided as enrichment. Feed was distributed twice a day in the trough by an automated feeding system, mixed with water in a 3 Kg water/1 Kg concentrate ratio. Based on the nutrient requirements of each productive phase, 4 to 6 Kg concentrate/sow were provided.
Oestrus detection was performed by means of a teaser boar, starting from 3 days after weaning. The teaser boar entered twice a day into the insemination area and was free to move among the lanes without entering single or multiple stalls. Sows showing the reflex of immobility, vulva hyperemia and edema, were artificially inseminated by the same operator with 200 ml of refrigerated semen obtained from the owned boars, containing at least 3 billions of progressively motile spermatozoa. The insemination of sows in MG was performed while an operator induced immobility reflex for restraint.
Data collection
Reproductive measures were assessed for all sows in all replicates. Weaning-to-service interval (W-S) was recorded while the pregnancy rate was determined in each group as the proportion of sows inseminated that resulted pregnant. Pregnancy diagnosis was performed by trans-abdominal, real-time ultrasound (RKU10, Kaixin ultrasound scanner, Kaixin Mansion, C-01, Economic Development Zone, Xuzhou, Jiangsu, China) by the farm veterinarian at 24 d after the insemination. The number of sows culled after weaning was recorded to calculate the culling rate.
The presence of lameness, as localization and severity of skin injuries were assessed by visual inspection performed by the same operator on both sides of the sow body, at T1 and T2. The animal body was divided into areas, namely: head, rear leg, body, rump, hind leg and tail/vulva. In case more than one body region displayed skin injuries, the animal was scored as “multiple”. The severity of lesions in each area was scored according to a 3-point scale (superficial lesion = 1; bleeding = 2; deep wound = 3). If lesions displayed different degrees of severity, the most severe was included into the dataset. In MG, once skin lesions on a sow were recorded, the animal was identified using a non-toxic dye stick.
Statistical analysis
Data were recorded in an Excel™ work sheet and then imported into IBM® Statistics SPSS v.23 Software for statistical analysis. The distribution of parity, BF at T0 and W-S were evaluated by the Explore function; MG and CG were compared through two-tailed ANOVA test. The distribution and severity of skin injuries were also plotted. The pregnancy rate at the first AI and culling rate were compared in MG and CG through binary logistic regression.
To perform further analysis, skin injuries were classified as a dichotomous variable (presence vs absence). The influence of factors potentially contributing to pregnancy and culling rates was examined through multivariable logistic regression. The outcome (empty vs pregnant; non-culled vs culled) was set as the dependent variable, while covariates were parity, treatment group, BF in T1 and the presence/absence of skin injuries in T1 and T2.
Results were considered statistically significant when p < 0.05.
22Does
RESULTS
At the time of weaning, there was no difference between the groups for BF (13.5 mm in MG and 14.2 mm in CG, respectively, p > 0.05). The two housing systems had no effect on the culling rate due to replacement (Table 1). Among the remaining sows (n=91), no effect of housing or mixing stress on reproductive efficiency was observed (W-S interval and pregnancy rate) and 95.6% of them were recognized as being in estrus within 8 days after weaning and then inseminated, with an overall 74.7% pregnancy rate after the first AI (72.9% and 75.9% in MG and CG, respectively).
At weaning (T0) any skin lesions were observed. Localiza-
tion and severity of the lesions observed in MG sows are shown in Figure 1. At T1, 20 of 41 (49%) sows in MG displayed at least one body region affected by skin lesions. Skin injuries due to fighting were localized in the regions of the head (20%) and rear leg (2%), while 24% of sows showed multiple localization. Only a limited number of sows displayed deep injuries (3%) and lameness (3%). Any animal from CG showed lesions at T1. At T2, the percentage of injured sows in MG decreased to 27%, with 11 of 41 animals involved, while 1 sow from CG displayed a superficial skin lesion on the rear leg. Most of MG sows showed multiple injuries (10%) and lameness (7%).
Tables 2 and 3 summarize the results from the multivariable
F. Di Muzio et al. Large Animal Review 2023; 29: 21-2623
N4165106 Parity2.07 ± 1.233.18 ± 1.47< 0.011 2.75 ± 1.48 Culling rate (%)9.8 (4/41)16.9 (11/65)n.s. 2 14.2 (15/106) N after culling375491 W-S (d)5.26 ± 1.155.59 ± 1.15n.s. 1 5.46 ± 1.16 Pregnancy rate (%) 72.9 (27/37)75.9 (41/54)n.s. 2 74.7 (68/91)
Figure 1 - Localization, frequency and severity of skin injuries and lameness in MG sows in T1 and T2. a) frequency of healthy, injured and lame sows in T1. b) distribution of the severity score of skin injuries in sows in T1. c) frequency of healthy, injured and lame sows in T2. d) distribution of the severity score of skin injuries in sows in T2. Severity of skin injuries: 1 = superficial lesion; 2 = bleeding; 3 = deep wound.
GroupAll MGCGp-value
Table 1 - Effect of housing sows after weaning in groups (MG) or in stalls (CG) on reproductive performance and culling rate.
p-value
2 p-value
MG: multiple housing group; CG: control (individual stalls) group; BF: back fat thickness; W-S: weaning to service interval; mm: millimeters; d: days; n.s.: the difference between MG and CG was not significant.
1
from ANOVA test.
from binary logistic regression.
social competition affect the reproductive performance of sows moved to group housing after weaning?
logistic regression for evaluating factors affecting the outcome of the first insemination (pregnant) and culling decision (culled). According to the model, any examined factor significantly affected the pregnancy rate in MG and CG sows. Concerning culling, any factor significantly influenced the decision, except for parity (p = 0.048).
DISCUSSION
Concerns for animal welfare in intensive breeding systems are growing in importance globally, while management strategies that improve the expression of social behavior, including fighting, could be perceived by farmers as having a negative impact on animal productivity and fertility5. This study was undertaken to evaluate whether grouping sows of different parities from weaning to the first month of pregnancy could affect the occurrence of skin injuries and the interval from weaning to the first insemination and to conception.
In this study, the mean parity of sows allocated in MG and CG
was statistically different, with a significant greater amount of primiparous allocated to MG in our study. Jansen et al.10 suggested that mixing gilts could exacerbate fights and stress. In the experiment here, the farm routinely mixed younger animals with a smaller percentage of older sows to facilitate hierarchy stabilization, as primiparous sows show lesser body weight compared with older herd mates14. It should also be considered that in farms where both multiple and single stalls are available, farmers could choose to move younger and healthy sows in the former, and to allocate older, lame, low body condition score ones into the latter to avoid detriment of their condition and culling15 However, it is reasonable to suggest that mixing animals and competition could negatively affect the health of post-weaning sows, while single stalls could be beneficial to recovery their clinical condition before moving to group housing.
Previous research tried pointing out the effect of stress and fear in the multiple group housed sows on reproduction, and even if some results showed inconsistency14,15, there is some indication that high stocking density can impair fertility5, especially when stress occurs during the first 3 weeks of preg-
24Does
Parity0.1011.5120.9222.478 Group MGReferent CG0.7440.7630.1503.870 BF in T10.1691.2830.8991.831 Lesions in T1 No injuryReferent Injuries0.3330.3660.0482.799 Lesions in T2 No injuryReferent Injuries0.0989.0060.665121.977
95% C.I. Covariatesp-valueORLowerUpper
Table 2 - Factors affecting the positive pregnancy diagnosis. Results from multivariable logistic regression.
Parity0.0481.5531.0042.402 BF in T10.3271.2100.8271.770 Group MG Referent CG0.3081.8840.5576.372 Lesions in T1 No injuryReferent Injuries0.2213.6940.45729.893 Lesions in T2Not enough cases
MG: multiple housing group; CG: control (individual stalls) group; BF: back fat thickness; T1: 24 hour after moving to MG or CG; T2: 7 days after moving to MG or CG; OR: odds ratio.
95% C.I. Covariatesp-valueORLowerUpper
Table 3 - Factors affecting the culling decision. Results from multivariable logistic regression.
MG: multiple housing group; CG: control (individual stalls) group; BF: back fat thickness; T1: 24 hour after moving to MG or CG; T2: 7 days after moving to MG or CG; OR: odds ratio.
nancy8,16. In our study, an average of 2.50 m2/sow was ensured in multiple housing and a maximum of 7 sows were allocated in multiple stalls. The limited number of animals per multiple group is closer to the naturally formed family group in wild pigs7, while the high space allocation agrees with recommendations from Verdon et al.17. These factors likely contributed to reducing, even if not to eliminate, the stress due to social grouping and competition in our experiment. According to Jansen et al.10 social fights usually last for 2 or 3 days after mixing unfamiliar animals, while Brajon et al.9 observed agonistic behavior up to 1 month after grouping. However, in their study each group contained 90 sows on average and this large amount likely contributed to exacerbating fights even after hierarchy establishment. In this study, we observed that fights for hierarchy reached their maximum intensity in the first 24 h after grouping, similarly to what reported by Peltoniemi et al.8. In fact, the observation of skin injuries confirmed a decrease in the number of sows displaying lesions yet in T2 in MG, that is, from 20 to 11 of 41 animals allocated in multiple group. Comparing T1 and T2, the overall amount of injured sows decreased, as a lower incidence of injuries in the anterior regions of the sows body was noticed; however, an increase in lameness and hind leg lesions was observed. This was likely due to mounting behavior in relation to pro-estrus and estrus in MG animals during the time interval from T1 and T2, rather than to social competition.
The 74.7% of inseminated sows were pregnant after the first AI, and this result agrees with the average reproductive performance reported by other authors15,16,18-20. Fertility was not influenced by factors such as parity, type of housing, occurrence of skin lesions, as no differences were found in W-S and W-Conc intervals. Studies which evaluated the impairment of fertility in group-housed sows often involved larger groups, that is 7 to more than 10,21 or 20 sows with 4.3 m2/sow22,23, or even greater groups with individual electronic feeders24,25, compared to our study. Einarsson et al.7 reported that weaned sows housed in groups with sufficient space allocation showed a shorter weaning-to-oestrus interval, that is 4 -5 days. Even though differences in W-S intervals were not significant in our study, these results suggested that housing sows after weaning in the multiple group with a reduced number of herd mates led to increased stress due to competition for establishing hierarchy, but this condition was quickly overcome.
CONCLUSIONS
Our results suggested that housing sows after weaning in the multiple small group, that is 6 -7 subjects, with a space allowance of 2.50 m2/sow, led to social competition and fighting, as demonstrated by the incidence of skin injuries in the anterior areas of sows body at 24 h after mixing. However, this condition was quickly overcome and 7 days later, the percentage of injured sows already decreased. Moreover, no negative effect of grouping sows was observed on the weaning to service interval, pregnancy and culling rates. In conclusion, mixing sows into small groups after weaning could improve the expression of social behavior with no damaging effect on fertility, thus representing a compromise between the need of farmers and the demands of consumers.
Ethics statement
Ethic review and approval was not applicable according to the directive 2010/63/EU since the procedures were performed during routine health check, it did not require us housing animals and the procedures involved on-farm routine, non-invasive practices.
Data availability statement
The data that support the findings of this study are available from the corresponding author upon reasonable request.
Conflict of interest
The authors declare no competing interest.
Funding
This research received no external funding.
Fondazione Cariparo supported Maria Costanza Galli by a doctoral fellowship at University of Padova (Italy).
Author contribution
Di Muzio and Paoluzzi carried out the study, Galli designed, directed the study and corrected the manuscript, Crociati performed the statistical analysis, drafted the manuscript, Sylla drafted and critically corrected the manuscript.
References
1. Vogeler C.S. (2017). Farm Animal Welfare Policy in Comparative Perspective: Determinants of Cross-national Differences in Austria, Germany, and Switzerland. Eur. Policy Anal, 3, 20-47, doi:10.1002/EPA2.1015.
2. Vogeler C.S. (2019). Why Do Farm Animal Welfare Regulations Vary Between EU Member States? A Comparative Analysis of Societal and Party Political Determinants in France, Germany, Italy, Spain and the UK. JCMS J. Common Mark. Stud, 57, 317-335, doi:10.1111/JCMS.12794.
3. Skaperda Z., Veskoukis A.S., Kouretas D. (2019). Farm animal welfare, productivity and meat quality: Interrelation with redox status regulation and antioxidant supplementation as a nutritional intervention (Review). World Acad. Sci. J, 1, 177-183, doi:10.3892/WASJ.2019.19/HTML.
4. Galli M.C., Gottardo F., Contiero B., Scollo A., Boyle L.A. (2021). The changing face and associated drivers of research on welfare of the gestating sow. Ital. J. Anim. Sci, 20, 2174-2187, doi:10.1080/1828051X.2021. 2002732/FORMAT/EPUB.
5. Kongsted A.G. Stress and fear as possible mediators of reproduction problems in group housed sows: a review. (2007). Acta Agric. Scand. Sect. A - Anim. Sci, 54, 58-66, doi:10.1080/09064700410032031.
6. EFSA (2007). Animal health and welfare aspects of different housing and husbandry systems for adult breeding boars, pregnant, farrowing sows and unweaned piglets - Scientific Opinion of the Panel on Animal Health and Welfare. EFSA J, 5, doi:10.2903/J.EFSA.2007.572.
7. Einarsson S., Sjunnesson Y., Hultén F., Eliasson-Selling L., Dalin A.M., Lundeheim N., Magnusson U. (2014). A 25 years experience of group-housed sows-reproduction in animal welfare-friendly systems. Acta Vet. Scand, 56, 1-7, doi:10.1186/1751-0147-56-37/FIGURES/1.
8. Peltoniemi O., Björkman S., Maes D. (2016). Reproduction of grouphoused sows. Porc. Heal. Manag, 2, 1-6, doi:10.1186/S40813-016-00332/FIGURES/2.
9. Brajon S., Ahloy-Dallaire J., Devillers N., Guay F. (2021). Social status and previous experience in the group as predictors of welfare of sows housed in large semi-static groups. PLoS One, 16, doi:10.1371/JOURNAL.PONE.0244704.
10. Jansen J., Kirkwood R.N., Zanella A.J., Tempelman R.J. (2007). Influence of gestation housing on sow behavior and fertility. J. Swine Heal. Prod, 15, 132-136.
11. Razdan P., Mwanza A.M., Kindahl H., Rodriguez-Martinez H., Hultén F., Einarsson S. (2002). Effect of repeated ACTH-stimulation on early embryonic development and hormonal profiles in sows. Anim. Reprod. Sci, 70, 127-137, doi:10.1016/S0378-4320(01)00182-8.
12. Tsuma V.T., Einarsson S., Madej A., Kindahl H., Lundeheim N. (1996).
F. Di Muzio et al. Large Animal Review 2023; 29: 21-2625
26Does social competition affect the reproductive performance of sows moved to group housing after weaning?
Effect of food deprivation during early pregnancy on endocrine changes in primiparous sows. Anim. Reprod. Sci, 41, 267-278, doi:10.1016/03784320(95)01456-X.
13. Arey D.S., Edwards S.A. (1998). Factors influencing aggression between sows after mixing and the consequences for welfare and production. Livest. Prod. Sci, 56, 61-70, doi:10.1016/S0301-6226(98)00144-4.
14. Salak-Johnson J.L., Niekamp S.R., Rodriguez-Zas S.L., Ellis M., Curtis S.E. (2007). Space allowance for dry, pregnant sows in pens: body condition, skin lesions, and performance. J. Anim. Sci, 85, 1758-1769, doi:10.2527/JAS.2006-510.
15. Koketsu Y., Iida R. (2017). Sow housing associated with reproductive performance in breeding herds. Mol. Reprod. Dev, 84, 979-986, doi:10.1002/MRD.22825.
16. Knox R., Salak-Johnson J., Hopgood M., Greiner L., Connor J. (2014). Effect of day of mixing gestating sows on measures of reproductive performance and animal welfare. J. Anim. Sci, 92, 1698-1707, doi:10.2527/JAS.2013-6432.
17. Verdon M., Hansen C.F., Rault J.L., Jongman E., Hansen L.U., Plush K., Hemsworth P.H. (2015). Effects of group housing on sow welfare: a review. J. Anim. Sci, 93, 1999-2017, doi:10.2527/JAS.2014-8742.
18. Bates R.O., Edwards D.B., Korthals R.L. (2003). Sow performance when housed either in groups with electronic sow feeders or stalls. Livest. Prod. Sci, 79, 29-35, doi:10.1016/S0301-6226(02)00119-7.
19. Mcglone J.J., von Borell E.H., Deen J., Johnson A.K., Levis D.G., MeunierSalaon M., Morrow J., Reeves D., Salak-Johnson J.L., Sundberg P.L. (2004).
REVIEWS: Compilation of the Scientific Literature Comparing Housing
Systems for Gestating Sows and Gilts Using Measures of Physiology, Behavior, Performance, and Health. Prof. Anim. Sci, 20, 105-117, doi:10.15232/S1080-7446(15)31285-7.
20. Karlen G.A.M., Hemsworth P.H., Gonyou H.W., Fabrega E., David Strom A., Smits R.J. (2007). The welfare of gestating sows in conventional stalls and large groups on deep litter. Appl. Anim. Behav. Sci., 1-3, 87-101, doi:10.1016/J.APPLANIM.2006.05.014.
21. Peltoniemi O.A.T., Love R.J., Heinonen M., Tuovinen V., Saloniemi H. (1999). Seasonal and management effects on fertility of the sow: a descriptive study. Anim. Reprod. Sci, 55, 47-61, doi:10.1016/S03784320(98)00159-6.
22. Munsterhjelm, C. Valros A., Heinonen M., Hälli O., Peltoniemi O.A.T. (2008). Housing during early pregnancy affects fertility and behaviour of sows. Reprod. Domest. Anim, 43, 584-591, doi:10.1111/J.14390531.2007.00956.X.
23.Galli M.C., Boyle L.A., Mazzoni C., Contiero B., Stefani A., Bertazzo V., Mereghetti F., Gottardo F. (2022). Can we further reduce the time pregnant sows spend in gestation stalls?, Livestock Science, 264, 105049, doi: 10.1016/j.livsci.2022.105049.
24. Li Y.Z., Cui S.Q., Yang X.J., Johnston L.J., Baidoo S.K. (2018). Minimal floor space allowance for gestating sows kept in pens with electronic sow feeders on fully slatted floors. J. Anim. Sci, 96, 4195-4208, doi: 10.1093/JAS/SKY282.
25. Pierdon M.K., Parsons T.D. (2018). Effect of familiarity and mixing method on gestating sow welfare and productivity in large dynamic groups. J. Anim. Sci, 96, 5024, doi:10.1093/JAS/SKY380.
1 Department of Animal Nutrition, Faculty of Animal Production and Technology, University of Veterinary and Animal Sciences, Lahore, Pakistan
2 Animal Nutrition, Life Sciences, Graduate School of Agricultural Science, Tohoku University, Sendai, Japan
3 Department of Poultry Production, Faculty of Animal Production and Technology, University of Veterinary and Animal Sciences, Lahore, Pakistan
4 Department of Animal Sciences, Faculty of Agriculture, University of Sargodha, Sargodha, Pakistan
SUMMARY
The aim of this study was to evaluate chemical constituents and antimicrobial as well as antioxidant properties of three essential oils (EOs) of Apiaceae family, coriander (Coriandrum sativum), ajwain (Trachyspermum ammi) and dill seed (Anethum graveolens) to assess their in vitro potential to be used as an alternative to antibiotic growth promoters (AGPs) in broiler production. The EOs of coriander, ajwain and dill seed were extracted by hydro-distillation technique and analyzed for their chemical constituents by gas chromatography-mass spectrophotometry (GC-MS) analysis. The GC-MS analysis indicated that the major bioactive compounds in coriander essential oil (CEO), ajwain essential oil (AjEO) and dill seed essential oil (DEO) are linalool (56.8%), thymol (68.2%) and carvone (41.1%), respectively. The antibacterial capacity of these EOs determined against E. coli and two Salmonella species of poultry origin. In agar well diffusion assay for E. coli, AjEO was 2 and 3 folds more potent as compared to CEO and DEO, respectively. For S. enteritidis, DEO showed 2 folds more activity than AjEO, whereas for S. gallinarum AjEO performed 3 times better than CEO. In agreement with the results of the agar well diffusion assay, minimum inhibitory concentrations (MIC) of AjEO were lowest for E. coli and S. gallinarum as compared to other EOs, while for S. enteritidis, MIC of DEO was found lowest. The antioxidant activities, analyzed by per oxide value (PV), thiobarbituric acid (TBA) and 2,2’-diphenyl-1-picrylhydrazyl (DPPH) method showed the AjEO had highest antioxidant potential in comparison to other EOs. During storage period of 28 days, AjEO reduced the PV and TBA values of rapeseed oil by 44.3 and 49.1%, respectively. Overall, the findings of in vitro analysis demonstrated that AjEO in comparison to CEO and DEO, has considerable antibacterial and antioxidant activities and could be a potential replacement of AGPs in broiler production with less amount of supplementation.
KEY WORDS
Essential oil, in vitro, antibacterial, antioxidant, broiler.
1. INTRODUCTION
World population is growing exponentially and predicted to cross nine billion by 2050. In response, agri-food markets have also been expanding rapidly in the last two decades. To meet the worldwide population demand in the next thirty years, a 102% increase in the food supply will be required1. Poultry is one of the major contributor to fulfil the protein requirements of the world population. The nutritional and genetic improvements in chickens are the main strategies to increase productivity to accomplish the white meat demands worldwide. However, high growth rates of birds and stocking density negatively affect the health status, which is partially covered by the sub-therapeutic usage of antibiotics, known as antibiotic growth promoters (AGPs)2
Corresponding Author:
Usman Ali (usman.ali@uvas.edu.pk).
The AGPs are potentially used in broiler industry to improve the gut health, production performance and to reduce the morbidity and mortality3. These AGPs support the intestinal health by reducing the antimicrobial load and ultimately maximum utilization of the nutrients which results in better growth performance. However, an extensive use of AGPs is leading to development of antibiotic resistance crisis and foodborne-disease outbreaks in broilers as well as human populations. Many of AGPs used in broiler production belong to the same class of antibiotics being practiced treating the human diseases. These facts have high-lighten the serious public health concerns worldwide and question the use of AGPs in broiler production. Consequently, the AGPs use in broiler production has been prohibited in several countries including European Union4. Keeping in mind the importance, there is a dire need to find the best suitable alternatives of AGPs for broiler production. Alternatives to reduce and/or eliminate the AGPs in broiler production include not only probiotics, prebiotics, organic acids, bacteriophages, but also the phytobiotics including essential oils (EOs)5. The EOs received much attention due to being natu-
USMAN ALI1*, SAIMA1, MASAAKI TOYOMIZU1,2, SHAFQAT NAWAZ QAISRANI1, ATHAR MAHMUD3, ZAFAR HAYAT4
U. Ali et al. Large Animal Review 2023; 29: 27-3427
Implication of chemical compositions and in vitro properties of coriander, ajwain and dill seed essential oils as potential replacement of antibiotic growth promoters in broilers
rg
28Implication of chemical compositions and in vitro properties of coriander, ajwain and dill seed essential oils
ral, easily available, non-toxic, cost effective and residue-free. A variety of EOs have the potential to replace AGPs in broiler production based on their bioactive constituents and growth promoting activities3. Antimicrobial activity is one of the most eminent activities of EOs, while they also have antioxidant, anti-inflammatory, anti-stress, and growth promoting effects. The EOs can also alleviate the oxidative stress by several mechanisms, such as direct antioxidant action and expression of antioxidant enzymes6. Therefore, EOs with the antimicrobial and antioxidant properties could support gut health and growth performance of the broilers as a possible replacement of AGPs.
Apiaceae is one of the largest plant families. Several constituents of the EOs extracted from plants of this family are reported to have potential to exert beneficial effects on gut morphology, nutrient absorption, microbiota, and oxidative status3. Therefore, the EOs extracted from the Apiaceae family have been considered as a possible replacement for AGPs in broiler production. In this study coriander (Coriandrum sativum), ajwain (Trachyspermum ammi) and dill seed (Anethum graveolens) were employed as representatives from the Apiaceae family because of their well-known antimicrobial and antioxidant potential and common availability mostly in South Asian countries. Most of the published literature covers the in vitro antimicrobial properties of these EOs against the bacterial species relevant to food pathogenesis1. There is scarcity of published data for bacteria of poultry origin such as Escherichia coli,Salmonella enteritidis, Salmonella gallinarum and Clostridium perfrengens. Furthermore, as different in vitro test methods as well as different pathogens and culture media conditions exist, a side-by-side comparison of their chemical compositions and in vitro antibacterial and antioxidant properties could not be made between those EOs. Therefore, studies investigating for ranking the capacity of these three EOs i.e., coriander essential oil (CEO), ajwain essential oil (AjEO) and dill seed essential oil (DEO) are of particular importance. The aim of this study was to analyze the chemical constituents and compared antimicrobial as well as antioxidant properties between three EOs, to assess their in vitro potential to be used as an alternative to AGPs in broiler production.
2. MATERIALS AND METHODS
2.1. Plant material and essential oil extraction
The samples (coriander, ajwain and dill seeds) collected from local market of Lahore, Pakistan in summer, 2021, botanically identified and stored after coarse grinding until hydro-distillation process. The EOs from ground material were extracted by hydro-distillation technique using clevenger apparatus. Briefly, 100 g material was subjected to hydro-distillation using 500 mL of distilled water in 1 L flask for 4 hrs until complete recovery of the EO. The yielded EOs were stored in a sealed amber colored vial at 4ºC for the further laboratory analysis7
2.2. Gas chromatography-mass spectrometry analysis
Chemical constituents present in the extracted EOs were analyzed by GC-MS (QP-2020, Shimadzu Co., Kyoto, Japan). The individual compounds were separated by Shimadzu SH-Rxi5sil MS (30 m length, 0.25 mm i.d., 0.25 µm df) column. He-
lium was used as a carrier gas for all the three EOs with flow rate 1.5, 1.8, and 1.5 mL/min for CEO, AjEO, and DEO, respectively. For CEO, the oven temperature was programmed to increase from 35 to 200ºC at a rate of 3ºC/min, followed by a final hold time of 10 min8 and the total scan time was 66 min. For AjEO, the temperature program was set at 60ºC for 5 min, subsequently increased to 220ºC with 4ºC/min increase, then 11ºC/min up to 280ºC with 15min hold time and the total scan time was 65 min7. For DEO, the oven temperature program was initially set at 60ºC for 2 min, thereafter, increased up to 280ºC at 10ºC/min, with 5 min of hold time and the total scan time was 28 min9.
The identification of the EO constituents was based on the comparison of their retention indices (RI) relative to C8-C30 n-alkanes and by matching their mass spectral fragmentation patterns with corresponding library (NIST® 2017; National Institute of Standards and Technology, Gaithersburg, MD, USA). The quantity of the identified compounds was calculated by dividing the individual peak area by the total area of all peaks10
2.3. Antibacterial activity
a. Bacterial test strains
The polymerase chain reaction (PCR) confirmed strains of E. coli, S. enteritidis and S. gallinarum of poultry origin were obtained from the in-house collection of Department of Microbiology, University of Veterinary and Animal Sciences, Lahore. The bacteria were collected from the liver and cecal samples of chickens arranged from different commercial farms. Briefly, the E. coli and S. enteritidis were isolated from the cecal and the S. gallinarum from the liver tissues of the suspected birds. The isolated and PCR confirmed strains of these three bacteria were stored at -80ºC in 50% sterile glycerol for further use.
b. Agar well diffusion assay
The activity of EOs against E. coli, S. enteritidis and S. gallinarum of poultry origin weredetermined by well diffusion assay on nutrient agar plates. All the analyses of agar well diffusion assay were replicated three times. Briefly, exponentially growing bacteria were re-suspended in phosphate buffer saline (~0.5 McFarland) and swabbed on agar plates to obtain a uniform lawn of bacterial growth. The wells of 6mm size were made on the inoculated plates aseptically, sealed and 100 µL of each EOs (100 µL/mL dimethyl sulfoxide (DMSO)) were added in each well11. The gentamycin and ciprofloxacin (15 µL/mL DMSO) were evaluated as standards for E. coli and Salmonella strains, respectively, and DMSO as a negative control. Plates were incubated at 37ºC in an incubator for 24 hrs and the antibacterial activity of EOs were read as zone of inhibition (ZOI) of growth surrounding the wells.
c. Minimum inhibitory concentrations
Minimum inhibitory concentrations of EOs were determined by broth microdilution method using 96 well microtiter plates in triplicates. A twofold serial dilution of EOs in 10% DMSO (10 µL/mL to 0.02 µL/mL) were prepared. A 100 µL of each dilution was added in each well and 100 µL of microbial suspension (1×10⁶ CFU/mL) was also mixed. The gentamycin and ciprofloxacin at similar concentrations were evaluated as standards for E. coli and Salmonella strains, respectively, and DMSO as negative control. The plates were incubated at 37ºC in an incubator for 24 hrs. MICs were defined as the lowest concentration of compound able to in-
hibit the growth of the microorganisms.
2.4. Antioxidant activity
a.
Peroxide value
To measure primary lipid oxidation that indicates the number of peroxides formed in the fats and oils during oxidation, PV was analyzed by using a modified oven test12. Briefly, 200 ppm of EOs or the butylated hydroxytoluene (BHT, commercial antioxidant) were added to 30 g of the rapeseed oil in a 100 mL glass beaker. BHT was used as a positive control to confirm the effectiveness of EOs13. The mixtures were thoroughly homogenized and placed into the thermostatic oven at 80ºC for four weeks12. A control sample (without additive) was also prepared and evaluated under similar conditions. The PV of the samples was measured on weekly basis at 0, 7th, 14th, 21st and 28th day and replicated for 3 times. For this purpose, 1 g sample was dissolved in a solution of CH3COOH:CHCl3 (3:2 v/v) and then 1 ml saturated solution of potassium iodide was added and titrated against 0.1 N sodium thiosulphate, using starch as an indicator. A blank titration was also run parallel to the treated samples and the PV (meq/kg) was calculated as described by Singh et al.13
b. Thiobarbituric acid value
The sample for TBA analysis was also prepared by using the same technique as for PV test and replicated for 3 times. For TBA value estimation, a 10 g sample was mixed with 20 mL 0.67% aqueous thiobarbituric acid and 25 mL benzene solution, and this mixture was shaken continuously by mechanical shaker for 2 hrs. The supernatant was separated after shaking and placed in water bath (95ºC) for 60 min. After cooling, absorbance of the supernatant was measured at 540 nm with SPECORD® 200 Plus spectrophotometer as described by Singh et al.12. The TBA value of the samples were measured on
weekly basis at 0, 7th, 14th, 21st and 28th day.
c. DPPH free radical scavenging activity
The reducing efficacy of DPPH in the presence of antioxidant is one of the several methods proposed for antioxidant assay whose characteristic color transformation from purple to yellow is measured spectrophotometrically. 1 mL methanolic solution of the EOs or BHT at five different concentrations (525 µL/mL) was thoroughly mixed with 4 mL of 0.004% methanolic solution of DPPH and replicated 3 times. The mixtures were than kept in dark for 30 min and absorbance was measured using SPECORD® 200 Plus spectrophotometer at 517 nm wavelength14. The ability of additives to scavenge the DPPH radicals was calculated using the following equation:
DPPH scavenging effect (%) = Ac - At / Ac x 100
Where, Ac = absorbance of control sample
At = absorbance of test sample
d. Oxidative stability index (OSI)
The OSI was determined by using the Professional Rancimat 892 (Metrohm, Herisan, Switzerland) instrument. Five samples of rapeseed oil were prepared out of which three were supplemented with 200 ppm of each EO, fourth had BHT and the fifth was the negative control15. Three gram of each sample was subjected to determine the oxidative stability at 120ºC under a constant oxygen flow (20 L/hr) and replicated 3 times. The results are indicated as the induction period (IP), which is known as the time required for reaching an endpoint of oxidation corresponding to either a level of detectable rancidity or a sudden change in the oxidation rate as described by Cordeiro et al.15
2.5. Statistical analysis
The data were analyzed for normality and for homogeneity.
U. Ali et al. Large Animal Review 2023; 29: 27-3429
948 α-pinene3.34-0.07 998 δ-terpinene1.6512.70.67 1018D-limonene1.01-19.9 1042Cymene0.72130.16 1082Linalool56.8-3.7 1104Nonanal2.63-1121Camphor2.33-0.02 1138Borneol3.11-1179Dihydro-carvone--11.2 1190Carvone1.09-41.1 1228Geraniol2.94-1262Thymol-68.21352Geranyl acetate17.6-0.06 1705Dill apiol--6.57 2704Phthalic acid--9.05 Total (%)93.293.992.5
RI*Compound NameConcentrations (%) CEOAjEODEO
Table 1 - Major phyto-constituents of coriander, ajwain and dill seed essential oils analyzed by gas chromatography-mass spectrometry.
CEO=coriander essential oil; AjEO=ajwain essential oil; DEO=dill seed essential oil; *RI: retention index observed; (-): not detected
Analysis of variance was performed by ANOVA procedure using SPSS 16.0 (SPSS Inc., Chicago, IL) statistical package. Probability values of p ≤ 0.05 were declared as significant. When the effect was significant, the difference among the treatment means were detected using Duncan’s multiple range test.
3. RESULTS AND DISCUSSION
3.1. Essential oil yields and the chemical compositions
The hydro-distillation of coriander, ajwain, and dill seed yielded 0.35% (yellowish), 1.96% (brownish), and 2.24% (light yellowish) EOs, respectively. A total of 28, 25, and 31 volatile bioactive compounds covering >99% of the GC-MS peaks were identified in CEO, AjEO and DEO, respectively. The concentrations (%) of major chemical constituents (>92.5% in total) of EOs along with their retention indices (RI) are presented in Table 1. The main volatile compounds in CEO were linalool (56.8%), geranyl acetate (17.6%), -pinene (3.34%), borneol (3.11%), and geraniol (2.94%), which belong to monoterpenes (linalool, geranyl acetate, -pinene, borneol) and monoterpenoid alcohols (geraniol) groups. In AjEO, the major identified compounds were thymol (68.2%), cymene (13%) and δ-terpinene (12.7%). Thymol in AjEO is phenolic in nature while the other two are monoterpenes. In DEO, carvone (41.1%), D-limonene (19.9%), dihydro-carvone (11.2%), phthalic acid (9.05%), dillapiol (6.57%), and linalool (3.7%) were identified as main bioactive compounds belonging to monoterpenes group.
Linalool, thymol and carvone are considered as the major bioactive constituents of the CEO, AjEO and DEO, respectively, with variable relative concentrations. In the current study, linalool concentration (56.8%) in CEO was relatively lower than the reported concentrations (66.1 - 75.3%) in some studies8,10,13, whereas the geranyl acetate (17.6%) concentration in CEO was higher than the reported concentrations (0 - 8.1%).
The thymol concentration (68.2%) in AjEO agrees with the findings (67.4%) of Vitali et al.7, but not in line with the reported concentrations (15.5-50.8%) in other studies16,17,18. This variation might be related with the differences in rapness of the seeds, area of cultivation and conditions and duration of hydrodistillation process.
The carvone concentration (41.1%) in DEO was similar to the result of Singh et al.19, who showed 47.7% carvone, but they reported dillapiole as the second component with 32.7%, which is much higher than our result with 6.57%. This may be due to differences in growth stage of seeds, considering that the conversion of dillapiole to oxygenated terpenes might increase during the developmental growth of seeds. The presence of limonene as second major component in DEO is in accordance with the findings of most of studies12,20,21 except for results of Singh et al.19, who showed dillapiole as the second one as mentioned above.
3.2. Antibacterial activity a. Agar well diffusion assay
Table 2 shows the results of antibacterial activity of the EOs determined by well diffusion assay against E. coli, S. enteritidis and S. gallinarum of poultry origin. Each of the three EOs exhibited different antibacterial activities in terms of ZOI based on their bioactive constituents. The AjEO performed better
Table 2 - The zone of inhibition (mm) of coriander, ajwain and dill seed essential oil, and standard antibiotics against three different bacteria.
Test material E. coliS. enteritidisS. gallinarum
CEO=coriander essential oil; AjEO=ajwain essential oil; DEO=dill seed essential oil; CEO, AjEO, DEO (100µL/mL DMSO); gentamycin and ciprofloxacin (15 µL/mL DMSO); ZOI exclude the diameter (6mm) of well; NA: not evaluated; Means with different superscript letters are significantly different (p ≤ 0.05) from each other; SEM=standard error of the mean
against E. coli (10.83 mm) and S. gallinarum (13.93 mm) than the other EOs. Our results are line with the data presented in previous studies7,16. These findings supported by the fact that thymol, the major bio active compound of AjEO, has the bacteriostatic or bactericidal properties due to its phenolic nature22. The cymene and δ-terpinene are the major components of AjEO after thymol and their antibacterial activities have also been reported previously23 which support our findings. DEO oil showed higher antibacterial activity (p < 0.001) against S. enteritidis than CEO and AjEO, while Singh et al.12 reported DEO as ineffective against Salmonellatyphimurium. The CEO showed the narrower ZOI against all the bacteria tested in this study which can be justified with the fact that it is a potent antibacterial against gram positive than gram negative bacteria due to structural differences in bacterial membranes as the gram-negative bacteria are naturally more resistant due to the presence of an outer membrane made up of lipoproteins and lipopolysaccharides which reduce the entry of certain lipophilic molecules inside the bacterial cell24. Additionally, this finding can be supported by the fact that the linalool has weaker antibacterial but stronger antifungal activity25.
b. Minimum inhibitory concentrations
The MICs of CEO, AjEO and DEO required to inhibit the bac-
Table 3 - Minimum inhibitory concentration (µL/mL) of coriander, ajwain and dill seed essential oils and standard antibiotics against three different bacteria.
Test material E. coliS. enteritidisS. gallinarum
CEO=coriander essential oil; AjEO=ajwain essential oil; DEO=dill seed essential oil; NA: not evaluated; Means with different superscript letters are significantly different (p ≤ 0.05) from each other; SEM=standard error of the mean
30Implication
of chemical compositions and in vitro properties of coriander, ajwain and dill seed essential oils
CEO5.33b 0d 4.67c AjEO10.83a 5.67c 13.93a DEO3.33b 11.1b 0d Gentamycin9.26a NANA CiprofloxacinNA15.34a 9.37b SEM0.540.460.53 p-value<0.001<0.001<0.001
CEO 0.63b 2.5a 0.31b AjEO 0.31c 0.63c 0.08c DEO 2.5a 0.31d 0.63a Gentamycin0.63b NANA CiprofloxacinNA1.25b 0.02d SEM0.260.250.07
-value<0.001<0.001<0.001
p
terial growth are shown in Table 3. The AjEO showed lower MIC against E. coli (0.31 µL/mL) and S. gallinarum (0.08 µL/mL) in comparison to other EOs tested in this study. Our result confirmed the findings of Upadhyay et al.26, who reported the low MIC (0.13 µL/mL) of AjEO against E. coli, emphasizing AjEO can be a potent antimicrobial agent.
DEO showed better action against S. enteritidis than the others. The CEO showed 0.63 µL/mL MIC against E. coli. Our findings did not agree with some of the previous studies investigating antibacterial activity of CEO8,27: Delaquis et al.8 and Ozkinali et al.27 reported higher MIC of CEO (2.3 µL/mL and 50 µg/mL, respectively) against E. coli in comparison to our results. This can be related with the variation in chemical composition of CEO as Delaquis et al.8 and Ozkinali et al.27 reported 70% linalool and no geranyl acetate in their findings which in much different from current data.
The available data on antibacterial properties of CEO, AjEO and DEO is not always certain due to not only variable chemical compositions and analytical procedures, but also the variability in bacterial strains and concentration in cultures, affecting the MIC results. As per authors’ knowledge, there is a scarcity of data regarding antibacterial properties of these EOs against bacterial strains of poultry origin. Based on the ZOI and MIC results of this study, it would be conceivable that the AjEO might be an appropriate replacement for antibiotics in the chicken
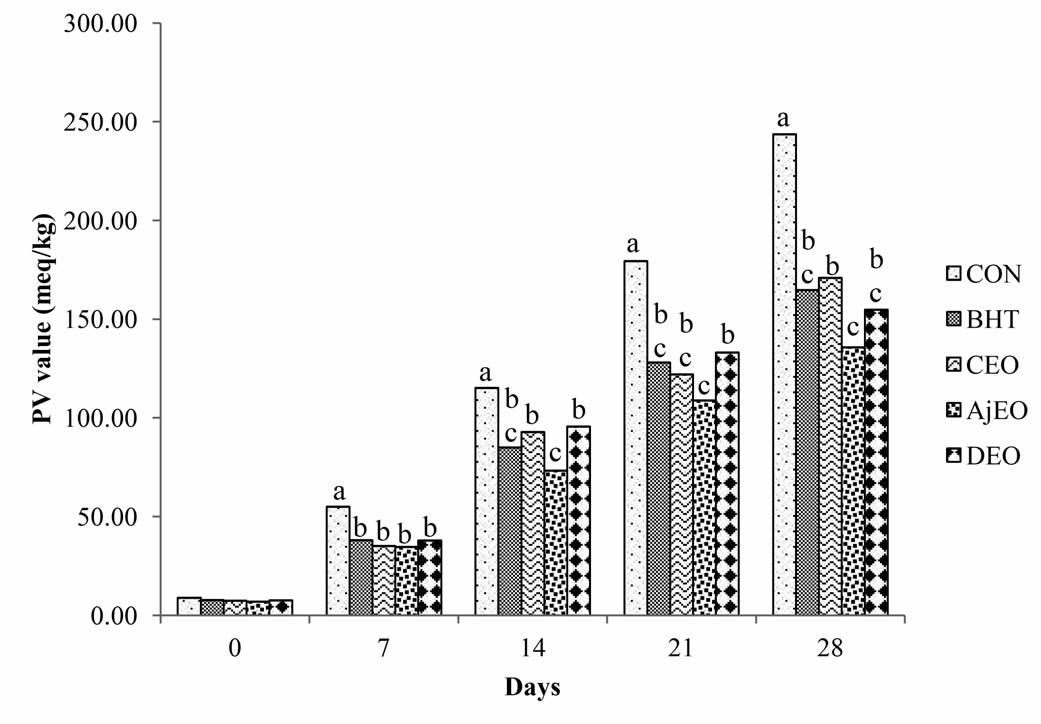
diets with less amount of supplementation than CEO and DEO.
3.3. Antioxidant activity
a. Peroxide value
Figure 1 demonstrates PV changes in rapeseed oil of all investigated samples at 80°C. Peroxide value is a widely known measure of the primary lipid oxidation, showing the number of peroxides formed in the fats and oils during oxidation. Rapeseed oil oxidation was measured at time intervals of 7 days during 28 days of storage. The oxidation status of all the samples was low in start and linearly increased with the storage duration, however, the extent of increase is variable due to additives. For 28 days storage period the PV of control rapeseed oil increased to 243.8 meq/Kg, whereas the oil supplemented with BHT, CEO, AjEO, and DEO showed 164.8, 170.9, 135.7, and 154.8 meq/Kg PV at concentration of 200 ppm, respectively. Our findings of reduction in PV with EOs supplementing supported the results from previous studies using different dietary oils12,13,17: briefly, the CEO reduced the PV of sunflower oil by 21%13, AjEO reduced the PV of linseed oil by 39.5%17, and DEO reduced the PV of rapeseed oil by 10.6%12. The present results showed that the BHT,
U. Ali et al. Large Animal Review 2023; 29: 27-3431
CEO, AjEO and DEO reduced the PV of rapeseed oil by 32.4, 29.8, 44.3, and 36.5%, respectively in comparison to control on day 28. In terms of retarding the formation of primary oxidation products, the effectiveness of the addi-
Figure 1 - Inhibitory effects on peroxide accumulation of coriander, ajwain and dill seed essential oils, and BHT in term of rapeseed oil at 80C ìCON=control; BHT=butylated hydroxytoluene; CEO=coriander essential oil; AjEO=ajwain essential oil; DEO=dill seed essential oil; p-value (0.52 for day 0; <0.001 for day 7; <0.001 for day 14; <0.001 for day 21; <0.001 for day 28); Significant differences (p ≤ 0.05) between means are indicated by different letters
day 28); Significant differences (p ≤ 0.05) between means are indicated by different
tives at concentration of 200 ppm can be put into the following order: AjEO>DEO>BHT>CEO. This performance of AjEO may be involved in the fact that the phenolic group in thymol has the greater radical trapping abilities28
b. Thiobarbituric acid value
Figure 2 shows the effects of three EOs and BHT on malonaldehyde formation in rapeseed oil at 80ºC measured using thiobarbituric acid value method in terms of incubation time versus TBA value. Note: Primary oxidation products are unstable compounds that produce several secondary products during the oxidation chain process, such as malonaldehyde and 2alkenals, which are measured by TBA method19. TBA value in rapeseed oil for control group linearly increased during period of 7 to 28 days, where more secondary products were formed from the primary oxidation products, peroxides, implying quick formation of malonaldehyde during the oxidation chain process. For 28 days storage period the TBA value of control rapeseed oil increased to 3.71 meq/kg, whereas the oil supplemented with BHT, CEO, AjEO, and DEO showed 2.57, 2.33, 1.89 and 2.61 meq/kg TBA values at concentration of 200 ppm, respectively.
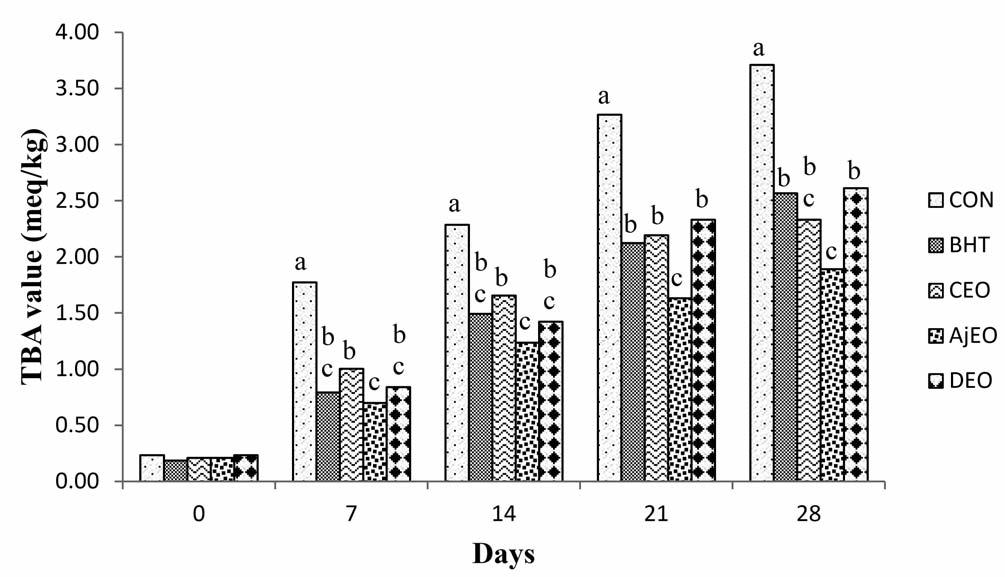
Our findings for EOs effects on TBA value agree with the results of some previous studies12,13,17. The CEO reduced the TBA value of sunflower oil by 37.5% during storage of 21 days13, AjEO reduced the TBA value of linseed oil by 24% for 28 days storage17, and DEO reduced the TBA value of rapeseed oil by 50% during the storage of 28 days at 80ºC12. The present results showed that inhibitory effects of BHT, CEO, AjEO and DEO on TBA value were 30.8, 37.1, 49.1, and 29.6%, respec-
tively in comparison to control. Therefore, the effectiveness of the additives at concentration of 200 ppm can be put into the following order: AjEO > CEO > BHT > DEO. Like PV, AjEO performed better than all other additives for TBA which can be related to the phenomenal antioxidant properties of thymol28 meaning that AjEO might work very well for retarding the formation of both primary and secondary oxidation products in comparison with other EOs.
c. DPPH free radical scavenging activity
Figure 3 shows the free radical scavenging activity of the EOs and BHT in a concentration range 5-25 µL/mL. Percentage DPPH radical scavenging activity of all EOs and BHT gradually increased with increasing the concentrations and was found to be the dose dependent. The AjEO showed highest radical scavenging potential out of all the three EOs and the activity is comparable to the BHT. These findings are in line with some previous studies16, who reported the higher antioxidant activity of AjEO than ascorbic acid and BHT, respectively. The antioxidant activity is mainly related to the phenolic components of EOs29. Thymol, the major component of AjEO, is phenolic in nature and a powerful scavenger of DPPH29, which support the findings of current study.
For CEO, in line to current findings some studies have reported the considerable radical scavenging activity in comparison to different standards10,30. Kacaniova et al.10 and Shahwar et al.30 reported the percentage DPPH radical scavenging activity of CEO as 51.1 and 66.5%, respectively. In accordance to our findings, DEO also showed significant DPPH radical scavenging activity in some studies12,19, though Kazemi21 reported it as weak-
32Implication of chemical compositions and in vitro properties of coriander, ajwain and dill seed essential oils
Figure 2 - Inhibitory effects of coriander, ajwain and dill seed essential oils, and BHT for rapeseed oil measured using thiobarbituric acid value method at 80C CON=control; BHT= butylated hydroxytoluene; CEO=coriander essential oil; AjEO=ajwain essential oil; DEO=dill seed essential oil; p-value (0.75 for day 0; <0.001 for day 7; <0.001 for day 14; <0.001 for day 21; <0.001 for
letters
CON=control; BHT= butylated hydroxytoluene; CEO=coriander essential oil; AjEO=ajwain essential oil; DEO=dill seed essential oil; p-value (<0.001 for 5 µL; <0.001 for 10 µL; <0.001 for 15 µL; <0.001 for 20 µL; 0.25 for 25µL); Significant differences (p ≤ 0.05) between means are indicated by different letters
er DPPH scavenger, which can be related to the contrasting chemical composition with no carvone in his study. All studies including ours demonstrating the free radical scavenging activity reported carvone as major bioactive compound with variable concentration between 41 to 74%12,19.
d. Oxidative stability index
Table 4 shows the effects of EOs and BHT incorporation on oxidative stability of rapeseed oil. This test measures the secondary and volatile products resulting from the oxidation of oils and fats by trapping in and increasing the conductivity of deionized water31. The control sample had the lowest IP (3.98 hr) and
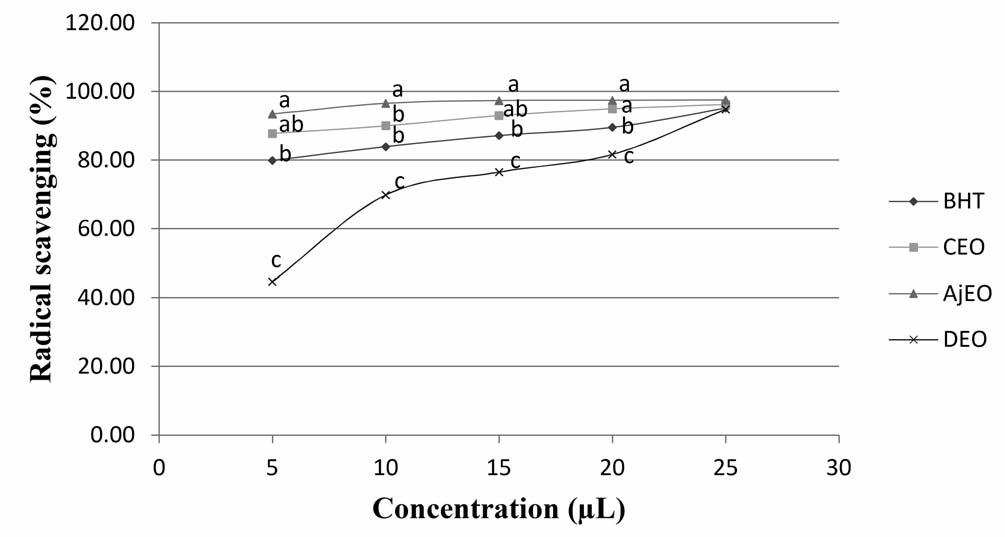
the CEO showed highest IP (5.1 hr). Ghazanfari et al.31 evaluated the oxidative stability of soybean oil by supplementing CEO, being effective (IP=5.20 hr) in comparison to control (IP=4.60 hr). As per authors’ knowledge, there is no Rancimat published data available regarding use of CEO, AjEO and DEO as oxidative stability agent in rapeseed oil. The present study provides the evidence that the OSI of all the tested additives at concentration of 200 ppm can be in the following order: CEO>BHT>AjEO>DEO.
4. CONCLUSIONS
Test materialIP (hr)
CON3.98c
It is concluded that the tested EOs have diverse phyto-constituents and shown potential antibacterial and antioxidant properties. The AjEO showed better antibacterial and antioxidant potential overall based on its major bioactive compound, thymol. It is a positive indication that these EOs can be included in broilers feed as replacement of AGPs and the antibiotic resistance issue may be addressed. They may support gut health of broilers with their antibacterial and antioxidant properties. Moreover, in vitrostudies are not enough to support this cause because during the in vivoconditions, the results are often contrasting. Therefore, in vivo studies are recommended to find out the exact effects of these EOs on broiler production.
Acknowledgement/Conflicts of interest
CON=control; BHT= butylated hydroxytoluene; CEO=coriander essential oil; AjEO=ajwain essential oil; DEO=dill seed essential oil; IP (hr): induction period in hours; Means with different superscript letters are significantly different (p ≤ 0.05) from each other; SEM=standard error of the mean
This research work was funded by Higher Education Commission, Pakistan under Indigenous 5000 PhD Fellowship Program (Mr. Usman Ali). All authors have no conflicts of interest.
U. Ali et al. Large Animal Review 2023; 29: 27-3433
p-value<0.001
BHT4.48b CEO5.1a AjEO4.29bc DEO4.13bc SEM0.11
Table 4 - Stability of rapeseed oil supplemented with coriander, ajwain and dill seed essential oils and BHT estimated by Rancimat at 120C.
Figure 3 - Radical scavenging effect of coriander, ajwain and dill seed essential oils, and BHT on DPPH radicals
34Implication of chemical compositions and in vitro properties of coriander, ajwain and dill seed essential oils
References
1. Evangelista A.G., Corrêa J.A.F., Pinto A.C.M.S., Luciano F.B. (2022). The impact of essential oils on antibiotic use in animal production regarding antimicrobial resistance-a review. Crit Rev Food Sci Nutr, 62 (19): 52675283.
2. Zeng Z., Zhang S., Wang H., Piao X. (2015). Essential oil and aromatic plants as feed additives in non-ruminant: a review. J Anim Sci Biotechnol, 6: 7.
3. Ali U., Naveed S., Qaisrani S.N., Mahmud A., Hayat Z., Abdullah M., Kikisato M., Toyomizu M. (2022). Characteristics of essential oils of Apiaceae family: their chemical compositions, in vitro properties and effects on broiler production. The J Poult Sci, 59: 16-37.
4. Aljumaah M.R., Alkhulaifi M.M., Abudabos A.M. (2020). In vitro antibacterial efficacy of non-antibiotic growth promoters in poultry industry. J Poult Sci, 57: 45-54.
5. Sugiharto S. (2016). Role of nutraceuticals in gut health and growth performance of poultry. J Saudi Soc Agric Sci, 15 (2): 99-111. doi: 10.1016/j.jssas.2014.06.001
6. Kikusato M. (2021). Phytobiotics to improve health and production of broiler chickens: functions beyond the antioxidant activity. Animal Bioscience, 34: 345-353.
7. Vitali L.A., Beghelli D., Nya P.C.B., Bistoni O., Cappellacci L., Lupidi G., Maggi F., Orsomando G., Papa F., Petrelli D., Petrelli R., Quassinti L., Sorci L., Zadeh M.M., Bramucci M. (2016). Diverse biological effects of the essential oil from Iranian Trachyspermum ammi. Arab J Chem, 9 (6): 775786.
8. Delaquis P.J., Stanich K., Girard B., Mazza G. (2002). Antimicrobial activity of individual and mixed fractions of dill, cilantro, coriander and eucalyptus essential oils. Int J Food Microbiol, 74: 101-109.
9. Ma B., Ban X., Huang B., He J., Tian J., Zeng H., Chen Y., Wang Y. (2015). Interference and mechanism of dill seed essential oil and contribution of carvone and limonene in preventing Sclerotinia rot of rapeseed. PloS One, 10 (7): e0131733.
10. Kačániová M.L., Galovičová E., Ivanišová N.L., Vukovic J., Štefániková V., Veronika V., Borotová P., Žiarovská J., Terentjeva M., Felšöciová S., Tvrdá E. (2020). Antioxidant, antimicrobial and antibiofilm activity of coriander (Coriandrum sativum L.) essential oil for its application in foods. Foods, 9 (3): 282
11. Yasmin S., Nawaz M., Anjum A.A., Ashraf A., Basra M.A.R., Mehmood A., Khan I., Malik F. (2019). Phytochemical analysis and In Vitro activity of essential oils of selected plants against Salmonella enteritidis and Salmonella gallinarum of poultry origin. Pak Vet J, 40 (2): 139-144.
12. Singh G., Maurya S., De Lampasona M., Catalan C. (2005). Chemical constituents, antimicrobial investigations, and antioxidative potentials of Anethum graveolens L. essential oil and acetone extract: Part 52. J Food Sci, 70 (4): 208-215.
13. Singh G., Maurya S., De Lampasona M., Catalan C.A. (2006). Studies on essential oils, Part 41. Chemical composition, antifungal, antioxidant and sprout suppressant activities of coriander (Coriandrum sativum) essential oil and its oleoresin. Flavour Fragr J, 21 (3): 472-479.
14. Singh G., Kapoor I.P.S., Singh P., de Heluani C.S., de Lampasona M.P., Catalan C.A.N. (2008). Chemistry, antioxidant and antimicrobial investigations on essential oil and oleoresins of Zingiber officinale. Food Chem Toxicol, 46 (10): 3295-3302.
15. Cordeiro A.M.T.M., Medeiros M.L., Silva M.A.A.D., Silva I.A.A., Soledade L.E.B., Souza A.L., Queiroz N., Souza A.G. (2013). Rancimat and PDSC
accelerated techniques for evaluation of oxidative stability of soybean oil with plant extracts. J Therm Anal Calorim, 114 (2): 827-832.
16. Patil S.D., Maknikar P.P., Wankhade S.J., Ukesh S.C., Rai M.K. (2016). Chemical composition, antimicrobial and antioxidant activity of essential oils from cumin and ajowan. Nus Biosci, 8 (1): 60-65.
17. Singh G., Maurya S., Catalan C., De Lampasona M. (2004). Chemical constituents, antifungal and antioxidative effects of ajwain essential oil and its acetone extract. J Agric Food Chem, 52 (11): 3292-3296.
18. Grdinaru A., Trifan A., Şpac A., Brebu M., Miron A., Aprotosoaie A.C. (2018). Antibacterial activity of traditional spices against lower respiratory tract pathogens: combinatorial effects of Trachyspermum ammi essential oil with conventional antibiotics. Lett Appl Microbiol, 67 (5): 449457.
19. Singh S., Das S., Singh G., Perroti M., Schuff C., Catalan C.A. (2017). Comparative studies of chemical composition, antioxidant and antimicrobial potentials of essential oils and oleoresins obtained from seeds and leaves of Anethum graveolens L. Toxicol Open Access, 3 (1): 2-9.
20. Yili A., Aisa H., Maksimov V., Veshkurova O., Salikhov S.I. (2009). Chemical composition and antimicrobial activity of essential oil from seeds of Anethum graveolens growing in Uzbekistan. Chem Nat Compd, 45 (2): 280-281.
21. Kazemi M. (2015). Chemical composition and antimicrobial, antioxidant activities and anti-inflammatory potential of Achillea millefolium L., Anethum graveolens L., and Carum copticum L. essential oils. J Herb Med, 5 (4): 217-222.
22. Dorman H.J.D., Deans S.G. (2000). Antimicrobial agents from plants: antibacterial activity of plant volatile oils. J Appl Microbiol, 88 (2): 308-316.
23. Yang T.S., Chao L.K.P., Liu T.T. (2014). Antimicrobial activity of the essential oil of Glossogyne tenuifolia against selected pathogens. J Sci Food Agric, 94: 2965-2971.
24. Oliveira R.S., Fontaine V., Mathieu V., Zhiri A., Baudoux D., Stevigny C., Souard F. (2020). Antibacterial and cytotoxic activities of ten commercially available essential oils. Antibiotics, 9 (10): 717.
25. Abd El-Baky R.M., Hashem Z.S. (2016). Eugenol and linalool: Comparison of their antibacterial and antifungal activities. Afr J Microbiol Res, 10 (44):1860-1873.
26. Upadhyay R.K., Dwivedi P., Ahmad S. (2010). Screening of antibacterial activity of six plant essential oils against pathogenic bacterial strains. Asian J Med Sci, 2 (3): 152-158.
27. Özkinali S., ener N., Gür M., Güney K., Olgun Ç. (2017). Antimicrobial activity and chemical composition of coriander & galangal essential oil. Indian J Pharm Educ Res, 51: 221-223.
28. Yanishlieva N.V., Marinova E.M., Gordon M.H., Ravena V.G. (1999). Antioxidant activity and mechanism of action of thymol and carvacrol in two lipid systems. Food Chem, 64 (1): 59-66.
29. Ozdemir N., Ozgen Y., Kiralan M., Bayrak A., Arslan N., Ramadan M.F. (2018). Effect of different drying methods on the essential oil yield, composition and antioxidant activity of Origanum vulgare L. and Origanum onites L. J Food Meas Charact, 12 (2): 820-825.
30. Shahwar M.K., El-Ghorab A.H., Anjum F.M., Butt M.S., Hussain S., Nadeem M. (2012). Characterization of coriander (Coriandrum sativum L.) seeds and leaves: volatile and non-volatile extracts. Int J Food Prop, 15 (4): 736-747.
31. Ghazanfari N., Mortazavi S., Yazdi F.T., Mohammadi M. (2020). Microwave-assisted hydrodistillation extraction of essential oil from coriander seeds and evaluation of their composition, antioxidant and antimicrobial activity. Heliyon, 6 (9): e0489.
38Congenital heart defects in cattle
Prospective studies are lacking in the literature to evaluate the prognosis in calves with VSD. No prognostic factors have been identified to determine the outcome of calves affected by VSD: Buczinski et al. reported a poor prognosis in many affected animals in their retrospective study but failed to define prognostic factors useful in assessing the evolution of the disease4. It should be underlined that even if adult cattle with small defects have normal reproductive and productive performances, they can be predisposed to complications, such as bacterial endocarditis19, 20. Finally, owing to the likely genetic implications in the development of CHD3, the potential disadvantages of breeding cattle with CHD should always be discussed with the farmer.
Atrial septal defects
Atrial septal defects (ASD) are persistent communications between the left and right atrium. These congenital anomalies are rarely observed as single defect, whereas they are most commonly detected as part of complex CHD6, 8, 13, 16. ASD can be classified into ostium primum ASD (located in the ventral interatrial septum above the tricuspid valve), ostium secundum ASD (located in the area of the fossa ovalis) and sinus venosus ASD (located near the cranial and caudal vena caval inflow) 6, 8, 13, 16. Patent foramen ovale (PFO) is characterized by unfused flap of tissue covering the foramen ovale and it is not considered as a real ASD. Ostium secundum defects can have a typical “fish-net” appearance, characterized by the presence of multiple coalescing small defects associated or not to a larger one (Figure 2).
ASD cause left-to-right shunt predominantly during the end-systole, when pressure gradient between the atria is higher, increasing pulmonary blood flow. In moderate to large ASD, volume overload of the right heart results in the right atrial and ventricular enlargement, and pulmonary overcirculation13, 16
Clinical signs in small and isolated ASD can be irrelevant (no clinical signs, no murmur). Large ASD can lead to right-sided volume overload and pulmonary overcirculation with potentially clinical signs of left-sided congestive heart failure13, 16. Volume overload of the right heart and increase of pulmonary blood flow can generate a “relative pulmonary stenosis” murmur at the left heart base. Concurrent cause of high right atrial pressures (e.g., pulmonary outflow obstruction or pulmonary hypertension) can result in
right-to-left shunt with clinical symptoms, such as intolerance to movement and central cyanosis13, 16 .
Echocardiographic examination allows the visualization of the abnormal communication and evaluation of the flow through the defect (Figure 2). Small ASD cannot be easily detect by Doppler studies because of overlapping physiological flows from pulmonary or caval veins5. Saline contrast study (microbubbles obtained by mixing saline solution and air) can provide additional information and confirm the shunt5
Calves with small and isolated ASD can have a favorable prognosis; this anomaly can be detected incidentally at necroscopy, although prospective studies are not available in the literature. On the other hand, the prognosis for large defects or ASD associated with complex CHD should be considered guarded.
Patent ductus arteriosus
Patent ductus arteriosus (PDA) is a congenital anomaly that is mostly associated with other and more complex CHD in calves. The ductus arteriosus is an arterial connection between main pulmonary artery and descending aorta that permits shunting of blood in the fetus21. This ductus closes at birth or in the first days after the delivery5, 21. When this communication fails to close, a left-toright shunt from the aorta to the pulmonary artery occurs, resulting in volume overload of the pulmonary circulation and left heart chambers22-27. The clinical signs depend on the magnitude of the shunt, which in turn is dependent on the size of the PDA and the pressure gradient between the aorta and pulmonary artery22-27. In very large PDA, volume and pressure overload can result in pulmonary hypertension with right-to-left shunt flow if pulmonary vascular resistance exceeds systemic vascular resistance (Eisenmenger’s syndrome).
Physical examination findings include a continuous “machinery” heart murmur and thrill, usually loudest at the left base of the heart (craniodorsally to the aortic valve area - left axillary area)22-27. Moreover, it is possible to detect “bounding” arterial pulses characterized by rapid increase of the systolic pressure (due to volume overload) and rapid decrease of diastolic pressure (due to shunting through the PDA). Signs of congestive heart failure and poor weight gain have also been reported22-27. Volume overload can also lead to left congestive heart failure (tachypnea/dyspnea for pul-
Figure 3 - Echocardiographic and gross findings in two calves affected by patent ductus arteriosus. (A) Color Doppler image recorded from a modified left cranial parasternal view, showing left-to-right turbulent flow within the pulmonary artery (PA); (B) gross appearance of an opened patent ductus arteriosus (PDA). PA, pulmonary artery; AO, aorta; RV, right ventricle; LV, left ventricle; LA, left atrial auricle.
monary edema)22-27. When right-to-left shunt flow occurs, heart murmur disappears and differential cyanosis could be evident (genital mucous membranes are cyanotic, whereas head mucous membranes are normal). Some of affected calves could show hind limb weakness, especially after exercise. Rarely, aneurysm of the PDA can occur with clinical, radiological and ultrasonographic findings suggestive of a mass in the cranioventral mediastinum27 Echocardiography allows the visualization of the PDA and the estimation of left ventricular volume overload using various echocardiographic indices5. The Doppler studies allow to visualize the flow through the PDA into the pulmonary artery (Figure 3) and measure its velocity5. A low velocity (< 4.5-5 m/sec) can be considered prognostically unfavorable because it is due to an increase of the pulmonary pressures or reduce of the systemic pressure secondary to severe left ventricular systolic dysfunction. Prospective studies are not available in the literature for calves affected by PDA; however, prognosis is guarded to poor in several case reports22-27. Thromboembolic arteritis caused by a chronic thromboarteritis of PDA has been reported in an adult cow with normal reproductive and productive performances26
CYANOGENIC CONGENITAL HEART DEFECTS
Abnormal ventriculoarterial connections are complex CHD reported in humans and domestic animals28-37. In cattle, these anomalies can present a wide spectrum of anatomic abnormalities including malposition or malformation of great vessels that can arise from the wrong ventricle. Some of these complex CHD are tetralogy of Fallot, transposition of the great vessels, double-outlet right ventricle. Less frequent malformations are those in which the great arteries emerge from the base of the heart as a common trunk (single common arterial trunk), or pulmonary artery is absent and only the aorta is identified (solitary arterial trunk)38-40
Tetralogy of Fallot
Tetralogy of Fallot (ToF) is a complex CHD characterized by VSD,
overriding (dextroposition) of the aorta and right ventricular outflow tract obstruction (usually hypoplasia of the valvular annulus and main pulmonary artery) inducing adaptive right ventricular hypertrophy. If ToF is combined with ASD or PDA, these abnormalities is named pentalogy of Fallot. ToF is a well-documented complex CHD responsible for right-to-left shunting, arterial desaturation, and cyanosis in calves 41-46
Right-to-left shunt through VSD is due to the high right intraventricular pressure secondary to pulmonary stenosis. The degree of cyanosis and severity of clinical signs depend on the volume of blood traversing the lungs. ToF with severe right ventricular outflow tract obstruction is characterized by high pressures in the right ventricle, large amount of blood flow through the aorta and VSD, and central cyanosis. Mild right ventricular outflow tract obstruction associated with a small VSD characterize forms of tetralogy of Fallot without cyanosis or with cyanosis that only appears after exercise (termed «pink» tetralogy of Fallot).
Calves affected by more severe forms show poor weight gain/failure to thrive, lethargy, central cyanosis, dyspnea and intolerance to movement41, 42, 45, 46. Erythrocytosis, metabolic acidosis (poor tissue oxygenation) and dehydration can also be detected. A loud systolic ejection murmur over the pulmonic valve area due to pulmonic stenosis can be heard41, 42, 45, 46. Echocardiographic examination reveals the typical abnormalities of ToF: hypertrophy of the right ventricular free wall, VSD, dextroposition of the aorta, and hypoplasia of the pulmonary valve and main pulmonary artery41, 42, 45, 46 (Figure 4). The Doppler studies allow to detect the shunt through VSD and high-velocity flow through the pulmonary valve41, 42, 45, 46
The prognosis in calves with ToF is guarded to poor, as described in the literature41-43. It is possible for affected calves to live for months or years43-46.
Complete transposition of great arteries
Complete transposition of the great arteries (TGA) is a complex cardiac anomaly characterized by atrioventricular concordance and ventriculoarterial discordance: the atria are normally connected
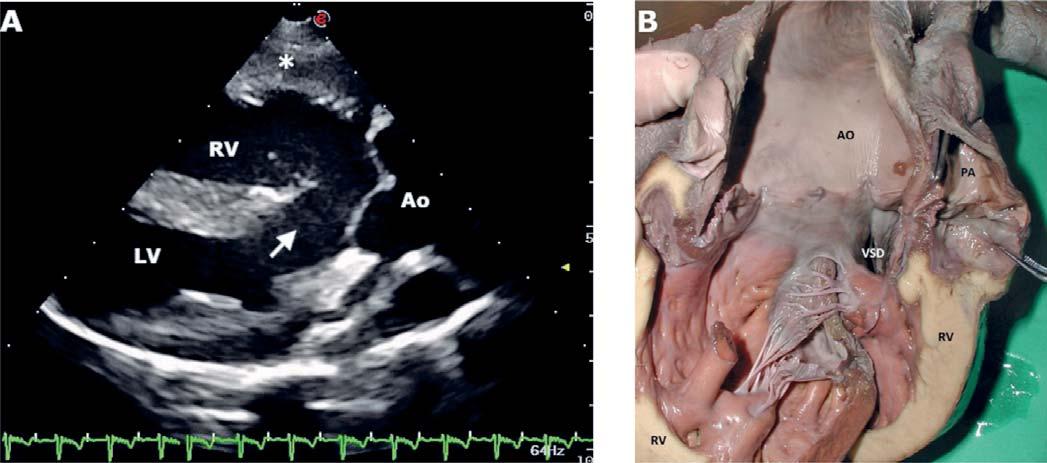
D. Caivano et al. Large Animal Review 2023; 29: 35-4539
Figure 4 - Echocardiographic and gross findings in a calf affected by tetralogy of Fallot. (A) Right parasternal long axis view of the left ventricular outflow tract showing large ventricular septal defect, dextrally located aorta (Ao), enlarged right ventricle (RV) and thickened right ventricular free wall (*); (B) right ventricular view with enlarged aorta (AO) overriding a large interventricular septal defect (VSD), smaller pulmonary ostium and artery (PA) and thickened right ventricular free wall (RV).
indicates turbulent
(C)
with aorta (AO)
with their respective ventricles, whereas the pulmonary artery arises from the left ventricle and the aorta from the right ventricle. This occurs due to absence of the normal 180° rotation of the great arteries during embryonic development47. Consequently, as the pulmonary and systemic circulation are independent and parallel, oxygenated blood from the lungs cannot reach the systemic circulation. Therefore, this abnormality should be incompatible with life without associated communications between the pulmonary and systemic circulation that allow mixing of oxygenated and nonoxygenated blood (e.g., VSD, ASD or PDA)48, 49. Clinical signs are characterized by poor weight gain/failure to thrive, exercise intolerance, central cyanosis (especially after exercise) and tachypnea/dyspnea, as a consequence of reduced amount of oxygenated blood reaching the tissues and its mixing with non-oxygenated blood48, 49. A typical heart murmur due to VSD or PDA can be heard in the affected calves48, 49
from
(RV)
Echocardiographic examination can detect the abnormal communication (VSD, ASD or PDA), as well as identify the pulmonary artery and its branches that arise from the left ventricle whereas the aorta leaves the right ventricle48, 49 (Figure 5). The Doppler studies can confirm the presence and the direction of shunting through the abnormal communication (typically bidirectional)48, 49 .
The prognosis in calves is poor for this type of CHD48-51. Calves with small communication between the pulmonary and systemic circulation die soon after birth50
Double-outlet right ventricle
Double-outlet right ventricle (DORV) is a complex CHD characterized by ventriculoarterial discordance, as already seen for TGA. Unlike the latter, both the aorta and the pulmonary artery arise from the right ventricle. This cardiac abnormality has been de-
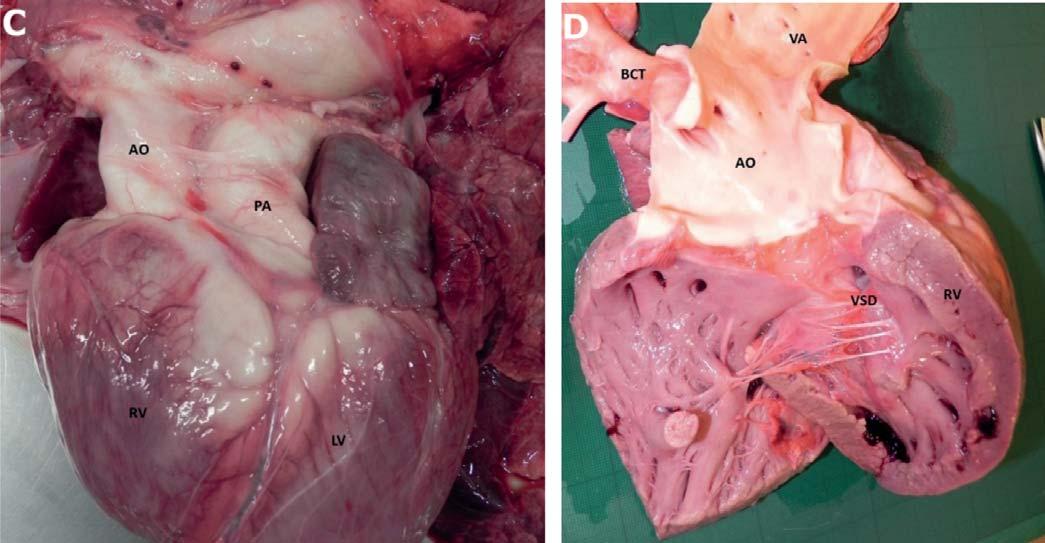
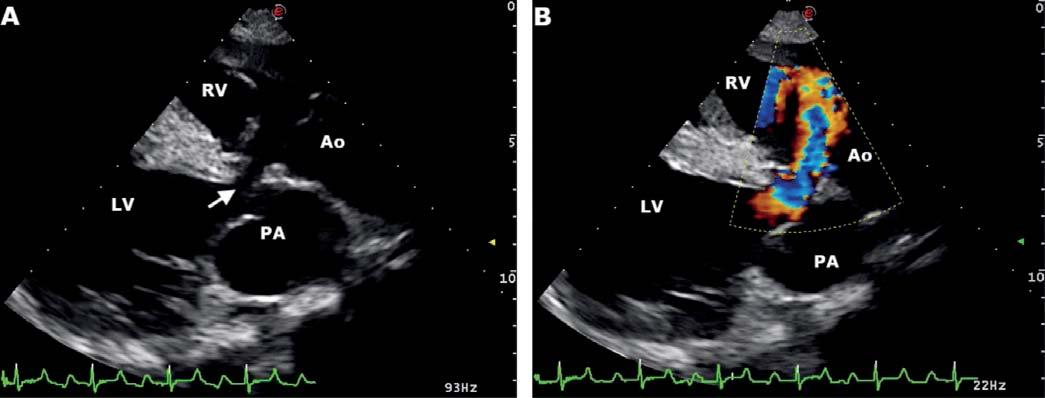
40Congenital heart defects in cattle
Figure 5 - Echocardiographic and gross findings in a calf affected by complete transposition of the great arteries. (A) Right parasternal long axis view of the left ventricular outflow tract displaying a ventricular septal defect (arrow) and the great vessels (Ao - aorta and PA - pulmonary artery) arising from ventricles in parallel alignment (anomaly of the right ventricular outlet position); (B) colour flow mapping
flow across the defect;
external view
arising
right ventricle
whereas pulmonary artery (PA) overrides left ventricle (LV); (D) right ventricular (RV) view with aorta (AO) overriding a ventricular septal defect (VSD). BCT, brachiocephalic trunk; VA, vertebral arteries.
scribed in Chianina, Angus, Brangus, Herford and Friesian calves52-57
As for TGA, this abnormality is incompatible with life without associated communications between the pulmonary and systemic circulation that allow mixing of oxygenated and non-oxygenated blood (e.g., VSD, ASD or PDA). Clinical signs are characterized by failure to thrive, intolerance to movement, central cyanosis (especially after exercise) and tachypnea/dyspnea53, 55-57. A systolic, plateau shaped, heart murmur with PMI over the tricuspid area (valvular insufficiency secondary to dilation of the right ventricle) and/or a murmur due to VSD or PDA, can be heard53, 55-57 Echocardiographic examination allows identification of both great arteries originating from the right ventricle in anomalous parallel alignment with the tricuspid valve; usually, severe dilation of the right-sided cardiac chambers with a hypoplastic left ventricle
Figure
Echocardiographic and gross findings in a calf affected by double-outlet right ventricle. (A) Left cranial parasternal, long-axis, oblique view showing aorta (Ao) and pulmonary artery (PA) leaving the right ventricle (RV) in parallel alignment with the tricuspid valve (TV); (B) saline contrast study showing microbubbles leaving RV via Ao and PA simultaneously. Because of tricuspid regurgitation the microbubbles can be seen also in the right atrium (RA); (C) right ventricular view showing a very enlarged right atrium (RA) and two probes, the red inserted into the aorta (AO) and the blue inserted into pulmonary artery (PA), that both open into the right ventricle (RV) whose free wall (RVFW) is thickened.
is detected57. Moreover, abnormal communications as VSD, ASD or PDA can be visualized. The Doppler studies and saline contrast study can identify the presence and direction of shunting through the abnormal communication. Microbubbles can be noted leaving the right ventricle via aorta and pulmonary artery simultaneously (Figure 6). The prognosis for calves affected by DORV is poor52-57.
RARE CONGENITAL HEART DEFECTS
Malformations of atrioventricular valves
The malformations of the atrioventricular valves are rarely described in cattle58-61. The valves can be dysplastic and partially or completely imperforate (atresic); the leaflets can be thickened, fenestrated, fused or cystic; the chordae tendineae can be altered in size, length, position or orientation21, 58-61. These anomalies are frequently detected as part of complex CHD.
A severe form of malformation of the atrioventricular valves is the atrioventricular septal defect (also known as endocardial cushion defect). It is a complex CHD due to maldevelopment of the atrioventricular junction and valves (atrioventricular septum), originating from the endocardial cushions. In humans, the atrioventricular septal defect can be complete, partial, intermediate and transitional, according to the location of ASD/VSD and the morphology of atrioventricular valves (number of orifices and site of insertion of chordae tendineae)62. The complete or partial form of this CHD has been more frequently described in veterinary medicine63-65: the complete form shows an abnormal communication between all four cardiac chambers (ostium primum ASD, large VSD and common atrioventricular valve with single orifice); the partial form is characterized by only ostium primum ASD or only VSD with discrete orifices of the atrioventricular valve annuli. In both
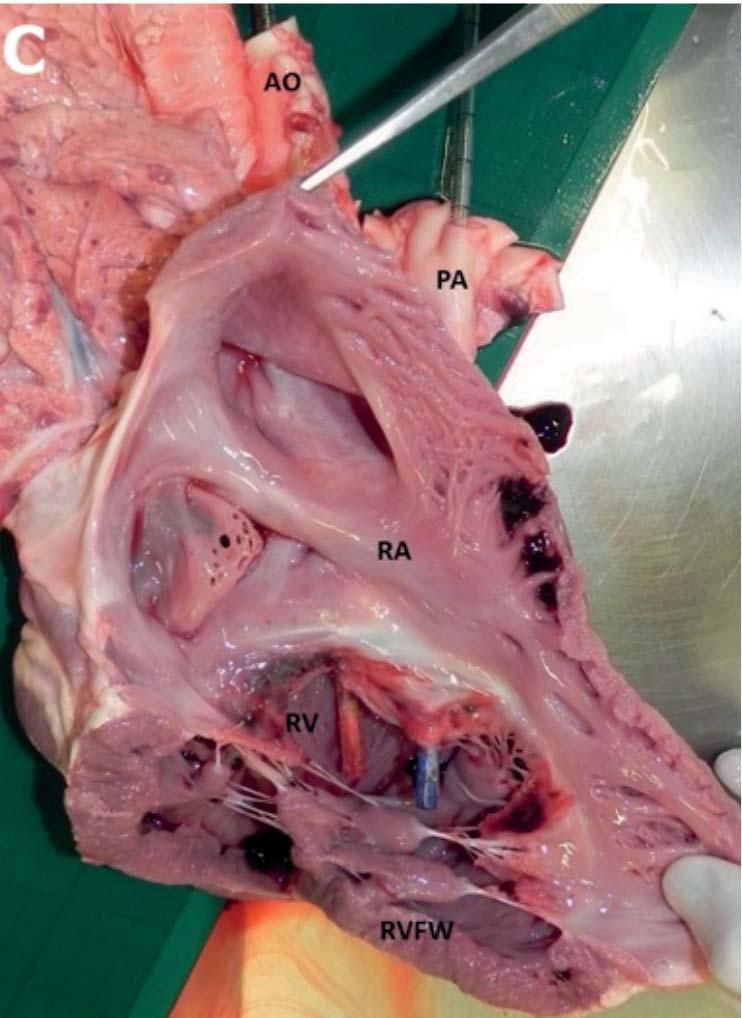
D. Caivano et al. Large Animal Review 2023; 29: 35-4541
6 -
forms, the anomalous morphology of the atrioventricular valves can result in variable degrees of regurgitation. The atrioventricular septal defect has been rarely described in cattle21, 49 Clinical signs can be variable as a consequence of the size of ASD/VSD and the amount of shunting. Calves with atrioventricular septal defect will be hemodynamically similar to one with a large VSD. Affected calves show tachypnea/dyspnea due to pulmonary volume overload and systolic heart murmurs (VSD and relative pulmonary stenosis)49
Echocardiographic examination allows the visualization of the ASD adjacent to the atrioventricular valves and VSD below the atrioventricular valves as well as abnormal morphology of the atrioventricular valves (abnormalities of the atrioventricular septum)49 (Figure 7). Doppler studies can identify the presence and direction of shunting through the abnormal communications49. Prognosis reported in calves affected by atrioventricular septal defect is poor21, 49
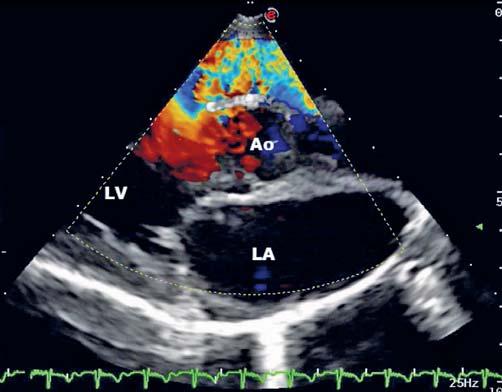
Outflow tract obstructions
The right or left outflow tract obstructions can be located in the subvalvular, valvular, or supravalvular regions66-68: subvalvular forms can result from shelves of fibromuscolar tissue; valvular forms can occur for hypoplasia/dysplasia of the valves (fusion, tethering or thickening of the leaflets); supravalvular forms can result from hypoplasia/restriction of the pulmonary artery or aorta. Severe forms of these congenital anomalies are represented by the atresia of the semilunar valves66-68
Outflow tract obstructions result in concentric hypertrophy of the respective ventricle, dynamic obstruction of the outflow tract, and subsequent eccentric dilation with atrioventricular valve regurgitation due to dilation of the right ventricle. To the authors’ knowledge, isolated left or right outflow tract obstructions have not been reported in calves but can be detected in combination with other complex CHD, such as tetralogy of Fallot41-43, 45, 46 .
A systolic ejection heart murmur is usually evident over the left base. Other clinical signs depend on the type of associated complex CHD41-43, 45, 46 .
Echocardiographic examination allows the evaluation of the ven-
tricular outflow tracts, valvular morphology and motion, associated ventricular changes (hypertrophy or dilation)5. The Doppler studies can identify blood flow turbulence (Figure 8) and measure the velocity of the blood flow to estimate the stenosis (flow velocity > 2 m/sec can indicate stenosis) 5. Color Doppler studies can also detect regurgitation of the atrioventricular valves5. Prognosis in calves affected by outflow tract obstruction is related to the associated complex CHD.
Anomalies of great arterial and venous vessels connected to the heart
Congenital defects affecting the aortic arch (hypoplasia), caval veins (persistent left cranial vena cava), pulmonary venous vessels or coronary arteries have rarely been described in cattle21,49. These abnormalities have mainly been observed during postmortem examinations21,49
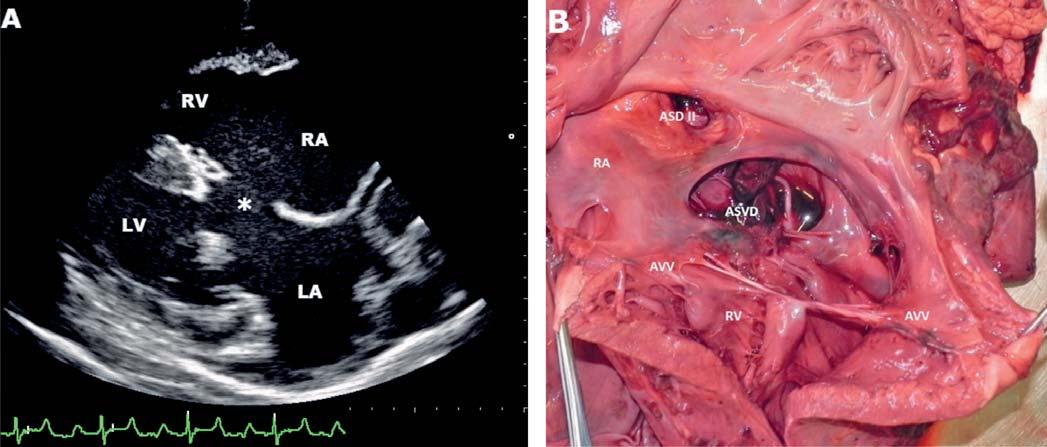
42Congenital heart defects in cattle
Figure 7 - Echocardiographic and gross findings in a calf affected by atrioventricular septal defect. (A) Right parasternal long axis four chamber view with opened atrioventricular valves showing an evident anomaly (*) occurring at the site of the atrioventricular septum; (B) right ventricular (RV) view showing large atrioventricular septal defect (AVSD) with enlarged right atrium (RA) and a common atrioventricular valve (AVV). LV, left ventricle; LA, left atrium; ASD II, atrial septal defect.
Figure 8 - Echocardiographic findings in a calf affected by pentalogy of Fallot. (A) Right parasternal long axis view optimized to visualize aorta (Ao) and pulmonary artery showing turbulent flow in the hypoplastic pulmonary artery. LV, left ventricle; LA, left atrium.
Figure 9 - Algorithm showing the history and clinical signs in the most common congenital heart defects. +/-, with or without; ASD, atrial septal defect; VSD, ventricular septal defect; PDA, patent ductus arteriosus; ToF, tetralogy of Fallot; TGA, complete transposition of great arteries; E.S., Eisenmenger’s syndrome; DORV, double-outlet right ventricle.
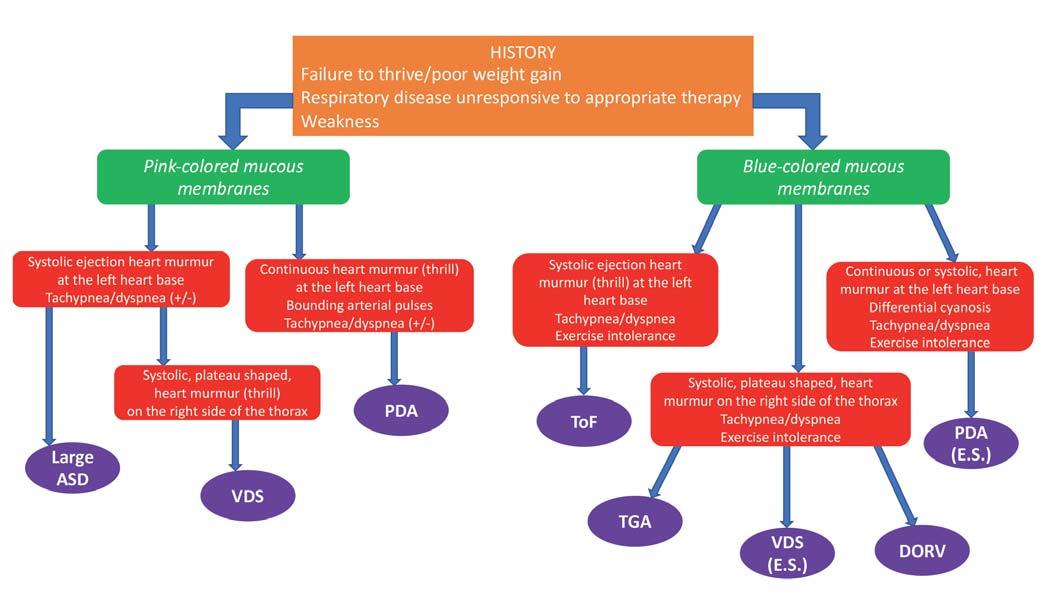
CONCLUSIONS
CHD represent a small part of congenital diseases in cattle; however, these defects can occur with a wide spectrum and complexity. History and physical examination can be useful to suspect the presence of CHD: failure to thrive, poor weight gain, respiratory disease unresponsive to appropriate therapy, weakness, cyanotic mucous membranes, intolerance to movement and heart murmur are reported in calves affected by CHD (Figure 9). The echocardiography represents the most sensitive and specific diagnostic test to obtain a definite diagnosis. Moreover, this diagnostic tool is readily available and can be performed in veterinary hospitals as well as in farms. Because of complexity of some CHD, evaluation of affected cattle should be performed in consultation with a specialist in veterinary cardiology. A precise diagnosis can be useful in cases with isolated defects, which can be associated with a favorable prognosis; likewise, it can be important an accurate and early diagnosis in cases with severe and complex malformations, often associated with a poor prognosis for long-term productivity and survival. This is of primary importance in order to avoid unnecessary treatments or animal suffering.
Acknowledgments
No third-party funding or support was received in connection with this study or the writing or publication of the manuscript.
Conflict of Interest
The authors declare that there were no conflicts of interest.
References
1.Zhang J., Ko J.M., Guileyardo J.M., Roberts W.C. (2015). A review of spontaneous closure of ventricular septal defect. Proc (Bayl Univ Med Cent), 28: 516-520. doi: 10.1080/08998280.2015.11929329.
2.Short D.M., Seco O.M., Jesty S.A., Reef V.B. (2010). Spontaneous closure of a ventricular septal defect in a horse. J Vet Intern Med, 24: 1515.doi.org/10.1111/j.1939-1676.2010.0589.x
3.Buczinski S., Rezakhani A., Boerboom D. (2010). Heart disease in cattle: Diagnosis, therapeutic approaches and prognosis. Vet J, 184: 258-263. doi: 10.1016/j.tvjl.2009.05.005.
4.Buczinski S., Fecteau G., DiFruscia R. (2006). Ventricular septal defects in cattle: A retrospective study of 25 cases. Can Vet J, 47: 246-252.
5.Mitchell K.J., Schwarzwald C.C. (2016). Echocardiography for the Assessment of Congenital Heart Defects in Calves. Vet Clin N Am Food Anim Pract, 32: 37-54. doi: 10.1016/j.cvfa.2015.09.002.
6.van Nie C.J. (1966). Congenital malformations of the heart in cattle and swine. A survey of a collection. Acta Morphol Neerl Scand, 6: 387-393.
7.Kemler A.G., Martin J.E. (1972). Incidence of congenital cardiac defects in bovine fetuses. Am J Vet Res, 33: 249-251.
8.Leipold H.W., Dennis S.M., Huston K. (1972). Congenital defects of cattle: nature, cause, and effect. Adv Vet Sci Comp Med, 16: 103-150.
9.Hagio M., Murakami T., Tateyama S., Otsuka H., Hamana K., Shimobepu I. (1985). Congenital heart in disease in cattle. Bull Fac Agric Miyazaki Univ, 32: 233-349.
10.Blue G.M., Kirk E.P., Sholler G.F., Harvey R.P., Winlaw D.S. (2012). Congenital heart disease: current knowledge about causes and inheritance. Med J Aust, 197: 155-159. doi: 10.5694/mja12.10811.
11.Belling T.H. (1962). Genetic effect of cardiac ventricular septal defect in Hereford cattle. Vet Med, 57: 965-968.
12.Belling T.H. (1962). Ventricular septal defect in the bovine heart. A report of three cases. J Am Vet Med Assoc,138: 595-598.
13.Gopal T., Leipold H.W., Dennis S.M. (1986). Congenital cardiac defects in calves. Am J Vet Res, 47: 1120-1121.
D. Caivano et al. Large Animal Review 2023; 29: 35-4543
44Congenital heart defects in cattle
14.Penrith M.L., Bastianello S.S., Petzer I.M. (1994). Congenital cardiac defects in two closely related Jersey calves. J S Afr Vet Assoc, 65: 31-35.
15.Jacinto J.G.P., Häfliger I.M., Caivano D., Drögemüller C. (2022). A germline de novo variant in NUMB associated with a double-outlet right ventricle in Chianina cattle. Anim Genet, 53: 713-714. doi: 10.1111/age.13236.
16.Ohwada K., Murakami T. (2000). Morphologies of 469 cases of congenital heart diseases in cattle. J Jap Vet Med Assoc, 53: 205-209. doi.org/10.12935/jvma1951.53.205.
17.Cordy D.R., Ribelin W.E. (1950). Six congenital cardiac anomalies in animals. Cornell Vet, 40: 249-256.
18.Pipers F.S., Reef V.B., Wilson J. (1985). Echocardiographic detection of ventricular septal defects in large animals. J Am Vet Med Assoc, 187: 810816.
19.Sherwin V., Baiker K., Wapenaar W. (2015). Consequences of endocarditis in an adult cow with a ventricular septal defect. Vet Rec Case Rep 3: e000234. doi: 10.1136/vetreccr-2015-000234.
20.Caivano D., Marchesi M.C., Boni P., Passamonti F., Venanzi N., Lepri E. (2021). Mural Endocarditis and Embolic Pneumonia Due to Trueperella pyogenes in an Adult Cow with Ventricular Septal Defect. Vet Sci, 8: 318. doi: 10.3390/vetsci8120318.
21.Michaelsson M., Ho S.Y. (2000). Congenital heart malformations in mammals. London: Imperial College Press, 2000.
22.Sandusky G.E., Smith C.W. (1981). Congenital cardiac anomalies in calves. Vet Rec, 108: 163-165. doi: 10.1136/vr.108.8.163.
23.West H.J. (1988). Congenital anomalies of the bovine heart. Br Vet J, 144: 123-130.
24.Horton E.W., Crea P.R., Perry M.D. (1989). Two cases of persistent patent ductus arteriosus in calves. Vet Rec, 125: 354.
25.Prescott J.R.R., Slater J.D., Jackson P.G.G. (1997). Patent ductus arteriosus in an 11-month-old heifer. Vet Rec, 140: 430-431.
26.Löhr C.V., Teifke J.P., Trunk A., Kumper H. (1997). Thromboarteritis of a patent ductus arteriosus and pulmonary artery in a four-year-old cow. Vet Rec,141: 151-152. doi: 10.1136/vr.141.6.151.
27.Pravettoni D., Re M., Riccaboni P., Di Giancamillo M., Zanardelli M.C., Belloli A.G. (2005). Aneurysm of the ductus arteriosus in a heifer. Vet Rec, 156: 783-785. doi: 10.1136/vr.156.24.783
28.Chaffin M.K., Miller M.W., Morris E.L. (1992). Double outlet right ventricle and other associated congenital cardiac anomalies in an 255 American miniature horse foal. Equine Vet J, 24: 402-406. doi.org/10.1111/j.2042-3306.1992.tb02865.x
29.Stieger-Vanegas S.M., Scollan K.F., Meadows L., Sisson D., Schlipf J., Riebold T., Löhr C.V. (2016). Cardiac-gated computed tomography angiography in three alpacas with complex congenital heart disease. J Vet Cardiol, 18: 88-98. doi: 10.1016/j.jvc.2019.11.004.
30.Obler D., Juraszek A.L., Smoot L.B., Natowicz M.R. (2008). Double outlet right ventricle: aetiologies and associations. J Med Genet, 45: 481-497. doi: 10.1136/jmg.2008.057984.
31.Cetta F., Boston U.S., Dearani J.A., Hagler D.J. (2005). Double outlet right ventricle: opinions regarding management. Curr Treat Options Cardiovasc Med, 7: 385-390. doi: 10.1007/s11936-005-0022-2.
32.Mair D.D., Ritter D.G., Ongley P.A., Helmoholz H.F. (1971). Hemodynamics and evaluation for surgery of patients with complete transposition of the great arteries and ventricular septal defect. Am J Cardiol, 28: 632-640. doi: 10.1016/0002-9149(71)90050-6.
33.Grünberg W., van Bruggen L.W., Eisenberg S.W., Weerts E.A., Wolfe A. (2011). Complete transposition of the aorta and pulmonary artery in a Belgian Blue crossbreed calf: a case report. BMC Vet Res, 7: 22. doi.org/10.1186/1746-6148-7-22.
34.van der Linde-Sipman J.S. (1978). Hypoplasia of the left ventricle in four ruminants. Vet Pathol, 15: 474-480. doi: 10.1177/030098587801500404.
35.Mohamed T., Sato H., Kurosawa T., Oikawa S., Nakade T., Koiwa M. (2004). Tetralogy of Fallot in a calf: clinical, ultrasonographic, laboratory and postmortem findings. J Vet Med Sci, 66: 73-76. doi: 10.1292/jvms.66.73.
36.Schrope, D.P. (2015). Prevalence of congenital heart disease in 76,301 mixed-breed dogs and 57,025 mixed-breed cats. J Vet Cardiol, 17: 192202. doi: 10.1016/j.jvc.2015.06.001
37.Tidholm A., Ljungvall I., Michal J., Haĝgström J., Höglund K. (2015). Congenital heart defects in cats: a retrospective study of 162 252 cats (19962013). J Vet Cardiol, 17, 215-219. doi: 10.1016/j.jvc.2014.09.004.
38.Heath E., Kukreti J.P. (1979). Persistent truncus arteriosus communis in a two-year-old steer. Vet Rec, 105: 527-530.
39.Camón J., López-Béjar M.A., Verdú J., Rutllant J., Sabaté D., Degollada E., López-Plana C. (1995). Persistent truncus arteriosus in a diprosopic newborn calf. Zentralbl Veterinarmed A, 42: 41-49. doi: 10.1111/j.1439-
0442.1995.tb00354.x.
40.Schwarzwald C., Gerspach C., Glaus T., Scharf G., Jenni R. (2003). Persistent truncus arteriosus and patent foramen ovale in a Simmentaler x Braunvieh calf. Vet Rec, 152: 329-333. doi: 10.1136/vr.152.11.329.
41.McManus A., Moloney T., Kelly P., Rowan C., Skelly C., McAloon C.I. (2020). An unusual presentation of developmental anomalies of the cardiovascular system including tetralogy of fallot, double outlet right ventricle, patent foramen ovale and persistent right aortic arch in a Friesian calf. BMC Vet Res, 16: 224. doi: 10.1186/s12917-020-02439-8.
42.Mohamed T., Sato H., Kurosawa T., Oikawa S., Nakade T., Koiwa M. (2004). Tetralogy of Fallot in a calf: clinical, ultrasonographic, laboratory and postmortem findings. J Vet Med Sci, 66: 73-76. doi: 10.1292/jvms.66.73.
43.Nakade T., Uchida Y., Otomo K. (1993). Three cases of bovine extreme tetralogy of Fallot. J Vet Med Sci, 55: 161-167. doi: 10.1292/jvms.55.161.
44.Dear M.G., Price E.K. (1970). Complex congenital anomaly of a bovine heart. Vet Rec, 86: 219-222.
45.McKenna S.L.B., Barkema H.W., McClure J.T., Rogers L.A. (2003). Tetralogy of Fallot in a 2-year-old Holstein heifer. Can Vet J, 44: 312-313.
46.Ishiyama D., Makino E., Nakamura Y., Uchida M., Onodera Y., Chambers J.K., Uchida K., Matsuda F. (2019). Clinical and postmortem findings of pentalogy of Fallot in an 18-month-old Holstein heifer. J Vet Med Sci, 81: 1676-1679. doi: 10.1292/jvms.19-0147.
47.Mair D.D., Ritter D.G., Ongley P.A., Helmoholz H.F. (1971). Hemodynamics and evaluation for surgery of patients with complete transposition of the great arteries and ventricular septal defect. Am J Cardiol, 28: 632-640. doi: 10.1016/0002-9149(71)90050-6.
48.Grunberg W., van Bruggen L.W., Eisenberg S.W., Weerts E.A., Wolfe A. (2011). Complete transposition of the aorta and pulmonary artery in a Belgian Blue crossbreed calf: a case report. BMC Vet Res, 7: 22. doi.org/10.1186/1746-6148-7-22.
49.Caivano D., Boni P., Gobbi M., Venanzi N., Cicogna M., Lepri E. (2022). Complex congenital heart defects in three Holstein Friesian calves. Large Anim Rev, 28, 101-106.
50.Kast A. (1970). Congenital transposition of the aorta and pulmonary artery in cattle. Zentralbl Veterinarmed A, 17: 780-795.
51.Sandusky G.E., Smith C.W. (1981). Congenital cardiac anomalies in calves. Vet Rec, 108: 163-165. doi: 10.1136/vr.108.8.163.
52.Wilson R.B., Cave J.S., Horn J.B., Kasselberg A.G. (1985). Double outlet right ventricle in a calf. Can J Comp Med 49, 115-116.
53.Prosek R., Oyama M.A., Church W.M., Nagy D.W., Sisson D.D. (2005). Double-outlet right ventricle in an Angus calf. J Vet Intern Med, 19, 262267. doi: 10.1892/0891-6640(2005)19<262:drviaa>2.0.co;2.
54.Nourani H., Parchami A., Bonyadian M. (2009). Double outlet right ventricle in a calf. Comp Clin Pathol, 18, 187-189. doi: 10.1007/s00580-0080771-x.
55.Newhard D.K., Jung S.W., Winter R.L., Kuca T., Bayne J., Passler T. (2017). Double-outlet right ventricle with an intact interventricular septum and concurrent hypoplastic left ventricle in a calf. J Vet Cardiol, 19, 205-210. doi: 10.1016/j.jvc.2016.11.002.
56.McManus A., Moloney T., Kelly P., Rowan C., Skelly C., McAloon C.I. (2020). An unusual presentation of developmental anoma-242 lies of the cardiovascular system including tetralogy of fallot, double outlet right ventricle, patent foramen ovale and persistent right aortic arch in a Friesian calf. Vet Res, 16, 224-230. doi: 10.1186/s12917-020-02439-8.
57.Caivano D., Marchesi M.C., Boni P., Venanzi N., Angeli G., Porciello F., Lepri E. (2021). Double-Outlet Right Ventricle in a Chianina Calf. Animals, 11: 318. doi.org/10.3390/ani11020318.
58.Marcato P.S., Benazzi C., Bettini G., Masi M., Della Salda L., Sarli G., Vecchi G., Poli A. (1996). Blood and serous cysts in the atrioventricular valves of the bovine heart. Vet Pathol, 33: 14-21. doi: 10.1177/030098589603300102.
59.Murakami T., Tsuda S. (2006). Atrioventricular septal defect without persistent ostium primum in a calf. Adv Anim Cardiol, 39: 64-69.
60.Depenbrock S.M., Visser L.C., Kohnken R.A., Russell D.S., Simpson K.M., Bonagura J.D. (2015). Congenital isolated cleft mitral valve leaflet and apical muscular ventricular septal defect in a Holstein calf. J Vet Cardiol, 17: 237-242. doi: 10.1016/j.jvc.2015.03.003.
61.Dias Moreira A.S., Grint K., Stepien R., Shaw G., Peek S. (2019). Tricuspid valve dysplasia and a patent foramen ovale resulting in severe tricuspid regurgitation and right-heart dilation in a Red Angus calf. J Vet Cardiol, 21: 28-33. doi: 10.1016/j.jvc.2018.10.005.
62.Nayak S., Kanakriyeh M., Varadarajan P. (2020). Echocardiographic assessment of atrioventricular canal defects. Echocardiography, 37: 21992210. doi: 10.1111/echo.14961.
63.Saponaro V., Staffieri F., Franchini D., Crovace A. (2010). Complete atrioventricular canal in a dog. J Vet Cardiol, 12: 135-140. doi: 10.1016/j.jvc.2010.04.003.
64.Schrope D.P. (2013). Atrioventricular septal defects: natural history, echocardiographic, electrocardiographic, and radiographic findings in 26 cats. J Vet Cardiol, 15: 233-242. doi: 10.1016/j.jvc.2013.06.004.
65.Drábková Z., Amory H., Kabeš R., Melková P., van Loon G. (2020). Partial atrioventricular septal defect in an adult sport horse. J Vet Cardiol, 31: 8-14. doi: 10.1016/j.jvc.2020.06.003.
66.Watson T.D., Marr C.M., McCandlish I.A. (1991). Aortic valvular dysplasia in a calf. Vet Rec, 129: 380-382. doi: 10.1136/vr.129.17.380.
67.Lemberger K.Y., Mohr K.R., Andrews J.J. (2004). Atypical hypoplastic left ventricular syndrome in a calf. J Vet Diagn Invest, 16: 423-426. doi: 10.1177/104063870401600509.
68.van Nie CJ. (1993). A stenosis of the isthmus aortae concurrent with multiple defects in a calf heart. An attempt at an embryological and phylogenetic explanation. Anat Histol Embryol, 22: 289-295. doi: 10.1111/j.14390264.1993.tb00221.x.
D. Caivano et al. Large Animal Review 2023; 29: 35-4545

SANDRO CAVIRANI1*,
1 Unit of Infectious Diseases of Domestic Animals, Department of Veterinary Science, University of ParmaItaly
2 Virbac - Italy
3 Unit of Animal Production Sciences, Department of Veterinary Science, University of Parma - Italy
SUMMARY
A dairy herd must be considered an integrated production unit. From newborn calves to milking cows, animal health status is pivotal to get satisfactory economic results. Theneonatal phase of calves is a period of life that needs extra care due to their vulnerability. Diarrhea is considered the main pathology affecting newborn calves. Conversely, respiratory disease is the main cause of losses after sixty days of life. The present study aimed at assessing the impact of neonatal diarrhea on growth, milk productivity and health status in a selected population of dairy cattle. A case-control study involving 300 calves from 5 large dairy herds located in the Po Valley (Italy) was carried out. All animals received lived-modified or inactivated, monovalent or combined vaccines for immunization to Bovine Herpesvirus 1 (BoHV-1), Bovine Viral Diarrhea Virus (BVDV) and Bovine Respiratory Syncytial Virus (BRSV). Particularly, most calves were administered with IBR marker and BRSV vaccines by intranasal route as priming immunization treatment. The enrolled animals were divided in two groups, each consisting of 150 calves. In the group A (cases) were included the animals experiencing severe neonatal diarrhea. Conversely, the group B (controls) included calves showing no clinical signs of neonatal enteritis. The animals were monitored in order to measure the body weight at birth, 6 and 15 months of age and milk production. Moreover, mortality rate and incidence of respiratory disease episodes during life were recorded. Animals of Group A showed a lower body weight at 6 and 15 months of age and a significant loss of milk production compared to those of the Group B. Moreover, incidence of respiratory disease and relapses were significantly higher in Group A. Results support the thesis that neonatal enteritis has a negative impact on weight gain during the grow period, milk production and is related to severe respiratory disease onset.
KEY WORDS
Neonatal enteritis; respiratory disease; productive performances.
INTRODUCTION
Like any industrial enterprise, the main target of bovine dairy industry is the economic sustainability as well. This implies the production of a sufficient amount of milk to guarantee an acceptable income for the farmer. A dairy herd must be considered an integrated production unit. From newborn calves to milking cows, animal health status is pivotal to get satisfactory economic results. Theneonatal phase of calves is a period of life that needs extra care due to their vulnerability6. This period, defined as the time interval from birth to 28 days of age, is expecially important from a health point of view, as ap-
Corresponding Author: Sandro Cavirani (sandro.cavirani@unipr.it).
proximately 75% of losses in young calves occur at this stage, and the first week of life is considered the most critical period, with 50% of losses3. Diarrhea is considered the main pathology affecting newborn calves. Conversely, respiratory disease is the main cause of losses after sixty days of life. In many cases, respiratory disease episodes occur in animals previously showing neonatal diarrhea8. Microbial and extramicrobial factors combine to trigger neonatal diarrhea. In particular, the Failure of Passive Transfer (FPT) status is considered the main extramicrobial factor predisposing to the occurrence of neonatal diarrhea but also to infectious diseases in the latter stages of life7. The problem is widespread in dairy cattle industry. Regardig the domestic situation, a survey carried out in newborn calves belonging to 85 Italian friesian herds with high milk production (≥11000 kg/cow/lactation) showed a FPT mean prevalence of 35%. In addition, 17% of colostrum samples suffered from a deficit of IgG. No significant difference was demon-
CLOTILDE SILVIA CABASSI1, COSTANZA SPADINI1, EMILIANA SCHIANO1, MARCO DI PIETRO2, FEDERICO RIGHI3, GIAN LUCA BASSI2, SIMONE TADDEI1
S. Cavirani et al. Large Animal Review 2023; 29: 47-5047
From a healthy calf to a performing cow: a case-control study N
48From a healthy calf to a performing cow: a case-control study
strated for colostrum immunoglobulin content in relation to cow parity2. The present study aimed at assessing the impact of neonatal diarrhea on growth, milk productivity and health status in a selected population of dairy cattle.
MATERIALS AND METHODS
A case-control study was performed on a total of 300 newborn calves enrolled from 5 large dairy herds, located in the Po Valley (Italy). All the animals resulted negative to IDEXX SNAP BVDV Antigen test devoted to detection of Bovine Viral Diarrhea Virus persistently infected (PI) animals. Calves were located in single pens or hutches for the first sixty days of life. No calves received any colostrum replacer. Fifty-five out of 300 calves were treated orally against Cryptosporidium parvum at birth. Depending on the cases, the animals were submitted to different immunization regimens. All animals received livedmodified or inactivated, monovalent or combined vaccines for immunization to Bovine Herpesvirus 1 (BoHV-1), Bovine Viral Diarrhea Virus (BVDV) and Bovine Respiratory Syncytial Virus (BRSV). Particularly, most calves were administered with IBR marker and BRSV vaccines by intranasal route as priming immunization treatment.
Based on the health status in the neonatal period, calves were enrolled and assigned to one of two groups (A or B), each consisting of 150 calves. Group A (cases) included animals experiencing severe (needing antibiotic therapy) neonatal diarrhea.
Conversely, group B (controls) included calves that did not showed clinical signs of neonatal enteritis. All animals were observed in order to record body weight at birth, at 6 and at 15 months of age. Additionally, they were monitored throughout their productive life to measure the average milk yield per lactation. Furthermore, mortality rate and prevalence of respiratory disease episodes, involving single animals and requiring antiinflammatory and antibiotic treatments, were recorded. Two or more severe (needing anti-inflammatory and antibiotic therapy) respiratory disease episodes occurring in the same animal and in absence of a respiratory disease outbreak were evaluated as relapses due to reactivation of silent foci of pneumonia. Results were submitted to the analysis of variance by using the software IBM SPSS v28 (IBM Corp. Released 2020. IBM SPSS 240 Statistic for Windows, Version 28.0. Armonk, NY: IBM Corp). The Chi-square test was performed to compare mortality and morbidity data.
RESULTS
Data regarding body weight and milk yield in Group A and B are reported in Table 1. The animals of the Group A (cases) compared to those of the Group B had similar body weight at birth but differed for this parameter at 6 and 15 months of age on average by 8.77 and 5.15%, respectively. Regarding milk yield, overall group A suffered a mean loss of 760 Kg of milk/cow, corresponding to 350-450 euro/cow, in relationship to milk pro-
Figure 1 - Calf pneumonia (c, d) caused by microbial pathogens translocation from the gut with enteritis (a, b) to the lung through bloodstream route.
ductive destination. Calculation did not consider losses due to mortality and costs for therapy of respiratory disease episodes. Mortality rate and incidence of respiratory disease were respectively 8.67% and 30.67% in Group A vs 4,67% and 20,67% in Group B. Mortality rate was similar between groups, while respiratory disease incidence was significantly different (P<0.05). Among respiratory disease episodes, 45% in Group A showed a relapsing character vs 21% in Group B (P<0.05). In addition, data showed that overall 60% of respiratory disease episodes occurred during the first 6 months of age.
DISCUSSION
Results support the thesis that severe neonatal enteritis has a negative impact on weight gain during the growth period and on milk production. As previously demonstrated, preweaning diseases, namely enteritis and/or respiratory disease, elicits longterm negative effects on milk production1. However, the impact on critical reproductive performance indicators and reproductive performances still remained uncertain1. FPT plays an important role in the pathogenesis of neonatal enteritis, favouring viral, bacterial and parasitic infection and related pathogenic effect. Despite this parameter was not investigated in the present study, it’s widely accepted that an IgG concentration <800 mg/100 ml of blood serum in 3-10 day old calves is considered an index of a FPT status9. Regarding the origin of FPT, poor management of colostrum feeding has been widely accepted as the main cause of the problem. However, as reported above, a non-negligible number of dairy cows produce low-
quality colostrum (IgG <50 mg/ml)4. To cope the problem, a useful tool could be the creation of a colostrum bank, collecting and freezing “good” quality colostrum aliquots. In this case, adoption of effective hygienic measures to avoid microbial contamination of stored colostrum must be considered pivotal. Animals affected by diarrhea showed a higher incidence of respiratory disease in later life periods. Impairment of enteric barrier triggers a microbial (mainly bacteria) translocation form gut to bloodstream and then to different organs, including lung (Fig. 1). Isolation of enteropathogenic bacteria, mainly Escherichia coli and Salmonella spp., from lung specimens of calves which experienced enteritis support this pathogenetic hypothesis. Furthermore, the anatomy of bovine lung (8 lobes, absence of interalveolar pores, presence of interlobular septa) hampers the microbial clearance, promoting persistence of silent foci of bacterial infection which can reactivate during the productive life causing the onset of relapsing respiratory episodes5 (Fig. 2).
S. Cavirani et al. Large Animal Review 2023; 29: 47-5049
Body Weight (Kg) at birth47.6 ± 4.247.2 ± 3.8 at 6 months182.5 ± 32.0198.5 ± 23.0* at 15 months360.8 ± 32.4379.4 ± 21.0* Milk Yield (Kg) 11720 ± 42512480 ± 346**
Figure 2 - Respiratory relapse in an adult cow.
Group AGroup B * P<0.05, ** P<0.01
Table 1 - Comparison of Body Weight and Milk Yield in animals belonging to Group A and Group B.
50From a healthy calf to a performing cow: a case-control study
CONCLUSIONS
Since severe neonatal enteritis affects health, growth and production of dairy cattle, disease control is the first step to support dairy farm sustainability. Following the mantra “prevention is better than cure”, vaccination of dam during the dry period should be included in the protocols to cope neonatal enteric disorders. However, if a FPT status persists, even in presence of an effective maternal immunization, prevalence and seriousness of neonatal enteritis often persists as well. Consequently, the farmer’s feed-back could be: “this vaccine doesn’t work” or, even worst “vaccination practice doesn’t work at all” To avoid that, it’s pivotal to detect the origin of FPT in the herd, setting up possible solutions to the problem. But, it’s not so easy to get.
References
1. Abuelo A., Cullens F., Brester J. (2021). Effect of preweaning disease on the reproductive performance and first-lactation milk production of heifers in a large dairy herd. J Dairy Sci, 104(6): 7008-7017.
2. Cavirani S., Taddei S., Cabassi C.S., Donofrio G., Toni F., Ghidini F., Piancastelli C., Schiano E., Flammini C.F. (2005). Deficit of colostrum IgG and passive immunity transfer in high production dairy herds. Large Anim Rev, 11: 17-21.
3. Cho Y., Yoon K. (2014). An overview of calf diarrhea-infectious etiology, diagnosis, and intervention. J Vet Sci, 15(1): 1-17.
4. Drikic M., Windeyer C., Olsen S, Fu Y., Doepel L., De Buck J. (2018). Determining the IgG concentrations in bovine colostrum and calf sera with a novel enzymatic assay. J Anim Sci Biotechnol, 9: 69. https://doi.org/10.1186/s40104-018-0287-4.
5. Griffin D., Chengappa M., Kuszak J., McVey S. (2010). Bacterial pathogens of the bovine respiratory disease complex. Vet Clin North Am Food Anim Pract, 26(2): 381-94.
6. Plaizier JC., Danesh Mesgaran M., Derakhshani H., Golder H., Khafipour E., Kleen JL., Lean I., Loor J., Penner G., Zebeli Q. (2018). Review: Enhancing gastrointestinal health in dairy cows. Animal, 12(s2): s399-s418. doi: 10.1017/S1751731118001921.
7. Raboisson D., Trillt P., Cahuzac C. (2016). Failure of Passive Immune Transfer in Calves: A Meta-Analysis on the Consequences and Assessment of the Economic Impact. Plos One, 11(3): e0150452.
8. Rebhun W.C. (1995). Abdominal and respiratory diseases. In: Disease of Dairy Cattle. Ed. William & Wilkins.
9. Zakian A., Nouri M., Rasooli A., Ghorbanpour M., Constabel P., Mohammad-Sadegh M. (2018). Evaluation of 5 methods for diagnosing failure of passive transfer in 160 Holstein calves. Vet Clin Pathol, 47(2): 275283.

 Figure 1 - Echocardiographic and gross findings in calves affected by ventricular septal defect. (A) Right parasternal long axis view of the left ventricular outflow tract showing a perimembranous ventricular septal defect (arrow); (B) right parasternal long axis four chamber view showing a large ventricular septal defect (*), enlarged right ventricle (RV) and thickened right ventricular free wall; (C) four chamber cut of a formalin-fixed heart showing a perimembranous interventricular septal defect (VSD); (D) left ventricular (LV) view of a large perimembranous ventricular septal defect just below left coronary aortic cusp (LCC). LV, left ventricle; LA, left atrium; Ao, aorta; RVFW, right ventricular free wall; LVFW, left ventricular free wall; IVS, interventricular septum; IAS, interatrial septum; RCC, right coronary cusp; NCC, non-coronary cusp; MV, mitral valve.