TRIBORO ECODISTRICT ENERGY BASELINE STUDY


with New Sun Rising and support from The Henry L. Hillman Foundation
August 2022


with New Sun Rising and support from The Henry L. Hillman Foundation
August 2022

New Sun Rising
Brian Wolovich, Triboro Ecodistrict Director
Zaheen Hussain, Director of Sustainability
Elias Smolcic Larson, Americorps VISTA
evolve environment::architecture
Anna Rosenblum, Associate
Nico Azel, Technical Analyst
Harisa Martinos, Technical Analyst
with
Sarah SanGiovanni
Green Building Alliance
Duquesne Light
Peoples Gas
Penn State University
with support from The Henry L. Hillman Foundation
Photos and images provided by evolveEA and the Triboro Ecodistrict unless otherwise noted.
August 2022
Millvale is a self reliant urban solar village.
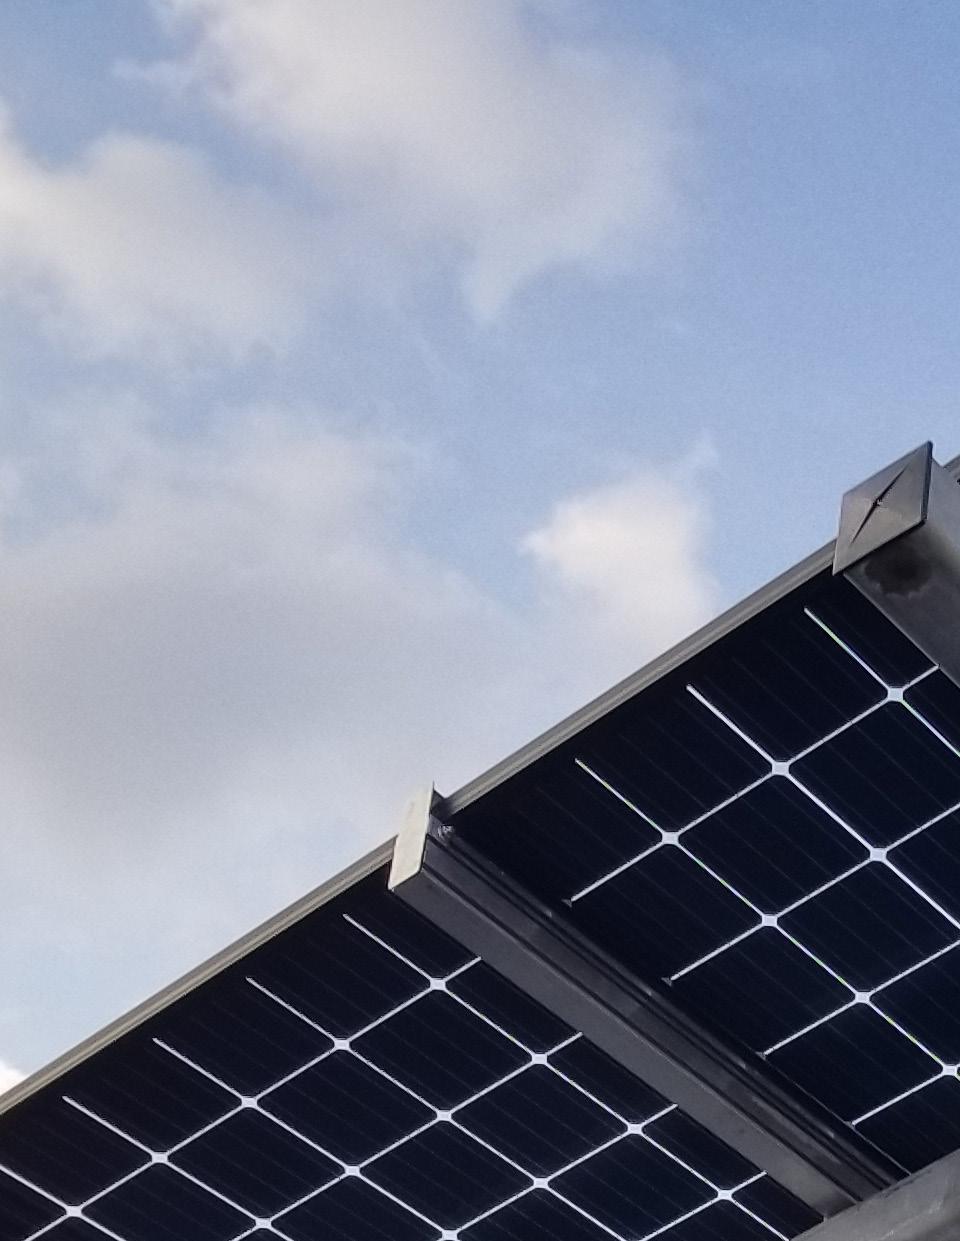
Etna is an innovative community that takes collective action to provide smart energy solutions.
Sharpsburg is an energy independent community.
The Triboro Ecodistrict promotes coordinated sustainable community development throughout the Boroughs of Millvale, Etna, and Sharpsburg, which earned the honor of being the first three EcoDistricts certified communities in the world.
With over 10,000 residents combined, these Allegheny River Towns are building on a strong collaborative history to improve quality of life through the shared lenses of Equity, Food, Water, Energy, Air Quality, and Mobility.
The Triboro Ecodistrict partners help to reduce and mitigate the impacts of climate change by centering the community’s voice through an ecodistricts approach. Together, they are building healthier, inclusive, and sustainable communities for current and future generations.
Energy was selected as one of the three key quality of life areas to address during the establishment of the Millvale Ecodistrict in 2012. The concept has been revisited as part of the Millvale Pivot 2.0 Plan in 2015, the Sharpsburg Community Vision Plan in 2017, and the Etna EcoDistrict Plan in 2019. With each planning effort, the three communities have found ways to reduce their community’s carbonbased energy consumption through beautiful and high performing places, programs, and initiatives. Every energy-related effort has been carefully considered for its potential to provide cost savings, reduce energy consumption, increase adoption of renewable energy, increase community resilience, and to achieve equitable outcomes by reducing the energy burden for community members.
The Triboro Ecodistrict has established vision statements for each of the three communities that describes the energy future they would like to see by the year 2030. These guiding statements, along with an energy hierarchy that prioritizes energy conservation, solarization, and resilience, has guided their efforts.
The Triboro Ecodistrict helps residents and institutions gain access to the resources and information necessary to learn about and implement affordable and clean energy projects. They also provide project technical assistance and implementation guidance to help their communities achieve their energy vision statements. TRIBORO
High risk of flooding, poor air quality, and household energy costs put unnecessarily strain on residents in the Triboro Ecodistrict. In Pennsylvania, 63% of energy comes from extractive, fossil fuels such as coal, natural gas, and petroleum. Continued reliance on these carbonbased sources contributes to poor respiratory health and cancer rates. These emissions not only make us less healthy, but contribute to a rapidly changing climate as evidenced by the frequency of severe storms and supposed “100 year floods”.
How we choose to produce and consume our energy will largely dictate the sustainability of communities like Millvale, Etna, and Sharpsburg. By prioritizing clean and affordable options like solar energy, we can reduce these negative impacts while keeping more money in the pockets of residents and key partners who support them.
PENNSYLVANIA’S ENERGY GENERATION CONSISTS OF ONLY 0.001% SOLAR ENERGY
Amount of global energy derived from renewables in 2019
18%
Amount of solar energy generated in the U.S. in 2020
132.63 Twh
Increase in the clean energy job industry versus the overall economy +70%
Over the last five years, drop in price of photovoltaic modules
Source: Triboro Ecodistrict Data Story Report, New Sun Rising
Medical costs from premature births due to fossil fuel emissions
$5 billion
Amount that Americans would save annually if 100% renewable energy was used $321 billion
Increase of U.S. renewable energy investment in 2019 29%
Average increase of home value with solar panels $15,000

The Triboro Ecodistrict has secured considerable funding from the Pennsylvania Department of Environmental Protection, the Henry L. Hillman Foundation, and the Heinz Endowments that has allowed them to bring several energy-related projects to fruition. A selection of these projects include:
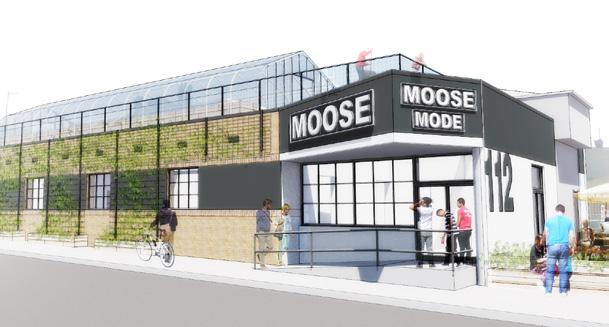
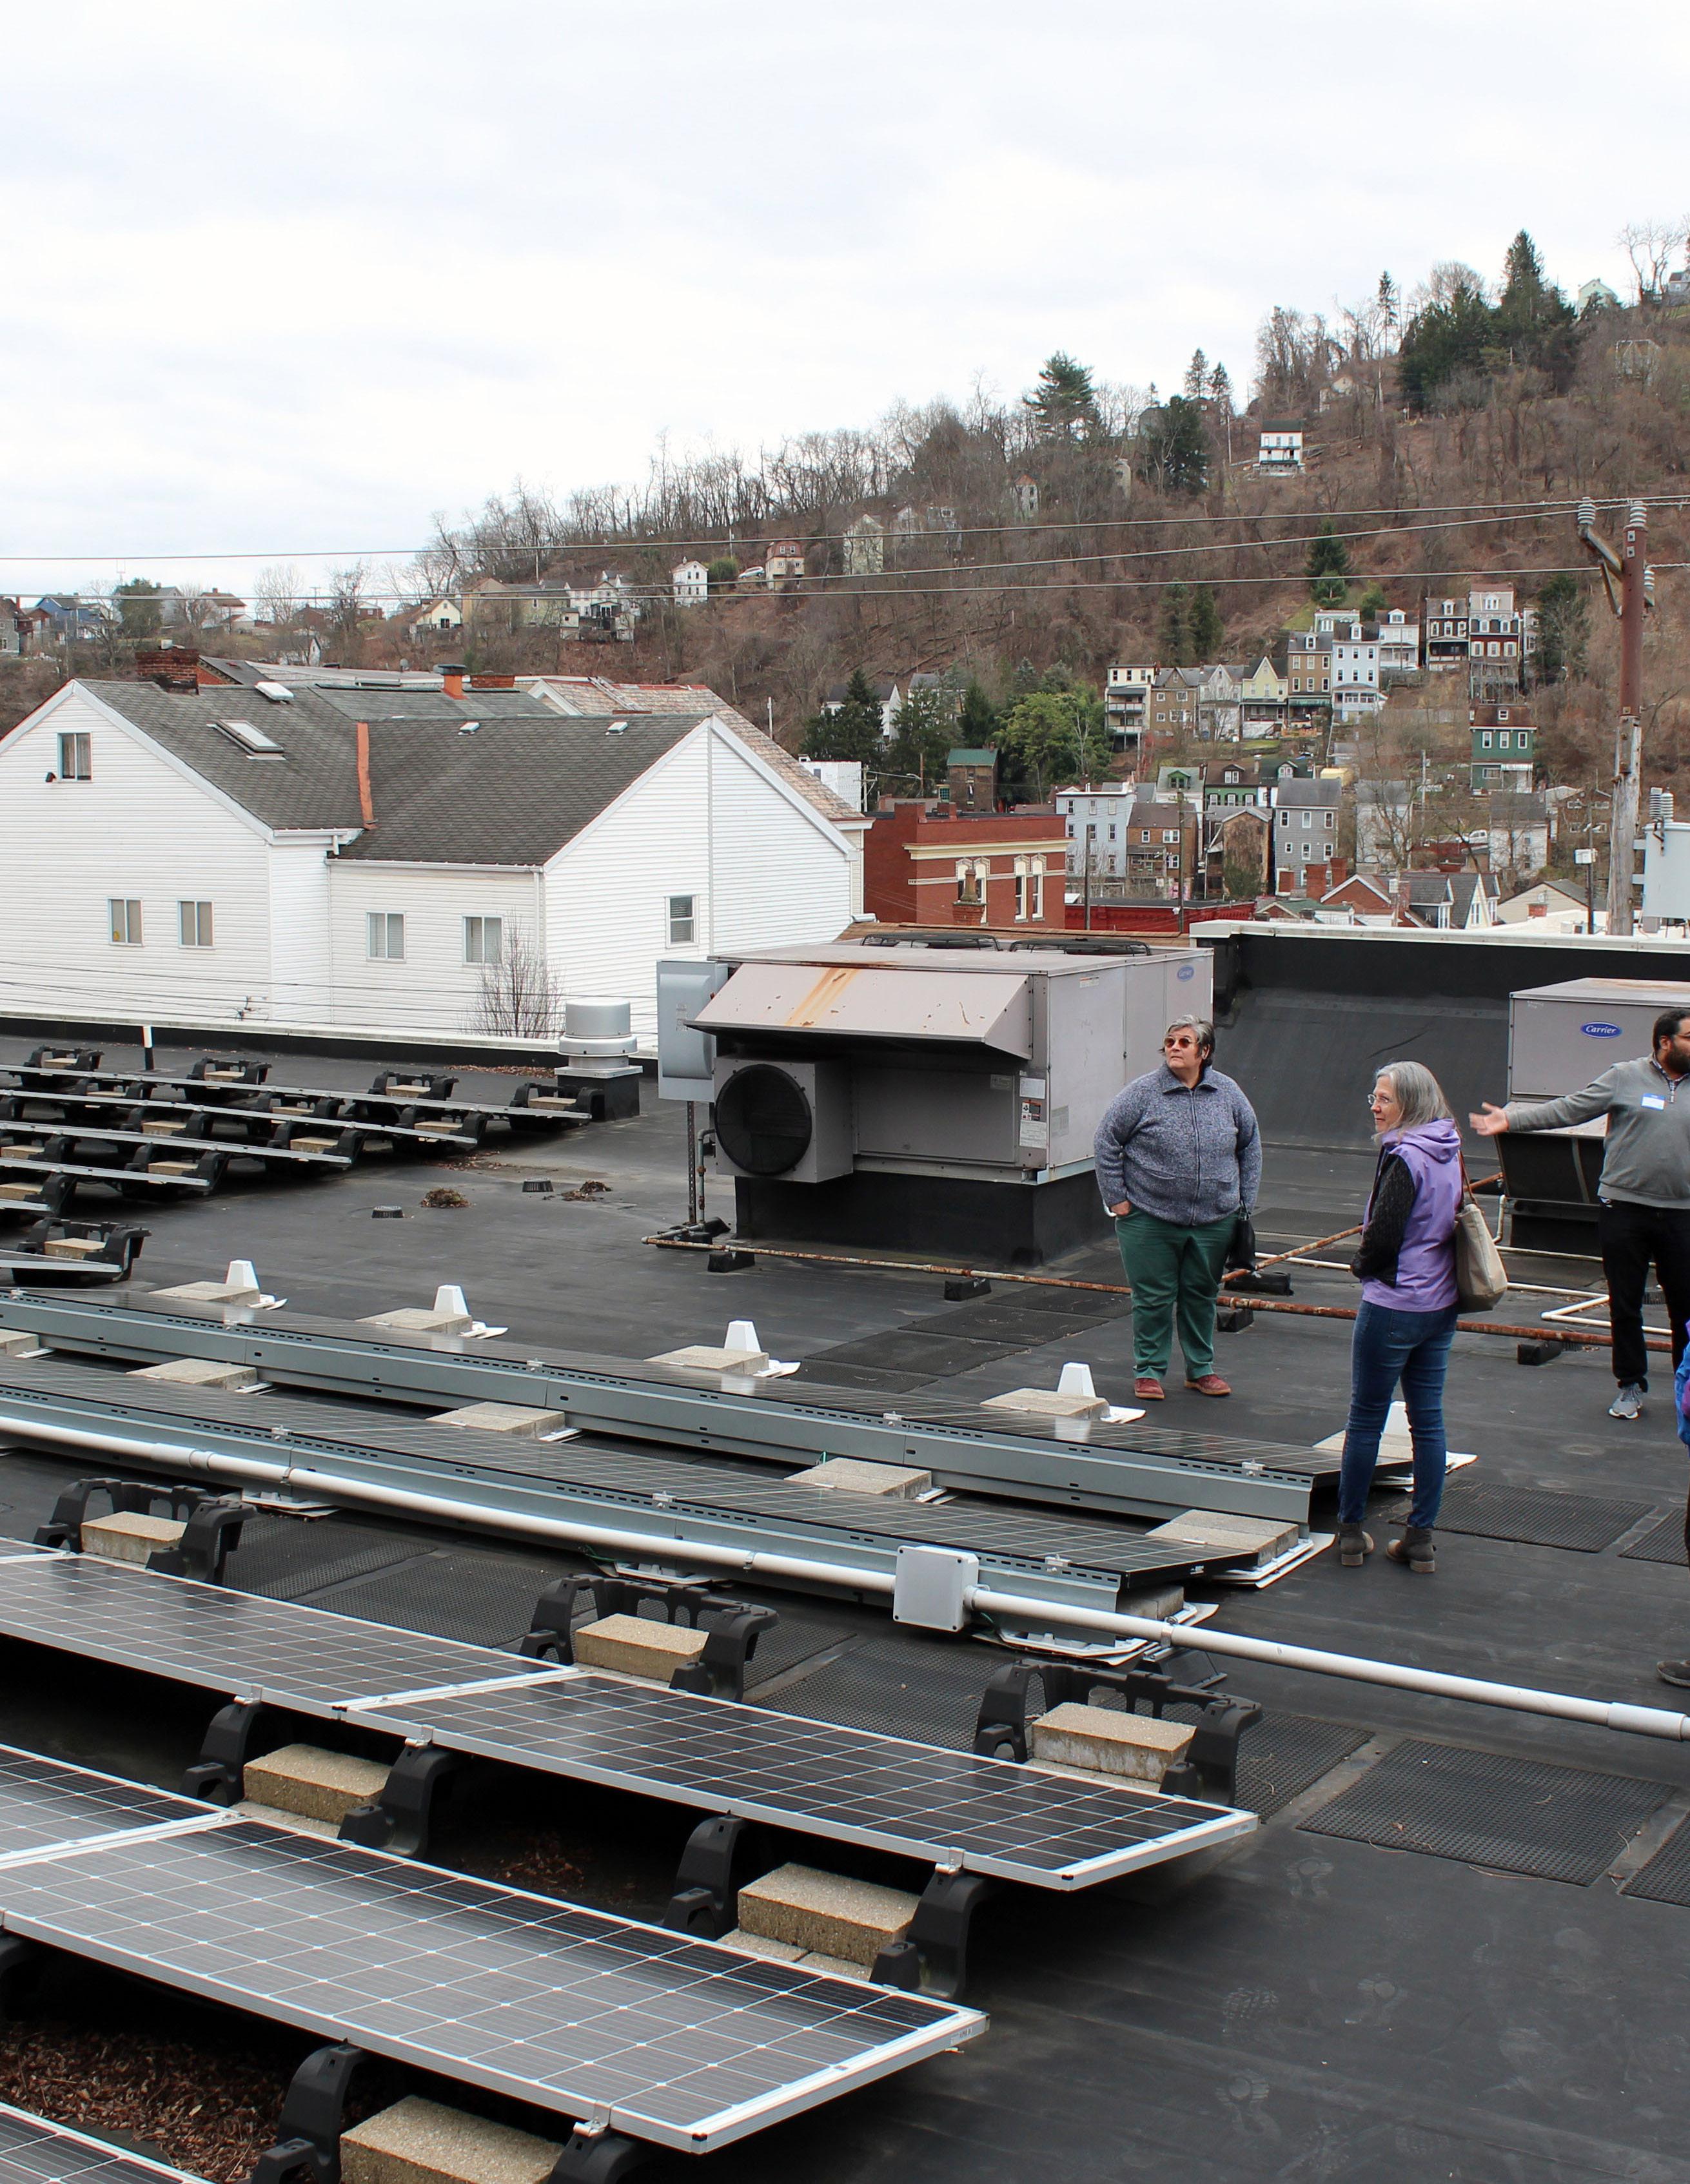
This 10,000 square foot former Moose Lodge has been transformed into a solar powered facility that serves as a cafe, food rescue, co-working space, public and private event space, job training space, and gathering space for enhanced community resilience. The building contains a Solar DC Microgrid System that serves as a learning tool, as well as the beginnings of a future energy hub.
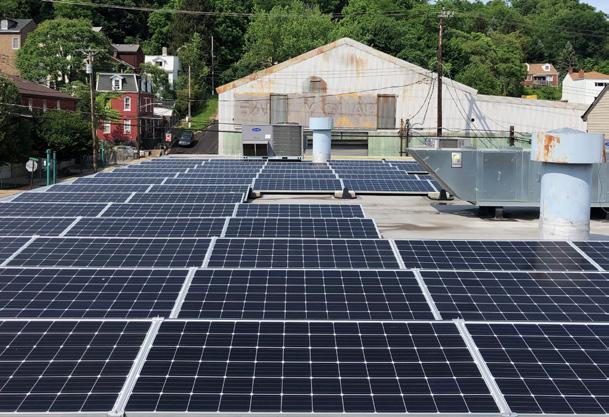
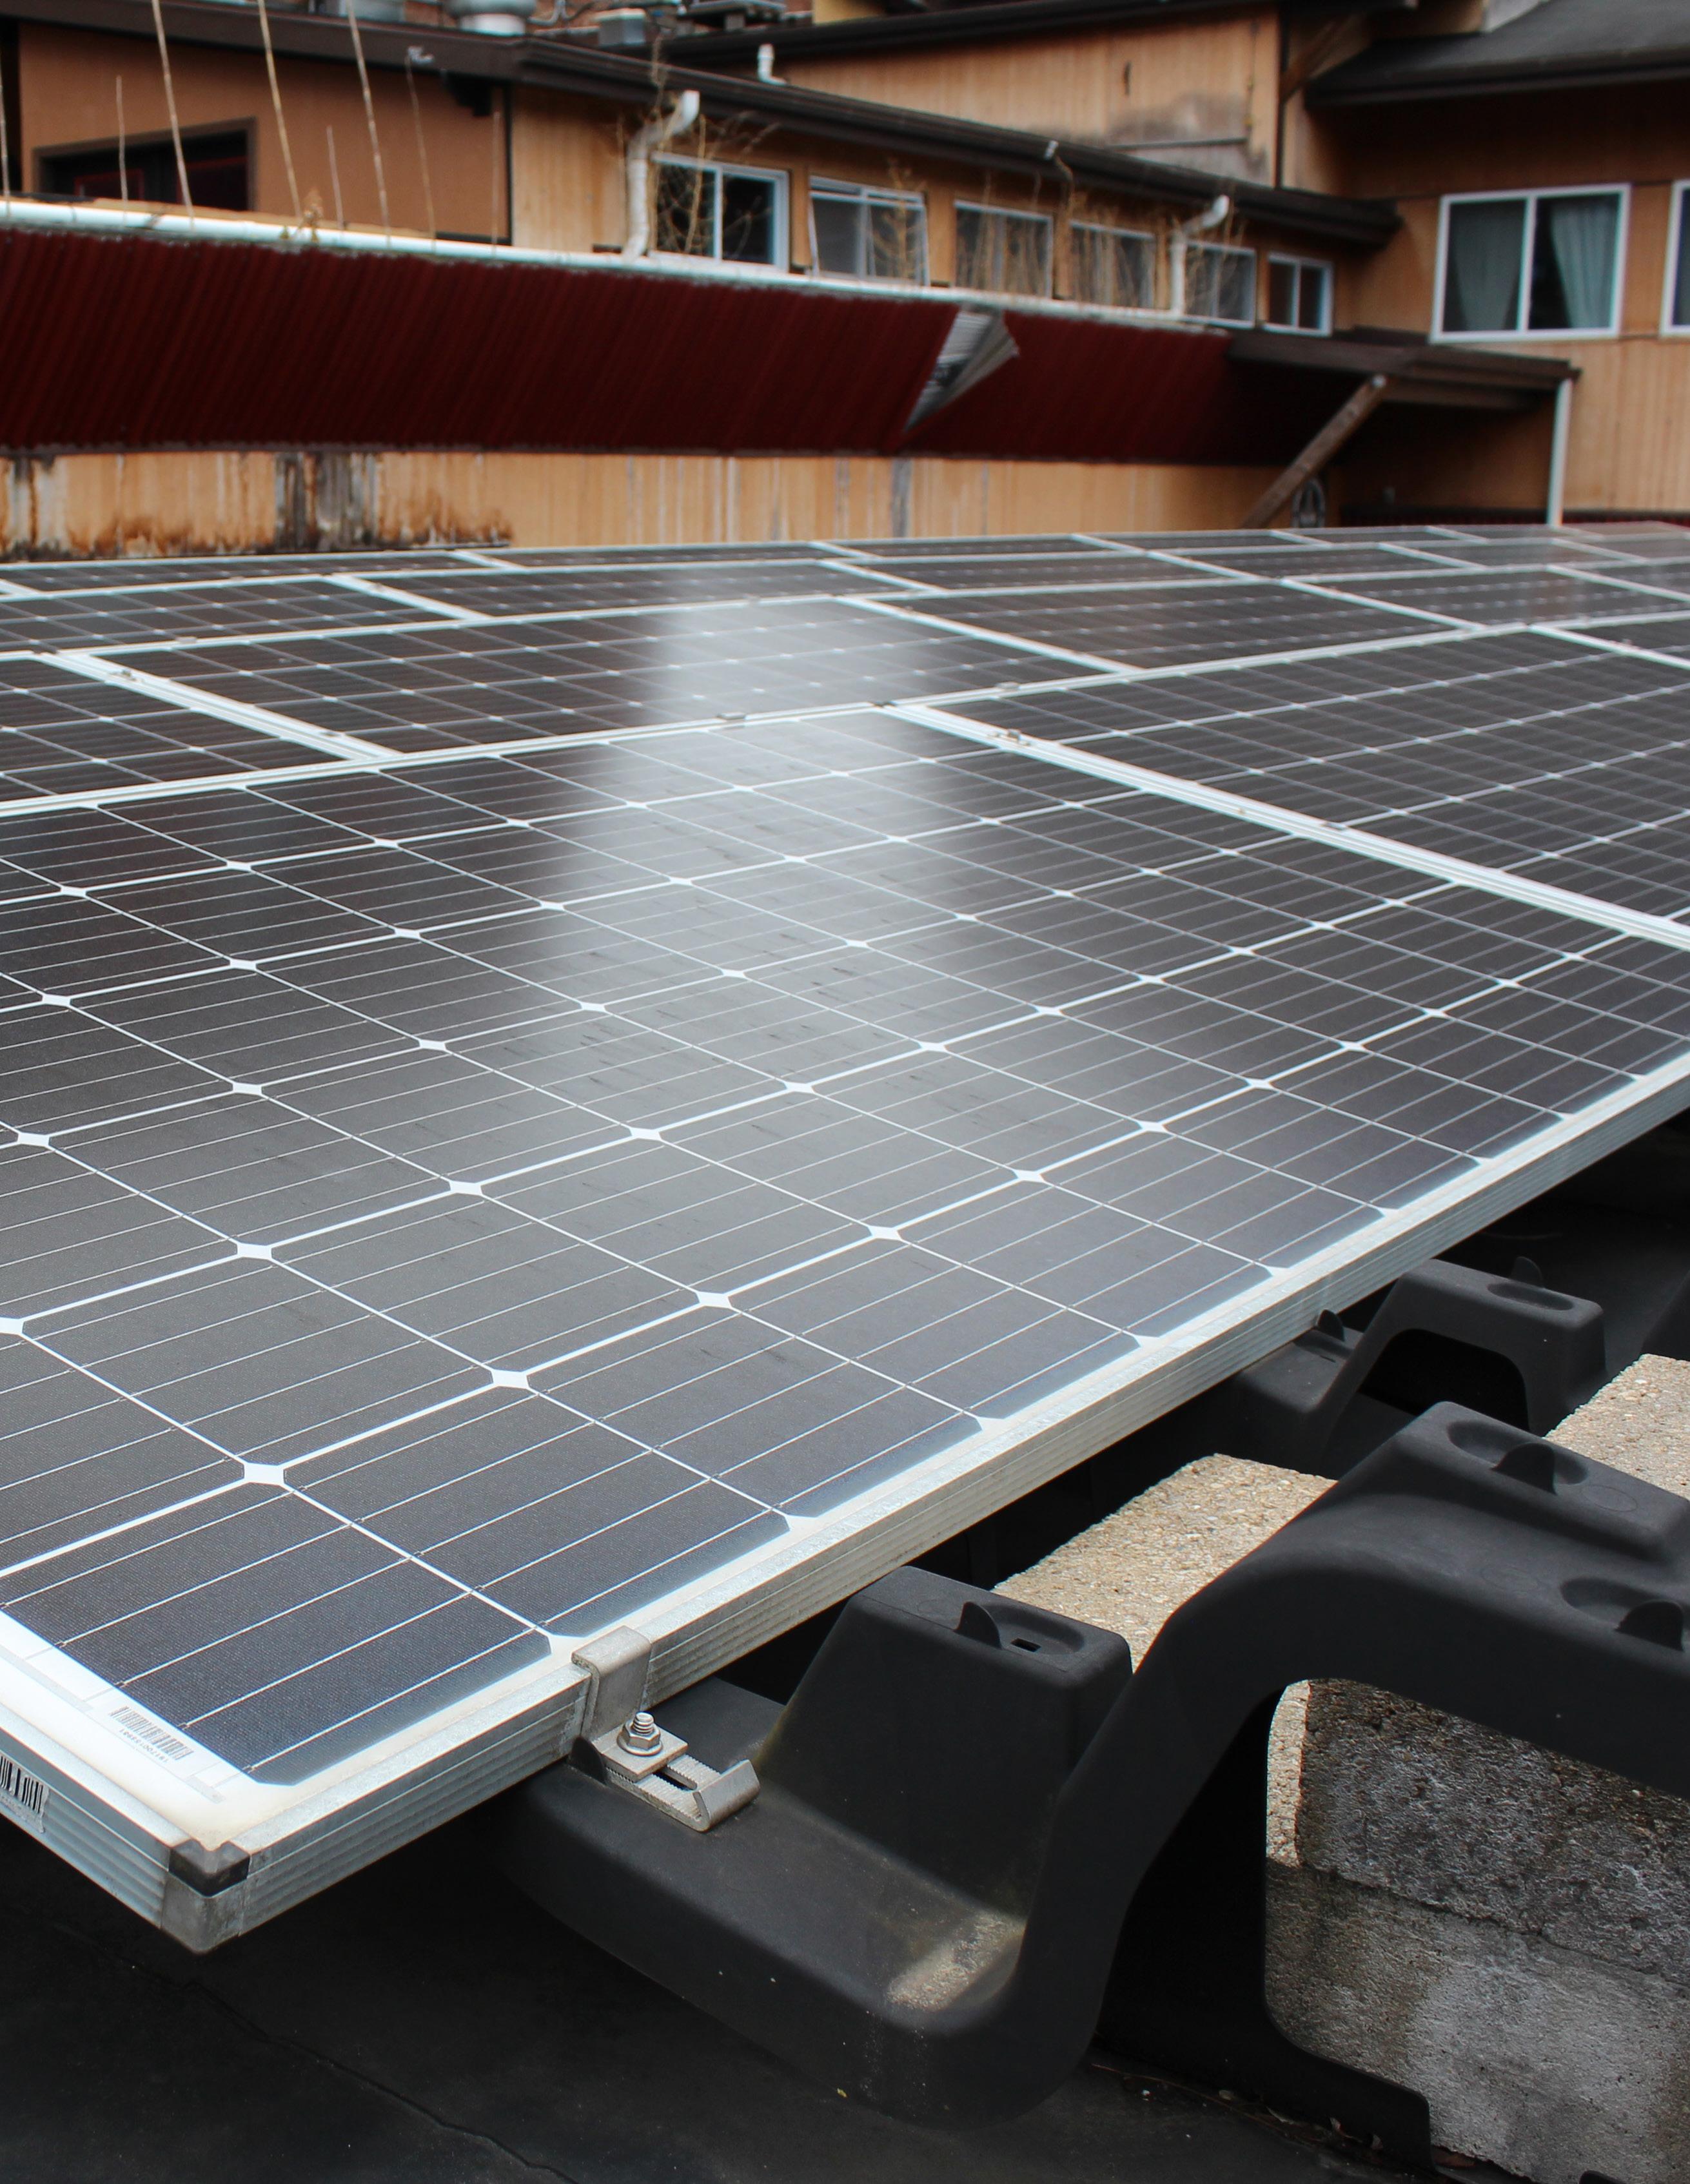
The Triboro Ecodistrict has installed solar arrays on key community buildings, including the Sharpsburg Sustainability & Civic Engagement Center, Millvale Community Library, Etna Community Garden (including an electric vehicle charging station), and soon, the Etna Center for Community.
The program consists of 1) Solar Energy Workforce program, with training, certification, and hands-on experience with a professional solar installer to prepare participants for entry into the growing clean energy industry.
2) Teen Solar Fellowship that introduces students to the technical skills, career experiences, and valuable connections that can help them to succeed in the installation industry. 3) Energy Discovery Zone, which provides educational opportunities.
The Sharpsburg Neighborhood Organization (SNO) was awarded a 6-year grant to perform residential energy audits throughout the Triboro Ecodistrict and provide funding for homeowners to implement recommendations from the audits.
HELIOStudio, a Carnegie Mellon University architecture studio that took place in collaboration with Land Art Generator Inc. (LAGI) in the fall of 2021, examined the reciprocal relationship between landscape, urban form, and distributed infrastructure in the pivot between carbon-based energy and renewable energy. The studio explored these concepts in Etna, PA through generalized urban integrated typologies, urban solar capacity analyses, and tools for community engagement and empowerment.
This study seeks to increase the rate of solar adoption in the Triboro Ecodistrict by quantifying and promoting investment opportunities for solar across the three communities. This study found that there is almost 1.4 million square feet of viable roof area for solar panels across the Triboro Ecodistrict.
The initiatives described on the previous spread are working to achieve the Triboro Ecodistrict’s energy goals in different ways. This report, the Triboro Ecodistrict Energy Baseline Study, helps the three communities to better understand residential energy consumption in Millvale, Etna, and Sharpsburg to inform future 2030 Energy Action Plan and goal creation. This study, and the scenarios modeled at the conclusion of the study, can inform decision making about how to most impactfully, cost efficiently, and/or equitably implement initiatives that will continue to help the Triboro Ecodistrict meet their energy goals. The recommendations on the adjacent page were informed by the findings from this report and have varying impacts, cost, and effort to implement.
1. Increase internal capacity to implement energy-related recommendations by hiring a Triboro Ecodistrict coordinator.
2. Acquire funding to support additional solarization efforts throughout the communities, which will also create more jobs.
3. Encourage participation in existing government rebate and financial assistance programs to upgrade HVAC systems to all-electric, energy efficient models that protect from poor outdoor air quality and improve thermal comfort.
4. Encourage residents to adjust their water heater temperature and retire their second refrigerator (if they have one).
5. Implement weatherization programs, with targeted recruitment of houses with building characteristics that account for a significant proportion of total community energy consumption and with high EUIs. This could include single family detached houses, smaller houses, houses that are described as often being “drafty”, and houses in average condition.
6. Recruit resident energy ambassadors to develop and distribute a list of resident behavior recommendations for how to reduce energy consumption, including programming a setback thermostat, changing lightbulbs, unplugging appliances when not in use, etc.
7. Encourage community-wide advocacy at all levels of governance, that promotes incentives for and reduces barriers to solar adoption.
8. Implement insulation programs including cavity-filled insulation for houses with frame construction and exterior rigid insulation for houses with siding that is nearing its end of life.
9. Implement a green power purchase campaign to encourage broader adoption of green power purchase, including inviting representatives from Green Mountain Energy and other companies to public events and energy-themed programs.
10. Host a lightbulb giveaway program to encourage residents to change their lightbulbs to LEDs.
11. Encourage residents to purchase programmable thermostats and train high school students to help install and program them.
12. Perform an assessment and/or develop a checklist specific to the Triboro Ecodistrict to better assess building envelope condition and perform improvements on building envelopes in poor condition.
13. Encourage energy efficiency best practices for housing renovations, and density, dwelling types with shared walls, and high insulation levels for new construction.
The purpose of the Triboro Energy Baseline Study is to better understand residential site energy consumption in Millvale, Etna, and Sharpsburg to inform future 2030 Energy Action Plan and goal creation.
The Triboro Ecodistrict seeks to reduce greenhouse gas (GHG) emissions, therefore lessening their contribution to the climate crisis. The Millvale Pivot 2.0 Plan, Sharpsburg Community Vision Plan, and Etna EcoDistrict Plan describe strategies that contribute to this goal, including strategies that reduce site energy consumption and increase on-site renewable energy production. The results of this study will inform a future prioritized 2030 Energy Action Plan and goals and will be used to evaluate progress as future energy strategies are implemented.
The Triboro Energy Baseline Study consists of three components:
BUILDING ENERGY CHARACTERISTICS
Analysis of the number of residential units, dwelling type, square footage, building age, condition, presence of heating and air conditioning systems, and exterior finish.
UTILITY DATA COLLECTION & ANALYSIS
Collection and analysis of actual energy consumption data, analyzed according to the building energy characteristics.
RESIDENT SURVEY
Resident survey to understand behaviors and perceptions related to residential energy consumption.
The consultant team performed research on building characteristics and their impact on energy consumption. Following this, evolveEA performed an analysis of the residential building stock in each of the three communities using publicly available information from the Allegheny County Property Assessments. The analysis focused on building characteristics from the research that were identified as having an impact on energy consumption, characteristics that can be changed, and characteristics that can be analyzed based on publicly available data. The analysis included mapping of the dwelling type, square footage, age, condition, presence of heating and air conditioning systems, and exterior finish. These building energy characteristics served as the basis for the data collection efforts performed in collaboration with Duquesne Light and Peoples Gas.

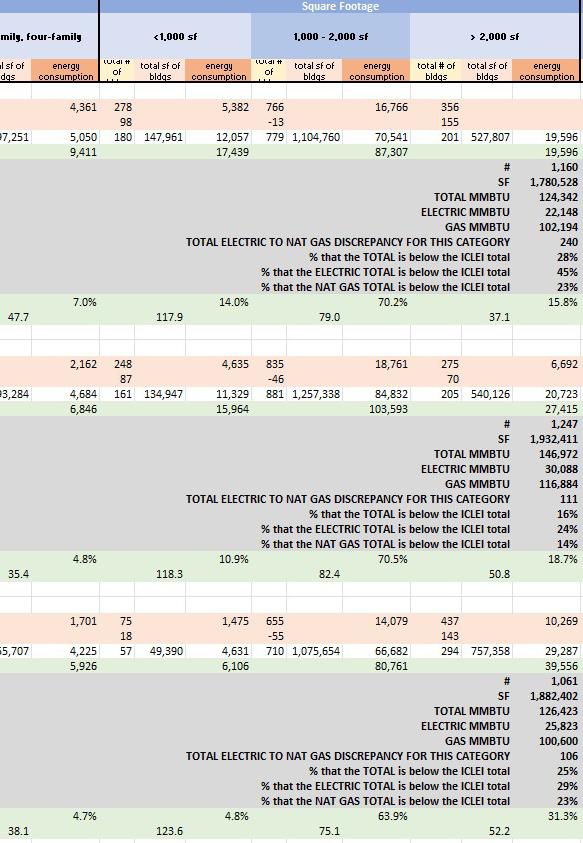


In collaboration with the Green Building Alliance, evolveEA and the Triboro Ecodistrict worked with Duquesne Light and Peoples Gas to acquire actual residential energy consumption data for all residential properties in the three communities in 2017. Due to privacy concerns, the acquired data was not associated with specific properties, but instead is organized based on the building energy characteristics. This data was then analyzed to understand trends in energy consumption based on the various building characteristics. The results informed the Energy Use Analysis, which includes the consultant team’s initial hypothesis, findings, and energy conservation recommendations for residential properties, organized by building characteristic.

In addition to the energy use analysis, the consultant team wanted to understand residential energy consumption behaviors that cannot be easily understood through utility data. In collaboration with Sarah SanGiovanni, the consultant team issued an Energy Use Survey to residents in the Triboro Ecodistrict, which included questions about the residents’ homes, energy use, energy costs, alternative energy and sustainability, and demographic information. Analysis of the survey results provides additional findings and recommendations to reduce energy consumption in the three communities.
Prior to the implementation of the Triboro Energy Baseline Study, Sarah SanGiovanni performed precedent research to understand the methodology pursued by other community energy studies. A detailed analysis of this precedent research can be found in Appendix A. While no single precedent directly informed the methodology of this study, the precedent research provided useful findings that informed aspects of this methodology.
While the Triboro Energy Baseline Study was performed with the best available data and methods available to the consultant team at the time, there are limitations to this study. The consultant team compared the residential data collection results to the energy analysis performed as part of the ICLEI Climate Action Plan efforts conducted by Penn State University Students and noticed varying discrepancies in residential energy consumption between the two efforts. This is likely due to differing “data cleaning” methods between the two efforts. For this study, properties listed with 0 square footage in area, “N/A” listed for energy consumption, and dwelling types of 5 housing units or more were excluded from this analysis. Further detail regarding these discrepancies can be found in Appendix C. While the data analysis was performed with the best available data and methods available to the consultant team at the time, there are limitations. Home energy consumption is influenced by a variety of factors and is not limited to the six building characteristics analyzed in this study. Additional factors include resident behavior, appliances, payment responsibility for utility bills, number of household members, primary heating fuel, and much more that was not analyzed as part of this study.
There are also limitations to the Resident Survey. The respondents were self-selected as opposed to a pre-determined representative sample of residents. Survey respondents may have had more time, interest, and previous history of involvement with civic initiatives compared to those who did not complete the survey.
These next steps are recommended to advance the findings from this study:
1. To have greater confidence in the data analysis, it is recommended that actual utility bills are acquired from a representative sample of houses in the Triboro Ecodistrict. The energy consumption could be analyzed in relation to building characteristics at a granular level to determine if the trends found in this study align.
2. The findings from this report should inform development of an energy action plan that begins with energy conservation, solarization, and then resilience. The action plan should be prioritized using first cost, energy savings, return on investment, and social equity considerations.
3. The Triboro Ecodistrict should complete the feasibility study and business plan and seek investment in “Accelerating Solar Investment Study” to advance solarization in the Triboro Ecodistrict.
4. New Sun Rising should continue to grow the Solar Workforce Development program and align with community installations.


The consultant team performed research on building characteristics and their impact on energy consumption. Following this, evolveEA performed an analysis of the residential building stock in each of the three communities using publicly available information from the Allegheny County Property Assessments. The analysis focused on building characteristics that were identified as having an impact on energy consumption, characteristics that can be changed, and characteristics that can be analyzed based on publicly available data. The building energy characteristics included dwelling type, square footage, age, condition, presence of heating and air conditioning systems, and exterior finish of residential properties in the three communities. The prevalence of these building characteristics in the Triboro Ecodistrict informed the definition of the building characteristic subcategories. There are six building characteristics (listed previously), with three or four subcategories each, for a total of 22 building characteristic subcategories. These building characteristic subcategories served as the basis for the data collection efforts by Duquesne Light and Peoples Gas. Due to privacy concerns, utility data cannot be acquired for specific properties or groups of properties that would sacrifice anonymity. Instead, the utility data was provided to the consultant team organized by building characteristic subcategories. This allowed the consultant team to perform analysis and understand which building characteristics most impact building energy consumption, and to understand which building characteristic subcategories tend to consume more energy per square foot, making them good candidates for targeted energy conservation projects and programs.
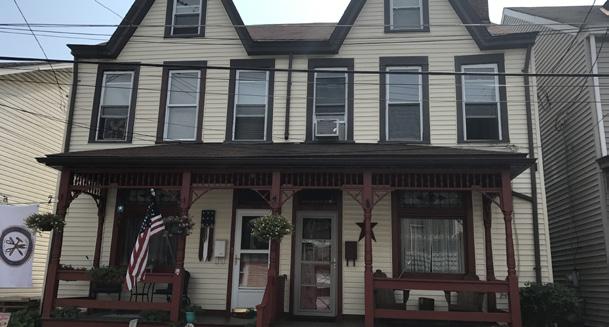
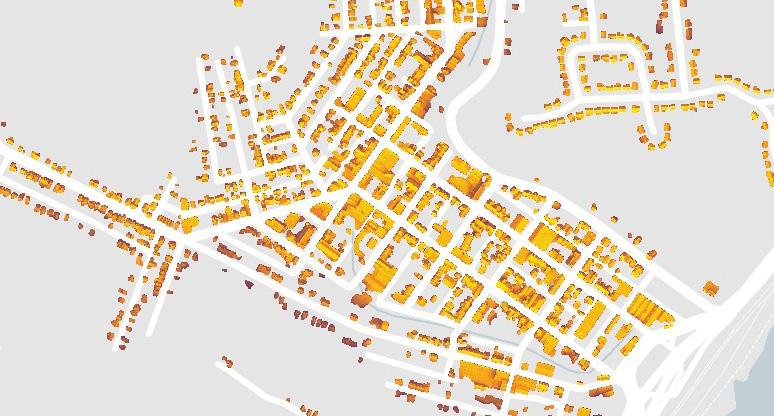
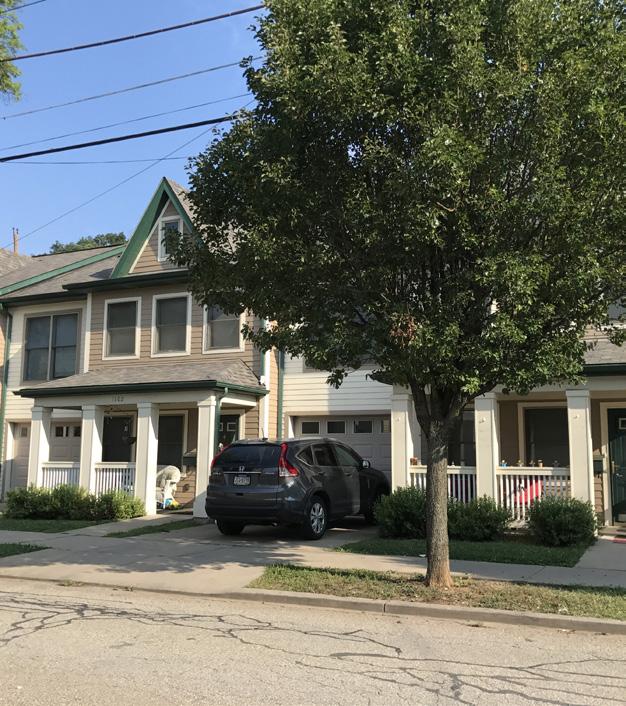
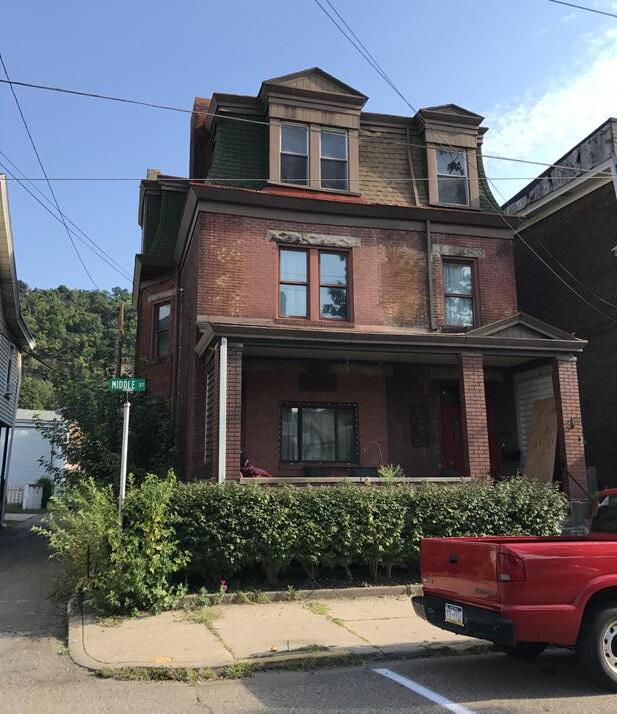
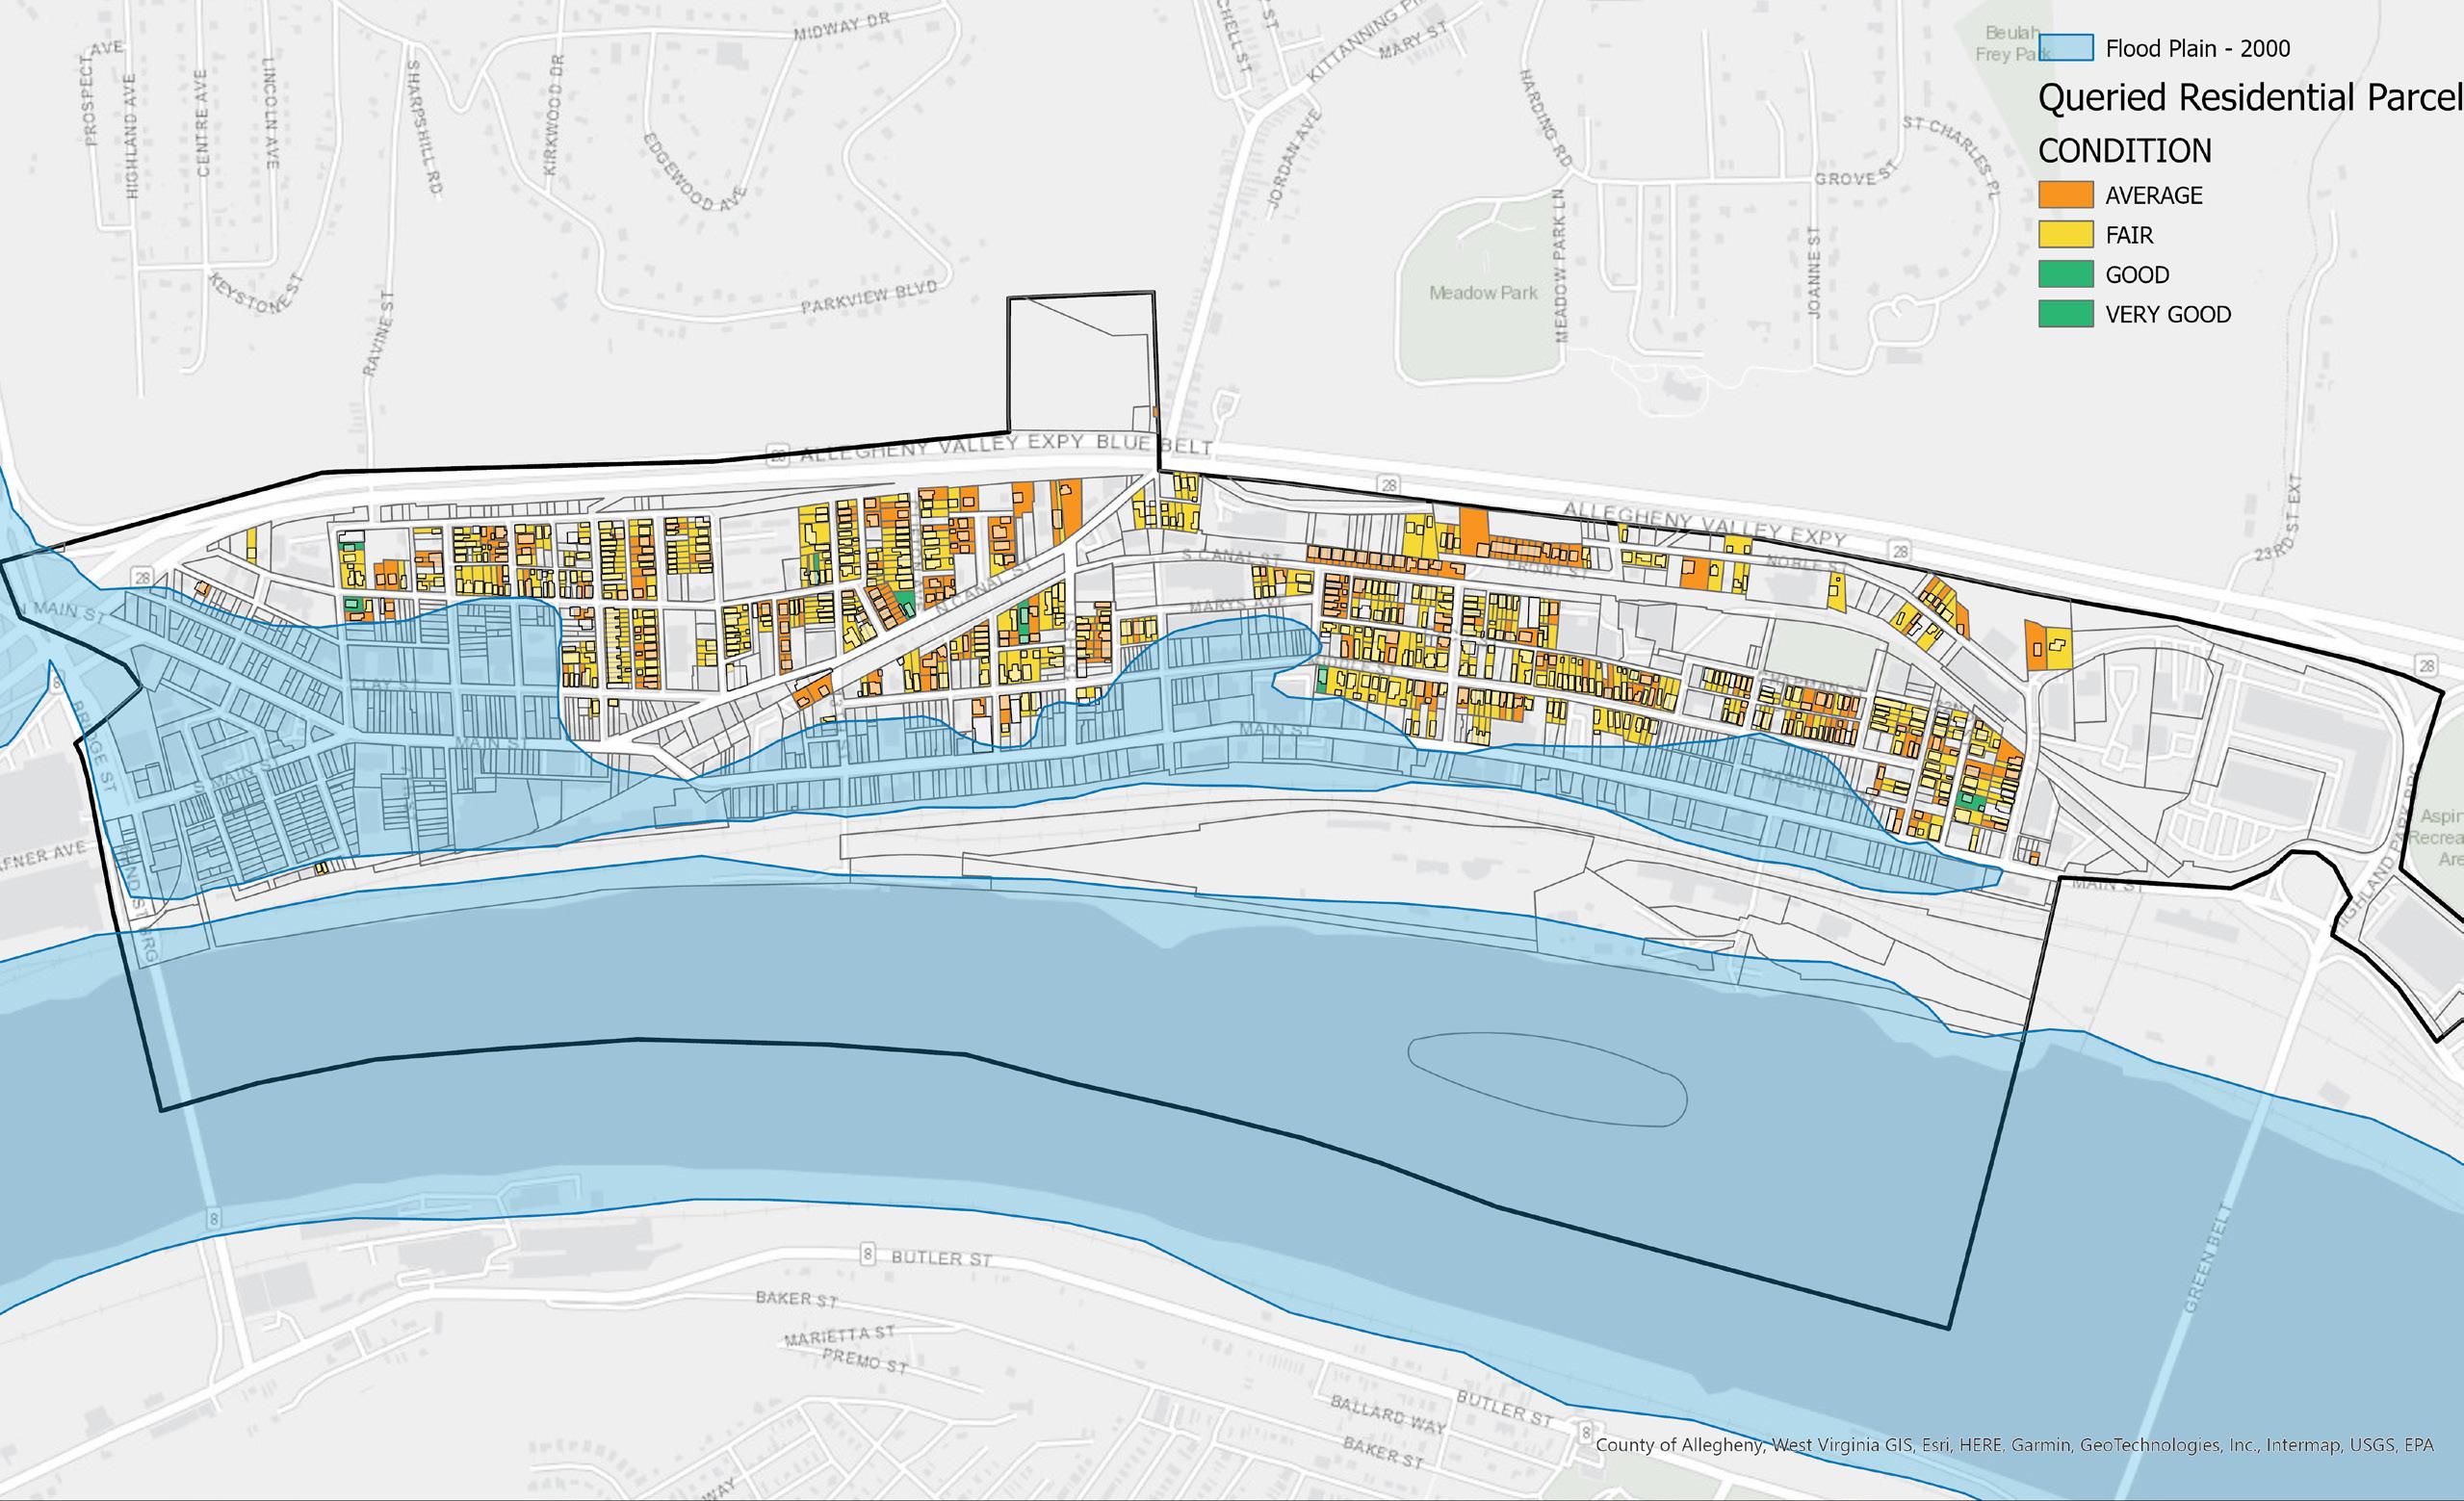
The six building characteristics and related subcategories can be seen on the adjacent page, and example analysis maps for Millvale, Etna, and Sharpsburg are shown on the following spread. These maps are also included in Appendix D.
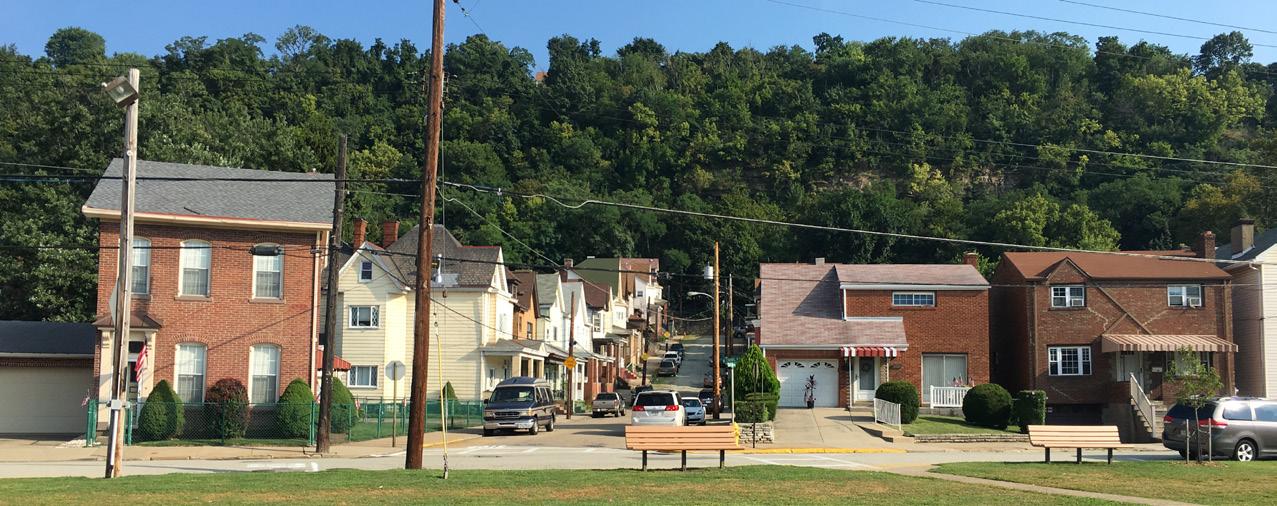
Analysis of the number of residential units, dwelling type, square footage, building age, condition, presence of heating and air conditioning systems, and exterior finish.
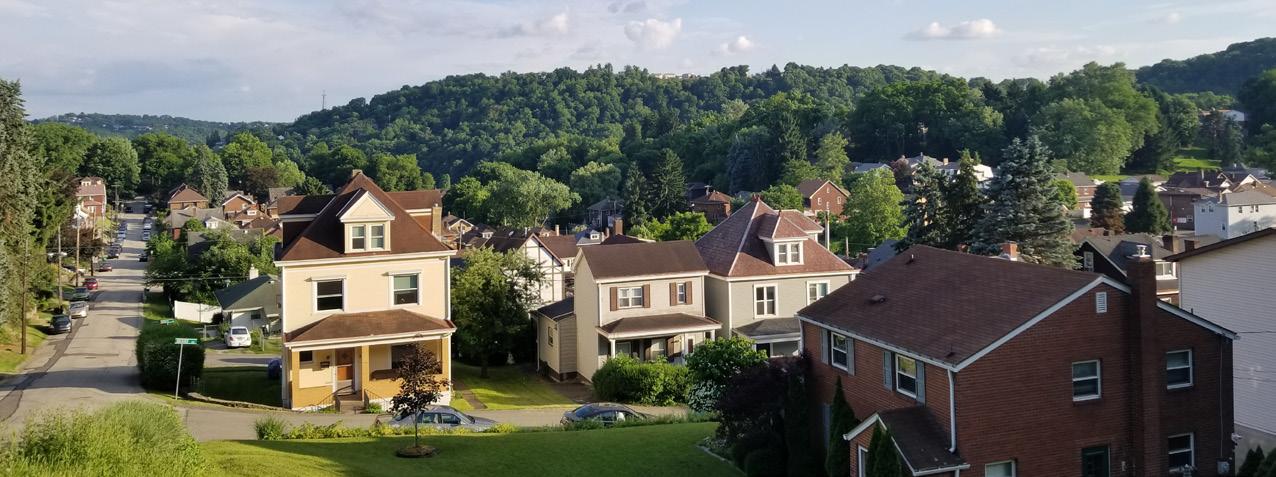

MILLVALE | DWELLING TYPE
MILLVALE | SQUARE FOOTAGE
MILLVALE | BUILDING CONDITION
ETNA | DWELLING TYPE


ETNA | SQUARE FOOTAGE
ETNA | BUILDING CONDITION
SHARPSBURG | DWELLING TYPE


SHARPSBURG | SQUARE FOOTAGE
SHARPSBURG | BLDG CONDITION


Through this study it was found that Millvale, Etna, and Sharpsburg share many similarities in their building stock. However, there are notable differences that can be seen in the statistics below.
NOTE: The following statistics only include the properties that were analyzed as part of this study. These statistics are associated with the actual properties for which Duquesne Light and Peoples Gas provided utility data. There may be residential properties that were not included in the data analysis and are therefore not included in the following statistics.
74% of houses are single family detached houses

1,613 ft.2 is the average house size
65% of houses are in below average condition
Single Family
Two-Family; Rowhouse; Townhouse
Three-Family; Four-Family

Very Good, Good Average Fair Poor, Unsound, Very Poor
building
3,468 households in the Triboro Ecodistrict 5,595,341 ft.2 total square footage ~ 87,942 MMBTU of electricity consumption ~ 318,954 MMBTU of natural gas consumption

109 years is the average house age (in 2022)
79% of houses have heat with no central air conditioning
68% of houses have a frame exterior
IN TOTAL

1,160 households
1,780,528 ft.2 total square footage
~ 32,846 MMBTU of electricity consumption


~ 102,108 MMBTU of natural gas consumption
THE AVERAGE HOME


1908 average year built
1,535 ft.2 average size
76 average energy use intensity (kBTU/sf)
49% of houses are in below average condition
Millvale Borough Boundary


VERY GOOD GOOD AVERAGE FAIR POOR
VERY POOR UNSOUND


IN TOTAL
1,247 households

1,932,411 ft.2 total square footage
~ 29,262 MMBTU of electricity consumption


~ 116,328 MMBTU of natural gas consumption
THE AVERAGE HOME


1918 average year built
1,550 ft.2 average size
75 average energy use intensity (kBTU/sf)
67% of houses are in below average condition


IN TOTAL
1,061 households


1,882,402 ft.2 total square footage
~ 25,834 MMBTU of electricity consumption


~ 100,518 MMBTU of natural gas consumption
THE AVERAGE HOME


1910 average year built
1,774 ft.2 average size
67 average energy use intensity (kBTU/sf)
84% of houses are in below average condition
Sharpsburg Borough Boundary


VERY GOOD GOOD AVERAGE FAIR POOR
VERY POOR UNSOUND
What is the EUI of the average home in the northeast United States?


45.2 average energy use intensity (kBTU/sf)
What is the EUI of the average home in the Triboro Ecodistrict?
72.7 average energy use intensity (kBTU/sf)


That is 60% higher than the average northeast U.S. home!

The charts on the following pages summarize the Duquesne Light and Peoples Gas utility data analysis performed by the consultant team. The top part of the charts indicate the average energy use per square foot (EUI) for houses that possess the listed building characteristic subcategories, organized by the three communities. Energy use per square foot per year, also known as Energy Use Intensity (EUI) is a useful indicator to compare energy consumption in different buildings because it normalizes energy consumption across buildings of varying sizes. The average EUI for homes located in the northeast United States according to the EIA 2015 Residential Energy Consumption Survey is 45.2 kBTU/sf/yr. The average EUI for homes in the Triboro Ecodistrict is 72.7 kBTU/sf/yr, 60% higher than the average home in the northeast
The following pages include charts with average EUI summaries and percent of total residential site energy consumption by building characteristic subcategory and community. This is followed by hypotheses developed by the consultant team and the Triboro Ecodistrict at the onset of the project. The hypotheses are focused on which building characteristic subcategories would consume the most energy per square foot, and would therefore be good candidates for targeted energy conservation improvements. These hypotheses were informed by previous high-level analysis, on-the-ground observations, personal experience, and logical reasoning. This is followed by the data analysis findings that tested the hypothesis, and the resulting consultant recommendations.
While the data analysis was performed with the best available data and methods available to the consultant team at the time, there are limitations. Home energy consumption is influenced by a variety of factors and is not limited to the six building characteristics analyzed in this study. Additional factors include resident behavior, appliances, payment responsibility for utility bills, number of household members, primary heating fuel, and much more that was not analyzed as part of this study.
What is EUI?
EUI stands for “Energy Use Intensity”. It is the energy consumed per square foot, per year (kBTU/sf/yr).
A HIGHER EUI means...
the home consumes MORE energy than its peers.
Collection and analysis of actual energy consumption data, analyzed according to the building energy characteristics.
A LOWER EUI means...
the home consumes LESS energy than its peers, and is closer to the Triboro Ecodistrict’s goal of net zero carbon-based energy by 2050.
Average EUIs for building characteristic subcategories that exceed the average EUI for the Triboro Ecodistrict by 10% are highlighted in red below and on the following pages. These houses have the biggest opportunity to reduce their annual energy consumption, from an EUI perspective. The bottom portion of the charts indicate what percentage of the total residential site energy consumption can be attributed to buildings with the indicated building characteristic subcategories. Percentages for building characteristic subcategories that exceed 50% are highlighted in green. The Triboro Ecodistrict has the most opportunity to reduce community-wide energy consumption by targeting those specific building characteristic subcategories with energy conservation initiatives.
SingleFamilyDetachedHouse lessthan1,000ft.
VeryGood,Good Rowhouse,Townhouse, orTwo-FamilyHouse 1,000-2,000ft.
Average Three-FamilyorFour-FamilyHouse greaterthan2,000ft.
Fair Poor,Unsound, orVeryPoor
Building characteristic subcategories with the biggest opportunity for improvement (EUI is at least 10% greater than the Triboro Ecodistrict average)
Building characteristic subcategories that account for more than 50% of total energy consumption
Single Family Detached House
Hypothesis: Single family detached houses will have the highest EUI.
Findings:
• The EUI for single family detached houses is consistently higher than other dwelling types across the Triboro Ecodistrict. Rowhouses, townhouses, and two-family houses have the second highest EUI, with 3+ family houses having the lowest EUI.
• The majority of houses in the Triboro Ecodistrict are single family detached houses, with Etna containing the highest proportion of single family detached houses.
Recommendations:
• Houses that share a wall with another household presumably consume less energy per square foot because heat loss through shared walls is minimized. Encourage density and dwelling types with shared walls for future housing development to minimize heat loss and EUI.


Hypothesis: Smaller houses will have the highest EUI.
Findings:
• The EUI for houses under 1,000 ft.2 are consistently higher than larger houses.
• In Etna and Sharpsburg, medium houses have the second highest EUI and large houses have the lowest EUI. In Millvale, this is reversed, with houses between 1,000 - 2,000 ft.2 having the second highest EUI.
• The majority of houses in the Triboro Ecodistrict are between 1,000 to 2,000 ft.2, with Etna having the highest proportion of houses in this range.
Recommendations:
• Small houses typically have a smaller building envelope, meaning it is less costly to insulate the building envelope compared to a larger house. Weatherization programs should focus on tightening up the building envelope for small houses, especially single family detached houses, where improvements could have a significant impact.
Hypothesis: Houses in very good and good condition will have the lowest EUI.
Findings:
• The EUI for houses in Millvale are fairly consistent independent of building condition. This shows that housing condition may not be a significant factor influencing energy consumption in Millvale.
• In Etna and Sharpsburg, houses in average condition have the highest EUI. In Etna, houses in poor, very poor, or unsound condition have the lowest EUI and in Sharpsburg, houses in very good and good condition have the lowest EUI. Similar to Millvale, this shows that housing condition may not be a significant factor influencing energy consumption.
• The majority of the houses in the Triboro Ecodistrict are in average or fair condition, where average EUIs are within a 21 kBTU/sf/yr range.
Recommendations:


• Energy conservation and weatherization programs should focus on houses in below average condition, because they make up a significant proportion of total residential site energy consumption (especially in Sharpsburg). This will not only reduce energy consumption but will improve quality of life for those living in houses whose conditions can be improved.
• Building condition as defined by the Allegheny County Property Assessments may not be an accurate judgment of building envelope condition as related to heat loss. The Triboro Ecodistrict could perform it’s own assessment or develop a checklist to assess building envelope condition, which would be a more accurate categorization.
Hypothesis: Older buildings will have the highest EUI.
Findings:
• Houses built between 1921 and 1970 have the highest EUI, and houses built since 1970 have the lowest EUI across the three communities.
• The majority of houses in the Triboro Ecodistrict were built prior to 1920, with Millvale containing the highest proportion of pre-1920 houses. Etna comes closest to an equal number of houses built prior to and after 1920.
Recommendations:


• The findings indicate that a certain dwelling type or construction practice may have been more prevalent prior to 1920, such as dwellings that share a wall, which has contributed to these houses having a lower EUI. Further investigation may provide greater insights. Energy efficiency initiatives should focus on reducing energy consumption in older homes, especially those built from 1921 to 1970.
• While they only compose a small proportion of the total energy consumption and number of houses in the Triboro Ecodistrict, houses built since 1970 have likely employed construction practices that have contributed to their lower EUI. Energy efficiency best practices, high insulation levels, density, and dwelling units with shared walls are all recommended for future new construction and significant renovations.


Hypothesis: Homes with central heat and air conditioning will have a higher EUI.
Findings:
• Houses with central heat and air conditioning have a higher EUI than houses with just central heat, although the increase is minor in Millvale and Etna. The majority of houses in the Triboro Ecodistrict have central heat only.
• A small number of houses have a floor furnace, unit heat, or other heating system. In Millvale and Etna, those homes had the lowest EUI. Sharpsburg had the greatest number of houses heated by these systems, which had the highest EUI across system types.

Recommendations:
• Houses that have central heat but no central air conditioning in southwestern Pennsylvania either use window or standalone air conditioning units, or do not have air conditioning at all. System upgrade programs or incentives could be used to upgrade homes to energy-efficient systems with central heat and air conditioning, that will also improve thermal comfort.
• As a heating-dominated climate, Pittsburgh homes consume more energy with heating than air conditioning over the course of the year, although the energy consumed for air conditioning will continue to increase as the climate changes. Energy conservation programs should focus on improving the efficiency of HVAC systems, improving thermal comfort by ensuring houses are equipped with air conditioning, and improving system filtration to protect from poor outdoor air quality.
Hypothesis: Frame houses will have the lowest EUI.


Findings:
• There appears to be no pattern with the relationship between house exterior finish and EUI. All average EUIs were within 15 kBTU/sf/yr of one another.
• The majority of houses in the Triboro Ecodistrict are frame.
Recommendations:

• While exterior finish does not necessarily have a significant impact on energy consumption, the consultant team believed it could provide insights into building construction practices. This does not appear to be the case and further investigation into housing construction practices is recommended.
• Weatherization initiatives that involve cavity-filled insulation should focus on houses with frame construction, because they will have the most area that can be filled with insulation. Initiatives that involve exterior rigid insulation should focus on houses with siding that is nearing it’s end of life. Houses with brick finishes are not good candidates for exterior rigid insulation.



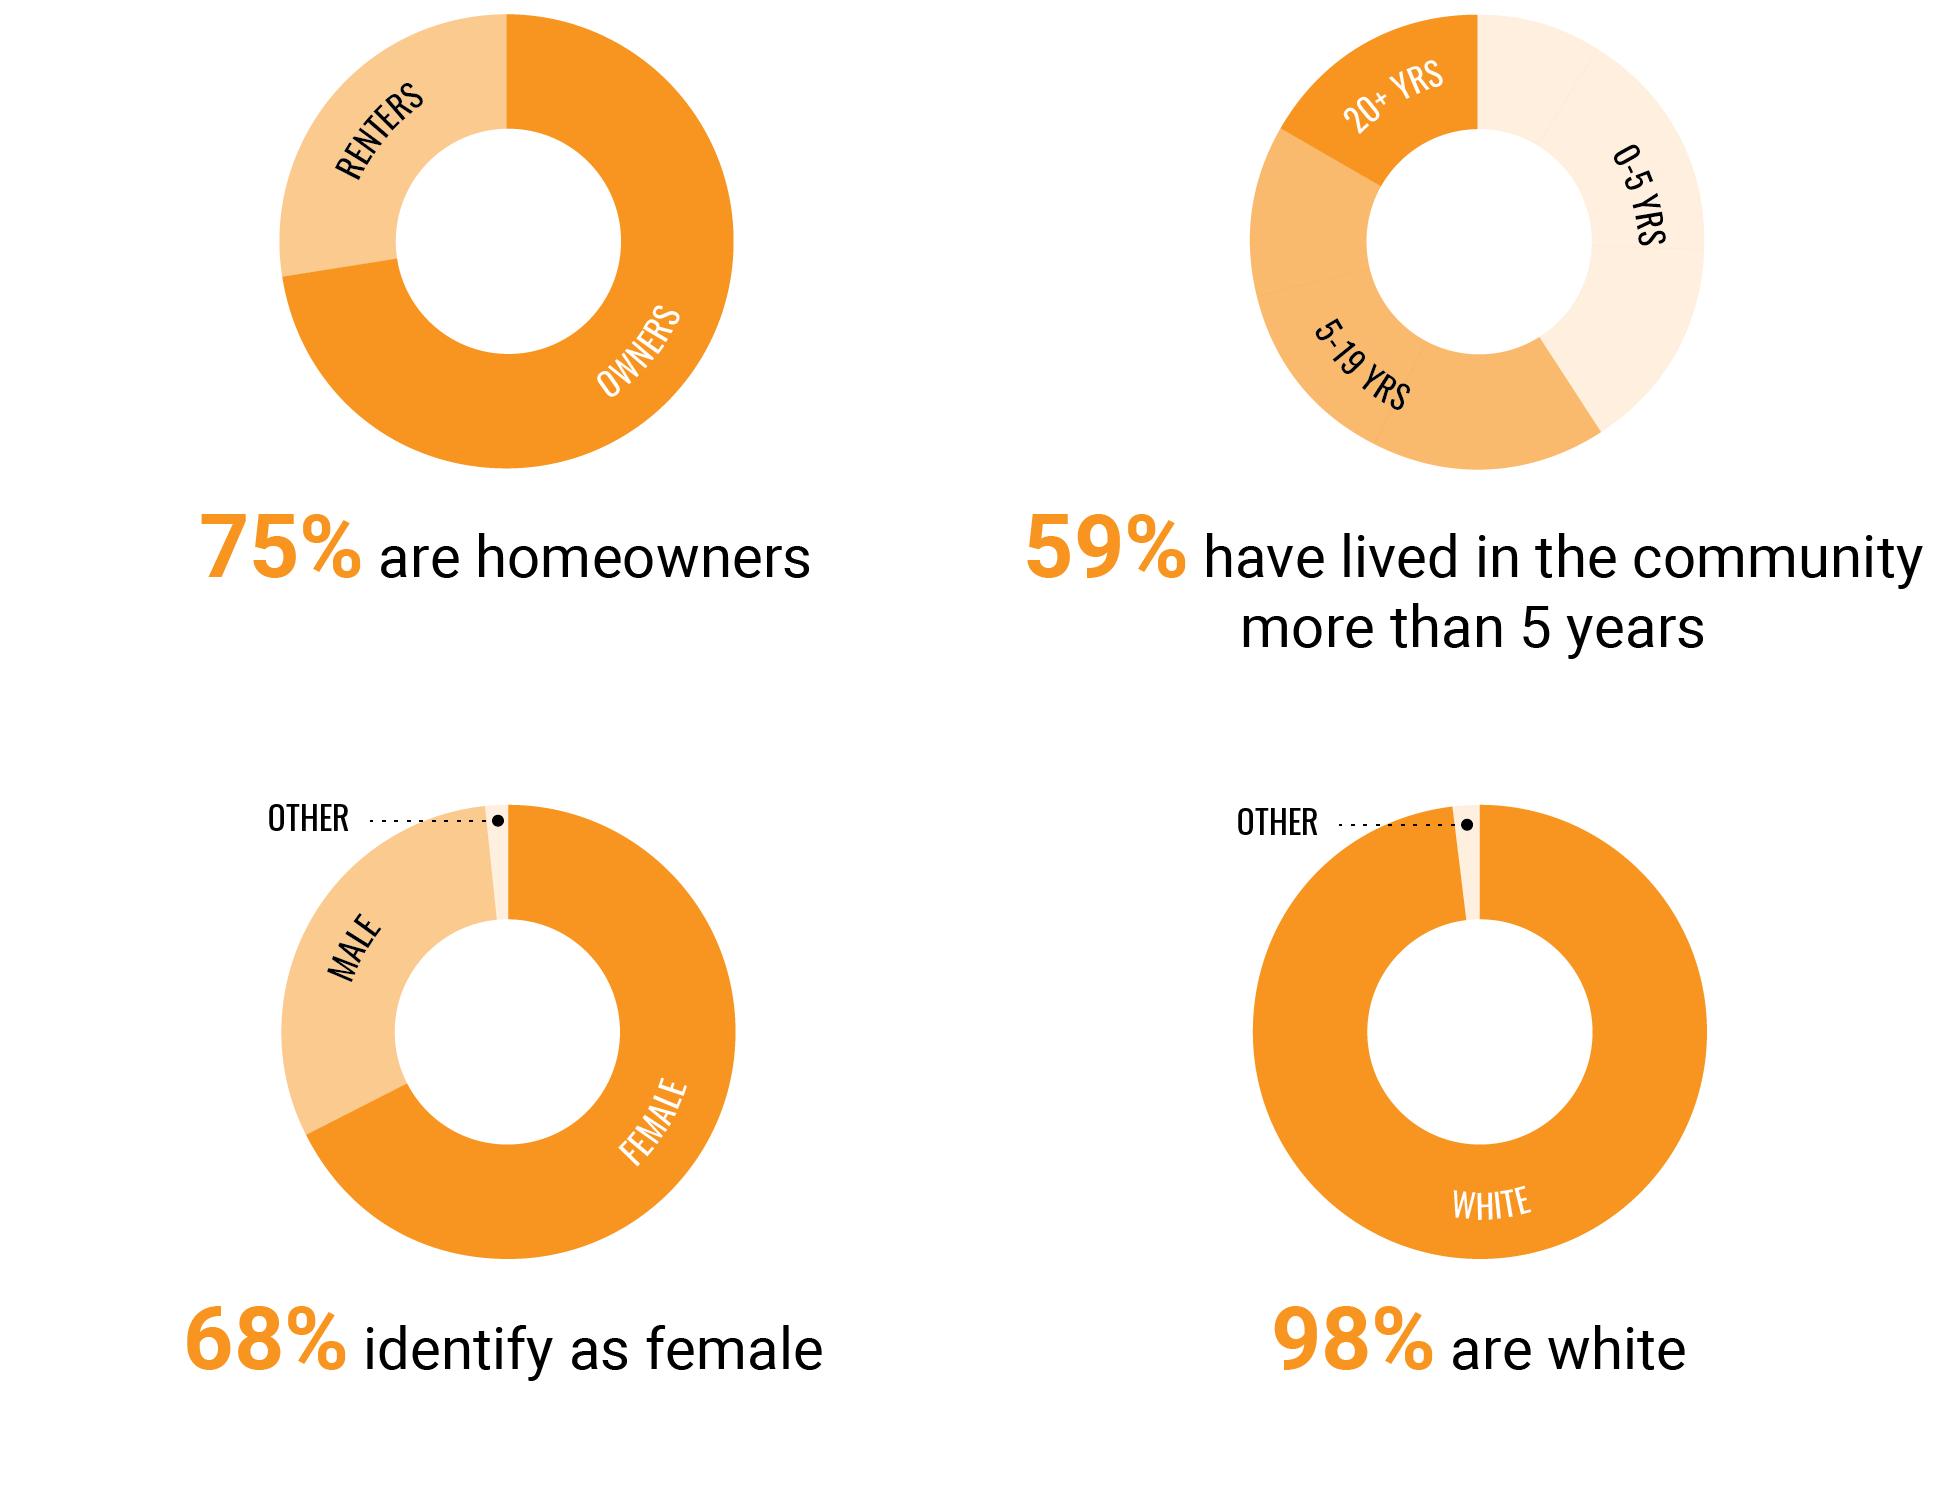
In collaboration with Sarah SanGiovanni, the consultant team and the Triboro Ecodistrict issued an energy use survey in the three communities in the summer of 2020. Response rates varied by community, and in total the survey received 75 responses. The majority of survey respondents own their home (72%), have lived in the community for more than 5 years (59%), identify as female (69%), and are white (98%). The survey respondents represent a range of household incomes and education levels. Key takeaways from the survey can be found below, and the complete survey responses can be found in Appendix E.
Resident survey to understand behaviors and perceptions related to residential energy consumption.
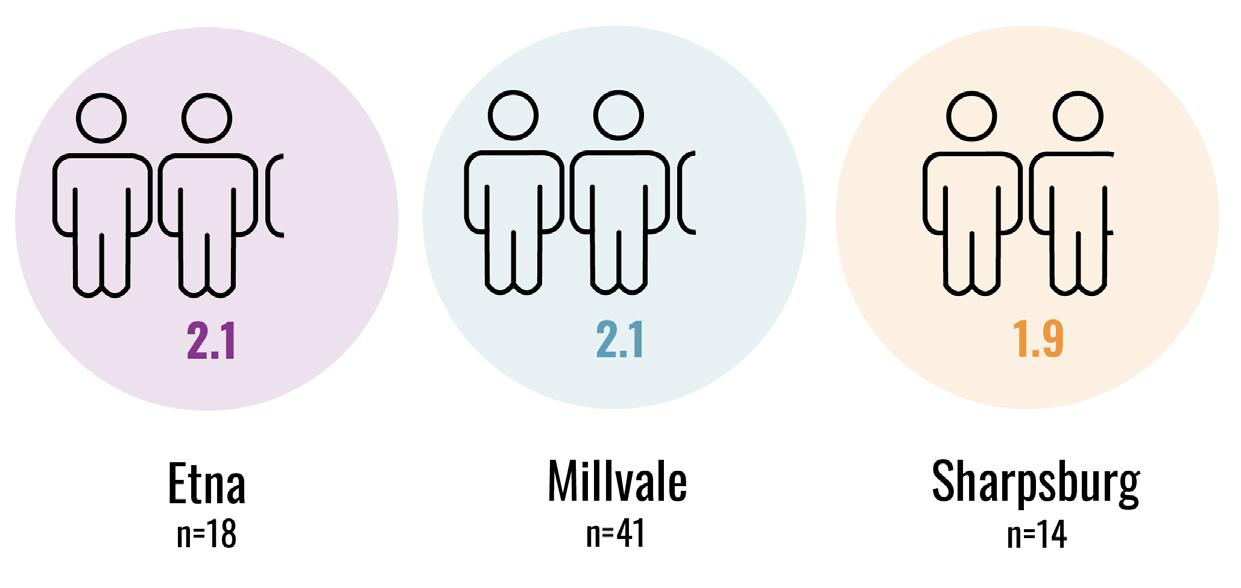
Q1. HOW MANY PEOPLE LIVE IN THIS HOME ON A DAILY BASIS?
On average, two people live in each household.
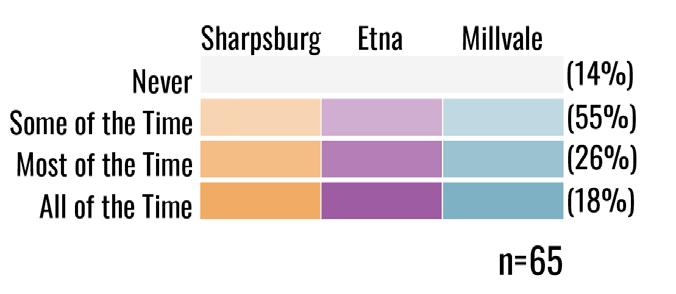
Q3. WHEN IT’S COLD OUTSIDE, HOW OFTEN DO MEMBERS OF YOUR HOUSEHOLD FIND YOUR HOME TO BE TOO DRAFTY?
Almost half of survey respondents feel their homes are too drafty at least “most of the time” when it is cold outside.
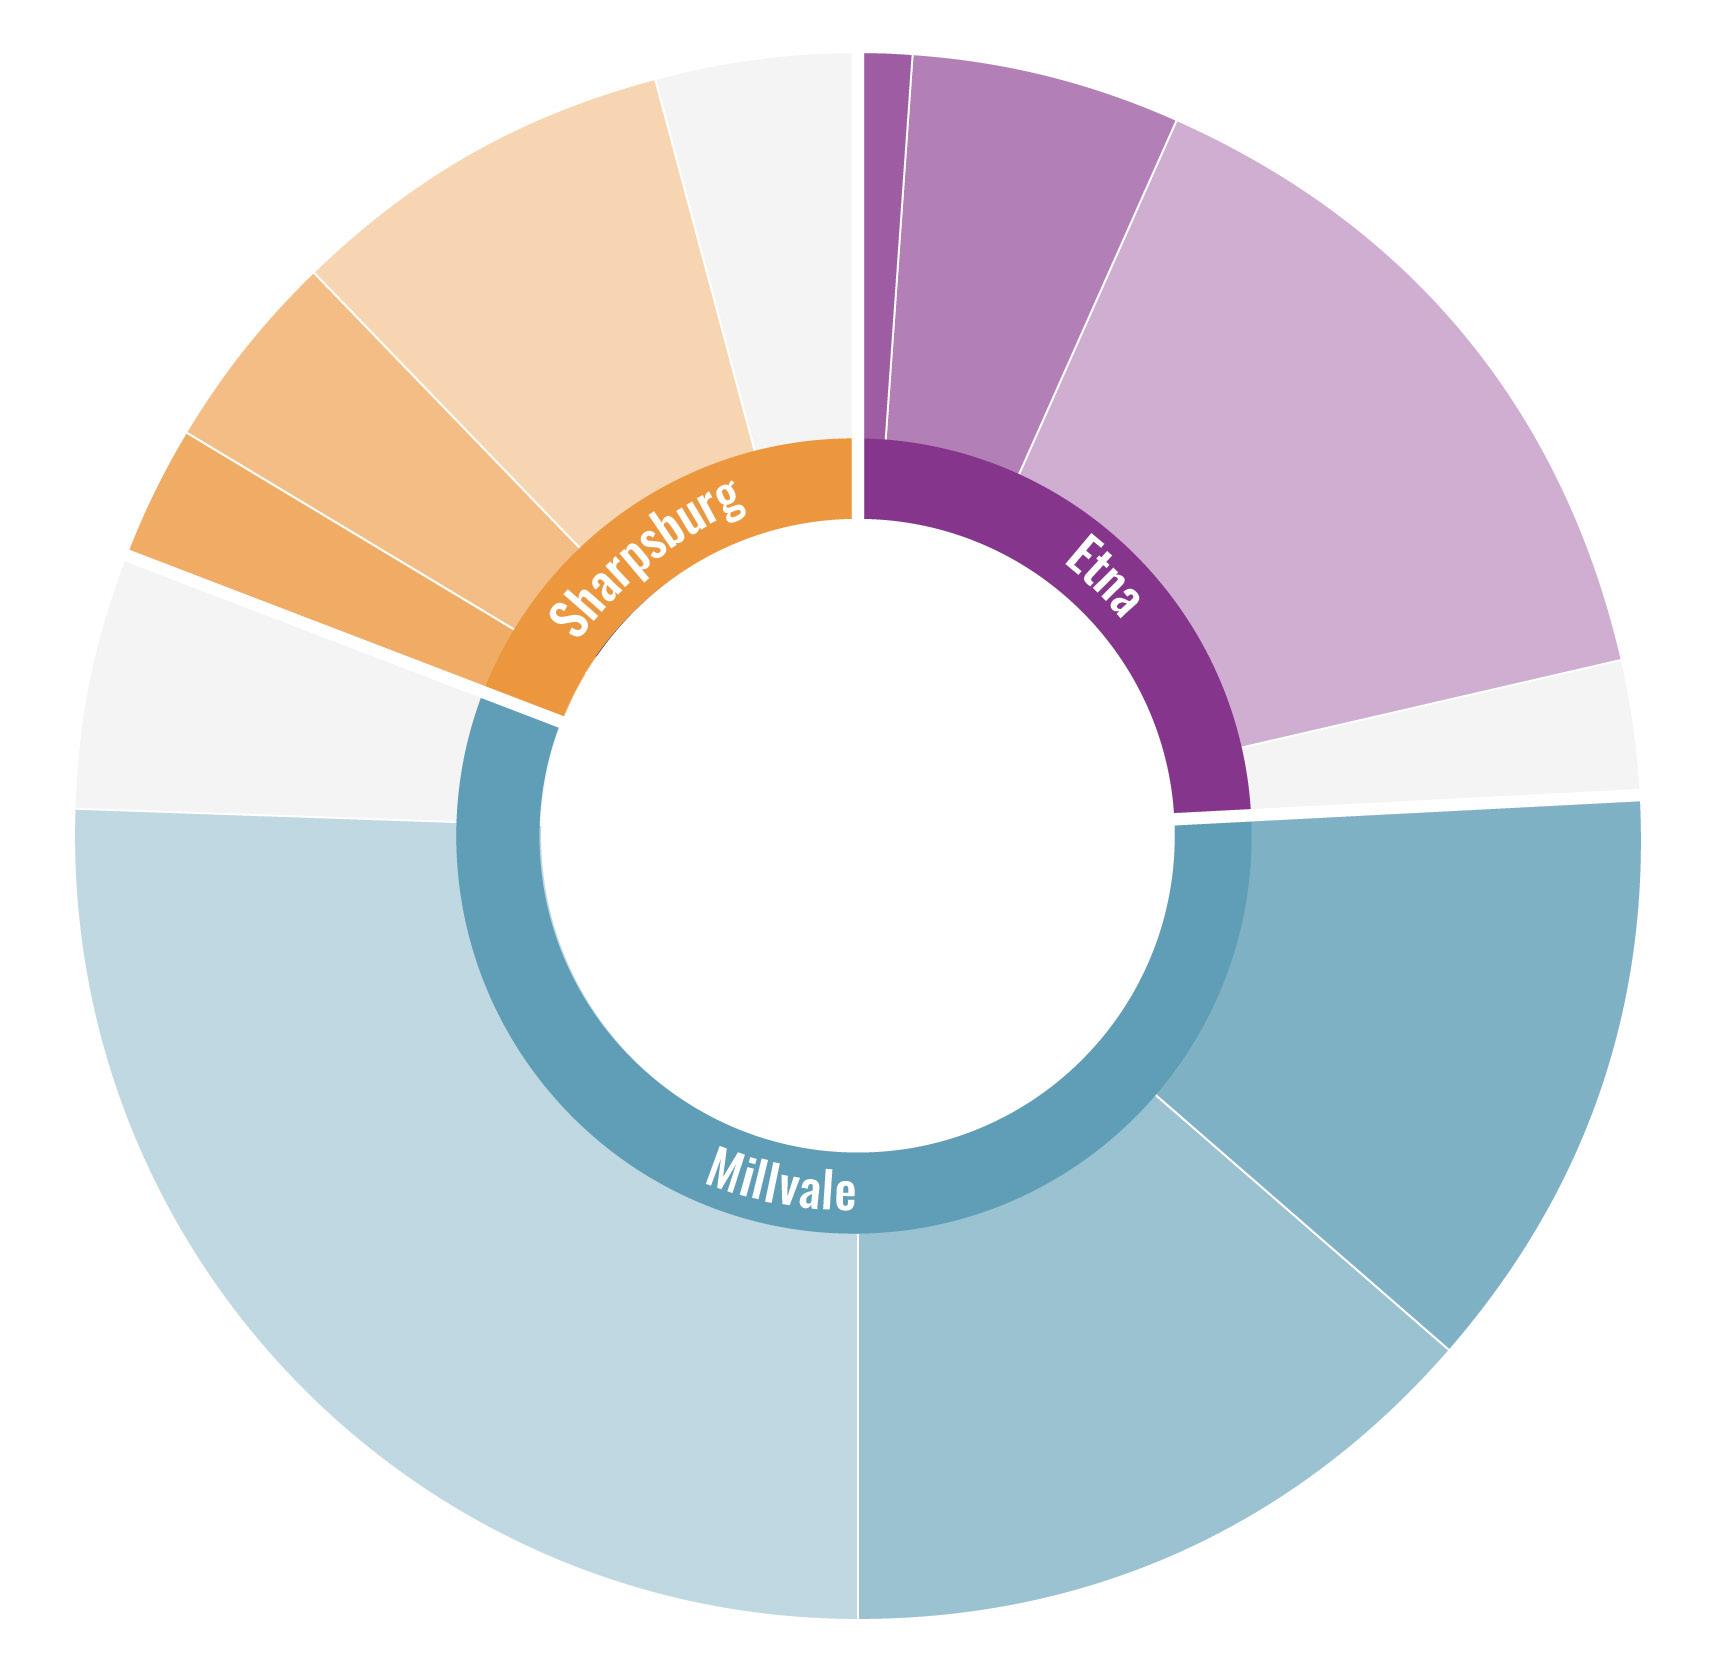
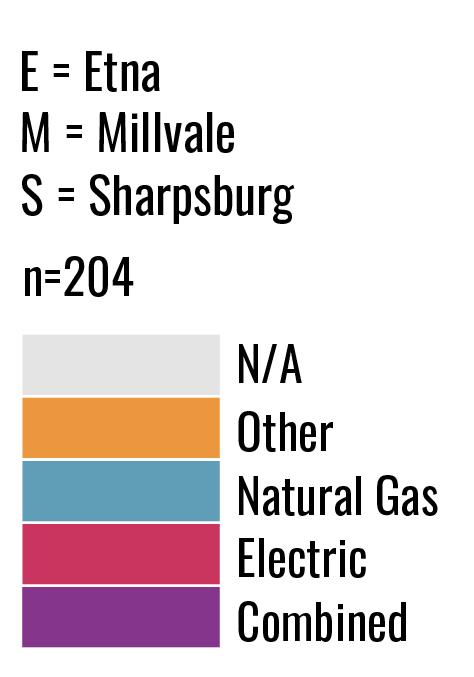
Q4. WHAT SOURCES OF ENERGY DO YOU USE IN YOUR HOME?
Natural gas is the most prevalent fuel source across the Triboro Ecodistrict, especially for heating and water heating.
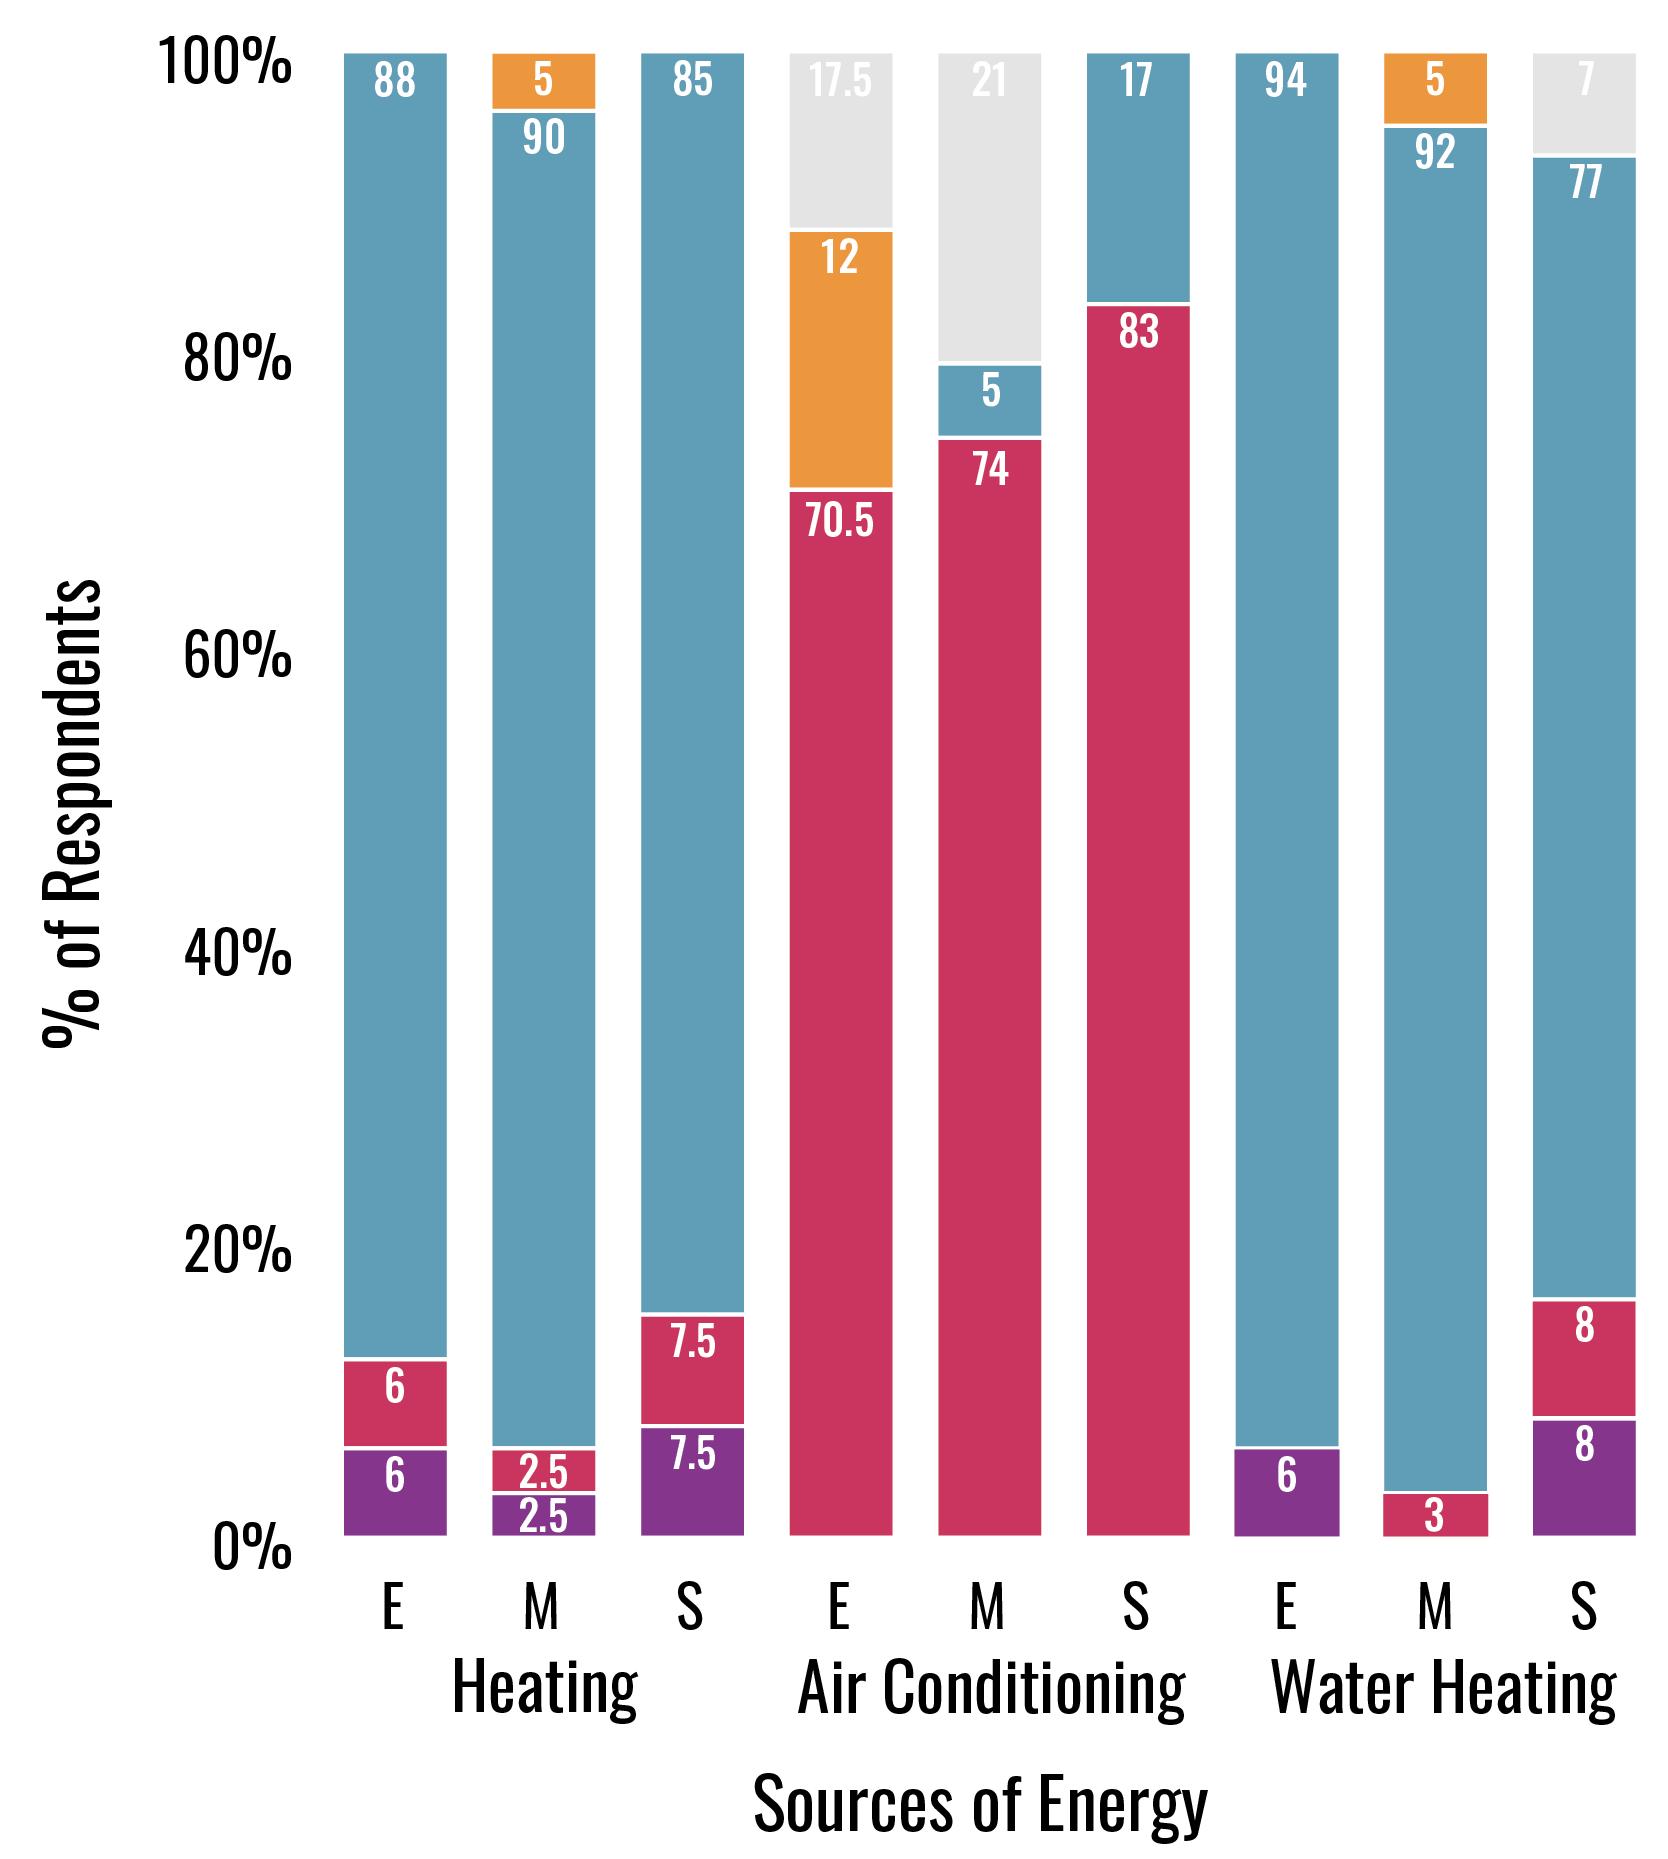
Some households do not have air conditioning.
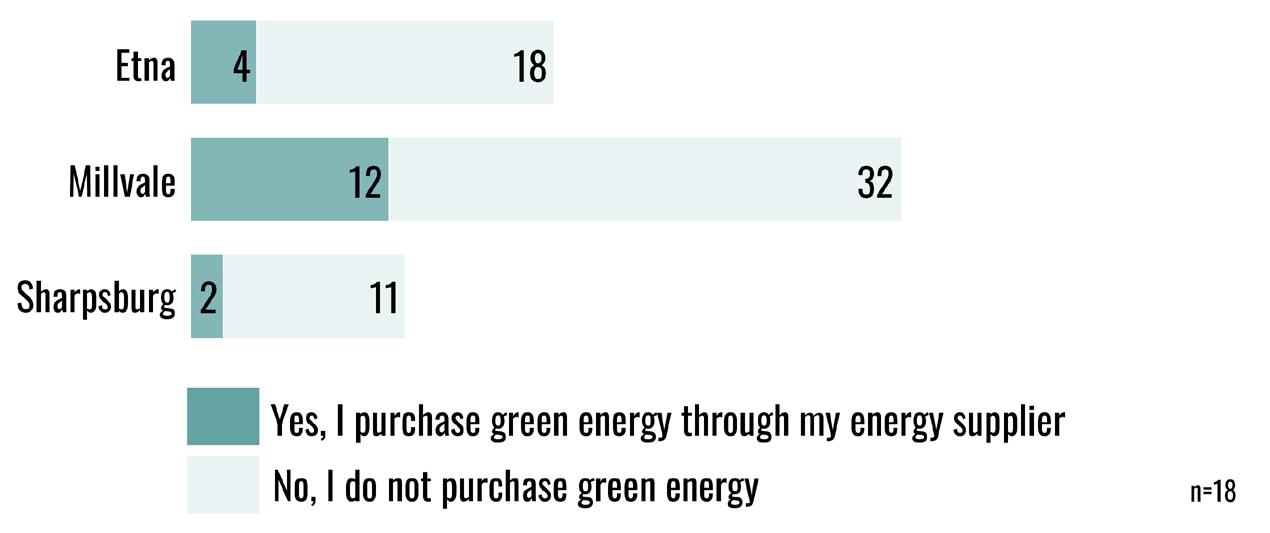
Q22. DO YOU USE ANY OF THE FOLLOWING RENEWABLE ENERGY OPTIONS? CHECK ALL THAT APPLY.
Millvale survey respondents are more likely to purchase green energy compared to Etna and Sharpsburg respondents.
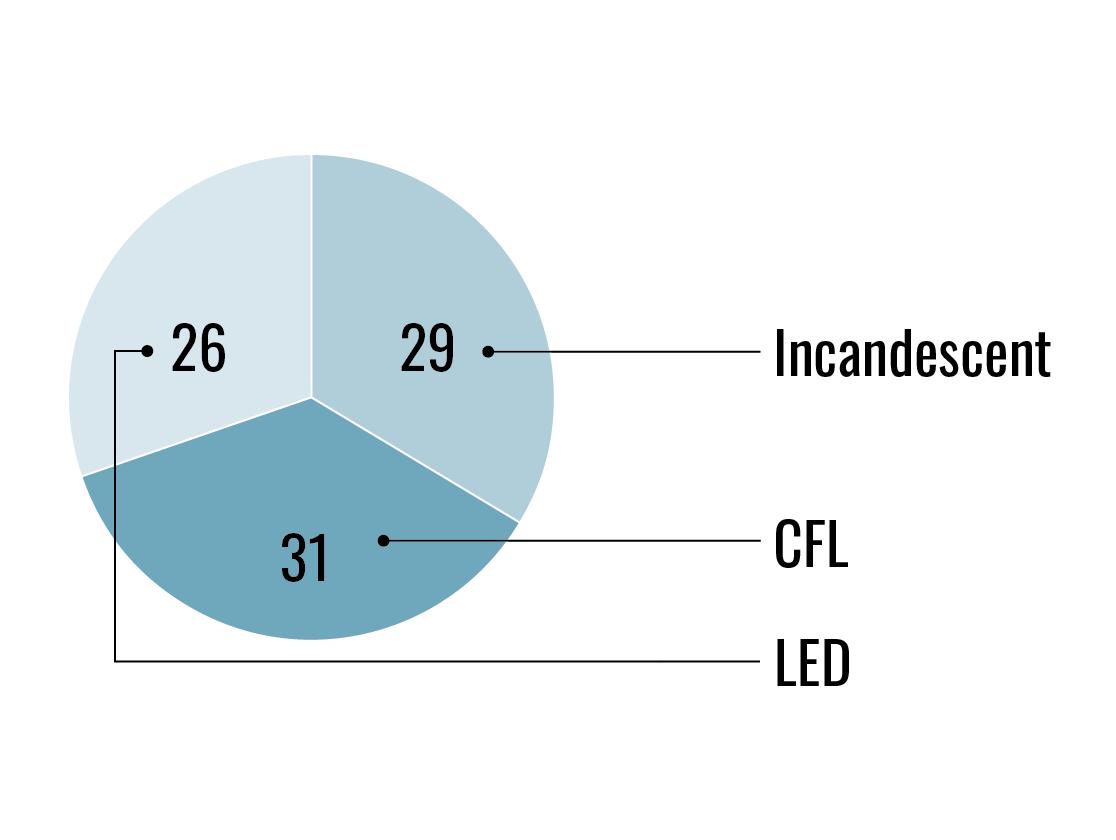
Q10. PLEASE INDICATE WHAT PORTION OF THE LIGHT BULBS INSIDE YOUR HOME ARE OF EACH TYPE:
TRIBORO (ALL)
Sharpsburg survey respondents lead in percentage of incandescent and LED bulbs, and Millvale leads in owning the highest percentage of CFL bulbs.
MILLVALE
Millvale survey respondents have fairly consistent use across the three lightbulb types, with slightly more CFL use.
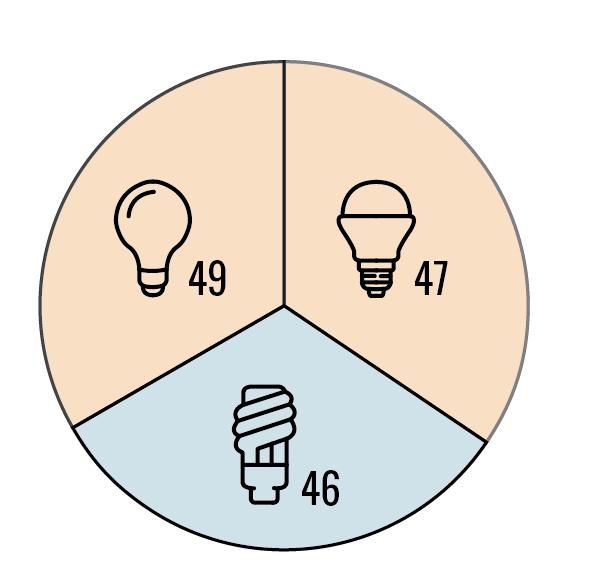
ETNA
Etna survey respondents use mostly CFL and LED bulbs, but at least half have some incandescent bulbs in their homes.
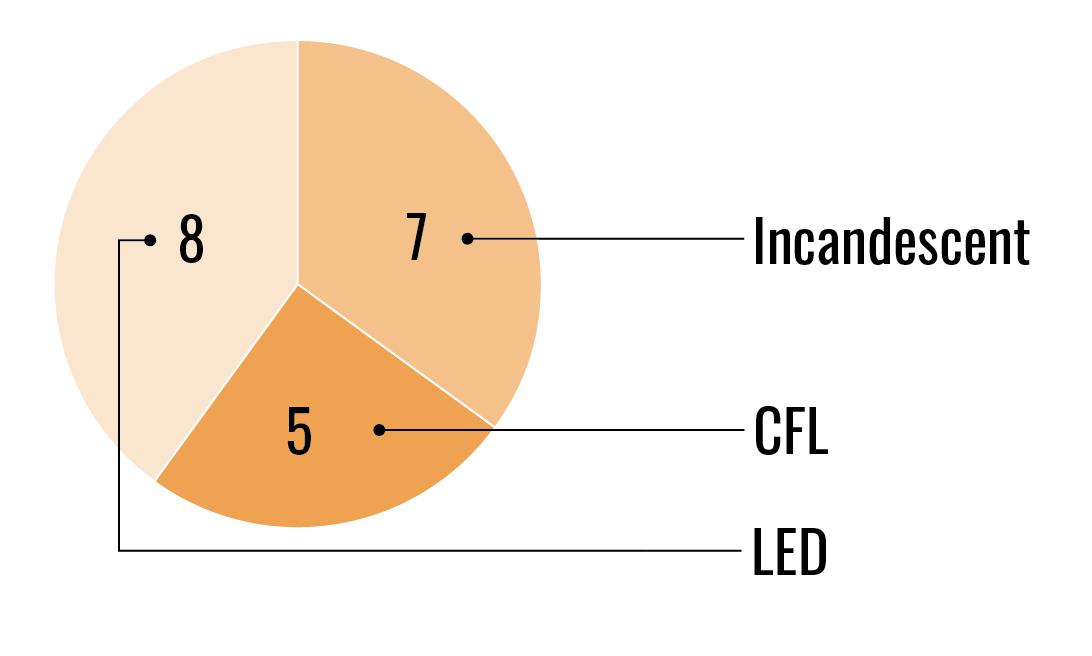
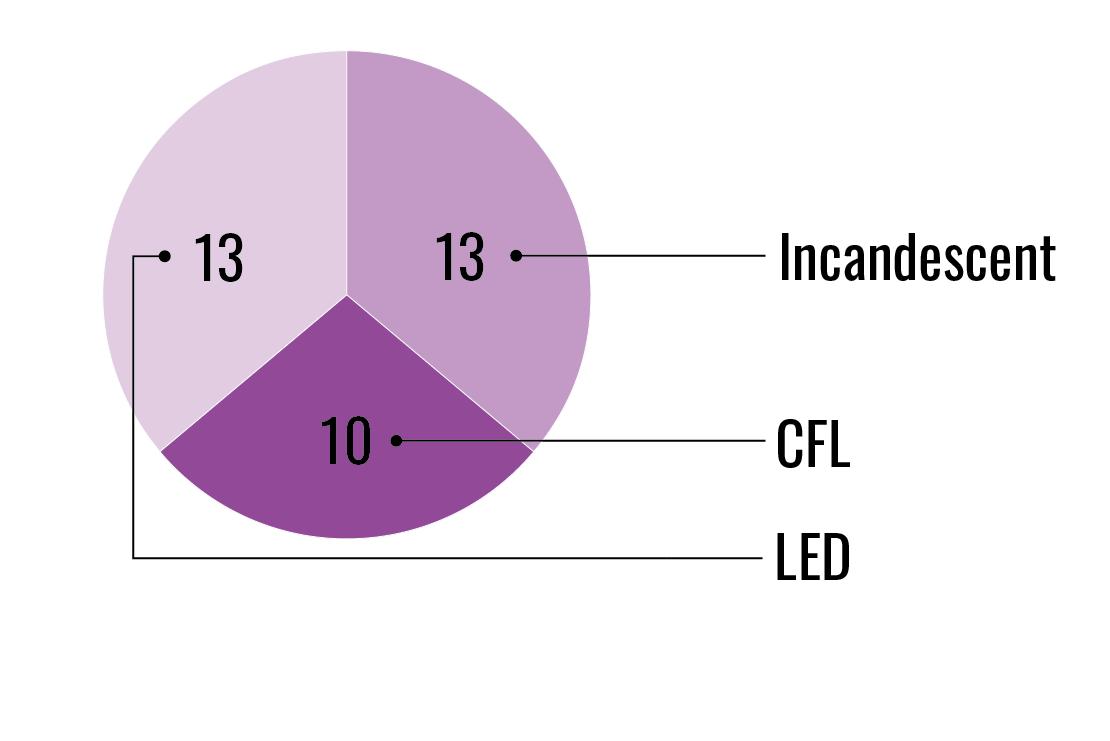
SHARPSBURG
Sharpsburg survey respondents use mostly LED and incandescent bulbs. They also have the highest percentage of LED use out of the three Boroughs.


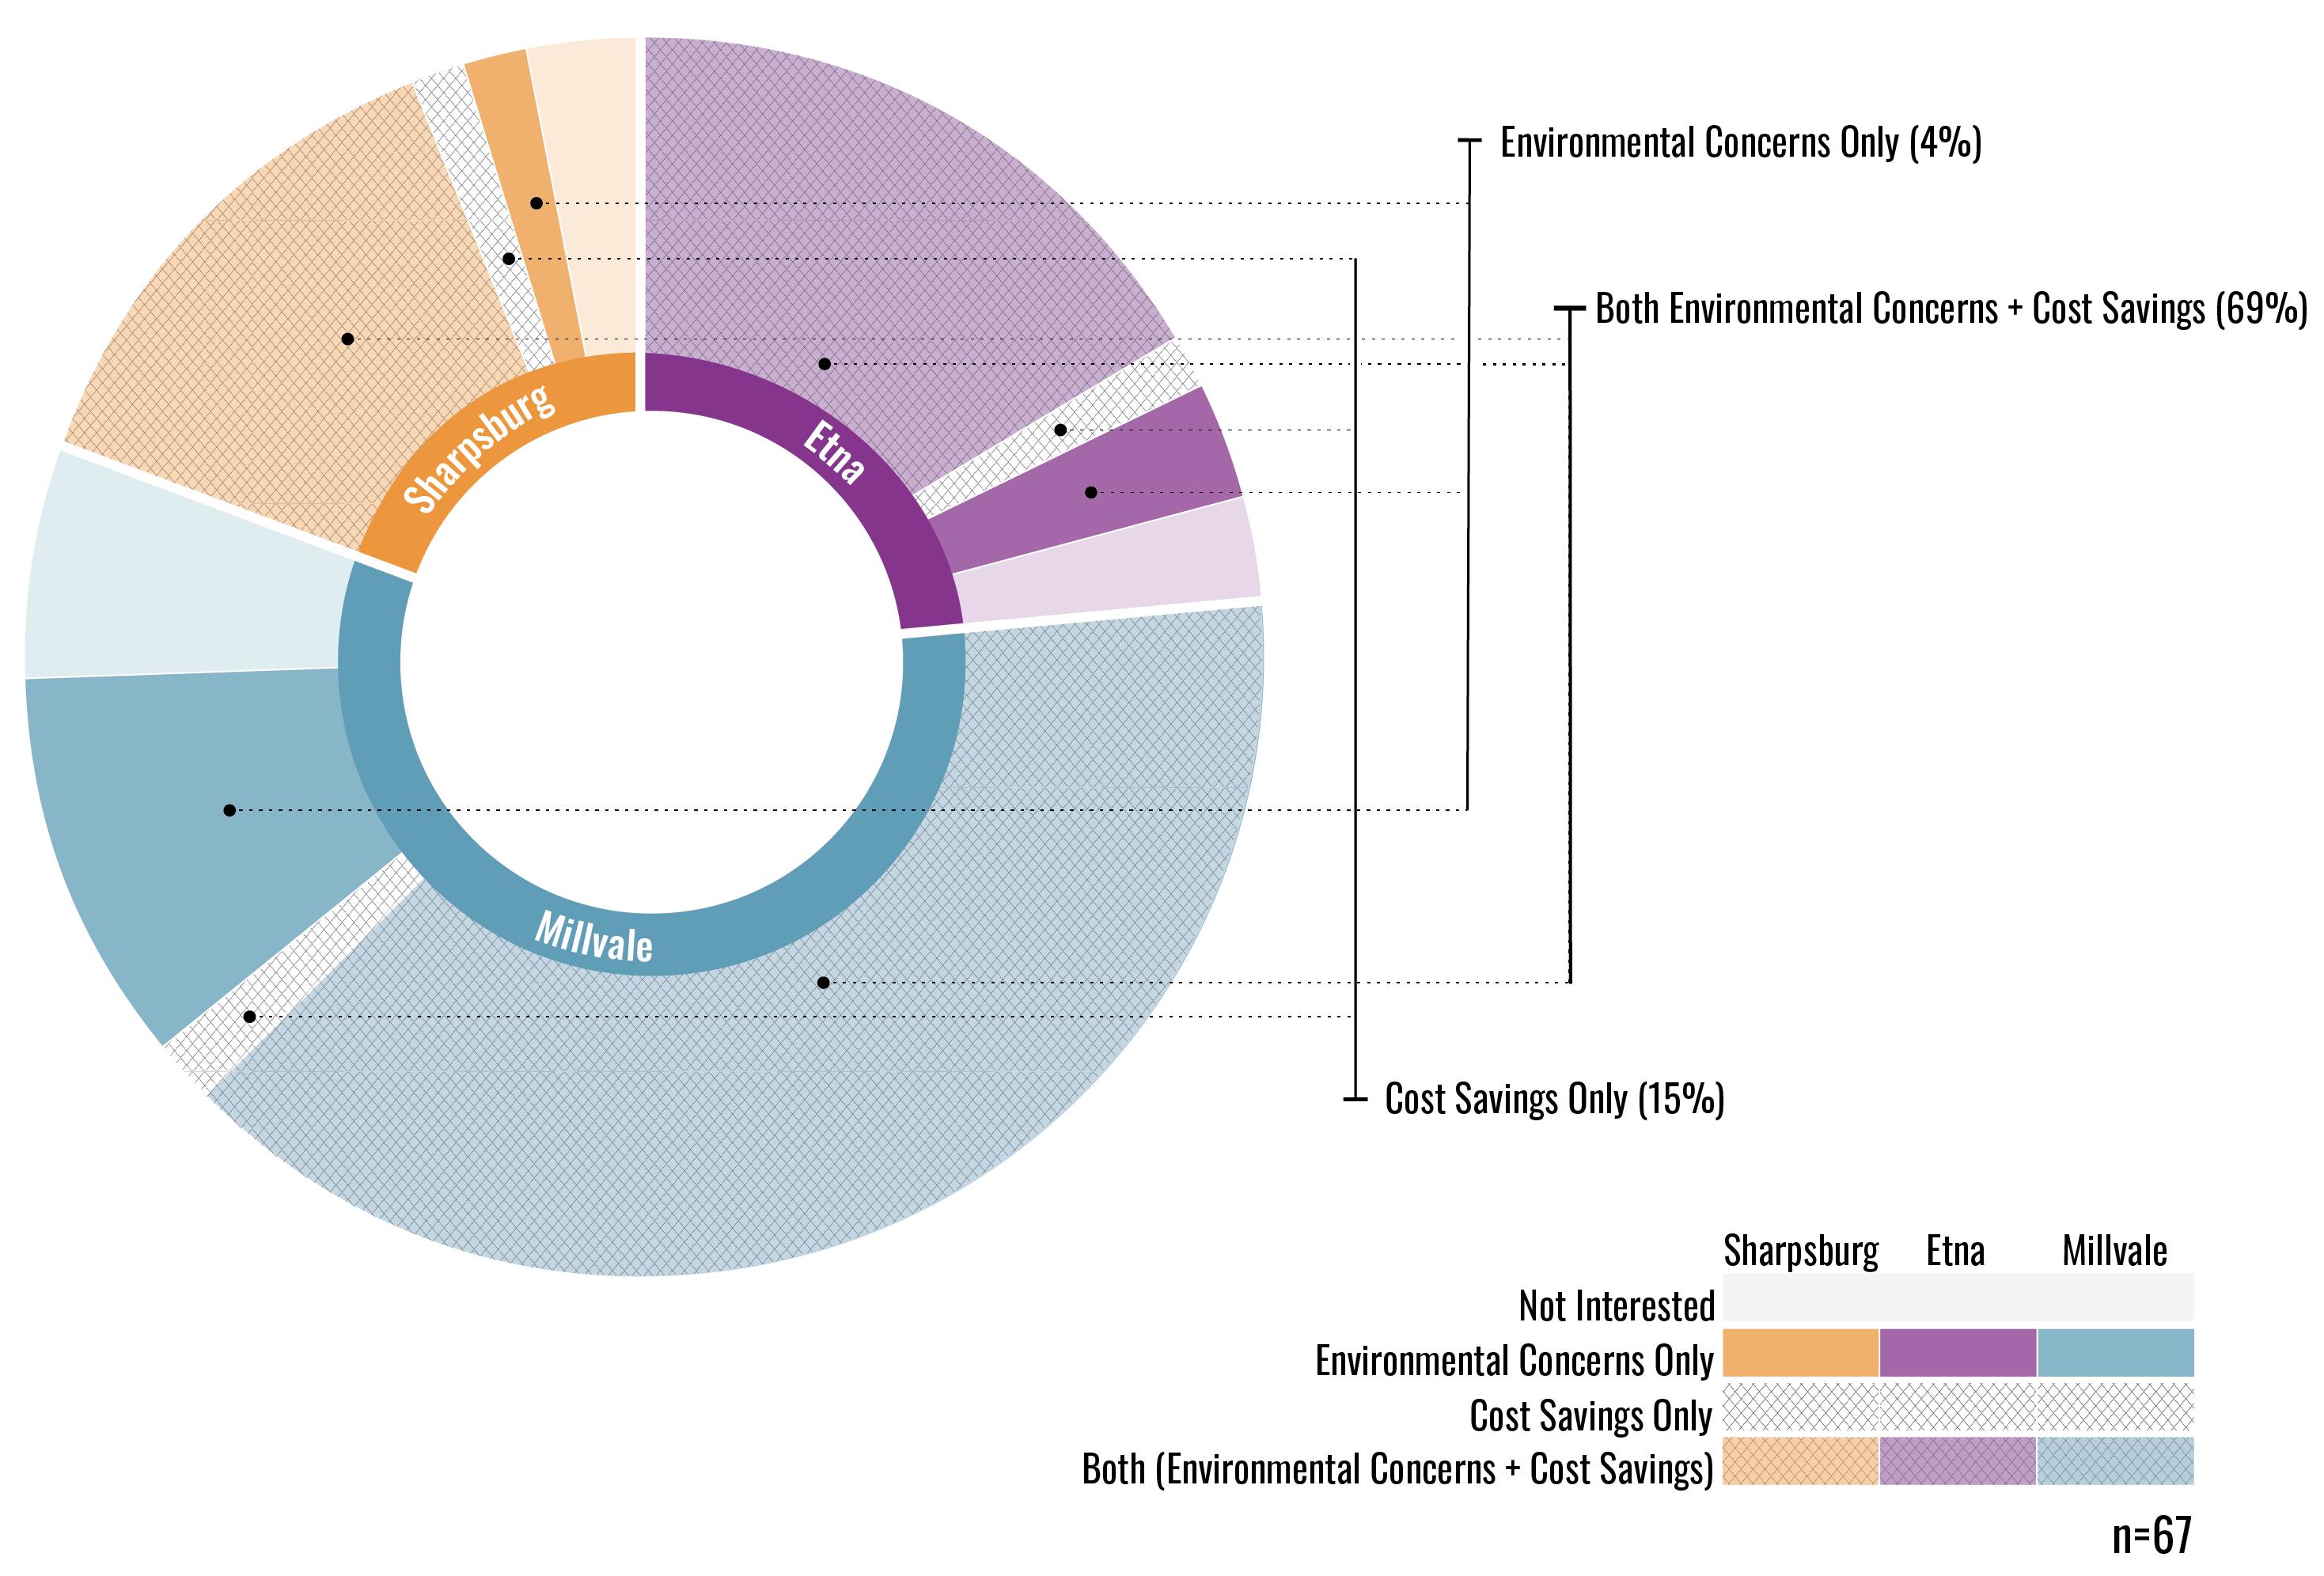
Q18. WHICH OF THE FOLLOWING STATEMENTS BEST DESCRIBES YOUR INTEREST IN ENERGY CONSERVATION IN YOUR HOME?
88% of survey respondents are interested in energy conservation to save money on energy bills in addition to environmental concerns.
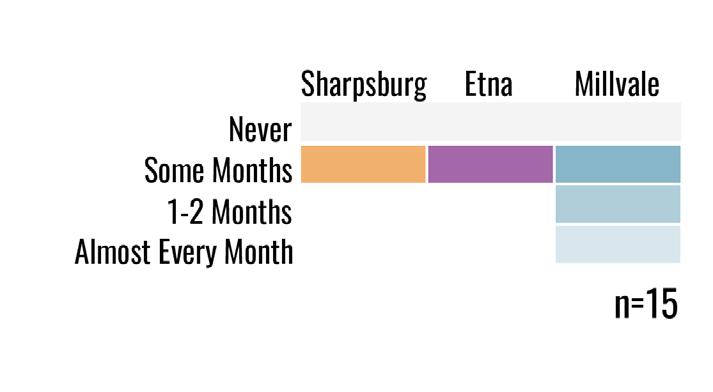
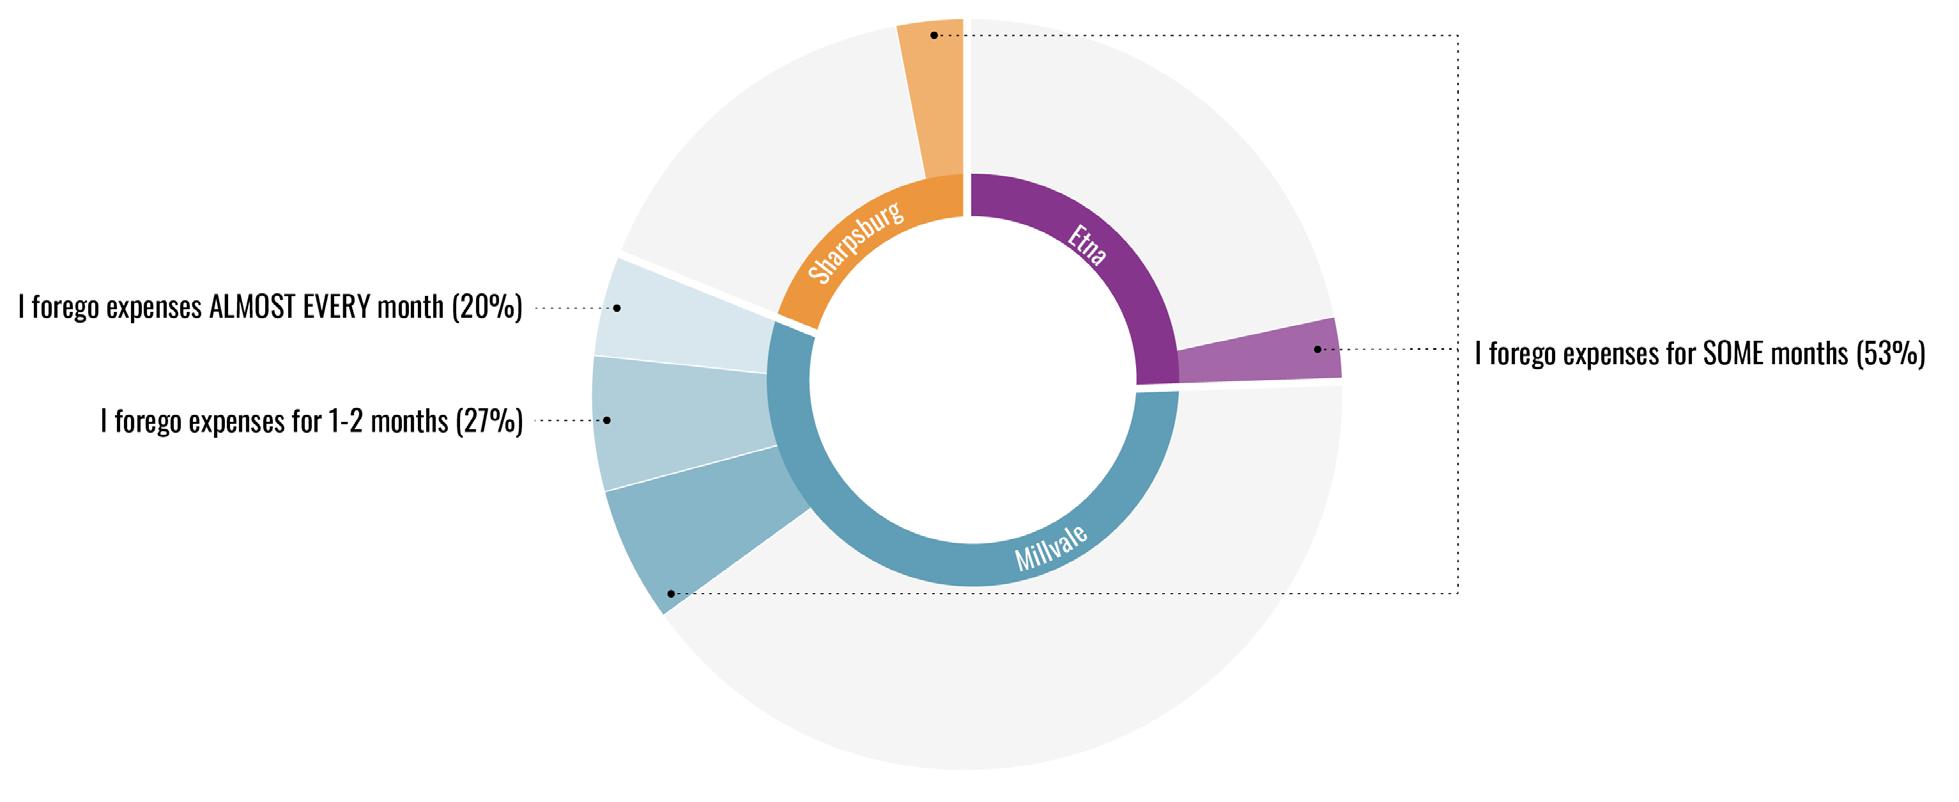
Q15. IN THE LAST YEAR, HOW MANY MONTHS DID YOUR HOUSEHOLD REDUCE OR FORGO EXPENSES FOR BASIC HOUSEHOLD NECESSITIES, SUCH AS MEDICINE OR FOOD, IN ORDER TO PAY AN ENERGY BILL?
Millvale survey respondents are more likely to forgo expenses to pay an energy bill, and for a longer period, than Etna and Sharpsburg respondents.
Q16. IN THE LAST YEAR, HOW MANY MONTHS DID YOUR HOUSEHOLD KEEP YOUR HOME AT A TEMPERATURE YOU FELT WAS UNSAFE OR UNHEALTHY?
Select Sharpsburg survey respondents have found their homes’ temperature to feel unsafe in the summer.
Select Etna respondents have found their homes’ temperature to feel unsafe in the winter.
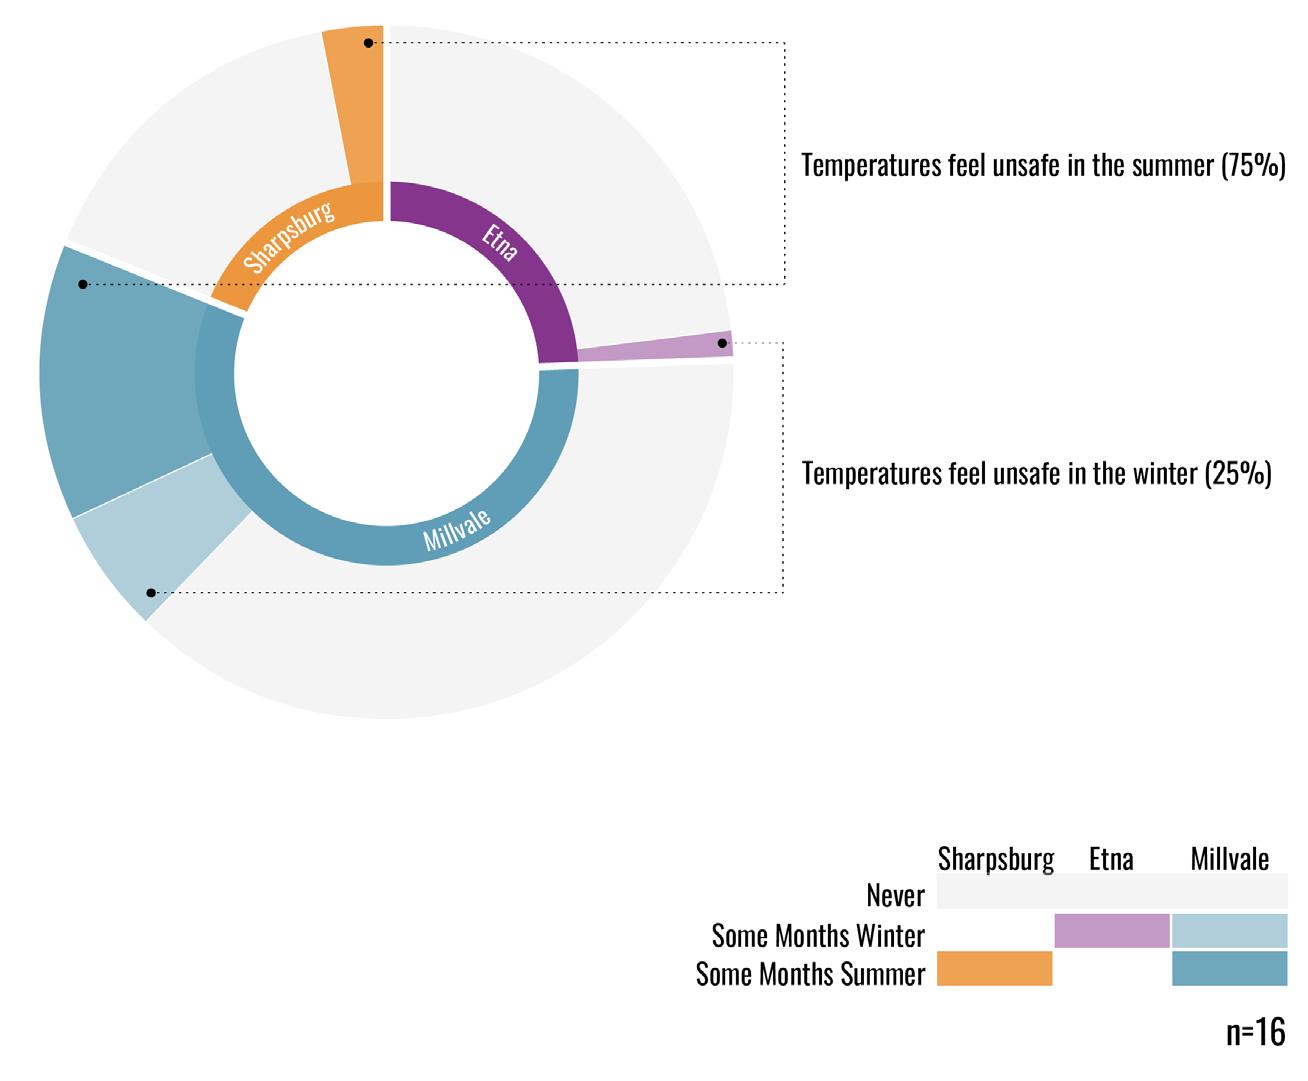
Select Millvale respondents have found their homes’ temperature to feel unsafe in both summer and winter.
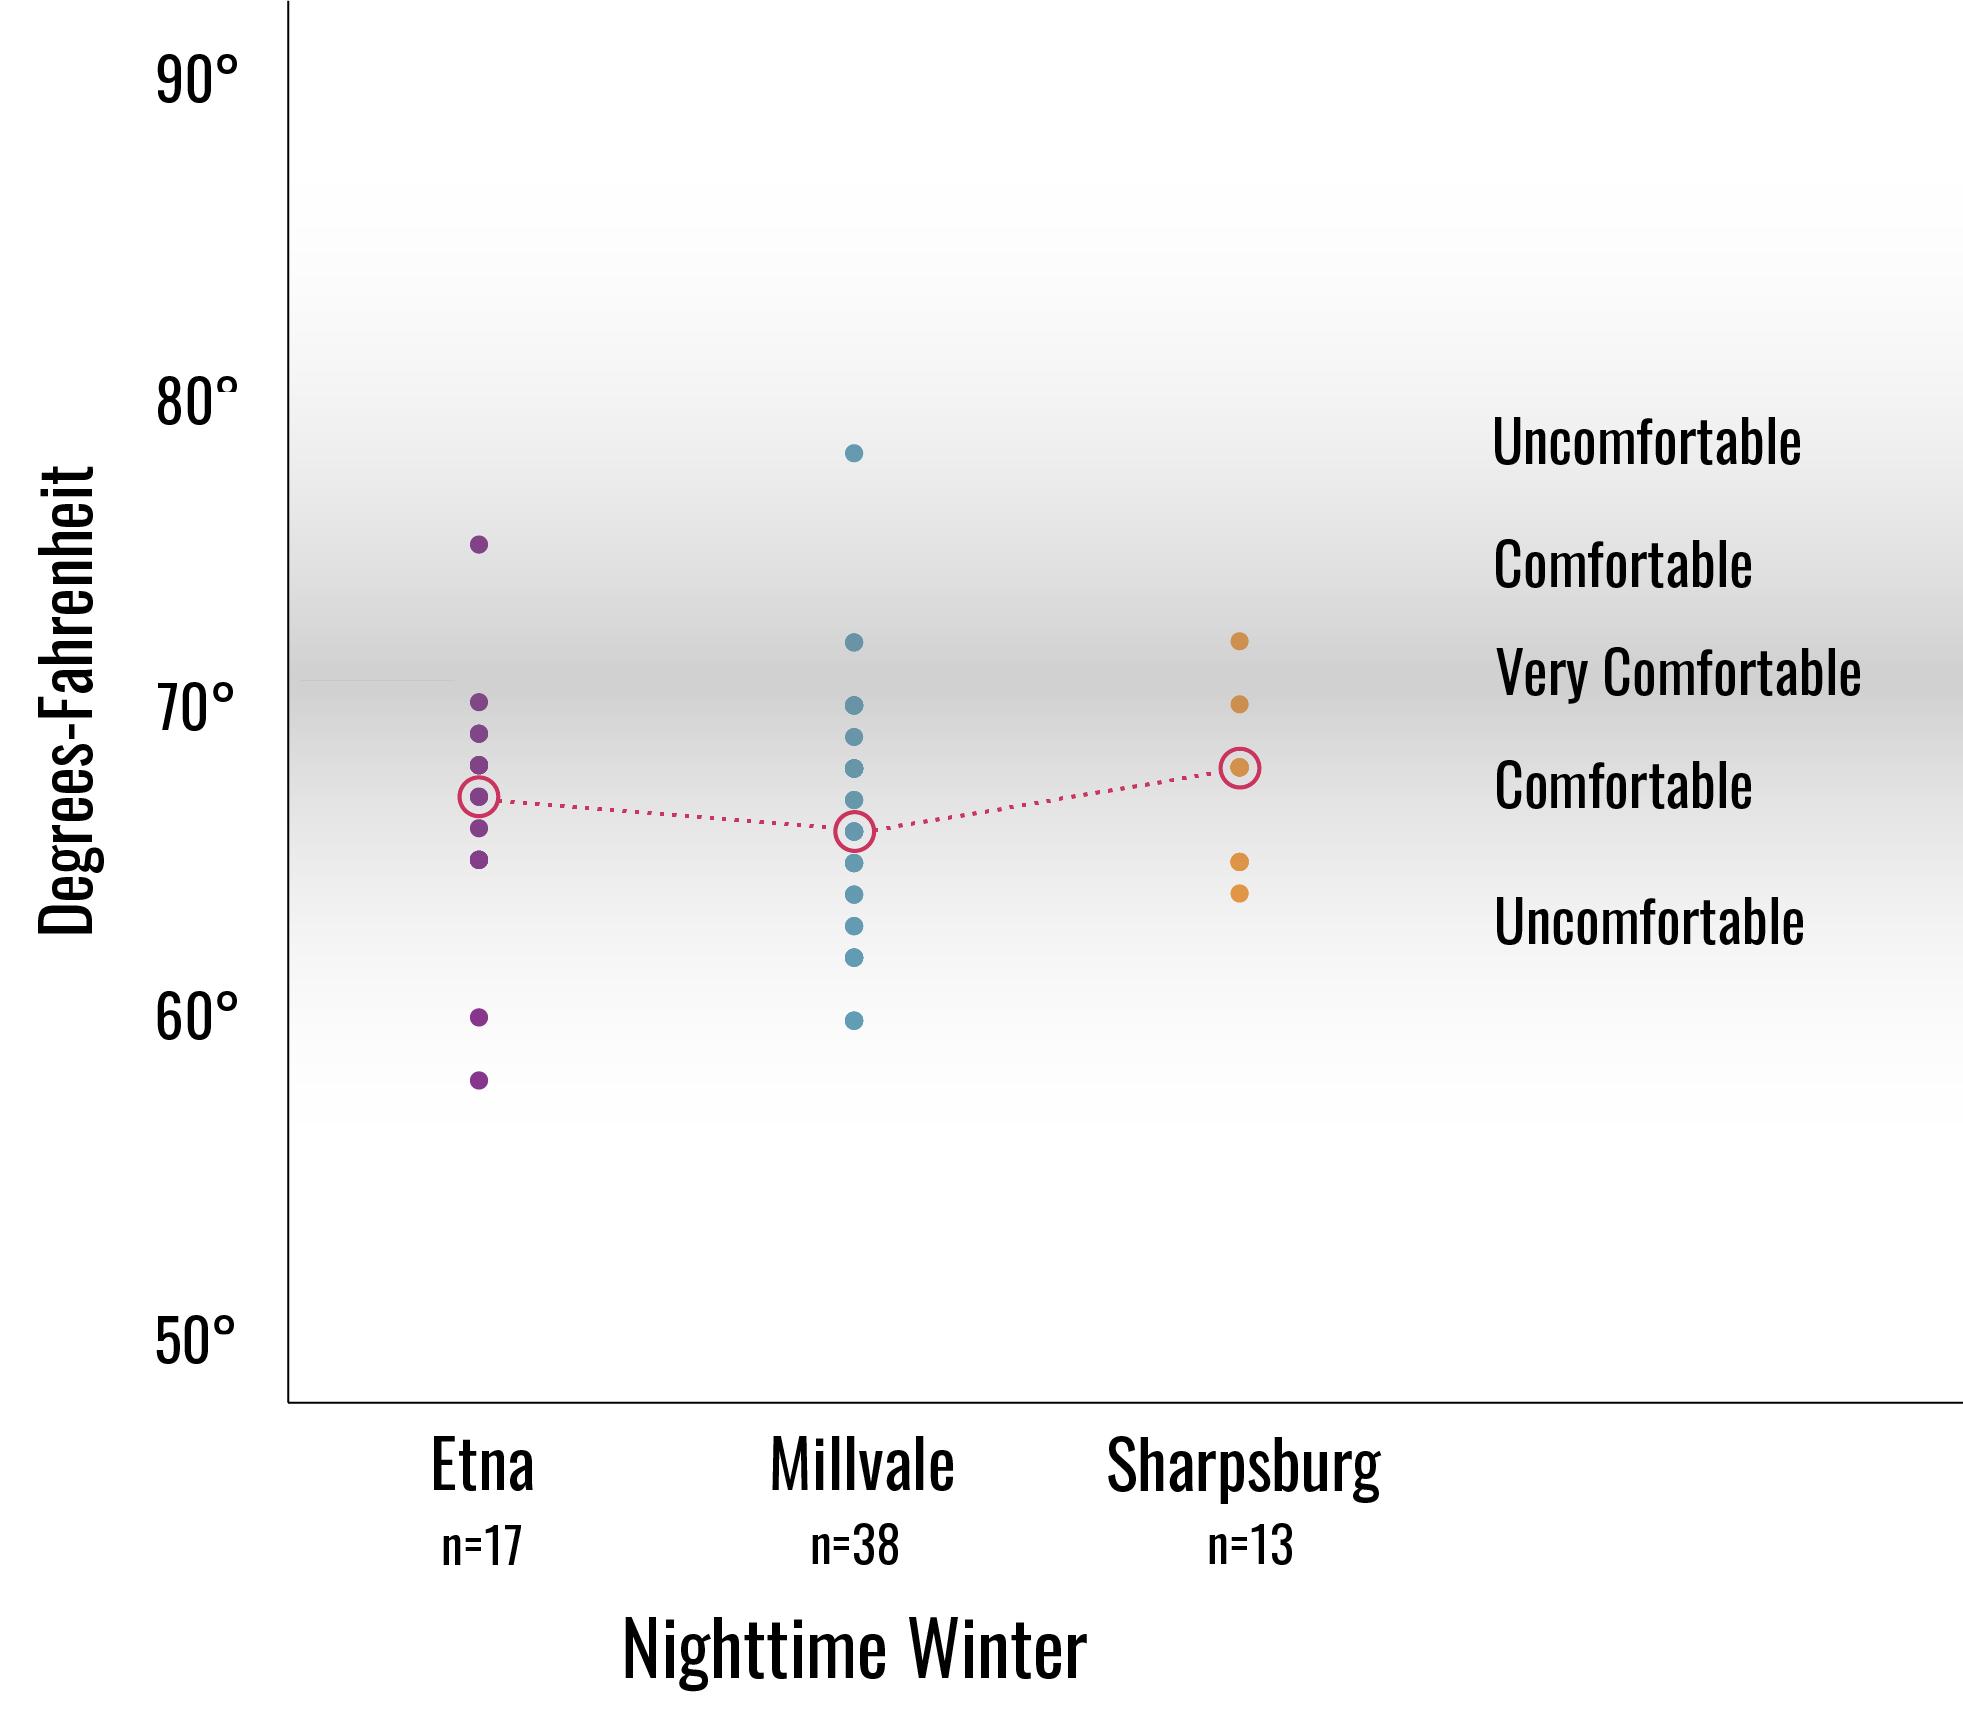
Q8. DURING THE FOLLOWING SEASONS/TIMES OF DAY, WHAT IS THE TYPICAL TEMPERATURE IN YOUR HOME?
On average, Triboro Ecodistrict households increase their thermostats by 2 degrees in the summer when no one is home.
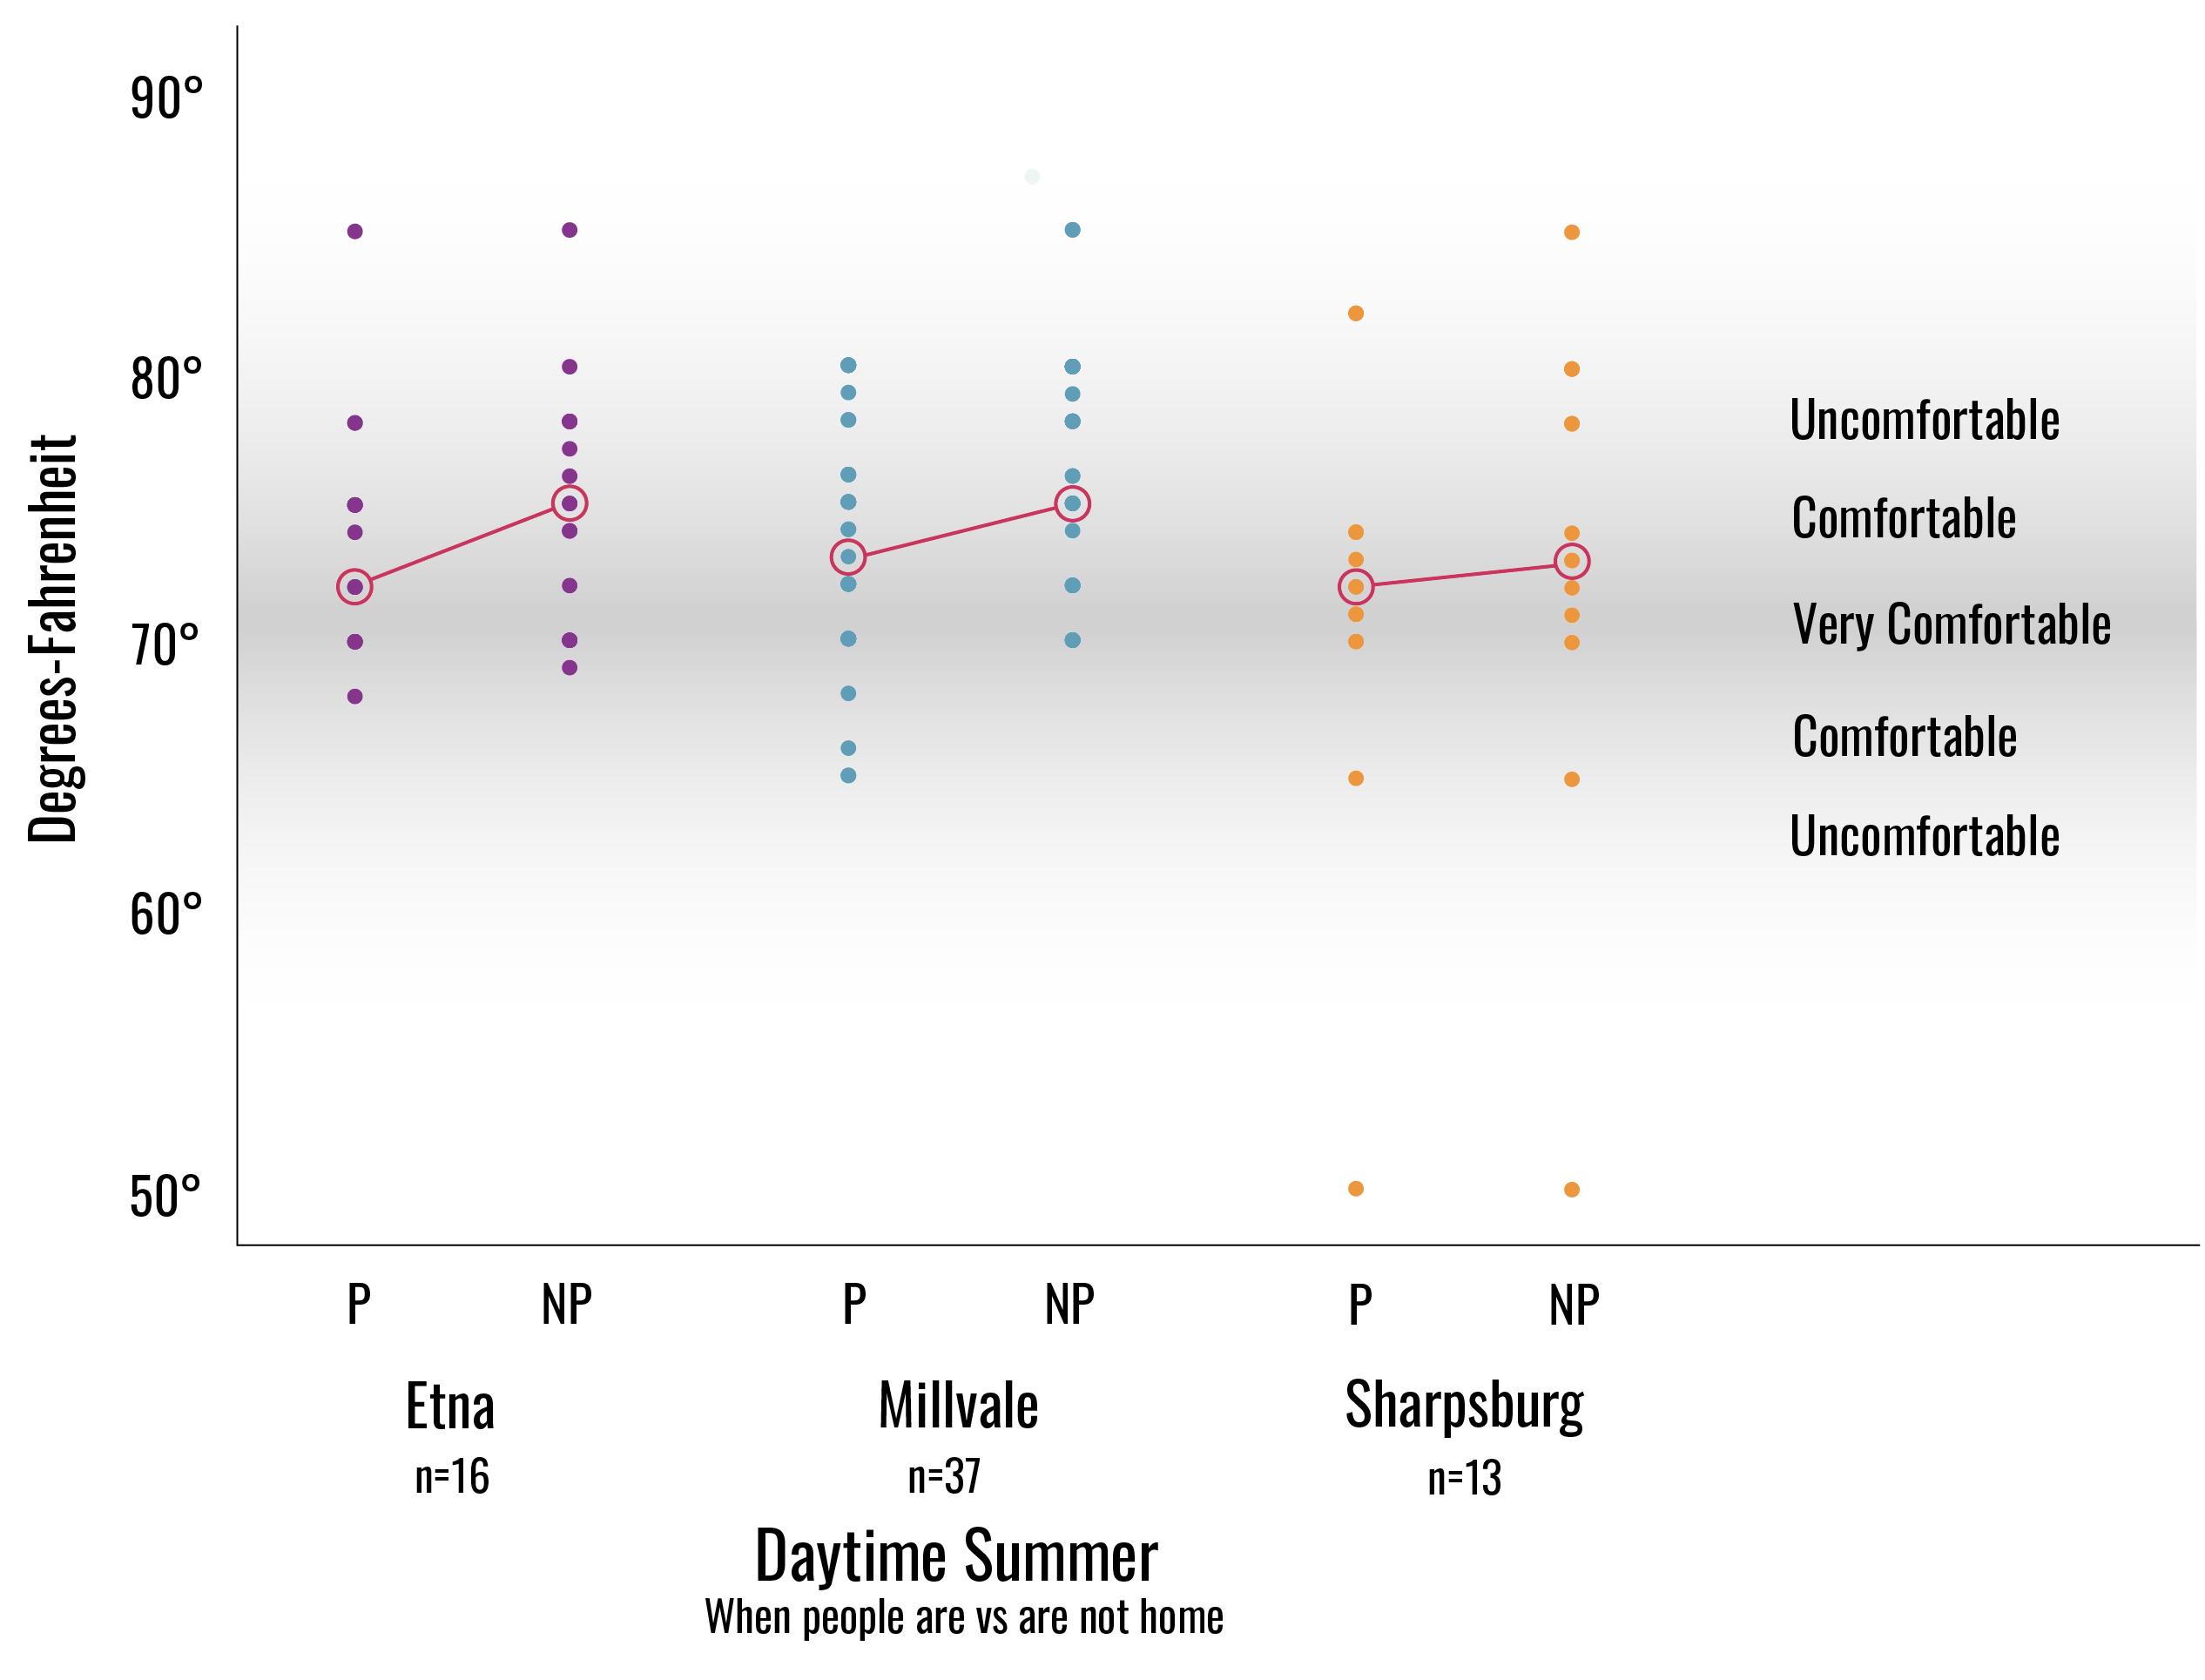
Sharpsburg survey respondents keep their home temperatures on average 3 degrees cooler in the summer compared to Millvale and Etna respondents.

Millvale survey respondents are more likely to keep their thermostats at a more uncomfortable temperature during summer nights.
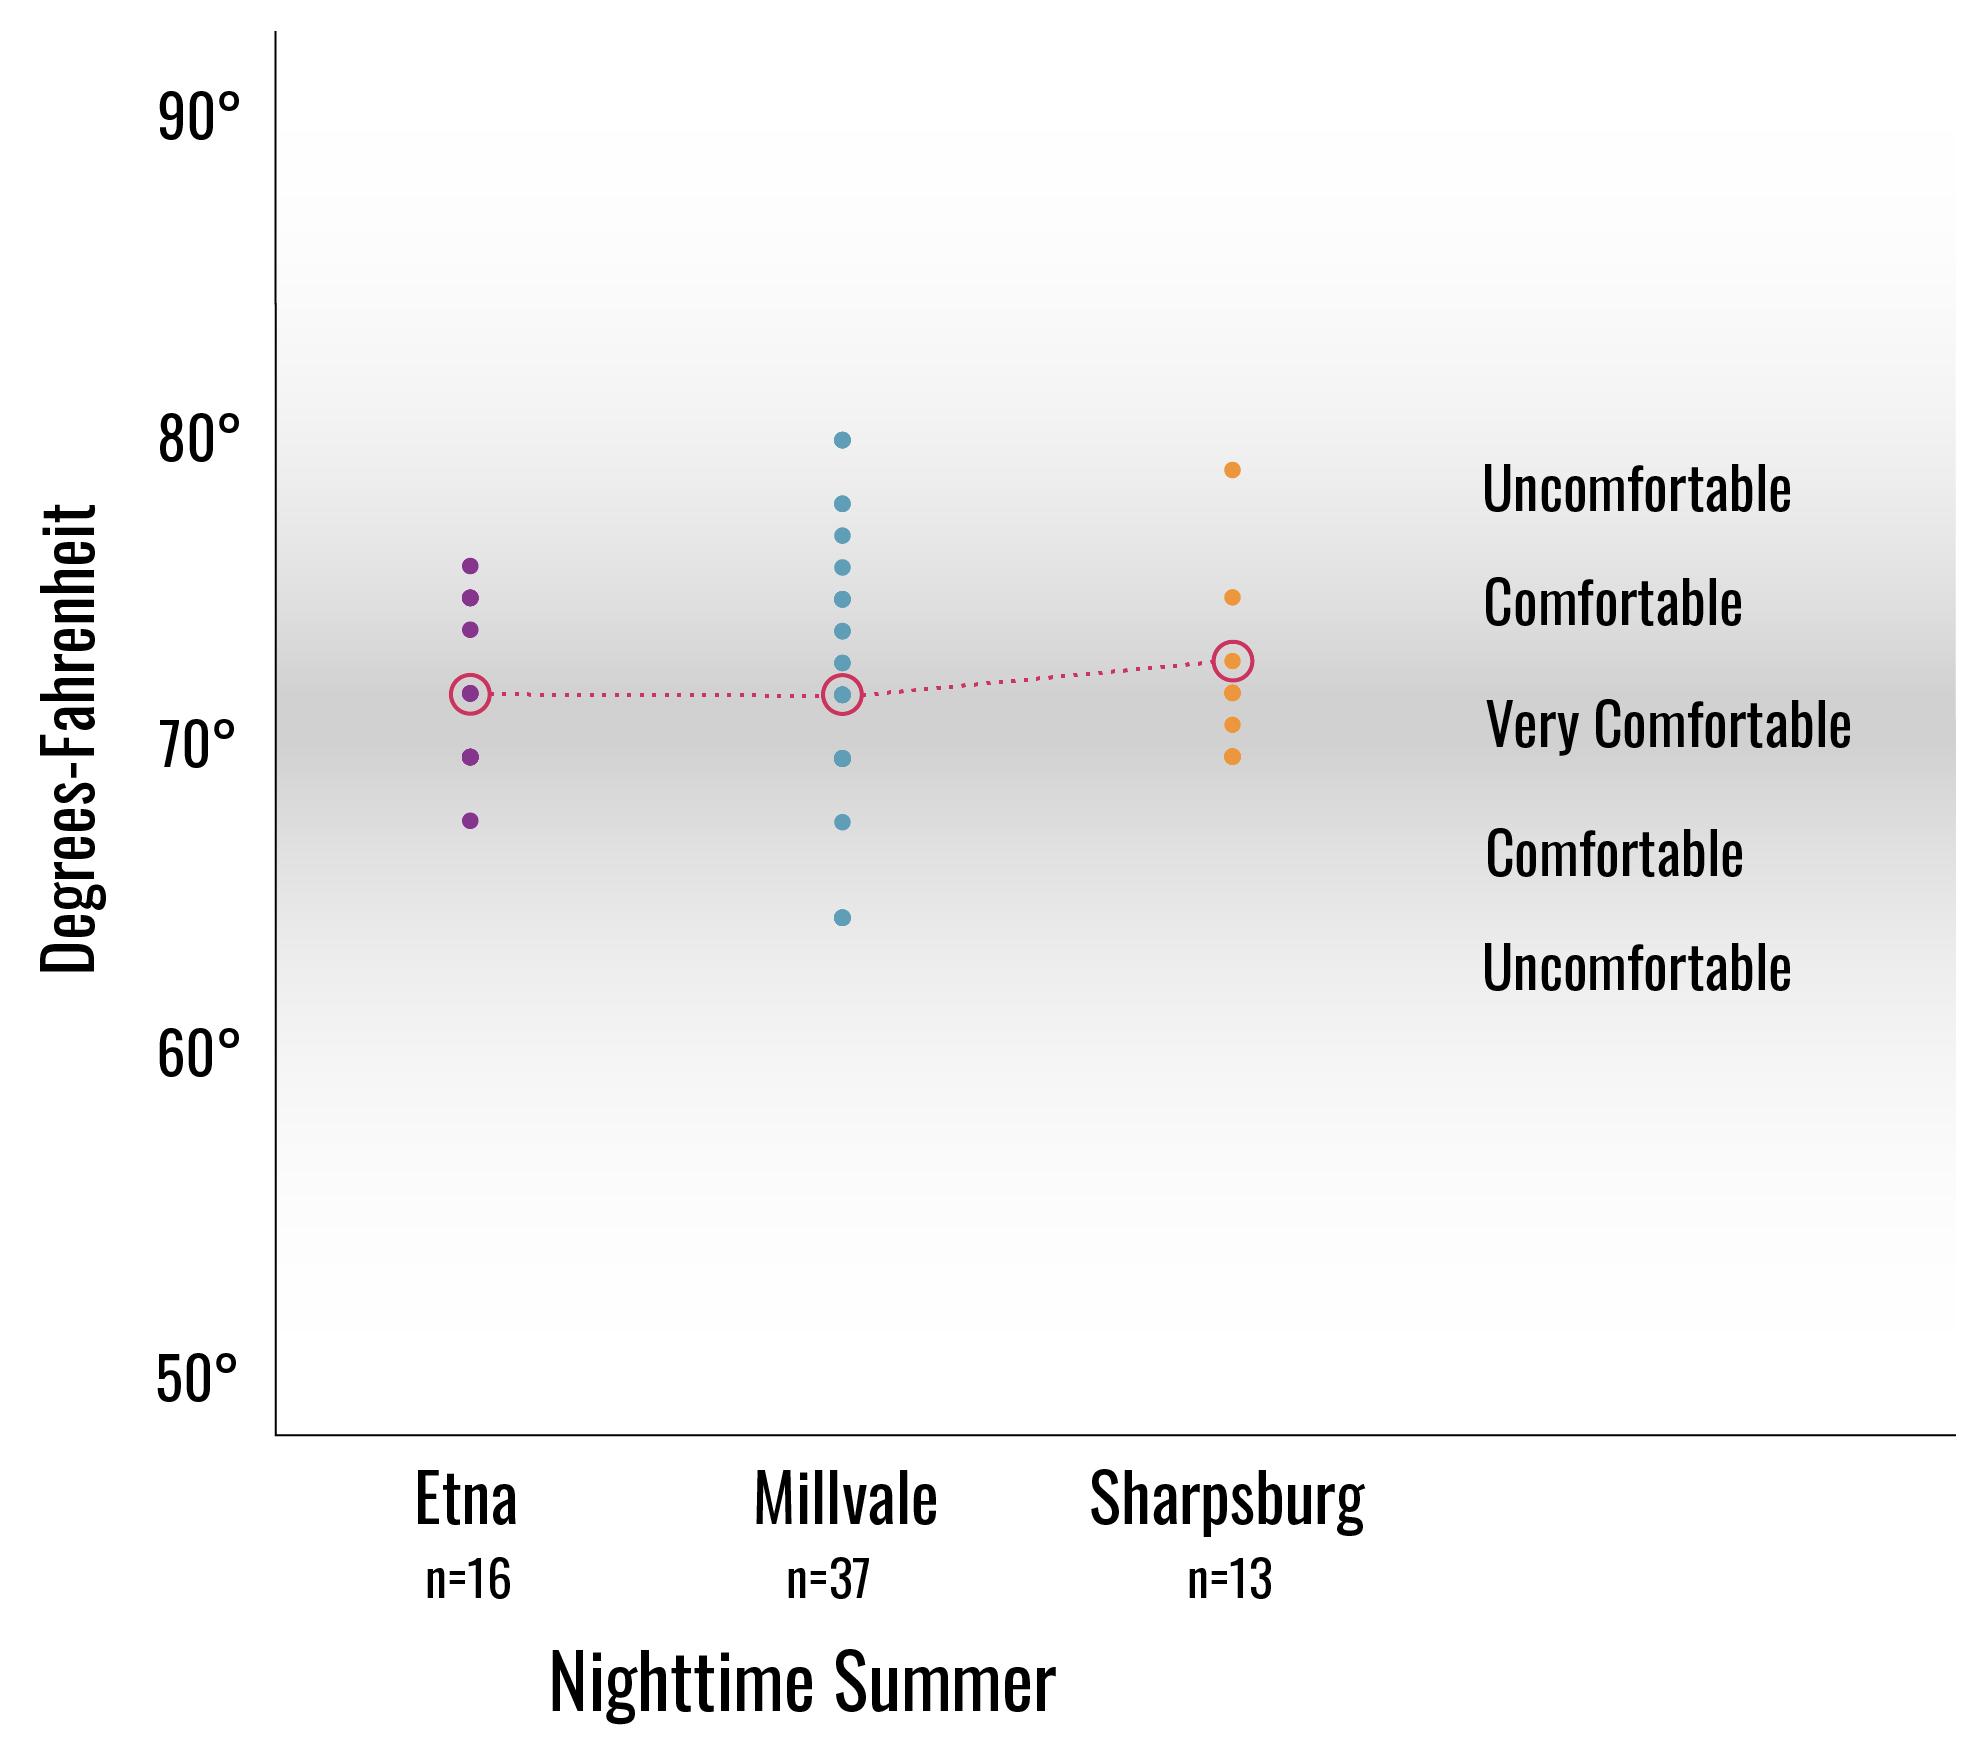
On average, Sharpsburg residents keep their thermostats 2 degrees cooler during summer nights, compared to summer days.

On average, Triboro Ecodistrict households decrease their thermostats by 2 degrees in the winter when no one is home.

On average, Millvale survey respondents adjust their thermostats to much lower temperatures when no one is home during the winter months, compared to Etna and Sharpsburg.
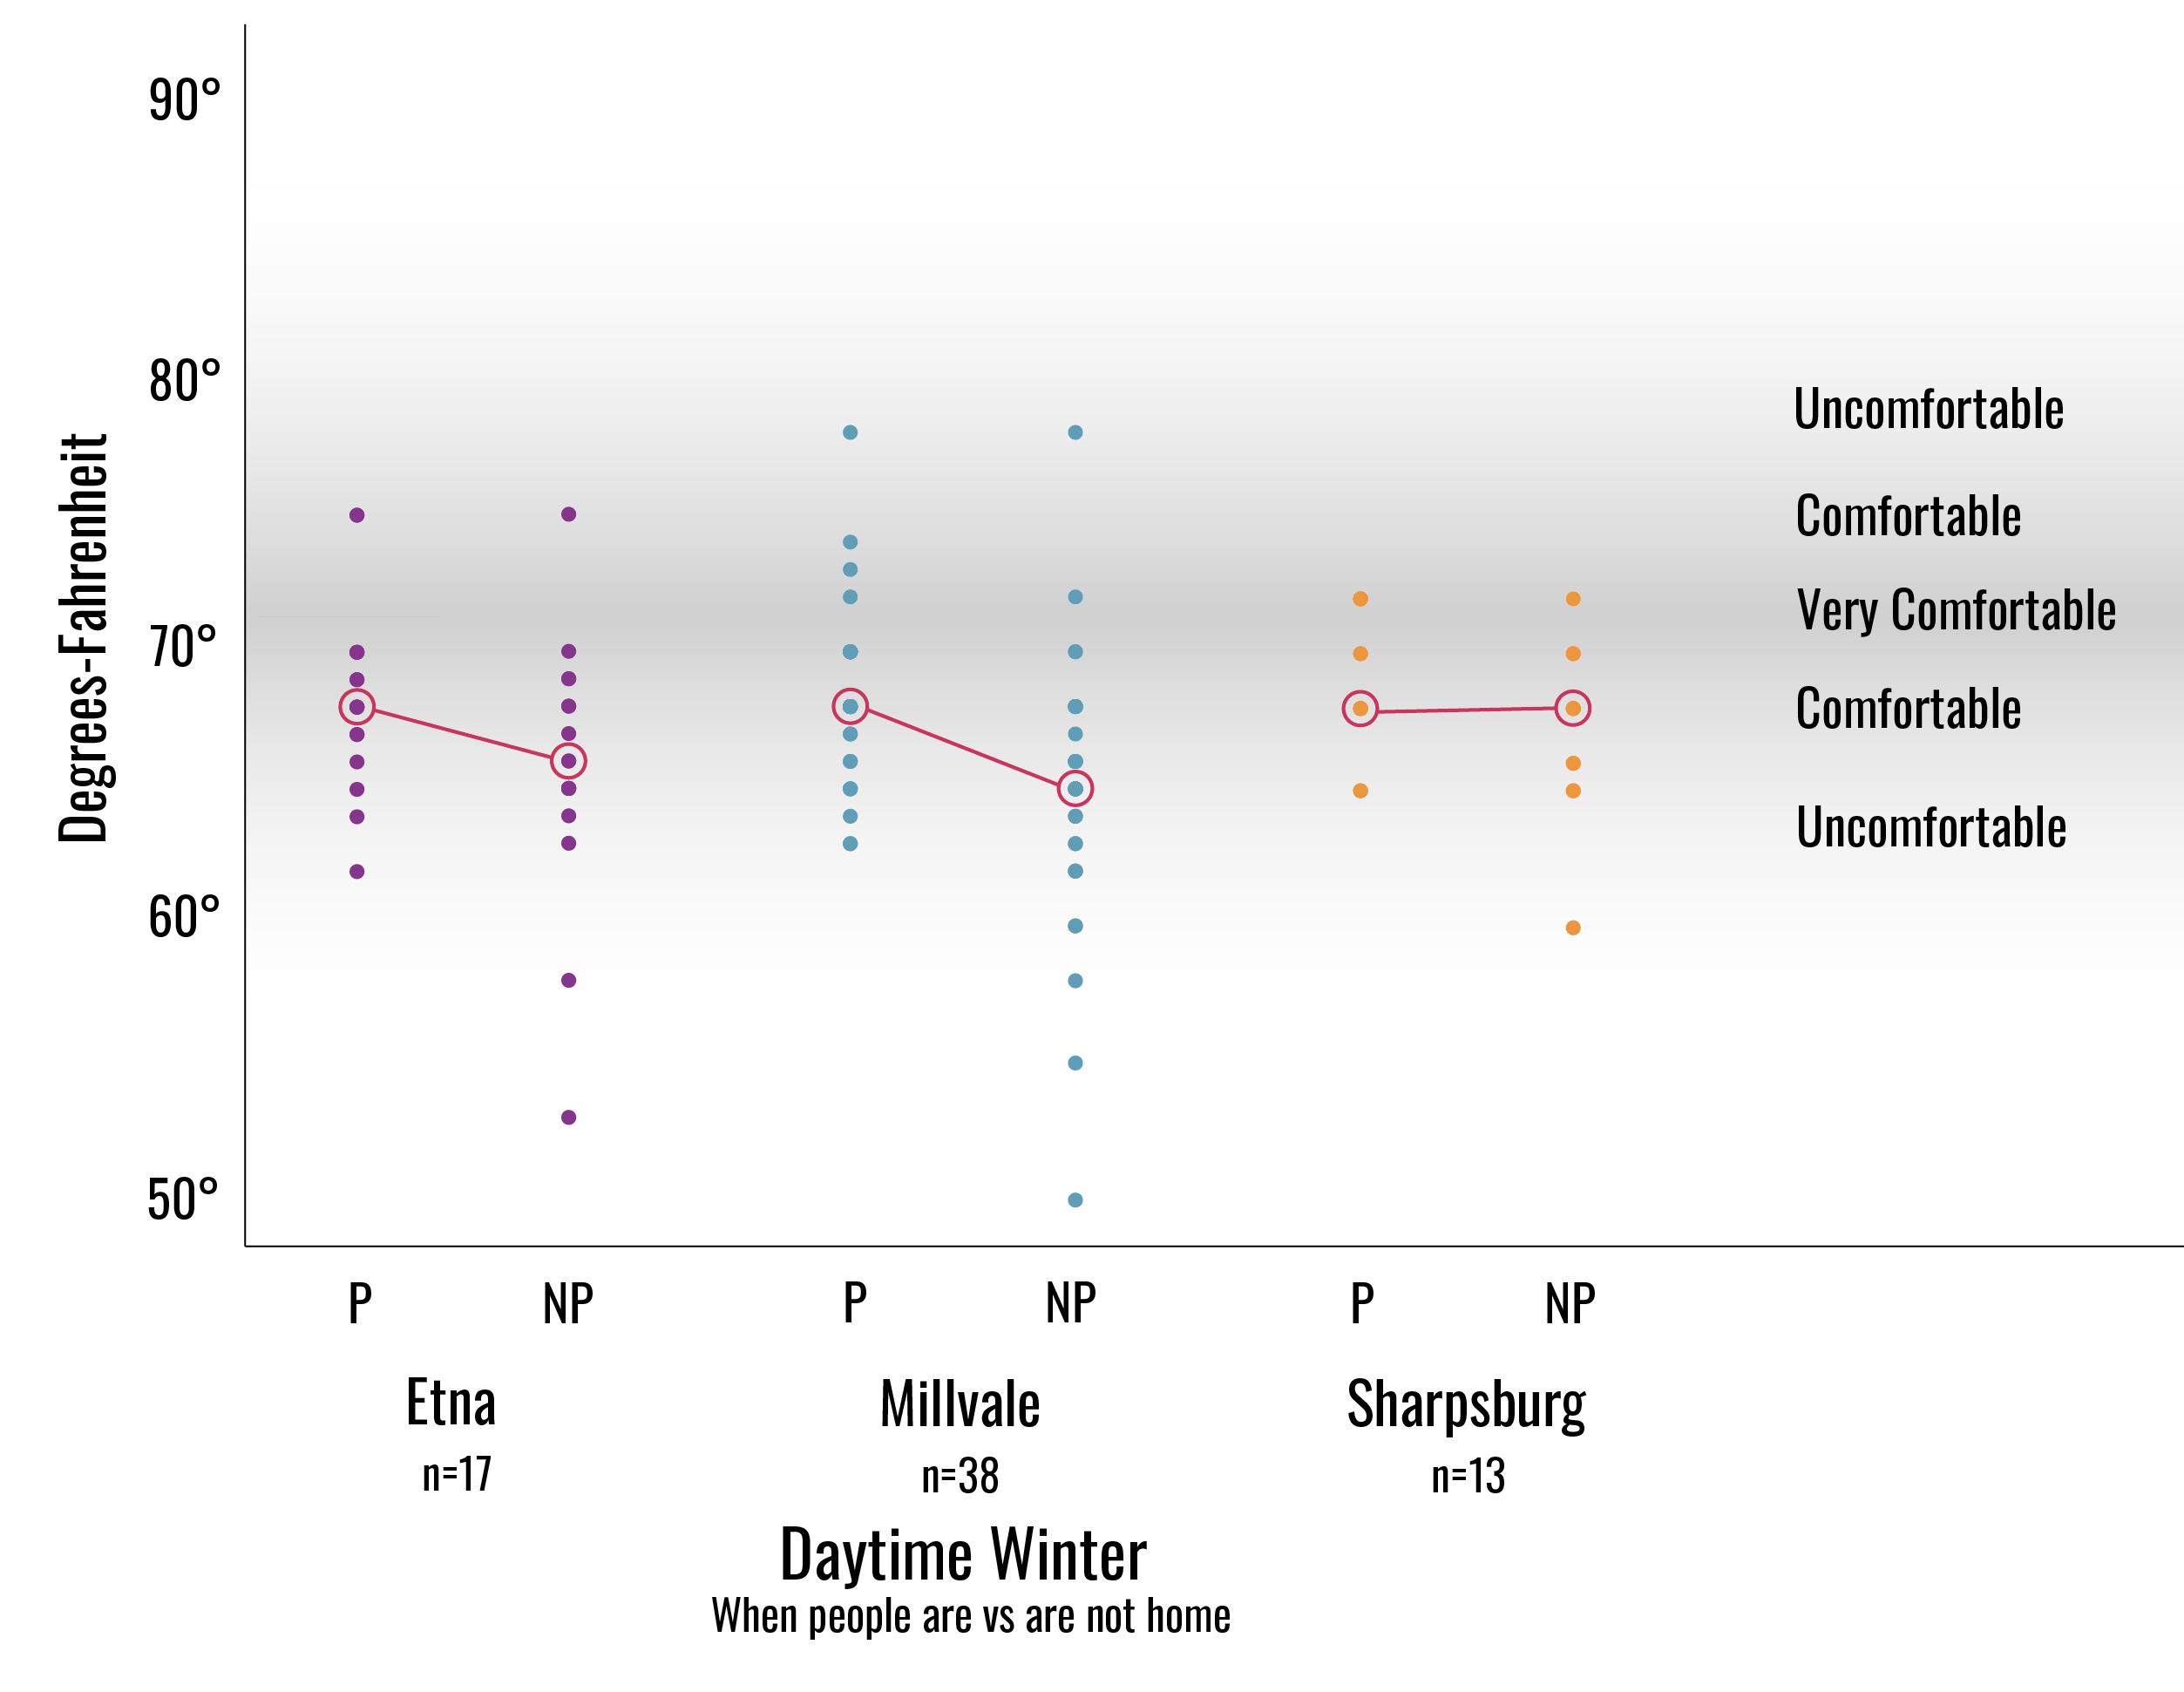
On average, Triboro Ecodistrict households decrease their thermostats by 1 degree during winter nights.

The results of the resident energy use survey have led to several energy conservation findings and recommendations, including:
• More than half of the survey respondents have reported that their homes feel too drafty at times. The Triboro Ecodistrict has a large proportion of older homes, which tend to have greater air infiltration. Weatherization programs and incentives can be low cost, and will result in reduced infiltration and heat loss, as well as more comfortable indoor environments. According to Rebuilding Together Pittsburgh, air sealing can reduce air leakage by 50% and on average provides less than a 5 year return on investment.
• The predominant fuel source in the Triboro Ecodistrict is natural gas. Guidance and incentives for households that are upgrading their heating, air conditioning, and water heating systems (or their systems are nearing end of life) should encourage a transition to electric systems. Electric systems can be more efficient, save money, and could be fueled by solar power in the future, in addition to preparing the homeowner for future energy transition. Triboro Ecodistrict residents should work with local organizations to advocate for government rebates and financial assistance to upgrade to more energy efficient systems.
• A small percentage of survey respondents are currently purchasing green energy through their energy supplier. Lack of information regarding green energy purchase could be a major barrier to participation. A green power purchase campaign and assistance could encourage more households to sign up, especially if there is minimal if any additional cost to participate. Millvale survey respondents were more likely to purchase green energy than respondents in Sharpsburg and Etna. Existing programs in Millvale, such as inviting representatives from Green Mountain Energy and other companies to public events and hosting energy-themed programs, could increase participation in Etna and Sharpsburg.
• When discussing how to conserve energy at home, many individuals point to changing their lightbulbs as one of the easiest and most obvious ways to reduce energy consumption. While the true impact of changing your lightbulbs varies depending on the household, it is at the least an intentional demonstration of one’s participation and belief in energy conservation. According to the survey responses, there are still several households that have not made the switch to energy efficient bulbs. A lightbulb giveaway program could be an easy first step for residents to participate in energy conservation, while improving lighting quality and reducing their energy bills. According to Rebuilding Together Pittsburgh, upgrading to LED lightbulbs costs $192 for the average household and can produce average annual savings of $169, which is less than a 1.5 year return on investment.
• The significant number of survey respondents who indicated that energy conservation is important to them due to environmental concerns as well as cost savings shows that when implementing energy conservation initiatives, it is important that the messaging includes both of these benefits
• The fact that select survey respondents indicated that they forgo expenses to pay energy bills and/or have kept their home temperature at an unsafe or unhealthy level demonstrates the cost burden that exists for many households in the Triboro Ecodistrict. Implementing energy conservation initiatives is both an environmental issue and a social equity and health issue
• The survey results have shown that on average, Triboro Ecodistrict survey respondents adjust their thermostat depending on the season, time of day, and presence of people at home. Encouraging households to install programmable thermostats could encourage further energy conservation and cost savings. According to Rebuilding Together Pittsburgh, installing a programmable thermostat with setback temperatures costs about $194 on average and can produce $80 in annual energy savings, which is a 2.5 year return on investment.
• Resident behavior can significantly impact energy consumption. The Triboro Ecodistrict could have energy ambassadors develop and distribute a list of resident behavior recommendations for how to reduce energy consumption, including programming a setback thermostat, changing lightbulbs, unplugging appliances when not in use, etc.
• Two energy conservation measures that were not addressed in the utility data analysis or resident behavior survey, but are no-cost with significant energy savings are adjusting the water heater temperature and retiring a second refrigerator (if the home has one). These adjustments cost nothing to implement, and according to Rebuilding Together Pittsburgh, can produce annual every cost savings of $32 and $83 respectively.
What if we air sealed and insulated all of the eligible houses in Sharpsburg?
CONSERVE PRODUCE RESILIENCE
1 2 3
It would reduce community-wide energy consumption by 37,977 MMBTU
What if we installed a solar array on the roof of the Etna Center for Community?
It would reduce community-wide energy consumption by 48 MMBTU
What if we established a resilience cluster in Millvale?
It would reduce community-wide energy consumption by 1,353 MMBTU
The Triboro Energy Baseline Study is intended to inform future 2030 Energy Action Plan and goal creation. More specifically, the findings in this report can help the Triboro Ecodistrict understand how energy conservation, renewable energy production, and resilience efforts will impact specific residential building characteristics, and how community-wide programs and improvements will reduce community carbon-based energy consumption. The Triboro Ecodistrict is currently building on their numerous energy successes and has several initiatives underway. The consultant team has modeled the impact of three scenarios that are currently being investigated in Sharpsburg, Etna, and Millvale that demonstrate the Triboro’s energy hierarchy of conservation, production, and resilience. These scenarios describe the potential energy and cost impacts of three proposed initiatives.
NOTE: The consultant team has stated the assumptions made as part of these calculations and actual performance may vary from these projected numbers.
What if we improved the building envelope?
What if we upgraded the HVAC systems?
What if we installed solar arrays?
What if we installed efficient lightbulbs?
What if our community spaces were transformed into resilience hubs??
What if we insulated our attics and basements?
What if we transitioned to all-electric?
What if we used a programmable thermostat?

The Triboro Ecodistrict is currently partnering with Rebuilding Together Pittsburgh to offer free home energy audits and up to $100 in home repairs to households in Sharpsburg, Etna, and Millvale. This initiative will not only help Triboro Ecodistrict residents reduce their greenhouse gas emissions, but will also help them save money on their utility bills. This program is open to both renters (with the landlord’s permission) and homeowners. Households with an income of 50% or less of the area median income will be prioritized for this opportunity. The program is kicking off its first year of engagement in Sharpsburg. Rebuilding Together Pittsburgh shared three recommendations that are often suggested as a result of the home energy audits, which provide the greatest return on investment with a moderate cost investment. These recommendations include air sealing, attic insulation, and insulating the rim joists in the basement.
Air sealing stops unwanted air flow between the indoors and outdoors by sealing the small gaps around the house. This can include caulking cracks and openings in the building envelope, such as around window and door frames, cracks in the building foundation, and gaps around vent ducts, air conditioners, plumbing, and wiring, among other areas.
Insulating the attic and rim joists is important because it can prevent air from escaping the house and stop outside air from coming in. This saves energy and makes your house more comfortable. The type of insulation recommended for attics and rim joists may depend on the house, but generally spray foam insulation will be the highest performing option because it can easily fill nooks and crannies, it serves as a moisture barrier, and it provides the highest R-value per inch. For air sealing and insulation, the ideal candidate houses have:
• No water infiltration or sewer backups (as a result, properties in the floodplain have been excluded from this scenario modeling)
• A roof that is in good condition (as a result, properties in less than “fair condition” have been excluded from this scenario modeling)
• No toxic contaminants, such as asbestos insulation, gas leaks, or radon (there have been no exclusions based on this consideration)
• No dangerous electrical systems, such as knob and tube wiring (there have been no exclusions based on this consideration)
• Easy access to the attic and basement (as a result, properties described as not having a “full basement” have been excluded from this scenario modeling)
Considering these exclusions, there are 634 houses, equating to 1,083,200 ft.2 of space that would be ideal candidates for air sealing and insulation in Sharpsburg. According to Rebuilding Together Pittsburgh (RTP), air sealing can reduce air leakage by up to 50%. The average cost of air sealing is $1,591 and the average house can expect an annual energy savings of 30 MMBTU and cost savings of $350. The average cost to install attic insulation is $1,886, resulting in 15.9 MMBTU of annual energy savings and $182 in energy cost savings. The average cost to insulate the basement rim joists is $817, resulting in 4 MMBTU of annual energy savings and $42 in energy cost savings.
When combined, on average, these improvements cost $4,294 and would result in $574 in energy cost savings annually, as well as 59.9 MMBTU in energy savings. This is a 7.5 year return on investment. If all of the houses in Sharpsburg that are an ideal candidate for these improvements implemented these recommendations, it would result in 37,977 MMBTU in annual community-wide energy savings.
There are 634 ideal candidates for air sealing and insulation in Sharpsburg
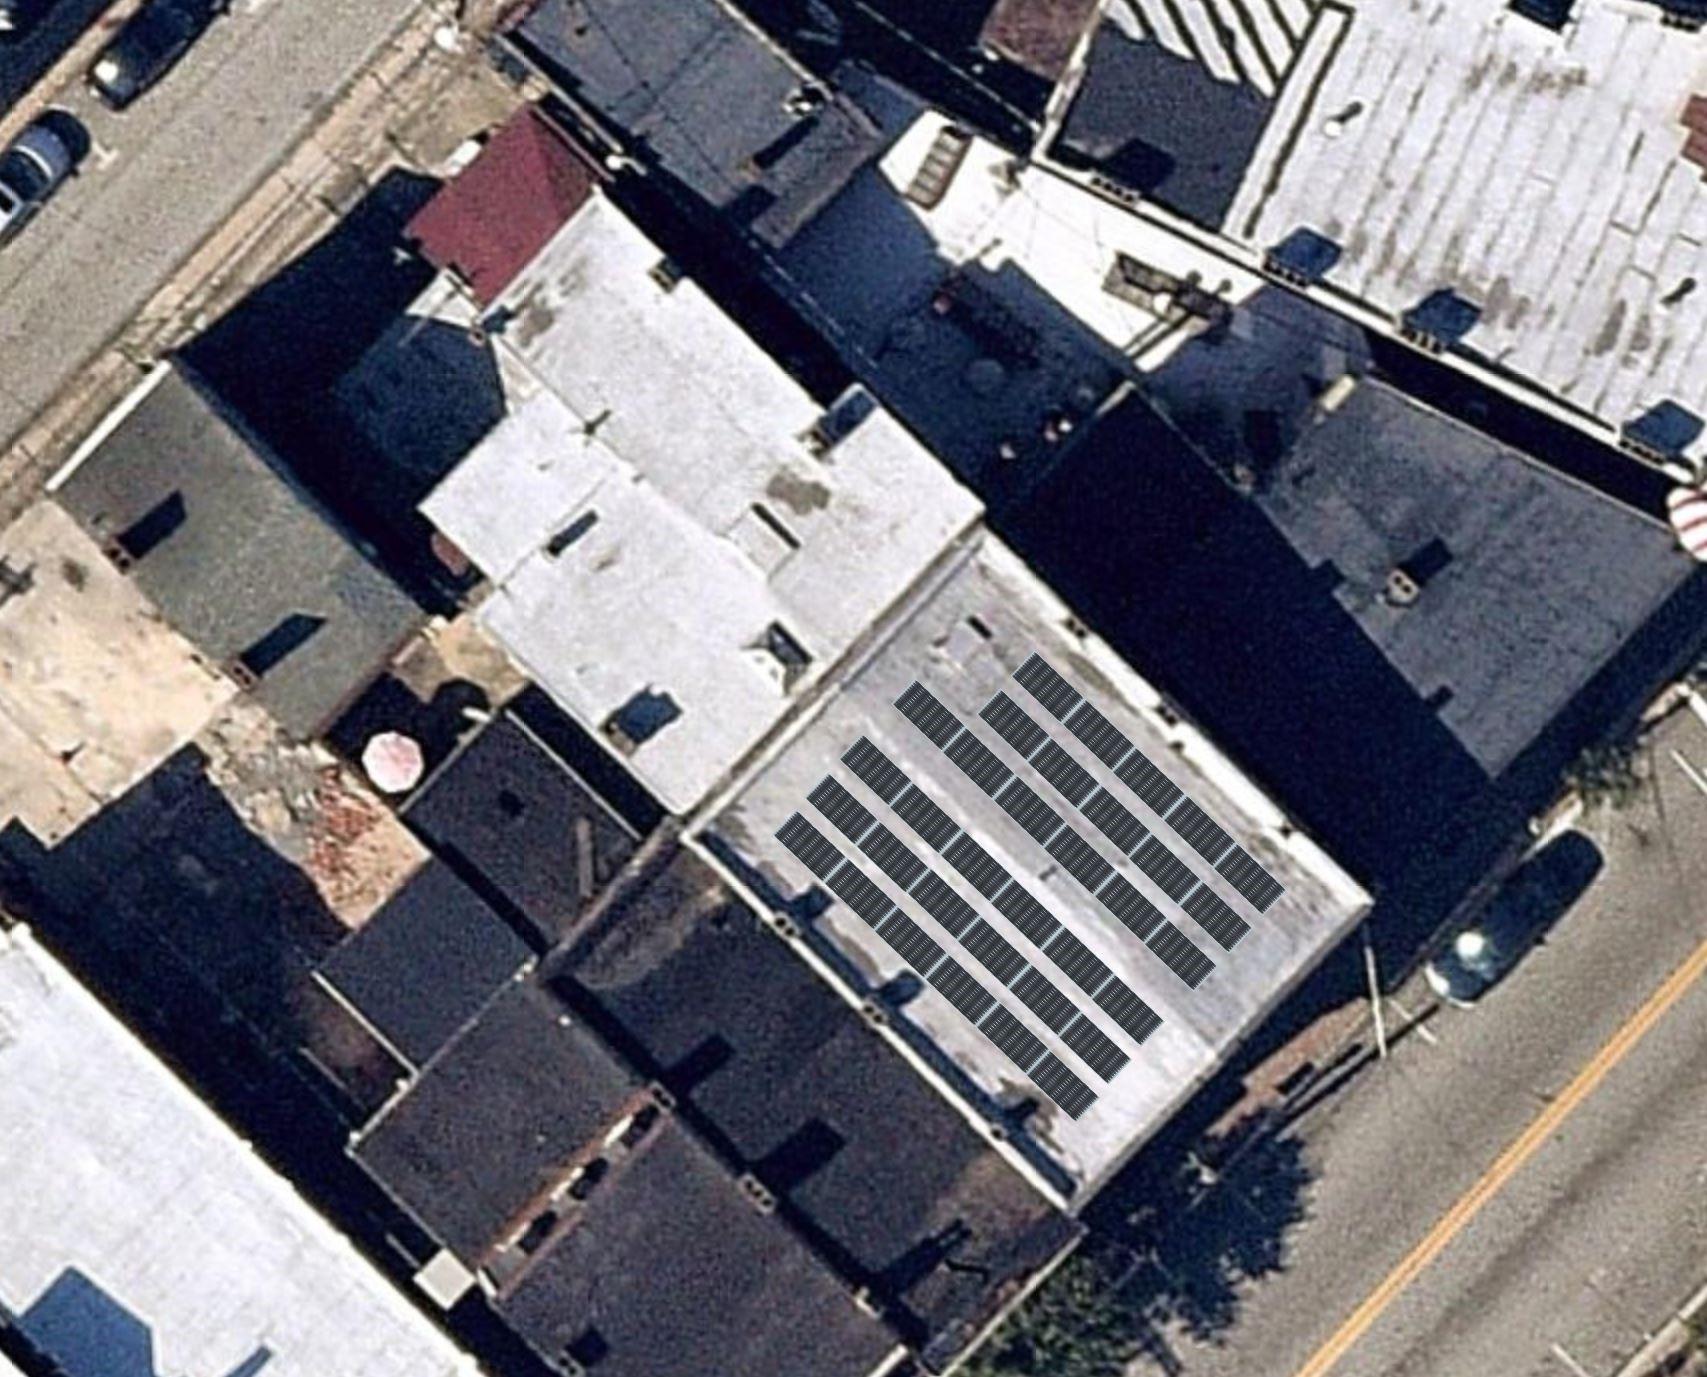
The Etna Community Organization is currently raising funds to establish the Etna Center for Community (ECC) at 341 - 343 Butler Street in Etna, PA. The building will house a public library and will offer resources like access to technology, early childhood educational programming, and activities for seniors and teens. The ECC will also physically demonstrate the values of the Etna Ecodistrict, including a rooftop solar array.
According to the Department of Energy, the average EUI for a library nationwide is 246 kBTU/sf/yr. Since the ECC will only occupy the first floor of the building, which is approximately 2,012 ft.2, this would equate to 494,952 kBTU (495 MMBTU) of energy consumption annually.
EIS Solar has suggested installation of a 12.92 kW ballast roof-mounted PV array on the roof of the building, which is estimated to produce 13,954 kWh annually (47.6 MMBTU). If these estimates are correct, the solar array would produce about 10% of the building’s annual energy consumption (this is a conservative estimate). If the building implements energy conservation measures, this will reduce the building’s annual energy consumption significantly, and the percent of renewable energy produced will compose a greater quantity of the building’s annual energy consumption.
The ECC solar array will provide many other benefits in addition to reducing the community’s carbon-based energy consumption.
Education & Training. The solar array can act as a learning opportunity for the community to understand how solar energy works, and even engage in the installation and maintenance of the system.
Public Health. The Pittsburgh region is known for consistently ranking as one of the most polluted cities in the country. Reducing carbon-based energy consumption directly contributes to reduced air pollution, which will reduce the impacts on community health.
Resilience. The ECC can act as a resilience hub and provide air conditioning, heating, internet, and power during community emergencies when the public electric grid goes down.
Advocacy. Lastly, the solar array helps to normalize the inclusion of solar arrays in our communities, to show what is possible and encourage a broader transition to renewable energy adoption.
Etna Community Library
341-343 Butler Street, Etna, PA 15223
Proposed Solar Layout v2
Prepared by Ian Smith 1/15/20
Questions: Contact Ian (814) 490-5492 ian@eissolar.com
12.92 kW Ballast Roof-Mounted PV Array
34 VSUN 380W Bifacial Modules--30-year production warranty
SMA SB Inverters (2)
Sunny Portal Web-Based Monitoring Included
Estimated Year One Output: 13,954 kWh*
*based on PV-Watts and aerial image analysis, subject to revision after full site evaluation
Included: Turn Key Installation by Expert EIS Crew Building/Electrical Permits as Required Part 1 & 2 Interconnection Process w/Utility
PV Meter & SREC Registration (You keep your SRECs) Electrical Inspection & Walk Through Service, Installation, and Equipment Warranties
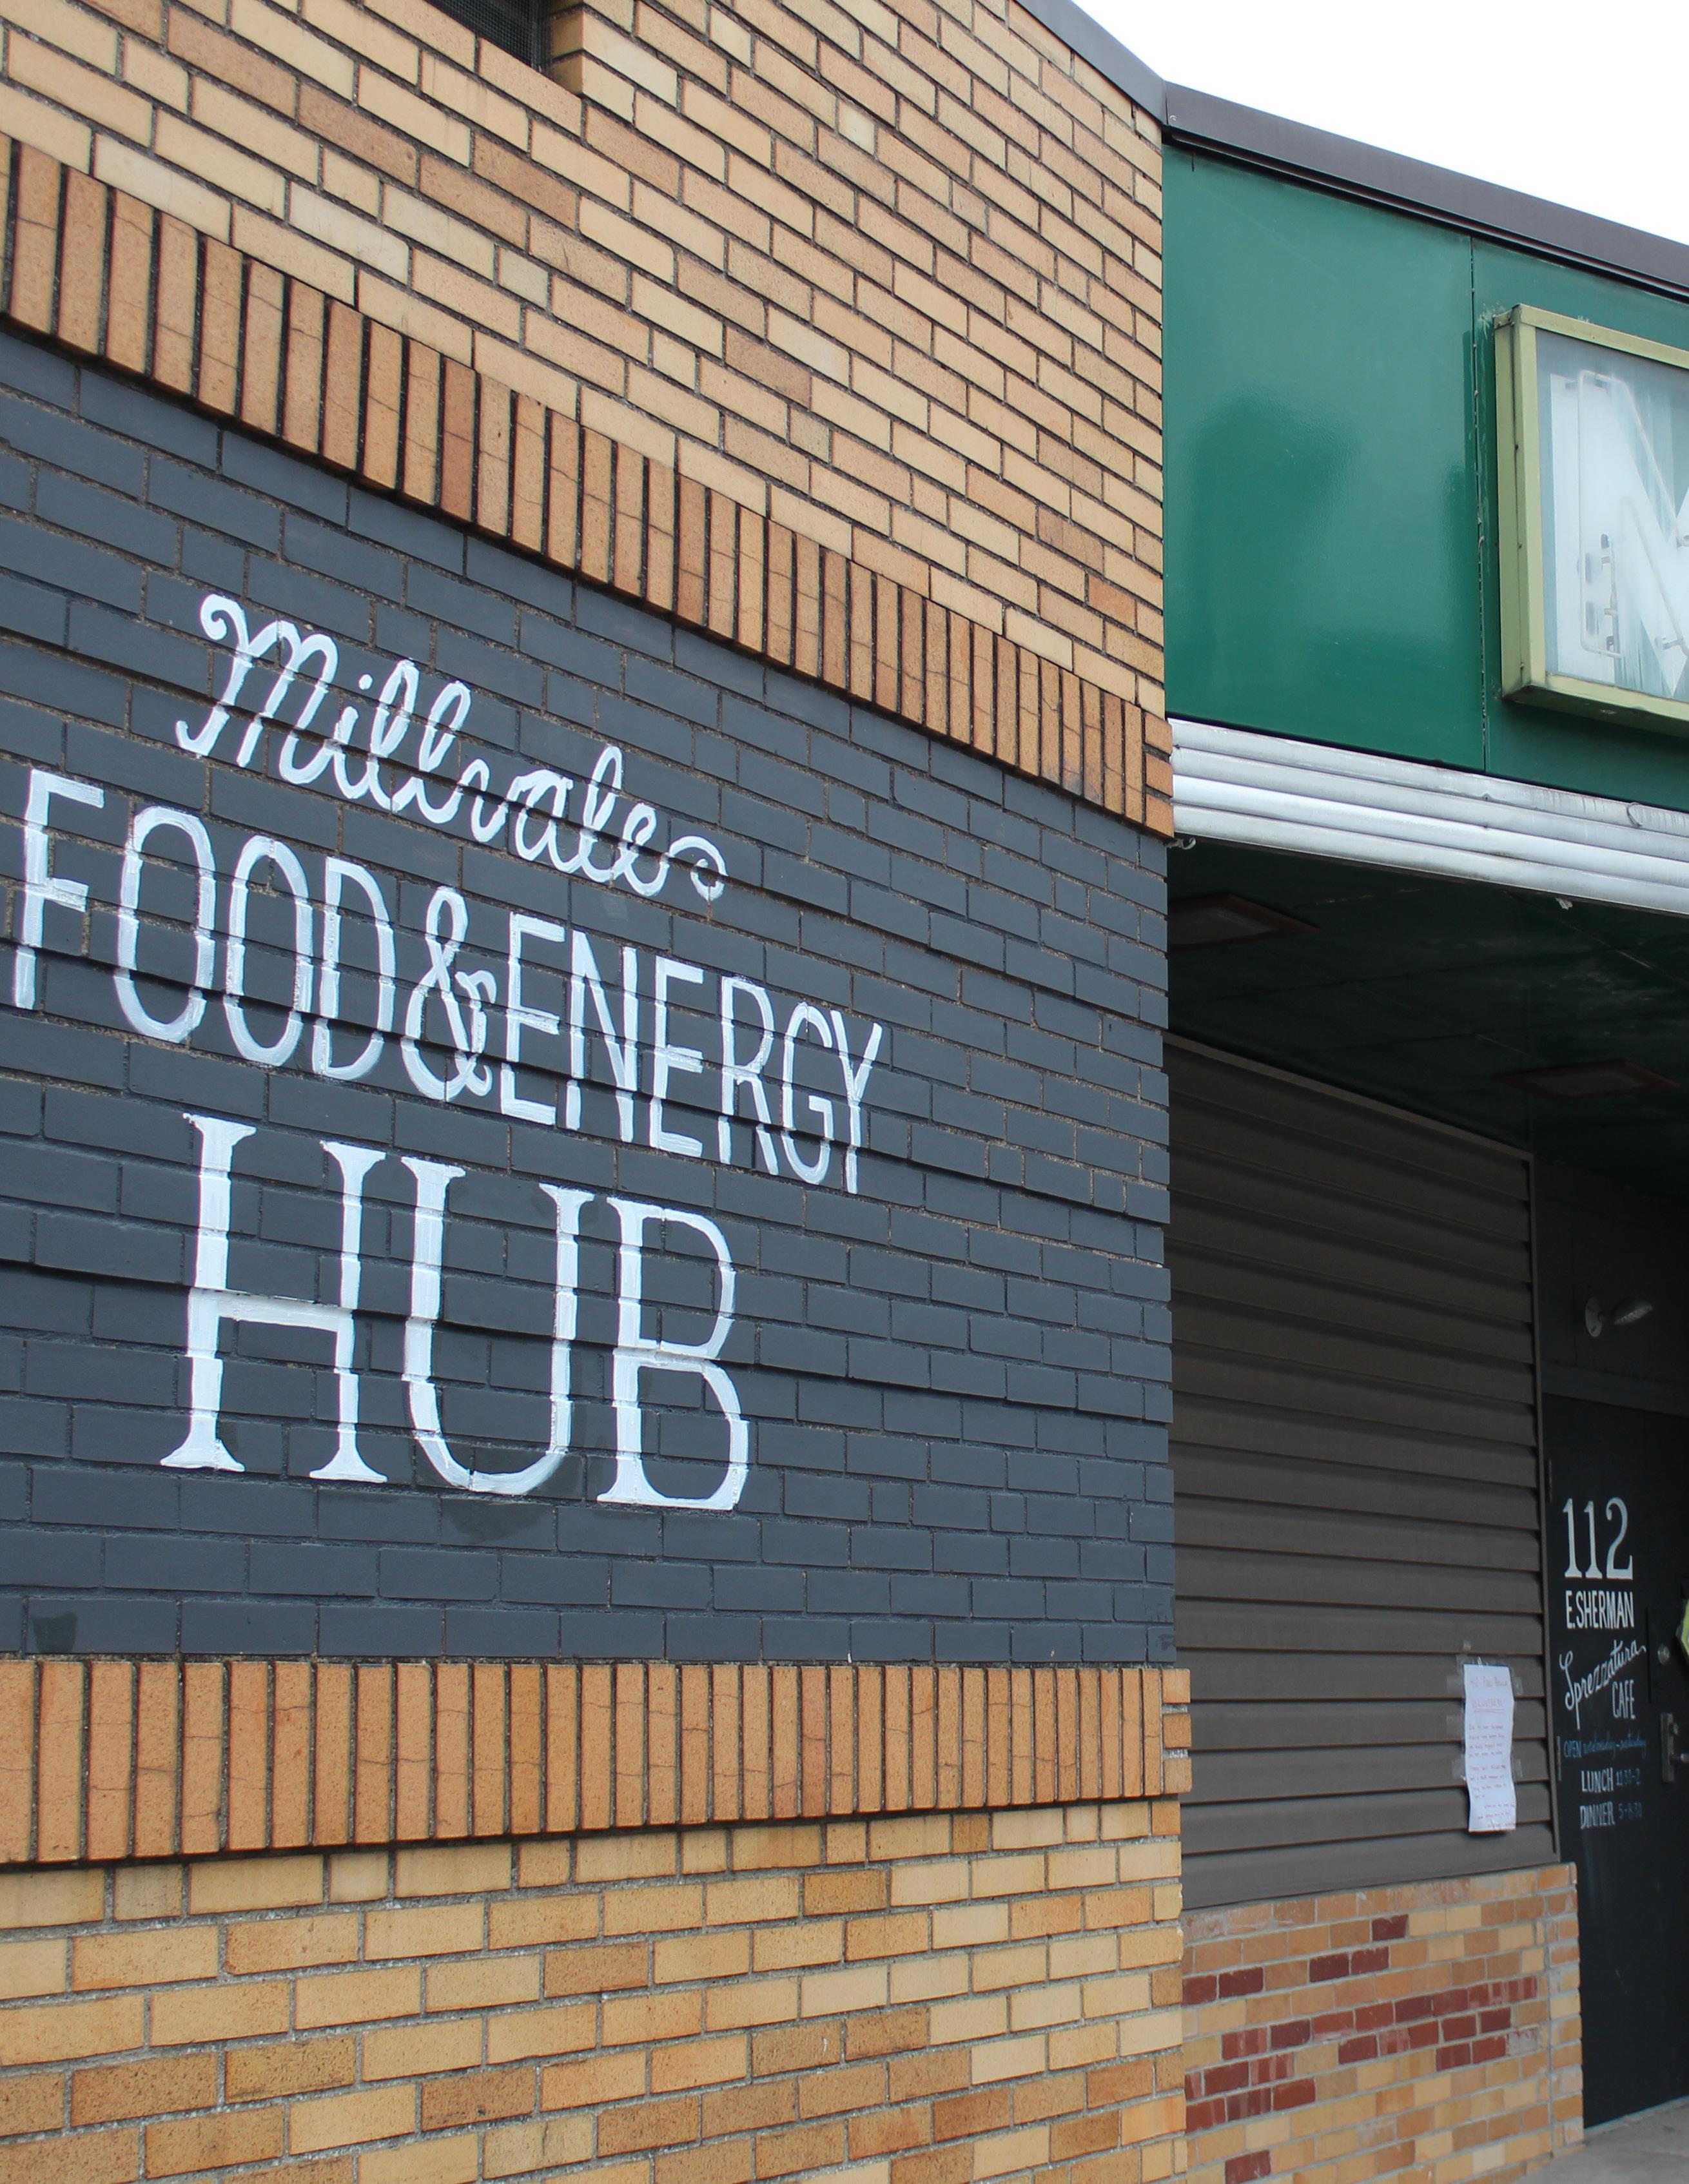
New Sun Rising’s Millvale Food and Energy Hub has already installed the foundational infrastructure to become a community resilience hub. The building’s solar DC microgrid system is able to provide uninterrupted communication and coordination out of the building during emergencies when the public electricity grid is down. If there is a flood or other event where the public grid goes down, the Food + Energy Hub is able to continue running cooling and heating systems, refrigeration, lighting, provide internet, and become a shelter for Millvale during emergency communication efforts.
There are many additional opportunities to create resilience hubs throughout the Triboro Ecodistrict, especially in locations where adjacent buildings can connect to the same microgrid, thereby pooling their resources.
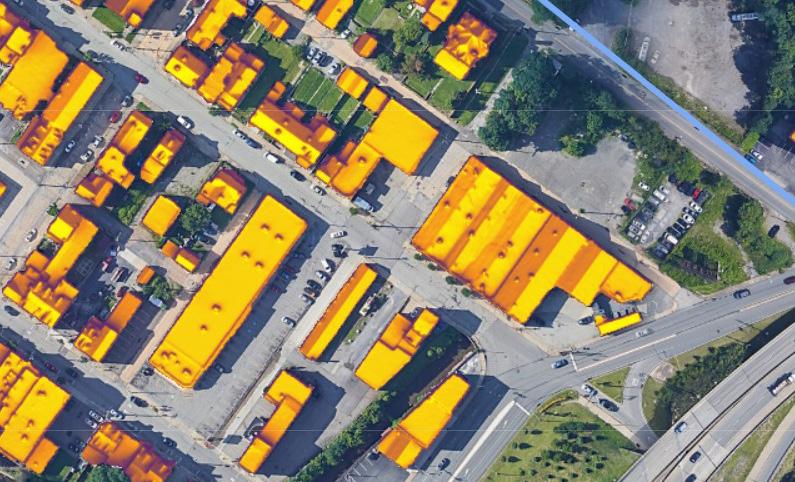
The first step is to determine which properties are viable for photovoltaic arrays. This research has already been performed by Brian Wolovich and Noah Bushlow. Their research produced an inventory of properties with at least 5,000 ft.2 of roof space or vacant land of at least 1 acre. Using Project Sunroof, they determined that there is 1,390,630 ft.2 of available area for solar panels in the Triboro Ecodistrict, which could accommodate 25.28 mW worth of photovoltaic systems.
There are three standout properties, one in each of the three communities, that would provide significant unobstructed roof area, and therefore significant renewable energy production potential. These properties are adjacent to other ideal candidates for PV arrays, and if they were to pool their resources, could provide significant impact as community resilience hubs.
Focusing on the standout property in Millvale, 112 Lincoln Avenue, according to PVWatts, if this property installed a 170 kW solar array, it could produce 201,900 kWh of renewable energy annually (688.9 MMBTU).
This property could connect to a microgrid with other adjacent solar candidates to produce a resilience cluster, including:
113 Lincoln Avenue. If this property installed a 32 kW solar array, it could produce 38,005 kWh of renewable energy annually (129.7 MMBTU).
126 Lincoln Avenue. If this property installed a 32 kW solar array, it could produce 38,005 kWh of renewable energy annually (129.7 MMBTU).
123,129 Lincoln Avenue + 124 Grant Avenue. If these properties (who share a roof) installed a 100 kW solar array, it could produce 118,765 kWh of renewable energy annually (405 MMBTU).
Cumulatively, this cluster of buildings could produce 1,353.3 MMBTU of renewable energy annually.
This cluster of buildings could product 1,353.3 MMBTU of renewable energy annually
If this cluster of buildings pooled their resources, installed solar arrays, and connected to the same microgrid, it could become a resilience cluster that would serve a similar function as the Millvale Food + Energy Hub, but with greater capacity.
A. Precedent Research
B. Hierarchy and Ranking of Characteristics Based on Research
C. Energy Analysis Assumptions and Comparison
D. Building Characteristic Maps and Analysis
E. Resident Survey Questions and Results
Prior to the implementation of the Triboro Energy Baseline Study, Sarah SanGiovanni performed precedent research to understand the methodology pursued by other community energy studies. A summary of this research is provided below. While no single precedent directly informed the methodology of this study, the precedent research provided useful findings that informed aspects of this methodology.
http://www.livingcully.org/incomin g/2018/05/LC-Community-EnergyPlan-FINAL-6.pdf
mattered to them (and may matter for us if we are asking for energy bills from building tenants/owners) was: for multi -family units, is there one bill sent by the utility to the building owner, or are individual bills sent to users of the building? This might be important to know when
http://www.morpc.org/wordpress/ wpcontent/uploads/2018/06/2018-
GBA was already having several buildings monitor their energy use via the energy star tool before trying to assess at the district level. Maybe as part of this methodology, there should be broad recruitment of people to track their energy use using energy star? But only use the data to calculate representative energy use for those who fit the building typologies. Potentially it would be useful to start getting people into tracking their energy use via energy star in Etna/Sharpsburg too (although this would perhaps have an effect on peoples usage and therefore affect the data; this report indicated that just by tracking their use people tended to reduce their use).
• Use the energy star tool to develop the survey of residents (i.e., collect the same things from residents via a survey that the energy star tool uses) so that we could use the energy star tool/what we collect could be easily compared to the national averages, etc., that this tool provides. This could maybe put less burden on people to track energy use on their own?
http://www.2030districts.org/sites/ default/files/atoms/files/Pittsburgh _2030_District-Energy_Baseline.pdf
Pittsburgh 2030 Dist...
• http://energymap.cityofchicago.org /
The consultant team performed research on building characteristics and their impact on energy consumption. This research was summarized and building characteristics were ranked based on impact on energy consumption, characteristics that can be changed, and characteristics that can be analyzed based on publicly available data. This research informed the refinement of six building characteristics that formed the basis of the utility data collection and analysis.
TYPOLOGIES (physical characteristics)
# Characteristics included High/low energy consumption ranking (hypothesis)
While the Triboro Energy Baseline Study was performed with the best available data and methods available to the consultant team at the time, there are limitations to this study. The consultant team compared the residential data collection results to the energy analysis performed as part of the ICLEI Climate Action Plan efforts conducted by Penn State University Students and noticed varying discrepancies in residential energy consumption between the two efforts. This is likely due to differing “data cleaning” methods between the two efforts.
The following assumptions were made as part of the energy use analysis:
• Properties listed with 0 square footage in area, “N/A” listed for energy consumption, and dwelling types of 5 housing units or more were excluded from this analysis.
• This process eliminated 32 properties in Millvale, 25 properties in Sharpsburg, and 13 properties in Etna.
• In the Allegheny Property Assessments, CDUDESC was used for building condition and “Finished Living Area” was used for gross square footage.
• The ACS Housing Summary (2017) was referenced to determine how many properties are all-electric with no natural gas use. The difference in total number of all-electric properties analyzed as part of this study compared to the ACS estimate is 91 properties in Sharpsburg, 121 in Etna, and 102 properties in Millvale.
ON THE FOLLOWING PAGES


SINGLE FAMILY ROWHOUSE TOWNHOUSE TWO FAMILY THREE FAMILY FOUR FAMILY APART: 5-19 UNITS APART:20-39 UNITS INDEPENDENT LIVING (SENIORS)



Thank you for your interest in the Millvale Energy Use Survey! This survey will help show current energy use and costs in Millvale. With this information, the TriBoro Ecodistrict will implement programs to reduce energy use and help you save money on your energy bills. It should only take 10 minutes to complete this survey and those who participate will be entered to win a raffle with $250 worth of gift cards and prizes.
An additional $500 fund will be distributed among selected volunteers willing to share their June 2019 energy bill (gas and electric). Sharing energy bills will provide more detailed energy use and expense information for Millvale. Your personal information will not be shared and participating will not affect your eligibility for utility assistance programs now or in the future.

To submit your survey, enter the $250 raffle, and indicate whether you are interested in sharing your energy bill, please fill out the bottom portion of this page and return it with your completed survey by:
A) Dropping it off in person at the Millvale Community Library
B) Mailing it to the Millvale Community Library using the included stamped envelope
Submit your survey by the deadline of January 31, 2020.
If you would prefer, you can fill out and submit this survey online instead by visiting: https://tinyurl.com/MillvaleEnergyUse
I HAVE COMPLETED THE MILLVALE ENERGY SURVEY!
Name: __________________________________________________
Email:
Phone: _________________________________________________
Home address in Millvale: ______________________________________________
Are you interested in learning more about sharing your June 2019 energy bill? A Triboro Ecodistrict organizer will contact you to follow up if you select “Yes”
o Yes o No
What is the best way to reach you about the raffle result and/or sharing your June 2019 energy bill?
oPhone call
oEmail
o Letter home
This survey is a project of the Triboro Ecodistrict, a coordinated sustainable development initiative across The Boroughs of Millvale, Etna, and Sharpsburg. To learn more, see: https://www.newsunrising.org/project/triboro-ecodistrict/

Instructions: Please answer each question on this survey to the best of your knowledge for your home in Millvale. If you do not know the answer or prefer not to answer, please leave the question blank.
Q1. How many people live in this home on a daily basis?
o 1 person
o 2 – 3 people
Q2. How many bedrooms are in your home?
o 1 Bedroom
o 2 Bedrooms
o 3 Bedrooms
o 4 – 5 people
o More than 5 people
o 4 Bedrooms
o 5+ Bedrooms
Q3. How often do members of your household find your home to be too drafty? Drafty means you feel cold air coming into the house under the doors, near the windows, or in other places in your home.
o All the time
o Most of the time
o Some of the time
o Never
Q4. What sources of energy do you use in your home?

Q5. What is the main type of heating equipment used to heat your home?
o My home is not heated
o Central furnace
o Heat pump
o Steam or hot water system with radiators or pipes
o Built-in electric units installed in walls, ceilings, baseboards, or floors

o Built-in floor/wall pipe-less furnace
o Built-in room heater burning gas, oil, or kerosene
o Heating stove burning wood, coal, or coke
o Portable electric heaters
o Fireplace
o Other (write in):
Q6. Do you have air conditioning in your home? If so, please specify the type of equipment you use and the number of units you own:
o I do not have air conditioning
o I have central AC
o I have 1 window unit or portable AC
o I have 2 window units or portable ACs
o I have 3+ window units or portable ACs
Q7. Do you have laundry machines in your home? If your home is in an apartment building, please indicate whether you have access to laundry machines in your building or unit.
o No, I do not have laundry machines
o Yes, I have laundry machines in my home/apartment unit
o Laundry machines are available in my apartment building (Write in number of machines available)
Q8. During the following seasons/times of day, what is the typical temperature in your home?
Summer
Daytime when people are home: _____
Daytime when no one is home: _____
Over night: _____
Winter
Daytime when people are home: _____
Daytime when no one is home: _____
Over night: _____
Q9. About how old are the following appliances in your home?
Q10. Please indicate what portion of the light bulbs inside your home are of each type:


Q11. Who is responsible for paying energy bills in your household? Please check all that apply:
o Self
o Family members or roommates
o
o Other (write in)
Q12. A home energy audit is when a trained professional examines how energy is used in all parts of a home. After examining a home, the energy auditor will provide a list of ways to reduce energy use and save money on energy bills. Has your home ever had a home energy audit, and if so were changes made to your home based on the audit’s results?
o Not sure
o No, my home has not had an energy audit
o Yes, my home has had an energy audit. Changes WERE made to my house based on the audit’s results
o Yes, my home has had an energy audit. Changes WERE NOT made to my house based on the audit’s results
Q13. Has your household received any of the following energy-related benefits or assistance for your home? Please check all that apply.
o Free or subsidized energy-efficient light bulbs
o Free or subsidized home energy audit
o Utility or energy supplier rebate for new appliance equipment

o Recycling of old appliance or equipment (e. g., a refrigerator)
o Tax credit for new appliance or equipment
o Home winterizing/weatherization kits or materials
o Other (write in)
Q14. Has your household worked with any of the following organizations to implement energy efficiency programs for your home?
o No
o Duquesne Light
o People’s Natural Gas
o Grassroots Greenhomes
o Other (write in) __________________
Q15. In the last year, how many months did your household reduce or forgo expenses for basic household necessities, such as medicine or food, in order to pay an energy bill?
o Almost every month
o Some months
o 1 or 2 months
o Never
Q16. In the last year, how many months did your household keep your home at a temperature you felt was unsafe or unhealthy?
o Almost every month
o Some months in the summer
o Some months in the winter
o Never
Q17. In the last year, did anyone in your household receive medical attention because your home was either too hot or too cold?
o Yes
o No
Q18. Which of the following statements best describes your interest in energy conservation in your home?
o I am not interested in energy conservation in my home
o I am interested in energy conservation in my home primarily to save money on energy bills
o I am interested in energy conservation in my home primarily because of environmental concerns
o I am interested in energy conservation in my home for both cost-savings and environmental reasons
o I am interested in energy conservation in my home for other reasons (write in)
Q19. How often do you turn off the lights when a room is not in use?
o Always
o Sometimes
o Never
Q20. How often do you use cold water instead of hot water for tasks such as laundry or washing the dishes?
o Always
o Sometimes
o Never
Q21. How interested are you in learning about or expanding your use of renewable energy through energy assistance programs, cooperative models, or community projects in Millvale?

o Very interested
o Somewhat interested
o Not interested
Q22. Do you use any of the following renewable energy options? Check all that apply
o Solar panels have been installed on my house
o I am part of a solar co-op
o I purchase green energy through my energy supplier
o I use other types of renewable energy (write in) _______________

Q23. Do you own or rent your home?
o Own
o Rent
Q24. For how long have you lived at your current address?
o 1 year or less
o 2 – 3 years
o 4 – 5 years
o 6 – 10 years
o 11 – 14 years
o 15 – 19 years
o Other (write in):___________________
o 20+ years
Q25. In what range does your typical annual household income fall?
o Less than $25,000
o $25,000 to $34,999
o $35,000 to $49,999
o $50,000 to $74,999
o $75,000 to $99,999
o $100,000 to $149,999
Q26. What is your highest attained level of education?
o High school diploma or equivalent
o Associates degree
o Some college
o College degree
Q27. With what gender do you identify? Please write in: ________________________
o $150,000 to $199,999
o $200,000 or higher
o Graduate degree
o Other (write in)
Q28. With what race(s) do you identify? Please write in: PAGE 6
If you did not previously provide the following contact information one the first page of this survey, please do so now! This survey will help show current energy use and costs in Millvale. With this information, the TriBoro Ecodistrict will implement programs to reduce energy use and help you save money on your energy bills. Those who participate will be entered to win a raffle with $250 worth of gift cards/prizes.
An additional $500 fund will be distributed among selected volunteers willing to share their June 2019 energy bill (gas and electric). Sharing energy bills will provide more detailed energy use and expense information for Millvale. Your personal information will not be shared and participating will not affect your eligibility for utility assistance programs now or in the future.

To submit your survey, enter the $250 raffle, and indicate whether you may be interested in sharing your June 2019 energy bill for additional financial compensation, please submit your survey by either dropping it off in person to the Millvale Community Library or mailing it to the Millvale Community Library using the included self-addressed stamped envelope.
Please submit your survey by the deadline: January 31, 2020
I HAVE COMPLETED THE MILLVALE ENERGY SURVEY!
Name: __________________________________________________
Email:
Phone: _____________________________________________________________
Home address in Millvale:
Are you interested in learning more about sharing your June 2019 energy bill? A Triboro Ecodistrict organizer will contact you to follow up if you select “Yes”
o Yes o No
What is the best way to reach you about the raffle result and/or sharing your June 2019 energy bill?
oPhone call
oEmail
o Letter home
ENERGY
