Articulation


1. Symphysis mente/mental symphysis- midline ridge of mandible.
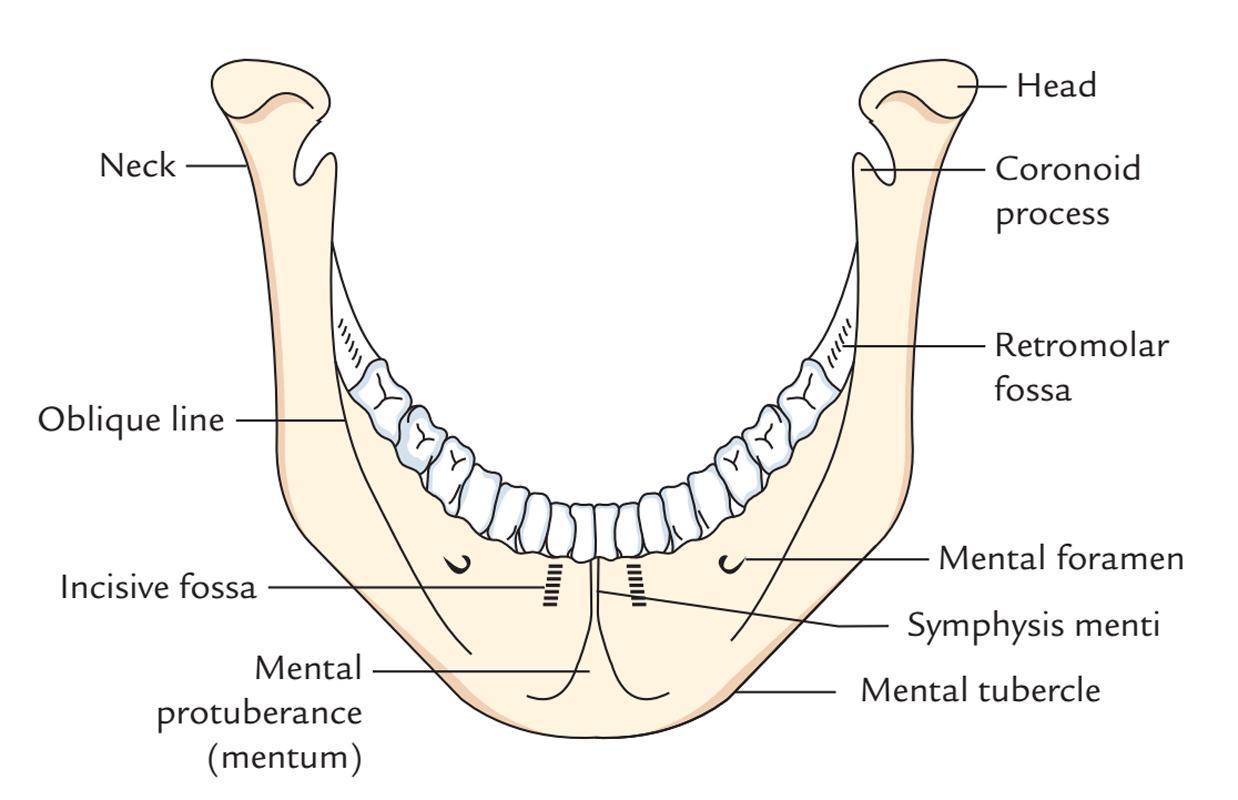
2. Mental foramen- holes that provide path to trigeminal nerve (CN V)
3. Mental protuberance- the protruding part of the chin
4. Mental tubercles- two anterior projections on the sides of the mental protuberance

1. Corpus: body
2. Angle: between corpus & ramus
3. Ramus: vertical portion of mandible
4. Coronoid process: anterior of the mandible
5. Condylar process: head & neck, posterior
6. Pterygoid process: present on the head of condylar
(anterior)

1. Dental alveoli: indentation where teeth is present
2. Alveolar arch: supports lower teeth
3. Mylohyoid line: attachment for mylohyoid muscle
4. Mandibular foramen: passage of CN V
5. Superior and inferior mental spines: point of attachment for genioglossus muscle

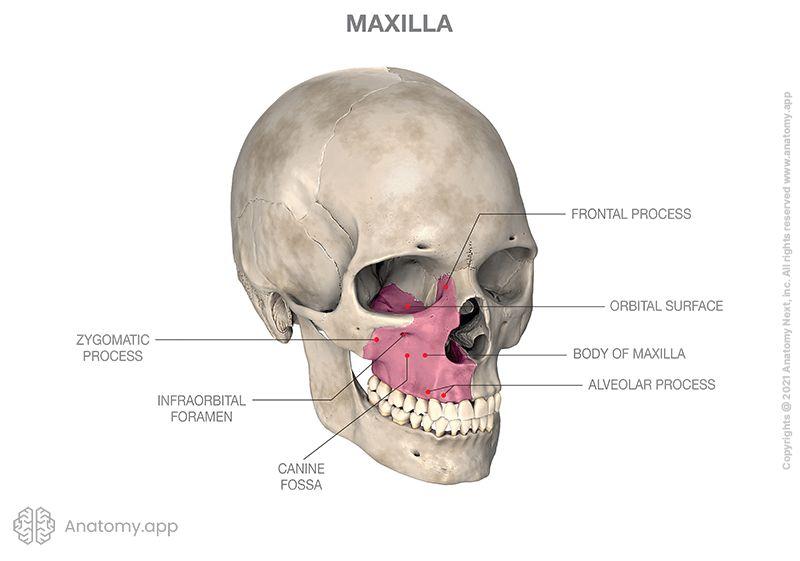
Frontal View:
1. Zygomatic process
2. Frontal process
3. Orbital process
4. Infraorbital margin
5. Infraorbital foramen

1.
2.
3.
4.
5.
6.
Anterior nasal spine Nasal notch Nasal crest Alveolar process Maxillary sinus Palatine process
1. Intermaxillary suture
2. Palatine process
3. Premaxilla, premaxillary suture
4. Incisive foramen

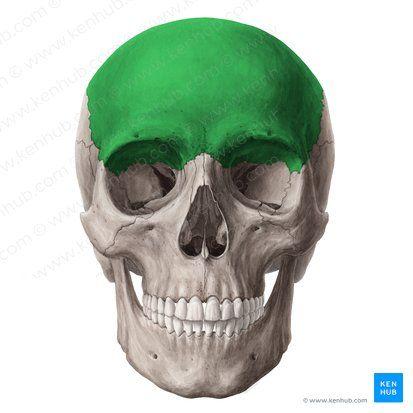
● Frontal bone makes the forehead space ● It articulates with the nasal bone and the maxilla ● The orbital portion is also part of the frontal bone
● It is the middle portion of the bones of the brain
● This bone covers the parietal lobe of the brain
● Sutures:
○ Sagittal
○ Lamboidal
○ Lateral
○ Coronal
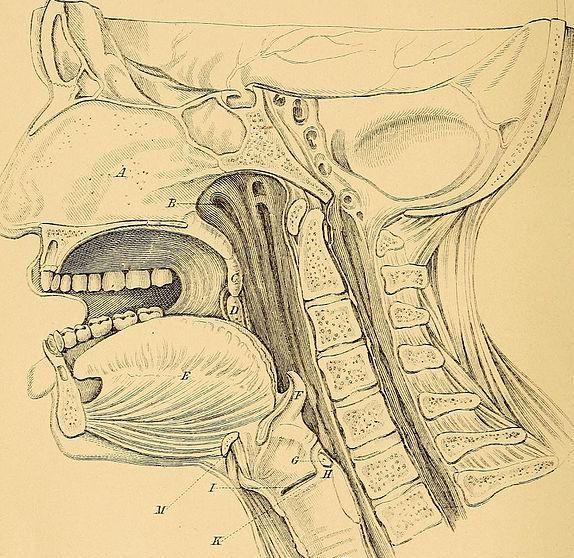
● Resonance: the vibrating response to an applied force. It is the response of air molecules to some source of sound present in oral, nasal, and pharyngeal cavities
● Resonating cavities: they do not make sound but instead modify sound. Some cavities include oral, nasal, and pharyngeal cavities. Changing the shape of the resonating cavities changes the shape of the vocal tract, which changes the air pressure produced, and hence changes in sound.

Source: vocal folds
Filter: vocal tract
Air molecules that has undergone vibration with the help of vocal folds passes through the vocal tract, creating a spectrum with broadband energy peaks.
Graph 1: In the source spectrum intensity becomes less in the graph with the increase in frequency. These frequencies are coming from the larynx.
Graph 2: In the filter spectrum, from the cavities, the intensity amplifies and attenuates.
Graph 3: In the output spectrum there can be seen peaks which are called formants, these help detect sound.