MARKET SNAPSHOT


2023 Q1 ATLANTA,GEORGIA
Market Snapshot

2023 Q1 ATLANTA,GEORGIA

Single-Family Homes Condominiums Townhomes Inside the Perimeter 8 - 27 Outside the Perimeter 28 - 45 Inside the Perimeter 46 - 55 Outside the Perimeter 56 - 61 Inside the Perimeter 62 - 71 Outside the Perimeter 72 - 83 Market Overview 4 - 7
Market Overview
The real estate market has been largely defined by rising mortgage rates since summer 2022, when the average 30year fixed rate mortgage went over 5.25% for the first time in more than a decade. Q1 2023 marked a full year since interest rates began rising, and rates finally started to gradually decline. Now, patient would-be buyers who have been in “waiting mode” are slowly returning to the market.
February and March 2023 posted month-over-month (MOM) increases in closed sales in Metro Atlanta, signaling the start of the spring market. Although there is momentum brewing, home sales have not increased as dramatically as in a typical year, as interest rates remain elevated. There were 11,709 closed sales and 14,110 pending sales in Q1 2023. That was 25.3% fewer closed sales and 24.8% fewer pending sales than the average for Q1 from 2017 to 2022. Sales picked up each month of the quarter, jumping 35.7% MOM from January (2,866 closed sales) to February (3,891 closed sales) and 29.9% from February to March (5,058 closed sales).
On average, closed sales were down -28.1% YOY in Q1. Condominium sales had the largest year-over-year decline in closed sales (-41.9%), followed by single-family homes (-27.8%), with townhomes posting the fewest declines (-20%). In terms of price point, homes priced under $500,000 had the largest decline in home sales (-30.5% YOY), in part because home values have risen, moving homes into higher brackets. Homes priced $500,000 to $749,999 were down -23.1% YOY, those priced $750,000 to $999,999 were down -24% YOY, and homes over $1 million declined the least at -15% YOY. Most homes sold in the metro area were under $500,000 (69%).
Q1 2023 at a Glance
11,709 homes sold
$463,918 average sale price
1.8 months of inventory
44 average days on market
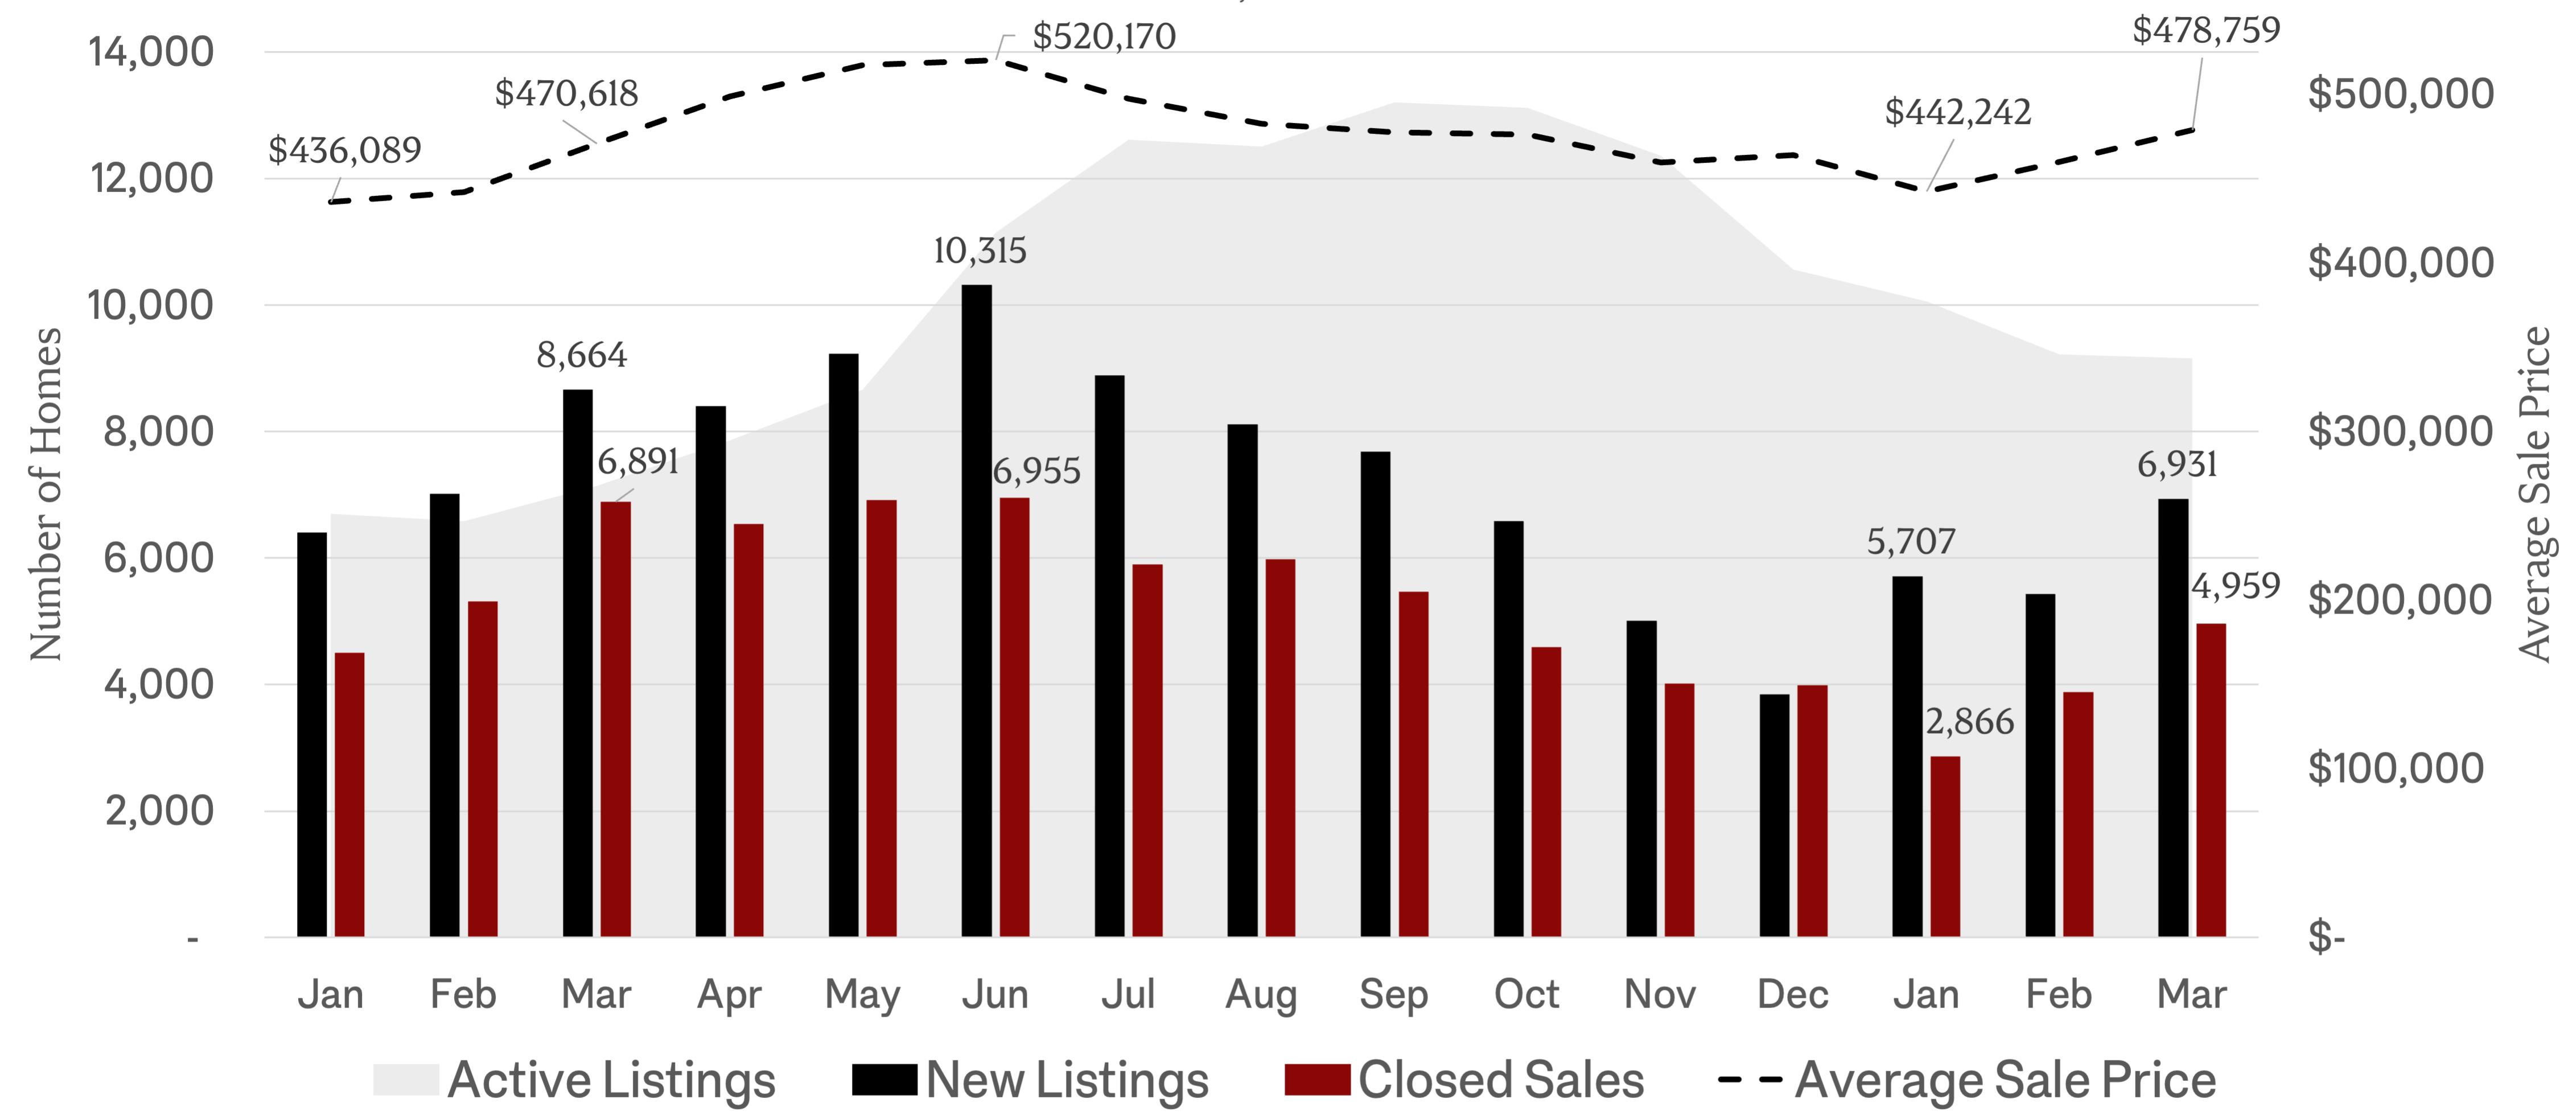
Home prices were up year-overyear in Q1, averaging $463,918 (+2.6% YOY). They rose steadily throughout the quarter—a normal seasonal trend— up 8.3% from January to March, when prices averaged $478,759. Homes
Q1 2023 ATLANTA MARKET SNAPSHOT 4 EVATLANTA.COM
Source: FMLS InfoSparks, Greater Atlanta Area (Cherokee, Clayton, Cobb, DeKalb, Douglas, Fayette, Forsyth, Fulton, Gwinnett, Henry, and Rockdale Counties) All home types, All price points, Rolling 3-months as of March 2023
Metro Atlanta Supply Dynamics Summary (January 2022 - March 2023)
Source: FMLS InfoSparks, Greater Atlanta Area, All Home Types, January 2022 to March 2023
Metro Atlanta Market Summary (Q1 2023)
q Down Year-Over-Year (YOY) p Up YOY
Source: FMLS InfoSparks, Greater Atlanta Area/City of Atlanta/ITP, All home types, All price points, Rolling 3-months as of March 2023 (year-over-year change compared to rolling 3-months as of March 2022), Retrieved 4/10/23
Q1 2023 ATLANTA MARKET SNAPSHOT 5 EVATLANTA.COM Metro Atlanta City of Atlanta ITP Closed Sales 11,709 q -29.3% 2,016 q -40.0% 2,278 q -39.5% Pending Sales 14,110 q -23.3% 2,502 q -33.5% 2,814 q -33.9% Active Listings 9,493 p +39.1% 2,189 p +33.0% 2,467 p +39.3% New Listings 18,083 q -17.8% 3,838 q -16.0% 4,384 q -14.2% Median Sale Price $388,000 p +0.8% $390,000 q -0.5% $415,000 p +2.0% Average Sale Price $463,918 p +2.6% $533,013 p +0.7% $557,859 p +3.0% Average Price Per Square Foot $203 p +1.0% $272 p +1.5% $279 p +1.8% Average Sale Price to Original List Price Ratio 96.2% q -4.9% 96.0% q -3.6% 96.0% q -3.5% Months of Inventory 1.8 p +80% 2.4 p +84.6% 2.4 p +100% Average Days on Market 44 p +91.3% 41 p +28.1% 41 p +28.1%
sold for 96.2% of the original list price on average, a typical prepandemic range.
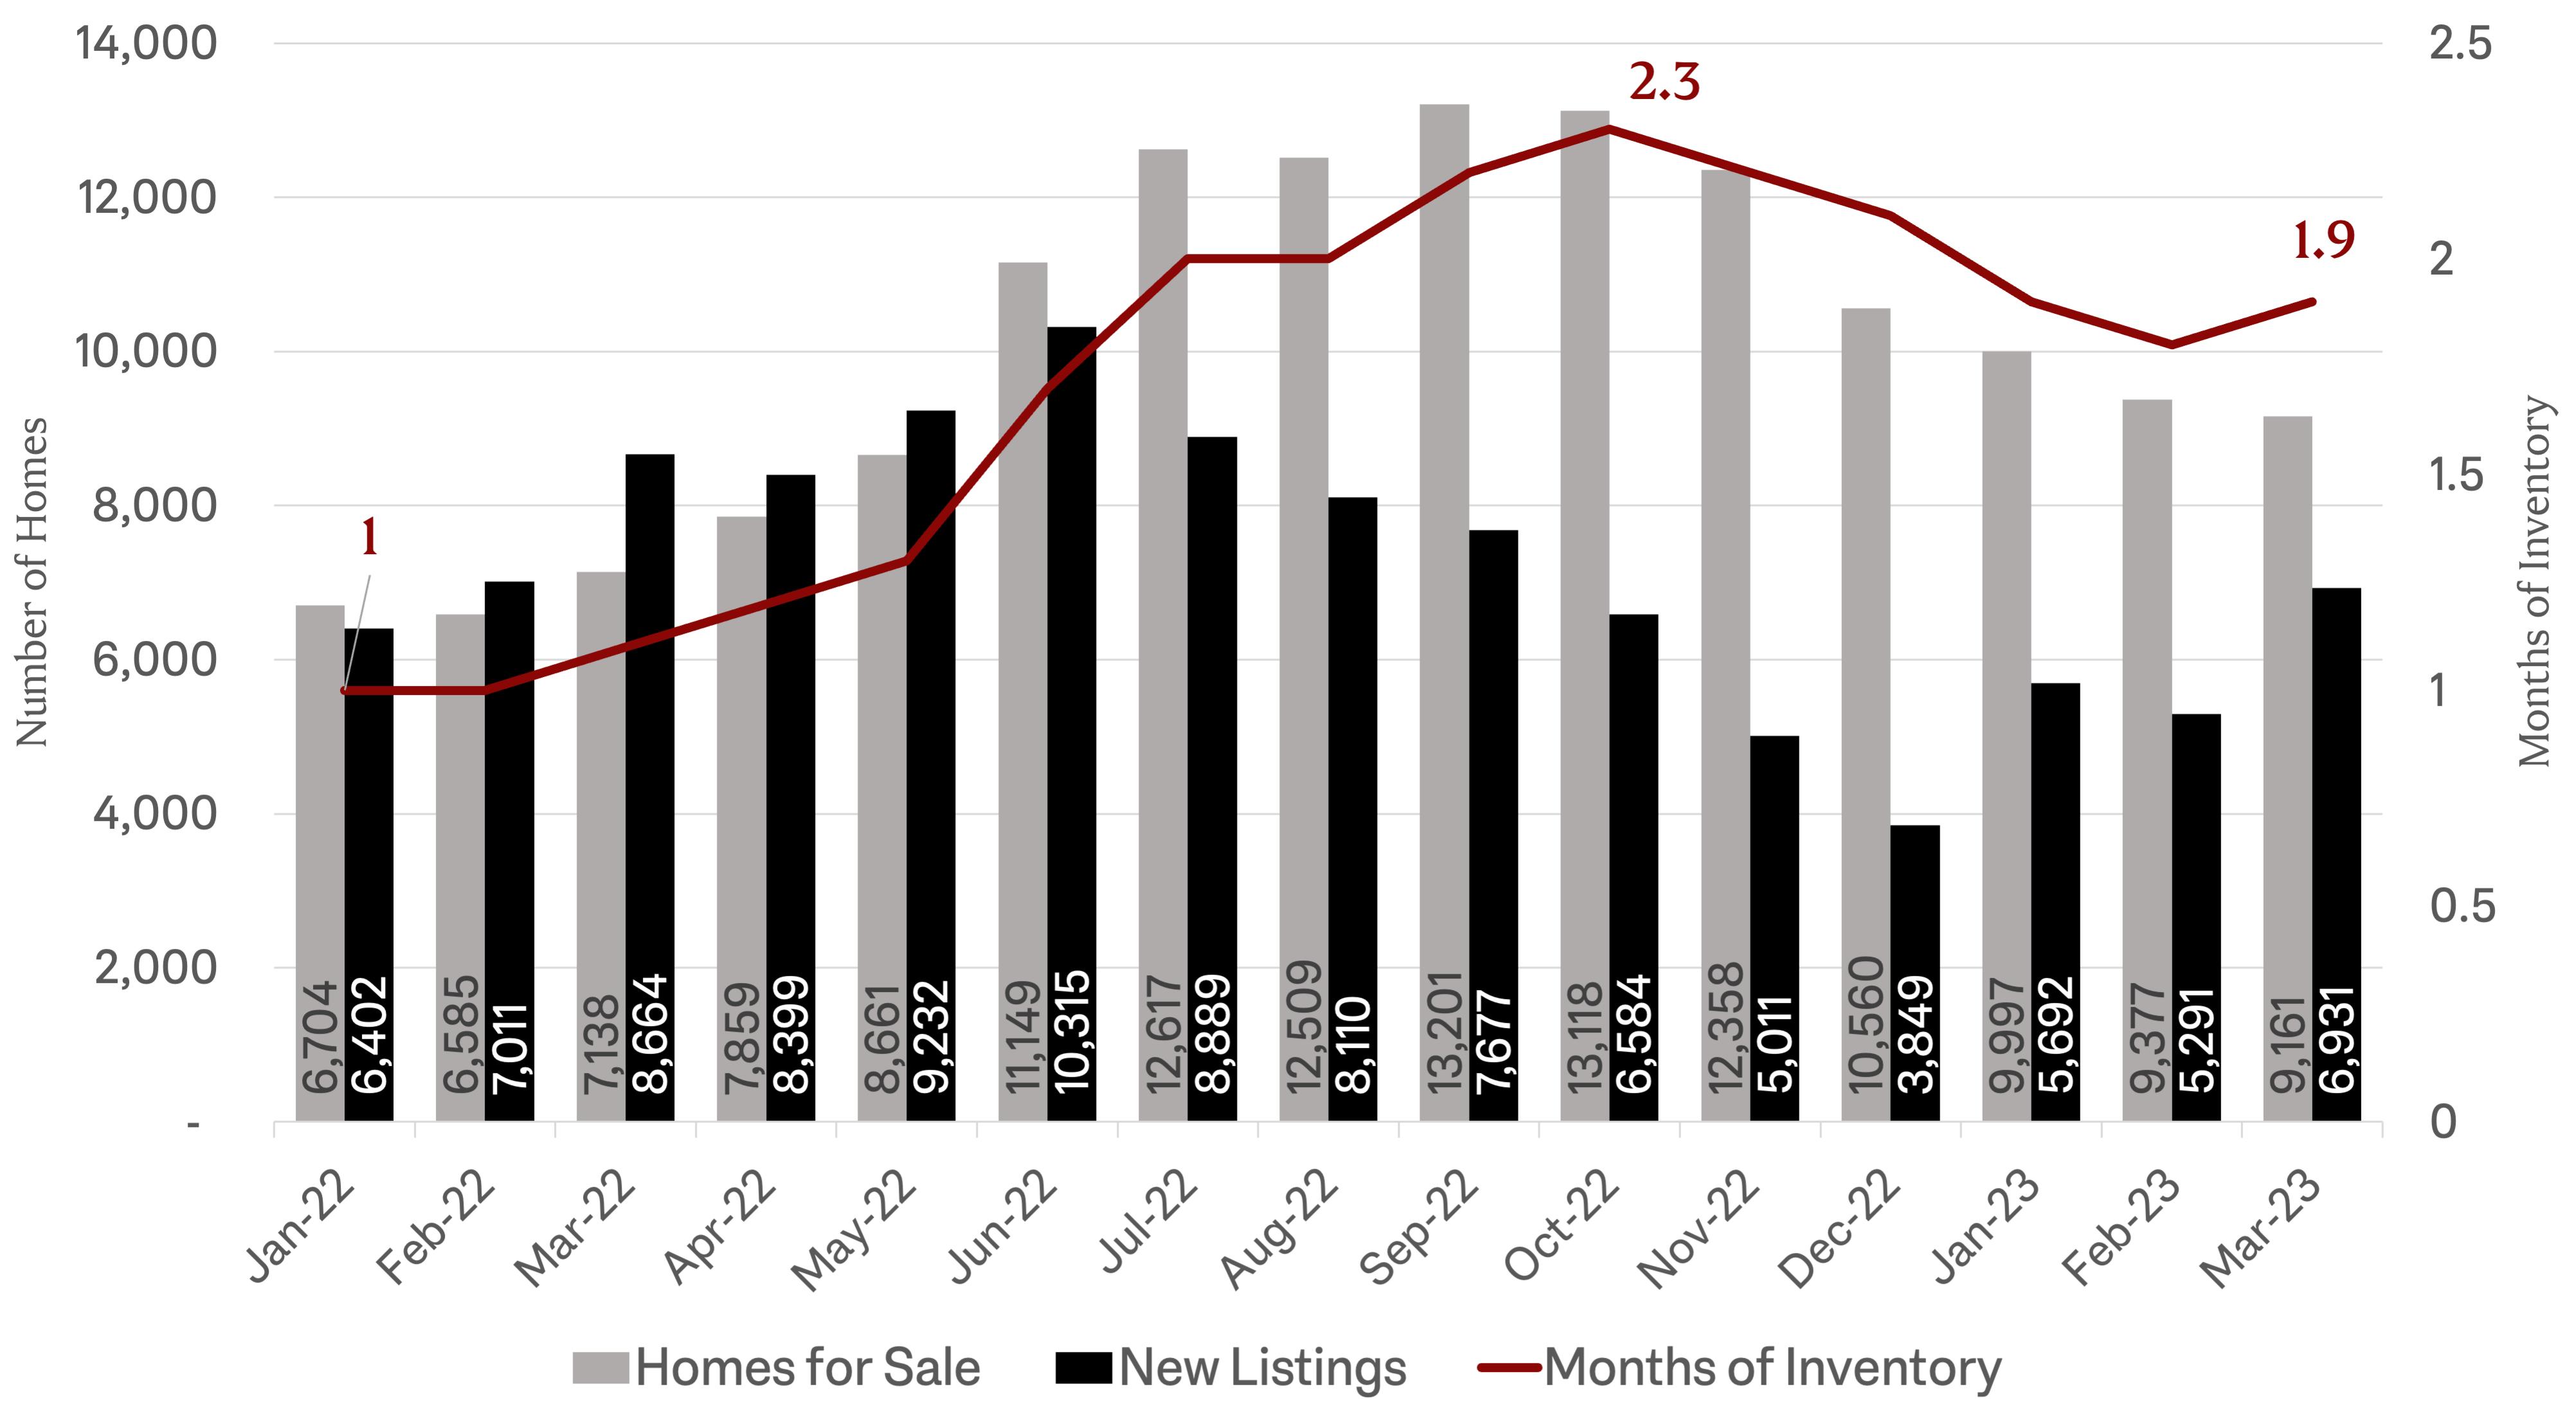
Inventory has been declining since November, as fewer existing homeowners with low rates have been willing to put their homes on the market. In Q1, there was 1.8 months of inventory, a level considered to be in the “seller’s market” range. This low level of inventory has contributed to rising yearover-year home prices despite lower demand due to interest rates. It has also been a source of frustration for buyers, who often feel there are not enough desirable homes to choose from. New listings rose in January for the first time since June 2022. There was a dip in new listings in February when interest rates rose, but they increased again in March, showing more sellers are ready to make a move.
Last spring, homes sold at a record pace of about two weeks. As interest rates rose, so did the average days on market. By February, it reached 46 days, a peak for this year but lower than the same time in 2019 (54 days), a typical pre-pandemic year. In March, it declined for the first time in 11 months to 43 days, a sign of buyers returning to the market. In some high demand submarkets, homes continue to sell in less than three weeks.
With interest rates impacting buying and selling decisions, it is important to understand
where they are headed. As of April 13, 2023, the national average 30-year fixed rate mortgage was 6.27%. 1 Rates are expected to remain elevated but gradually decline throughout the year, likely ending the year in the mid- to high-5% range. Home sales are forecasted to increase throughout the year as lower interest rates make home ownership more affordable and latent demand returns. 2, 3, 4, 5 In the meantime, many lenders and new construction developers are continuing to offer incentives like rate buydowns or no-closing cost refinancing to reduce mortgage costs.
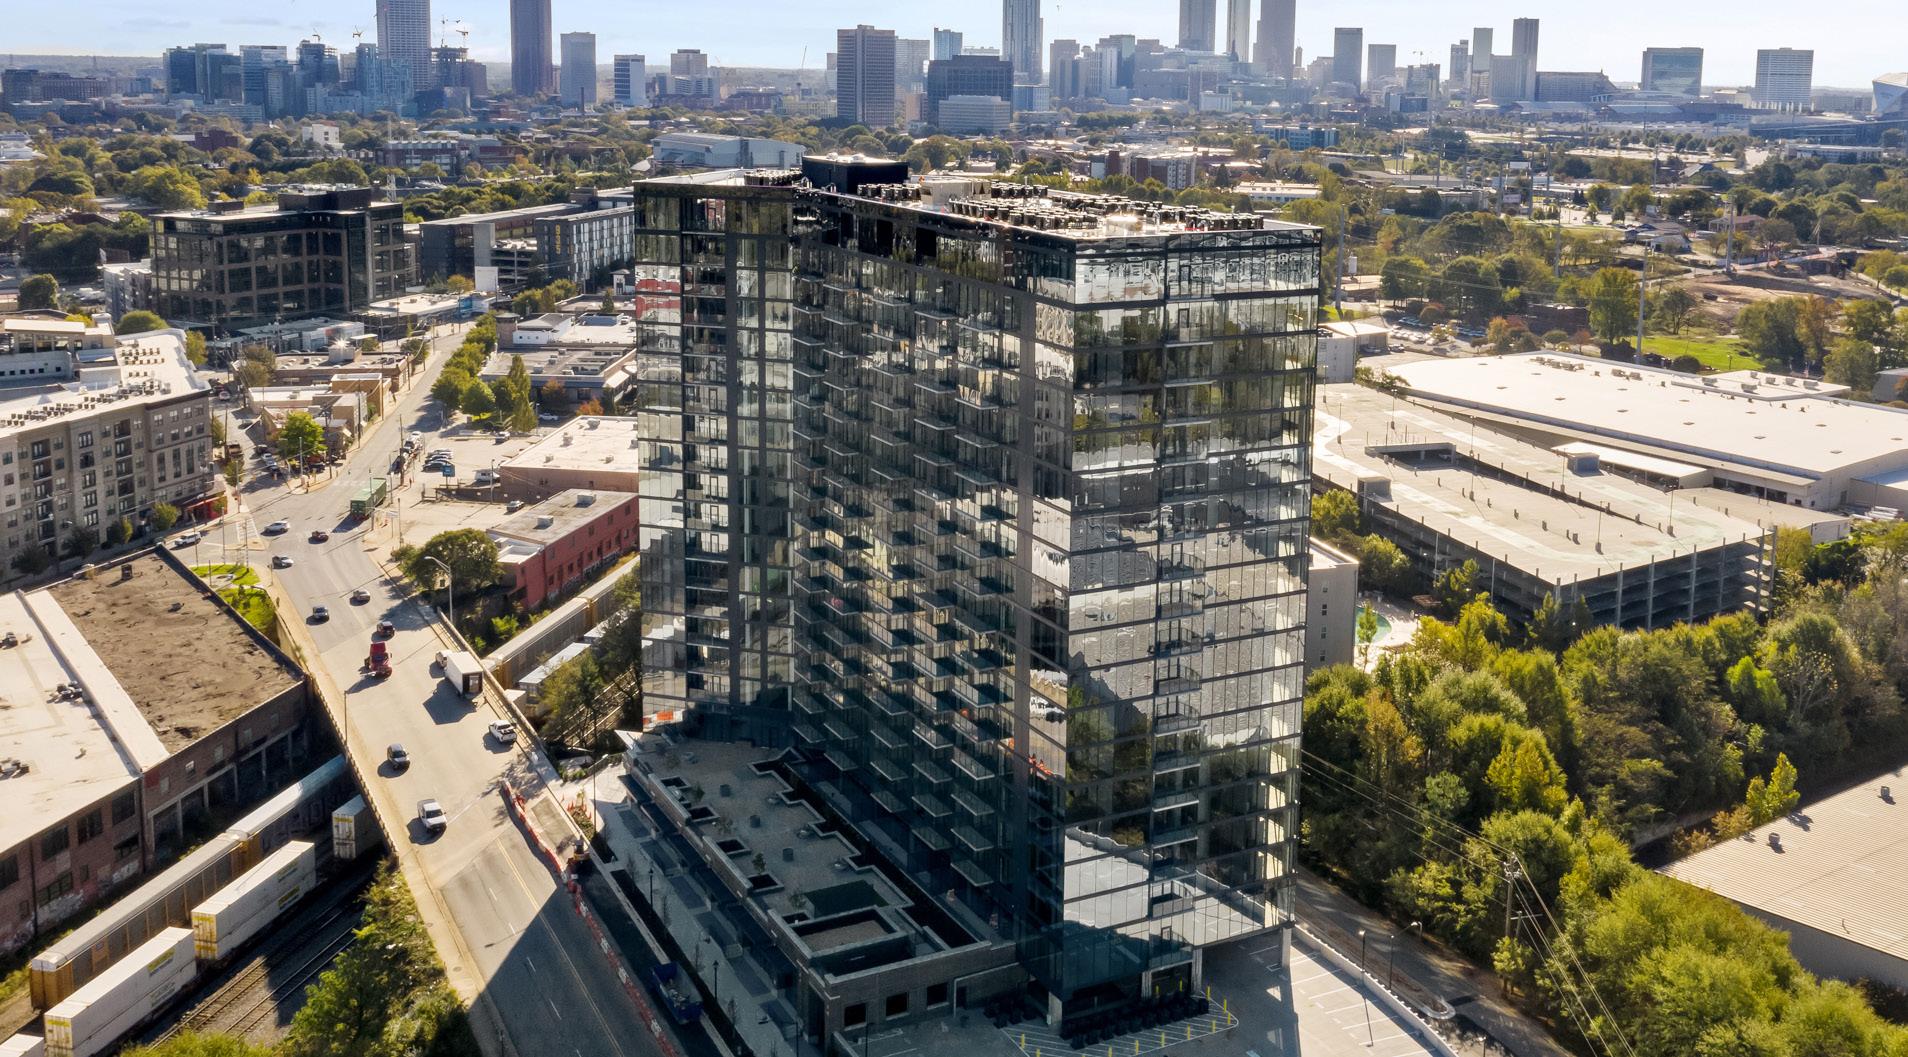
Home trends have varied significantly by submarket this year, as the desirability of individual homes and neighborhoods has become increasingly important. The rest of this report provides a snapshot of key metrics by home type (single-family homes, townhomes, and condominiums) and submarket, including neighborhoods Inside the Perimeter (ITP) and Outside the Perimeter (OTP).
To learn more about homes selling in your neighborhood or your dream location, reach out to your Engel & Volkers advisor for more detailed information about trends in your area.
Christa Huffstickler Founder & CEO Engel & Volkers Atlanta

Q1 2023 ATLANTA MARKET SNAPSHOT 6 EVATLANTA.COM
1 Fannie Mae Primary Mortgage Market Survey, Average 30-year Fixed Rate Mortgage as of 4/6/23
2 Freddie Mac, October 2022 Forecast
3 Fannie Mae, March 2023 Forecast
4 Mortgage Bankers Association, March 2023 Forecast
2023 Q1 Q2 Q3 Q4 Freddie Mac (Oct. 2022) 6.6% 6.5% 6.4% 6.2% Fannie Mae (Feb. 2023) 6.1% 6.0% 5.9% 5.7% Mortgage Bankers Association (Feb. 2023) 6.4% 6.1% 5.7% 5.3% National
(Mar.
6.7% 6.3% 5.9% 5.6%
5 National Association of Realtors, March 2023 Forecast
Association of Realtors
2023)
2023 Quarterly Average 30-Year Fixed Rate Mortgage Forecasts
Metro Atlanta Pending and Closed Sales vs. Interest Rates (January 2022 - March 2023)
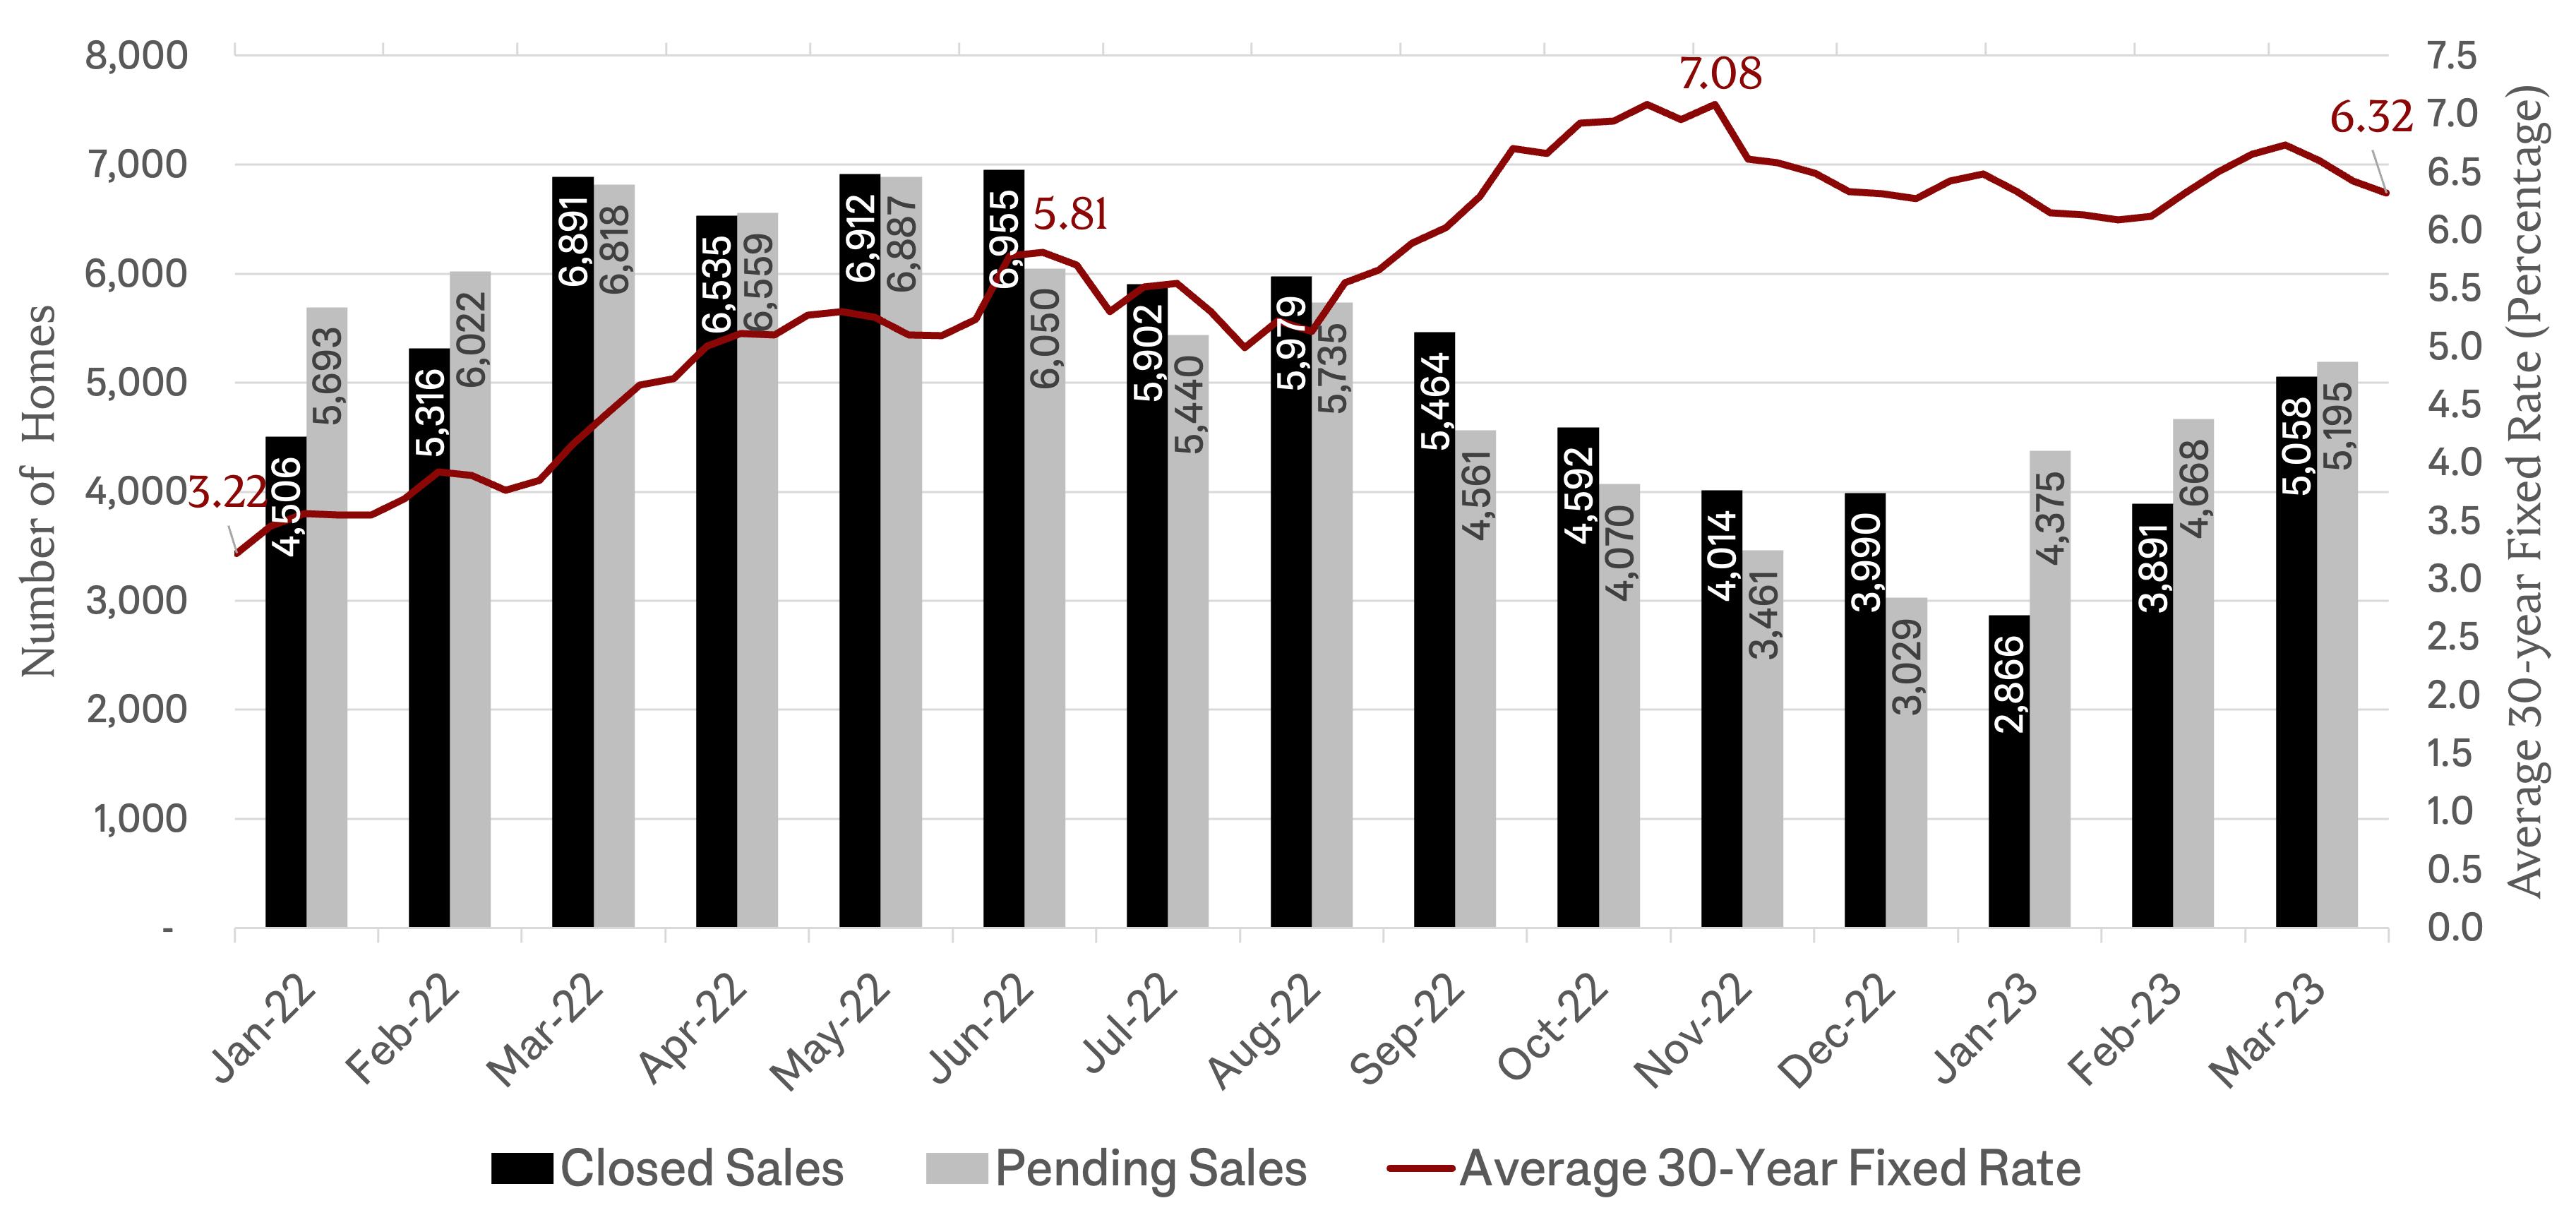
Sources: FMLS InfoSparks, Greater Atlanta Area, All home types, All price points, January 2022 to March 2023, Retrieved 4/10/23; Fannie Mae Primary Mortgage Market Survey
Metro Atlanta Home Inventory (January 2022 - March 2023)
Source: FMLS InfoSparks, Greater Atlanta Area, All home types, All price points, January 2022 to March 2023, Retrieved 4/10/23
Q1 2023 ATLANTA MARKET SNAPSHOT 7 EVATLANTA.COM
Single-Family Homes
INSIDE THE PERIMETER


Q1 2023 ATLANTA MARKET SNAPSHOT 9 EVATLANTA.COM Source: FMLS, InfoSparks, TrendGraphix, Q1 2023 (1/1/23 to 3/31/23) Ansley Park / Sherwood Forest SINGLE-FAMILY HOMES Avondale Estates SINGLE-FAMILY HOMES $2,325,000 Median Closed Sales Price Homes Sold 6 Months of Inventory 4.7 Average Days On Market 101 $2,100,000 Average Closed Sales Price $562,500 Median Closed Sales Price Homes Sold 14 Months of Inventory 1.0 Average Days On Market 31 $577,491 Average Closed Sales Price
Q1 2023 ATLANTA MARKET SNAPSHOT 10 EVATLANTA.COM Source: FMLS, InfoSparks, TrendGraphix, Q1 2023 (1/1/23 to 3/31/23) Brookhaven SINGLE-FAMILY HOMES Brookwood Hills SINGLE-FAMILY HOMES $741,500 Median Closed Sales Price Homes Sold 62 Months of Inventory 1.8 Average Days On Market 34 $894,875 Average Closed Sales Price N/A Median Closed Sales Price Homes Sold 0 Months of Inventory 0.9 Average Days On Market N/A N/A Average Closed Sales Price


Q1 2023 ATLANTA MARKET SNAPSHOT 11 EVATLANTA.COM Source: FMLS, InfoSparks, TrendGraphix, Q1 2023 (1/1/23 to 3/31/23) Buckhead SINGLE-FAMILY HOMES Cabbagetown SINGLE-FAMILY HOMES $1,175,000 Median Closed Sales Price Homes Sold 137 Months of Inventory 2.7 Average Days On Market 51 $1,573,237 Average Closed Sales Price $360,000 Median Closed Sales Price Home Sold 1 Months of Inventory 0.4 Average Days On Market 43 $360,000 Average Closed Sales Price
Q1 2023 ATLANTA MARKET SNAPSHOT 12 EVATLANTA.COM Source: FMLS, InfoSparks, TrendGraphix, Q1 2023 (1/1/23 to 3/31/23) Cascade East SINGLE-FAMILY HOMES Cascade West SINGLE-FAMILY HOMES $355,000 Median Closed Sales Price Homes Sold 38 Months of Inventory 4.3 Average Days On Market 36 $366,232 Average Closed Sales Price $299,000 Median Closed Sales Price Homes Sold 23 Months of Inventory 2.4 Average Days On Market 46 $315,443 Average Closed Sales Price
Q1 2023 ATLANTA MARKET SNAPSHOT 13 EVATLANTA.COM Source: FMLS, InfoSparks, TrendGraphix, Q1 2023 (1/1/23 to 3/31/23) Chamblee SINGLE-FAMILY HOMES Chastain Park SINGLE-FAMILY HOMES $465,000 Median Closed Sales Price Homes Sold 19 Months of Inventory 1.1 Average Days On Market 33 $536,837 Average Closed Sales Price $2,294,000 Median Closed Sales Price Homes Sold 5 Months of Inventory 2.7 Average Days On Market 7 $2,195,300 Average Closed Sales Price
Q1 2023 ATLANTA MARKET SNAPSHOT 14 EVATLANTA.COM Source: FMLS, InfoSparks, TrendGraphix, Q1 2023 (1/1/23 to 3/31/23) College Park SINGLE-FAMILY HOMES Collier Hills/ Ardmore Park SINGLE-FAMILY HOMES $325,000 Median Closed Sales Price Homes Sold 41 Months of Inventory 3.2 Average Days On Market 37 $323,360 Average Closed Sales Price $1,175,000 Median Closed Sales Price Home Sold 1 Months of Inventory 1.4 Average Days On Market 17 $1,175,000 Average Closed Sales Price

Q1 2023 ATLANTA MARKET SNAPSHOT 15 EVATLANTA.COM Source: FMLS, InfoSparks, TrendGraphix, Q1 2023 (1/1/23 to 3/31/23) Decatur SINGLE-FAMILY HOMES Druid Hills/ Emory SINGLE-FAMILY HOMES $850,000 Median Closed Sales Price Homes Sold 24 Months of Inventory 0.9 Average Days On Market 28 $842,489 Average Closed Sales Price $879,000 Median Closed Sales Price Homes Sold 17 Months of Inventory 1.5 Average Days On Market 22 $1,057,288 Average Closed Sales Price

Q1 2023 ATLANTA MARKET SNAPSHOT 16 EVATLANTA.COM Source: FMLS, InfoSparks, TrendGraphix, Q1 2023 (1/1/23 to 3/31/23) East Atlanta SINGLE-FAMILY HOMES East Lake SINGLE-FAMILY HOMES $573,230 Median Closed Sales Price Homes Sold 18 Months of Inventory 1.2 Average Days On Market 17 $579,476 Average Closed Sales Price $656,250 Median Closed Sales Price Homes Sold 12 Months of Inventory 2.2 Average Days On Market 31 $630,750 Average Closed Sales Price

Q1 2023 ATLANTA MARKET SNAPSHOT 17 EVATLANTA.COM Source: FMLS, InfoSparks, TrendGraphix, Q1 2023 (1/1/23 to 3/31/23) East
SINGLE-FAMILY HOMES Edgewood SINGLE-FAMILY HOMES $286,000 Median Closed Sales Price Homes Sold 41 Months of Inventory 3.4 Average Days On Market 39 $281,159 Average Closed Sales Price $666,500 Median Closed Sales Price Homes Sold 16 Months of Inventory 1.7 Average Days On Market 26 $660,494 Average Closed Sales Price
Point
Q1 2023 ATLANTA MARKET SNAPSHOT 18 EVATLANTA.COM Source: FMLS, InfoSparks, TrendGraphix, Q1 2023 (1/1/23 to 3/31/23) Garden Hills SINGLE-FAMILY HOMES Grant Park/ Glenwood Park SINGLE-FAMILY HOMES $935,000 Median Closed Sales Price Homes Sold 9 Months of Inventory 3.3 Average Days On Market 18 $1,030,944 Average Closed Sales Price $691,000 Median Closed Sales Price Homes Sold 17 Months of Inventory 1.2 Average Days On Market 23 $722,759 Average Closed Sales Price


Q1 2023 ATLANTA MARKET SNAPSHOT 19 EVATLANTA.COM Source: FMLS, InfoSparks, TrendGraphix, Q1 2023 (1/1/23 to 3/31/23) Hapeville/ Thomasville SINGLE-FAMILY HOMES Inman Park SINGLE-FAMILY HOMES $320,000 Median Closed Sales Price Homes Sold 7 Months of Inventory 4.5 Average Days On Market 43 $355,856 Average Closed Sales Price $980,000 Median Closed Sales Price Homes Sold 4 Months of Inventory 0.7 Average Days On Market 45 $943,750 Average Closed Sales Price

Q1 2023 ATLANTA MARKET SNAPSHOT 20 EVATLANTA.COM Source: FMLS, InfoSparks, TrendGraphix, Q1 2023 (1/1/23 to 3/31/23) Kirkwood SINGLE-FAMILY HOMES Lake Claire/ Little Five Points SINGLE-FAMILY HOMES $506,000 Median Closed Sales Price Homes Sold 15 Months of Inventory 1.2 Average Days On Market 36 $590,800 Average Closed Sales Price $842,500 Median Closed Sales Price Homes Sold 18 Months of Inventory 1.2 Average Days On Market 36 $899,891 Average Closed Sales Price


Q1 2023 ATLANTA MARKET SNAPSHOT 21 EVATLANTA.COM Source: FMLS, InfoSparks, TrendGraphix, Q1 2023 (1/1/23 to 3/31/23) Oakhurst SINGLE-FAMILY HOMES Midtown SINGLE-FAMILY HOMES $1,575,000 Median Closed Sales Price Home Sold 1 Months of Inventory 1.7 Average Days On Market 0 $1,575,000 Average Closed Sales Price $827,864 Median Closed Sales Price Homes Sold 8 Months of Inventory 0.9 Average Days On Market 44 $836,591 Average Closed Sales Price


Q1 2023 ATLANTA MARKET SNAPSHOT 22 EVATLANTA.COM Source: FMLS, InfoSparks, TrendGraphix, Q1 2023 (1/1/23 to 3/31/23) Old Fourth Ward SINGLE-FAMILY HOMES Ormewood Park SINGLE-FAMILY HOMES $722,500 Median Closed Sales Price Homes Sold 8 Months of Inventory 4.3 Average Days On Market 81 $756,269 Average Closed Sales Price $634,000 Median Closed Sales Price Homes Sold 4 Months of Inventory 2.1 Average Days On Market 28 $630,750 Average Closed Sales Price
Q1 2023 ATLANTA MARKET SNAPSHOT 23 EVATLANTA.COM Source: FMLS, InfoSparks, TrendGraphix, Q1 2023 (1/1/23 to 3/31/23) Peachtree Hills SINGLE-FAMILY HOMES Peoplestown/Chosewood Park/ Lakewood Heights SINGLE-FAMILY HOMES $760,000 Median Closed Sales Price Homes Sold 11 Months of Inventory 1.2 Average Days On Market 31 $1,063,909 Average Closed Sales Price $337,000 Median Closed Sales Price Homes Sold 44 Months of Inventory 4.0 Average Days On Market 47 $371,745 Average Closed Sales Price

Q1 2023 ATLANTA MARKET SNAPSHOT 24 EVATLANTA.COM Source: FMLS, InfoSparks, TrendGraphix, Q1 2023 (1/1/23 to 3/31/23) Reynoldstown SINGLE-FAMILY HOMES Summerhill SINGLE-FAMILY HOMES $634,000 Median Closed Sales Price Homes Sold 4 Months of Inventory 2.1 Average Days On Market 28 $630,750 Average Closed Sales Price $510,000 Median Closed Sales Price Homes Sold 6 Months of Inventory 2.5 Average Days On Market 23 $522,667 Average Closed Sales Price
Q1 2023 ATLANTA MARKET SNAPSHOT 25 EVATLANTA.COM Source: FMLS, InfoSparks, TrendGraphix, Q1 2023 (1/1/23 to 3/31/23) Vinings SINGLE-FAMILY HOMES Virginia Highlands/ Morningside SINGLE-FAMILY HOMES $1,027,725 Median Closed Sales Price Homes Sold 14 Months of Inventory 2.6 Average Days On Market 26 $1,144,811 Average Closed Sales Price $1,243,625 Median Closed Sales Price Homes Sold 38 Months of Inventory 1.7 Average Days On Market 30 $1,427,572 Average Closed Sales Price

Q1 2023 ATLANTA MARKET SNAPSHOT 26 EVATLANTA.COM Source: FMLS, InfoSparks, TrendGraphix, Q1 2023 (1/1/23 to 3/31/23) West End/Adair Park/ Capitol View SINGLE-FAMILY HOMES West Midtown/ Underwood Hills SINGLE-FAMILY HOMES $320,000 Median Closed Sales Price Homes Sold 89 Months of Inventory 4.0 Average Days On Market 40 $323,312 Average Closed Sales Price $475,000 Median Closed Sales Price Homes Sold 70 Months of Inventory 2.3 Average Days On Market 34 $487,099 Average Closed Sales Price
Single-Family Homes
PERIMETER
OUTSIDE THE


Q1 2023 ATLANTA MARKET SNAPSHOT 29 EVATLANTA.COM Source: FMLS, InfoSparks, TrendGraphix, Q1 2023 (1/1/23 to 3/31/23) Acworth Alpharetta SINGLE-FAMILY HOMES SINGLE-FAMILY HOMES $415,000 Median Closed Sales Price Homes Sold 264 Months of Inventory 1.7 Average Days On Market 45 $443,388 Average Closed Sales Price $677,500 Median Closed Sales Price Homes Sold 184 Months of Inventory 1.3 Average Days On Market 36 $804,142 Average Closed Sales Price

Q1 2023 ATLANTA MARKET SNAPSHOT 30 EVATLANTA.COM Source: FMLS, InfoSparks, TrendGraphix, Q1 2023 (1/1/23 to 3/31/23) Chattahoochee
SINGLE-FAMILY HOMES Canton SINGLE-FAMILY HOMES $472,950 Median Closed Sales Price Homes Sold 348 Months of Inventory 1.9 Average Days On Market 49 $536,814 Average Closed Sales Price $1,078,029 Median Closed Sales Price Homes Sold 6 Months of Inventory 2.7 Average Days On Market 47 $1,015,218 Average Closed Sales Price
Hills

Q1 2023 ATLANTA MARKET SNAPSHOT 31 EVATLANTA.COM Source: FMLS, InfoSparks, TrendGraphix, Q1 2023 (1/1/23 to 3/31/23) Clarkston SINGLE-FAMILY HOMES Cumming SINGLE-FAMILY HOMES $324,000 Median Closed Sales Price Homes Sold 8 Months of Inventory 1.8 Average Days On Market 30 $329,750 Average Closed Sales Price $540,000 Median Closed Sales Price Homes Sold 481 Months of Inventory 1.2 Average Days On Market 42 $585,365 Average Closed Sales Price

Q1 2023 ATLANTA MARKET SNAPSHOT 32 EVATLANTA.COM Source: FMLS, InfoSparks, TrendGraphix, Q1 2023 (1/1/23 to 3/31/23) Duluth SINGLE-FAMILY HOMES Douglasville SINGLE-FAMILY HOMES $308,950 Median Closed Sales Price Homes Sold 252 Months of Inventory 2.1 Average Days On Market 52 $327,236 Average Closed Sales Price $447,450 Median Closed Sales Price Homes Sold 140 Months of Inventory 1.1 Average Days On Market 39 $582,614 Average Closed Sales Price
Q1 2023 ATLANTA MARKET SNAPSHOT 33 EVATLANTA.COM Source: FMLS, InfoSparks, TrendGraphix, Q1 2023 (1/1/23 to 3/31/23) Dunwoody SINGLE-FAMILY HOMES East Cobb SINGLE-FAMILY HOMES $640,000 Median Closed Sales Price Homes Sold 58 Months of Inventory 0.9 Average Days On Market 32 $703,409 Average Closed Sales Price $470,000 Median Closed Sales Price Homes Sold 391 Months of Inventory 1.2 Average Days On Market 39 $533,948 Average Closed Sales Price
Q1 2023 ATLANTA MARKET SNAPSHOT 34 EVATLANTA.COM Source: FMLS, InfoSparks, TrendGraphix, Q1 2023 (1/1/23 to 3/31/23) Fayetteville SINGLE-FAMILY HOMES Fairburn SINGLE-FAMILY HOMES $386,240 Median Closed Sales Price Homes Sold 98 Months of Inventory 2.0 Average Days On Market 42 $381,119 Average Closed Sales Price $375,000 Median Closed Sales Price Homes Sold 74 Months of Inventory 2.4 Average Days On Market 50 $503,259 Average Closed Sales Price
Q1 2023 ATLANTA MARKET SNAPSHOT 35 EVATLANTA.COM Source: FMLS, InfoSparks, TrendGraphix, Q1 2023 (1/1/23 to 3/31/23) Kennesaw SINGLE-FAMILY HOMES Johns Creek SINGLE-FAMILY HOMES $765,000 Median Closed Sales Price Homes Sold 77 Months of Inventory 0.9 Average Days On Market 52 $857,768 Average Closed Sales Price $400,000 Median Closed Sales Price Homes Sold 40 Months of Inventory 1.3 Average Days On Market 40 $457,049 Average Closed Sales Price
Q1 2023 ATLANTA MARKET SNAPSHOT 36 EVATLANTA.COM Source: FMLS, InfoSparks, TrendGraphix, Q1 2023 (1/1/23 to 3/31/23) Mableton SINGLE-FAMILY HOMES Lawrenceville SINGLE-FAMILY HOMES $370,000 Median Closed Sales Price Homes Sold 492 Months of Inventory 1.4 Average Days On Market 51 $394,077 Average Closed Sales Price $339,375 Median Closed Sales Price Homes Sold 82 Months of Inventory 1.6 Average Days On Market 34 $369,702 Average Closed Sales Price

Q1 2023 ATLANTA MARKET SNAPSHOT 37 EVATLANTA.COM Source: FMLS, InfoSparks, TrendGraphix, Q1 2023 (1/1/23 to 3/31/23) Marietta SINGLE-FAMILY HOMES McDonough SINGLE-FAMILY HOMES $430,000 Median Closed Sales Price Homes Sold 619 Months of Inventory 1.2 Average Days On Market 41 $496,920 Average Closed Sales Price $358,000 Median Closed Sales Price Homes Sold 162 Months of Inventory 2.8 Average Days On Market 48 $375,787 Average Closed Sales Price

Q1 2023 ATLANTA MARKET SNAPSHOT 38 EVATLANTA.COM Source: FMLS, InfoSparks, TrendGraphix, Q1 2023 (1/1/23 to 3/31/23) Milton SINGLE-FAMILY HOMES Norcross SINGLE-FAMILY HOMES $1,175,000 Median Closed Sales Price Homes Sold 43 Months of Inventory 2.6 Average Days On Market 34 $1,301,538 Average Closed Sales Price $335,000 Median Closed Sales Price Homes Sold 51 Months of Inventory 1.5 Average Days On Market 34 $423,175 Average Closed Sales Price

Q1 2023 ATLANTA MARKET SNAPSHOT 39 EVATLANTA.COM Source: FMLS, InfoSparks, TrendGraphix, Q1 2023 (1/1/23 to 3/31/23) Peachtree City SINGLE-FAMILY HOMES Peachtree Corners SINGLE-FAMILY HOMES $586,500 Median Closed Sales Price Homes Sold 22 Months of Inventory 1.4 Average Days On Market 45 $597,433 Average Closed Sales Price $555,000 Median Closed Sales Price Homes Sold 40 Months of Inventory 0.8 Average Days On Market 48 $598,174 Average Closed Sales Price


Q1 2023 ATLANTA MARKET SNAPSHOT 40 EVATLANTA.COM Source: FMLS, InfoSparks, TrendGraphix, Q1 2023 (1/1/23 to 3/31/23) Roswell SINGLE-FAMILY HOMES Sandy Springs SINGLE-FAMILY HOMES $629,000 Median Closed Sales Price Homes Sold 168 Months of Inventory 1.2 Average Days On Market 38 $704,043 Average Closed Sales Price $822,000 Median Closed Sales Price Homes Sold 75 Months of Inventory 2.0 Average Days On Market 50 $1,203,417 Average Closed Sales Price

Q1 2023 ATLANTA MARKET SNAPSHOT 41 EVATLANTA.COM Source: FMLS, InfoSparks, TrendGraphix, Q1 2023 (1/1/23 to 3/31/23) Smyrna SINGLE-FAMILY HOMES Snellville SINGLE-FAMILY HOMES $473,750 Median Closed Sales Price Homes Sold 158 Months of Inventory 1.4 Average Days On Market 39 $516,036 Average Closed Sales Price $335,000 Median Closed Sales Price Homes Sold 211 Months of Inventory 1.5 Average Days On Market 53 $367,388 Average Closed Sales Price

Q1 2023 ATLANTA MARKET SNAPSHOT 42 EVATLANTA.COM Source: FMLS, InfoSparks, TrendGraphix, Q1 2023 (1/1/23 to 3/31/23) South Fulton SINGLE-FAMILY HOMES Sugar Hill SINGLE-FAMILY HOMES $339,375 Median Closed Sales Price Homes Sold 18 Months of Inventory 3.6 Average Days On Market 44 $351,364 Average Closed Sales Price $426,750 Median Closed Sales Price Homes Sold 56 Months of Inventory 1.2 Average Days On Market 42 $429,835 Average Closed Sales Price

Q1 2023 ATLANTA MARKET SNAPSHOT 43 EVATLANTA.COM Source: FMLS, InfoSparks, TrendGraphix, Q1 2023 (1/1/23 to 3/31/23) Suwanee SINGLE-FAMILY HOMES Tucker SINGLE-FAMILY HOMES $599,000 Median Closed Sales Price Homes Sold 153 Months of Inventory 1.0 Average Days On Market 45 $674,863 Average Closed Sales Price $406,500 Median Closed Sales Price Homes Sold 88 Months of Inventory 1.4 Average Days On Market 41 $431,537 Average Closed Sales Price
Q1 2023 ATLANTA MARKET SNAPSHOT 44 EVATLANTA.COM Source: FMLS, InfoSparks, TrendGraphix, Q1 2023 (1/1/23 to 3/31/23) Woodstock Union City SINGLE-FAMILY HOMES SINGLE-FAMILY HOMES $259,900 Median Closed Sales Price Homes Sold 23 Months of Inventory 1.8 Average Days On Market 39 $261,326 Average Closed Sales Price $410,000 Median Closed Sales Price Homes Sold 269 Months of Inventory 1.3 Average Days On Market 45 $461,917 Average Closed Sales Price
Condominiums

INSIDE THE PERIMETER
Q1 2023 ATLANTA MARKET SNAPSHOT 47 EVATLANTA.COM Source: FMLS, InfoSparks, TrendGraphix, Q1 2023 (1/1/23 to 3/31/23) Brookhaven/Chamblee CONDOMINIUMS Brookwood Hills CONDOMINIUMS $281,000 Median Closed Sales Price Homes Sold 28 Months of Inventory 1.3 Average Days On Market 18 $303,426 Average Closed Sales Price $270,000 Median Closed Sales Price Homes Sold 11 Months of Inventory 2.7 Average Days On Market 39 $252,227 Average Closed Sales Price

Q1 2023 ATLANTA MARKET SNAPSHOT 48 EVATLANTA.COM Source: FMLS, InfoSparks, TrendGraphix, Q1 2023 (1/1/23 to 3/31/23) Cabbagetown CONDOMINIUMS Buckhead CONDOMINIUMS $295,000 Median Closed Sales Price Homes Sold 169 Months of Inventory 2.5 Average Days On Market 43 $480,831 Average Closed Sales Price $407,950 Median Closed Sales Price Homes Sold 10 Months of Inventory 0.9 Average Days On Market 57 $439,293 Average Closed Sales Price
Q1 2023 ATLANTA MARKET SNAPSHOT 49 EVATLANTA.COM Source: FMLS, InfoSparks, TrendGraphix, Q1 2023 (1/1/23 to 3/31/23) Collier Hills/Ardmore Park CONDOMINIUMS Decatur/Druid Hills/Emory CONDOMINIUMS $346,500 Median Closed Sales Price Homes Sold 15 Months of Inventory 0.9 Average Days On Market 57 $439,293 Average Closed Sales Price $273,500 Median Closed Sales Price Homes Sold 35 Months of Inventory 1.4 Average Days On Market 33 $335,030 Average Closed Sales Price


Q1 2023 ATLANTA MARKET SNAPSHOT 50 EVATLANTA.COM Source: FMLS, InfoSparks, TrendGraphix, Q1 2023 (1/1/23 to 3/31/23) Downtown CONDOMINIUMS Edgewood/Kirkwood CONDOMINIUMS $277,000 Median Closed Sales Price Homes Sold 34 Months of Inventory 4.3 Average Days On Market 60 $316,845 Average Closed Sales Price $330,050 Median Closed Sales Price Homes Sold 12 Months of Inventory 2.5 Average Days On Market 25 $314,233 Average Closed Sales Price

Q1 2023 ATLANTA MARKET SNAPSHOT 51 EVATLANTA.COM Source: FMLS, InfoSparks, TrendGraphix, Q1 2023 (1/1/23 to 3/31/23) Garden Hills CONDOMINIUMS Grant Park/Glenwood Park CONDOMINIUMS $425,000 Median Closed Sales Price Homes Sold 9 Months of Inventory 1.4 Average Days On Market 56 $419,611 Average Closed Sales Price $356,000 Median Closed Sales Price Homes Sold 5 Months of Inventory 2.8 Average Days On Market 47 $400,800 Average Closed Sales Price

Q1 2023 ATLANTA MARKET SNAPSHOT 52 EVATLANTA.COM Source: FMLS, InfoSparks, TrendGraphix, Q1 2023 (1/1/23 to 3/31/23) Midtown CONDOMINIUMS Inman Park CONDOMINIUMS $485,500 Median Closed Sales Price Homes Sold 4 Months of Inventory 1.3 Average Days On Market 59 $497,750 Average Closed Sales Price $340,000 Median Closed Sales Price Homes Sold 121 Months of Inventory 2.0 Average Days On Market 41 $425,975 Average Closed Sales Price

Q1 2023 ATLANTA MARKET SNAPSHOT 53 EVATLANTA.COM Source: FMLS, InfoSparks, TrendGraphix, Q1 2023 (1/1/23 to 3/31/23) Old Fourth Ward/ Poncey Highland CONDOMINIUMS Peachtree Hills CONDOMINIUMS $330,000 Median Closed Sales Price Homes Sold 28 Months of Inventory 1.0 Average Days On Market 23 $309,059 Average Closed Sales Price $185,000 Median Closed Sales Price Homes Sold 13 Months of Inventory 3.9 Average Days On Market 41 $231,962 Average Closed Sales Price
Q1 2023 ATLANTA MARKET SNAPSHOT 54 EVATLANTA.COM Source: FMLS, InfoSparks, TrendGraphix, Q1 2023 (1/1/23 to 3/31/23) Virginia Highlands/ Morningside CONDOMINIUMS Vinings CONDOMINIUMS $325,000 Median Closed Sales Price Homes Sold 23 Months of Inventory 1.0 Average Days On Market 31 $448,978 Average Closed Sales Price $287,000 Median Closed Sales Price Homes Sold 25 Months of Inventory 1.2 Average Days On Market 29 $320,616 Average Closed Sales Price
Q1 2023 ATLANTA MARKET SNAPSHOT 55 EVATLANTA.COM Source: FMLS, InfoSparks, TrendGraphix, Q1 2023 (1/1/23 to 3/31/23) West Midtown CONDOMINIUMS West End/Adair Park/ Capitol View CONDOMINIUMS $178,000 Median Closed Sales Price Homes Sold 3 Months of Inventory 3.0 Average Days On Market 33 $187,333 Average Closed Sales Price $273,500 Median Closed Sales Price Homes Sold 36 Months of Inventory 2.5 Average Days On Market 45 $309,622 Average Closed Sales Price
Condominiums
OUTSIDE THE PERIMETER


Q1 2023 ATLANTA MARKET SNAPSHOT 57 EVATLANTA.COM Source: FMLS, InfoSparks, TrendGraphix, Q1 2023 (1/1/23 to 3/31/23) Cumming CONDOMINIUMS Duluth CONDOMINIUMS $462,000 Median Closed Sales Price Homes Sold 43 Months of Inventory 3.2 Average Days On Market 43 $443,397 Average Closed Sales Price $257,000 Median Closed Sales Price Homes Sold 11 Months of Inventory 0.9 Average Days On Market 36 $273,727 Average Closed Sales Price

Q1 2023 ATLANTA MARKET SNAPSHOT 58 EVATLANTA.COM Source: FMLS, InfoSparks, TrendGraphix, Q1 2023 (1/1/23 to 3/31/23) Marietta/Smyrna/ Vinings CONDOMINIUMS East Cobb CONDOMINIUMS $263,000 Median Closed Sales Price Homes Sold 38 Months of Inventory 1.9 Average Days On Market 31 $279,517 Average Closed Sales Price $263,000 Median Closed Sales Price Homes Sold 71 Months of Inventory 1.0 Average Days On Market 23 $316,322 Average Closed Sales Price
Norcross/Peachtree Corners

Q1 2023 ATLANTA MARKET SNAPSHOT 59 EVATLANTA.COM Source: FMLS, InfoSparks, TrendGraphix, Q1 2023 (1/1/23 to 3/31/23)
CONDOMINIUMS Roswell/Alpharetta/ Johns Creek CONDOMINIUMS $225,000 Median Closed Sales Price Homes Sold 12 Months of Inventory 0.9 Average Days On Market 34 $247,575 Average Closed Sales Price $360,000 Median Closed Sales Price Homes Sold 45 Months of Inventory 0.8 Average Days On Market 37 $360,344 Average Closed Sales Price

Q1 2023 ATLANTA MARKET SNAPSHOT 60 EVATLANTA.COM Source: FMLS, InfoSparks, TrendGraphix, Q1 2023 (1/1/23 to 3/31/23) Woodstock CONDOMINIUMS Sandy Springs/Dunwoody/ Perimeter CONDOMINIUMS $243,250 Median Closed Sales Price Homes Sold 88 Months of Inventory 1.4 Average Days On Market 40 $253,468 Average Closed Sales Price $430,000 Median Closed Sales Price Homes Sold 5 Months of Inventory 2.5 Average Days On Market 12 $433,800 Average Closed Sales Price

Townhomes
INSIDE THE PERIMETER
Q1 2023 ATLANTA MARKET SNAPSHOT 63 EVATLANTA.COM Source: FMLS, InfoSparks, TrendGraphix, Q1 2023 (1/1/23 to 3/31/23) Brookhaven/ Chamblee TOWNHOMES Buckhead TOWNHOMES $595,000 Median Closed Sales Price Homes Sold 47 Months of Inventory 0.8 Average Days On Market 35 $591,899 Average Closed Sales Price $572,500 Median Closed Sales Price Homes Sold 57 Months of Inventory 1.7 Average Days On Market 36 $649,503 Average Closed Sales Price
Q1 2023 ATLANTA MARKET SNAPSHOT 64 EVATLANTA.COM Source: FMLS, InfoSparks, TrendGraphix, Q1 2023 (1/1/23 to 3/31/23) Cascade East TOWNHOMES Cascade West TOWNHOMES $230,000 Median Closed Sales Price Homes Sold 8 Months of Inventory 1.7 Average Days On Market 19 $215,363 Average Closed Sales Price $270,000 Median Closed Sales Price Homes Sold 20 Months of Inventory 2.0 Average Days On Market 29 $245,443 Average Closed Sales Price
Q1 2023 ATLANTA MARKET SNAPSHOT 65 EVATLANTA.COM Source: FMLS, InfoSparks, TrendGraphix, Q1 2023 (1/1/23 to 3/31/23) Collier Hills/ Ardmore TOWNHOMES Decatur/Emory/ Druid Hills TOWNHOMES $372,500 Median Closed Sales Price Homes Sold 8 Months of Inventory 1.4 Average Days On Market 55 $698,125 Average Closed Sales Price $625,000 Median Closed Sales Price Homes Sold 15 Months of Inventory 1.8 Average Days On Market 20 $611,196 Average Closed Sales Price
Q1 2023 ATLANTA MARKET SNAPSHOT 66 EVATLANTA.COM Source: FMLS, InfoSparks, TrendGraphix, Q1 2023 (1/1/23 to 3/31/23) Downtown East Atlanta TOWNHOMES TOWNHOMES $348,800 Median Closed Sales Price Homes Sold 3 Months of Inventory 1.5 Average Days On Market 61 $429,600 Average Closed Sales Price $514,000 Median Closed Sales Price Home Sold 1 Months of Inventory 0.7 Average Days On Market 11 $514,000 Average Closed Sales Price
Q1 2023 ATLANTA MARKET SNAPSHOT 67 EVATLANTA.COM Source: FMLS, InfoSparks, TrendGraphix, Q1 2023 (1/1/23 to 3/31/23) Edgewood/Kirkwood TOWNHOMES East Point TOWNHOMES $287,900 Median Closed Sales Price Homes Sold 9 Months of Inventory 0.7 Average Days On Market 15 $271,067 Average Closed Sales Price $436,900 Median Closed Sales Price Homes Sold 17 Months of Inventory 0.6 Average Days On Market 63 $503,057 Average Closed Sales Price
Q1 2023 ATLANTA MARKET SNAPSHOT 68 EVATLANTA.COM Source: FMLS, InfoSparks, TrendGraphix, Q1 2023 (1/1/23 to 3/31/23) Grant Park/Glenwood Park/ Ormewood Park TOWNHOMES Inman Park TOWNHOMES $480,000 Median Closed Sales Price Homes Sold 7 Months of Inventory 1.5 Average Days On Market 9 $486,214 Average Closed Sales Price $1,190,000 Median Closed Sales Price Homes Sold 4 Months of Inventory 0 Average Days On Market 39 $1,019,999 Average Closed Sales Price


Q1 2023 ATLANTA MARKET SNAPSHOT 69 EVATLANTA.COM Source: FMLS, InfoSparks, TrendGraphix, Q1 2023 (1/1/23 to 3/31/23) Midtown TOWNHOMES Old Fourth Ward/ Poncey Highlands TOWNHOMES $612,000 Median Closed Sales Price Homes Sold 5 Months of Inventory 0.3 Average Days On Market 18 $736,380 Average Closed Sales Price $629,750 Median Closed Sales Price Homes Sold 10 Months of Inventory 1.9 Average Days On Market 41 $640,463 Average Closed Sales Price
Q1 2023 ATLANTA MARKET SNAPSHOT 70 EVATLANTA.COM Source: FMLS, InfoSparks, TrendGraphix, Q1 2023 (1/1/23 to 3/31/23) Summerhill TOWNHOMES Reynoldstown TOWNHOMES $625,000 Median Closed Sales Price Homes Sold 11 Months of Inventory 1.9 Average Days On Market 41 $690,136 Average Closed Sales Price $691,900 Median Closed Sales Price Homes Sold 12 Months of Inventory 1.9 Average Days On Market 51 $598,650 Average Closed Sales Price
Q1 2023 ATLANTA MARKET SNAPSHOT 71 EVATLANTA.COM Source: FMLS, InfoSparks, TrendGraphix, Q1 2023 (1/1/23 to 3/31/23) West Midtown TOWNHOMES Vinings TOWNHOMES $463,450 Median Closed Sales Price Homes Sold 30 Months of Inventory 1.5 Average Days On Market 38 $510,219 Average Closed Sales Price $464,950 Median Closed Sales Price Homes Sold 68 Months of Inventory 2.6 Average Days On Market 72 $493,484 Average Closed Sales Price
Townhomes
OUTSIDE THE PERIMETER
Q1 2023 ATLANTA MARKET SNAPSHOT 73 EVATLANTA.COM Source: FMLS, InfoSparks, TrendGraphix, Q1 2023 (1/1/23 to 3/31/23) Acworth TOWNHOMES Canton TOWNHOMES $307,900 Median Closed Sales Price Homes Sold 19 Months of Inventory 1.6 Average Days On Market 42 $376,850 Average Closed Sales Price $327,600 Median Closed Sales Price Homes Sold 25 Months of Inventory 3.2 Average Days On Market 49 $390,102 Average Closed Sales Price
Q1 2023 ATLANTA MARKET SNAPSHOT 74 EVATLANTA.COM Source: FMLS, InfoSparks, TrendGraphix, Q1 2023 (1/1/23 to 3/31/23) Cumming TOWNHOMES Duluth TOWNHOMES $379,000 Median Closed Sales Price Homes Sold 24 Months of Inventory 1.0 Average Days On Market 38 $405,571 Average Closed Sales Price $377,000 Median Closed Sales Price Homes Sold 69 Months of Inventory 1.7 Average Days On Market 73 $383,452 Average Closed Sales Price
Q1 2023 ATLANTA MARKET SNAPSHOT 75 EVATLANTA.COM Source: FMLS, InfoSparks, TrendGraphix, Q1 2023 (1/1/23 to 3/31/23)
TOWNHOMES Fairburn TOWNHOMES $360,000 Median Closed Sales Price Homes Sold 61 Months of Inventory 1.2 Average Days On Market 37 $394,025 Average Closed Sales Price $313,446 Median Closed Sales Price Homes Sold 47 Months of Inventory 1.0 Average Days On Market 3 $312,054 Average Closed Sales Price
East Cobb

Q1 2023 ATLANTA MARKET SNAPSHOT 76 EVATLANTA.COM Source: FMLS, InfoSparks, TrendGraphix, Q1 2023 (1/1/23 to 3/31/23) Jonesboro TOWNHOMES $230,000 Median Closed Sales Price Homes Sold 24 Months of Inventory 1.9 Average Days On Market 24 $220,673 Average Closed Sales Price Kennesaw TOWNHOMES $352,500 Median Closed Sales Price Homes Sold 46 Months of Inventory 1.9 Average Days On Market 40 $353,085 Average Closed Sales Price
Q1 2023 ATLANTA MARKET SNAPSHOT 77 EVATLANTA.COM Source: FMLS, InfoSparks, TrendGraphix, Q1 2023 (1/1/23 to 3/31/23) Lawrenceville TOWNHOMES $325,000 Median Closed Sales Price Homes Sold 55 Months of Inventory 1.5 Average Days On Market 45 $334,187 Average Closed Sales Price Mableton TOWNHOMES $360,000 Median Closed Sales Price Homes Sold 29 Months of Inventory 1.9 Average Days On Market 35 $330,947 Average Closed Sales Price
Q1 2023 ATLANTA MARKET SNAPSHOT 78 EVATLANTA.COM Source: FMLS, InfoSparks, TrendGraphix, Q1 2023 (1/1/23 to 3/31/23) Milton TOWNHOMES Marietta/Smyrna/ Vinings TOWNHOMES $375,000 Median Closed Sales Price Homes Sold 165 Months of Inventory 1.5 Average Days On Market 42 $379,268 Average Closed Sales Price $706,250 Median Closed Sales Price Homes Sold 6 Months of Inventory 2.9 Average Days On Market 51 $608,750 Average Closed Sales Price
Norcross/Peachtree Corners
Q1 2023 ATLANTA MARKET SNAPSHOT 79 EVATLANTA.COM Source: FMLS, InfoSparks, TrendGraphix, Q1 2023 (1/1/23 to 3/31/23)
TOWNHOMES Roswell/Alpharetta/ Johns Creek TOWNHOMES $415,500 Median Closed Sales Price Homes Sold 42 Months of Inventory 2.2 Average Days On Market 62 $433,469 Average Closed Sales Price $490,000 Median Closed Sales Price Homes Sold 109 Months of Inventory 1.6 Average Days On Market 35 $539,480 Average Closed Sales Price
Q1 2023 ATLANTA MARKET SNAPSHOT 80 EVATLANTA.COM Source: FMLS, InfoSparks, TrendGraphix, Q1 2023 (1/1/23 to 3/31/23) Suwanee TOWNHOMES Sandy Springs/Dunwoody/ Perimeter TOWNHOMES $429,688 Median Closed Sales Price Homes Sold 82 Months of Inventory 1.1 Average Days On Market 27 $441,251 Average Closed Sales Price $490,000 Median Closed Sales Price Homes Sold 44 Months of Inventory 2.2 Average Days On Market 69 $471,828 Average Closed Sales Price

Q1 2023 ATLANTA MARKET SNAPSHOT 81 EVATLANTA.COM Source: FMLS, InfoSparks, TrendGraphix, Q1 2023 (1/1/23 to 3/31/23) Tucker TOWNHOMES Stone Mountain TOWNHOMES $195,000 Median Closed Sales Price Homes Sold 25 Months of Inventory 2.3 Average Days On Market 30 $194,416 Average Closed Sales Price $321,393 Median Closed Sales Price Homes Sold 51 Months of Inventory 0.9 Average Days On Market 33 $331,010 Average Closed Sales Price
Q1 2023 ATLANTA MARKET SNAPSHOT 82 EVATLANTA.COM Source: FMLS, InfoSparks, TrendGraphix, Q1 2023 (1/1/23 to 3/31/23) Woodstock Homes Sold $365,000 Median Closed Sales Price 188 Months of Inventory 1.2 Average Days On Market 19 TOWNHOMES Union City Homes Sold $205,000 Median Closed Sales Price 50 Months of Inventory 1.3 Average Days On Market 19 TOWNHOMES
Key Indicators Glossary
The following key indicators are used throughout this report to describe market trends:


Active Listings
Properties that are currently listed for sale on FMLS. Additional properties may be for sale at any given time— such as for-sale by owner homes or off-market listings— but are not included in the count of “active listings” in this report if they are not in the FMLS database.
New Listings

New listings are those that have been added to FMLS in a given month. They do not include active listings that were entered in previous months.
Closed Sales
Closed sales represent homes that have sold and transactions have been finalized. This indicator tends to lag market trends slightly because properties typically close one to two months after an offer has been accepted and buyers have locked their interest rates.
Pending Sales
Pending sales are properties that have accepted an offer from a buyer and is in the due diligence period. The sales transaction has not happened yet. This is a leading indicator because it give us insight into how buyers and sellers are reacting to the most current market conditions.
Sale Price
The sale price is the final amount paid for a home. It is measured as either an average or a median, with the average price tending to be skewed higher by the highest priced homes. It does not reflect seller concessions, such as closing costs that may have been paid.
Sale Price to List Price Ratio
The sale price to list price ratio (SP/LP) indicates if a home sold at (100%), above (>100%), or below (<100%) the listed asking price. The sale price to original list price ratio (SP/OLP) compares the sale price to the original asking price, as the current asking price may have reflected price changes.
Days on Market
Days on market (DOM) measures how long it takes from the time a home is listed until the owner signs a contract for the sale of a property. This tends to vary based on the desirability of a given property, market conditions, and season.
Months of Inventory
Months of inventory indicates how long it would likely take to sell currently listed homes, if no new inventory were added. It is measured as a ratio of active listings to homes sold. 5 to 6 months of inventory is considered a balanced market. Less than 6 months supply tends to favor sellers, and more tends to favor buyers.

evatlanta.com 404.845.7724 | 1745 Peachtree Street, Atlanta, GA 30309, USA | 1411 North Highland Avenue NE, Atlanta, GA 30306, USA ©2023 Engel & Völkers. All rights reserved. Each brokerage independently owned and operated. All information provided is deemed reliable but is not guaranteed and should be independently verified. If your property is currently represented by a real estate broker, this is not an attempt to solicit your listing. Engel & Völkers and its independent license partners are Equal Opportunity Employers and fully support the principles of the Fair Housing Act.
