MARKET INTELLIGENCE


a
Source: 1/1/2021 – 7/31/2021 provided by FMLS
2022 Q4 ATLANTA, GEORGIA
ENGEL & VÖLKERS ATLANTA


Contents Market Trends 13 Interest Rates 14 Inventory 17 Home Prices 19 Transaction Volumes 23 Growth & Migration 26 Peer Markets 27 Market Snapshot 29 Single-Family Homes 36 Single-Family Homes - Inside the Perimeter 38 Single-Family Homes - Outside the Perimeter 43 Townhomes 48 Townhomes - Inside the Perimeter 51 Townhomes - Outside the Perimeter 56 Condominiums 61 Condominiums - Inside the Perimeter 64 Condominiums - Outside the Perimeter 69 Submarket Profiles 75
 ENGEL & VÖLKERS
A Word From Us
The past three years in the real estate industry have brought us a series of ups and downs. We finally believe we have reached a sense of normalcy again and are back to a more balanced market across Georgia.
The first half of 2022 saw an extension of the hot market of 2021, with a cooling off that settled in for the second half of the year. This was fueled by rising interest rates, inflation, the lack of affordability and market uncertainty. Without question, 2020 and 2021 were outlier years in real estate where we saw less travel, very low interest rates, and an increased focus on home life. Because these years were such outliers, real estate trends in 2019 are also referenced throughout this report as a a comparison to a more typical year.
The recent decline in sales began in June of 2022 when rates moved over 5.25%. These rising interest rates increased the cost of home ownership for buyers, pricing many would-be buyers out of the market and forcing others to consider homes at a lower price point than they may have been exploring earlier in the year.
Market inventory is rising but still low with 2.1 months of inventory in Metro Atlanta overall at year end. Demand is down, but so is supply, which is helping to limit significant price declines. While prices are down slightly compared to the summer peak, this reflects an accelerated version of normal seasonal price fluctuations. Notably, the average sales price in Metro Atlanta in the second half of 2022 was still up 9.9% year over year. New listings have been down every month since June, which is, again, an accelerated version of a normal seasonal trend. Inventory reached its lowest level in a decade in December of 2022.
Although national forecasts call for home prices to stabilize or decline in some markets next year, Atlanta is rated the #1 top real estate market for 2023 by the National Association of REALTORS, with home prices expected to increase at least 5% in 2023.
Consumers demand is shifting and home quality matters again. Houses that are well designed, located in desirable areas, and priced well continue to sell. Those with less desirable characteristics are staying on the market longer and in some cases selling below asking price.
There is still latent demand as many people have been in “wait mode,” hoping that interest rates fall and more inventory comes to market. Market uncertainty is still compelling buyers to wait to buy until things look more favorable, which they perceive to be right around the corner. Buyers and sellers are just beginning to realize we are not going to snap back to the same market as a year ago, are adjusting to new interest rates, and are finally making buying and selling decisions again.
Christa Huffstickler Founder & CEO Engel & Volkers Atlanta

2022 END OF YEAR ATLANTA MARKET INTELLIGENCE 5 ENGEL & VÖLKERS www.evatlanta.com

A Guide to the Report

Interested in getting to know the Atlanta real estate market? See how this guide is structured and learn about key indicators to help you make sense of what is happening in the market.

2022 End-of-Year Market Intelligence Report
A Guide to the Report
This report is designed as a guide to the Metro Atlanta real estate market, helping savvy homebuyers and sellers make informed, strategic decisions in the year to come. Whether you’re an Atlanta native or new to the area, this guide will give you the intel you need to understand what is happening in the market overall and hone in on the best options for you and your family.
Where to Start
This report has three sections, beginning with an overview of the market before getting into specifics about home types and submarkets within Metro Atlanta:
1 Market Trends
Take a deep dive into broader market and economic trends driving the real estate market, including interest rates, inventory levels, price trends, and the Atlanta economy, framed through our seller and buyer clients’ top FAQs this season.
Beginning on page 14.
Data Sources
2 Market Snapshot
Are you selling or looking for a single-family home, townhome, or condominium? Check out what’s happening market-wide for each home type and how prices and products in different neighborhoods compare.
Beginning on page 30.
3 Submarket Profiles
Metro Atlanta has many neighborhoods, homes, and lifestyles to offer. See what’s happening across each submarket and what new development is on its way to the neighborhoods on your mind.
Beginning on page 75.
What is FMLS?
Data referenced throughout this report comes primarily from the First Multiple Listing Service (FMLS), TrendGraphix, and MarketNsight. Sources are noted with tables and charts, or as endnotes compiled at the end of this report. This report is focused on the second half of 2022 and most data refers to Q3 and Q4 overall (July 1, 2022 to December 31, 2022), or select months where specified.
First Multiple Listing Service is a regional real estate database for the Atlanta area, with data on most of the active, pending, and closed sales in the area. Additional off-market transactions may have occurred, but are not included in FMLS data.
2022 END OF YEAR ATLANTA MARKET INTELLIGENCE 9 ENGEL & VÖLKERS www.evatlanta.com
Defining Metro Atlanta


This report discusses the market from the metro level down to specific neighborhoods. Here’s how we define the geographies referenced throughout the report:
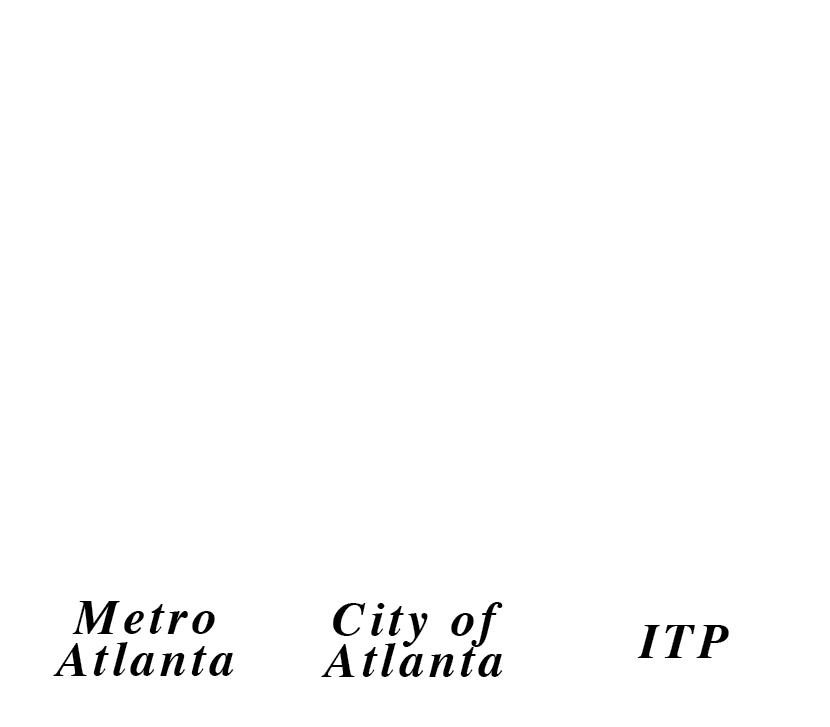
Metro Atlanta
This 11-county area includes Cherokee, Clayton, Cobb, DeKalb, Douglas, Fayette, Forsyth, Fulton, Gwinnett, Henry, and Rockdale Counties. Some of our data sources use the term “Greater Atlanta Area” to refer to this same geography.
Inside the Perimeter (ITP)
Interstate 285 (I-285) forms a ring around Atlanta known as The Perimeter. Neighborhoods inside the perimeter are called “ITP.” This includes most of the City of Atlanta and nearby places like Brookhaven, part of Sandy Springs, Chamblee, Vinings, East Point, College Park, Hapeville, and Decatur.
Outside the Perimeter (OTP)
Neighborhoods and cities outside the I-285 perimeter are “OTP.” This area covers most of suburban Atlanta.
NW, SW, NE, & SE Quadrants
The four quadrants of Atlanta are a way to organize the city by subareas. They are delineated by major streets in the center of the city. Peachtree Street runs north-south and generally aligns with where Interstates 75 and 85 (I75/85) run outside of the center of the city. This line distinguishes “west” from “east” neighborhoods. Interstate 20 (I-20) runs east-west through the metro just south of Downtown. It delineates the “north” part of the metro from the “south” part.

North Georgia
The North Georgia market has close ties to Metro Atlanta as a nearby escape to nature, surrounded by the hills and mountains. It includes places like Blue Ridge, Ellijay, and Helen in Clay, Fannin, Gilmer, Murray, Pickens, Rabun, Towns, and Union Counties.


2022 END OF YEAR ATLANTA MARKET INTELLIGENCE 10 ENGEL & VÖLKERS www.evatlanta.com
Key Indicators

The following key indicators are used throughout this report to describe market trends:
Active Listings
Properties that are currently listed for sale on FMLS. Additional properties may be for sale at any given time— such as for-sale by owner homes or off-market listings— but are not included in the count of “active listings” in this report if they are not in the FMLS database.


New Listings

New listings are those that have been added to FMLS in a given month. They do not include active listings that were entered in previous months.

Closed Sales
Closed sales represent homes that have sold and transactions have been finalized. This indicator tends to lag market trends slightly because properties typically close one to two months after an offer has been accepted and buyers have locked their interest rates.
Pending Sales
Pending sales are properties that have accepted an offer from a buyer and is in the due diligence period. The sales transaction has not happened yet. This is a leading indicator because it give us insight
Sale Price
The sale price is the final amount paid for a home. It is measured as either an average or a median, with the average price tending to be skewed higher by the highest priced homes. It does not reflect seller concessions, such as closing costs that may have been paid.

Sale Price to List Price Ratio
The sale price to list price ratio (SP/LP) indicates if a home sold at (100%), above (>100%), or below (<100%) the listed asking price. The sale price to original list price ratio (SP/OLP) compares the sale price to the original asking price, as the current asking price may have reflected price changes.
Days on Market
Days on market (DOM) measures how long it takes from the time a home is listed until the owner signs a contract for the sale of a property. This tends to vary based on the desirability of a given property, market conditions, and season.

Months of Inventory
Months of inventory indicates how long it would likely take to sell currently listed homes, if no new inventory were added. It is measured as a ratio of active listings to homes sold. 5 to 6 months of inventory is considered a balanced market. Less than 6 months supply tends to favor sellers, and more tends to favor buyers.

2022 END OF YEAR ATLANTA MARKET INTELLIGENCE 11 ENGEL & VÖLKERS www.evatlanta.com

Market Trends
Learn about the factors that shaped the Metro Atlanta housing market in the second half of 2022 and what it means for real estate in 2023.

2022 End-of-Year Market Intelligence Report
Market Trends Overview
Over the past year, macro trends like rising interest rates and tight housing inventories have shaped the way buyers and sellers have approached the real estate market. Check out what has been happening with these key trends with our clients’ top FAQs and see how they’re shaping the market ahead in 2023.
Client FAQs
Interest Rates
• What’s next for interest rates?
(page 16)
• Market Trend: Rate Buydowns
(page 17)
Inventory
• Is supply beginning to exceed demand? (page 18)
• Why are there more listings but it still doesn’t feel like there are any good homes to choose from?
(page 19)
• Will there be an influx of foreclosed homes like in the Great Recession? (page 19)
• Are there more new construction homes on the way? (page 19)
Home Prices
• What is normal for price appreciation?
(page 20)
• Has normal seasonality returned?(page 21)
• How do sale prices align with appraised values? (page 22)
• Will home prices drop dramatically this year? (page 23)
Transaction Volumes
• Which price points had the most sales?
(page 25)
• Can Atlantans afford current homes?
(page 26)
Growth & Migration
• How is Atlanta’s economy doing? (page 27)
• Where are people who move to Atlanta coming from? (page 27)

2022 END OF YEAR ATLANTA MARKET INTELLIGENCE 14 ENGEL & VÖLKERS www.evatlanta.com
?
Interest Rates
Mortgage interest rates have been a driving force in the housing market in 2022. The year started with near record low rates for a 30-year fixed rate mortgage, which averaged 3.22% nationally at the start of the year.1 At the same time, inflation was on the rise globally and home prices were rising rapidly as low borrowing costs enticed buyers and contributed to stiff competition for a limited inventory of homes. To reign in inflation, the Federal Reserve began raising its benchmark interest rates in the spring, a factor leading to an increase in mortgage rates. The Fed’s goal in raising interest rates was to cool demand and slow price
increases, an effect that has been felt in the housing market more than in most sectors of the economy.
Mortgage interest rates more than doubled over the course of 2022, the largest single-year increase since the early 1980s. By June, the average rate for a 30-year fixed-rate mortgage exceeded 5.25%, which proved to be a sensitivity threshold above which buyer demand dampened, leading to declines in home sales beginning in late summer. The average interest rate for a 30-year fixed-rate mortgage reached a 20-year high of 7.08% in November, which most economists
Metro Atlanta 2022 Monthly Pending and Closed Sales vs. Interest Rates
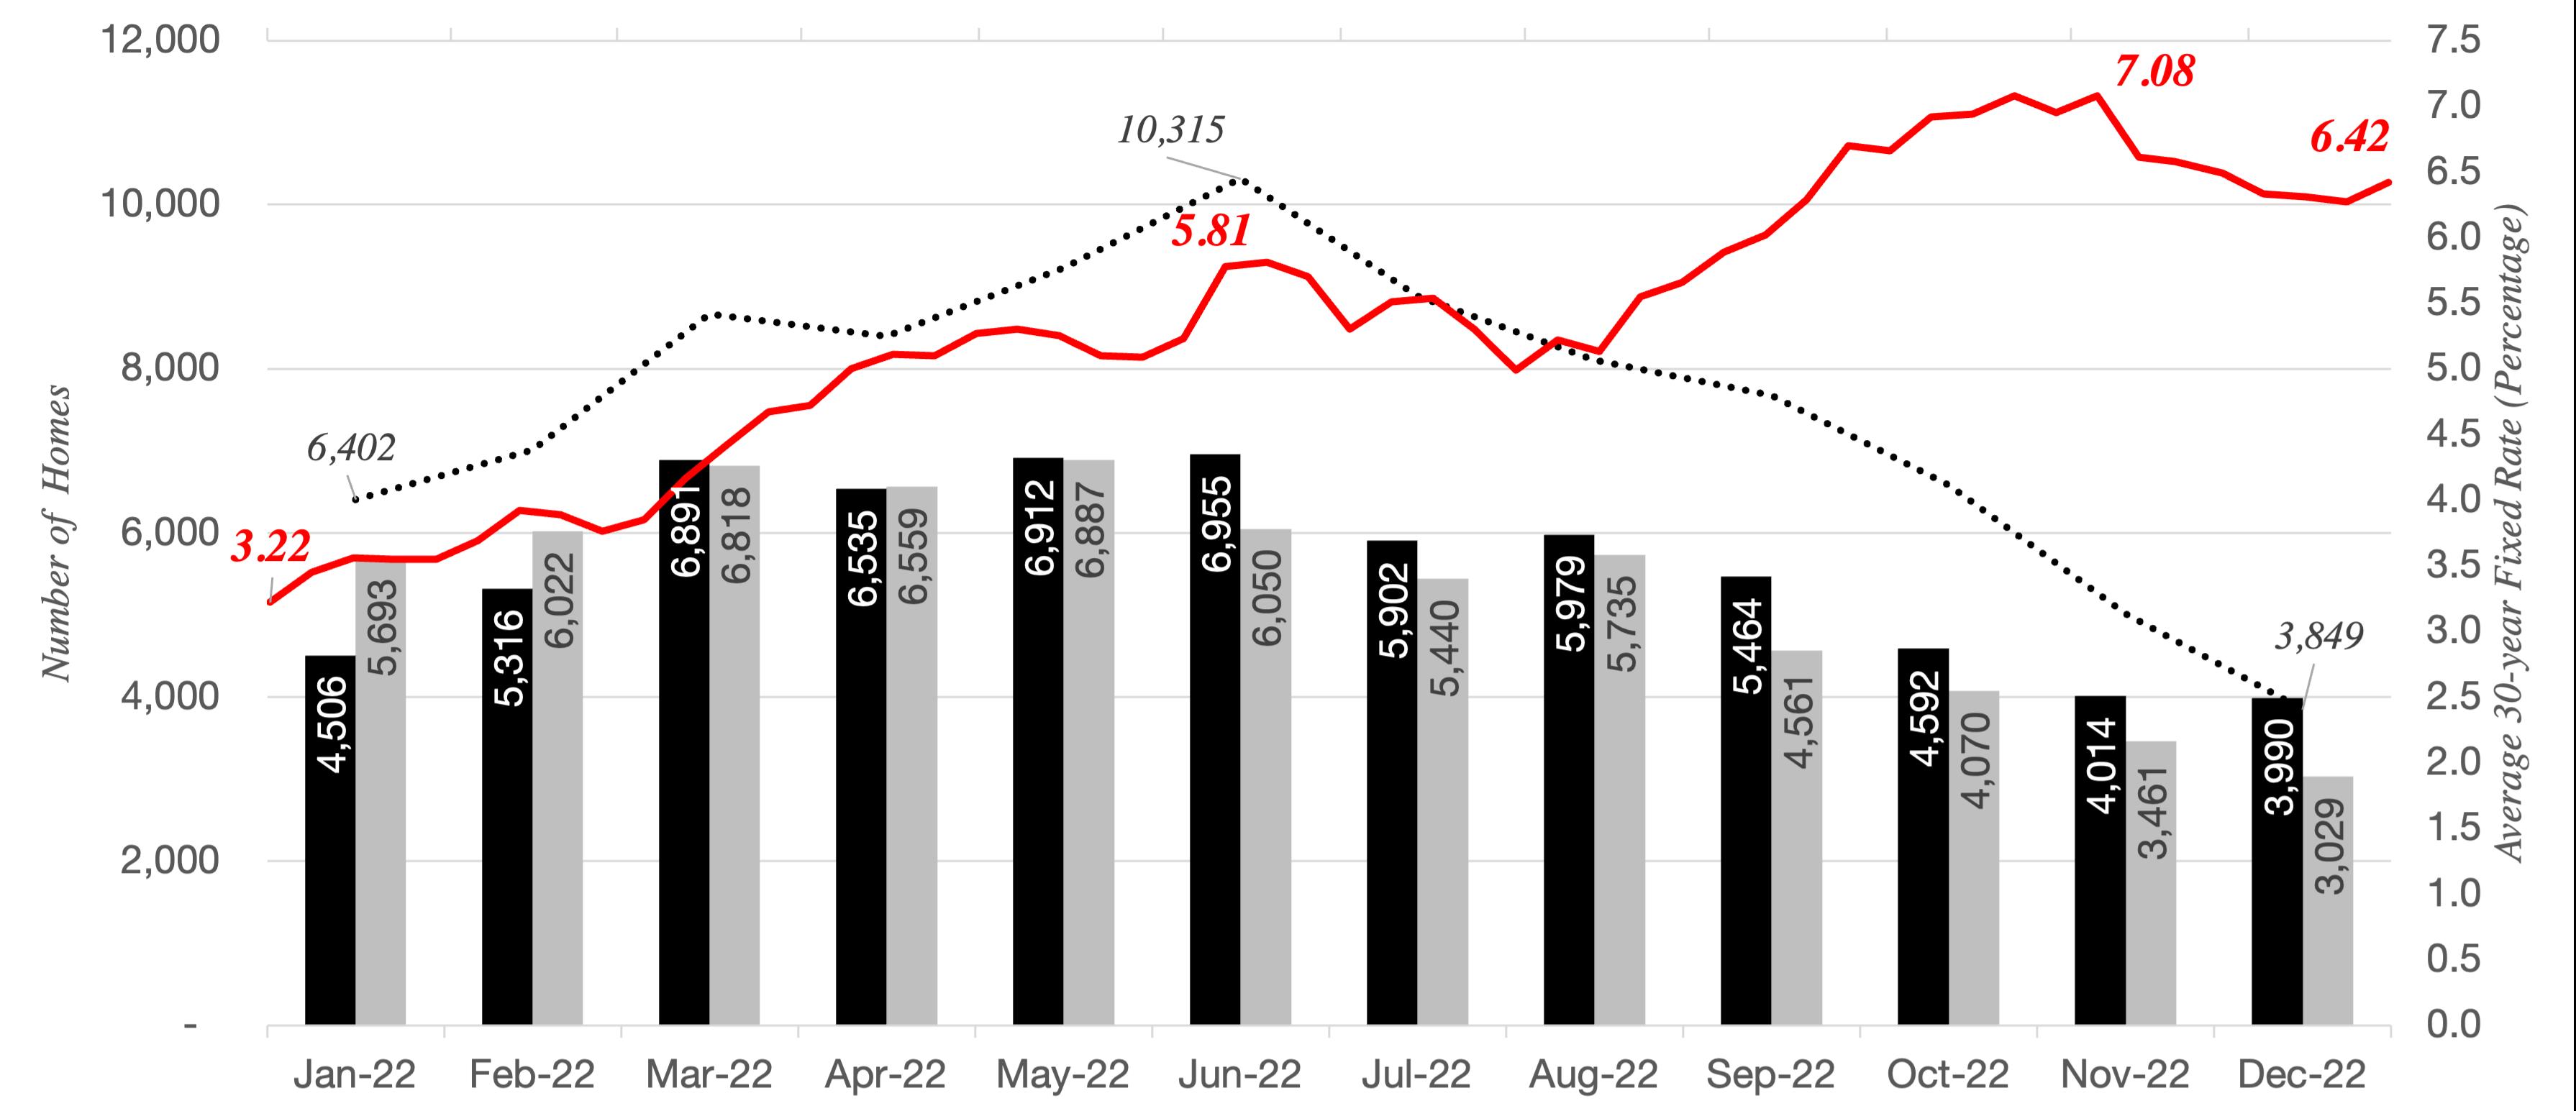
Most economists believe mortgage interest rates for this cycle peaked in November 2022 and will stabilize in 2023, ranging from about 6.5% to 5.5%.
believe to be the peak rate for this cycle. It declined to 6.42% by the end of the year,2 returning to a level typical in the early 2000s, but still above levels that are likely needed to bring significantly more buyers into the market.
2022 END OF YEAR ATLANTA MARKET INTELLIGENCE 15 ENGEL & VÖLKERS www.evatlanta.com
Source: FMLS InfoSparks (Greater Atlanta Area), Freddie Mac Primary Mortgage Market Survey (National)
Interest rates over 5.25%
Brief drop in interest rates Interest rates peaked in November
(Seasonal#SalesandNewListingsDecline Trend+InterestRates)
What’s Next for Interest Rates?
The Federal Reserve has stated its intent to continue restricting monetary policy until it believes inflation is under control. This means that although mortgage interest rates are expected to decline slightly
in 2023, they are not likely to return to the 3% range in the next couple of years. The Federal Reserve has not yet made a clear statement about their policy for rates in 2023. Most economists are forecasting that inflation and mortgage interest rates already peaked for this cycle in late 2022.
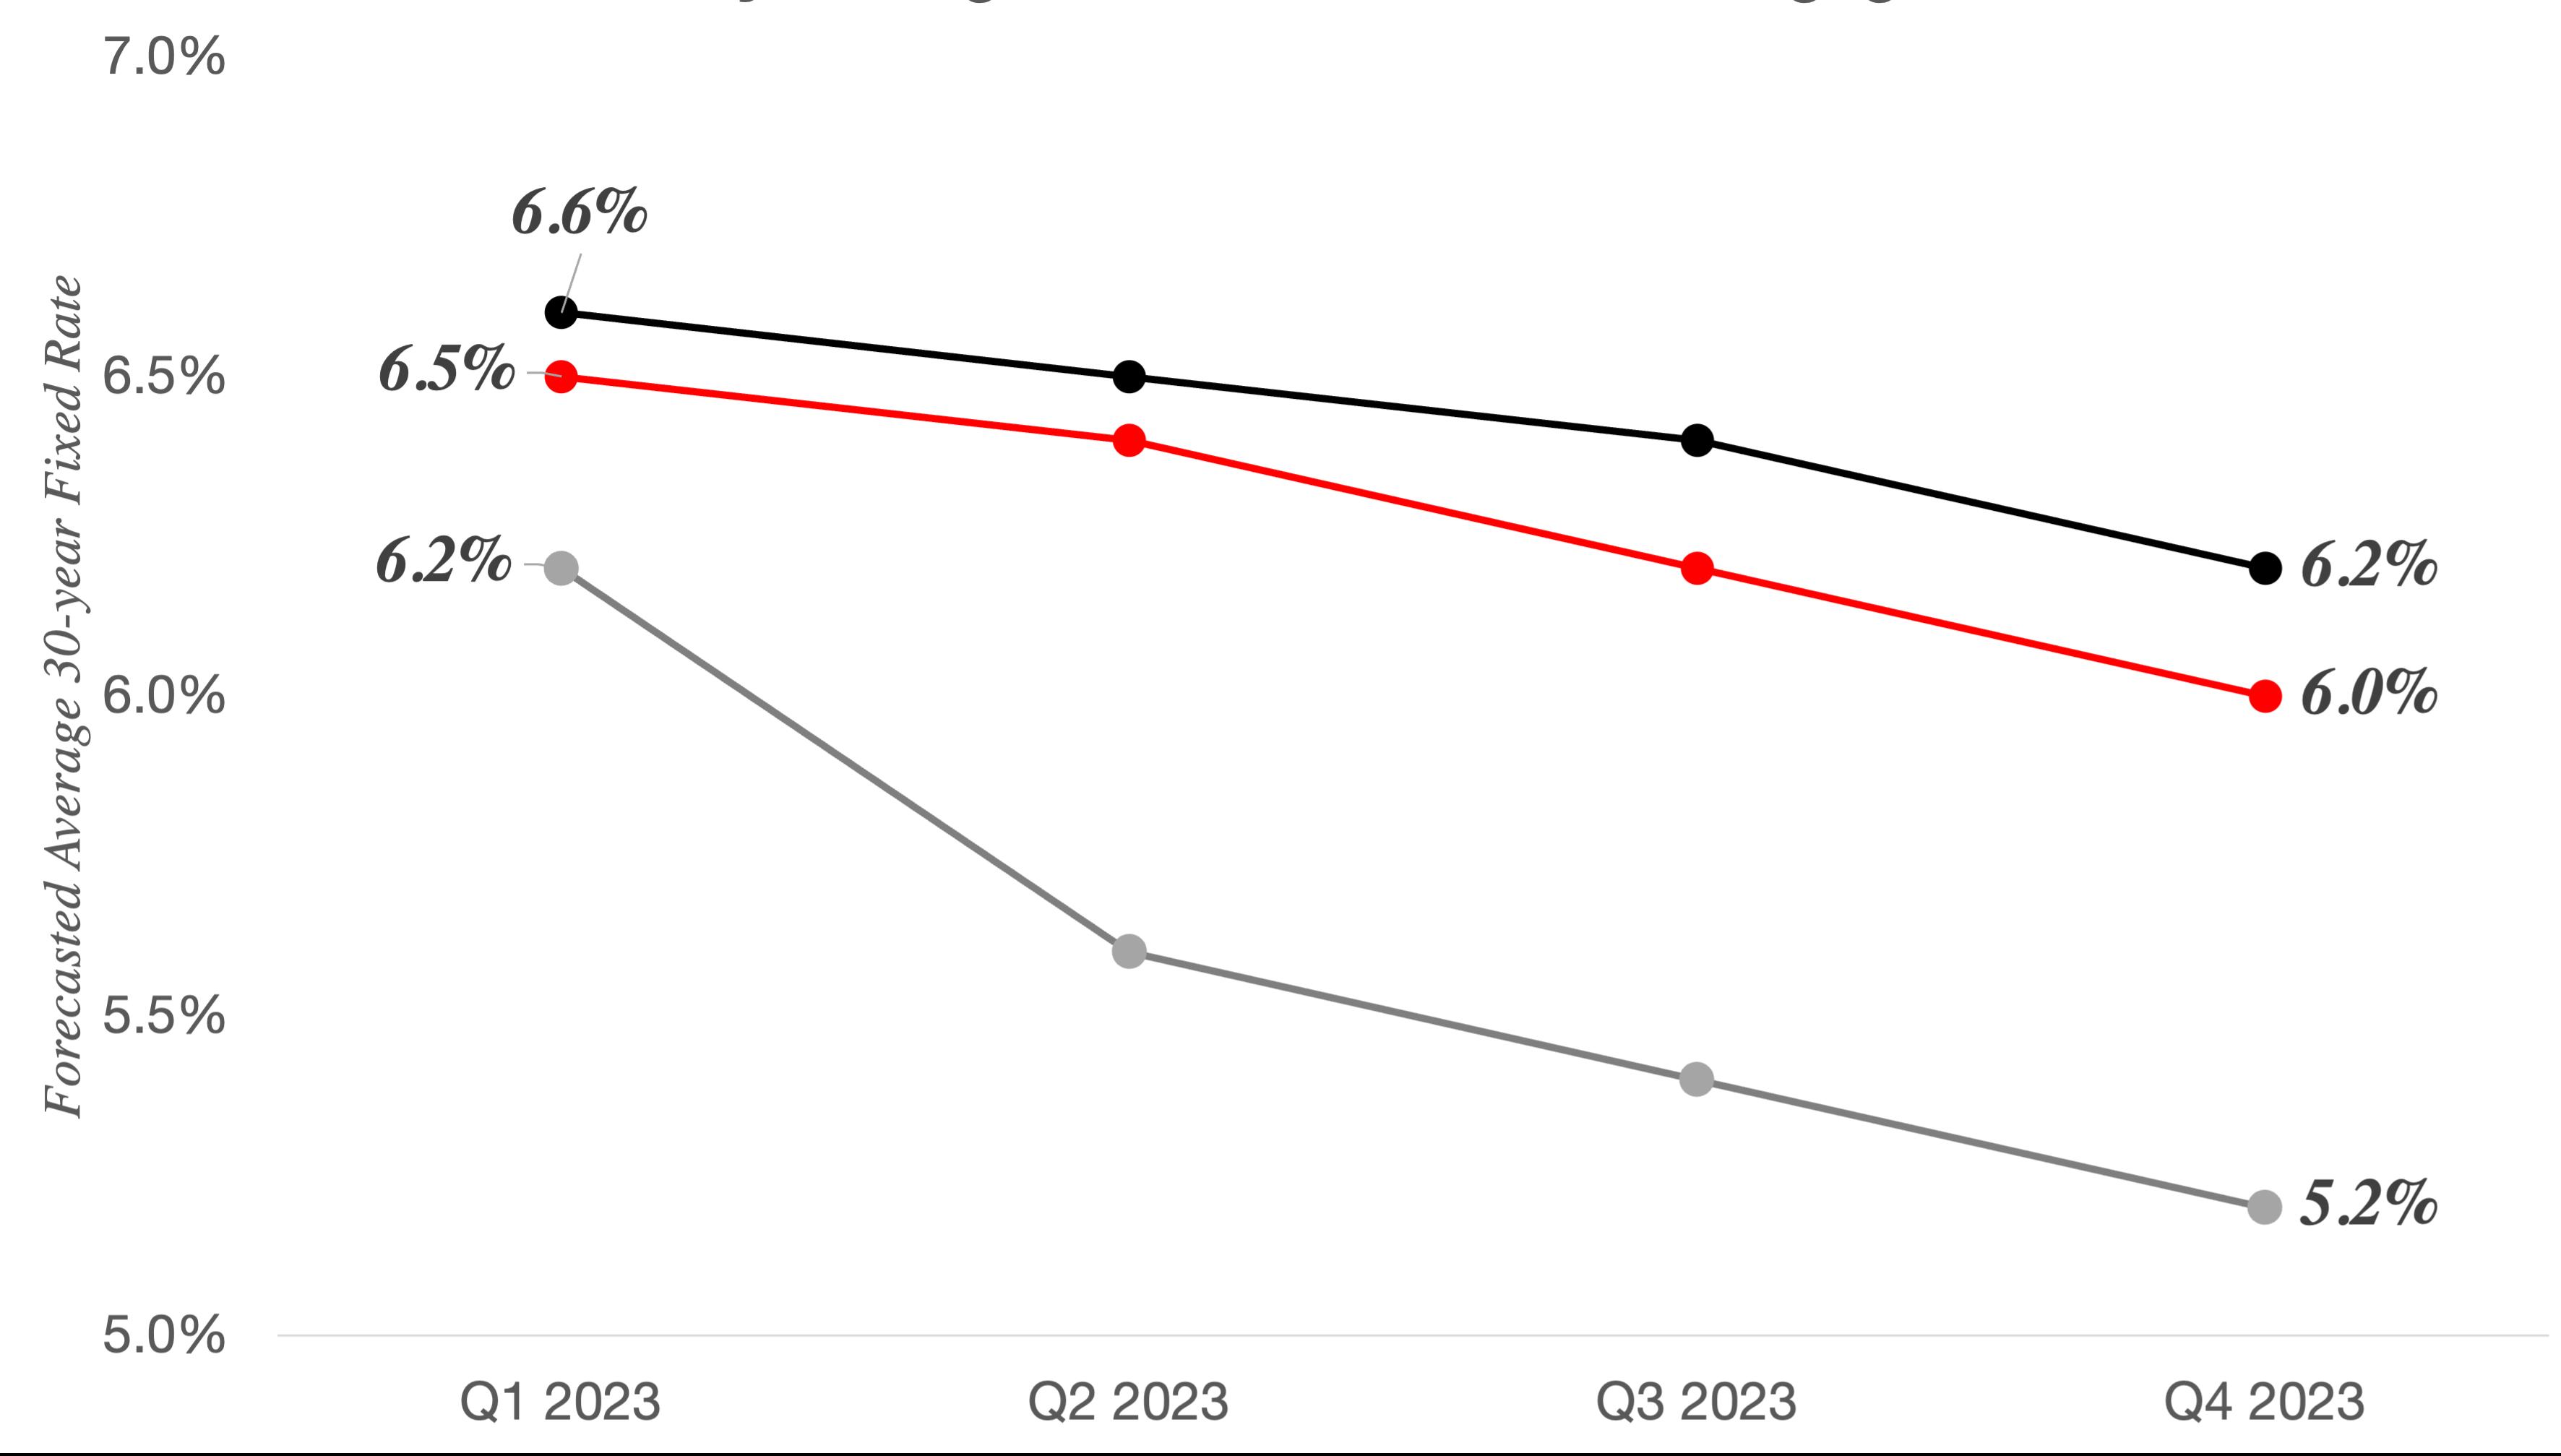
Forecasts for mortgage interest rates next year vary,3, 4, 5 typically stabilizing near current levels (6% to 6.5%) in the first half of 2023, with a slight decline in the latter half of the year. Buyers interested in making a purchase over the next year will need to adjust to mortgage rates staying within the 5.5% to 6.5% range.
2023 Quarterly Average 30-Year Fixed Rate Mortgage Forecasts
30-year Fixed Rate Mortgage Interest Rate Forecasts
2022 END OF YEAR ATLANTA MARKET INTELLIGENCE 16 ENGEL & VÖLKERS www.evatlanta.com Historic Forecasted 2022 2023 2024 Q1 Q2 Q3 Q4 Q1 Q2 Q3 Q4 Q1 Q2 Q3 Q4 Freddie Mac (Oct. 2022) 3.8% 5.3% 5.6% 6.8% 6.6% 6.5% 6.4% 6.2% - - -Fannie Mae (Dec. 2022) 3.8% 5.2% 5.6% 6.7% 6.5% 6.4% 6.2% 6.0% 6.5% 6.4% 6.2% 6.0% Mortgage Bankers Association (Jan. 2023) 3.9% 5.3% 5.7% 6.6% 6.2% 5.6% 5.4% 5.2% 5.0% 4.7% 4.4% 4.4%
“It is likely that restoring price stability will require holding policy at a restrictive level for some time. We will stay the course until the job is done.”
-Federal Reserve Chairman
Jerome Powell
Freddie Mac Forecast Fannie Mae Forecast Mortgage Bankers Association Forecast
Market Trend: Rate Buydowns
In the new construction market, some homebuilders have begun to work around the prevailing interest rates by offering incentives like rate buydowns to attract buyers who are sitting on the sidelines waiting for rates to drop. In certain cases, individual homeowners have offered similar rate buydown incentives as well.
Rate buydowns allow a seller to pay an upfront fee to reduce the buyer’s interest rate by a set amount for a set period of time, before returning to a fixed rate. The most common types are 2/1 buydowns—which reduce the interest rate by 2% in the
first year and by 1% in the second year—and 3/1 buydowns, which reduce the interest rate by 3% in the first year, 2% in the second year, and 1% in the third year. With these temporary buydowns, buyers typically hope that interest rates will decline in the next few years, at which point they can refinance their loans at a lower rate, generally for a fee. For a permanent reduction, the seller may pay discount points to reduce the interest rate over the life of the loan, at a higher cost.
For more information about these trending tools, check with your mortgage provider for available programs and terms.
Types of Rate Buydowns
2/1 Buydown
The mortgage interest rate is reduced by 2% in the first year and by 1% in the second year
3/1 Buydown
The mortgage interest rate is reduced by 3% in the first year, 2% in the second year, and 1% in the third year
Discount Points
Fee paid to permanently reduce a fixed interest rate
2022 END OF YEAR ATLANTA MARKET INTELLIGENCE 17 ENGEL & VÖLKERS www.evatlanta.com
Inventory
Is supply beginning to exceed demand?
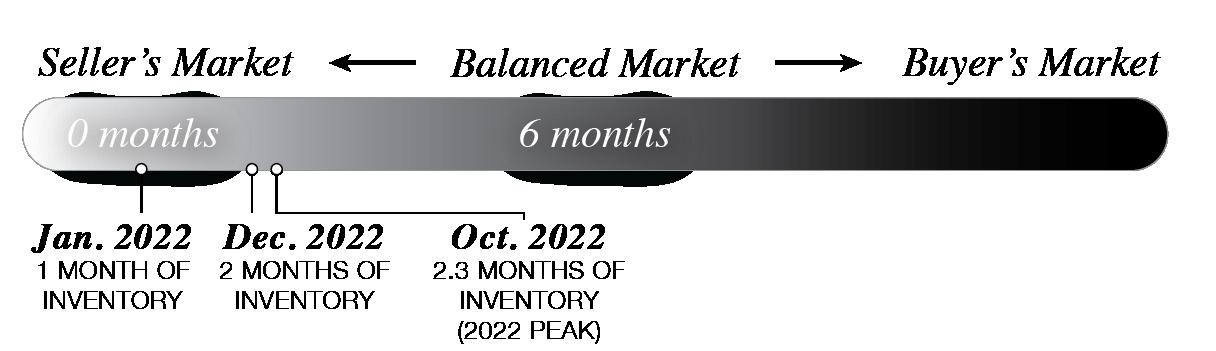
Demand continues to outpace supply in Atlanta. In January 2022, home inventory was at a record low of 1 month of supply. Although it has risen significantly since then, there was still only a 2.1-month supply of homes for sale by year end.6
At the start of 2022, the very limited number of available homes in Atlanta could not match pandemic era buyer demand in a time with low mortgage rates and an increased focus on life at home. This inventory shortage contributed to competitive conditions that heavily favored sellers and led to bidding wars, rapidly rising home prices, and ultrafast timelines, with most homes selling in less than a week.
Home inventory is measured as “months of inventory,” a term that describes how long it would likely take for all the actively listed homes to sell, if no new homes were listed, based on the recent pace of home sales. A 6-month supply is considered a balanced market, with fewer months of inventory favoring sellers and more favoring buyers.
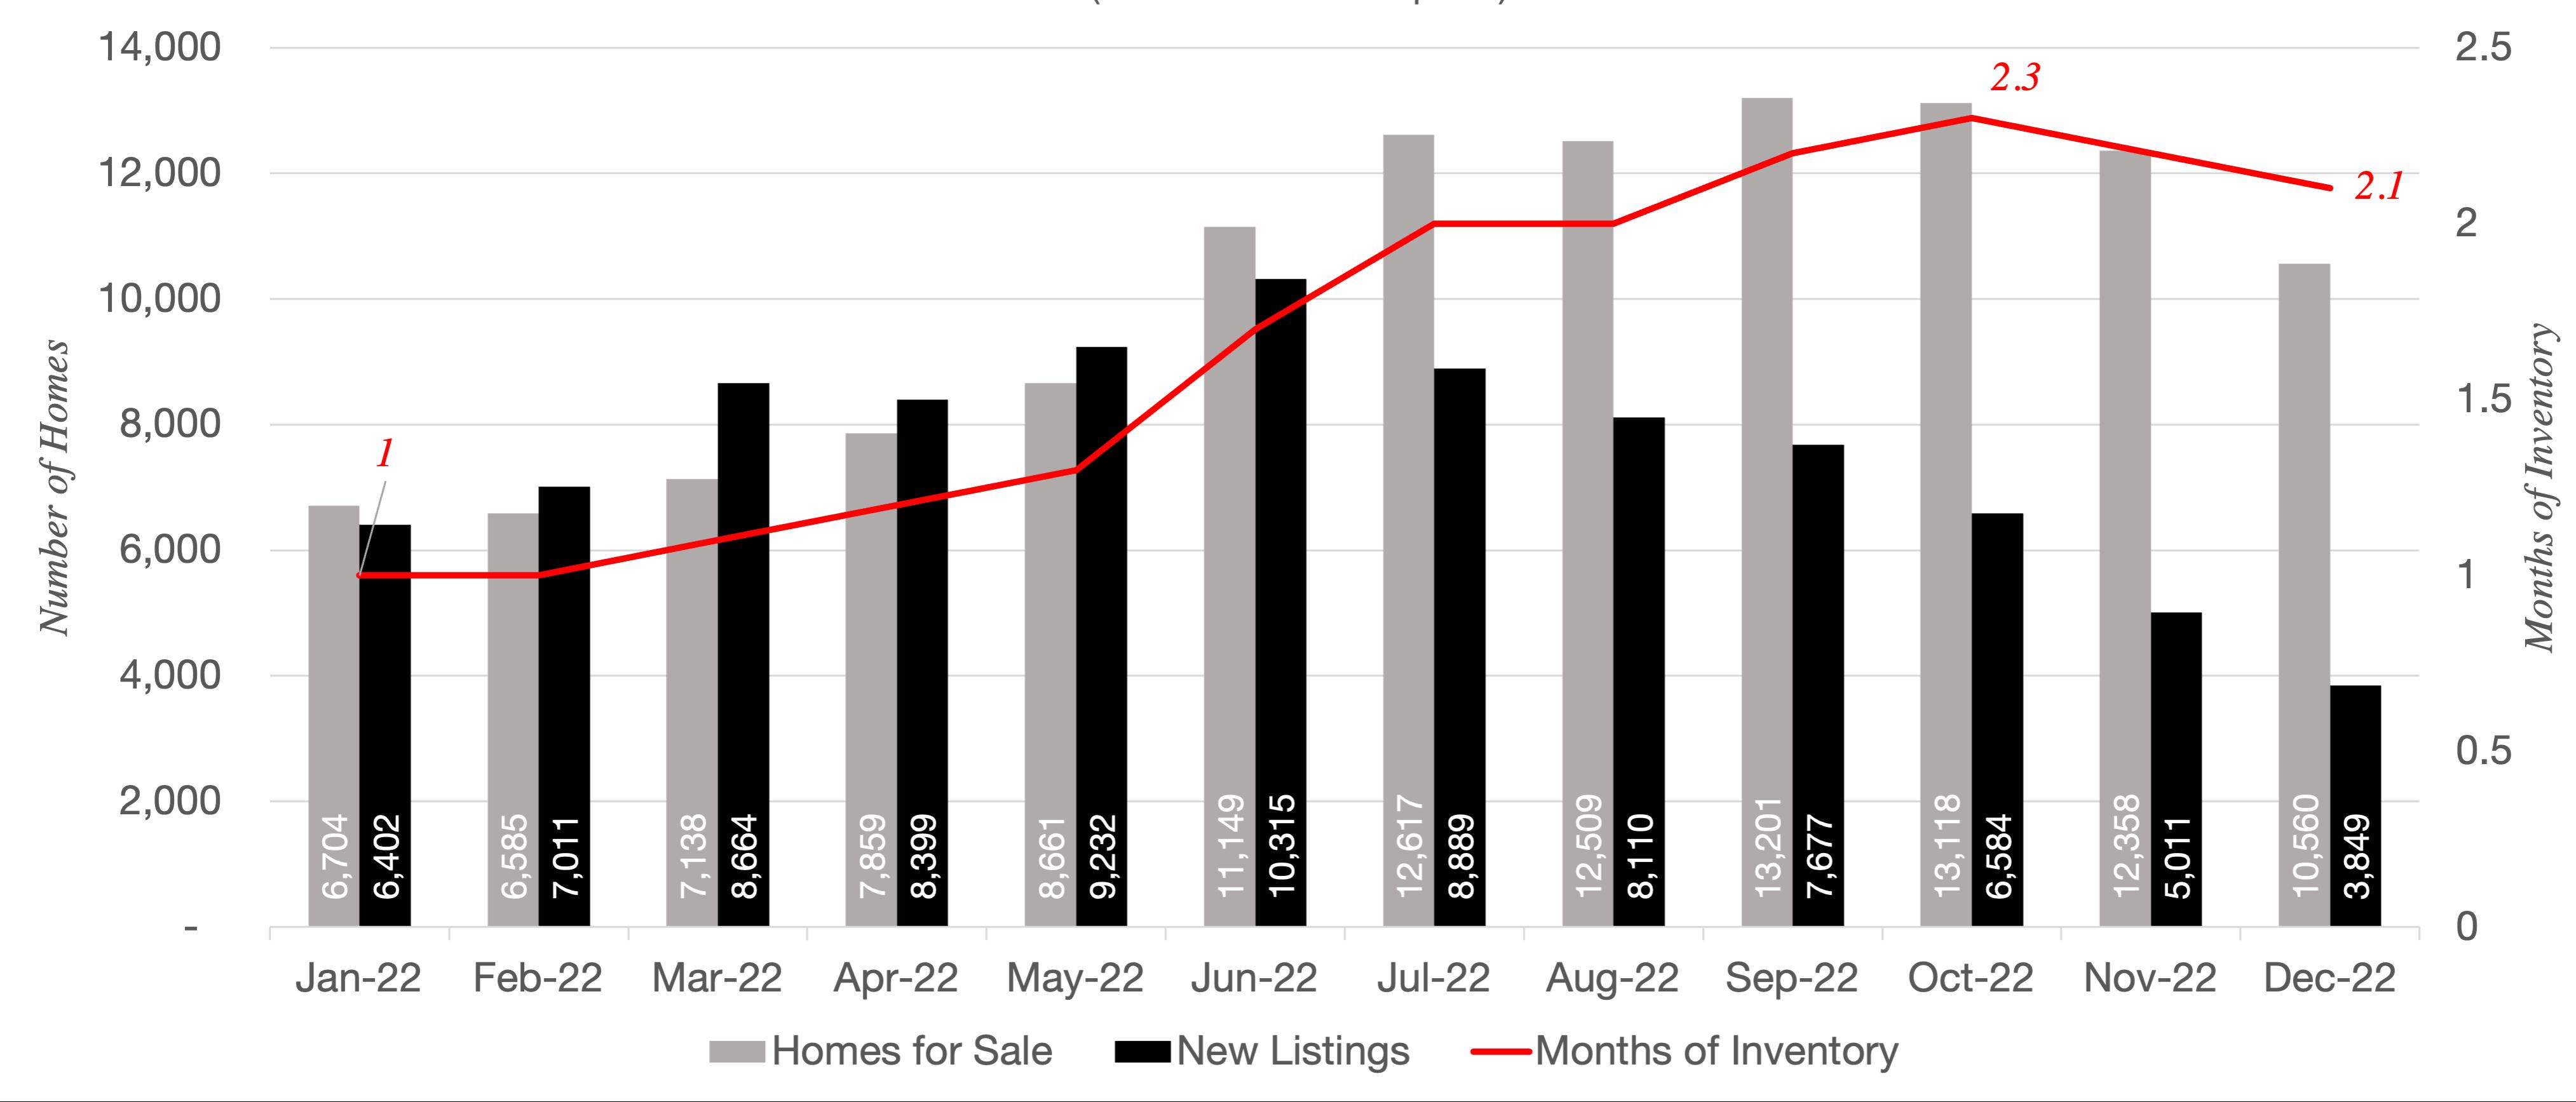
summer, buyer demand declined, but so did new listings, with current homeowners hesitant to give up their low interest rates. Atlanta reached a peak of 2.3 months of supply in October and dropped back to just 2 months in December, following a typical seasonal slowdown in the winter.
Supply ticked up heading into the spring market as more homes were listed, a normal seasonal trend. As mortgage interest rates rose over the Metro Atlanta 2022 Monthly Home Inventory
Despite lower demand, the Atlanta market remains at less than half of the supply that would be considered a balanced market (6 months of inventory), with select submarkets approaching a balanced market. Assuming interest rates peaked in November and demand bottomed out at that time, months of supply in spring and summer 2023 are not expected to go above 3 months.
2022 END OF YEAR ATLANTA MARKET INTELLIGENCE 18 ENGEL & VÖLKERS www.evatlanta.com
Source: FMLS InfoSparks (Greater Atlanta Area)
Much of the increase in home inventory in late 2022 can be attributed to homes taking longer to sell than they did early in the year, rather than a major increase in the number of homes buyers can choose from. After lightning fast sales in early 2022, the time it takes to sell the average home also increased in the second half of the year, a return to normal seasonality after an unusually hot market in 2020 and 2021. By December, the median days on market rose to 23 days in the Greater Atlanta Area, still a week faster than in December 2019, a typical year when the median days on market was 30 days.7
Buyers feel like they have more to choose from when new listings that fit their criteria are added. New listings in Metro Atlanta declined every month from June to December, slightly outpacing the normal seasonal trend of fewer new listings in the second half of the year. The number of new listings in December 2022 was the lowest of any month in a decade. Just 3,849 new listings were added, about a third of the new listings added in June 2022 and 29% lower than the average of Decembers in 2017 to 2021.8 Fewer homeowners are choosing to sell, discouraged by higher interest rates and limited inventory. As of November 2022, 99% of U.S. homeowners with mortgages had rates below 6%,9 which disincentivizes them from selling their current home to buy another at a higher rate, leading to
stagnation in home inventory and limited choices for buyers.
In January 2023, the number of new listings went up for the first time since June 2022, with 45% more new listings than December. Although new listings were still below average for January, this uptick is a sign that sellers who have been waiting are beginning to get off the fence.
Will there be an influx of foreclosed homes like in the Great Recession?
Current homeowners often have a significant amount of equity in their homes due to recent price appreciation. Combined with a strong labor market and less risky loan underwriting in recent years, this means they are not likely to be forced into a sale for financial reasons, as was the case for some homeowners during the Great Recession. Several indicators show current homeowners in a strong financial position with a low likelihood of a wave of foreclosures:
• The foreclosure rate today is at a historical low of 0.6% nationally.10
• Significant price appreciation in past two years has given homeowners stronger equity positions in their investments. In the third quarter of 2022, the average U.S. loan-tovalue (LTV) ratio was 43.6%, significantly lower than the average 71.3% LTV heading into the great recession in Q1 2010.11
• Nationally, distressed property sales made up just 2% of all sales in November 2022, well below the 30% mark seen during the Great Recession.12
• Mortgage delinquency is also low at 3.6%, compared to 10.1% during the Great Recession.13
• The national unemployment rate is at 3.4%, the lowest in 53 years14
Are there more new construction homes on the way?
New homes are under construction, but not enough to meet demand. As of January 2023, the Atlanta market had an annual housing deficit of 62,000 units,15 with just 13,000 new homes expected to be constructed over the next 12 months.16 As builders begin to pull back on new starts due to economic conditions, we may see even fewer of these homes actually completed this year, furthering the deficit. This low level of inventory is one of the factors that has shielded Atlanta from the kind of significant price reductions that some buyers may have expected to coincide with a significant increase in mortgage interest rates.
2022 END OF YEAR ATLANTA MARKET INTELLIGENCE 19 ENGEL & VÖLKERS www.evatlanta.com
Why are there more listings but it still doesn’t feel like there are many good homes to choose from?
Home Prices
Homes in the Metro Atlanta appreciated in value at record pace in 2020, 2021, and the first half of 2022 before returning to a more typical pace of appreciation in the second half of 2022.

In the last three years—between December 2019 and December 2022—the average sale price in Metro Atlanta rose by 40% from $335,948 to $461,667, an increase of $125,719. That rapid growth was more than double the pace of the previous 3-year period from December 2016 to 2019, when prices rose 17%, or an average of $50,804.17 As a result, many homeowners have significant amounts of equity in their homes from price appreciation, but the cost of buying a new home is higher than ever.
The average sale price varies by home type. In Q3 and Q4 2022 the average sale prices in Metro Atlanta for each type were:
• Single-Family Home: $499,874
• Townhome: $391,205
• Condominium: $323,137
What is normal for price appreciation?
For the past 47 years, the Atlanta market has averaged 4.6% annual home price appreciation.18
After a few of years with historically high levels of price appreciation, we are returning to these more moderate levels of price growth. As of December 2022, the average Metro
“Metro Atlanta home price appreciation in December 2022 was 4.2% year-over-year, near the 47-year average of 4.6% annual price growth.”
Atlanta home price of $461,598 was up 4.2% year-over-year, near that historic norm. For Q3 and Q4 overall, average prices were up 9.9% yearover-year, with an average sale price of $477,682.
2022 END OF YEAR ATLANTA MARKET INTELLIGENCE 20 ENGEL & VÖLKERS www.evatlanta.com
Metro Atlanta Average Sale Price Growth by Home Type (Rolling 12 months, December 2016 to 2022)
40% increase in average sale price for all homes in 3 years
Source: FMLS InfoSparks, Greater Atlanta Area, Average Sale Price, Rolling 12 months, December 2016 to 2022
Has normal seasonality returned?
Homes sales—and sale prices—tend to ebb and flow with the seasons of life, with the greatest demand in the spring and summer and a natural slowdown in the winter months. In Atlanta, home prices typically rise throughout the spring market, peak in June, decline in the second half of the year, see a slight end-of-year bump in December. With frenzied demand in 2020 and 2021, that

normal historical pattern did not occur, and prices continue to rise through much of the fall and winter.
2022 largely brought a return to seasonality, with prices peaking in June and declining heading into the fall. However, the declines in home prices between June and December 2022 were greater than a typical historical decline for this period. From 2009 to 2019, the average sale price for all homes in the Greater Atlanta Area typically declined between June and December, ranging from -1.9% to -14.5%, averaging
-4.8%. In 2022, the average sale price declined -9.7% from June to December, outpacing normal seasonality for most years, but still less than the maximum decline during this period, which occurred in 2011. The most significant price declines in 2022 occurred between June and August—when normal seasonality coincided with mortgage interest rates first exceeding 5.25%—and leveled off toward the end of the year.19
2022 END OF YEAR ATLANTA MARKET INTELLIGENCE 21 ENGEL & VÖLKERS www.evatlanta.com
Metro Atlanta Home Price Seasonality (Monthly Average Sale Price 2012 to 2022)
Atlanta home prices typically rise in the Spring, peak in June, and decline in the Fall Normal seasonality did not occur in 2020 and 2021
Source: FMLS InfoSparks, Greater Atlanta Area, Average Sale Price, All Home Types
2012 2013 2014 2015 2016 2017 2018 2019 2020 2021 2022 Average Sale Price
How do sale prices align with appraised values?
Earlier this year, home prices were rising rapidly due to intense buyer competition and homes were often appraising below the contract price, requiring buyers to pay the appraisal gap in cash. In April 2022,
a record high 20% of homes had an appraisal gap. As mortgage interest rates rose and demand cooled over the summer, offers began to more closely align with appraised home values. By October 22, just 6.3% of homes were appraised below the contract sales price,20 reflecting a market more in line with actual home values.
2022 END OF YEAR ATLANTA MARKET INTELLIGENCE 22 ENGEL & VÖLKERS www.evatlanta.com
Will home prices drop dramatically this year?
The question on everyone’s minds as of late has been how far—if at all—homes prices can be expected to drop in 2023. Home price growth in 2023 will vary significantly by region. In Atlanta, there are several fundamental conditions that have prevented dramatic price declines even as interest rates doubled over the course of a year, including:
• Low inventory levels;
• Low construction activity;
• A strong economy; and
• A growing population.
These fundamentals are so strong that the National Association of Realtors (NAR) named Atlanta the #1 housing market in the U.S. with the most potential for growth in 2023. It was also ranked #9 on Zillow’s list of the hottest housing markets for 2023.
Home price forecasts vary widely and are adjusted often, and actual prices will depend on factors like inflation, prevailing mortgage interest rates, unemployment levels, submarket, and individual home quality. Despite forecasts of home prices plateauing or declining slightly on a national level in 2023,21, 22, 23 , 24, 25, 26 the Atlanta market is forecasted to see home prices grow by at least 5% this year.27
Mortgage interest rates are also expected to level off in the first half of 2023 and gradually decline in the second half of the year, with many economists anticipating rates stabilizing below 6% later in the year. This rate reduction and stabilization would lower the cost of home ownership and increase the sense of certainty in the market, increasing demand by widening the pool of eligible buyers and enabling buyers of all kinds to get more for their money.

2022 END OF YEAR ATLANTA MARKET INTELLIGENCE 23 ENGEL & VÖLKERS www.evatlanta.com
“The Atlanta market is rated the #1 real estate market to watch in the U.S. in 2023, with home prices forecasted to grow by at least 5% this year.”
according to the National Association of Realtors forecast
Zillow Regional Home Values Forecast (November 2022 to November 2023)
Map and Data Source: Lance Lambert, Zillow, 20 January 2023
Transaction Volumes
Fewer people have been buying and selling homes since higher interest rates set in during summer 2022. Pending sales are a leading indicator of sales activity— typically about a month ahead of closings— and had a strong relationship to ongoing interest rate changes in 2022.
Pending sales began to decline in April, as interest rates first began to rise and more significantly in June, when they rose above 5.25%. Pending sales continued to decrease throughout most of the second half of the year, in keeping with seasonal trends accelerated by rising interest rates.
August was the only month that did not post month-over-month declines in pending sales. When interest rates dipped to 4.99% in early August, there was an uptick in transactions, with 5.4% more pending sales than July. Pending sales reached what is believed to be the low point for this cycle in November, when interest rates peaked at 7.08%.
In December, interest rates came down for six consecutive weeks and pending sales bounced slightly.28
In early January 2023, they continued to pick up. Although they were still down year-over-year (YOY), they were down 16% YOY (and just -5% compared to 2019) the third week of January, an improvement over the low point in November when pending sales were down 45% YOY,29 showing signs of buyers returning as rates stabilize. That same week, mortgage applications nationally were up 7% over the previous week, another sign of buyers getting ready to enter the spring market.30
As of the week of February 2nd, the average 30-year fixed rate mortgage rate was at 6.09%.31 With interest rates expected to land in the 5.5% to 6.5% range for most of 2023, the total number of homes sold in 2023 is expected to be lower than in 2022. Nationally, the NAR is forecasting a 7% decline in home sales for 2023 compared to 2022.32
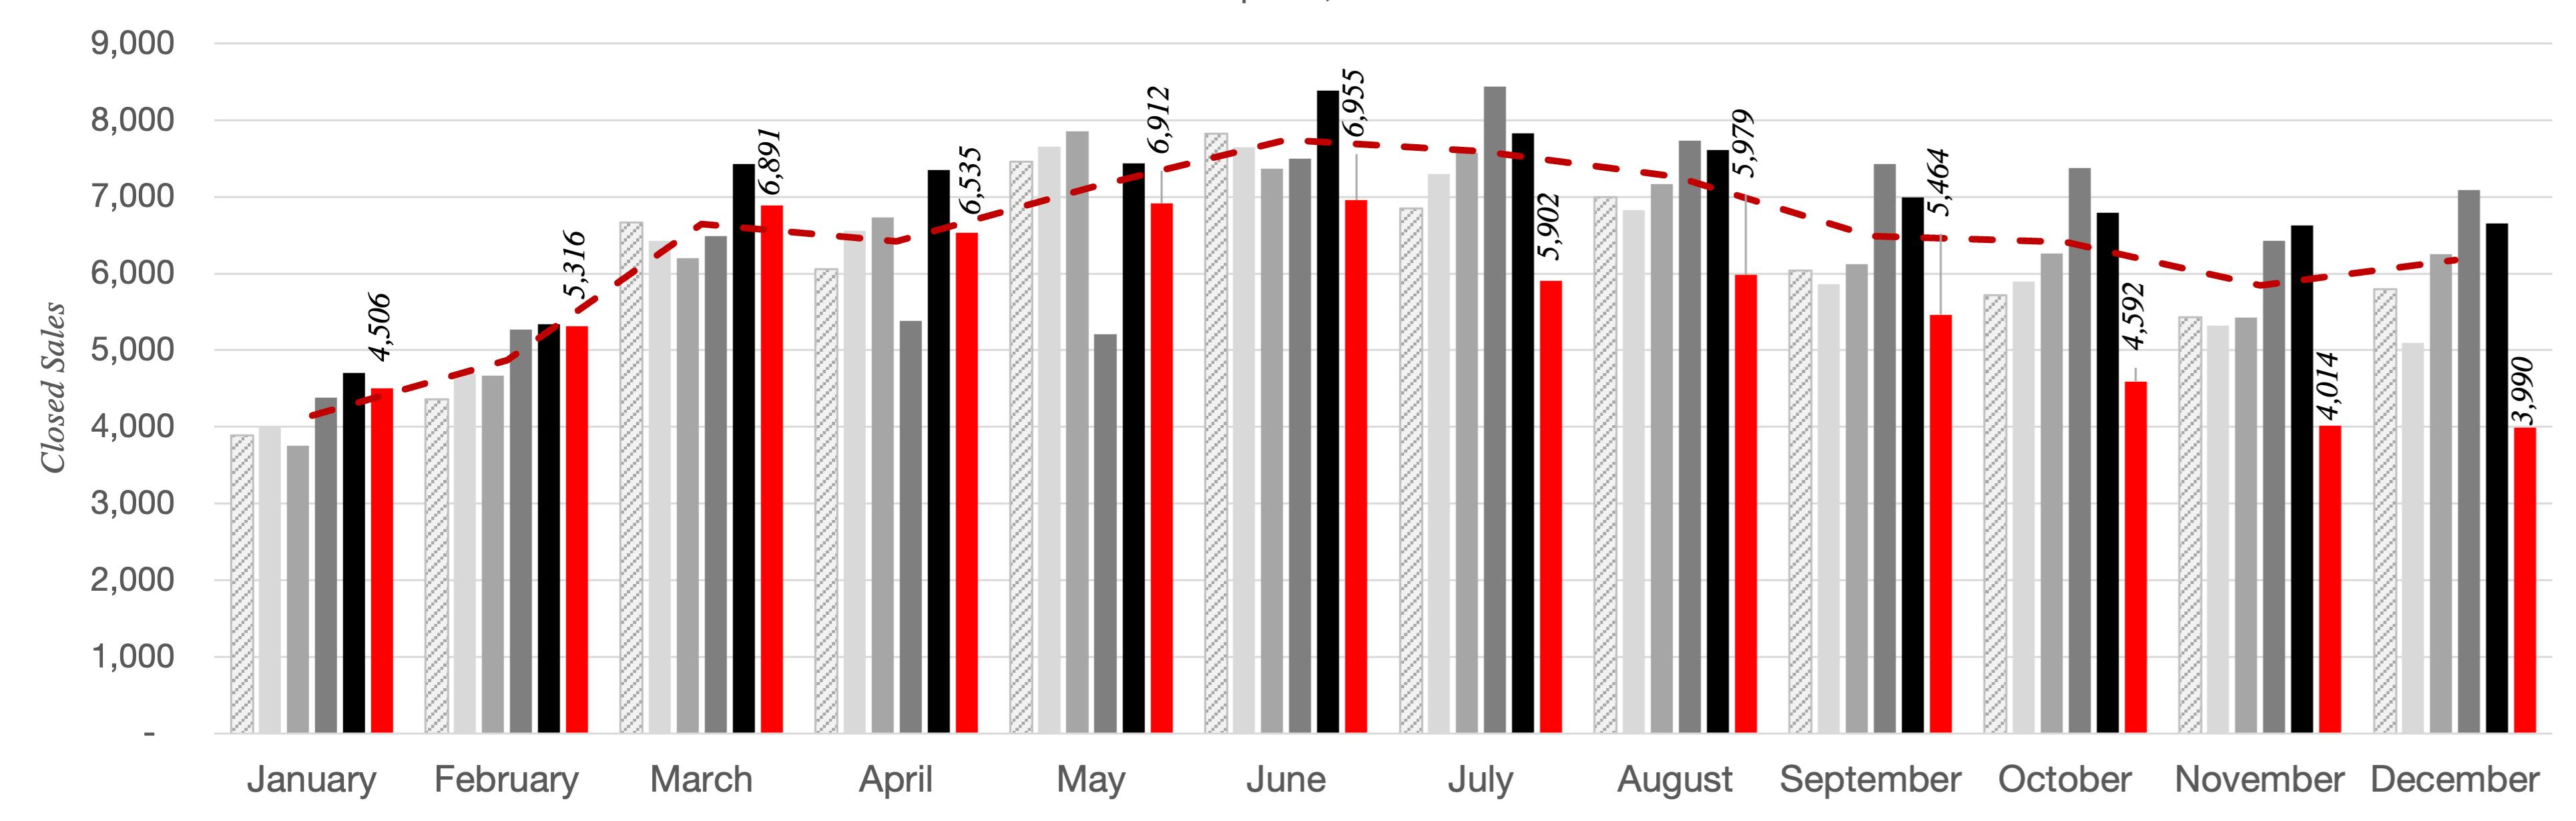
67,095 homes were sold in all of 2022 (13% fewer than the annual average for 2017-2021)
17,345 homes were sold in Q3 (19% fewer than the average for the same period 2017-2021)
12,596 homes were sold in Q4 (32% fewer than the average for the same period 2017-2021)
7% fewer homes expected to be sold in 2023 than in 2022 according to the National Asssociation of Realtors
2022 END OF YEAR ATLANTA MARKET INTELLIGENCE 24 ENGEL & VÖLKERS www.evatlanta.com
Metro Atlanta Closed Sales by Month (2017 to 2022)
Interest rates rose above 5.25% in June and sales began to slow Q1 Q2 Q3 Q4
Source: FMLS InfoSparks, Greater Atlanta Area, Closed Sales, All Home Types
Which price points had the most sales?
Entry level homes continue to make up the bulk of sales, but have taken the biggest hit in transaction volume declines since higher interest rates set in during summer 2022:
Entry Level (< $500,000)
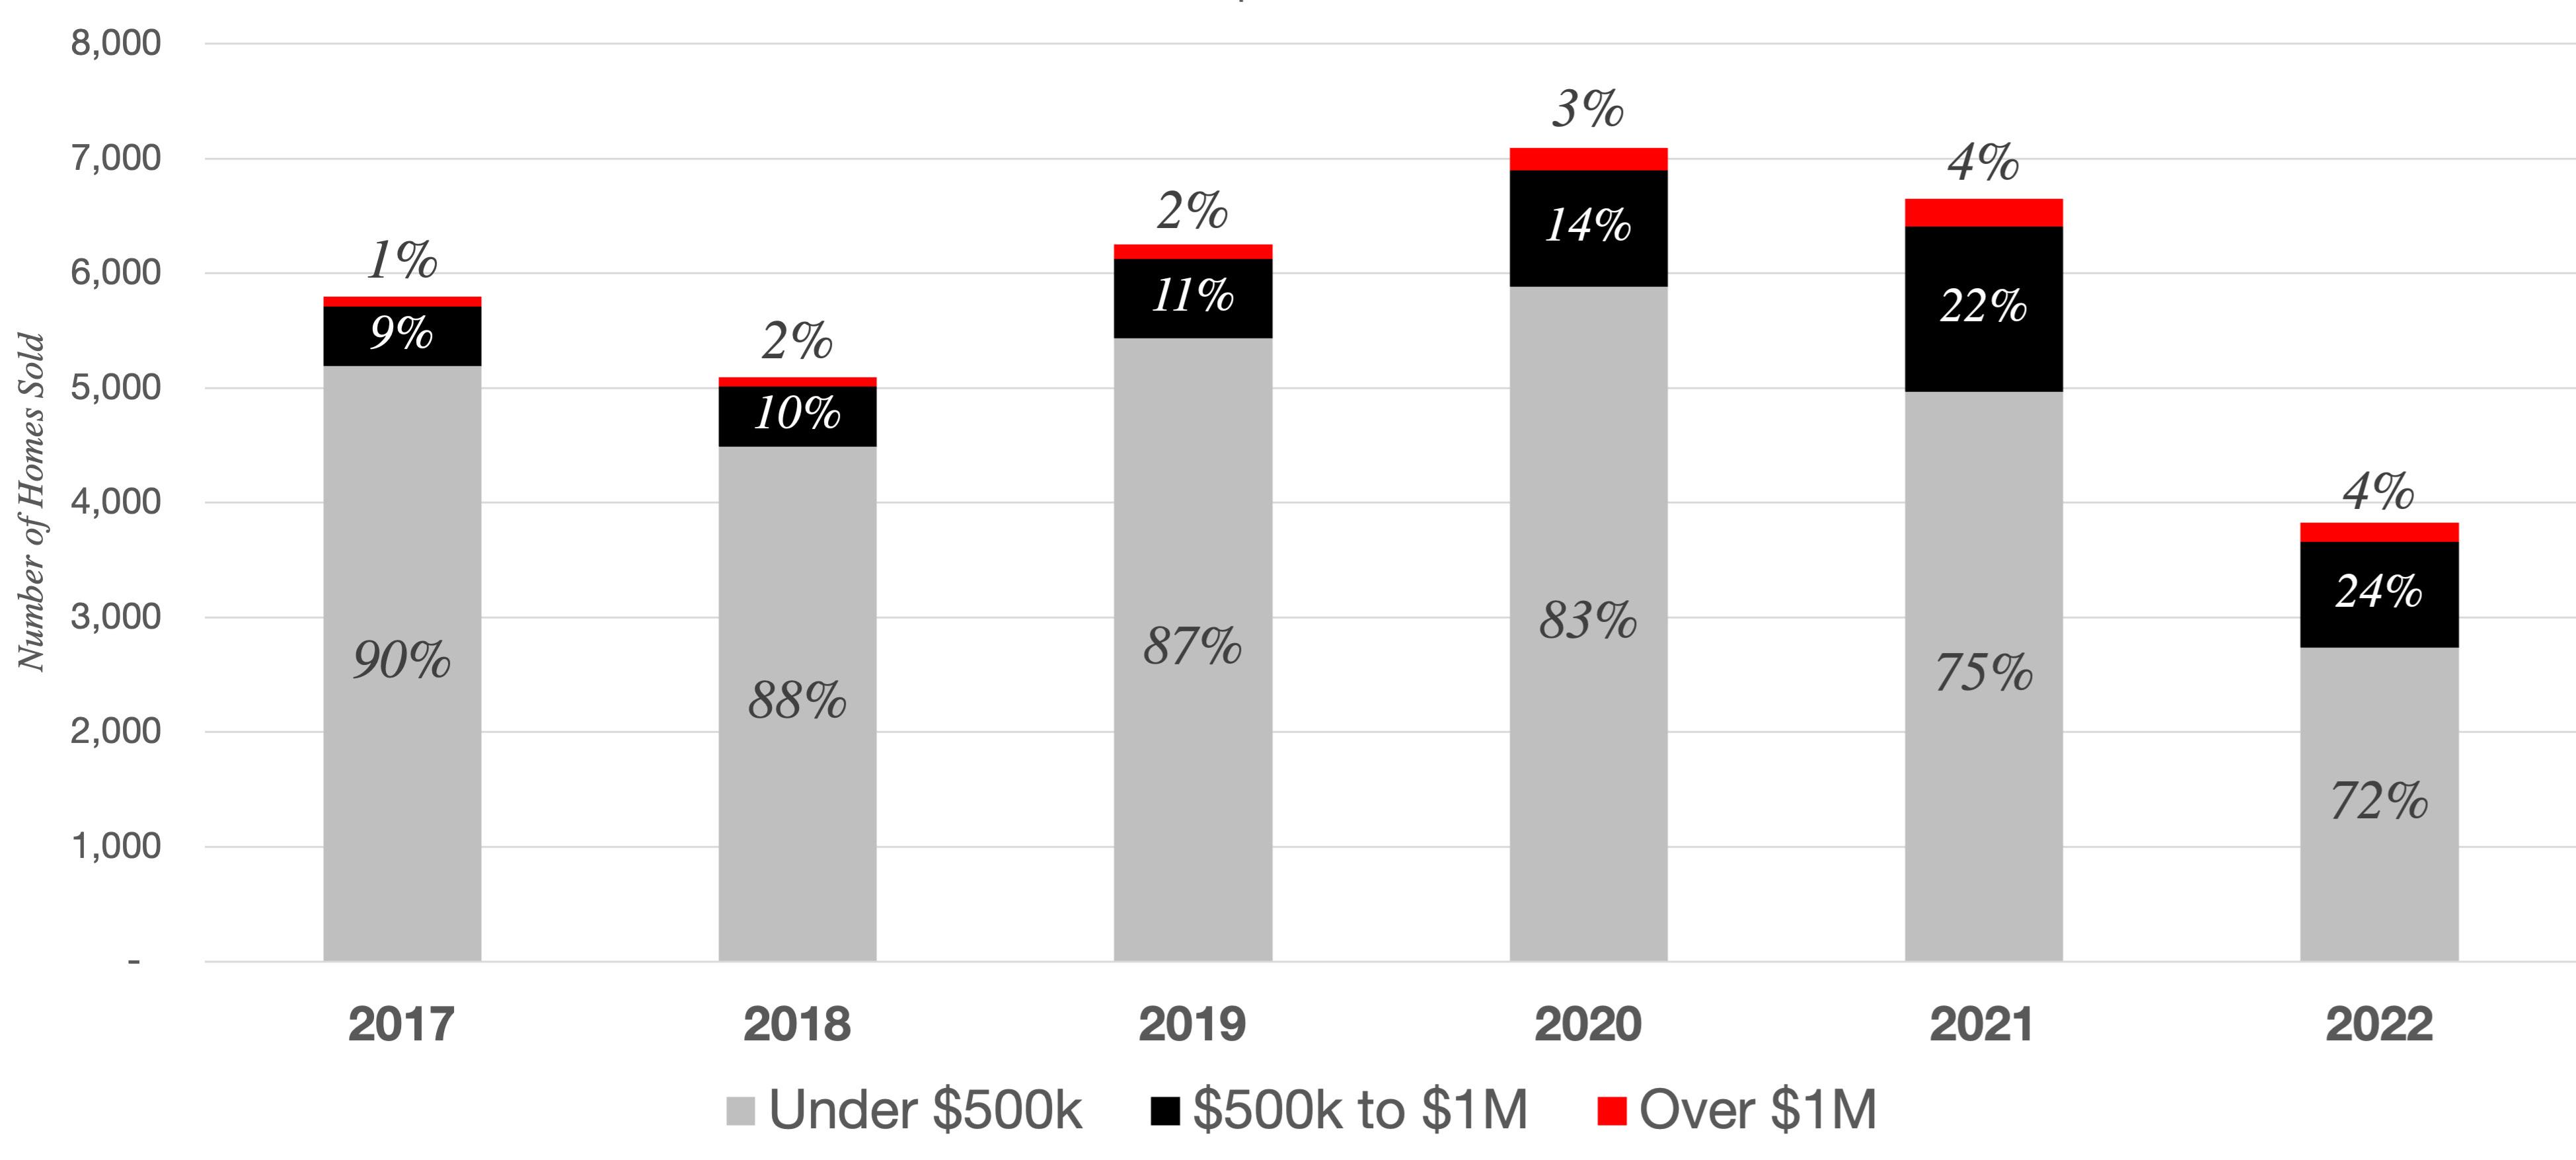
Most homes sold in the Greater Atlanta Area have been under $500,000, both historically and in 2022. However, the share of homes priced under $500,000 has declined in the last several years as prices overall have risen and more homes now fall into higher price brackets. In December 2022, only 72% of homes in the Greater Atlanta Area sold for less than $500,000 compared to 90% of homes in 2017.33
In December, there were 2,739 homes sold for less than $500,000 in the Greater Atlanta area, 47% fewer sales than the average for the previous five Decembers, and down 45% compared to December 2021. This was a greater decline in transaction volume than higher price points, reflecting fewer homes for sale in this price range and potentially that entry level buyers may be more price sensitive and experiencing greater constraints from the higher mortgage rate environment.
Move-Up ($500,000 to $1 million)
Move-up buyers—those purchasing homes priced between $500,000 and $1 million, often upgrading from an entry level home—have also been affected by increased interest rates. Closed sales in this price range were down 36% yearover-year in December 2022, a less dramatic decline in sales than entry level homes. This may be in part due to rising prices, which pushed more homes into this price range.
Luxury (Over $1 million)
Luxury buyers were the least responsive to the higher interest rate environment of the past year. There was a 30% decline in closed sales for homes over $1 million in December 2022 compared to December 2021, the smallest decline of any price bracket. Even with this slower pace of sales, about twice as many homes sold for over $1 million in December 2022 as in December 2017, largely due to the overall escalation of home prices in Atlanta over the past five years.
2022 END OF YEAR ATLANTA MARKET INTELLIGENCE 25 ENGEL & VÖLKERS www.evatlanta.com
Source: FMLS InfoSparks, Greater Atlanta Area, Closed Sales, All Home Types, December 2017 to 2022
Metro Atlanta Closed Sales by Price Point - December 2017 to 2022
Declining share of home sales under $500,000
Rising share of home sales over $500,000 (2.8x since 2017)
Can Atlantans afford current home prices?
Although Atlanta remains more affordable than many major cities, continued home price growth and rising mortgage rates have led to an increased cost of homeownership that has outpaced income growth in the past few years, making it more difficult for some Atlantans to afford to buy a home and leading some buyers to consider a wider range of potential homes that fit their budgets.
Decreased affordability leads to a smaller pool of potential buyers and therefore fewer total transactions. The average sale price for a home in Metro Atlanta increased by 44% between December 2019
and December 2022.34 The typical monthly payment for the average home increased even more* due to higher interest rates. Meanwhile, the monthly take home pay for the median household increased by 11% from 2019 to 2021 (2022 data is not yet available).35
In December 2017, the monthly payment for the average priced home in the Atlanta area cost about 39% of the net monthly income for a family earning the median household income. By December 2022, a typical monthly mortgage payment for the average priced home reached 59% of the median household’s monthly budget. This increased cost has pushed some would-be buyers to wait to buy a home.
There would need to be a change in dynamics for a greater share of
Atlantans to comfortably afford home ownership— and for the number of home sales to rise signficantly— such as a reduction in mortgage interest rates, more affordable home prices, or an increase in income.
For those who are able to purchase a home, some may choose to lower their target price range to account for a higher interest rate. To meet their financial goals, some buyers today are expanding their searches to different types of homes—such as a smaller home, a townhome, or a condominium— or considering a wider range of neighborhoods, allowing them to find homes that meet their lifestyle goals while fitting their budget. Others are taking advantage of mortgage rate buydown programs to lower their initial payments, with plans to refinance at a lower rate.
* Assumptions: Annual median household income from U.S. Census American Community Survey estimates as net monthly household income (based on the ADP Gross to Net Calculator for a Georgia resident); FMLS InfoSparks average sale price (all home types) for the Greater Atlanta Area in December of each year; Average 30-year fixed rate mortgage interest rate from Freddie Mac Primary Mortgage Market Survey for the given month.
Metro Atlanta Key Housing Affordability Statistics
a) U.S. Census American Community Survey, Atlanta-Sandy Springs-Roswell MSA, 2017 to 2021
b) 2022 Median Household Income had not yet been published at t he time of this report; 2021 data shown for reference
c) Net monthly income estimated using the ADP Gross to Net Calculator for a Georgia resident
d) FMLS InfoSparks average sale price (all home types) for the Greater Atlanta Area in December of each year
e) Freddie Mac Primary Mortgage Market Survey, average of weekly average rates for December of each year
f) Assumes a 20 percent down payment and no PMI; includes estimated property taxes and insurance, but not HOA dues
2022 END OF YEAR ATLANTA MARKET INTELLIGENCE 26 ENGEL & VÖLKERS www.evatlanta.com
2022 2021 2020 2019 2018 2017 Median Household Income (Gross Annual) a $77,589 b $77,589 $71,193 $71,742 $69,464 $65,381 Estimated Median Household Income (Net Monthly) c $4,798 b $4,798 $4,447 $4,313 $4,170 $3,773 Average Sale Price – December d $469,890 $442,993 $375,045 $335,948 $313,268 $297,631 Average 30-year Fixed Rate – December e 6.36% 3.10% 2.68% 3.72% 4.64% 3.95% Estimated Monthly Payment (Assuming 20% Down) f $2,849 $1,995 $1,632 $1,622 $1,651 $1,476 Monthly Mortgage Payment for Average Sale Price Home with Average Interest Rate as Percentage of Net Monthly Income for Median Household 59% b 42% 37% 38% 40% 39%
Growth & Migration
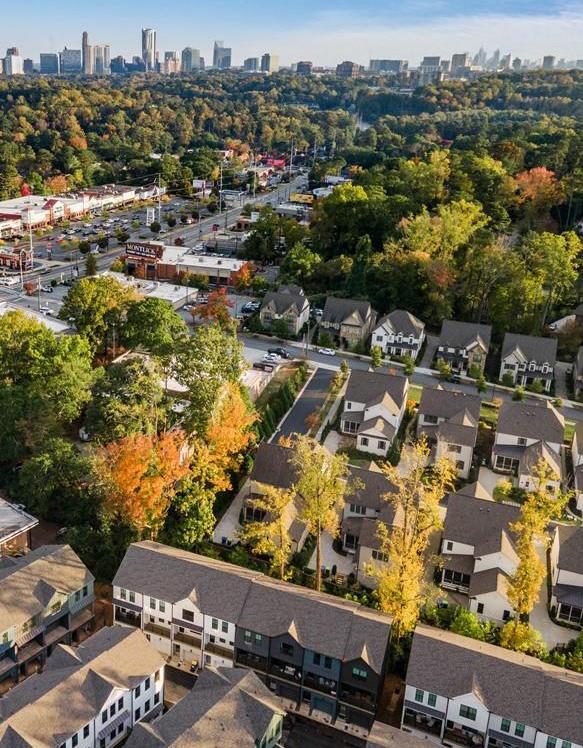
Atlanta continues to hold its position as the economic powerhouse of the Southeast, attracting new companies and residents with its culture, climate, and relative affordability. Metro Atlanta grew by 64,940 people in the past year, bringing the 11-county area to 5.1 million residents (+1.3%). About 10% of metro area residents live in the City of Atlanta (507,015 people).36
Each of the 11 counties grew this year, with the greatest number of new residents in Gwinnett (13,460), Fulton (11,200), Cobb (6,900), and Cherokee (6,890) Counties. As a percent of its total population, the northern edge counties saw the greatest rates of population growth, with Forsyth County growing by 2.6% and Cherokee County growing by 2.5% year-over-year.37
Atlanta’s strong job market and growing population are key reasons it is expected to be the #1 top U.S. real estate market to watch in 2023.38 In addition to growth in staple industries like life sciences and manufacturing, Georgia’s growing film industry and a number of major West Coast companies—including Apple, Microsoft, and Visa—opening
large offices in Atlanta have also brought new residents to the metro. The number of jobs in Metro Atlanta was up 6.7% year-over-year, making it #2 of all large metros for job growth in 2022. The unemployment rate was just 2.7% in November 2022, below the national average of 3.4%.39 Atlanta workers are more likely to be working from home, with 24% telecommuting, three times as many teleworkers as there were prepandemic.40
This job growth has resulted in population growth to fuel demand for housing. Metro Atlanta was the #5 moving destination in the country in 2021.41 People are choosing to move to our region from all over the country and the world. In the U.S., the metro areas around New York City, Miami/Fort Lauderdale, Chicago, Washington, D.C., Los Angeles, and Orlando were among the top feeder markets for people relocating to Atlanta in recent years. Fellow Georgians are also migrating to Atlanta from places like Athens, Gainesville, and Savannah.42
2022 END OF YEAR ATLANTA MARKET INTELLIGENCE 27 ENGEL & VÖLKERS www.evatlanta.com
Metro Atlanta Population (2022)
City of Atlanta Population (2022) 507,015 New Metro Atlanta Residents (2022) 64,940 Metro Atlanta Job Growth (2022) +6.7% 2nd Highest Among Large U.S. Metros Metro Atlanta Median Household Income (2021) $77,589 Metro Atlanta Median Home Price $400,000 (Q3 & Q4 2022) Metro Atlanta Average Home Price $477,701 (Q3 & Q4 2022) Zillow Observed Rent Index $2,002 (+53.3% in 5 years)
5,091,644
2022 End-of-Year Market Intelligence Report Market Snapshot Take an inside look at market trends by home type and price point across Metro Atlanta, including single-family homes, townhomes, and condominiums.
Market Snapshot
Across Metro Atlanta, home sales slowed in the second half of 2022, reflecting normal seasonal trends at an accelerated pace due to higher interest rates and uncertain economic conditions. The number of homes sold was down about 30% marketwide compared to Q3 and Q4 2021, and down 22.7% compared to the same period in 2019, a more normal year.
Although new listings declined consistently, the total number of listings went up as homes stayed on the market longer than they did in the hot early 2022 market. went up as homes stayed on the market longer than they did in the hot early 2022 market. Homes averaged
25 days on market in Q3 and Q4 2022. More affordable homes were typically scooped up faster than the more expensive inventory, and townhomes and condominiums sold faster than single-family homes. Inventory remained low at just 2.1 months of supply. This limited
Metro Atlanta Market Summary - All Home Types (Q3 & Q4 2022)
inventory helped to stabilize home prices despite a decline in demand. The average sale price was up 9.9 % year-over-year, and up 44.8% from the same period in 2019, with an average increase of $147,969 since 2019 (including $18,593 last year).
Source: FMLS InfoSparks, Greater Atlanta Area/City of Atlanta/ITP, All home types, All price points, Rolling 6-months as of December 2022 (year-over-year change compared to rolling 6-months as of December 2021)
2022 END OF YEAR ATLANTA MARKET INTELLIGENCE 30 ENGEL & VÖLKERS www.evatlanta.com
Metro Atlanta
Atlanta ITP closed Sales 29,963 q -29.5% 5,036 q -35.4% 5,773 q -34.9% Pending Sales 26,299 q -32.8% 4,460 q -37.2% 5,052 q -37.3% active Listings 12,429 p +43.7% 2,508 p +4.3% 2,854 p +4.6% New Listings 40,193 q -12.6% 7,708 q -16.3% 8,801 q -15.3% Median Sale Price $400,000 p +9.6% $410,000 p +8.8% $438,250 p +9.6% average Sale Price $477,701 p +9.9% $546,332 p +8.0% $570,771 p +8.6% average Price Per Square Foot $205 p +10.8% $274 p +8.3% $282 p +8.9% average Sale Price to Original List Price Ratio 97.5% q -3.3% 97.1% q -1.5% 97.2% q -1.2% Months of Inventory 2.1 p +75.0% 2.4 p +33.3% 2.3 p +27.8% average Days on Market 25 p +31.6% 26 q -3.7% 26 q -3.7%
City of
q Down YOY p Up YOY
$400,000 median sale price
$477,701 average sale price

2.1 months of inventory
Single-Family Homes: 2.2 months
Townhomes: 1.9 months
Condominiums: 1.7 months

(Q3
Average Price Per Square Foot
& Q4 2022, All Home Types)
(Q3 & Q4 2022, Metro Atlanta, All Home Types)
(Q3
& Q4 2022, Metro Atlanta, All Home Types)
+9.6% year-over-year +9.9% year-over-year
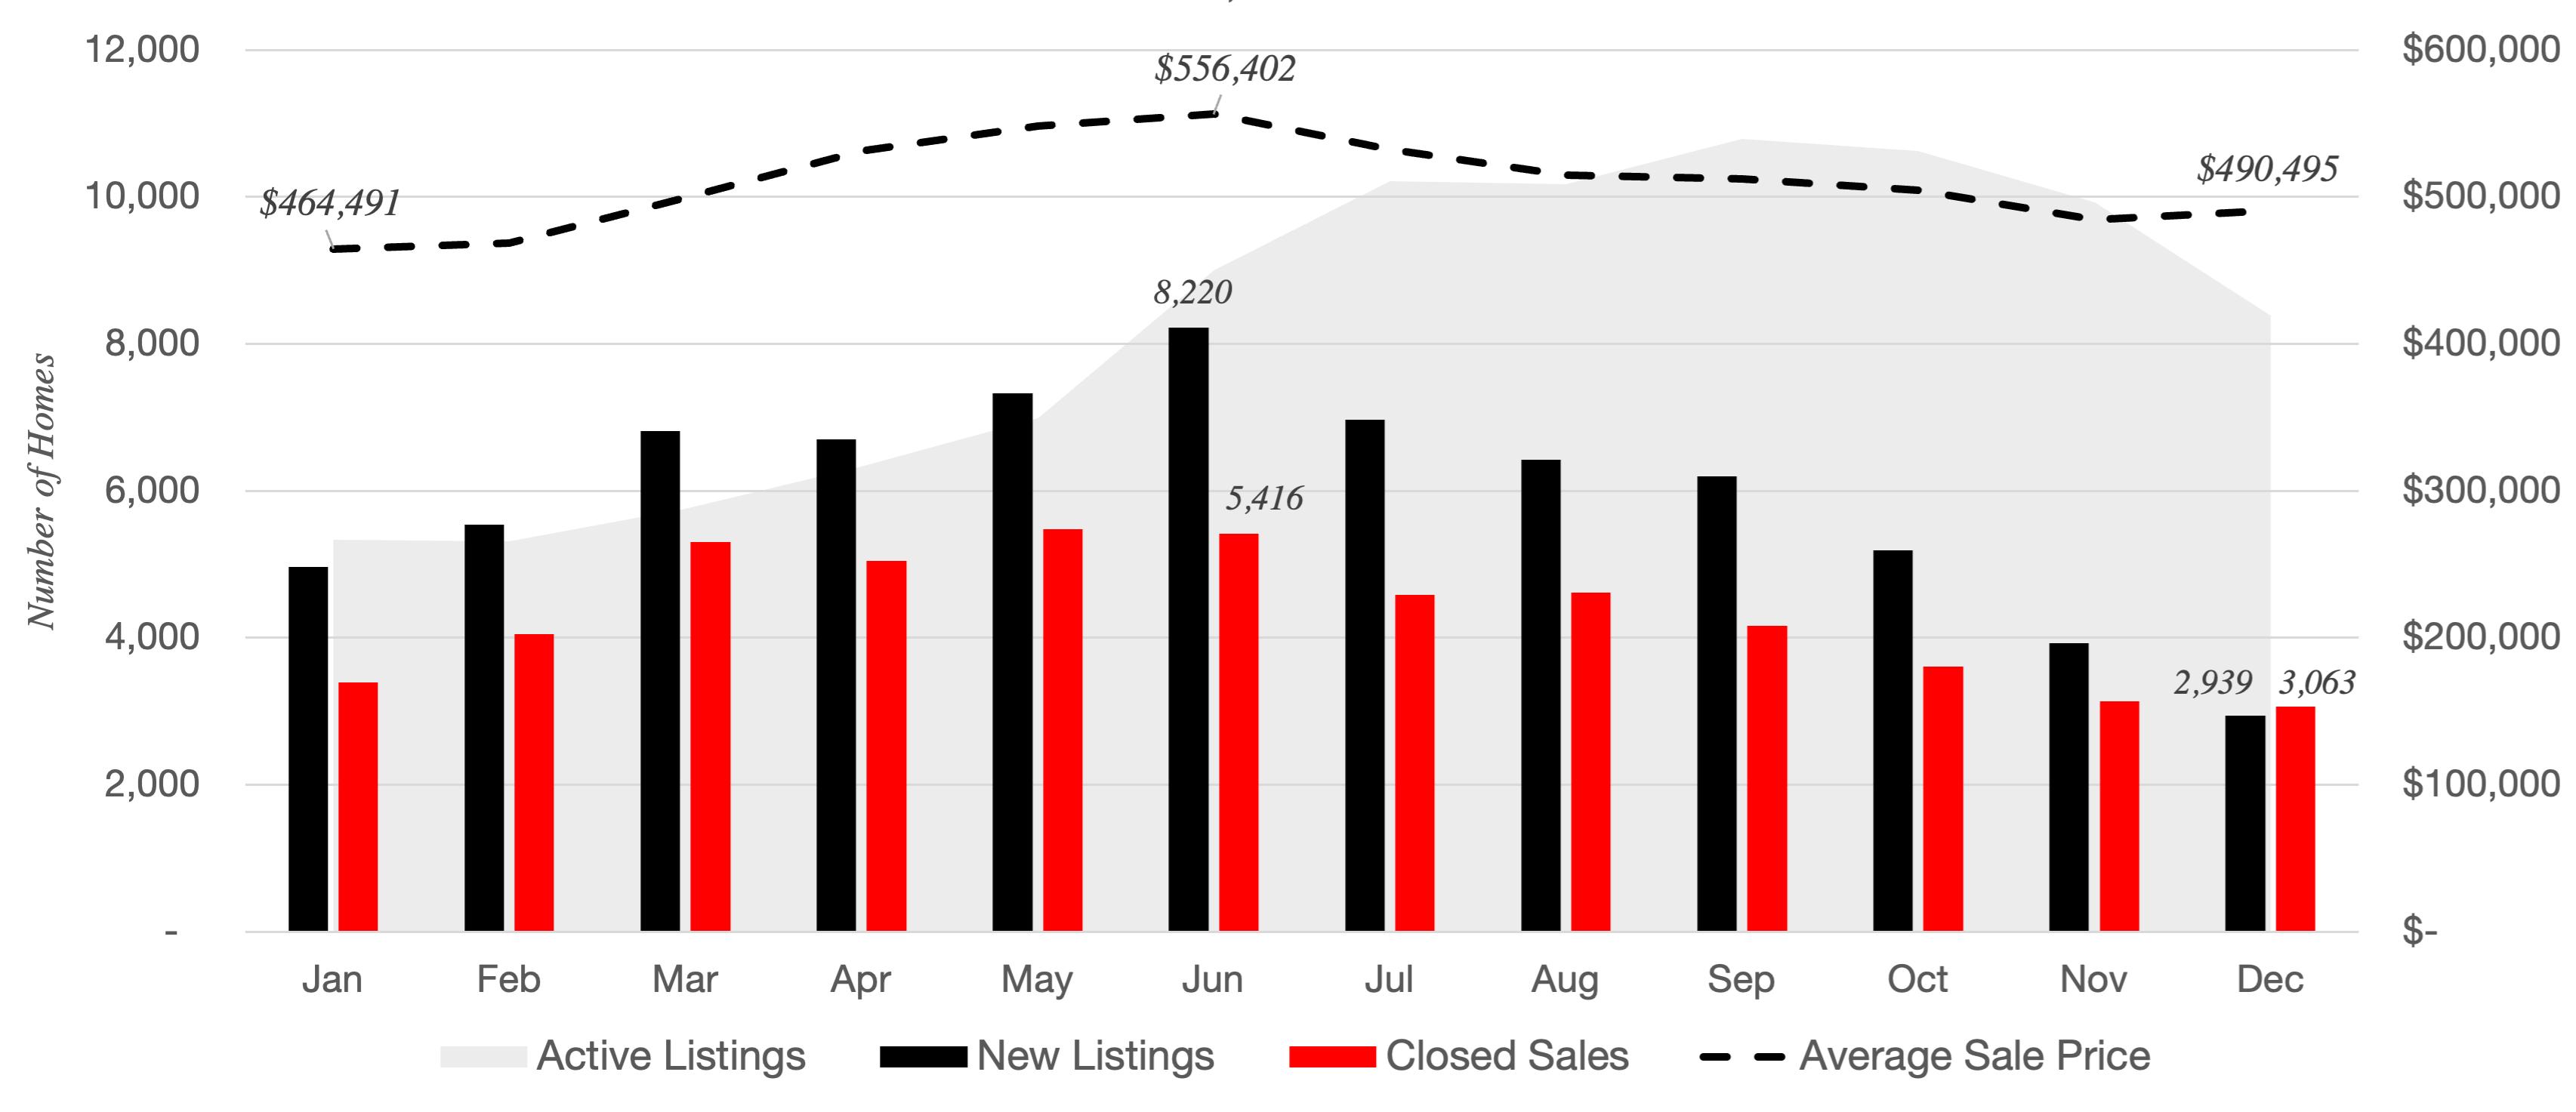
Supply Dynamics by Home Type
Metro Atlanta 2022 Supply Dynamics - All Home Types
Source: FMLS InfoSparks, Greater Atlanta Area, All Home Types, January to December 2022
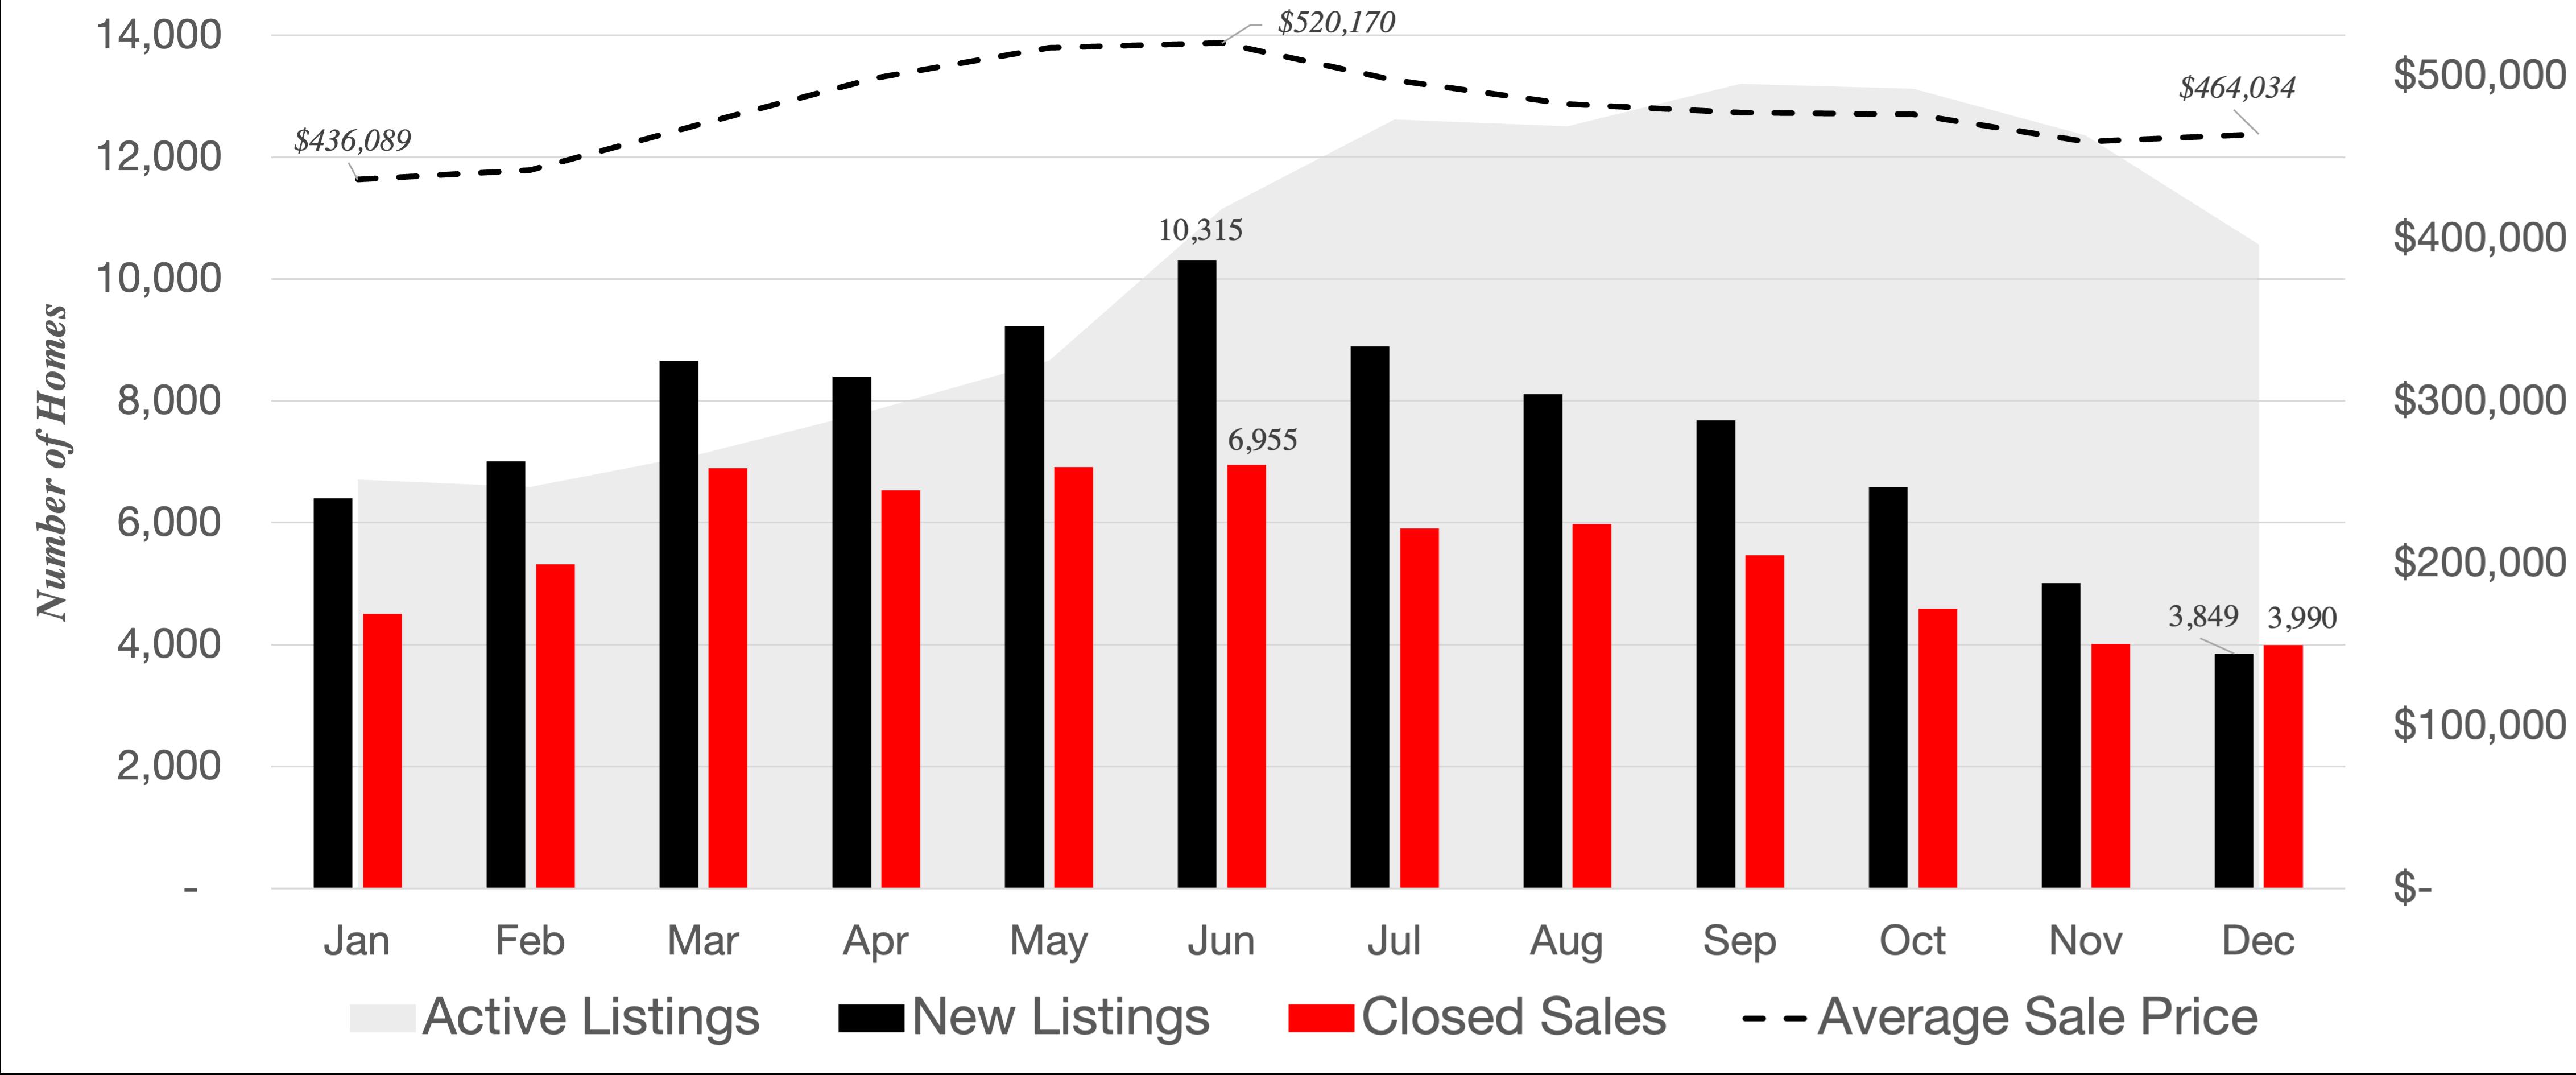
Metro Atlanta 2022 Supply Dynamics - Single-Family Homes
Source: FMLS InfoSparks, Greater Atlanta Area, Single-Family Homes, January to December 2022
2022 END OF YEAR ATLANTA MARKET INTELLIGENCE 32 ENGEL & VÖLKERS www.evatlanta.com
Average Sale Price Average Sale Price
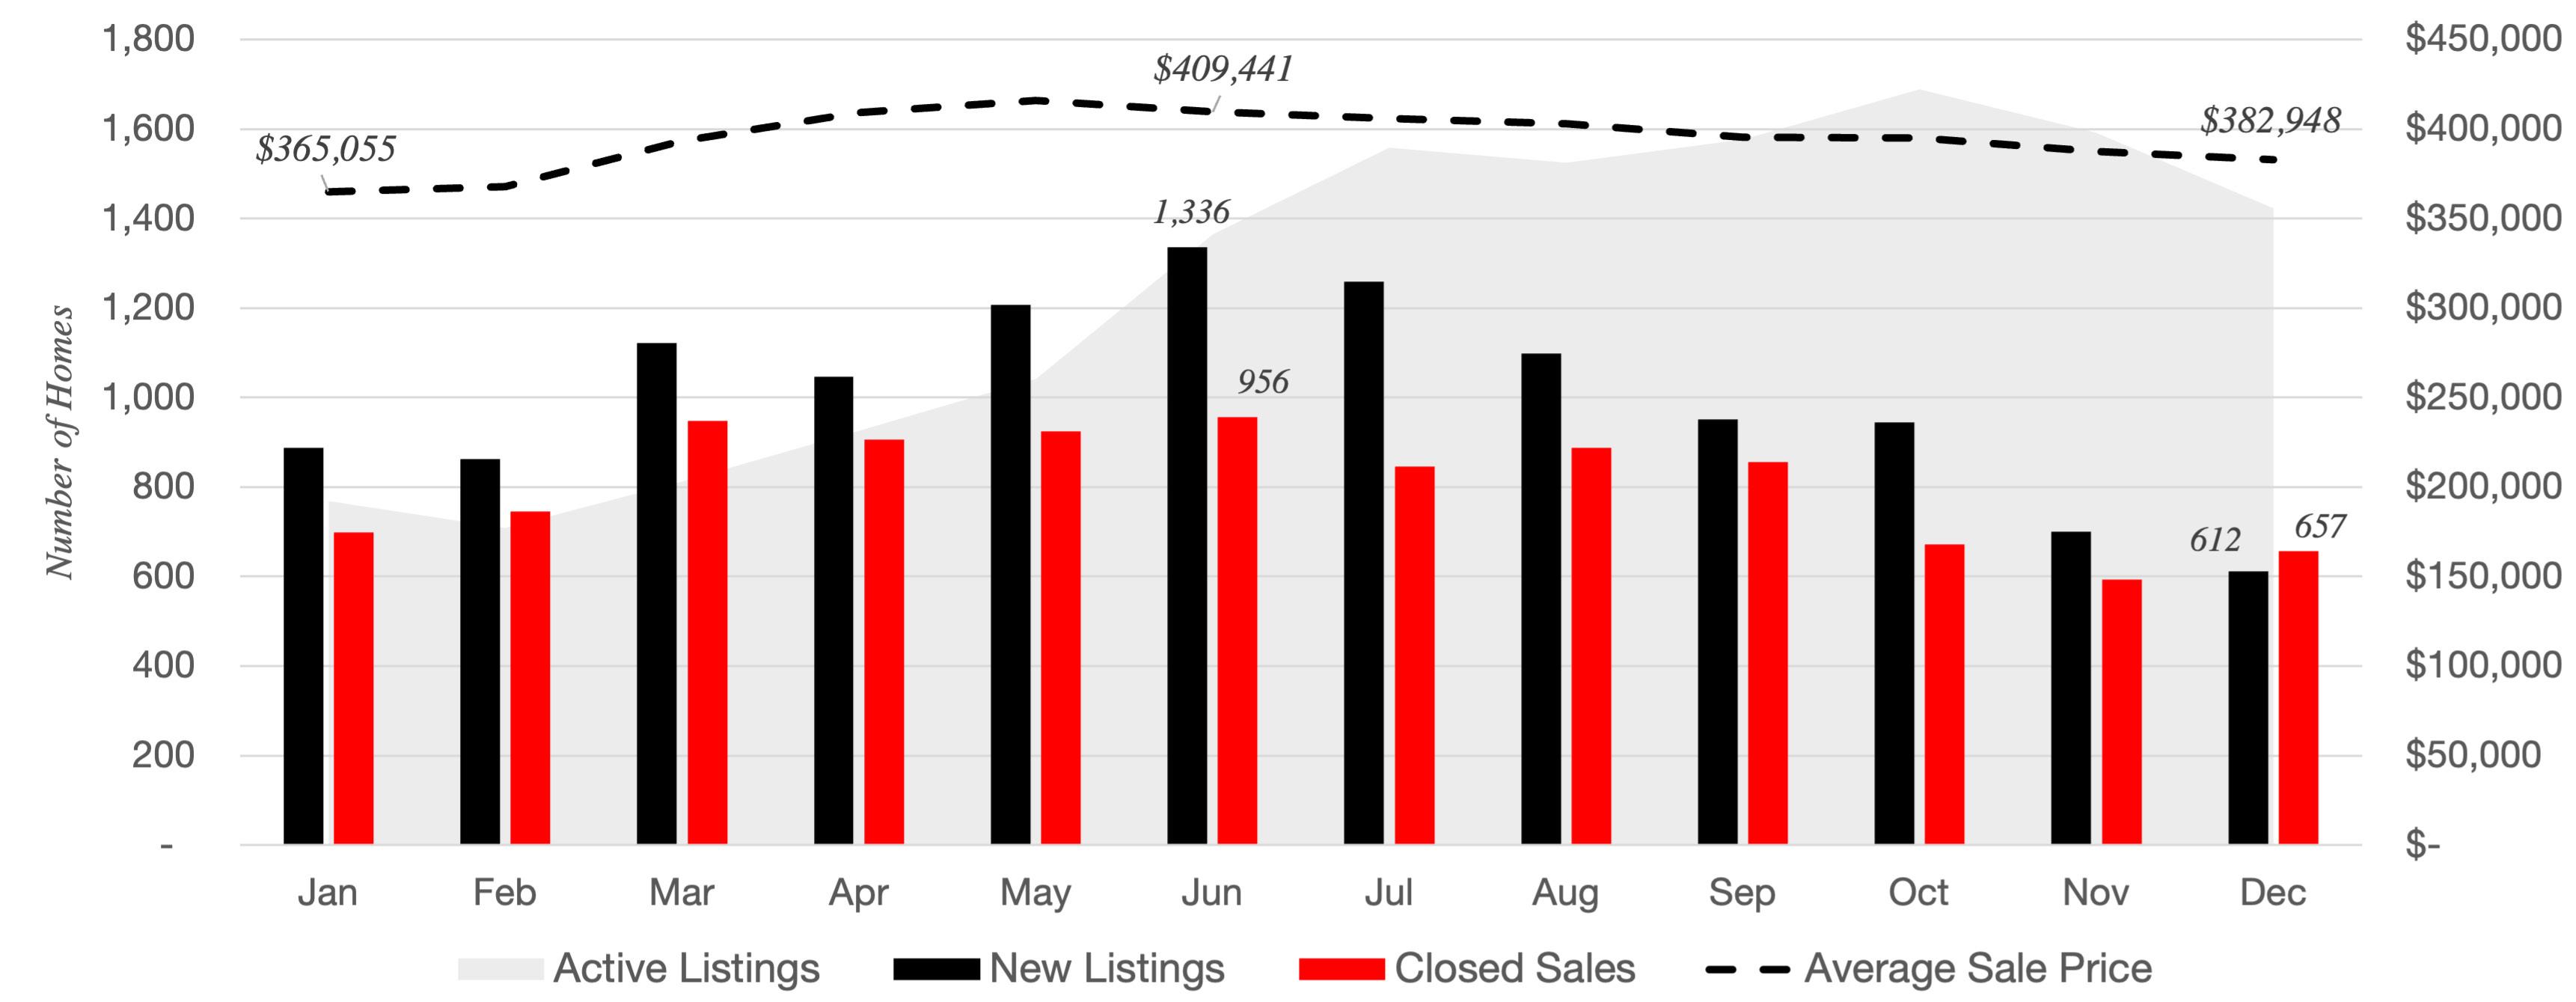
Metro Atlanta 2022 Supply Dynamics - Townhomes
Source: FMLS InfoSparks, Greater Atlanta Area, Townhomes, January to December 2022
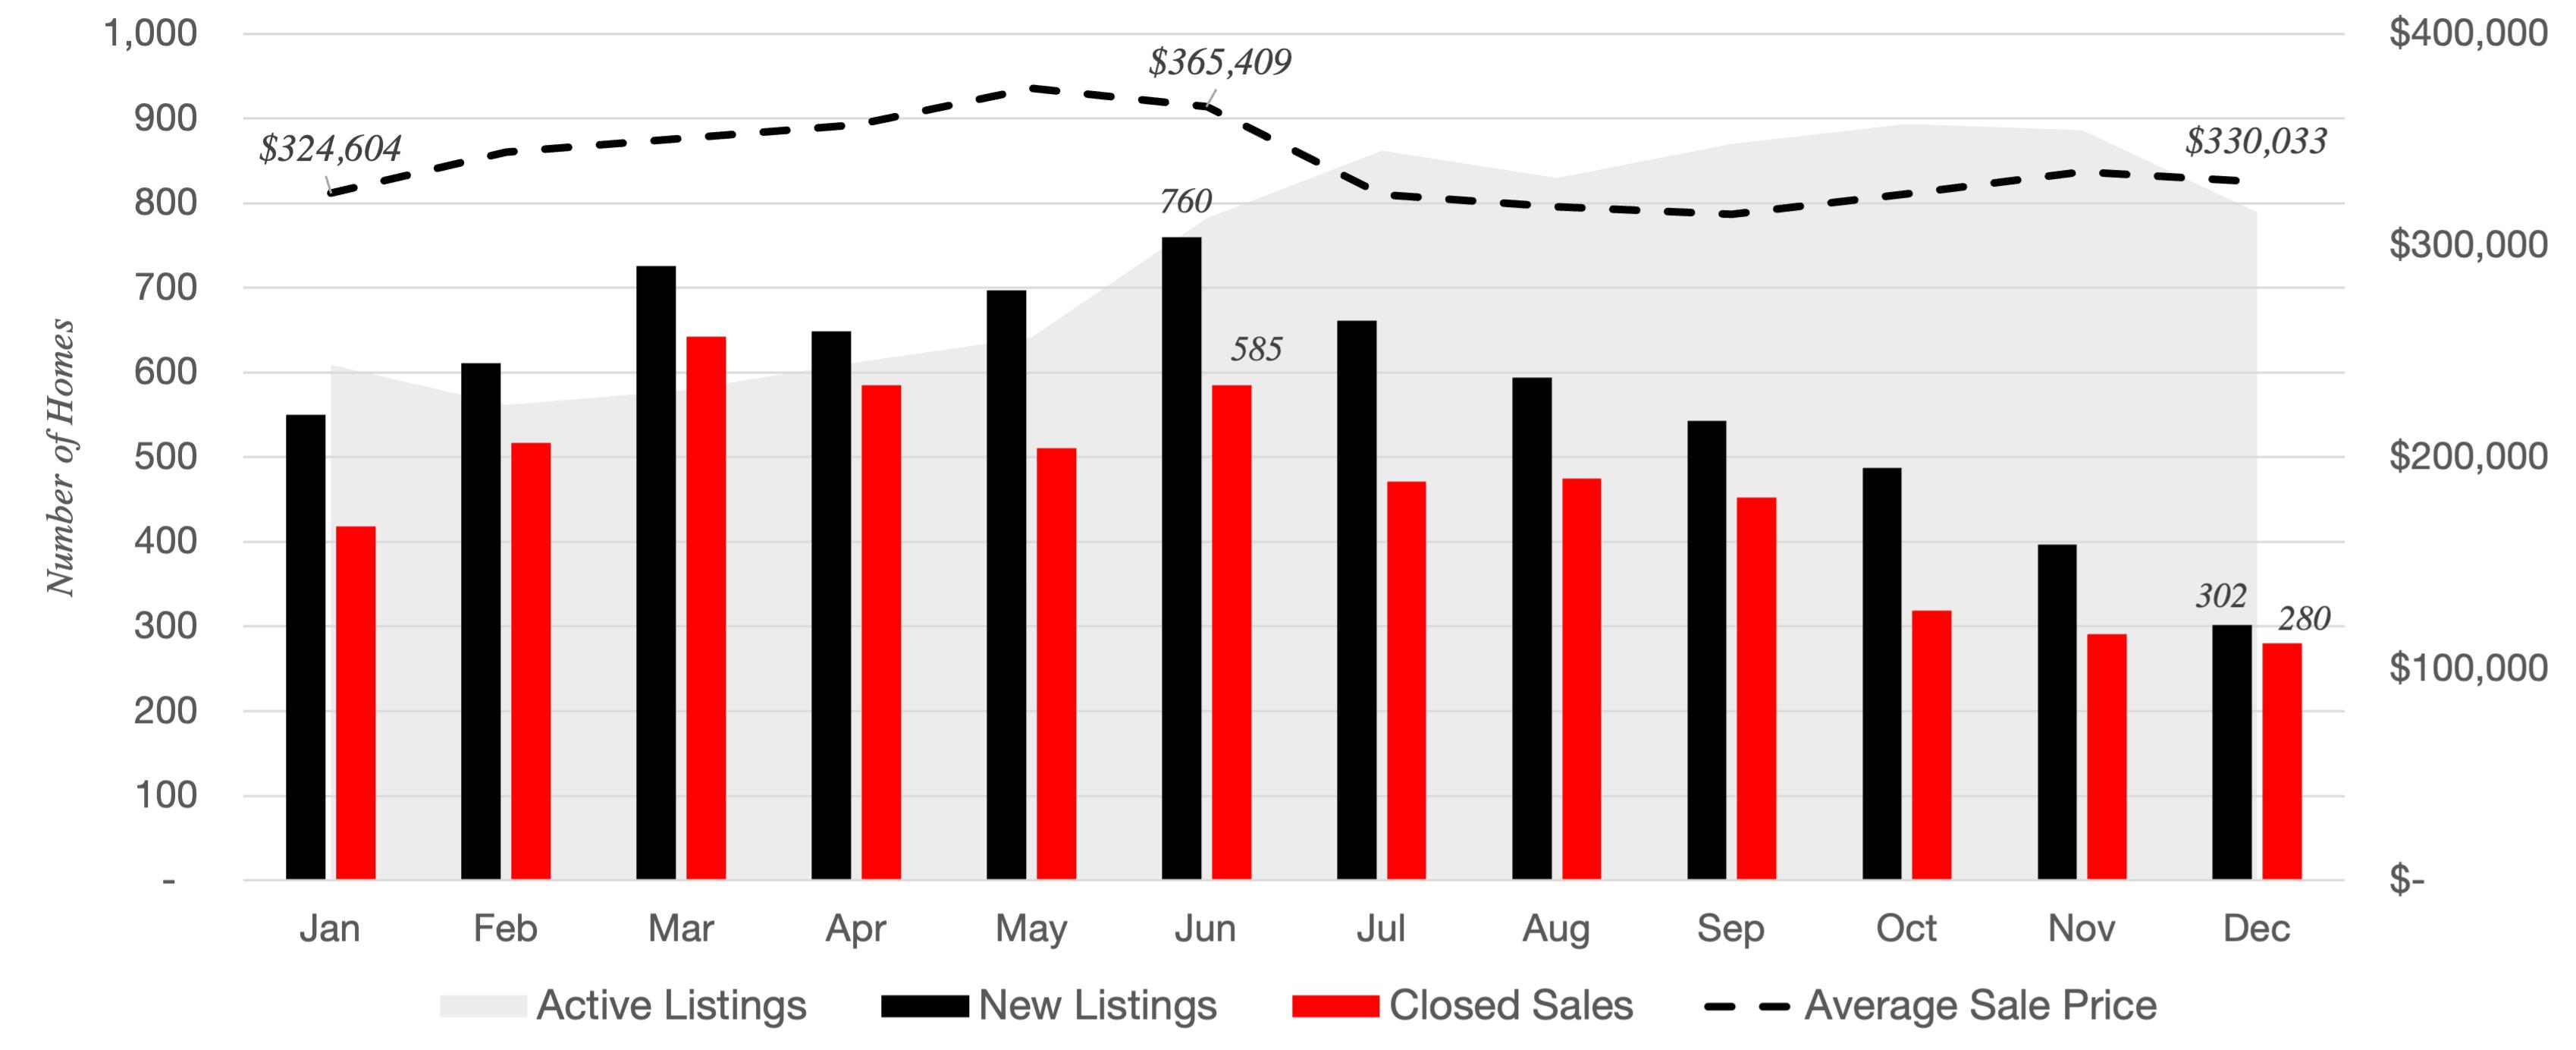
Metro Atlanta 2022 Supply Dynamics - Condominiums
Source: FMLS InfoSparks, Greater Atlanta Area, Condominiums, January to December 2022
2022 END OF YEAR ATLANTA MARKET INTELLIGENCE 33 ENGEL & VÖLKERS www.evatlanta.com
Average Sale Price Average Sale Price
Metro Atlanta Market Summary by Price Point - All Home Types (Q3 & Q4 2022)
Source: FMLS InfoSparks, Greater Atlanta Area, All home types, Rolling 6-months as of December 2022 (year-over-year change com
pared to rolling 6-months as of December 2021)
Metro Atlanta Market Summary by Price Point - Single-Family Homes (Q3 & Q4 2022)
Source: FMLS InfoSparks, Greater Atlanta Area, Detached Single-family homes, Rolling 6-months as of December 2022 (year-over-year change compared to rolling 6-months as of December 2021)
2022 END OF YEAR ATLANTA MARKET INTELLIGENCE 34 ENGEL & VÖLKERS www.evatlanta.com
# Closed Sales % of All Closed Sales # Active Listings % of All Active Listings Months of Inventory Average Days on Market < $300k 6,938 q -47.2% 23% 2,025 q -3.9% 16% s 1.4 s 24 $300k - $499k 13,653 q -27.9% 46% 5,226 p +70.3% 42% s 2.0 s 24 $500k - $699k 5,416 q -13.9% 18% 2,355 p +74.4% 19% r 2.4 w 25 $799k - $999k 2,520 q -3.6% 8% 1,270 p +61.4% 10% r 2.7 w 25 $1M+ 1,401 q-8.8% 5% 1,173 p +38.8% 9% r 4.5 r 32 Total 29,928 q -29.6% 100% 12,412 p +43.5% 100% w 2.1 w 25
-
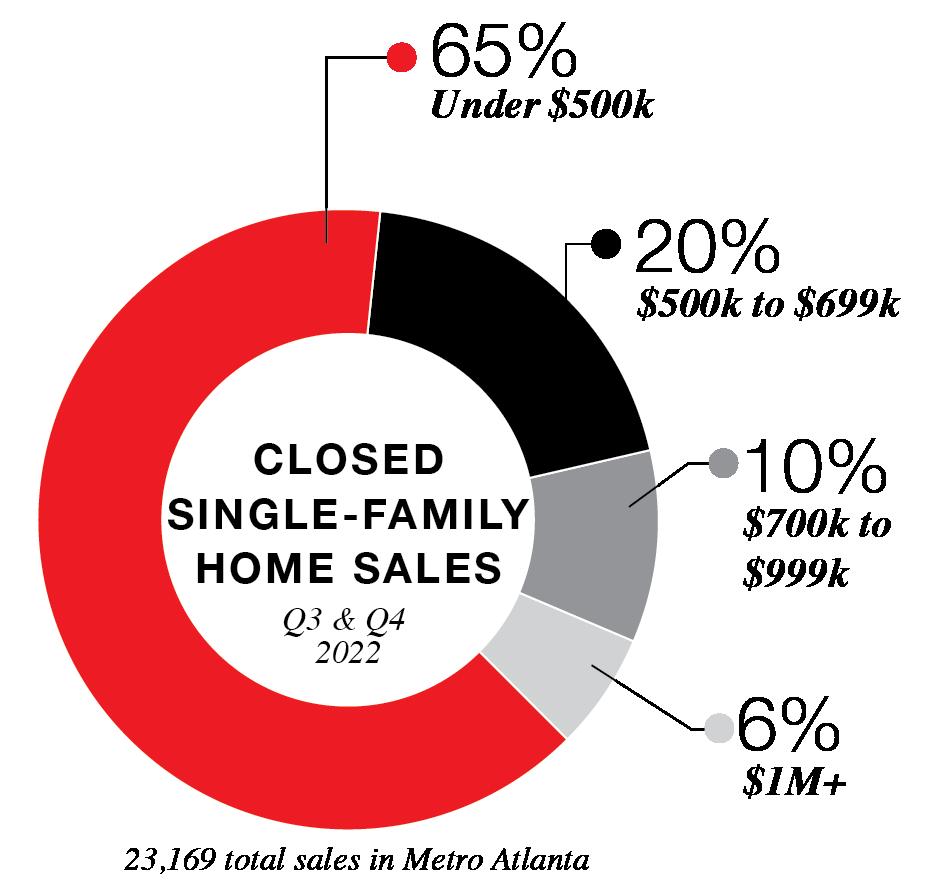
# Closed Sales % of All Closed SFH Sales # Active Listings % of All Active SFH Listings Months of Inventory Average Days on Market < $300k 4,079 q -50.5% 18% 1,329 p +6.0% 13% s 1.6 r 28 $300k - $499k 10,916 q -29.6% 47% 4,318 p +77.3% 43% s 2.0 w 25 $500k - $699k 4,593 q -14.4% 20% 1,939 p +84.0% 19% r 2.3 s 24 $799k - $999k 2,239 q -4.7% 10% 1,070 p +70.9% 11% r 2.6 s 24 $1M+ 1,312 q -8.6% 6% 1,051 p +43.0% 11% r 4.4 r 31 Total 23,169 q -29.6% 100% 9,998 p +52.9% 100% r 2.2 r 26
q Down YOY p Up YOY s Below Market Average r Above Market Average w Equal to Market Average
Metro Atlanta Market Summary by Price Point - Townhomes (Q3 & Q4 2022)
Source: FMLS InfoSparks, Greater Atlanta Area, Townhomes, Rolling 6-months as of December 2022 (year-over-year change compared to rolling 6-months as of December 2021)
Metro Atlanta Market Summary by Price Point - Condominiums (Q3 & Q4 2022)
Source: FMLS InfoSparks, Greater Atlanta Area, Condominiums, Rolling 6-months as of December 2022 (year-over-year change compared to rolling 6-months as of December 2021)
2022 END OF YEAR ATLANTA MARKET INTELLIGENCE 35 ENGEL & VÖLKERS www.evatlanta.com # Closed Sales % of All Closed TH Sales # Active Listings % of All Active TH Listings Months of Inventory Average Days on Market < $300k 1,548 q -39.2% 34% 365 q -7.8% 23% s 1.2 s 18 $300k - $499k 1,981 q -21.8% 44% 638 p +73.4% 41% s 1.8 s 22 $500k - $699k 689 q -7.6% 15% 323 p +68.2% 21% r 2.7 w 25 $799k - $999k 230 p +14.4% 5% 141 p +50.0% 9% r 3.5 r 33 $1M+ 57 p +14.0% 1% 49 p +32.4% 3% r 5.0 r 44 Total 4,505 q -25.9% 100% 1,559 p +38.6% 100% s 1.9 s 22
# Closed Sales % of All Closed Condo Sales # Active Listings % of All Active Condo Listings Months of Inventory Average Days on Market < $300k 1,311 q -44.3% 57% 331 q -27.9% 36% s 1.1 s 21 $300k - $499k 756 q -14.7% 33% 271 p +1.9% 32% s 1.8 s 21 $500k - $699k 134 q -27.2% 6% 94 q -8.7% 11% r 3.2 r 37 $799k - $999k 51 q -19.0% 2% 59 q -13.2% 7% r 4.2 r 36 $1M+ 32 q -38.5% 1% 74 p +1.4% 9% r 7.5 r 57 Total 2,284 q -35.5% 100% 854 q -13.6% 100% s 1.7 s 23
q Down YOY p Up YOY s Below Market Average r Above Market Average w Equal to Market Average
Single-Family Homes
In 2022, most homes sold in Metro Atlanta were detached single-family homes (77%). There were 51,855 single-family homes sold last year, the fewest of any 12-month period since 2015. Like the market overall, there were about 30% fewer singlefamily homes sold in the second half
of 2022 (23,169 homes) compared to the same period in 2021, a trend related to higher mortgage interest rates.
The average single-family home in Metro Atlanta sold for $509,136 in Q3 and Q4 2022, up 10% year-
Metro Atlanta Single-Family Home Summary (Q3 & Q4 2022)
over year. Since the same period in 2019, the average sale price was 49% ($167,570), resulting in significant equity for existing homeowners. While negotiation and some seller concessions became more common than early in the year, sellers continued to get close to
Source: FMLS InfoSparks, Greater Atlanta Area, Single-family homes, Rolling 6-months as of December 2022 (year-over-year change compared to rolling 6-months as of December 2021)
2022 END OF YEAR ATLANTA MARKET INTELLIGENCE 36 ENGEL & VÖLKERS www.evatlanta.com Metro Atlanta City of Atlanta ITP closed Sales 23,169 q -29.6% 2,716 q -34.0% 3,297 q -32.8% Pending Sales 20,319 q -32.6% 2,447 q -34.2% 2,921 q -34.2% active Listings 10,004 p +53.0% 1,528 p +18.7% 1,838 p +19.1% New Listings 31,1614 q -11.7% 4,615 q -10.8% 5,572 q -8.8% Median Sale Price $421,400 p +9.5% $490,000 p +7.8% $526,250 p +10.8% average Sale Price $509,136 p +10.0% $657,850 p +6.3% $682,681 p +7.3% average Sale Price to Original List Price Ratio 97.2% q -3.7% 96.2% q -2.3% 97.9% q -1.7% Months of Inventory 2.2 p +83.3% 2.7 p +50.0% 2.7 p +50.0% average Days on Market 26 p +44.4% 26 p +13.0% 26 p +8.3%
q Down YOY p Up YOY s Below SFH Market Average r Above SFH Market Average w Equal to SFH Market Average
their asking price in late 2022, with an average sale price to original list price of 97.2%.
The tight inventory of single-family homes for sale (2.2 months of inventory) is a key reason prices have continued to rise even as higher interest rates dampened demand.
Single-family home sales under $500,000 (-36.9%) were down more than higher priced homes in late 2022. This is in part because rising home prices overall pushed more homes into higher price brackets.
Source: FMLS InfoSparks, Greater Atlanta Area, Single-family homes, Rolling 6-months as of December 2022 (year-over-year change compared to rolling 6-months as of December 2021)
Source: FMLS InfoSparks, Greater Atlanta Area, Single-family homes, Rolling 6-months as of December 2022 (year-over-year change compared to rolling 6-months as of December 2021)
2022 END OF YEAR ATLANTA MARKET INTELLIGENCE 37 ENGEL & VÖLKERS www.evatlanta.com Less than $499,999 $500,000 to $699,999 $700,000 to $1 million Over $1 million closed Sales 14,978 q -36.9% 4,590 q -14.4% 2,237 q -4.8% 1,311 q -8.6% Pending Sales 13,177 q -40.2% 4,133 q -13.4% 1,919 q -4.3% 1,090 q -16.9% active Listings 5,651 p +53.1% 1,941 p +84.2% 1,072 p +71.2% 1,051 p +43.0% New Listings 19,452 q -21.7% 6,211 p +12.9% 2,973 p +19.7% 2,173 p +20.5% average Sale Price to Original List Price Ratio 96.7% q -4.5% 98.1% q -2.7% 98.4% q -1.5% 97.4% u 0.0% Months of Inventory 1.9 p +111.1% 2.3 p +64.3% 2.6 p +44.4% 4.4 p +41.9% average Days on Market 26 p +62.5% 24 p +33.3% 24 p +9.1% 31 q -8.8% 1-bedroom 2-bedroom 3-bedroom 4-bedroom + Median Sale Price $186,000 q -25.4% $295,000 p +11.3% $339,000 p +11.1% $499,900 p +12.3% average Sale Price $233,761 q -26.3% $321,689 p +8.7% $368,869 p +10.7% $605,113 p +10.8% closed Sales 33 q -31.3% 856 q -21.7% 8,360 q -27.6% 13,920 q -31.1% Pending Sales 36 q -18.2% 765 q -26.0% 7,592 q -29.5% 11,977 q -34.5% active Listings 187 p +83.3% 385 p +18.8% 3,361 p +50.4% 6,077 p +56.7% New Listings 512 p +66.2% 1,202 q -12.7% 11,245 q -13.3% 18,684 q -11.7% average Sale Price to Original List Price Ratio 91.7% q -2.7% 96.1% q -2.5% 96.8% q -4.3% 97.4% q -3.5% Months of Inventory 28.0 p +85.4% 2.4 p +26.3% 2.1 p +75.0% 2.2 p +83.3% average Days on Market 31 q -11.4% 25 p +13.6% 26 p +62.5% 26 p +44.4%
Metro Atlanta Single-Family Home Summary by Price Range (Q3 & Q4 2022)
Metro Atlanta Single-Family Home Summary by Number of Bedrooms (Q3 & Q4 2022)
q Down YOY p Up YOY s Below SFH Market Average r Above SFH Market Average w Equal to SFH Market Average
Single-Family Homes - Inside the Perimeter
Homebuyers looking for a singlefamily home ITP paid an average of $682,681 in the second half of 2022, up 7.3% from the same period in 2021. Intown living commanded a substantial premium compared to more suburban locations, with an average price $173,545 (34%) higher for ITP homes compared to the metro average.

Although prices continued to grow year-over-year, the market was quieter in the second half of 2022, with 32.6% fewer single-family homes sold ITP compared to the same period last year. Homes priced between $700,000 and $1 million kept the closest pace to 2021 (-4.8% fewer sales), likely because these more affluent buyers may be less sensitive to interest rates, more homes were priced in this range, and buyers previously looking at homes priced over $1 million may have shifted their search to this range.
Continued price growth has reduced the number of single-family homes
available at an entry level price point in Metro Atlanta. In the second half of 2022, just 65% of single-family homes sold for less than $500,000. This is down from the same period in 2021, when 72% of homes sold for less than $500,000. In 2019, it was 86%. This trend was even more pronounced ITP. In the second half of 2022, less than half of all singlefamily homes (47%) ITP sold for less than $500,000.
Fewer homes have been listed in Metro Atlanta each month since summer 2022, reflecting seasonal trends and rising interest rates that have made current homeowners hesitant to move. In the ITP singlefamily home market, this trend held up for homes under $500,000. There were 14% fewer new listings in the second half of 2022 compared to the same period in 2021, a decline that outpaced the dwindling share of homes sold for less than $500,000. Homeowners in this price range may be more sensitive to rising interest rates, less willing to move, or may be listing their homes at higher prices. At higher price points, the number of listings rose compared to the same period in 2021, with 20% to 22% more homes for sale in 2022.
Key Stats ITP Single-Family Homes
(Q3 & Q4 2022)
• $682,681 average sale price (+7.3% YOY)
• 14% of all single-family home sales were ITP
• 18% of all single-family home listings were ITP
• ITP homes sold at the same pace as the metro average (26 days on market)
• Homes sold for 97.9% of the original list price on average
Inventory levels remained relatively low at 2.1 months of supply for homes between $500,000 and $999,999 and 3.3 months of supply for homes over $1 million.
2022 END OF YEAR ATLANTA MARKET INTELLIGENCE 38 ENGEL & VÖLKERS www.evatlanta.com
Q3 + Q4 2022 ITP Single-family Home Superlatives
Most Expensive Area to Buy a Single-Family Home ITP Chastain Park (Average sale price of $2,281,660)
Fastest Growing Average Single-Family Home Prices ITP
Brookwood Hills (+29.9% Q3/Q4 average closed sale price in 2022 vs. 2021)
Highest Price Per Square Foot for Single-Family Homes ITP Cabbagetown (Average $449/SF)
Shortest Average Days on Market ITP Inman Park (Average 10 days on market)
Where Can You Buy the Typical Single-Family Home for...
Less than $499,999
Cascade East
Cascade West
College Park
East Atlanta
East Point
Hapeville
Summerhill
West End/
Capitol View
$500,000 to $699,999 $700,000 to $1 million Over $1 million
Avondale Estates
Cabbagetown
Chamblee
East Lake
Edgewood
Grant Park/ Glenwood Park
Kirkwood
Ormewood Park
Reynoldstown
West Midtown/ Underwood Hills
Brookhaven
Collier Hills/ Ardmore Park
Decatur
Druid Hills/ Emory
Lake Claire/Little
Five Points
Oakhurst
Old Fourth Ward
Peachtree Hills
Vinings
Ansley Park/ Sherwood Forest
Brookwood Hills
Buckhead
Chastain Park
Garden Hills
Inman Park
Virginia
Highlands/ MorningsideLenox Park
2022 END OF YEAR ATLANTA MARKET INTELLIGENCE 39 ENGEL & VÖLKERS www.evatlanta.com
Price brackets based on 6-month rolling average sale price in analyzed area as of December 2022 from FMLS
Source: FMLS InfoSparks, Rolling 6-months as of December 2022
ITP Single-Family Home Summary by Neighborhood - Q3 & Q4 2022
Source: FMLS InfoSparks,Single-family homes, Rolling 6-months as of December 2022 (year-over-year change compared to rolling 6-months as of December 2021)
2022 END OF YEAR ATLANTA MARKET INTELLIGENCE 40 ENGEL & VÖLKERS www.evatlanta.com
Area Number of SingleFamily Homes Sold in Q3 & Q4 Average Closed Sale Price Median Closed Sale Price Average PPSF Months of Inventory Average Days on Market Ansley Park/ Sherwood Forest 22 $1,446,645 q -25.7% $1,138,350 q -34.6% $426 p +0.7% r 4.3 r 39 Avondale Estates 53 $666,762 p +18.0% $648,000 p +12.6% $263 p +10.5% s 1.1 r 30 Brookhaven 233 $899,054 p +7.6% $770,000 p +6.7% $303 p +9.8% s 1.9 s 23 Brookwood Hills 6 $1,857,417 p +29.9% $1,428,500 q -3.7% $398 p +14.7% s 1.4 r 73 Buckhead 404 $1,483,149 p +6.1% $1,205,000 p +10.6% $354 p +9.9% r 2.7 r 27 Cabbagetown 12 $581,083 p +5.2% $546,500 q -11.4% $449 p +20.4% r 2.3 r 45 Cascade East 107 $359,717 p +16.7% $325,000 p +4.9% $186 p +5.1% r 3.2 r 31 Cascade West 97 $342,230 p +9.5% $287,750 p +8.6% $165 p +12.2% r 2.3 r 27 Chamblee 55 $570,043 p +4.0% $530,000 p +10.6% $280 p +13.4% s 1.9 r 28 Chastain Park 25 $2,281,660 p +23.3% $1,850,000 p +18.3% $398 p +16.0% r 2.7 r 27 College Park 73 $335,665 p +7.1% $275,000 q -6.6% $175 p +18.2% r 3.6 r 27 Collier Hills/ Ardmore Park 18 $931,361 p +13.7% $962,500 p +20.7% $391 p +13.7% s 1.6 s 13 Decatur 98 $782,544 p +8.3% $699,500 p +6.4% $232 p +7.4% s 1.2 s 23 Druid Hills/ Emory 48 $938,275 q -8.2% $834,000 q -1.9% $336 p +5.0% s 2.1 r 38 East Atlanta 55 $491,075 p +2.6% $469,900 p +3.4% $301 q -1.0% s 1.7 s 21 East Lake 35 $674,455 p +23.9% $640,000 p +10.7% $318 p +16.5% s 2.1 s 20 East Point 132 $296,117 p +13.9% $300,000 p +17.3% $196 p +18.1% r 2.6 s 24 q Down YOY p Up YOY s Below SFH Market Average r Above SFH Market Average w Equal to SFH Market Average
2022 END OF YEAR ATLANTA MARKET INTELLIGENCE 41 ENGEL & VÖLKERS www.evatlanta.com Area Number of SingleFamily Homes Sold in Q3 & Q4 Average Closed Sale Price Median Closed Sale Price Average PPSF Months of Inventory Average Days on Market Edgewood 33 $578,905 p +6.8% $525,000 q -5.0% $317 p +3.6% r 2.9 s 18 Garden Hills 17 $1,205,647 p +21.5% $1,200,000 p +20.6% $382 p +11.4% r 2.8 r 35 Grant Park/ Glenwood Park 57 $672,259 p +13.9% $625,000 p +10.8% $362 p +8.7% s 1.0 s 18 Hapeville 23 $307,392 p +6.1% $265,000 p +0.0% $221 p +18.8% s 2.1 s 24 Inman Park 10 $1,134,000 p +16.9% $1,125,000 p +49.0% $441 p +3.5% s 0.9 s 10 Kirkwood 49 $687,373 p +16.3% $645,000 p +8.8% $357 p +10.2% s 1.8 s 18 Lake Claire/ Little Five Points 40 $951,508 p +18.7% $859,750 p +11.7% $363 p +4.9% s 2.0 r 27 Midtown 13 $1,193,869 p +32.7% $1,025,000 p +18.0% $402 p +15.2% r 3.0 r 29 Oakhurst 21 $879,500 p +10.3% $750,000 p +2.0% $403 p +7.5% s 1.1 r 27 Old Fourth Ward 18 $892,312 p +23.3% $726,100 p +5.2% $400 p +7.0% r 3.6 r 30 Ormewood Park 19 $665,18 p +12.4% $530,000 q -3.9% $351 p +6.7% s 1.1 s 22 Peachtree Hills 23 $854,963 p +2.2% $773,000 p +1.0% $413 p +15.7% s 1.5 s 15 Peoplestown/ Chosewood Park/ Lakewood Heights 68 $342,490 p +2.3% $329,000 p +4.8% $226 p +3.7% r 3.7 w 26 Reynoldstown 9 $642,322 p +9.6% $599,900 p +7.8% $353 q -5.4% r 2.6 r 28 Summerhill 9 $474,765 q -5.2% $513,000 p +5.8% $262 q -6.8% s 1.8 r 33 Vinings 38 $861,873 q -5.8% $742,000 q -10.6% $233 q -6.4% w 2.2 r 30 Virginia Highlands/ Morningside 102 $1,182,769 p +0.7% $1,099,000 p +13.2% $412 p +11.1% s 2.1 s 20
q Down YOY p Up YOY s Below SFH Market Average r Above SFH Market Average w Equal to SFH Market Average
ITP Single-Family Home Summary by Neighborhood - Q3 & Q4 2022 (Continued)
ITP Single-Family Home Summary by Neighborhood - Q3 & Q4 2022 (Continued)
New Construction Single-Family Homes ITP
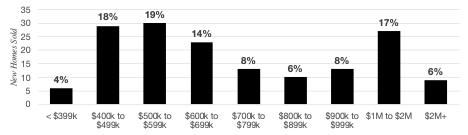
Almost all the single-family homes sold ITP were resale. Of the 3,297 detached single-family homes sold ITP in the second half of 2022, only 160 were new construction, representing just 4.9% of sales. Most were “infill” homes built on a lot in an established neighborhood, rather than as new subdivisions as seen in many OTP areas. They ranged from $279,000 for a 2-bedroom, 742-square-foot home in English Avenue to $5,779,000 for a custom 7-bedroom home with more than 11,000 square feet in Mount Paran.
Most were priced under $600,000 (59%); however, a significant number of homes priced over $1 million (23%) brought the average sale price for a new home ITP to $931,134. New homes priced under $600,000 were typically located on the south and west sides in places like Pittsburgh, Oakland City, Mozley Park, Bankhead, and Hapeville. Homes over $1 million were typically located on the north and east sides of town in places like Oakhurst, Buckhead, and Brookhaven.
2022 END OF YEAR ATLANTA MARKET INTELLIGENCE 42 ENGEL & VÖLKERS www.evatlanta.com Area Number of SingleFamily Homes Sold in Q3 & Q4 Average Closed Sale Price Median Closed Sale Price Average PPSF Months of Inventory Average Days on Market West End/ Adair Park/ Pittsburgh/ Capitol View/ Sylvan Hills 227 $377,171 p +14.6% $360,000 +7.5% $227 p +7.1% r 4.0 r 28 West Midtown/ Underwood Hills 173 $545,640 p +9.9% $543,000 p +9.7% $266 p +2.7% r 2.4 s 24
New Construction Single-Family Homes Sold ITP - Q3 & Q4 2022
Source: FMLS, New Construction Single-Family Homes, ITP, Rolling 6-month as of December 2022 (YOY change is compared to rolling 6-month period as of December 2021)
Single-Family Homes - Outside the Perimeter
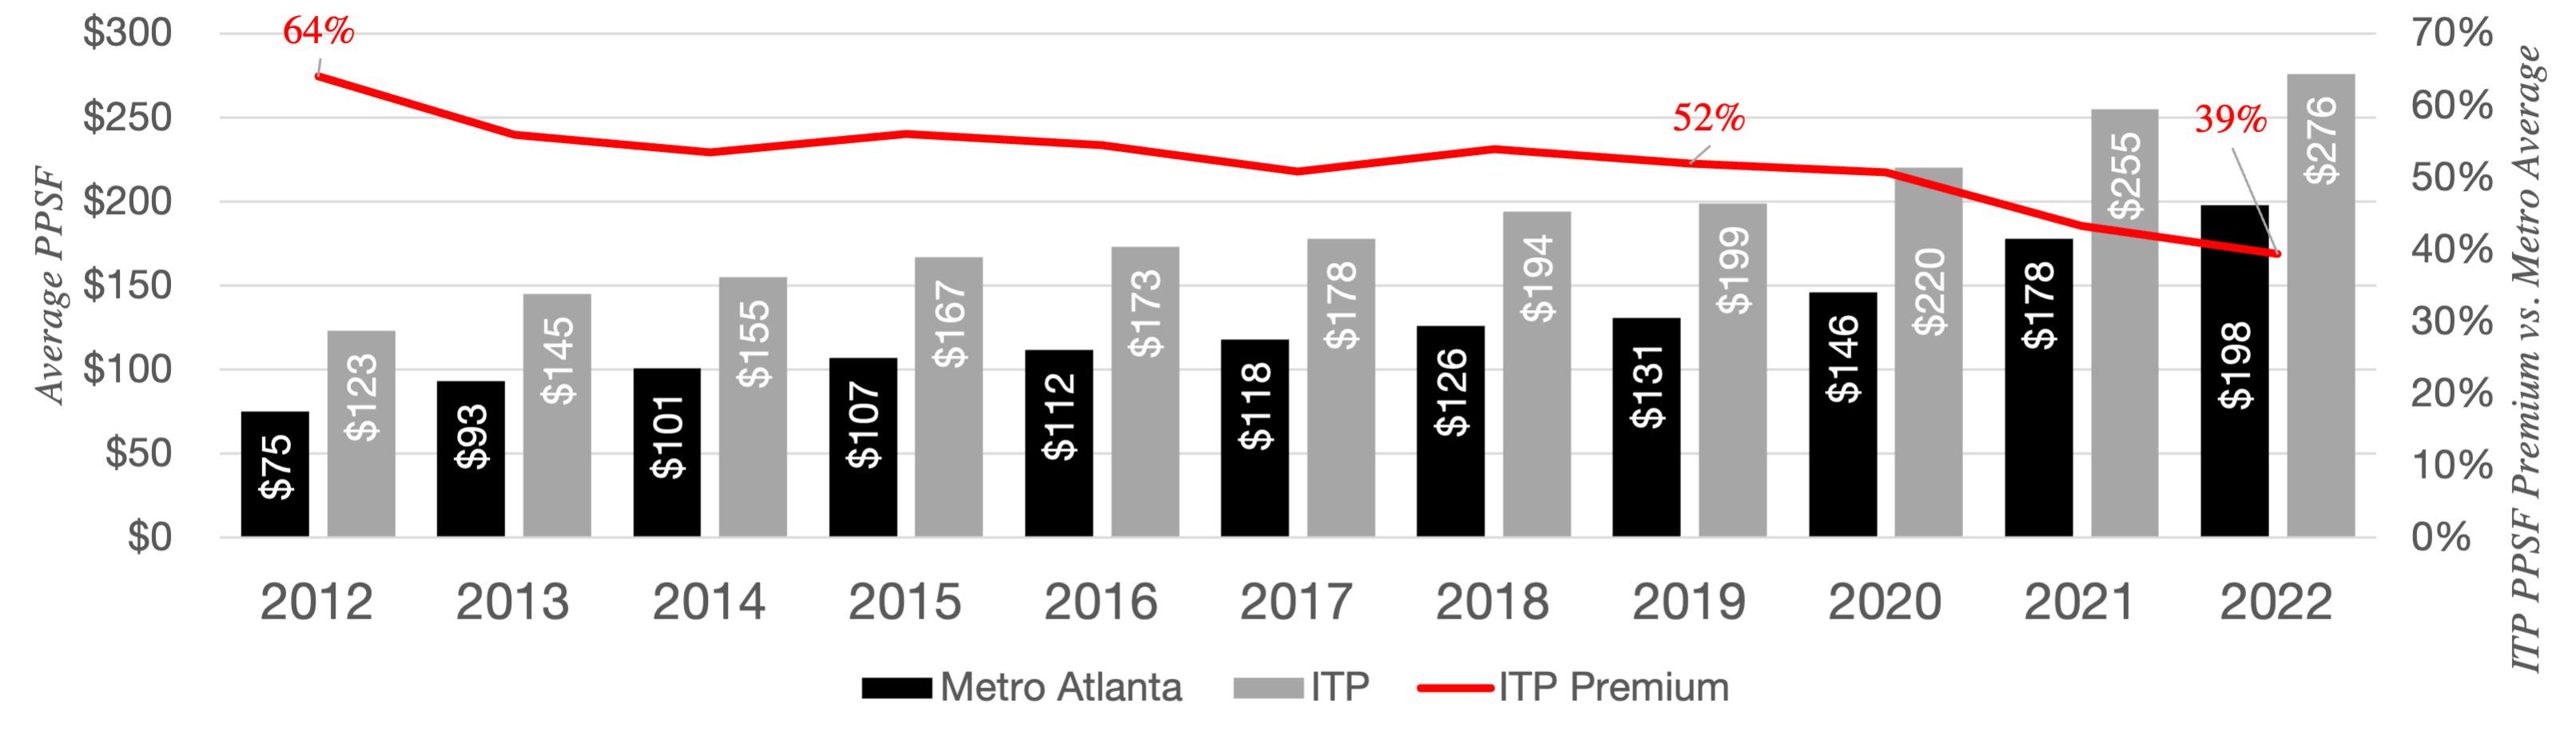
Single-family homes continue to be the primary type of housing outside the perimeter. Homes in suburban areas tend to offer more space at a lower cost per square foot, an appealing option for families and other buyers looking to get more for their money. However, the relative savings of OTP living has been declining in recent years. A decade ago, ITP homes cost 64% more per square foot (PPSF) than the average home in Metro Atlanta ($123/SF ITP compared to $75/SF on average). In late 2022, that premium had declined
to 39% ($276/SF ITP compared to $198/SF on average). This may reflect factors like an increase in the share of homes built OTP since 2012 (which tend to be smaller than those built in previous decades), an increasing share of new homes in the suburbs (which tend to cost more per square foot than resale), rising property values as suburban cities have developed their own town centers and amenities, or shifting preferences toward suburban living since the COVID-19 pandemic, which accelerated the shrinking gap between intown and suburban PPSF.
Still, homes in suburban Atlanta remain relatively affordable, and many places have average home prices below the national average.

Key Stats
OTP
SingleFamily Homes
(Q3 & Q4 2022)
• 86% of all single-family home sales were OTP
• 82% of all single-family home listings were OTP
Metro Atlanta vs. ITP Price Per Square Foot - Single-Family Homes (Q3 & Q4, 2012 to 2022)
2022 END OF YEAR ATLANTA MARKET INTELLIGENCE 43 ENGEL & VÖLKERS www.evatlanta.com
Source: FMLS, Metro Atlanta, FMLS, Rolling 6-month as of December of each year
Q3 + Q4 2022 OTP Single-family Home Superlatives
Most Expensive Area to Buy a Single-Family Home OTP
Fastest Growing Average Single-Family Home Prices OTP
Highest Price Per Square Foot for Single-Family Homes OTP
Shortest Average Days on Market OTP
Milton (Average Q3/Q4 sale price $1,315,685)
Milton (+24.3% Q3/Q4 average closed sale price in 2022 vs. 2021)
Chattahoochee Hills (Average $397/SF)
Tied between Dunwoody, McDonough, and Tucker (Average 19 days on market)
Where Can You Buy the Typical Single-Family Home for...
Less than $499,999 $500,000 to $699,999 $700,000 to $1 million Over $1 million
Acworth
Clarkston
Douglasville
Fairburn
Fayetteville
Kennesaw
Lawrenceville
Mableton
McDonough
Norcross
Snellville
South Fulton
Sugar Hill
Tucker
Union City
Woodstock
Canton
Cumming
Duluth
Dunwoody
East Cobb
Marietta
Peachtree City
Peachtree
Corners
Smyrna
Suwanee
Alpharetta
Chattahoochee Hills
Johns Creek
Roswell
Milton Sandy Springs
2022 END OF YEAR ATLANTA MARKET INTELLIGENCE 44 ENGEL & VÖLKERS www.evatlanta.com
Price brackets based on 6-month rolling average sale price in analyzed area as of December 2022 from FMLS
Source: FMLS InfoSparks, Rolling 6-months as of December 2022
OTP Single-Family Home Summary by Area - Q3 & Q4 2022
Source: FMLS InfoSparks, Single-family homes, Rolling 6-months as of December 2022 (year-over-year change compared to rolling 6-months as of December 2021)
2022 END OF YEAR ATLANTA MARKET INTELLIGENCE 45 ENGEL & VÖLKERS www.evatlanta.com Area Number of SingleFamily Homes Sold in Q3 & Q4 Average Closed Sale Price Median Closed Sale Price Average PPSF Months of Inventory Average Days on Market Acworth 647 $435,543 p +7.6% $395,000 p +7.0% $182 p +11.7% s 2.1 s 24 Alpharetta 666 $771,394 p +14.4% $677,450 p +16.4% $232 p +14.3% s 1.7 s 23 Canton 812 $530,669 p +13.2% $472,000 p +11.7% $194 p +13.5% r 2.4 r 30 Chattahoochee Hills 27 $986,497 p +25.9% $828,815 p +6.0% $397 p +5.9% r 2.3 r 55 Clarkston 18 $317,308 p +4.7% $346,675 p +16.3% $203 p +13.4% r 2.6 r 40 Cumming 1,161 $599,245 p +14.0% $563,911 p +17.5% $204 p +14.0% s 1.9 s 23 Douglasville 735 $339,364 p +9.9% $320,000 p +10.2% $161 p +10.3% r 2.3 r 27 Duluth 290 $536,650 q -4.4% $443,500 p +6.9% $193 p +9.0% s 2.0 s 25 Dunwoody 157 $665,151 p +7.2% $624,000 p +5.8% $224 p +8.2% s 1.5 s 19 East Cobb 1,059 $593,834 p +13.7% $500,000 p +13.6% $205 p +15.2% s 1.6 s 23 Fairburn 260 $370,372 p +13.7% $374,250 p +17.3% $150 p +14.5% r 2.3 s 23 Fayetteville 192 $492,099 p +15.4% $424,875 p +18.0% $168 p +9.1% r 2.8 r 29 Johns Creek 214 $819,597 p +12.5% $750,000 p +19.0% $213 p +13.9% s 1.9 s 23 Kennesaw 504 $459,439 p +10.7% $410,000 p +12.2% $183 p +10.9% s 1.7 s 23 Lawrenceville 1,229 $406,247 p +13.1% $385,000 p +11.6% $172 p +12.4% w 2.2 r 29 Mableton 216 $392,413 p +10.3% $361,750 p +3.3% $182 p +13.8% s 1.8 r 29
q Down YOY p Up YOY s Below SFH Market Average r Above SFH Market Average w Equal to SFH Market Average
OTP Single-Family Home Summary by Area - Q3 & Q4 2022 (Continued)
2022 END OF YEAR ATLANTA MARKET INTELLIGENCE 46 ENGEL & VÖLKERS www.evatlanta.com Area Number of SingleFamily Homes Sold in Q3 & Q4 Average Closed Sale Price Median Closed Sale Price Average PPSF Months of Inventory Average Days on Market Marietta 1,677 $545,504 p +14.7% $450,000 p +9.8% $203 p +12.8% s 1.7 s 24 McDonough 379 $391,706 p +6.8% $385,000 p +8.8% $155 p +13.1% r 2.9 s 19 Milton 151 $1,315,685 p +24.3% $1,185,000 p +24.6% $266 p +23.1% r 2.9 r 31 Norcross 148 $343,414 p +4.4% $342,500 p +12.3% $189 p +5.0% r 2.4 s 24 Peachtree City 88 $521,049 q -3.7% $522,851 p +8.2% $189 0.0% w 2.2 r 31 Peachtree Corners 126 $620,226 p +13.7% $570,000 p +13.4% $196 p +16.0% s 1.5 s 21 Roswell 512 $715,738 p +14.3% $609,000 p +12.8% $222 p +12.7% s 1.6 s 20 Sandy Springs 198 $1,099,937 p +12.0% $857,500 p +11.4% $250 p +13.1% r 2.3 r 29 Smyrna 373 $528,569 p +6.7% $499,900 p +7.5% $227 p +12.9% s 1.7 w 26 Snellville 550 $382,744 p +9.2% $355,000 p +11.1% $162 p +12.5% w 2.2 r 28 South Fulton 45 $304,235 q -14.1% $275,000 q -8.3% $146 p +10.6% r 4.5 s 23 Sugar Hill 184 $474,377 p +17.1% $437,500 p +13.6% $191 p +15.1% s 1.5 w 26 Suwanee 462 $663,609 p +12.8% $594,000 p +14.6% $193 p +13.5% s 1.7 s 24 Tucker 185 $427,703 p +12.7% $400,000 p +11.1% $200 p +8.1% s 1.7 s 19 Union City 84 $294,830 p +14.1% $302,500 p +18.6% $153 p +15.0% s 2.0 s 22 Woodstock 682 $477,807 p +13.4% $425,000 p +10.4% $202 p +14.8% s 1.8 s 24
q Down YOY p Up YOY s Below SFH Market Average r Above SFH Market Average w Equal to SFH Market Average
New Construction SingleFamily Homes OTP
There were 1,891 new construction single-family homes sold in Metro Atlanta in Q3 and Q4 2022. They sold for an average of $638,025, or $216 per square foot. Most single-family home construction in Atlanta is happening in the suburbs, particularly those north of Atlanta. Although some of these new homes were built as infill on lots in existing neighborhoods as is typical ITP, many were constructed as part of new subdivisions in suburban areas.

Gwinnett County had the most new construction single-family homes sold in late 2022 (393 homes), followed by Fulton (327), Cobb (224), Cherokee (219), and Forsyth (218) Counties.
The top cities for new singlefamily construction sales OTP were in the outer ring of the metro: Cumming, Canton, Loganville, and Fairburn. Marietta had the most new construction sales of closer in cities, with an average sale price of nearly $1 million for new single-family homes.
About 10% of new construction single-family homes sold in late 2022 were luxury homes priced at $1 million or higher. Most were in Fulton (45%), Cobb (21%), or DeKalb (16%) Counties. The most popular OTP cities for new homes over $1 million were Marietta (32 homes), Milton (20 homes), Alpharetta (16 homes), Canton (10 homes), and Johns Creek (10 homes).
The most affordable cities for new construction homes were all located south of Atlanta: Jonesboro ($290,000 average sale price), South Fulton ($312,495), Lovejoy ($379,066), East Point ($379,066), and Villa Rica ($382,463).
Top
2022 END OF YEAR ATLANTA MARKET INTELLIGENCE 47 ENGEL & VÖLKERS www.evatlanta.com
Rank City # New SFH Sold Q3 & Q4 2023 Average Sale Price Average PPSF 1 Cumming 122 $646,185 $219 2 Canton 121 $637,373 $224 3 Loganville 108 $469,280 $162 4 Fairburn 81 $416,608 $153 5 Marietta 80 $971,059 $254
Source: FMLS InfoSparks,Single-family homes, New construction, 7/1/22 to 12/31/22 Rank County # New SFH Sold Q3 & Q4 2023 % New SFH Sold Q3 & Q4 2023 Average Sale Price Average PPSF 1 Gwinnett 393 21% $549,806 $189 2 Fulton 327 17% $834,746 $250 3 Cobb 224 12% $732,459 $228 4 Cherokee 219 12% $605,668 $227 5 Forsyth 218 12% $664,512 $231 6 DeKalb 142 8% $754,734 $243 7 Henry 136 7% $443,716 $161 8 Rockdale 78 4% $427,955 $165 9 Douglas 73 4% $424,388 $165 10 Fayette 71 4% $569,896 $179 11 Clayton 10 1% $355,291 $140 Total 1,891 100% $638,025 $216 Source: FMLS InfoSparks,Single-family homes, New construction, 7/1/22 to 12/31/22
OTP Cities for New Construction Single-Family Home Sales (Q3 & Q4 2022)
New Construction Single-Family Home Sales by County (Q3 & Q4 2022)
Townhomes
There were 9,689 townhomes sold in Metro Atlanta in 2022, lower than the record sales of the pandemic era due to a slower second half of the year, but still 1% higher than in 2019.
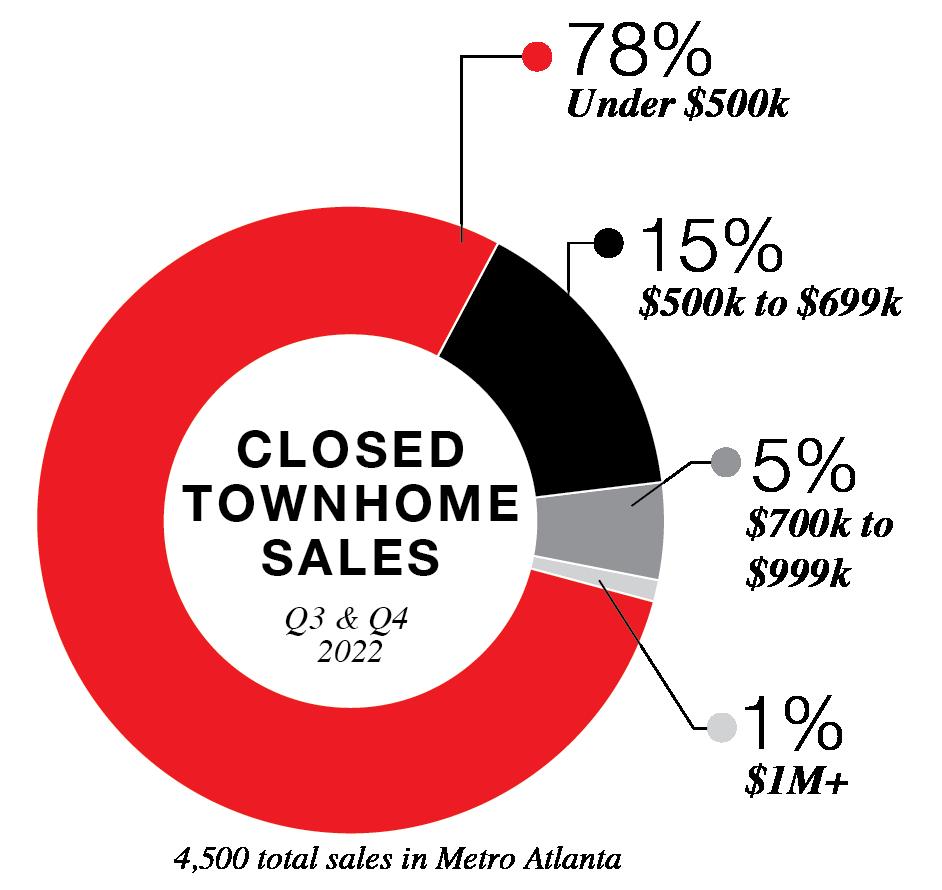
Townhomes have become an increasingly popular choice for Metro Atlanta homebuilders and buyers over the past decade, offering many of the perks of a single-family home with a lower price tag and less exterior maintenance. In late 2012, 10.5% of all homes purchased in the metro were townhomes. In the second half of 2022, about 15% of Metro Atlanta homebuyers opted for townhomes, with 4,500 total sales in Q3 and Q4.
Although the total number of townhomes sold was down in the second half of 2022 (-26% compared to the same period in 2021) sale prices continued to rise. The average price for a townhome in Metro Atlanta
was $395,933 in Q3 and Q4, 10% higher than the same period in 2021, in part because of limited inventory. 78% of townhomes sold for less than $500,000. Even with growing prices, townhomes remain a more affordable option than detached single-family homes, which sold on average for $113,149 more than the average townhome.
This relative cost savings is a key factor in the growing popularity of townhomes. There were just 1.9 months of townhome inventory in late 2022, a slightly tighter supply than the market overall. They went under contract in 22 days on average, faster than single-family homes or condominiums.
Most townhome sales were in suburban areas outside the perimeter, with about a quarter of townhome sales ITP. Threebedroom townhomes were the
Key Stats
Metro Atlanta
Townhomes
(Q3 & Q4 2022)
• $395,933 average sale price (+10.1% YOY)
• 15% of all homes sold were townhomes
• Townhomes sold 3 days faster than average (22 days on market)
• Townhomes sold for 98.7% of the original list price on average, the highest of any home type
2022 END OF YEAR ATLANTA MARKET INTELLIGENCE 48 ENGEL & VÖLKERS www.evatlanta.com
most purchased category, making up 62% of all townhome sales and averaging $403,020. Although they made up a smaller share of the market, 2-bedroom townhomes have the highest relative demand, with just 1.5 months of supply in Metro Atlanta.
While luxury townhomes continue to be a small portion of the overall townhome market (less than 2% of sales), there were 14% more townhomes sold for $1 million or more in the second half of 2022
compared to 2021. This shows a growing number of luxury buyers interested in a low-maintenance townhome lifestyle and an expanding portfolio of new luxury townhomes to choose from. With a smaller pool of luxury buyers, these townhomes tended to stay on the market about twice as long as more affordable townhomes, averaging 44 days on the market.
Metro Atlanta Townhome Summary (Q3 & Q4 2022)
Source: FMLS InfoSparks, Greater Atlanta Area, Townhomes, Rolling 6-months as of December 2022 (year-over-year change compared to rolling 6-months as of December 2021)
2022 END OF YEAR ATLANTA MARKET INTELLIGENCE 49 ENGEL & VÖLKERS www.evatlanta.com Metro Atlanta City of Atlanta ITP Median Sale Price $350,000 p +7.7% $440,000 p +6.8% $475,000 p +9.8% average Sale Price $395,933 p +10.1% $490,686 p +11.6% $517,902 p +11.1% closed Sales 4,500 q -26.0% 963 q -31.4% 1,023 q -34.0% Pending Sales 3,871 q -32.6% 804 q -38.6% 835 q -41.6% active Listings 1,559 p +38.6% 383 p +7.6% 402 p +1.8% New Listings 5,561 q -11.7% 1,261 q -16.0% 1,287 q -21.1% average Sale Price to Original List Price Ratio 98.7% q -2.5% 98.7% q -1.1% 98.7% q -0.9% Months of Inventory 1.9 p +72.7% 2.0 p +42.9% 2.0 p +42.9% average Days on Market 22 p +4.8% 26 0.0% 26 q -3.7%
q Down YOY p Up YOY
Source: FMLS InfoSparks, Greater Atlanta Area, Townhomes, Rolling 6-months as of December 2022 (year-over-year change compared to rolling 6-months as of December 2021)
Q4 2022)
Source: FMLS InfoSparks, Greater Atlanta Area, Townhomes, Rolling 6-months as of December 2022 (year-over-year change compared to rolling 6-months as of December 2021)
2022 END OF YEAR ATLANTA MARKET INTELLIGENCE 50 ENGEL & VÖLKERS www.evatlanta.com 1-bedroom 2-bedroom 3-bedroom 4-bedroom Median Sale Price $247,500 p +39.4% $264,000 p +12.2% $367,365 p +11.3% $516,000 p +13.3% average Sale Price $252,273 p +20.7% $283,975 p +8.1% $403,020 p +11.8% $572,671 p +16.9% closed Sales 26 p +4.0% 1,079 q -19.1% 2,807 q -24.4% 593 q -41.2% Pending Sales 22 q -8.3% 1,004 q -21.4% 2,364 q -32.5% 482 q -48.9% active Listings 23 p +76.9% 293 p +18.6% 977 p +46.9% 267 p +33.5% New Listings 92 p +55.9% 1,292 q -8.8% 3,378 q -12.1% 801 q -18.3% average Sale Price to Original List Price Ratio 97.0% q -2.3% 98.3% q -2.5% 99.0% q -2.4% 98.5% q -2.2% Months of Inventory 4.1 p +95.2% 1.5 p +25.0% 1.9 p +72.7% 2.3 p +91.7% average Days on Market 22 q -8.3% 21 p +16.7% 22 p +10.0% 26 q -7.1%
Less than $499,999 $500,000 to $699,999 $700,000 to $1 million Over $1 million closed Sales 3,525 q -30.6% 688 q -7.8% 230 p +14.4% 57 p +14.0% Pending Sales 3,115 q -34.9% 550 q -21.1% 157 q -27.0% 49 q -2.0% active Listings 1,002 p +31.2% 323 p +68.2% 141 p +50.0% 49 p +32.4% New Listings 4,089 q -19.5% 915 p +23.1% 309 p +7.7% 105 p +61.5% average Sale Price to Original List Price Ratio 98.6% q -2.8% 99.2% q -1.0% 98.8% q -0.5% 98.5% p +1.9% Months of Inventory 1.5 p +66.7% 2.7 p +68.8% 3.5 p +20.7% 5.0 p +31.6% average Days on Market 20 p +11.1% 25 q -21.9% 33 q -26.7% 44 p +25.7%
Metro Atlanta Townhome Summary by Number of Bedrooms (Q3 &
Metro Atlanta Townhome Summary by Price Range (Q3 & Q4 2022)
Down YOY p Up YOY
q
Townhomes - Inside the Perimeter
The growing trend toward townhomes has been even stronger ITP than in the metro overall. In the late 2012, 13% of all homes sold ITP were townhomes. By the second half of 2022, 18% were townhomes (1,023 sales). The cost savings compared to a detached single-family home was greater too. In Q3 and Q4 2022, the average ITP townhome cost $517,902, about $164,355 (24%) cheaper than the average detached single-family home. About 55% of ITP townhomes sold for less than $500,000, a higher share than the 47% of ITP single-family homes in the same price range.
Like the market overall, the total number of townhomes sold ITP was down in the second half of 2022 compared to the same period in 2021 (-34%). As with single-family homes, intown sales for townhomes under $500,000 were down more
than those at higher price points (-43.3%), reflecting greater buyer sensitivity to rising interest rates in the entry level price range.
The ITP luxury townhome market is small but growing. Townhomes priced over $1 million were the only price range with more ITP sales in late 2022 compared to 2021 (+2.7%) but remained a fraction of the market with just 38 sales. Though small, that is 475% more luxury townhomes sold than a decade ago. The number of new listings for townhomes over $1 million ITP is up significantly (+41.2% compared to late 2021) while new listings at lower price points is down (-22.6%), reflecting fewer of the less expensive resale townhomes being listed and higher price tags for new construction townhomes being delivered in a period with high construction costs.

Key Stats ITP Townhomes
(Q3 & Q4 2022)
• $517,902 average sale price (+11.1% YOY)
• 18% of all ITP homes sold were townhomes
• 23% of all townhome sales were ITP
• 26% of all townhome listings were ITP
• 22% ITP townhomes sold were new construction
• ITP homes sold a little slower than the metro average (26 days on market)
• Homes sold for 98.7% of the original list price on average
2022 END OF YEAR ATLANTA MARKET INTELLIGENCE 51 ENGEL & VÖLKERS www.evatlanta.com
Q3 + Q4 2022 ITP Townhome Superlatives
Most Expensive Area to Buy a Townhome ITP
Fastest Growing Average Townhome Prices ITP
Highest Price Per Square Foot for Townhomes ITP
Shortest Average Days on Market ITP
Inman Park ($1,215,599 average Q3/Q4 sale price)
Inman Park (+74.3% Q3/Q4 average closed sale price in 2022 vs. 2021)
Inman Park (Average $428/SF)
Tied between Avondale Estates and East Atlanta (Average 4 days on market)
Where Can You Buy the Typical Townhome for...
Less than $300,000
Cascade East College Park
East Point
West End/ Adair Park/ Capitol View/Sylvan Hills
$300,000 to $499,999
Avondale Estates
Collier Hills/ Ardmore Park
Grant Park
Glenwood Park
Peoplestown/ Chosewood Park/
Lakewood Heights
Vinings
West Midtown/ Underwood Hills
$500,000 to $699,999
Brookhaven
Buckhead
Chamblee
Chastain Park
Decatur
Druid Hills/ Emory
East Atlanta
Edgewood
Garden Hills
Kirkwood
Oakhurst
Ormewood Park
Reynoldstown
Summerhill
$700,000 to $1 million Over $1 million
East Lake
Lake Claire/ Little Five Points
Midtown
Old Fourth Ward
Peachtree Hills
Ansley Park/ Sherwood Forest
Inman Park
2022 END OF YEAR ATLANTA MARKET INTELLIGENCE 52 ENGEL & VÖLKERS www.evatlanta.com
Price brackets based on 6-month rolling average sale price in analyzed area as of December 2022 from FMLS
Source: FMLS InfoSparks, Rolling 6-months as of December 2022
ITP Townhome Summary by Neighborhood - Q3 & Q4 2022
2022 END OF YEAR ATLANTA MARKET INTELLIGENCE 53 ENGEL & VÖLKERS www.evatlanta.com Area Number of Townhomes Sold in Q3 & Q4 Average Closed Sale Price Median Closed Sale Price Average PPSF Months of Inventory Average Days on Market Ansley Park/ Sherwood Forest 3 $1,046,333 p +16.4% $690,000 q -18.8% $338 q -4.5% s 1.4 r 31 Avondale Estates 2 $340,000 p +28.8% $340,000 p +47.8% $196 p +24.8% s 1.0 s 4 Brookhaven 76 $570,292 p +7.7% $540,000 q -0.9% $248 p +9.3% s 1.1 r 24 Buckhead 148 $619,542 p +11.4% $548,319 p +9.2% $266 p +9.5% r 2.1 r 24 Cascade East 20 $216,595 p +24.0% $230,000 p +24.3% $138 p +31.4% s 1.6 w 22 Cascade West 36 $263,483 p +26.6% $283,075 p +29.9% $177 p +25.5% s 1.5 r 23 Chamblee 25 $533,521 p +15.3% $600,000 p +17.8% $241 p +16.4% s 1.4 r 23 Chastain Park 13 $545,895 p +28.5% $387,000 q -14.3% $310 q -4.6% s 1.1 s 18 College Park 8 $209,313 p +3.6% $228,750 p +43.0% $130 p +9.2% s 0.6 s 11 Collier Hills/ Ardmore Park 21 $459,400 p +4.4% $336,000 q -0.6% $288 p +7.1% s 1.6 s 18 Decatur 31 $537,727 p +4.3% $500,000 p +3.5% $266 p +11.8% r 2.5 s 20 Druid Hills/ Emory 24 $591,921 p +28.6% $625,000 p +40.4% $264 p +10.0% s 1.3 r 24 Downtown 5 $566,800 p +9.9% $645,000 p +19.1% $284 p +14.5% s 1.4 s 15 East Atlanta 3 $563,000 p +14.0% $514,000 p +7.7% $326 p +11.6% s 0.1 s 4 East Lake 2 $722,025 p +21.7% $722,025 p +28.9% $324 p +32.2% s 0.0 r 116 East Point 21 $271,328 p +28.9% $255,000 p +29.4% $176 p +23.9% s 1.1 r 23 Edgewood 29 $545,617 p +10.9% $556,830 p +11.4% $299 p +6.8% w 1.9 r 38
6-months
December 2022 (year-over-year
rolling 6-months
December 2021) q Down YOY p Up YOY s Below TH Market Average r Above TH Market Average w Equal to TH Market Average
Source: FMLS InfoSparks, Townhomes, Rolling
as of
change compared to
as of
ITP Townhome Summary by Neighborhood - Q3 & Q4 2022 (Continued)
2022 END OF YEAR ATLANTA MARKET INTELLIGENCE 54 ENGEL & VÖLKERS www.evatlanta.com Area Number of Townhomes Sold in Q3 & Q4 Average Closed Sale Price Median Closed Sale Price Average PPSF Months of Inventory Average Days on Market Garden Hills 2 $683,500 p +22.9% $683,500 p +2.4% $323 p +19.6% r 2.7 s 19 Grant Park/ Glenwood Park 12 $480,200 q -10.0% $447,500 q -14.8% $296 p +8.8% r 2.9 r 25 Inman Park 7 $1,215,599 p +74.3% $1,505,900 p +166.5% $428 p +17.6% r 2.6 s 11 Kirkwood 13 $527,013 p +19.8% $486,100 p +13.6% $306 p +15.0% s 1.3 r 43 Lake Claire/Little Five Points 15 $750,371 p +16.3% $630,000 p +12.0% $351 p +24.5% s 1.4 r 29 Midtown 10 $716,740 p +49.6% $681,500 p +45.8% $391 p +13.7% s 1.5 s 21 Oakhurst 3 $641,833 p +12.7% $599,000 p +11.5% $292 p +16.8% s 1.1 s 18 Old Fourth Ward 15 $978,427 p +52.1% $976,000 p +52.3% $398 p +31.4% s 1.5 r 48 Ormewood Park 13 $565,654 p +9.1% $499,000 p +6.2% $326 p +19.4% s 0.7 s 13 Peachtree Hills 5 $1,040,500 p +14.8% $940,000 q -17.5% $338 p +4.6% s 0.8 r 37 Peoplestown/ Chosewood Park/ Lakewood Heights 15 $428,344 p +16.1% $456,014 p +10.2% $267 p +9.0% r 2.9 r 26 Reynoldstown 20 $675,316 p +9.5% $644,793 p +2.1% $334 p +12.5% r 2.6 r 29 Summerhill 23 $591,341 p +13.3% $582,035 p +22.4% $412 +52.0% r 2.9 r 37 Vinings 70 $451,689 q -0.3% $438,750 p +8.3% $202 p +9.8% s 1.5 w 22 Virginia Highlands/ Morningside 13 $663,613 p +41.3% $510,000 p +21.4% $352 p +16.9% w 1.9 r 59 West End/ Adair Park/ Pittsburgh/ Capitol View/ Sylvan Hills 6 $294,750 p +66.3% $230,000 p +13.2% $206 p +35.5% r 2.4 s 11 West Midtown/ Underwood Hills 171 $488,026 p +14.5% $435,000 p +13.7% $272 p +13.3% r 2.7 r 26
q Down YOY p Up YOY s Below TH Market Average r Above TH Market Average w Equal to TH Market Average
New Construction Townhomes ITP
Nearly half (49%) of all new homes sold ITP in Q3 and Q4 2022 were townhomes (227 homes). This was greater than the number of singlefamily homes sold (195 homes), showing a growing trend toward intown townhome development, with designs that uses land more efficiently and often can be sold at a more attainable price point. Townhomes purchased in late 2022 were also more likely to be new builds compared to other types of homes. Although new construction made up just 8% of all ITP home sales in Q3 and Q4, 22% of all townhomes sold ITP were new construction.
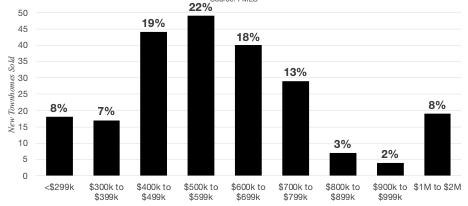
These new townhomes were most often located on the west side from West Midtown to the Chattahoochee River; in east side neighborhoods like Old Fourth Ward, Edgewood, Kirkwood, and Summerhill. Unlike new single-family homes ITP, most new construction townhomes
New Construction Townhomes Sold ITP - Q3 & Q4 2022
are part of small townhome developments, by nature of their attached design.
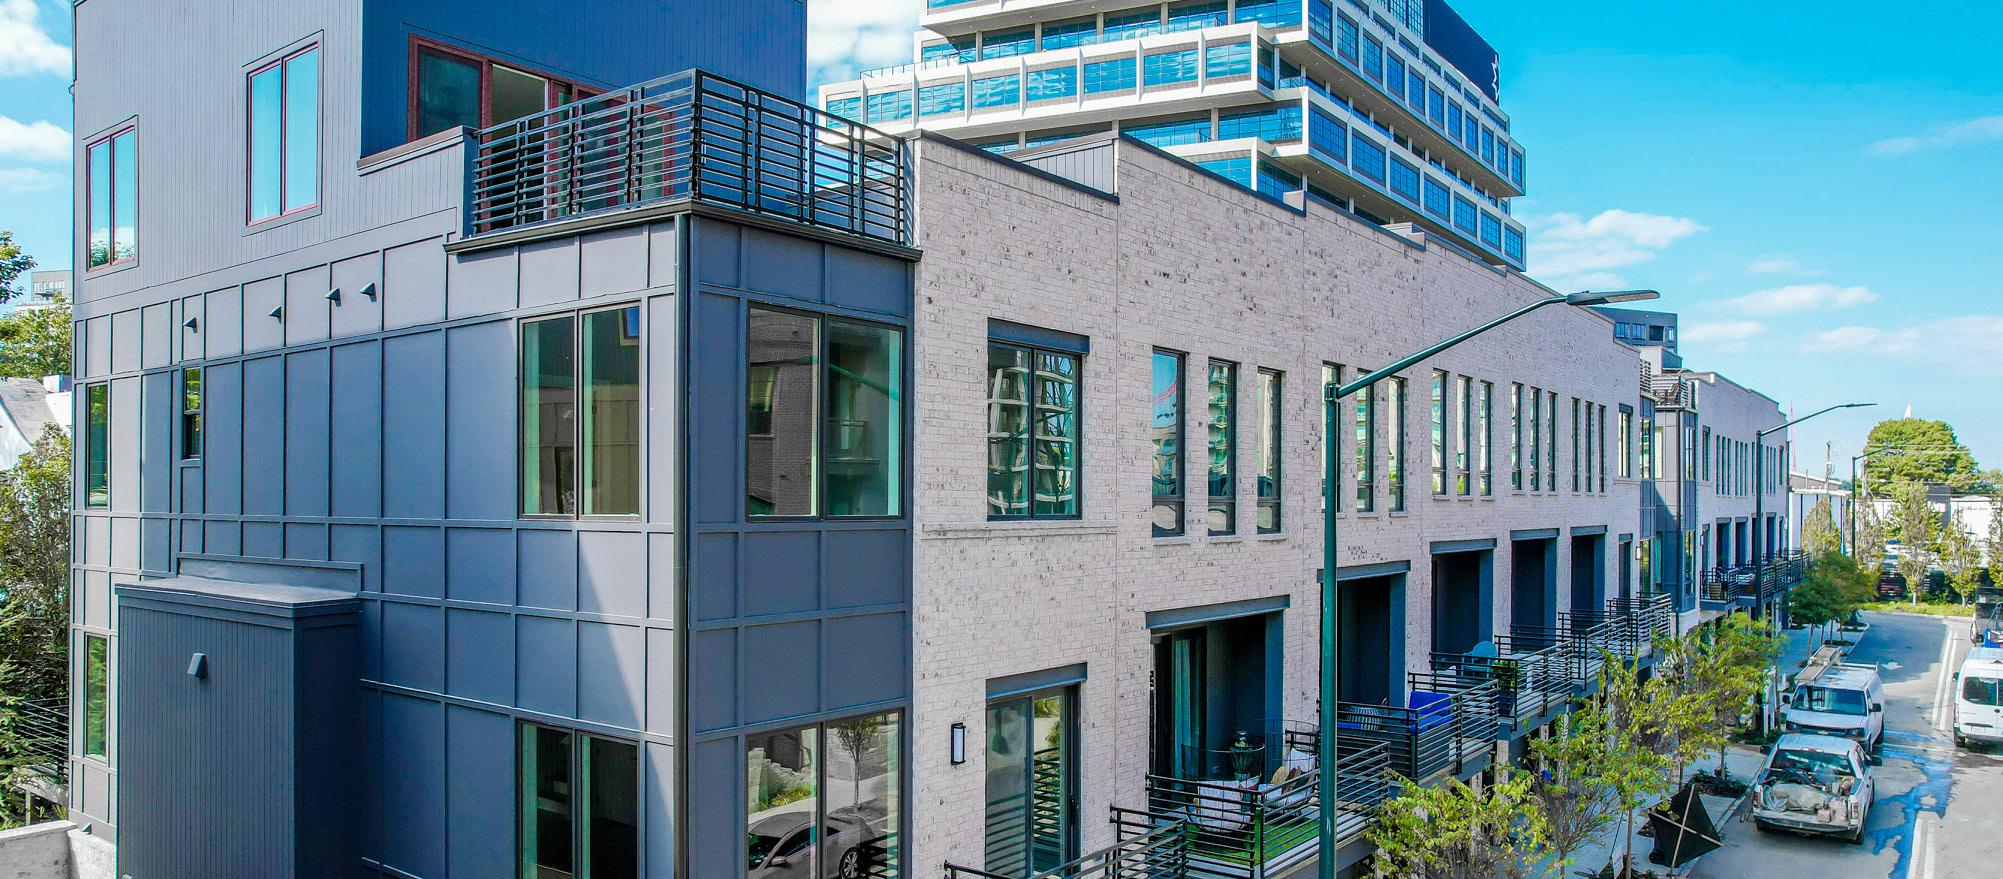
New construction townhomes ranged from $248,500 for a modest 3-bedroom, 1,800-square foot townhome at Browns Mill Village to $1,960,000 for a gut renovation
of a historic estate in Druid Hills that was converted to multiple homes, including this 4-bedroom, 4,574-square-foot townhome. Most were priced under $600,000 (56%), with an average sale price of $618,826 ($309 per square foot).46
2022 END OF YEAR ATLANTA MARKET INTELLIGENCE 55 ENGEL & VÖLKERS www.evatlanta.com
Source: FMLS, ITP, New Construction Townhomes, Rolling 6-months as of December 2022
Townhomes - Outside the Perimeter
Townhomes were a popular choice for buyers in all parts of suburban Atlanta, from Canton in the north to Fayetteville in the south. Most of the townhomes sold in the second half of 2022 were located OTP (77%).
The highest concentrations of townhome sales were in centrally located Fulton, DeKalb, and Cobb Counties, followed by the northern suburban counties. Fewer townhomes were sold in suburban counties south of Atlanta, where the housing stock leans more heavily toward single-family homes.
Fayette County had the fewest townhome sales in late 2022, with just 12 sales, but the highest average sale price of all Metro Atlanta counties. The average price for a townhome in Fayette County was driven by the fact that most sales were custom built townhomes in the new Trilith development, a master planned community next to Trilith Studios and designed to attracted film industry employees with convenient, high-end homes.
Key Stats
OTP Townhomes (Q3 & Q4 2022)
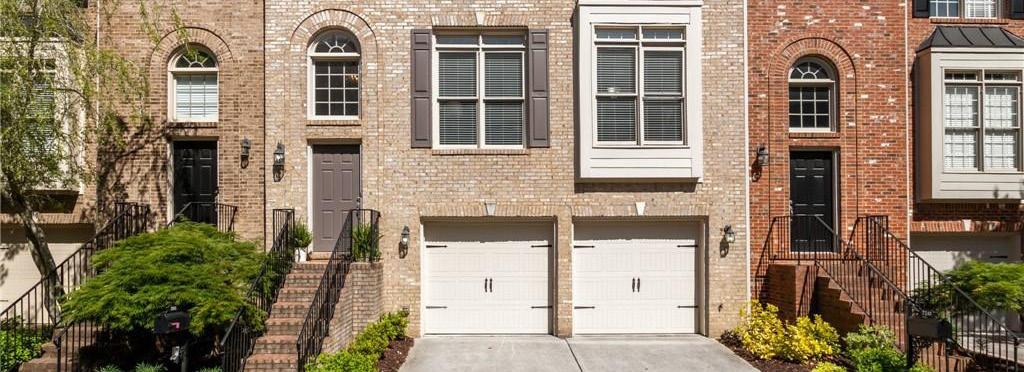
• 77% of all townhome sales were OTP
• 74% of all townhome listings were OTP
2022 END OF YEAR ATLANTA MARKET INTELLIGENCE 56 ENGEL & VÖLKERS www.evatlanta.com
Rank County # TH Sold Q3 & Q4 2023 Average Sale Price Average PPSF 1 Fulton 1,306 $469,943 $234 2 Cobb 753 $378,109 $194 3 DeKalb 753 $387,983 $204 4 Gwinnett 726 $376,307 $198 5 Cherokee 228 $401,878 $205 6 Forsyth 152 $428,052 $214 7 Clayton 113 $196,614 $136 8 Rockdale 31 $241,753 $152 9 Henry 23 $234,984 $170 10 Douglas 19 $236,474 $149
Fayette 12 $524,184 $225
11
Q3 + Q4 2022 OTP Townhome Superlatives
Most Expensive Area to Buy a Townhome OTP
Fastest Growing Average Townhome Prices OTP
Chattahoochee Hills ($838,908 average Q3/Q4 sale price)
Fayetteville (+161.9% Q3/Q4 average closed sale price in 2022 vs. 2021)
Highest Price Per Square Foot for Townhomes OTP Chattahoochee Hills (Average $431/SF)
Shortest Average Days on Market OTP Fairburn (Average 3 days on market)
Source: FMLS InfoSparks, Rolling 6-months as of December 2022
Where Can You Buy the Typical Townhome for...
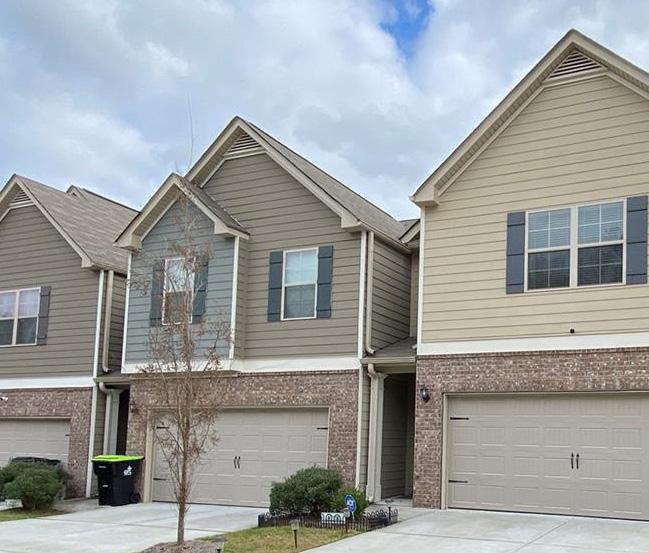
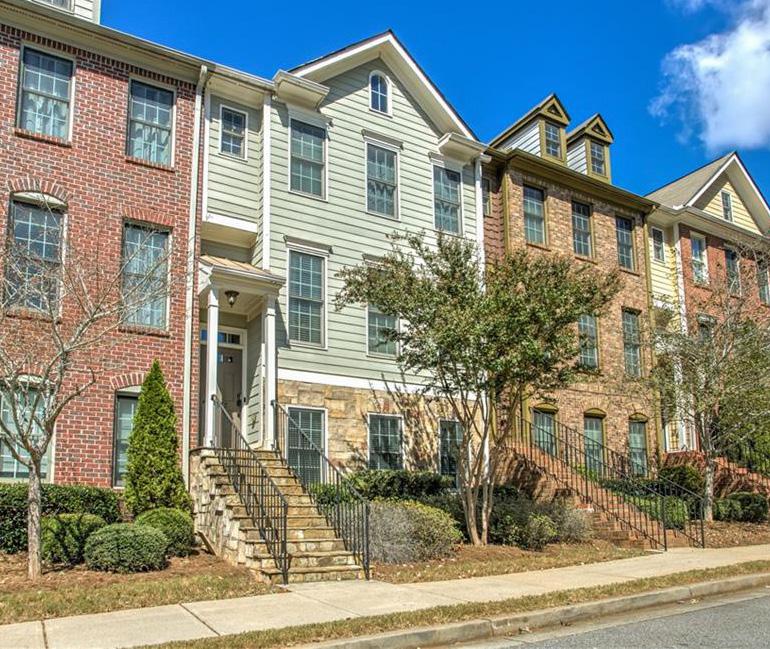
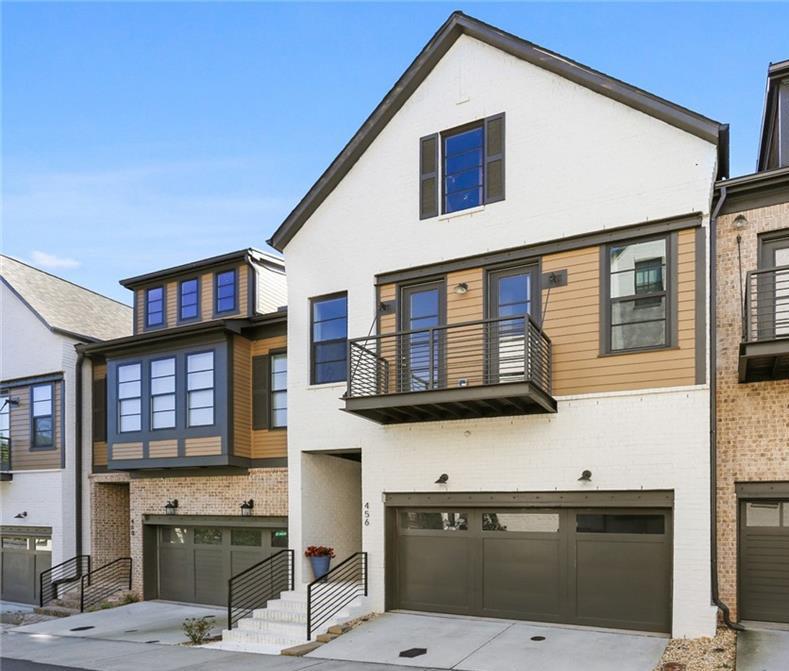
Clarkston
Douglasville
Fairburn
McDonough
Norcross
South Fulton
Tucker
Union City
Acworth
Canton
Duluth
East Cobb
Johns Creek
Kennesaw
Lawrenceville
Mableton
Marietta
Peachtree City
Peachtree
Corners
Sandy Springs
Smyrna
Snellville
Sugar Hill
Suwanee
Woodstock
Alpharetta
Dunwoody
Fayetteville
Milton
2022 END OF YEAR ATLANTA MARKET INTELLIGENCE 57 ENGEL & VÖLKERS www.evatlanta.com
Less
$300,000 $300,000
$499,999 $500,000 to $699,999 $700,000
$1 million
than
to
to
Roswell Chattahoochee Hills
Price brackets based on 6-month rolling average sale price in analyzed area as of December 2022 from FMLS
OTP Townhome Summary by Area - Q3 & Q4 2022
Source: FMLS InfoSparks, Townhomes, Rolling 6-months as of December 2022 (year-over-year change compared to rolling 6-months as of December 2021) q Down YOY p Up YOY
2022 END OF YEAR ATLANTA MARKET INTELLIGENCE 58 ENGEL & VÖLKERS www.evatlanta.com Area Number of Townhomes Sold in Q3 & Q4 Average Closed Sale Price Median Closed Sale Price Average PPSF Months of Inventory Average Days on Market Acworth 62 $351,897 p +27.9% $315,000 p +22.1% $195 p +20.4% r 2.5 r 25 Alpharetta 21 $522,842 p +18.3% $456,000 p +17.9% $252 p +18.9% s 1.8 s 21 Canton 47 $342,913 p +16.0% $319,900 p +14.7% $192 p +21.5% r 3.2 w 22 Chattahoochee Hills 9 $838,908 p +23.1% $745,900 p +7.3% $431 p +10.2% r 4.9 r 98 Clarkston 11 $198,482 p +4.1% $201,000 p +27.6% $148 p +16.5% s 1.2 s 15 Cumming 106 $385,822 p +8.2% $376,000 p +13.9% $203 p +14.7% w 1.9 s 20 Douglasville 18 $251,972 p +6.7% $245,000 -5.8% $150 p +9.5% s 1.7 r 26 Duluth 96 $385,752 p +20.9% $360,000 p +21.6% $202 p +16.8% r 3.1 s 20 Dunwoody 19 $537,010 p +19.7% $549,000 p +26.2% $216 p +7.5% s 0.7 r 23 East Cobb 116 $392,488 p +6.5% $329,950 p +3.1% $198 p +13.1% s 1.7 r 25 Fairburn 158 $297,654 p +20.6% $296,407 p +18.6% $157 p +12.9% s 1.4 s 3 Fayetteville 9 $569,728 p +161.9% $692,300 p +290% $243 p +104.2% r 2.2 r 25 Johns Creek 29 $465,445 p +11.9% $470,000 p +15.9% $213 p +16.4% s 1.4 r 26 Kennesaw 111 $335,245 p +18.2% $325,000 p +15.7% $193 p +19.1% r 2.8 r 23 Lawrenceville 169 $327,865 p +13.3% $318,500 p +10.4% $184 p +17.9% s 1.8 r 28 Mableton 76 $355,213 p +7.7% $365,000 p +4.4% $177 p +9.9% s 1.3 s 11 Marietta 255 $347,443 p +6.2% $335,000 p +11.7% $190 p +11.8% s 1.8 s 21
s Below TH Market Average r Above TH Market Average w Equal to TH Market Average
OTP Townhome Summary by Area - Q3 & Q4 2022
q Down YOY p Up YOY s Below TH Market Average r Above TH Market Average w Equal to TH Market Average
2022 END OF YEAR ATLANTA MARKET INTELLIGENCE 59 ENGEL & VÖLKERS www.evatlanta.com
Area Number of Townhomes Sold in Q3 & Q4 Average Closed Sale Price Median Closed Sale Price Average PPSF Months of Inventory Average Days on Market McDonough 17 $249,739 p +13.3% $240,000 p +17.1% $167 p +19.3% r 2.2 s 21 Milton 32 $677,960 p +20.7% $756,303 p +25.0% $297 p +26.9% r 3.2 r 45 Norcross 94 $290,796 p +11.0% $284,250 p +18.4% $189 p +18.9% s 1.3 s 16 Peachtree City 3 $387,553 p +35.3% $420,000 p +100.0% $200 p +17.0% s 0.3 s 21 Peachtree Corners 92 $437,555 p +31.5% $434,388 p +35.3% $208 p +23.1% r 3.3 r 27 Roswell 125 $509,490 p +10.0% $515,000 p +13.7% $229 p +12.3% s 1.0 s 19 Sandy Springs 104 $452,601 p +9.0% $395,000 p +6.8% $220 p +10.6% s 1.4 s 19 Smyrna 204 $414,486 p +8.4% $425,000 p +11.8% $206 p +13.8% s 1.5 s 21 Snellville 24 $349,090 p +0.5% $375,000 p +4.4% $171 p +9.6% s 1.7 r 25 South Fulton 40 $260,778 p +12.4% $261,720 p +11.1% $170 p +4.3% r 5.7 s 18 Sugar Hill 28 $377,568 p +18.6% $350,000 p +16.3% $182 p +15.2% r 2.9 r 35 Suwanee 122 $459,782 p +13.9% $477,015 p +16.0% $217 p +18.6% w 1.9 r 24 Tucker 55 $296,461 p +19.7% $270,000 p +17.4% $186 p +24.0% r 2.4 w 22 Union City 50 $197,124 p +27.2% $205,000 p +28.1% $132 p +23.4% s 1.3 s 19 Woodstock 152 $434,307 p +21.9% $432,450 p +31.0% $212 p +17.8% r 2.1 r 30
New Construction Townhomes OTP
There were 1,037 new construction townhomes sold in Metro Atlanta in Q3 and Q4 2022.47 They sold for an average of $471,488— about $167,000 less than the cost of the average new single-family home, making townhomes a more affordable option for buyers looking for new construction. Most new townhomes were constructed outside of the perimeter, often around the historic and emerging town centers of suburban cities.
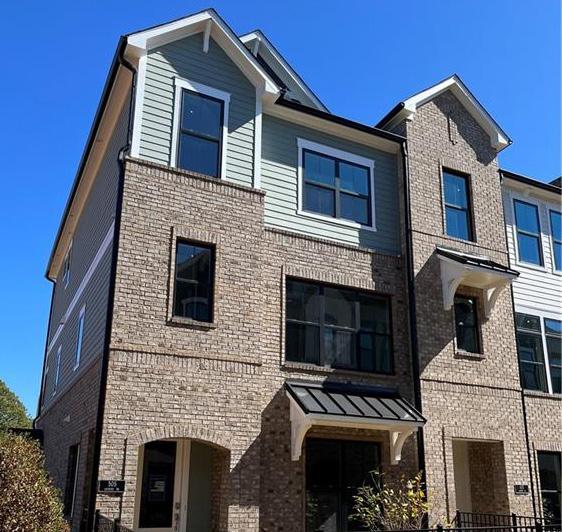
Fulton County had the most new construction townhomes sold in late 2022 (401 homes), followed by Gwinnett (199 homes), DeKalb (183 homes), Cobb (112 homes), and Cherokee (109 homes) Counties. In Fulton County, there were more new construction sales for townhomes than for single-family homes (327 homes) in Q3 and Q4 2022. Few new construction townhomes were sold on counties in the south Metro area, with just 21 new townhomes sold between Clayton, Henry, Fayette, Rockdale, and Douglas Counties.
The top cities for new construction townhome sales OTP were spread across the north and south sides of the metro, typically in cities that have been working on establishing more defined town centers: Fairburn, Woodstock, Suwanee, Stonecrest, Lithonia, and Peachtree Corners.
Luxury townhomes—priced at $1 million or higher—are an emerging part of the townhome market, offering a low-maintenance option for high-end buyers. About 2% of new construction townhomes sold in late 2022 were more than $1 million,
all located in Fulton or DeKalb Counties, and mostly within the City of Atlanta. The only OTP cities with new construction townhome sales over $1 million were Alpharetta and Milton.
As with new single-family homes, the most affordable cities for new construction homes were all located south of Atlanta: Morrow ($231,475 average sale price), South Fulton ($261,049), Stockbridge ($284,123), Lithonia ($294,817), and Fairburn ($296,179).
Top OTP Cities for New Construction Townhome Sales (Q3 & Q4 2022)
2022 END OF YEAR ATLANTA MARKET INTELLIGENCE 60 ENGEL & VÖLKERS www.evatlanta.com
Rank City # New TH Sold Q3 & Q4 2023 Average Sale Price Average PPSF 1 Fairburn 126 $296,179 $155 2 Woodstock 90 $465,103 $212 3 Suwanee 58 $493,135 $244 4 Stonecrest 42 $298,113 $199 5 - Tie Lithonia 37 $294,817 $164 5 – Tie Peachtree Corners 37 $541,606 $241
Source: FMLS,Townhomes, New construction, 7/1/22 to 12/31/22 Rank County # New TH Sold Q3 & Q4 2023 % New TH Sold Q3 & Q4 2023 Average Sale Price Average PPSF 1 Fulton 401 39% $498,409 $244 2 Gwinnett 199 19% $464,690 $228 3 DeKalb 183 18% $445,194 $230 4 Cobb 112 11% $453,940 $224 5 Cherokee 109 11% $455,265 $208 6 Forsyth 12 1% $545,414 $235 7 - Tie Clayton 7 1% $250,386 $156 7 - Tie Henry 7 1% $295,061 $200 9 Fayette 6 1% $659,385 $196 10 Rockdale 1 0% $342,150 $172 11 Douglas 0 0% -Total 1,037 100% $471,488 $232 Source: FMLS,Townhomes, New construction, 7/1/22 to 12/31/22
New Construction Townhome Sales by County (Q3 & Q4 2022)
Condominiums
Condominiums offer a convenient, low-maintenance, lifestyle that appeals to everyone from firsttime homeowners looking for an affordable place of their own to high-end buyers in search of resortstyle living. They have become an increasingly popular choice for Atlantans over the past decade as walkability became more top of mind and more condominiums were constructed. 1.4 times as many people bought condos in Metro Atlanta in 2022 than in 2012, shifting from 7% of all homes purchased in 2012 to 8% in 2022.
During the height of the pandemic, condominium sales slowed more than sales for single-family homes or townhomes, as many people sought extra space in a time of social distancing. They rebounded significantly in 2021 as vaccines rolled out and excitement for vibrant city living returned. In 2021, a record 7,205 condominiums sold in Metro Atlanta. In 2022, 5,545 condominiums were sold, down 23% year-over-year but still 3% higher
than the number of condominiums sold in 2019.
Like other home types, there were fewer condominiums in Q3 and Q4 2022 than there were in the first half of the year. There were the fewest condominiums sold in a 6-month period since 2015. Condominium buyers who are taking out mortgages may be more affected by rising interest rates than buyers of other home types, as the interest rate for a condominium is typically slightly higher.
The average condominium in Metro Atlanta sold for $323,036 in Q3 and Q4 2022, up 6.1% year-overyear. Prices for condominiums—like other types of homes— increased significantly over the past three years. The average condominium cost 20% ($53,297) more in late 2022 than it did in the same period in 2019.
Most condominiums in Metro Atlanta sold in late 2022 were priced under $500,000 (90%). Compared to the
Key Stats
Metro Atlanta Condominiums
(Q3 & Q4 2022)
• $323,036 average sale price (+6.1% YOY)
• 8% of all homes sold were condominiums
• Condominiums sold 2 days faster than average (23 days on market)
• Condominiums sold for 98.1% of the original list price on average
• Condominiums sold for more per square foot than any other home type, averaging $272/SF

2022 END OF YEAR ATLANTA MARKET INTELLIGENCE 61 ENGEL & VÖLKERS www.evatlanta.com
demand for condominiums in this entry-level price range, the number of homes for sale is limited. There were just 1.4 months of inventory for condominiums under $500,000 and they sold in three weeks on average, two to five weeks faster than higher priced condominiums.
Luxury condominiums (priced over $1 million) tend to feature high-end finishes, skyline views, and resortstyle building amenities. They make up a small share of the overall condominium market, with just 32 sales in Q3 and Q4 2022. With a smaller pool of potential buyers in the luxury segment, these homes tend to sell slower than lower priced homes, averaging 57 days on the market. Luxury condominiums have experienced the greatest decline in sales volume of any price point since the peak last summer, with
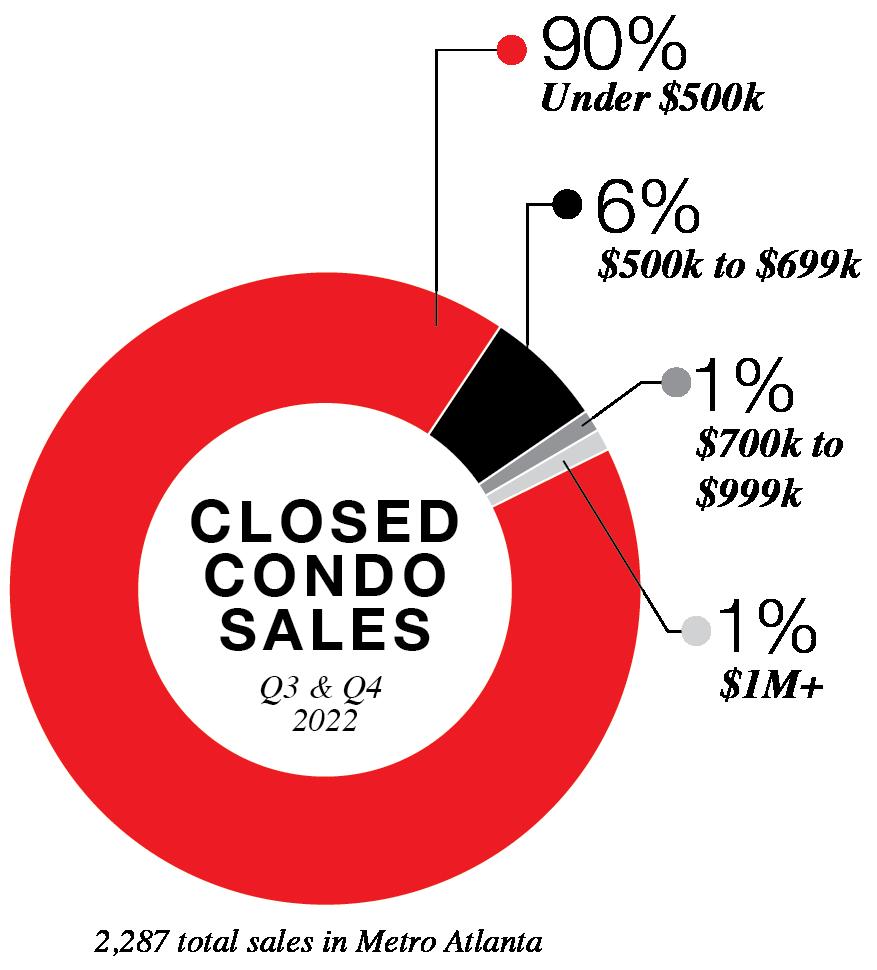
transactions down 56% since June 2022. However, they continue to sell near asking price, with an average sale price to original list price ratio of 96%.
Most condominiums are located in intown neighborhoods or near the town centers of suburban cities, offering a walkable lifestyle for residents. 64% of condominium sales in Q3 and Q4 2022 were ITP, and an even greater share of true condominiums were located intown, as many of the properties classified as condominiums in OTP locations are actually townhome condominiums.
InfoSparks, Greater Atlanta Area, Condominiums, Rolling 6-months as of December 2022 (year-over-year change compared to rolling 6-months as of December 2021)
2022 END OF YEAR ATLANTA MARKET INTELLIGENCE 62 ENGEL & VÖLKERS www.evatlanta.com Metro Atlanta City of Atlanta ITP Median Sale Price $277,000 p +10.8% $300,000 p +9.1% $290,000 p +7.4% average Sale Price $323,036 p +6.1% $361,690 p +5.5% $353,177 p +4.6% closed Sales 2,287 q -35.4% 1,344 q -41.1% 1,443 q -40.1% Pending Sales 2,059 q -37.1% 1,202 q -42.0% 1,285 q -41.2% active Listings 856 q -13.4% 595 q -21.8% 612 q -22.9% New Listings 2,983 q -22.7% 1,825 q -28.0% 1,938 q -26.8% average Sale Price to Original List Price Ratio 98.1% q -0.5% 97.8% q -0.2% 98.0% 0.0% Months of Inventory 1.7 0.0% 1.9 q -5.0% 1.9 q -5.0% average Days on Market 23 q -17.9% 26 q -23.5% 25 q -26.5%
Source: FMLS
Metro Atlanta Condominium Summary (Q3 & Q4 2022)
q Down YOY p Up YOY
Source: FMLS InfoSparks, Greater Atlanta Area, Condominiums, Rolling 6-months as of December 2022 (year-over-year change compared to rolling 6-months as of December 2021)
Source: FMLS InfoSparks, Greater Atlanta Area, Condominiums, Rolling 6-months as of December 2022 (year-over-year change compared to rolling 6-months as of December 2021)
q Down YOY p Up YOY
2022 END OF YEAR ATLANTA MARKET INTELLIGENCE 63 ENGEL & VÖLKERS www.evatlanta.com Less than $499,999 $500,000 to $699,999 $700,000 to $1 million Over $1 million closed Sales 2,069 q -36.2% 135 q -26.6% 36 q -42.9% 32 q -38.5% Pending Sales 1,834 q -38.5% 132 q -22.4% 51 q -28.2% 42 q -16.0% active Listings 603 q -16.7% 94 q -8.7% 59 q -13.2% 74 p +1.4% New Listings 2,446 q -26.7% 213 q -7.8% 119 q -3.3% 115 p +3.6% average Sale Price to Original List Price Ratio 98.3% q -0.4% 97.0% q -0.5% 96.5% p +0.5% 95.4% q -0.1% Months of Inventory 1.4 p +7.7% 3.2 q -3.0% 4.2 q -26.3% 7.5 q -24.2% average Days on Market 21 q -19.2% 37 q -28.8% 36 q -42.9% 57 q -24.0%
1-bedroom 2-bedroom 3-bedroom 4-bedroom Median Sale Price $240,000 p +6.7% $294,950 p +11.3% $328,875 p +9.6% $402,500 p +13.5% average Sale Price $253,527 p +8.3% $341,524 p +8.1% $409,697 q -6.3% $415,407 q -7.1% closed Sales 745 q -39.6% 1,202 q -33.8% 326 q -28.7% 14 q -58.8% Pending Sales 657 q -41.3% 1,080 q -35.8% 307 q -30.4% 15 q -51.6% active Listings 253 q -16.2% 426 q -17.4% 162 p +8.7% 16 q -23.8% New Listings 928 q -25.8% 1,522 q -24.5% 498 q -9.0% 35 q -22.2% average Sale Price to Original List Price Ratio 98.1% q -0.4% 98.3% q -0.2% 97.6% q -1.2% 95.2% q -3.9% Months of Inventory 1.6 p +6.7% 1.6 q -5.9% 2.4 p +20.0% 4.4 p +37.5% average Days on Market 22 q -24.1% 23 q -14.8% 21 q -30.0% 28 p +21.7%
Metro Atlanta Condominium Summary by Price Point (Q3 & Q4 2022)
Metro Atlanta Condominium Summary by Number of Bedrooms (Q3 & Q4 2022)
CondominiumsInside the Perimeter
Intown buyers were more likely to choose a condominium than the metro buyers on average. 25% of homes sold ITP in Q3 and Q4 2022 were condominiums compared to 8% of homes in Metro Atlanta.
Even with their relative popularity for intown buyers, the number of sales for intown condominiums were down 40% year-over-year in the second half of 2022, with 1,443 sales. This was a more significant slowdown than homes in Metro Atlanta in general (down 30% yearover-year) or all ITP homes (down 35% year-over-year).
Despite fewer sales, intown condominium prices continued to rise. The average sale price for an ITP condominium was $353,177 in late 2022, up 4.6% year-over-year, on par with the average annual home price growth in Metro Atlanta for the past 47 years. The price per square foot was up even higher, up 9.1% year-over-year. At an average of $312 per square foot, intown condominiums commanded a 15% premium compared to the average

price per square foot for all Metro Atlanta condominiums ($272 per square foot).
Smaller, more affordable ITP condominiums had the greatest price growth in late 2022. 1-bedroom and studio condominiums were up 7.4% year-over-year (selling for $259,347 on average) and 2-bedroom condominiums were up 6.6% (selling for $390,179 on average).
The majority of units sold ITP in Q3 and Q4 2022 were older. The average year built for condos sold during this period was 1986. Just 5% of sales were in buildings built in 2010 or later. This was down slightly from the first half of the year when 7% of sales were in these newer buildings, but a typical pre-pandemic share.
Most intown condominiums sold in late 2022 were less than 1,500 square feet (86%), a slightly higher share than in recent years (2 to 4% more). Condominiums less than 1,500 square feet were less expensive, but appreciated at a higher rate than larger condominiums (+7.9% year-over-year). This is related to the higher demand for these smaller and more affordable units. There were 1.6 months of
Key Stats ITP Condominiums
(Q3 & Q4 2022)
• $353,177 average sale price (+4.6% YOY)
• $312/SF (+9.1% YOY)
• 25% of all homes sold ITP were condominiums
• Condominiums sold 1 day faster than average (25 days on market)
• ITP condominiums sold for 98% of the original list price on average
• Average Year Built: 1986
• Buckhead had the most condominium sales of any ITP submarket (430 homes), followed by Midtown (262 homes)
inventory for ITP condominiums less than 1,500 square feet compared to 3.3 months of inventory for larger condominiums.
2022 END OF YEAR ATLANTA MARKET INTELLIGENCE 64 ENGEL & VÖLKERS www.evatlanta.com
Q3 + Q4 2022 ITP Condominium Superlatives
Most Expensive Area to Buy a Condominium ITP Ansley Park/Sherwood Forest ($543,385 average Q3/Q4 sale price)
Fastest Growing Average Condominium Price ITP
East Point (+96.0% Q3/Q4 average closed sale price in 2022 vs. 2021)
Highest Price Per Square Foot for Condominiums ITP Inman Park (Average $432/SF)
Shortest Average Days on Market ITP East Point (Average 1 day on the market)
Source: FMLS InfoSparks, Rolling 6-months as of December 2022
Where Can You Buy the Typical Condominium for...

Less than $300,000 $300,000 to $499,999
Avondale Estates
Brookhaven
Cascade East
Cascade West
Chastain Park
College Park
Decatur
Downtown
Hapeville
Peachtree Hills
Peoplestown/ Chosewood Park/ Lakewood Heights
West End/Adair
Park/Pittsburgh/
Sylvan Hills
Brookwood Hills
Buckhead
Cabbagetown
Collier Hills/Ardmore Park
Druid Hills/Emory
East Point
Edgewood
Garden Hills
Grant Park/Glenwood Park
Inman Park
Kirkwood
Lake Claire
Little Five Points
Midtown
Old Fourth Ward
Ormewood Park
Reynoldstown
Vinings
Virginia Highlands/Morningside
West Midtown/Underwood Hills
$500,000 to $699,999
Price brackets based on 6-month rolling average sale price in analyzed area as of December 2022 from FMLS
2022 END OF YEAR ATLANTA MARKET INTELLIGENCE 65 ENGEL & VÖLKERS www.evatlanta.com
Ansley Park/ Sherwood Forest
ITP Condominium Summary by Area - Q3 & Q4 2022
2022 END OF YEAR ATLANTA MARKET INTELLIGENCE 66 ENGEL & VÖLKERS www.evatlanta.com Area Number of Condos Sold in Q3 & Q4 Average Closed Sale Price Median Closed Sale Price Average PPSF Months of Inventory Average Days on Market Ansley Park/ Sherwood Forest 20 $543,385 p +21.1% $422,500 p +3.9% $381 p +15.8% 3.1 31 Avondale Estates 11 $233,364 p +31.6% $245,00 p +53.6% $187 p +27.2% 0.2 9 Brookhaven 56 $259,099 p +0.1% $250,000 p +10.9% $256 p +10.3% 0.9 14 Brookwood Hills 16 $368,125 p +36.6% $286,500 p +7.8% $292 p +17.7% 2.1 32 Buckhead 430 $379,171 p +1.8% $290,000 p +9.4% $296 p +8.4% 2.0 28 Cabbagetown 18 $473,244 p +14.1% $482,000 p +25.2% $354 p +5.4% 2.7 21 Cascade East 1 $135,000 p +82.1% $135,000 p +61.2% $119 p +105.2% 1.8 2 Cascade West 4 $210,775 q -10.7% $212,000 q -15.9% $140 p +12.9% 1.1 28 Chamblee 8 $293,863 p +7.7% $268,950 q -1.3% $263 p +1.9% 0.9 9 Chastain Park 10 $281,800 p +29.5% $220,000 p +9.7% $253 p +5.9% 1.2 28 College Park 3 $48,333 p +13.7% $45,000 p +5.9% $38 p +26.7% 1.2 7 Collier Hills/ Ardmore Park 38 $368,154 p +1.8% $322,500 q -3.0% $299 p +5.7% 1.4 23 Decatur 28 $285,152 +0.0% $265,000 p +5.0% $284 p +9.2% 1.5 32 Downtown 71 $280,946 q -1.0% $240,000 q -4.0% $291 p +6.6% 3.1 31 Druid Hills/ Emory 13 $338,377 q -28.1% $280,000 q -1.9% $282 q -1.4% 0.8 34 East Point 1 $312,050 p +96.0% $312,050 p +95.7% $223 p +97.3% 0.0 1 Edgewood 12 $337,721 q -15.0% $325,000 q -13.0% $315 p +7.5% 1.0 19
Source: FMLS InfoSparks, Condominiums, Rolling 6-months as of December 2022 (year-over-year change compared to rolling 6-months as of December 2021) q Down YOY p Up YOY s Below Condo Market Average r Above Condo Market Average w Equal to Condo Market Average
ITP Condominium Summary by Area - Q3 & Q4 2022
2022 END OF YEAR ATLANTA MARKET INTELLIGENCE 67 ENGEL & VÖLKERS www.evatlanta.com
Area Number of Condos Sold in Q3 & Q4 Average Closed Sale Price Median Closed Sale Price Average PPSF Months of Inventory Average Days on Market Garden Hills 24 $337,454 q -10.1% $255,500 q -8.8% $267 q -1.5% 1.4 29 Grant Park/ Glenwood Park 11 $367,682 p +5.8% $320,000 p +19.1% $350 p +8.4% 3.1 27 Hapeville 5 $217,980 p +20.1% $222,500 p +21.9% $169 p +16.6% 2.1 71 Inman Park 14 $398,707 q -2.0% $352,500 p +3.7% $432 p +12.5% 1.2 17 Kirkwood 12 $358,742 p +72.9% $375,750 p +127.7% $340 p +49.1% 1.8 36 Lake Claire/ Little Five Points 10 $320,635 p +33.7% $308,500 p +30.2% $328 p +15.1% 1.0 41 Midtown 262 $411,674 p +1.9% $350,000 p +7.3% $396 p +7.0% 1.8 24 Old Fourth Ward 64 $335,228 p +11.7% $310,000 p +6.9% $335 p +13.9% 1.1 26 Ormewood Park 4 $354,375 p +3.5% $355,000 q -1.4% $366 p +6.1% 0.0 5 Peachtree Hills 23 $266,003 p +5.7% $247,500 p +13.8% $247 p +8.3% 2.4 32 Peoplestown/ Chosewood Park/ Lakewood Heights 16 $241,313 q -13.0% $231,500 q -7.8% $256 q -1.9% 2.4 36 Reynoldstown 11 $389,364 p +8.8% $395,000 p +8.4% $377 p +14.6% 1.1 15 Vinings 55 $335,668 -0.2% $285,000 p +9.2% $238 p +4.4% 1.1 19 Virginia Highlands/ Morningside 47 $300,258 p +6.3% $270,000 p +5.5% $353 p +12.4% 1.3 19 West End/ Adair Park/ Pittsburgh/ Capitol View/ Sylvan Hills 11 $185,982 p +10.2% $160,000 p +0.0% $207 p +3.0% 4.3 24 West Midtown/ Underwood Hills 109 $379,718 p +18.6% $295,000 p +11.0% $317 p +16.1% 2.2 23 q Down YOY p Up YOY s Below Condo Market Average r Above Condo Market Average w Equal to Condo Market Average
New Construction Condominiums ITP
Most new construction condominium sales (56%) have been intown, typically in walkable neighborhoods where buyers can take advantage of the conveniences of city living. With 43 new condominiums sold ITP in late 2022, condos make up the smallest share of the ITP new home market (9% of new homes sold). In some cases, new construction sales are not recorded in FMLS and the actual number may be higher.
New condominiums ranged from $185,000 for the gut renovation of a historic 2-bedroom at Willow Park in Decatur to $8,250,000 for a 4-bedroom penthouse at Graydon Buckhead. Most were priced under $600,000 (60%), but the average sale price—$737,219 ($451 per square foot)—was skewed higher by a few luxury condominium sales.48
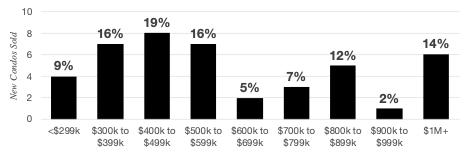
Most new condominiums sold in 2022 were located in high rises in Midtown, West Midtown, or Buckhead. These buildings typically completed construction in 2020 or

New Construction Condominiums Sold ITP - Q3 & Q4 2022
2021. These included 40 West 12th , 788 West, J5, Graydon Buckhead, and The Atlantic. The Dillon is also pre-selling luxury units in a high rise building under construction in Buckhead that is expected to be completed in 2024.
The number of cranes in the sky around Midtown and Buckhead are not a sign of more condominiums on the way. Almost all of these are for apartments or commercial projects. New condominiums completed in 2022 or currently under construction have trended toward smaller
buildings in east side neighborhoods like Old Fourth Ward, Grant Park, Virginia Highlands, Edgewood, and Decatur rather than high rises in the core. Most are four stories or less with 40 units or fewer. They offer a lock-and-leave lifestyle with new construction in quieter residential neighborhoods. In many ways a return to Atlanta’s traditional, smaller multifamily buildings of the early 1900s, but with modern designs, floorplans, and amenities.
2022 END OF YEAR ATLANTA MARKET INTELLIGENCE 68 ENGEL & VÖLKERS www.evatlanta.com
Source: FMLS, ITP, New Construction Condominiums, Rolling 6-months as of December 2022
Condominiums - Outside the Perimeter
Most of the condominiums sold in Q3 and Q4 were located intown, but condo living has a place in the suburbs as well. About 37% of condominiums were sold OTP in late 2022. In many cases, properties classified as condominiums OTP are townhome condominiums rather than traditional, singlelevel condominiums in multifamily buildings.
Traditional condominiums OTP are typically located in mid-rise buildings in the town centers of places like Sandy Springs, Dunwoody, Cumberland, Alpharetta, Woodstock, along with some low-rise buildings in places like Stonecrest.
Condominiums outside the perimeter are typically more affordable and slightly larger than intown condominiums.
Key
Stats
OTP
Condominiums (Q3 & Q4 2022)
• 37% of all condominium sales were OTP
• 29% of all condominium listings were OTP
2022 END OF YEAR ATLANTA MARKET INTELLIGENCE 69 ENGEL & VÖLKERS www.evatlanta.com
Q3 + Q4 2022 OTP Condominium Superlatives
Most Expensive Area to Buy a Condominium OTP
Fastest Growing Average Condominium Price OTP
Highest Price Per Square Foot for Condominiums OTP
Shortest Average Days on Market OTP
Suwanee ($544,000 average Q3/Q4 sale price)
McDonough (+119.2% Q3/Q4 average closed sale price in 2022 vs. 2021)
Chattahoochee Hills ($591 per square foot)

Chattahoochee Hills (Average 1 day on market)
Where Can You Buy the Typical Condominium for...
Less than $300,000 $300,000 to $499,999
Clarkston
Douglasville
East Cobb
Fayetteville
Lawrenceville
Mableton
Marietta
Norcross
Peachtree City
Peachtree Corners
Sandy Springs
Smyrna
Snellville
South Fulton
Tucker
Acworth
Alpharetta
Canton
Cumming
Duluth
Dunwoody
Johns Creek
Kennesaw
McDonough
Milton
Roswell
Chattahoochee Hills
Suwanee
2022 END OF YEAR ATLANTA MARKET INTELLIGENCE 70 ENGEL & VÖLKERS www.evatlanta.com
$500,000 to $699,999
Source: FMLS InfoSparks, Rolling 6-months as of December 2022
OTP Condominium Summary by Area - Q3 & Q4 2022
2022 END OF YEAR ATLANTA MARKET INTELLIGENCE 71 ENGEL & VÖLKERS www.evatlanta.com Area Number of Condos Sold in Q3 & Q4 Average Closed Sale Price Median Closed Sale Price Average PPSF Months of Inventory Average Days on Market Acworth 7 $344,643 p +8.1% $345,000 p +5.0% $201 p +12.3% s 0.3 s 9 Alpharetta 59 $399,936 p +15.0% $400,000 p +31.0% $280 p +23.9% s 1.1 s 21 Canton 5 $328,400 p +39.6% $350,000 p +50.9% $217 p +17.9% s 0.3 s 14 Chattahoochee Hills 1 $505,000 p +23.9% $505,000 p +23.9% $591 p +53.9% s 0.3 s 1 Clarkston 1 $29,000 -66.3% $29,000 -66.3% $20 -77.8% r 5.6 r 33 Cumming 39 $432,891 p +16.8% $400,000 p +12.7% $238 p +9.2% r 3.2 s 19 Douglasville 4 $245,000 -3.8% $240,000 -21.3% $152 p +6.3% w 1.7 r 47 Duluth 24 $322,381 p +43.6% $304,375 p +50.3% $196 p +31.5% r 2.0 s 22 Dunwoody 29 $334,381 p +24.9% $325,000 p +26.2% $266 p +23.7% w 1.7 s 10 East Cobb 71 $294,220 p +18.0% $265,000 p +18.3% $209 p +14.2% s 1.2 s 19 Fayetteville 1 $235,000 p +32.4% $235,000 p +32.4% $151 p +10.2% s 0.2 s 7 Johns Creek 5 $356,200 p +59.4% $375,000 p +108.3% $216 p +2.4% s 1.1 s 16 Kennesaw 15 $371,553 p +22.8% $349,000 p +22.5% $194 p +14.1% s 1.6 s 19 Lawrenceville 6 $291,650 p +12.4% $330,000 p +28.2% $191 p +40.4% s 1.5 r 30 Mableton 1 $240,000 p +30.7% $240,000 p +56.1% $135 p +17.4% s 0.0 s 2 Marietta 101 $274,363 p +15.9% $259,999 p +20.2% $194 p +16.2% s 1.0 s 19 McDonough 1 $415,000 p +119.2% $415,000 p +119.2% $230 p +84.0% s 0.5 r 91
FMLS InfoSparks, Condominiums, Rolling 6-months as of December 2022 (year-over-year change compared to rolling 6-months as of December 2021) q Down YOY p Up YOY s Below Condo Market Average r Above Condo Market Average w Equal to Condo Market Average
Source:
OTP Condominium Summary by Area - Q3 & Q4 2022 (Continued)
2022 END OF YEAR ATLANTA MARKET INTELLIGENCE 72 ENGEL & VÖLKERS www.evatlanta.com Area Number of Condos Sold in Q3 & Q4 Average Closed Sale Price Median Closed Sale Price Average PPSF Months of Inventory Average Days on Market Milton 5 $307,400 q -33.4% $295,000 q -7.8% $240 p +4.3% s 1.2 r 38 Norcross 14 $201,071 p +12.1% $186,000 p +6.3% $157 p +16.3% r 1.9 s 20 Peachtree City 3 $219,800 p +14.2% $214,500 p +11.4% $173 q -4.4% s 0.1 s 10 Peachtree Corners 22 $259,250 p +26.5% $242,500 p +24.5% $175 p +15.9% s 1.0 s 14 Roswell 40 $333,380 p +19.8% $274,000 p +17.6% $250 p +16.3% s 1.1 s 15 Sandy Springs 129 $236,110 p +19.9% $236,000 p +27.6% $217 p +14.8% s 1.2 s 19 Smyrna 67 $271,155 p +16.9% $260,900 p +13.4% $203 p +11.5% s 0.6 s 13 Snellville 1 $210,000 q -25.0% $210,000 q -25.0% $179 p +27.0% s 0.0 s 5 South Fulton 3 $74,667 N/A $60,000 N/A $68 N/A s 0.0 r 90 Suwanee 1 $544,000 p +19.5% $544,000 p +16.5% $242 p +19.2% s 1.5 s 5 Tucker 27 $190,915 p +14.7% $190,000 p +18.8% $167 p +24.6% s 1.2 s 19 Union City 7 $130,629 q -2.1% $130,000 q -5.5% $112 p +8.7% r 2.7 s 19 Woodstock 18 $385,097 p +7.9% $391,750 p +7.3% $232 q -4.5% r 2.1 s 12
q Down YOY p Up YOY s Below Condo Market Average r Above Condo Market Average w Equal to Condo Market Average
New Construction Condominiums OTP
There were 76 new construction condominiums sold in Metro Atlanta in Q3 and Q4 2022. Nearly half of new condominiums were located outside the perimeter; however, many of the homes categorized as condominiums OTP are townhome condominiums. The only new construction, true condominiums OTP sales included Bentley Ridge (Marietta), The Maxwell (Alpharetta),
Atley (Alpharetta), and Gatherings at Herrington (Cumming) (active adult community), with 20 total sales in these communities, averaging $485,585. The most expensive new condominium sold OTP in late 2022 was a 3-bedroom, age restricted unit at the Gatherings at Herrington in Cumming, which sold for $560,000. There were no new construction, true condominiums sold in other OTP locations in late 2022.
2022 END OF YEAR ATLANTA MARKET INTELLIGENCE 73 ENGEL & VÖLKERS www.evatlanta.com

Submarket Profiles
See what’s happening in your neighborhood or the area you have your eye on, including recent market trends and upcoming development.

2022 End-of-Year Market Intelligence Report
Metro Atlanta Markets
This section has a quick reference guide for each submarket in Metro Atlanta. It includes key metrics for each housing market overall, singlefamily homes, townhomes, and condominiums. Atlanta is a city of many neighborhoods. To organize

them, neighborhoods inside the perimeter are grouped as Midtown, Buckhead, Downtown, Brookhaven/ Chamblee, ITP Northwest, ITP Northeast, ITP Southwest, and ITP Southeast. Data for each of the 11 counties in Metro Atlanta
Intown Submarkets
• Midtown (page 78)
• Buckhead (page 79)
• Downtown (page 80)
• Brookhaven/Chamblee (page 81)
• ITP Northwest (page 82)
• ITP Northeast (page 83)
• ITP Southwest (page 84)
• ITP Southeast (page 85)
is also provided, including Fulton, Cobb, Cherokee, Clayton, DeKalb, Douglas, Fayette, Forsyth, Gwinnett, Henry, and Rockdale Counties. North Georgia counties are included in the next section.
Metro Atlanta Counties
• Fulton (page 86)
• Cobb (page 87)
• Cherokee (page 88)
• Clayton (page 89)
• DeKalb (page 90)
• Douglas (page 91)
• Fayette (page 92)
• Forsyth (page 93)
• Gwinnett (page 94)
• Henry (page 95)
• Rockdale (page 96)
2022 END OF YEAR ATLANTA MARKET INTELLIGENCE 76 ENGEL & VÖLKERS www.evatlanta.com
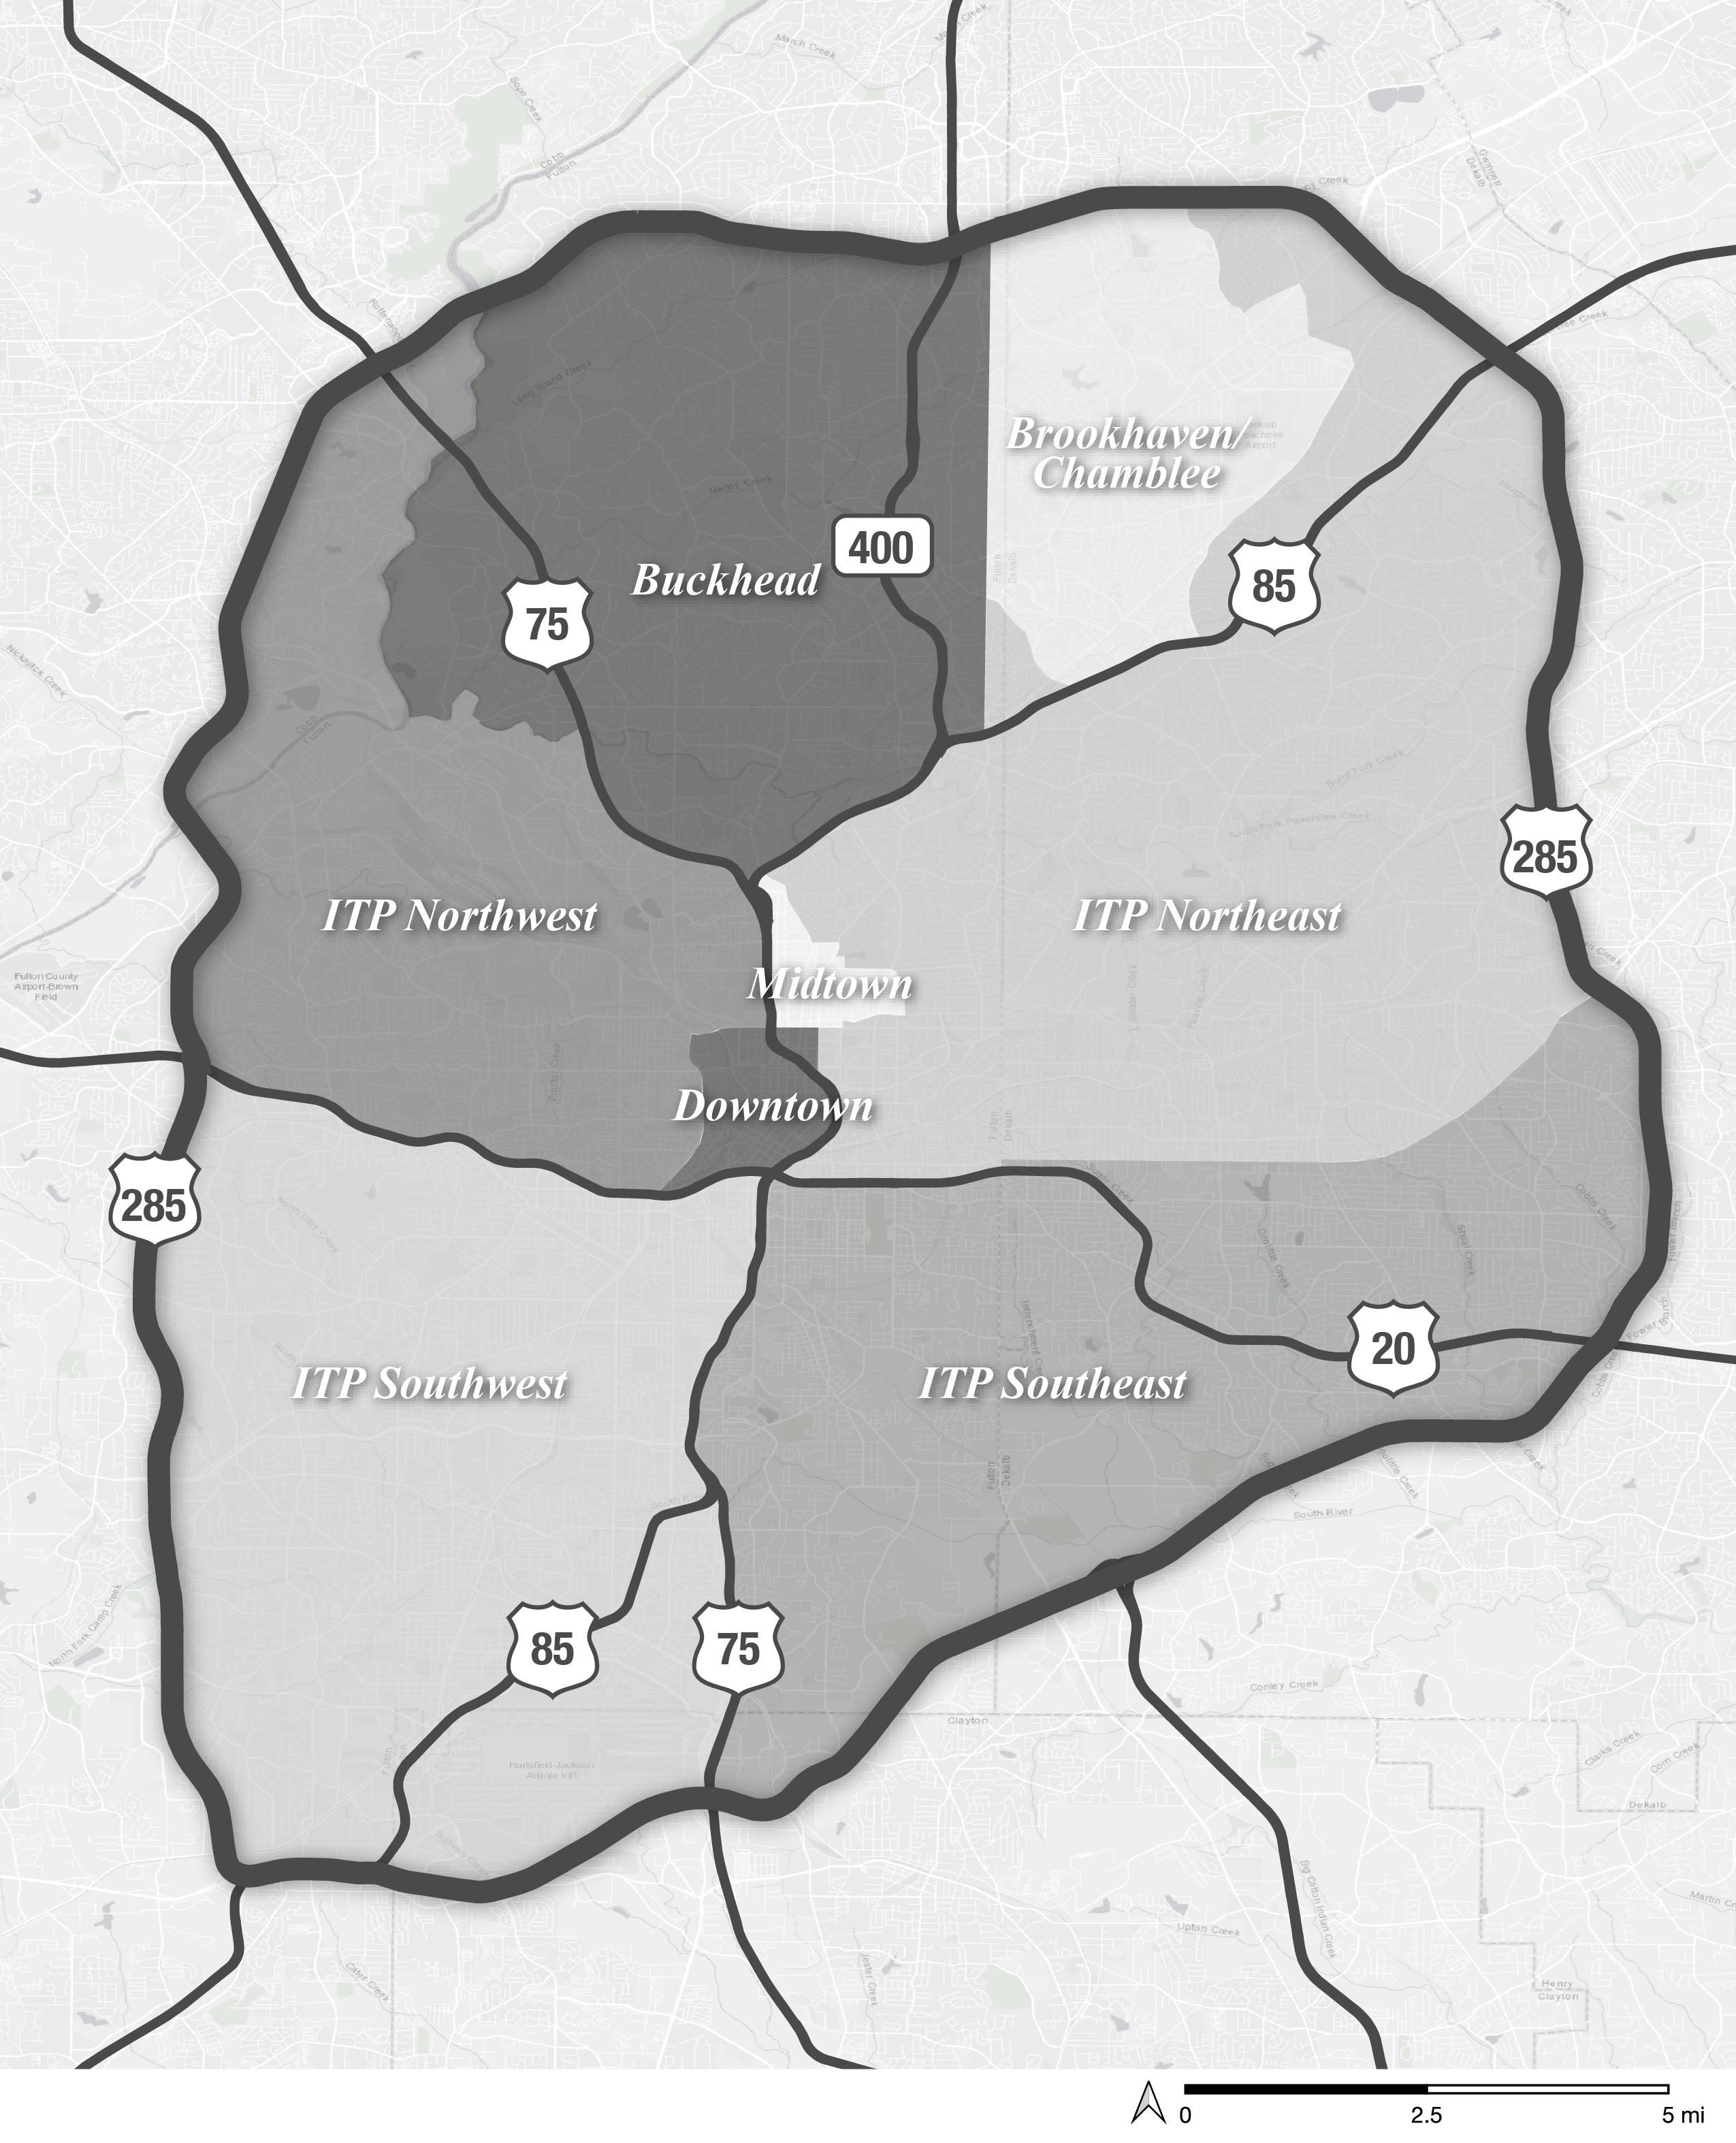
2022 END OF YEAR ATLANTA MARKET INTELLIGENCE 77 ENGEL & VÖLKERS www.evatlanta.com ITP Submarkets Map
Midtown
With Piedmont Park, Georgia Tech, plenty of restaurants, major events, the BeltLine, and thousands of jobs within walking distance, living in Midtown is a lifestyle decision for those looking for vibrant city living. Its central location and great transit access make it easy to get to many places in Metro Atlanta.

Most homes in Midtown are condominiums, ranging from older low-rise buildings to luxury high rises with skyline views. Compared to many major cities, an average sale price of $411,674 makes owning
a condo in the heart of the city relatively attainable. In the eastern part of Midtown— the Garden District— single-family homes and townhomes offer lower density housing close to the action, often commanding some of the highest prices in the city, with single-family homes often selling over $1 million.
More than $3 billion in development projects are underway in the growing district. Plans include the Winship Cancer Center at Emory Hospital Midtown, office towers like Spring Quarter and the Campanile
expansion, and several apartment buildings and student housing with ground floor retail. Street design projects, the Art Walk, and small parks and plazas are also planned to enhance Midtown’s public realm.
Source: FMLS InfoSparks, Midtown, Rolling 6-months as of December 2022 (year-over-year change compared to rolling 6-months as of December 2021)
2022 END OF YEAR ATLANTA MARKET INTELLIGENCE 78 ENGEL & VÖLKERS www.evatlanta.com
Overall
Townhomes Condos Median Sale Price $368,000 p +10.0% $1,025,000 p +18.0% $681,500 p +45.8% $350,000 p +7.3% average Sale Price $458,057 p +9.0% $1,193,869 p +32.7% $716,740 p +49.6% $411,674 p +1.9% average Price Per Square Foot $396 p +7.6% $402 p +15.2% $391 p +13.7% $396 p +7.0% closed Sales 285 q -43.5% 13 0.0% 10 q -54.5% 262 q -44.1% Pending Sales 261 q -42.4% 12 0.0% 10 q -52.4% 239 q -43.1% active Listings 130 q -11.6% 11 p +450.0% 4 q -42.9% 115 q -16.1% New Listings 397 q -25.5% 24 p +50.0% 13 q -48.0% 360 q -26.8% average Sale Price to Original List Price Ratio 97.7% 0.0% 93.6% q -3.6% 96.3% p +0.1% 97.9% p +0.1% Months of Inventory 1.9 p +5.6% 3.0 p +400.0% 1.5 q -31.8% 1.8 0.0% average Days on Market 24 q -31.4% 29 p +45.0% 21 q -27.6% 24 q -33.3% Midtown Market Summary (Q3 & Q4 2022) q Down YOY p Up YOY METRO ATLANTA
Single-Family Homes
Buckhead
Buckhead is a collection of neighborhoods in northern Atlanta including the mostly residential areas of Brookwood, Ardmore Park, Collier Hills, West Paces Ferry, Chastain Park, Lindbergh, Garden Hills, and Peachtree Hills. The Buckhead Village, North Buckhead, and Lenox areas offer a mix of high-rise condominiums, shops and restaurants, office towers, and hotels.
The Buckhead area is popular for homeowners looking for tree-lined streets, traditional architecture,

convenience, and often highend homes. Most neighborhoods have access to greenspace within walking distance, ranging from small neighborhood parks to Chastain Park, Bobby Jones Golf Course, and the Northwest BeltLine.
Although most of the land in Buckhead is dedicated to singlefamily homes (often on large lots), most of the homes sold in late 2022 were condominiums, typically found along primary streets like Peachtree Street or near Buckhead Village and Lindbergh.
Several projects are planned in Buckhead, including expansions at The Shepherd Center and Phipps Plaza, The Dillon condominiums, several new apartment buildings, and extensions of the BeltLine and PATH 400 trail.
Source: FMLS InfoSparks, Buckhead, Rolling 6-months as of December 2022 (year-over-year change compared to rolling 6-months as of December 2021)
2022 END OF YEAR ATLANTA MARKET INTELLIGENCE 79 ENGEL & VÖLKERS www.evatlanta.com
Overall
Townhomes Condos Median Sale Price $595,000 p +10.4% $1,210,000 p +11.0% $548,638 p +9.3% $290,000 p +9.4% average Sale Price $869,343 p +5.9% $1,483,376 p +6.1% $619,075 p +11.3% $378,872 p +1.7% average Price Per Square Foot $314 p +9.4% $354 p +9.9% $265 p +9.1% $296 p +8.4% closed Sales 985 q -38.6% 405 q -38.3% 149 q -40.6% 431 q -38.1% Pending Sales 869 q -38.9% 350 q -36.7% 134 q -41.5% 385 q -39.8% active Listings 503 q -20.4% 240 q -8.4% 59 q -7.8% 204 q -33.3% New Listings 1,409 q -25.4% 610 q -21.7% 222 q -17.8% 577 q -31.4% average Sale Price to Original List Price Ratio 96.8% q -0.3% 95.9% q -0.9% 97.1% q -1.0% 97.5% p +0.4% Months of Inventory 2.3 p +4.5% 2.8 p +33.3% 2.1 p +50.0% 2.0 q -23.1% average Days on Market 27 q -25.0% 27 q -12.9% 24 q -22.6% 28 q -33.3%
q Down YOY p Up YOY METRO
Single-Family Homes
Buckhead Market Summary (Q3 & Q4 2022)
ATLANTA
Downtown
Downtown Atlanta is anchored by the Georgia State Capitol, Georgia State University, and event venues like the Mercedes-Benz Stadium and Georgia World Congress Center. It is home to thousands of office workers, dozens of hotels, and residents who take advantage of its central location and affordable housing costs. Most homes Downtown are condominiums or apartments, with some townhomes along the edges. Downtown has multiple MARTA stations and easy highway access, making it well connected to the rest of the region.
Several ongoing and planned projects could shift momentum Downtown in the coming years. Newport has been gradually restoring historic buildings in South Downtown and has announced plans for adjacent new development featuring 650 apartments and ground floor retail. At the Gulch, the first phase of Centennial Yards is underway, with a 291-room hotel and a 300-unit apartment building. A total of 8 million square feet of development are planned for the site. Nearby, another 973-room hotel is being constructed by Hilton. Several office to residential conversions are in the
works at buildings like The Grant Building and 2 Peachtree Street. Infrastructure projects like major renovations to Five Points MARTA
redesigns, and The
over part of The
Source: FMLS InfoSparks, Downtown, Rolling 6-months as of December 2022 (year-over-year change compared to rolling 6-months as of December 2021)
2022 END OF YEAR ATLANTA MARKET INTELLIGENCE 80 ENGEL & VÖLKERS www.evatlanta.com
Overall Single-Family Homes Townhomes Condos Median Sale Price $247,500 q -3.3%$645,000 p +19.1% $240,000 q -4.0% average Sale Price $299,753 q -1.1%$566,800 p +9.9% $280,946 q -1.0% average Price Per Square Foot $290 p +7.0%$284 p +14.5% $291 p +6.6% closed Sales 76 q -57.8%5 q -66.7% 71 q -57.0% Pending Sales 79 q -52.1%5 q -16.7% 74 q -53.5% active Listings 63 q -16.0%2 p 0.0% 61 q -16.4% New Listings 148 q -26.7%6 p +50.0% 142 q -28.3% average Sale Price to Original List Price Ratio 97.0% q -1.3%97.6% q -2.7% 96.9% q -1.2% Months of Inventory 3.1 p +10.7%1.4 p +133.3% 3.1 p +6.9% average Days on Market 30 q -16.7%15 q -28.6% 31 q -16.2% Downtown Market Summary (Q3 & Q4 2022) q Down YOY p Up YOY METRO ATLANTA
Station, street
Stitch—a cap
Connector— are also in design.
park
Brookhaven/ Chamblee
Brookhaven and Chamblee are intown cities in northeast Atlanta. Brookhaven is known for Ogelthorpe University, great parks and trails, a growing downtown, and familyfriendly neighborhoods with mostly single-family homes and townhomes. Next door, Chamblee is known for its rail-oriented downtown, antique shops, and one of the best selections of international restaurants on Buford Highway. It has a mix of single-family homes on large lots,
townhomes, and condominiums, often at a more afforable price point. Both downtowns have their own MARTA rail stations, offering convenient commute options.

Upcoming projects will bring more jobs and residents to this area. Children’s Hospital of Atlanta is expanding just south of Brookhaven, a mixed-use film studio campus is being constructed at Assembly, in nearby Doraville, and commercial
projects like a 236,000 SF logistics park have been announced. Both cities are investing in their downtowns with projects like new city halls and trail expansions. Several apartment buildings are planned, as well as new townhomes and a small condominium building.
2022 END OF YEAR ATLANTA MARKET INTELLIGENCE 81 ENGEL & VÖLKERS www.evatlanta.com
Source: FMLS InfoSparks, Brookhaven/Chamblee, Rolling 6-months as of December 2022 (year-over-year change compared to rolling 6-months as of December 2021)
Overall Single-Family Homes Townhomes Condos Median Sale Price $654,000 p +13.0% $775,000 p +5.6% $580,000 p +5.5% $260,000 p +3.6% average Sale Price $746,738 p +9.8% $923,834 p +4.5% $579,617 p +4.1% $288,676 p +7.2% average Price Per Square Foot $288 p +10.3% $308 p +8.8% $254 p +8.5% $258 p +8.4% closed Sales 465 q -33.9% 290 q -25.6% 99 q -42.1% 76 q -46.5% Pending Sales 395 q -39.7% 248 q -30.7% 84 q -50.0% 63 q -51.2% active Listings 159 q -15.0% 105 q -10.3% 29 q -29.2% 15 q -48.2% New Listings 611 q -18.8% 411 q -6.6% 119 q -32.0% 81 q -40.1% average Sale Price to Original List Price Ratio 97.3% q -1.1% 96.6% q -1.5% 98.0% q -1.0% 98.9% p +0.1% Months of Inventory 1.7 p +21.4% 2.1 p +23.5% 1.3 p +18.2% 0.9 q -25.0% average Days on Market 22 q -21.4% 25 q -7.4% 24 q -29.4% 15 q -37.5%
q Down YOY p Up YOY
Brookhaven/Chamblee Market Summary (Q3 & Q4 2022)
METRO ATLANTA
ITP Northwest
The ITP Northwest area includes neighborhoods like Atlantic Station, Home Park, West Midtown, Underwood Hills, Bankhead, Grove Park, West Highlands, Riverside, Bolton, Vine City, English Avenue, Atlanta University Center, Vinings, and Cumberland. These neighborhoods offer everything from walkable, urban lifestyles and destination restaurants in places like West Midtown and Atlantic Station to quiet residential pockets in places like Underwood Hills and Grove Park. With the recently opened
Westside Park, this area now boasts the largest park in Atlanta, as well as trails like Proctor Creek Greenway and the BeltLine. Homeowners in ITP Northwest can choose from single-family homes, townhomes, or condominiums. This area has been one of the hotspots for new townhome construction in Atlanta, offering low-maintenance living in a convenient location.
ITP Northwest has had a lot of new development in the past few years and there is more on the way. Plans
include Georgia Tech’s 18-acre innovation district (Science Square), a 19-acre mixed use campus at Echo Street West, adaptive reuse at Westside Paper, several townhome and apartment projects, and the Northwest BeltLine trail.
Source: FMLS InfoSparks, ITP Northwest, Rolling 6-months as of December 2022 (year-over-year change compared to rolling 6-months as of December 2021)
2022 END OF YEAR ATLANTA MARKET INTELLIGENCE 82 ENGEL & VÖLKERS www.evatlanta.com
Overall
Homes Townhomes Condos Median Sale Price $399,450 p +14.8% $417,500 p +14.4% $445,000 p +11.3% $288,000 p +17.6% average Sale Price $445,481 p +11.6% $465,684 p +10.3% $476,358 p +9.6% $356,048 p +15.4% average Price Per Square Foot $251 p +10.1% $235 p +5.4% $251 p +13.6% $286 p +14.4% closed Sales 816 q -29.4% 388 q -32.3% 253 q -19.9% 175 q -34.5% Pending Sales 695 q -34.2% 349 q -31.3% 201 q -29.2% 145 q -45.1% active Listings 424 p +24.7% 250 p +26.3% 102 p +50.0% 72 q -4.0% New Listings 1,263 q -8.9% 746 q -0.8% 298 q -8.6% 219 q -28.9% average Sale Price to Original List Price Ratio 97.2% q -1.4% 95.1% q -2.8% 99.2% q -1.1% 98.7% p +0.5% Months of Inventory 2.7 p +58.8% 3.2 p +60.0% 2.2 p +100.0% 2.0 p +17.6% average Days on Market 25 0.0% 27 p +17.4% 24 0.0% 22 q -31.3%
Single-Family
q Down YOY p Up YOY METRO ATLANTA
ITP Northwest Market Summary (Q3 & Q4 2022)
ITP Northeast
The ITP Northeast area includes neighborhoods like Virginia Highlands, Morningside-Lenox Park, Old Fourth Ward, Inman Park, Candler Park, Cabbagetown, Reynoldstown, Edgewood, Kirkwood, Decatur, Oakhurst, Avondale Estates, Scottdale, and Northlake. These neighborhoods are mostly residential, with neighborhood shops and restaurants and employment anchors like Emory University and the Centers for Disease Control. They have a mix of single-family homes—from the cottages of Cabbagetown
to luxury homes in Morningside and ranch-style homes in North Decatur— as well as townhomes and condominiums throughout. These neighborhoods are big on front porches, walkability, local businesses, and plenty of charm. The Eastside BeltLine, Freedom Park, and smaller parks and trails are favorite local amenities. The east-west MARTA rail line, I-20, and I-285 offer regional access.
Planned development includes the mixed-use Ponce & Ponce project, a 55,000 SF expansion of
the Krog Street district, multiple apartment buildings, and several townhome communities and smallscale condominiums. A massive redevelopment concept has also been proposed for the North DeKalb Mall.
Source: FMLS InfoSparks, ITP Northeast, Rolling 6-months as of December 2022 (year-over-year change compared to rolling 6-months as of December 2021)

2022 END OF YEAR ATLANTA MARKET INTELLIGENCE 83 ENGEL & VÖLKERS www.evatlanta.com
Overall Single-Family Homes Townhomes Condos Median Sale Price $562,500 p +12.5% $665,000 p +9.0% $556,500 p +12.8% $287,500 p +6.6% average Sale Price $653,180 p +11.2% $787,826 p +8.6% $582,322 p +14.6% $323,445 p +7.7% average Price Per Square Foot $304 p +10.5% $314 p +9.0% $274 p +14.2% $304 p +10.9% closed Sales 2,133 q -33.1% 1,291 q -30.0% 401 q -36.9% 441 q -37.7% Pending Sales 1,791 q -37.3% 1,094 q -33.5% 317 q -45.5% 380 q -39.8% active Listings 778 q -5.6% 505 p +5.4% 143 q -16.9% 130 q -24.9% New Listings 2,731 q -19.9% 1,713 q -16.8% 487 q -23.7% 531 q -25.4% average Sale Price to Original List Price Ratio 97.9% q -0.7% 97.4% q -1.0% 98.8% q -0.5% 98.5% q -0.1% Months of Inventory 1.8 p +20.0% 2.0 p +33.3% 1.7 p +21.4% 1.4 0.0% average Days on Market 25 0.0% 25 p +8.7% 28 q -3.4% 22 q -12.0%
q Down YOY p Up YOY METRO
ITP Northeast Market Summary (Q3 & Q4 2022)
ATLANTA
ITP Southwest
The ITP Southwest area includes neighborhoods like West End, Adair Park, Pittsburgh, Capitol View, Oakland City, Sylvan Hills, Westwood Terrace, Cascade, Venetian Hills, Greenbriar, East Point, and College Park. It is anchored by Downtown to the north and the world’s busiest airport to the south. This area is primarily residential, with commercial areas like the Mall at West End and the historic main street districts of East Point and College Park. Residents enjoy amenities like the Westside BeltLine trail, Cascade Springs
Nature Preserve, Lionel Hampton Park, and smaller neighborhood parks. Most homes in this area are single-family homes, including craftsman bungalows, charming tudors, and mid-century ranches. Townhomes and condominiums are also available.
Most of the planned in this area is concentrated in West End and around the BeltLine, along Campbellton Road, or in the cities of East Point and College Park. It includes expansions of the Mall at West End and the Lee + White
ITP Southwest Market Summary (Q3 & Q4 2022)
district, the mixed-use Murphy Crossing project with 180,000 SF retail and 150,000 SF office/light industrial, 79,000 SF of commercial space at East Point Commons, and several townhome developments and apartment buildings.
Source: FMLS InfoSparks, ITP Southwest, Rolling 6-months as of December 2022 (year-over-year change compared to rolling 6-months as of December 2021)
2022 END OF YEAR ATLANTA MARKET INTELLIGENCE 84 ENGEL & VÖLKERS www.evatlanta.com
Overall Single-Family Homes Townhomes Condos Median Sale Price $303,075 p +7.9% $320,000 p +8.1% $245,000 p +7.5% $175,000 p +15.9% average Sale Price $329,800 p +12.2% $344,081 p +13.3% $250,468 q -3.0% $205,955 p +37.3% average Price Per Square Foot $204 p +11.3% $207 p +11.3% $163 p +2.5% $223 p +42.0% closed Sales 652 q -30.3% 566 q -30.6% 58 q -32.6% 28 q -17.6% Pending Sales 604 q -30.9% 523 q -32.3% 53 q -28.4% 28 p +3.7% active Listings 456 p +38.6% 418 p +41.7% 22 q -4.4% 16 p +45.5% New Listings 1,351 p +4.3% 1,230 p +5.9% 75 q -19.4% 46 p +12.9% average Sale Price to Original List Price Ratio 95.8% q -2.9% 95.5% q -3.1% 99.2% q -0.5% 96.7% q -1.4% Months of Inventory 3.4 p +61.9% 3.5 p +66.7% 2.0 p +25.0% 3.0 p +30.4% average Days on Market 27 p +12.5% 28 p +16.7% 15 q -50.0% 30 p +11.1%
q Down YOY p Up YOY
METRO ATLANTA
ITP Southeast
The ITP Southeast area includes neighborhoods like Grant Park, Glenwood Park, Summerhill, Peoplestown, Chosewood Park, Ormewood Park, South Atlanta, Lakewood, Hapeville, Mountain View, East Atlanta Village, Gresham Park, Panthersville, CandlerMcAfee, and Belvedere Park. It is a primarily residential area, with commercial development along major corridors like Memorial Drive and small neighborhood corner stores throughout. Most of the housing is single-family homes and many neighborhoods have some of
the most affordable prices for intown single-family homes at an average price below $400,000. These neighborhoods tend to have larger lots and mature trees, offering quiet surroundings close to the city.
Much of the new development planned for this area is centered around the upcoming Southeast BeltLine trail, along Memorial Drive, or near Hapeville. Proposed projects include the 40-acre Chosewood Park Village mixed-use site, a number of townhome projects (for sale and for rent), a few small-scale
condominiums, several apartment buildings, and the 90-acre Victory Landing logistics facility near the airport.
Source: FMLS InfoSparks, ITP Southeast, Rolling 6-months as of December 2022 (year-over-year change compared to rolling 6-months as of December 2021)
2022 END OF YEAR ATLANTA MARKET INTELLIGENCE 85 ENGEL & VÖLKERS www.evatlanta.com
Overall Single-Family Homes Townhomes Condos Median Sale Price $350,000 p +5.9% $350,000 p +3.2% $409,900 p +16.2% $255,000 p +16.3% average Sale Price $385,404 p +5.0% $387,273 p +3.6% $410,786 p +9.9% $265,729 q -5.6% average Price Per Square Foot $238 p +5.3% $236 p +4.0% $245 p +15.6% $252 p +2.0% closed Sales 817 q -37.0% 629 q -37.3% 147 q -29.7% 41 q -51.2% Pending Sales 745 q -39.3% 593 q -37.5% 114 q -48.6% 38 q -33.3% active Listings 502 p +30.1% 419 p +36.5% 66 p +10.0% 17 q -10.5% New Listings 1,496 q -10.5% 1,246 q -6.6% 183 q -31.2% 67 q -4.3% average Sale Price to Original List Price Ratio 96.6% q -2.5% 95.9% p +2.7 99.0% q -2.1% 97.9% q -2.5% Months of Inventory 2.8 p +64.7% 2.9 p +70.6% 2.3 p +35.3% 2.4 p +33.3% average Days on Market 27 p +17.4% 27 p +22.7% 27 p +8.0% 23 q -4.2%
q Down YOY p Up YOY METRO
ITP Southeast Market Summary (Q3 & Q4 2022)
ATLANTA
Fulton County
Fulton County is the most populated county in Metro Atlanta with more than 1 million residents. It includes Atlanta, Alpharetta, Milton, Johns Creek, Roswell, Sandy Springs, East Point, College Park, Union City, South Fulton, Fairburn, Chattahoochee Hills, and Palmetto. (Check out the intown sections above for more information on what’s happening ITP in Fulton County!)
North Fulton County has more dense suburban development, with subdivisions stretching almost
continuously across the county. South Fulton County has a mix of suburban development and rural areas, particularly toward Chattahoochee Hills, which has adopted a conservation approach to development. Most homes are single-family, with condominiums and townhomes closer to town centers.
There is a ton of development planned for Fulton County, including single-family home and townhome communities in areas like Alpharetta;
the mixed-use Continuum development in Alpharetta with more than 1.5 million SF commercial space; custom estate homes in Milton; the 42-acre Medley and Johns Creek Town Center mixeduse district; shopping center retrofits in Sandy Springs; the next phase of Serenbe in Chattahoochee Hills; industrial and logistics developments in places like Fulton Industrial Boulevard; and apartment buildings countywide.
Source: FMLS InfoSparks, Fulton County, Rolling 6-months as of December 2022 (year-over-year change compared to rolling 6-months as of December 2021)
2022 END OF YEAR ATLANTA MARKET INTELLIGENCE 86 ENGEL & VÖLKERS www.evatlanta.com
Overall Single-Family Homes Townhomes Condos Median Sale Price $425,000 p +6.3% $522,000 p +8.8% $372,000 q -3.4% $293,250 p +9.4% average Sale Price $575,000 p +8.8% $688,458 p +9.0% $457,918 p +7.5% $354,484 p +5.6% average Price Per Square Foot $249 p +8.3% $234 p +9.3% $233 p +8.9% $310 p +9.2% closed Sales 7,063 q -32.2% 4,222 q -32.1% 1,429 q -24.1% 1,412 q -39.1% Pending Sales 6,094 q -36.0% 3,672 q -33.8% 1,146 q -37.3% 1,276 q -40.6% active Listings 3,237 p +15.6% 2,115 p +31.3% 510 p +22.6% 613 q -20.6% New Listings 9,905 q -15.7% 6,408 q -9.6% 1,589 q -21.8% 1,908 q -27.2% average Sale Price to Original List Price Ratio 97.6% q -2.0% 97.0% q -2.8% 99.1% q -1.6% 97.9% q -0.3% Months of Inventory 2.3 p +43.8% 2.5 p +66.7% 2.0 p +53.8% 1.9 q -5.0% average Days on Market 24 0.0% 25 p +19.0% 22 q -4.3% 25 q -26.5% Fulton
Q4 2022) q Down YOY p Up YOY METRO ATLANTA
County Market Summary (Q3 &
Cobb County
Cobb County is located northwest of the Chattahoochee River along the I-75 corridor and includes the cities of Marietta, Smyrna, Mableton, Powder Springs, Acworth, and the East Cobb area. It is a draw for families looking for single-family homes with space, family-friendly amenities, and convenient highway access. Cities like Marietta and Mableton have charming, historic downtowns, and newer areas like Smyrna Market
Village and The Battery offer plenty of options to dine and play without leaving the county. The average home cost $463,645 in Q3 and Q4 2022, slightly more affordable than the metro average. Most homes are single-family homes in subdivisions, but townhome neighborhoods are also popular and condominiums are available in places like Cumberland, Vinings, and Smyrna.
Planned developments include corporate offices like the new Truist Securities headquarters in Cumberland; apartments, hotels, and shops around The Battery; the expansion of Avenue East Cobb; a new town center in Powder Springs; a 1,400-lot active adult community at Nature Walk at Seven Hills; and pockets of single-family home and townhome construction.
Source: FMLS InfoSparks, Cobb County, Rolling 6-months as of December 2022 (year-over-year change compared to rolling 6-months as of December 2021)
2022 END OF YEAR ATLANTA MARKET INTELLIGENCE 87 ENGEL & VÖLKERS www.evatlanta.com
Overall Single-Family Homes Townhomes Condos Median Sale Price $407,050 p +9.4% $425,650 p +7.9% $360,000 p +9.0% $271,500 p +18.0% average Sale Price $463,645 p +10.4% $496,040 p +10.7% $369,634 p +7.3% $295,456 p +14.4% average Price Per Square Foot $196 p +12.6% $196 p +12.6% $193 p +13.5% $208 p +12.4% closed Sales 4,966 q -29.7% 3,850 q -29.9% 849 q -25.5% 267 q -38.1% Pending Sales 4,372 q -31.5% 3,354 q -32.0% 786 q -25.1% 232 q -41.1% active Listings 1,707 p +39.6% 1,372 p +38.7% 280 p +52.2% 54 p +8.0% New Listings 6,103 q -15.6% 4,673 q -17.5% 1,143 q -1.6% 286 q -29.9% average Sale Price to Original List Price Ratio 97.9% q -3.1% 97.6% q -3.3% 98.5% q -3.0% 99.7% q -0.2% Months of Inventory 1.8 p +80.0% 1.8 p +63.6% 1.7 p +70.0% 1.0 p +42.9% average Days on Market 24 p +50.0% 25 p +56.3% 21 p +23.5% 18 p +20.0%
q Down YOY p Up YOY METRO ATLANTA
Cobb County Market Summary (Q3 & Q4 2022)
Cherokee County
Cherokee County is located in northwest Atlanta and includes the cities of Woodstock, Canton, and Holly Springs, and the small towns of Ball Ground and Waleska. It is one of the gateways from Metro Atlanta to the mountains of North Georgia. It is more expensive to own a home in Cherokee County than the metro average, with an average sale price of $489,762 in Q3 and Q4 2022, up 13.2% year-over-year. Most homes
are single-family homes, typically with generous square footage and larger lots. Places like Downtown Woodstock and Canton offer options to live in a walkable area, close to amenities like restaurants, shops, parks, and trails.
Planned developments include the expansion of the Woodstock City Center; a 30-acre adaptive reuse, mixed use project at The Mill at
Etowah in Canton; single-family home and townhome developments around Canton and Ball Ground; and logistics centers along the I-575 corridor. The recently incorporated City of Holly Springs is also designing its city hall, grand lawn, and surrounding town center, which will include shops, townhomes, and apartments.
Source: FMLS InfoSparks, Cherokee County, Rolling 6-months as of December 2022 (year-over-year change compared to rolling 6-months as of December 2021)
2022 END OF YEAR ATLANTA MARKET INTELLIGENCE 88 ENGEL & VÖLKERS www.evatlanta.com
Overall Single-Family Homes Townhomes Condos Median Sale Price $435,000 p +11.5% $445,000 p +11.3% $387,000 p +22.6% $387,500 p +25.0% average Sale Price $489,762 p +13.2% $501,973 p +12.7% $402,586 p +18.7% $365,050 p +14.6% average Price Per Square Foot $200 p +14.3% $199 p +13.7% $205 p +17.1% $227 p +3.7% closed Sales 2,137 q -28.2% 1,884 q -28.3% 229 q -29.8% 24 q -4.0% Pending Sales 1,948 q -27.8% 1,712 q -28.7% 217 q -21.1% 19 q -17.4% active Listings 907 p +65.8% 805 p +63.0% 96 p +95.9% 6 p +20.0% New Listings 2,829 q -8.5% 2,469 q -10.2% 337 p +7.3% 23 q -17.9% average Sale Price to Original List Price Ratio 97.5% q -3.6% 97.4% q -3.7% 98.6% q -3.1% 98.6% q -0.9% Months of Inventory 2.2 p +100.0% 2.2 p +100.0% 2.4 p +166.7% 1.8 p +20.0% average Days on Market 27 p +28.6% 27 p +35.0% 27 q -6.9% 12 p +20.0%
q Down YOY p Up YOY METRO ATLANTA
Cherokee County Market Summary (Q3 & Q4 2022)
Clayton County
Clayton County is located just south of Atlanta and includes the cities of Forest Park, Riverdale, Morrow, Lake City, Jonesboro, and Lovejoy. It is the most afforable county to own a home in Metro Atlanta, with an average sale price of $252,223 in Q3 and Q4 2022. The average sale price was up 11.6% year-over-year, higher than the metro average.
Most homes in Clayton County are single-family homes in subdivisions, including spacious traditional twostory homes and ranch homes in older neighborhoods. Townhomes offer options for low-maintenance living, and a handful of condominiums are available.
Planned developments in Clayton County include the conversion of the former Fort Gillem site in Forest Park to Bluestar Studios, a 53-acre film studio. MARTA has also planned a bus rapid transit project to improve access from Jonesboro and Lovejoy to East Point Station.
Source: FMLS InfoSparks, Clayton County, Rolling 6-months as of December 2022 (year-over-year change compared to rolling 6-months as of December 2021)
2022 END OF YEAR ATLANTA MARKET INTELLIGENCE 89 ENGEL & VÖLKERS www.evatlanta.com
Overall Single-Family Homes Townhomes Condos Median Sale Price $246,000 p +11.8% $258,500 p +13.7% $200,000 p +25.0% $130,000 p +20.4% average Sale Price $252,223 p +11.6% $264,049 p +12.3% $193,010 p +18.4% $115,433 p +11.7% average Price Per Square Foot $144 p +13.4% $147 p +13.1% $133 p +20.9% $103 p +35.3% closed Sales 876 q -8.2% 740 q -11.9% 127 p +21.0% 9 0.0% Pending Sales 800 q -14.3% 683 q -16.7% 108 p +2.9% 9 0.0% active Listings 341 p +83.3% 305 p +91.8% 34 p +36.0% 3 p +50.0% New Listings 1,300 p +15.4% 1,138 p +15.1% 152 p +18.8% 10 0.0% average Sale Price to Original List Price Ratio 97.4% q -4.6% 97.2% q -4.9% 98.6% q -3.3% 92.6% q -2.7% Months of Inventory 2.2 p +83.3% 2.2 p +83.3% 1.8 p +20.0% 1.7 p +41.7% average Days on Market 20 p +33.3% 21 p +40.0% 15 q -28.6% 20 q -28.6%
q Down YOY p Up YOY METRO ATLANTA
Clayton County Market Summary (Q3 & Q4 2022)
DeKalb County
DeKalb County includes the eastern part of the City of Atlanta, along with the cities of Decatur, Brookhaven, Dunwoody, Chamblee, Doraville, Tucker, Clarkston, Stone Mountain, Lithonia, and Stonecrest. Homes in DeKalb County are more affordable than the metro average, with an average sale price of $450,921 in Q3
and Q4 2022. It has a mix of singlefamily homes, townhomes, and condominiums and neighborhoods include both established older areas and newer subdivisions.
Planned developments include the Assembly mixed-use film studio campus in Doraville; an expansion
of the Children’s Hospital of Atlanta; adaptive reuse projects at former warehouses near Chamblee; new single-family homes as infill and pocket developments; new townhome communities (for sale and for rent); apartment buildings; and the redevelopment of both the North DeKalb Mall and the Stonecrest Mall.
Source: FMLS InfoSparks, DeKalb County, Rolling 6-months as of December 2022 (year-over-year change compared to rolling 6-months as of December 2021)
2022 END OF YEAR ATLANTA MARKET INTELLIGENCE 90 ENGEL & VÖLKERS www.evatlanta.com
Overall Single-Family Homes Townhomes Condos Median Sale Price $370,000 p +6.0% $415,000 p +9.2% $319,790 p +7.7% $230,000 p +5.3% average Sale Price $450,921 p +9.3% $502,669 p +10.0% $376,381 p +7.4% $243,764 p +5.6% average Price Per Square Foot $220 p +10.0% $225 p +9.2% $201 p +11.0% $219 p +11.2% closed Sales 4,201 q -30.0% 2,928 q -30.0% 846 q -30.3% 427 q -28.8% Pending Sales 3,732 q -34.1% 2,624 q -32.8% 724 q -40.2% 384 q -30.3% active Listings 1,721 p +26.6% 1,328 p +37.2% 269 p +3.5% 125 q -4.6% New Listings 5,940 q -12.3% 4,342 q -10.8% 1,041 q -18.2% 557 q -11.7% average Sale Price to Original List Price Ratio 97.5% q -2.4% 96.9% q -3.0% 99.2% q -1.2% 98.0% q -0.6% Months of Inventory 2.0 p +42.9% 2.2 p +57.1% 1.6 p +23.1% 1.5 p +15.4% average Days on Market 24 p +14.3% 25 p +31.6% 22 q -12.0% 20 q -4.8%
& Q4 2022) q Down YOY p Up YOY METRO ATLANTA
DeKalb County Market Summary (Q3
Douglas County
Douglas County is located southwest of Atlanta and includes the cities of Douglasville and Villa Rica, and rural areas to the south near the Chattahoochee River. Compared to the metro average, homes in Douglas County are more affordable at an average sale price of $339,328 in Q3 and Q4 2022. Most homes in Douglas County
are single-family homes, and this county has not yet seen the amount of townhome development that has occurred in most other counties. Homes tend to be larger, traditional two-story homes in subdivisions or ranch homes on larger lots in older neighborhoods. In the more rural areas to the south, homes are often
located on larger, wooded lots or on multiple acres.
Planned developments in Douglas County include the Douglasville Town Green project with a lawn, amphitheater, retail, and apartments; a Microsoft data center; and logistics facilities.
Source: FMLS InfoSparks, Douglas County, Rolling 6-months as of December 2022 (year-over-year change compared to rolling 6-months as of December 2021)
2022 END OF YEAR ATLANTA MARKET INTELLIGENCE 91 ENGEL & VÖLKERS www.evatlanta.com
Overall Single-Family Homes Townhomes Condos Median Sale Price $315,000 p +10.5% $317,000 p +9.5% $238,000 q -0.8% $240,000 q -21.3% average Sale Price $339,328 p +9.9% $342,241 p +9.7% $240,591 p +4.1% $245,000 q -3.8% average Price Per Square Foot $158 p +12.1% $158 p +11.3% $147 p +6.5% $152 p +6.3% closed Sales 901 q -28.9% 875 q -28.0% 22 q -52.2% 4 q -20.0% Pending Sales 793 q -33.3% 764 q -33.4% 23 q -39.5% 6 p +50.0% active Listings 416 p +63.8% 408 p +65.2% 6 p 0.0% 3 p +50.0% New Listings 1,282 q -11.2% 1,236 q -11.8% 34 q -5.6% 12 p +100.0% average Sale Price to Original List Price Ratio 96.8% q -4.3% 96.8% q -4.3% 95.7% q -7.2% 94.4% q -8.4% Months of Inventory 2.4 p +84.6% 2.4 p +84.6% 1.6 p +45.5% 1.6 p +45.5% average Days on Market 28 p +75.0% 28 p +86.7% 23 p +21.1% 47 q -29.9%
Douglas County Market Summary (Q3 & Q4 2022)
q Down YOY p Up YOY
METRO
ATLANTA
Fayette County
Fayette County is located south of Atlanta and includes the cities of Fayetteville, Peachtree City, and Tyrone. It features a mix of suburban and rural living just miles from the Atlanta airport. The average sale price of $506,955 in Q3 and Q4 2022 was above the metro average, and home prices increased slightly
faster than the metro average at 10.3% year-over-year. Most homes in Fayette County are spacious single-family homes on larger lots. The recently developed Trilith neighborhood—constructed to support the emerging film industry and Trilith Studios next door—has introduced lower maintenance
options at a higher price point, including single-family homes on smaller lots and townhomes in a walkable setting. The introduction of these new townhomes contributed to the dramatic increase in Fayette County’s average townhome price, which was up 105% year-over-year.
Source: FMLS InfoSparks, Fayette County, Rolling 6-months as of December 2022 (year-over-year change compared to rolling 6-months as of December 2021)
2022 END OF YEAR ATLANTA MARKET INTELLIGENCE 92 ENGEL & VÖLKERS www.evatlanta.com
Overall Single-Family Homes Townhomes Condos Median Sale Price $472,495 p +19.6% $474,995 p +18.7% 24 p +26.3% $224,750 p +26.6% average Sale Price $506,955 p +10.3% $510,086 p +8.7% $524,184 p +105.0% $223,600 p +20.9% average Price Per Square Foot $176 p +8.6% $175 p +7.4% $225 p +52.0% $168 p +5.7% closed Sales 312 q -1.3% 296 q -2.3% 12 p +33.3% 4 0.0% Pending Sales 258 q -18.1% 249 q -17.5% 6 q -40.0% 3 0.0% active Listings 143 p +44.4% 138 p +43.8% 4 p +33.3% 0 q -100.0% New Listings 432 p +0.2% 411 q -0.2% 18 p +5.9% 3 p +50.0% average Sale Price to Original List Price Ratio 96.9% q -1.2% 96.9% q -1.3% 96.9% p +1.3% 100.7% p +3.7% Months of Inventory 2.7 p +22.7% 2.7 p +22.7% 1.7 p +6.2% 0.3 q -25.0% average Days on Market 30 p +15.4% 30 p +15.4% 24 p +26.3% 9 q -79.5%
Fayette County Market Summary (Q3 & Q4 2022)
q Down YOY p Up YOY
METRO ATLANTA
Forsyth County
Forsyth County and its county seat, Cumming, have been ranked as one of the fastest growing areas in the metro area in recent years. Home prices appreciated on average 12.4% year-over-year in Q3 and Q4 2022,higher than the metro
average of 9.9%. Most homes in this suburban county are single-family homes. It had the highest average sale price of Metro Atlanta counties in Q3 & Q4 2022 at nearly $600,000.
Upcoming developments include the 75-acre Cumming City Center project with a park, amphitheater, and 117,000 SF of retail and office space; Passport Springs and Spa, a 10-acre destination spa; and several single-family home and apartment developments.
Source: FMLS InfoSparks, Forsyth County, Rolling 6-months as of December 2022 (year-over-year change compared to rolling 6-months as of December 2021)
2022 END OF YEAR ATLANTA MARKET INTELLIGENCE 93 ENGEL & VÖLKERS www.evatlanta.com
Overall Single-Family Homes Townhomes Condos Median Sale Price $555,000 p +16.2% $577,000 p +17.2% $410,500 p +9.9% $425,500 p +18.0% average Sale Price $594,999 p +12.4% $615,474 p +13.1% $428,243 p +11.8% $438,683 p +16.6% average Price Per Square Foot $209 p +15.5% $208 p +15.6% $213 p +15.8% $238 p +9.7% closed Sales 1,843 q -27.8% 1,639 q -29.3% 160 q -19.2% 44 p +15.8% Pending Sales 1,550 q -32.6% 1,376 q -34.3% 135 q -22.4% 39 p +18.2% active Listings 648 p +73.3% 577 p +62.5% 48 p +200.0% 23 p +666.7% New Listings 2,217 q -12.6% 1,980 q -14.5% 177 q -5.9% 60 p +81.8% average Sale Price to Original List Price Ratio 97.6% q -4.0% 97.5% q -4.0% 98.4% q -4.1% 98.5% q -2.5% Months of Inventory 1.9 p +111.1% 1.8 p +100.0% 1.8 p +260.0% 3.2 p +700.0% average Days on Market 23 p +53.3% 23 p +53.3% 20 p +42.9% 18 q -5.3%
q Down YOY p Up YOY METRO ATLANTA
Forsyth County Market Summary (Q3 & Q4 2022)
Gwinnett County
Gwinnett County is the second most populous county in Metro Atlanta and the fastest growing in 2022. Its cities include Norcross, Peachtree Corners, Duluth, Suwanee, Sugar Hill, Buford, Lawrenceville, Dacula, Lilburn, and Snellville. With an average sale price of $441,847 in Q3 and Q4 2022, it is one of
the more affordable places to live in Metro Atlanta. There is a wide variety of homes available, ranging from condominiums and townhomes in near town centers to ranch homes in places like Snellville and Lawrenceville, and even large estates in North Gwinnett.
Many Gwinnett cities have been working to establish walkable town centers with a unique sense of place over the past decade. Planned developments include renovations at The Forum in Peachtree Corners, an expansion of Northside Hospital Gwinnett, the redevelopment of Gwinnett Place Mall, and several apartment buildings in places like Norcross and Sugar Hill.
Source: FMLS InfoSparks, Gwinnett County, Rolling 6-months as of December 2022 (year-over-year change compared to rolling 6-months as of December 2021)
2022 END OF YEAR ATLANTA MARKET INTELLIGENCE 94 ENGEL & VÖLKERS www.evatlanta.com
Overall Single-Family Homes Townhomes Condos Median Sale Price $403,337 p +12.7% $415,000 p +12.8% $358,750 p +16.7% $249,500 p +19.4% average Sale Price $441,847 p +11.9% $457,007 p +11.4% $368,465 p +18.8% $272,680 p +18.9% average Price Per Square Foot $179 p +14.0% $176 p +13.5% $197 p +18.7% $181 p +19.1% closed Sales 5,613 q -31.3% 4,745 q -32.2% 782 q -26.3% 86 q -15.7% Pending Sales 4,959 q -34.4% 4,207 q -35.1% 670 q -30.9% 82 q -18.0% active Listings 2,352 p +79.7% 2,021 p +78.7% 302 p +91.1% 29 p +45.0% New Listings 7,347 q -14.1% 6,236 q -15.5% 995 q -5.9% 115 p +4.5% average Sale Price to Original List Price Ratio 97.2% q -4.5% 97.1% q -4.6% 98.1% q -3.7% 98.2% q -2.7% Months of Inventory 2.2 p +120.0% 2.2 p +120.0% 2.2 p +144.4% 1.7 p +54.5% average Days on Market 27 p +68.8% 27 p +80.0% 24 p +41.2% 19 p +35.7%
q Down YOY p Up YOY METRO ATLANTA
Gwinnett County Market Summary (Q3 & Q4 2022)
Henry County
Henry County is located southeast of Atlanta along the I-75 corridor and includes McDonough, Stockbridge, Hampton, and Locust Grove. It has a mix of suburban and rural character, with a cluster of logistics and industrial development near I-75.
Home prices were more affordable than the metro average, with an
average sale price of $366,593 in Q3 and Q4 2022. Home prices appreciated slightly slower than the metro average at 9.2% year-overyear; however, sales transactions were not down as much year-overyear as in many other counties in the metro.
Planned development in Stockbridge includes a new cultural arts center, the new Henry County STEM High School, and the Bridges at Jodeco, a 150-acre mixed-use development.
Source: FMLS InfoSparks, Henry County, Rolling 6-months as of December 2022 (year-over-year change compared to rolling 6-months as of December 2021)
2022 END OF YEAR ATLANTA MARKET INTELLIGENCE 95 ENGEL & VÖLKERS www.evatlanta.com
Overall Single-Family Homes Townhomes Condos Median Sale Price $359,000 p +11.5% $360,000 p +10.0% $240,000 p +17.1% $322,500 p +70.3% average Sale Price $366,593 p +9.2% $370,496 p +8.8% $243,045 p +11.8% $322,500 p +70.3% average Price Per Square Foot $155 p +13.1% $154 p +12.4% $170 p +22.3% $189 p +51.2% closed Sales 841 q -13.2% 814 q -12.6% 25 q -30.6% 2 0.0% Pending Sales 794 q -15.5% 753 q -16.1% 38 q -5.0% 3 p +50.0% active Listings 448 p +71.6% 431 p +70.4% 15 p +87.5% 2 p +100.0% New Listings 1,367 p +10.0% 1,300 p +9.7% 65 p +18.2% 2 q -33.3% average Sale Price to Original List Price Ratio 97.2% q -4.0% 97.1% q -4.1% 100.4% q -1.9% 94.8% p +3.3% Months of Inventory 2.9 p +61.1% 3.0 p +66.7% 2.5 p +31.6% 1.8 p +157.1% average Days on Market 30 p +66.7% 30 p +66.7% 19 p +90.0% 73 p +305.6%
q Down YOY p Up YOY METRO ATLANTA
Henry County Market Summary (Q3 & Q4 2022)
Rockdale County
Rockdale County is located east of Atlanta and includes the City of Conyers and its surrounding suburbs. It is the least populated county in Metro Atlanta with less than 100,000 residents. Homes in
Rockdale County are less expensive than the metro average at an average sale price of $337,501, appreciating at the metro average pace of 9.9% year-over-year.
Planned development in Rockdale County includes single-family home subdivisions, townhome communities, and industrial development near I-20.
Source: FMLS InfoSparks, Rockdale County, Rolling 6-months as of December 2022 (year-over-year change compared to rolling 6-months as of December 2021)
2022 END OF YEAR ATLANTA MARKET INTELLIGENCE 96 ENGEL & VÖLKERS www.evatlanta.com
Overall Single-Family Homes Townhomes Condos Median Sale Price $325,000 p +14.6% $340,000 p +16.4% $242,000 p +31.9% $135,000 p +57.1% average Sale Price $337,501 p +9.9% $348,703 p +9.7% $236,192 p +26.7% $157,769 p +71.1% average Price Per Square Foot $149 p +13.7% $150 p +12.8% $150 p +26.1% $122 p +54.4% closed Sales 553 q -19.4% 507 q -20.0% 33 q -28.3% 13 p +116.7% Pending Sales 469 q -26.4% 426 q -26.9% 31 q -35.4% 12 p +100.0% active Listings 231 p +71.1% 217 p +70.9% 12 p +100.0% 2 0.0% New Listings 750 0.0% 693 q -0.3% 47 q -2.1% 10 p +42.9% average Sale Price to Original List Price Ratio 97.2% q -3.5% 97.2% q -3.7% 97.6% q -1.6% 94.6% q -3.3% Months of Inventory 2.4 p +100.0% 2.4 p +84.6% 2.1 p +133.3% 0.8 q -33.3% average Days on Market 27 p +58.8% 27 p +58.8% 23 p +35.3% 26 p +18.2%
Rockdale County Market Summary (Q3 & Q4 2022)
q Down YOY p Up YOY
METRO ATLANTA
North Georgia Markets
The mountains of North Georgia are an easy escape from Metro Atlanta and a popular destination for Atlantans to vacation, relocate, or purchase a second home. This area is best known for its natural beauty and cities like Blue Ridge, Ellijay, Mineral Bluff, and Blairsville. It includes Murray, Fannin, Gilmer, Pickens, Union, Towns, and Rabun Counties. It offers the views and outdoor adventures of places like Highlands and Cashiers, with a more affordable price tag and an easier commute from Atlanta.
Most of the homes in North Georgia are single-family homes. For buyers looking to host guests— either as a rental or a second home— houses with scenic views, multiple bedrooms, new construction, and amenities like balconies and fire pits are in high demand.
Fannin County—home to the scenic towns of Blue Ridge and Mineral Bluff— is perhaps the best known part of the region and often the first stop for buyers interested in purchasing a home in North Georgia. After a red hot market in 2020 and

2021, sales volumes and prices have begun to cool. The average sale price in Q3 and Q4 2022 was down 4.1% year-over-year, but still up a whopping 77.9% since the same period in 2019, nearly double the price growth in Metro Atlanta during that time. With an average sale price of $700,800, it is not only the most expensive place to buy a home in North Georgia, but pricier than the average home in any Metro Atlanta county too. Closed sales were down 10.9% year-over-year in the second half of 2022, a more gentle decline than the 29.5% decrease in Metro Atlanta, showing continued interest in the area.
North Georgia Counties Map
Nearby, Gilmer County and the Ellijay area have also grown in popularity and have retained a more affordable price point, with an average sale price of $450,681 in Q3 and Q4 2022. It has also seen tremendous price growth, up 11.4% year-overyear and a total of 64.9% since the same period in 2019. Gilmer County’s combination of desirability and affordability mean buyers have continued to move to this area. Gilmer was the only county in North Georgia or Metro Atlanta to post increased year-over-year sale in the higher interest rate environment of late 2022, with closed sales up 4.6% year-over-year.
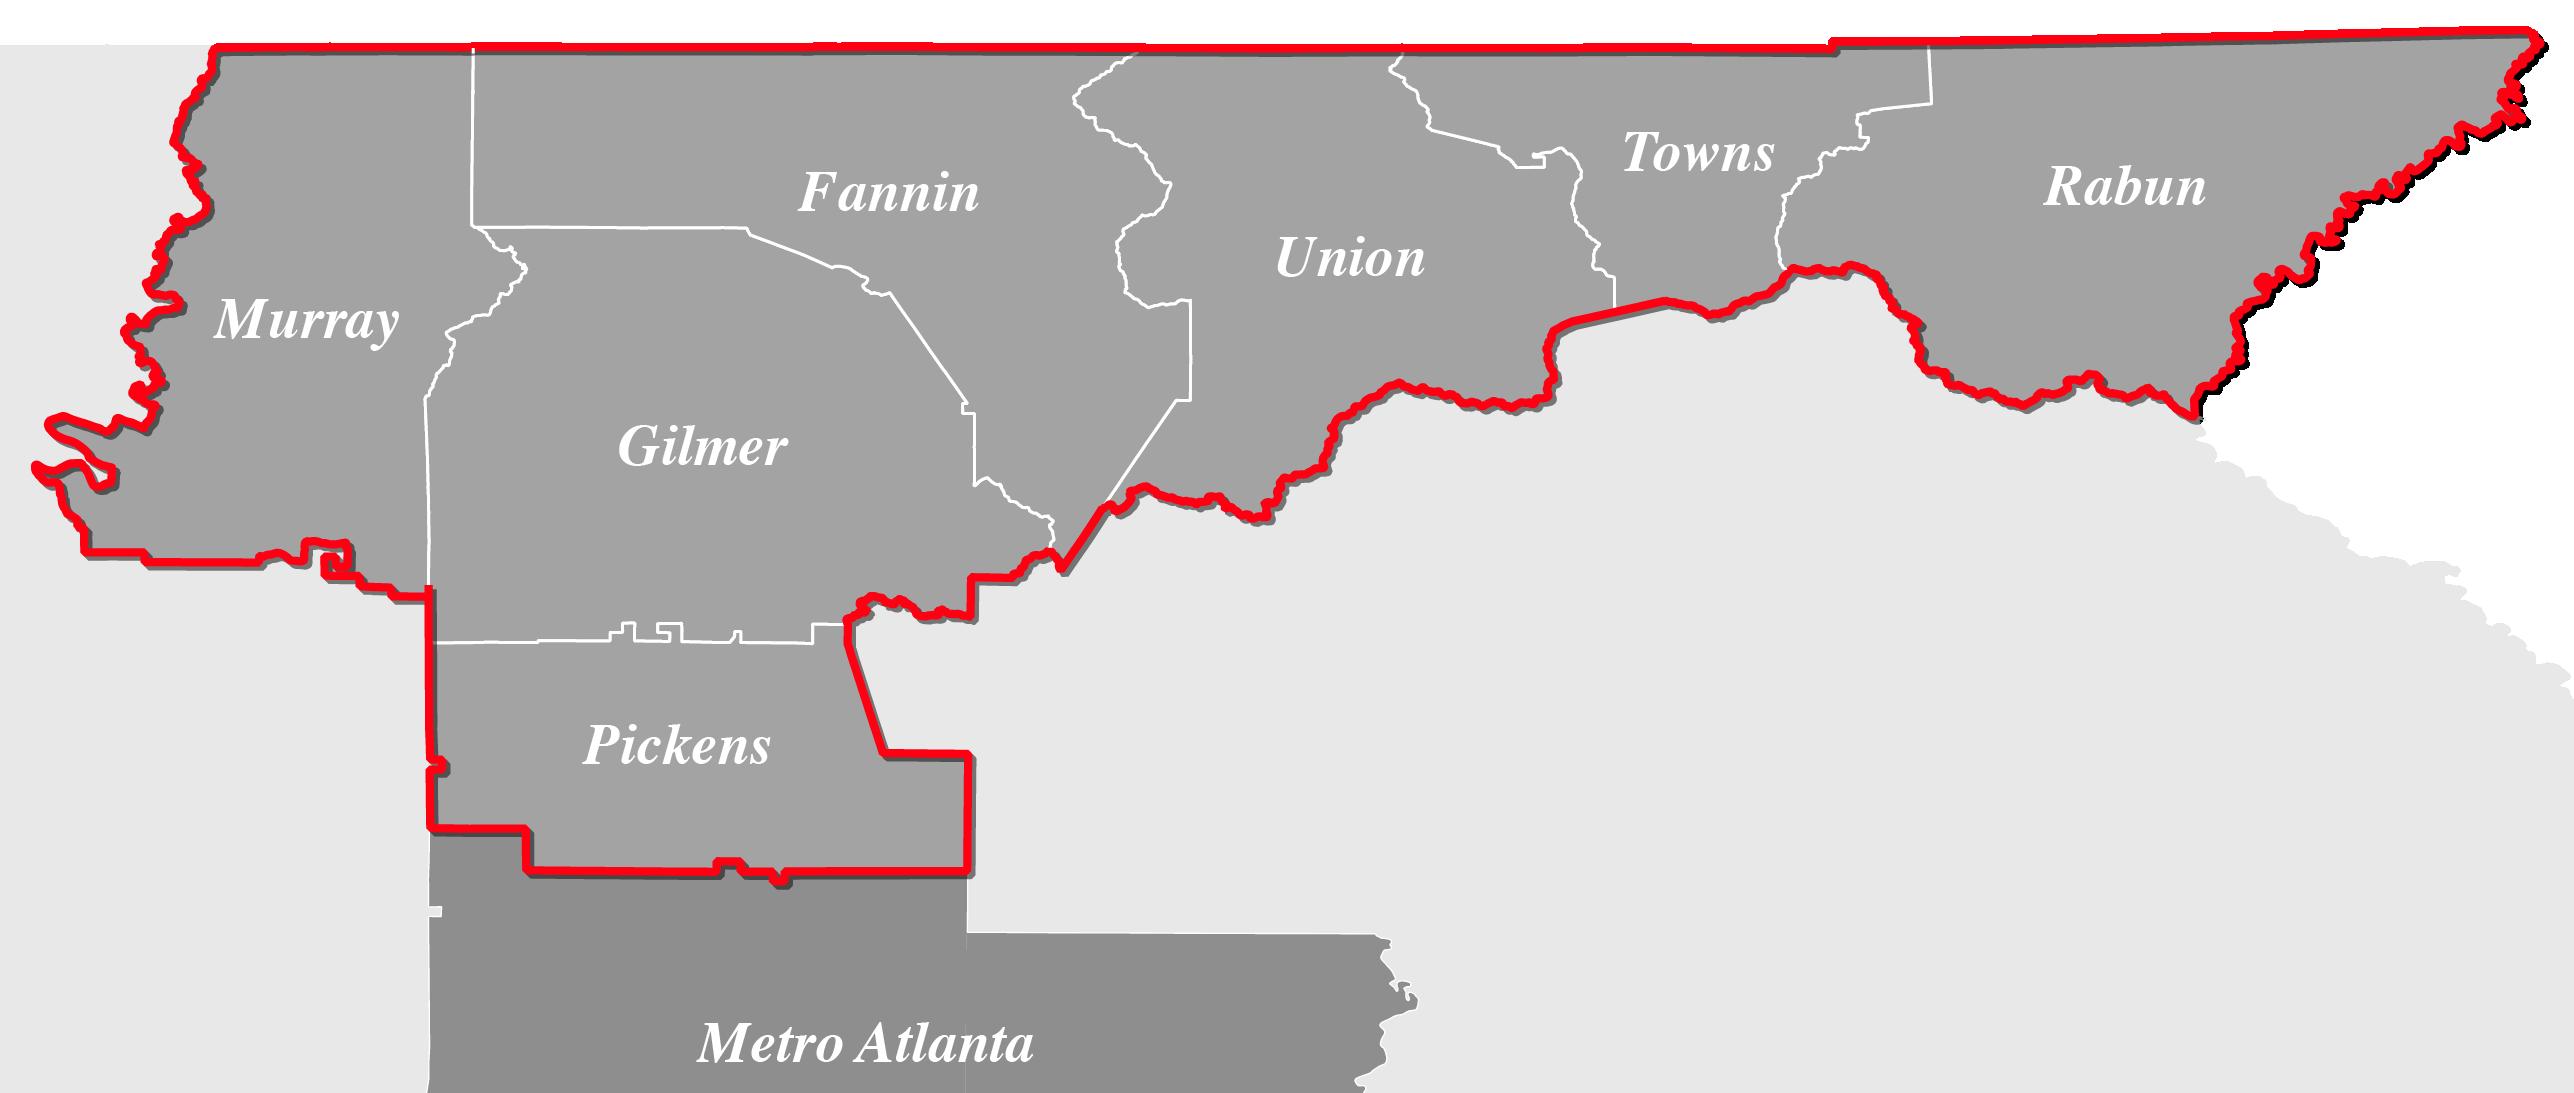
2022 END OF YEAR ATLANTA MARKET INTELLIGENCE 97 ENGEL & VÖLKERS www.evatlanta.com
Blue Ridge
Mineral Bluff Ellijay
Blairsville
Fannin County
FMLS InfoSparks, Fannin County, Rolling 6-months as of December 2022 (year-over-year change compared to rolling 6-months as of December 2021)
2022 END OF YEAR ATLANTA MARKET INTELLIGENCE 98 ENGEL & VÖLKERS www.evatlanta.com
Source:
Overall Single-Family Homes Townhomes Condos Median Sale Price $560,000 q -2.6% $560,000 q -2.6% -average Sale Price $700,800 q -4.1% $700,800 q -4.1% -average Price Per Square Foot $317 p +22.4% $317 p +22.4% -closed Sales 49 q -10.9% 49 q -10.9% -Pending Sales 56 p +19.1% 56 p +19.1% -active Listings 59 p +136.0% 59 p +136.0% -New Listings 119 p +128.8% 119 p +128.8% -average Sale Price to Original List Price Ratio 91.5% q -3.4% 91.5% q -3.4% -Months of Inventory 7.5 p +212.5% 7.5 p +212.5% -average Days on Market 41 q -34.9% 41 q -34.9% - -
q Down YOY p Up YOY NORTH GEORGIA
Fannin County Market Summary (Q3 & Q4 2022)
Gilmer County
2022 END OF YEAR ATLANTA MARKET INTELLIGENCE 99 ENGEL & VÖLKERS www.evatlanta.com
Source: FMLS InfoSparks, Gilmer County, Rolling 6-months as of December 2022 (year-over-year change compared to rolling 6-months as of December 2021)
Overall Single-Family Homes Townhomes Condos Median Sale Price $405,000 p +13.4% $405,000 p +11.0%$312,500 N/A average Sale Price $450,681 p +11.2% $451,550 p +9.7%$312,500 N/A average Price Per Square Foot $240 p +19.4% $240 p +18.2% -closed Sales 160 p +4.6% 159 p +7.4%1 N/A Pending Sales 163 p +12.4% 161 p +15.0%1 N/A active Listings 129 p +111.5% 128 p +120.7%1 N/A New Listings 249 p +35.3% 247 p +35.7%0 0.0% average Sale Price to Original List Price Ratio 91.7% q -5.1% 91.7% q -5.8%82.5% N/A Months of Inventory 5.4 p +116.0% 5.4 p +125.0% - N/A average Days on Market 47 p +51.6% 46 p +58.6%123 N/A Gilmer County Market Summary (Q3 & Q4 2022) q Down YOY p Up YOY NORTH GEORGIA
Murray County
2022 END OF YEAR ATLANTA MARKET INTELLIGENCE 100 ENGEL & VÖLKERS www.evatlanta.com
Source: FMLS InfoSparks, Murray County, Rolling 6-months as of December 2022 (year-over-year change compared to rolling 6-months as of December 2021)
Overall Single-Family Homes Townhomes Condos Median Sale Price $231,990 p +14.0% $234,370 p +15.2%$201,000 N/A average Sale Price $272,277 p +16.6% $274,373 p +17.5%$201,000 N/A average Price Per Square Foot $140 p +0.7% $140 p +0.7%$151 N/A closed Sales 35 q -43.5% 34 q -45.2%1 N/A Pending Sales 26 q -35.0% 25 q -37.5%1 N/A active Listings 15 q -11.8% 15 q -11.8%0 0.0% New Listings 31 q -45.6% 30 q -47.4%1 N/A average Sale Price to Original List Price Ratio 95.3% q -4.0% 95.1% q -4.2%103.1% N/A Months of Inventory 2.5 0.0% 2.5 0.0% - N/A average Days on Market 37 p +76.2% 38 p +81.0%6 N/A
q
NORTH GEORGIA
Murray County Market Summary (Q3 & Q4 2022)
Down YOY p Up YOY
Pickens County
FMLS InfoSparks, Pickens County, Rolling 6-months as of December 2022 (year-over-year change compared to rolling 6-months as of December 2021)
2022 END OF YEAR ATLANTA MARKET INTELLIGENCE 101 ENGEL & VÖLKERS www.evatlanta.com
Source:
Overall Single-Family Homes Townhomes Condos Median Sale Price $355,875 p +9.5% $367,500 p +9.7% $292,378 p +21.8% $229,000 p +22.3% average Sale Price $397,590 p +2.5% $406,074 p +2.8% $285,672 p +19.8% $225,500 p +12.6% average Price Per Square Foot $194 p +7.8% $195 p +7.7% $172 p +4.9% $212 p +16.5% closed Sales 298 q -25.1% 280 q -26.5% 12 p +9.1% 6 0.0% Pending Sales 275 q -26.1% 252 q -28.4% 17 p +21.4% 6 0.0% active Listings 170 p +54.5% 165 p +54.2% 4 p +33.3% 1 0.0% New Listings 393 q -7.3% 364 q -9.9% 18 p +20.0% 11 p +120.0% average Sale Price to Original List Price Ratio 95.4% q -3.0% 95.5% q -2.8% 97.1% q -3.5% 91.5% q -5.7% Months of Inventory 3.1 p +82.4% 3.2 p +77.8% 2.2 p +100.0% 0.7 p +133.3% average Days on Market 38 p +40.7% 39 p +50.0% 29 q -3.3% 31 q -3.1%
q
Pickens County Market Summary (Q3 & Q4 2022)
Down YOY p Up YOY NORTH GEORGIA
Rabun County
2022 END OF YEAR ATLANTA MARKET INTELLIGENCE 102 ENGEL & VÖLKERS www.evatlanta.com
Source: FMLS InfoSparks, Rabun County, Rolling 6-months as of December 2022 (year-over-year change compared to rolling 6-months as of December 2021)
Overall Single-Family Homes Townhomes Condos Median Sale Price $412,000 q -32.7% $412,000 q -32.7% -average Sale Price $959,892 p +52.7% $959,892 p +52.7% -average Price Per Square Foot $304 p +25.6% $304 p +25.6% -closed Sales 15 0.0% 15 0.0% -Pending Sales 17 p +30.8% 15 p +15.4%2 N/A active Listings 9 p +28.6% 8 p +14.3%1 N/A New Listings 31 p +72.2% 29 p +61.1%2 N/A average Sale Price to Original List Price Ratio 93.2% q -2.1% 93.2% q -2.1% -Months of Inventory 3.2 p +18.5% 3.2 p +14.3%0.5 N/A average Days on Market 42 0.0% 42 0.0% - -
Rabun County Market Summary (Q3 & Q4 2022)
q Down YOY p Up YOY
NORTH GEORGIA
Towns County
2022 END OF YEAR ATLANTA MARKET INTELLIGENCE 103 ENGEL & VÖLKERS www.evatlanta.com
Source: FMLS InfoSparks, Towns County, Rolling 6-months as of December 2022 (year-over-year change compared to rolling 6-months as of December 2021)
Overall Single-Family Homes Townhomes Condos Median Sale Price $350,000 q -5.1% $350,000 q -5.1% $404,775 N/Aaverage Sale Price $355,364 q -19.0% $335,600 q -23.5% $404,775 N/Aaverage Price Per Square Foot $171 p +3.0% $163 q -1.8% $191 N/Aclosed Sales 7 q -41.7% 5 q -58.3% 2 N/APending Sales 9 q -35.7% 7 q -50.0% 2 N/Aactive Listings 9 p +28.6% 6 q -14.3% 0 0.0% 3 N/A New Listings 18 p +5.9% 13 q -23.5% 1 N/A 4 N/A average Sale Price to Original List Price Ratio 95.6% p +1.6% 101.1% p +7.4% 81.9% N/AMonths of Inventory 4.2 q -20.8% 3.0 q -43.4% N/A 2.7 N/A average Days on Market 26 0.0% 22 q -15.4% 36 N/ATowns County Market Summary (Q3 & Q4 2022) q Down YOY p Up YOY NORTH GEORGIA
Union County
FMLS InfoSparks, Union County, Rolling 6-months as of December 2022 (year-over-year change compared to rolling 6-months as of December 2021)
2022 END OF YEAR ATLANTA MARKET INTELLIGENCE 104 ENGEL & VÖLKERS www.evatlanta.com
Source:
Overall Single-Family Homes Townhomes Condos Median Sale Price $329,900 q -4.0% $329,900 q -6.2% -average Sale Price $343,338 q -10.2% $343,338 q -11.6% -average Price Per Square Foot $201 p +1.5% $201 p +0.5% -closed Sales 13 q -55.2% 13 q -53.6% -Pending Sales 13 q -53.6% 13 q -51.9% -active Listings 14 q -6.7% 14 q -6.7% -New Listings 22 q -43.6% 22 q -42.1% -average Sale Price to Original List Price Ratio 90.7% q -7.8% 90.7% q -7.8% -Months of Inventory 4.9 p +16.7% 5.0 p +19.0% -average Days on Market 41 p +51.9% 41 p +46.4% - -
q Down YOY p Up YOY NORTH GEORGIA
Union County Market Summary (Q3 & Q4 2022)

Sources
1 Freddie Mac Primary Mortgage Market Survey. 6 January 2022.
2 Freddie Mac Primary Mortgage Market Survey. 29 December 2022.
3 Freddie Mac. “Quarterly Forecast: Rapidly Rising Rates & Declining Demand Driving a Housing Market Slowdown.” 21 October 2022. https:// www.freddiemac.com/research/forecast/20221021-quarterly-forecast-rapidly-rising-rates-declining-demand-driving-housing-market
4 Fannie Mae. “Housing Forecast: December 2022.” 12 December 2022. https://www.fanniemae.com/media/45801/display
5 Mortgage Bankers Association. “MBA Mortgage Finance Forecast.” 19 December 2022. https://www.mba.org/docs/default-source/research-and-forecasts/forecasts/mortgage-finance-forecast-dec-2022.pdf?sfvrsn=b584bf7_1
6 FMLS InfoSparks, Months of Supply and Days on Market - Greater Atlanta Area (Cherokee, Clayton, Cobb, DeKalb, Douglas, Fayette, Forsyth, Fulton, Gwinnett, Rockdale, and Paulding Counties)
7 FMLS InfoSparks, New Listings - Greater Atlanta Area (Cherokee, Clayton, Cobb, DeKalb, Douglas, Fayette, Forsyth, Fulton, Gwinnett, Rockdale, and Paulding Counties)
8 FMLS InfoSparks. Greater Atlanta Area – All Home Types – New Listings. Retrieved 4 January 2023.
9 CoreLogic. “Higher Mortgage Rates Lead to Stong Lock-in Effect.” 9 November 2022. https://www.corelogic.com/intelligence/higher-mortgage-rates-lead-to-strong-lock-in-effect/
10 National Association of Realtors. 15 December 2022. “5 Reasons This Isn’t a Repeat of the 2008 Housing Crash.” https://www.nar.realtor/ magazine/real-estate-news/5-reasons-this-isnt-a-repeat-of-the-2008-housing-crash
11 CoreLogic. “Homeowner Equity Insights.” 9 December 2022. https://www.corelogic.com/intelligence/homeowner-equity-insights-q3-2022/
12 National Association of Realtors. “NAR’s Lawrence Yun Predicts U.S. Home Prices Won’t Experience Major Decline, Could Possibly Rise Slightly in 2023 if Mortgage Rates Remain at 7%.” 11 November 2022. https://www.nar.realtor/newsroom/nars-lawrence-yun-predicts-ushome-prices-wont-experience-major-decline-could-possibly-rise-slightly
13 National Association of Realtors. “The Year Ahead: Real Estate Forecast Summit.” 13 December 2022. https://cdn.nar.realtor/sites/default/ files/documents/2022-12-13-nar-real-estate-forecast-summit-the-year-ahead-lawrence-yun-presentation-slides-12-13-2022.pdf
14 Wall Street Journal. “Unemployment Falls to 3.4%, Lowest in 53 Years, Jobs Report Shows.” 3 February 2023. https://www.wsj.com/articles/ january-jobs-report-unemployment-rate-economy-growth-2023-11675374490
15 MarketNsight. December 31st Market Update.
16 MarketNsight. MarketWatch Atlanta December 2022.
17 FMLS InfoSparks. Average Sale Price – All Home Types, Greater Atlanta Area, December 2016 to 2022.
18 MarketNsight. December 21, 2022 Market Update.
19 FMLS, Greater Atlanta Area, Average Sale Price, All Home Types, January 2011 to December 2022.
21 National Association of Realtors. “NAR’s Lawrence Yun Predicts U.S. Home Prices Won’t Experience Major Decline, Could Possibly Rise Slightly in 2023 if Mortgage Rates Remain at 7%.” 11 November 2022. https://www.nar.realtor/newsroom/nars-lawrence-yun-predicts-ushome-prices-wont-experience-major-decline-could-possibly-rise-slightly
22 National Association of Realtors. “The Year Ahead: Real Estate Forecast Summit.” 13 December 2022. https://cdn.nar.realtor/sites/default/ files/documents/2022-12-13-nar-real-estate-forecast-summit-the-year-ahead-lawrence-yun-presentation-slides-12-13-2022.pdf
23 CoreLogic. “U.S. Home Price Insights – January 2023.” 3 January 2023. https://www.corelogic.com/intelligence/u-s-home-price-insights-january-2023/
24 Goldman Sachs. Why Home Prices are Poised to Fall. 6 October 2022. https://www.goldmansachs.com/insights/pages/why-home-pricesare-poised-to-fall.html
26 Fortune. “How home prices are expected to shift in over 300 housing markets, according to updated forecasts from Zillow and Moody’s.” 20 January 2023. https://fortune.com/2023/01/20/housing-market-home-price-2023-prediction-moodys-zillow-forecast/CoreLogic. “Quick Take: Appraisal Gap Normalizes Amid a Cooling Housing Market.” 7 December 2022.
27 National Association of Realtors. “On The Horizon: Markets to Watch in 2023 and Beyond.” 13 December 2022. https://www.nar.realtor/research-and-statistics/research-reports/on-the-horizon-markets-to-watch-in-2023-and-beyond Moody’s. “U.S. Housing and Housing Finance: What’s After the Boom?” 25 January 2023. https://www.moodys.com/newsandevents/topics/ US-Housing-Housing-Finance-Whats-after-the-boom-00704C
28 FMLS. Greater Atlanta Area. Pending and Closed Sales, All Home Types.
29 MarketNsight. January 30, 2023 Market Update.
30 Mortgage Bankers Association. “Mortgage Applications Increase in Latest MBA Weekly Survey.” 25 January 2023. https://www.mba.org/ news-and-research/newsroom/news/2023/01/25/mortgage-applications-increase-in-latest-mba-weekly-survey
FMLS. Greater Atlanta Area. Pending and Closed Sales, All Home Types.
31 Freddie Mac. Primary Mortgage Market Survey - U.S. Weekly Averages as of 1/26/23. https://www.freddiemac.com/pmms
32 National Association of Realtors. “NAR’s Lawrence Yun Predicts U.S. Home Prices Won’t Experience Major Decline, Could Possibly Rise Slightly in 2023 if Mortgage Rates Remain at 7%.” 11 November 2022. https://www.nar.realtor/newsroom/nars-lawrence-yun-predicts-ushome-prices-wont-experience-major-decline-could-possibly-rise-slightly
33 FMLS. Greater Atlanta Area. Closed Sales and Sale Price, 2017 to 2022.
34 U.S. Census American Community Survey, Atlanta-Sandy Springs-Roswell MSA, 2017 to 2021
35 FMLS. Greater Atlanta Area. Average Sale Price, 2017 to 2022.
2022 END OF YEAR ATLANTA MARKET INTELLIGENCE 106 ENGEL & VÖLKERS www.evatlanta.com
Sources (Continued)
36 Atlanta Regional Commission. Population Estimates: Progress out of Pandemic. https://33n.atlantaregional.com/population/population-estimates-2022-progress-out-of-pandemic
37 Atlanta Regional Commission. Atlanta Region 2022 Population Estimates (Cherokee, Clayton, Cobb, DeKalb, Douglas, Fayette, Forsyth, Fulton, Gwinnett, Henry, and Rockdale Counties). https://atlantaregional.org/atlanta-region/population-forecasts-estimates/atlanta-region-population-estimates/
38 Barron’s. “Atlanta’s Housing Market Will Lead U.S. in 2023.” 14 December 2022. https://www.barrons.com/articles/atlantas-housing-marketwill-lead-u-s-in-2023-01671032900
39 U.S. Bureau of Labor Statistics. Unemployment Rates for Metropolitan Areas. November 2022. https://www.bls.gov/web/metro/laummtrk.htm
40 Atlanta Regional Commission. “A Tale of Telecommuting.” 10 January 2023. https://33n.atlantaregional.com/data-diversions/a-tale-of-telecommuting
41 Metro Atlanta Chamber. “Atlanta by the Numbers.” Retrieved 20 January 2023. https://www.metroatlantachamber.com/built-for-business/
42 Atlanta Regional Commission. “Where are all these people coming from (and going to)?” 6 July 2022. https://33n.atlantaregional.com/data-diversions/where-are-all-these-people-coming-from-and-going-to#:~:text=In%2DMigration&text=%E2%80%9COutside%20Metro%20 Area%20within%20U.S.,are%20the%20top%20origin%20places.
43 Realtor.com, Housing Inventory: Median Days on Market in the United States. Retrieved from FRED, Federal Reserve Bank of St. Louis, January 22, 2023. https://fred.stlouisfed.org/series/MEDDAYONMARUS
44 U.S. Bureau of Labor Statistics. Unemployment Rates for Metropolitan Areas. November 2022. https://www.bls.gov/web/metro/laummtrk.htm
45 U.S. Census Bureau. 2021 ACS 1-Year Estimates.
46 FMLS, New construction/under construction/to be built townhomes, ITP, Closed sales 7/1/22 to 12/31/22
47 FMLS, Closed sales for new construction/under construction/to be built townhomes, 7/1/22 to 12/31/22, Cherokee, Clayton, Cobb, DeKalb, Douglas, Fayette, Forsyth, Fulton, Gwinnett, Henry, and Rockdale Counties
48 FMLS, New construction/under construction/to be built condominiums, ITP, Closed sales 7/1/22 to 12/31/22
Report photographs sourced from Engel & Volkers Atlanta real estate listings and licensed photos.
2022 END OF YEAR ATLANTA MARKET INTELLIGENCE 107 ENGEL & VÖLKERS www.evatlanta.com
evatlanta.com 404.845.7724 | 1745 Peachtree Street, Atlanta, GA 30309, USA | 1411 North Highland Avenue NE, Atlanta, GA 30306, USA
Engel & Völkers. All rights reserved. Each brokerage independently owned and operated. All information provided is deemed reliable but is not guaranteed and should be independently verified. If your property is currently represented by a real estate broker, this is not an attempt to solicit your listing. Engel & Völkers and its independent license partners are Equal Opportunity Employers and fully support the principles of the Fair Housing Act.
©2022
