

SHORT ANSWER Write the word or phrase that best completes each statement or answers the question
Solve the problem.
1) After conducting a survey of his students, a professor reported that "There appears to be a strong correlation between grade point average and whether or not a student works " Comment on this observation
2) The following scatterplot shows a relationship between x and y that results in a correlation coefficient of r = 0 Explain why r = 0 in this situation even though there appears to be a strong relationship between the x and y variables

3) The following scatterplot shows the relationship between the time (in seconds) it took men to run the 1500m race for the gold medal and the year of the Olympics that the race was run in:

a Write a few sentences describing the association
b Estimate the correlation r =
1) 2)4) Identify what is wrong with each of the following statements:
a The correlation between Olympic gold medal times for the 800m hurdles and year is -0 66 seconds per year
b The correlation between Olympic gold medal times for the 100m dash and year is -1 37
c. Since the correlation between Olympic gold medal times for the 800m hurdles and 100m dash is -0. 41, the correlation between times for the 100m dash and the 800m hurdles is +0 41
d If we were to measure Olympic gold medal times for the 800m hurdles in minutes instead of seconds, the correlation would be -0 66/60 = -0 011
5) After conducting a survey at a pet store to see what impact having a pet had on the condition of the yard, a news reporter stated "There appears to be a strong correlation between the owning a pet and the condition of the yard " Comment on this observation
6) On the axes below, sketch a scatterplot described:

a a strong positive association
b a weak negative association
7) A study by a prominent psychologist found a moderately strong positive association between the number of hours of sleep a person gets and the person's ability to memorize information
a Explain in the context of this problem what "positive association" means
b Hoping to improve academic performance, the psychologist recommended the school board allow students to take a nap prior to any assessment Discuss the psychologist's recommendations.
4)
5)
6)
7)
8) A common objective for many school administrators is to increase the number of students taking SAT and ACT tests from their school The data from each state from 2003 are reflected in the scatterplot

a Write a few sentences describing the association
b Estimate the correlation r =
c If the point in the top left corner (4, 1215) were removed, would the correlation become stronger, weaker, or remain about the same? Explain briefly
d If the point in the very middle (38, 1049) were removed, would the correlation become stronger, weaker, or remain about the same? Explain briefly

9) After conducting a marketing study to see what consumers thought about a new tinted contact lens they were developing, an eyewear company reported, "Consumer satisfaction is strongly correlated with eye color " Comment on this observation
10) On the axes below, sketch a scatterplot described:
a. a strong negative association
b. a strong association but r is near 0
c. a weak but positive association
9)
10)
11) A school board study found a moderately strong negative association between the number of hours high school seniors worked at part-time jobs after school hours and the students' grade point averages
a Explain in this context what "negative association" means
b. Hoping to improve student performance, the school board passed a resolution urging parents to limit the number of hours students be allowed to work. Do you agree or disagree with the school board's reasoning Explain
12) Researchers investigating the association between the size and strength of muscles measured the forearm circumference (in inches) of 20 teenage boys. Then they measured the strength of the boys' grips (in pounds) Their data are plotted
12)
a. Write a few sentences describing the association.
b. Estimate the correlation. r =

c. If the point in the lower right corner (at about 14" and 38 lbs.) were removed, how would the correlation become stronger, weaker, or remain about the same?
d. If the point in the upper right corner (at about 15" and 75 lbs.) were removed, would the correlation become stronger, weaker, or remain about the same?
13) One of your classmates is reading through the program for Friday night’’s football game
Among other things, the program lists the players’’ positions and their weights Your classmate comments, “There is a strong correlation between a player’s position and their weight "
a Explain why your classmate’s statement is in error
13)
14) Match the following descriptions with the most likely correlation coefficient

The number of hours you study and your exam score
The number of siblings you have and your GPA
The number of hours you practice a task and the number of minutes it takes you to complete it.
The number of hours you use a pencil and its length
A -0 78
B 0 13
C 0 46
D 0 89
15) A researcher notes that there is a positive correlation between the temperature on a summer day and the number of bees that he can count in his garden over a 5-minute time span
a. Describe what the researcher means by a positive correlation.
b. If the researcher calculates the correlation coefficient using degrees Fahrenheit instead of Celsius, will the value be different?
16) Match each graph with the appropriate correlation coefficient. 0.98 0.73 0.09 -0.99
15)


17) One your classmates is working on a science project for a unit on weather. She tracks the temperature one day, beginning at sunrise and finishing at sunset. Given that you are know for being the stats expert, she asks you about calculating the correlation for her data What is the best advice you could give her?
17)
MULTIPLE CHOICE. Choose the one alternative that best completes the statement or answers the question.
18) Researchers studying growth patterns of children collect data on the heights of fathers and sons. The correlation between the fathers' heights and the heights of their 16 year-old sons is most likely to be . . .
A) near +1.0
B) near 0
C) near -1 0
D) near +0 7
E) somewhat greater than 1 0
19) The auto insurance industry crashed some test vehicles into a cement barrier at speeds of 5 to 25 mph to investigate the amount of damage to the cars They found a correlation of r = 0 60 between speed (MPH) and damage ($) If the speed at which a car hit the barrier is 1 5 standard deviations above the mean speed, we expect the damage to be ? the mean damage.
A) 0.90 SD above
B) 0.36 SD above
C) equal to
D) 1.5 SD above
E) 0.60 SD above
20) Which scatterplot shows a strong association between two variables even though the correlation is probably near zero?


18)
19)
20)
21) The correlation between X and Y is r = 0 35 If we double each X value, decrease each Y by 0 20, and interchange the variables (put X on the Y-axis and vice versa), the new correlation


A) is 0 70
B) cannot be determined.
C) is 0.35
D) is 0.50
E) is 0.90
22) A consumer group collected information on HDTVs . They created a linear model to estimate the cost of an HDTV (in $) based on the screen size (in inches). Which is the most likely value of the slope of the line of best fit?
A) 700 B) 7 C) 0 70 D) 70 E) 7000
23) The correlation between a family's weekly income and the amount they spend on restaurant meals is found to be r = 0 30 Which must be true?
I Families tend to spend about 30% of their incomes in restaurants
II In general, the higher the income, the more the family spends in restaurants
III. The line of best fit passes through 30% of the (income, restaurant$) data points.
A) II only
B) II and III only
C) III only
D) I, II, and III
E) I only
24) A medical researcher finds that the more overweight a person is, the higher his pulse rate tends to be In fact, the model suggests that 12-pound differences in weight are associated with differences in pulse rate of 4 beats per minute Which is true?
I The correlation between pulse rate and weight is 0 33
II If you lose 6 pounds, your pulse rate will slow down 2 beats per minute
III. A positive residual means a person's pulse rate is higher than the model predicts.
A) II only
B) I only
C) II and III only
D) none
E) III only
25) Education research consistently shows that students from wealthier families tend to have higher SAT scores The slope of the line that predicts SAT score from family income is 6 25 points per $1000, and the correlation between the variables is 0 48 Then the slope of the line that predicts family income from SAT score (in $1000 per point)
A) is 6 25 B) is 0 037 C) is 3 00
D) is 13 02
E) is 0 16
26) A regression analysis of company profits and the amount of money the company spent on advertising found r2 = 0 72 Which of these is true?
I. This model can correctly predict the profit for 72% of companies.
II. On average, about 72% of a company's profit results from advertising.
III. On average, companies spend about 72% of their profits on advertising.
A) none of these
B) II only
C) I and III
D) III only
E) I only
27) A least squares line of regression has been fitted to a scatterplot; the model's residuals plot is shown Which is true?

A) The linear model is poor because the correlation is near 0
B) The linear model is appropriate
C) none of these
D) The linear model is poor because some residuals are large
E) A curved model would be better
SHORT ANSWER. Write the word or phrase that best completes each statement or answers the question.
28) Earning power A college's job placement office collected data about students' GPAs and the salaries they earned in their first jobs after graduation The mean GPA was 2 9 with a standard deviation of 0 4 Starting salaries had a mean of $47,200 with a SD of $8500 The correlation between the two variables was r = 0 72 The association appeared to be linear in the scatterplot (Show work)
a Write an equation of the model that can predict salary based on GPA
b Do you think these predictions will be reliable? Explain
c Your brother just graduated from that college with a GPA of 3 30 He tells you that based on this model the residual for his pay is -$1880. What salary is he earning?
29) Assembly line Your new job at Panasony is to do the final assembly of camcorders. As you learn how, you get faster. The company tells you that you will qualify for a raise if after 13 weeks your assembly time averages under 20 minutes The data shows your average assembly time during each of your first 10 weeks
28)
a. Which is the explanatory variable?
b. What is the correlation between these variables?
c You want to predict whether or not you will qualify for that raise Would it be appropriate to use a linear model? Explain

30) Associations For each pair of variables, indicate what association you expect: positive(+), negative(-), curved(C), or none(N)
a power level setting of a microwave; number of minutes it takes to boil water
b number of days it rained in a month (during the summer); number of times you mowed your lawn that month
c. number of hours a person has been up past a normal bedtime; number of minutes it takes the person to do a crossword puzzle
d number of hockey games played in Minnesota during a week; sales of suntan lotion in Minnesota during that week
e length of a student's hair; number of credits the student earned last year
31) Music and grades (True Story) A couple of years ago, a local newspaper published research results claiming a positive association between the number of years high school children had taken instrumental music lessons and their performances in school (GPA)
a What does "positive association" mean in this context?
b A group of parents then went to the School Board demanding more funding for music programs as a way to improve student chances for academic success in high school. As a statistician, do you agree or disagree with their reasoning? Explain briefly.
32) Gas mileage again In the Data Desk lab last week you analyzed the association between a car's fuel economy and its weight. Another important factor in the amount of gasoline a car uses is the size of the engine. Called "displacement", engine size measures the volume of the cylinders in cubic inches The regression analysis is shown

a How many cars were included in this analysis?
b What is the correlation between engine size and fuel economy?
c. A car you are thinking of buying is available with two different size engines, 190 cubic inches or 240 cubic inches. How much difference might this make in your gas mileage? (Show work)
33) Crawling Researchers at the University of Denver Infant Study Center investigated whether babies take longer to learn to crawl in cold months (when they are often bundled in clothes that restrict their movement) than in warmer months The study sought an association between babies' first crawling age (in weeks) and the average temperature during the month they first try to crawl (about 6 months after birth). Between 1988 and 1991 parents reported the birth month and age at which their child was first able to creep or crawl a distance of four feet in one minute Data were collected on 208 boys and 206 girls The graph below plots average crawling ages (in weeks) against the mean temperatures when the babies were 6 months old The researchers found a correlation of r = -0 70 and their line of best fit was
a Draw the line of best fit on the graph (Show your method clearly )
b Describe the association in context
c Explain (in context) what the slope of the line means
d. Explain (in context) what the y-intercept of the line means.
e. Explain (in context) what R2 means.
f. In this context, what does a negative residual indicate?

MULTIPLE CHOICE. Choose the one alternative that best completes the statement or answers the question.
34) It takes a while for new factory workers to master a complex assembly process During the first month new employees work, the company tracks the number of days they have been on the job and the length of time it takes them to complete an assembly The correlation is most likely to be
A) exactly -1 0
B) near +0.6
C) exactly +1.0
D) near -0.6
E) near 0
35) A lakeside restaurant found the correlation between the daily temperature and the number of meals they served to be 0 40 On a day when the temperature is two standard deviations above the mean, the number of meals they should plan on serving is ? the mean
A) equal to
B) 0.16 SD above
C) 0.4 SD above
D) 2 0 SD above
E) 0 8 SD above
36) For families who live in apartments the correlation between the family's income and the amount of rent they pay is r = 0 60 Which is true?
I In general, families with higher incomes pay more in rent
II On average, families spend 60% of their income on rent
III The regression line passes through 60% of the (income$, rent$) data points
A) I and II only
B) I, II, and III
C) II only
D) I only
E) I and III only
37) A regression analysis of students' AP* Statistics test scores and the number of hours they spent doing homework found r2 = 0.32 . Which of these is true?
I 32% of student test scores can be correctly predicted with this model
II Homework accounts for 32% of your grade in AP* Stats
III There's a 32% chance that you'll get the score this model predicts for you
A) I only
B) III only
C) I and II
D) II only
E) none of these
38) Variables X and Y have r = 0.40. If we decrease each X value by 0.1, double each Y value, and then interchange them (put X on the Y-axis and vice versa) the new correlation will be
39) The residuals plot for a linear model is shown. Which is true?
A) The linear model is okay because approximately the same number of points are above the line as below it

B) The linear model is no good since the correlation is near 0
C) The linear model is no good since some residuals are large
D) The linear model is okay because the association between the two variables is fairly strong
E) The linear model is no good because of the curve in the residuals
40) A regression model examining the amount of weight a football player can bench press found that 10 cm differences in chest size are associated with 8 kg differences in weight pressed Which is true?
I The correlation between chest size and weight pressed is r = 0 80 II. As a player gets stronger and presses more weight his chest will get bigger. III. A positive residual means that the player pressed more than predicted.
41) Suppose we collect data hoping to be able to estimate the prices of commonly owned new cars (in $) from their lengths (in feet). Of these possibilities, the slope of the line of best fit is most likely to be
42) Medical records indicate that people with more education tend to live longer; the correlation is 0 48 The slope of the linear model that predicts lifespan from years of education suggests that on average people tend to live 0 8 extra years for each additional year of education they have The slope of the line that would predict years of education from lifespan is
43) This regression analysis examines the relationship between the number of years of formal education a person has and their annual income. According to this model, about how much more money do people who finish a 4-year college program earn each year, on average, than those with only a 2-year degree?

SHORT ANSWER. Write the word or phrase that best completes each statement or answers the question.
44) Associations For each pair of variables, indicate what association you expect: positive linear(+), negative linear(-), curved(C ), or none(N).
a the number of miles a student lives from school; the student's GPA
b a person's blood alcohol level; time it takes the person to solve a maze
c weekly sales of hot chocolate at a Montana diner; the number of auto accidents that week in that town
d the price charged for fund-raising candy bars; number of candy bars sold
e the amount of rainfall during growing season; the crop yield (bushels per acre)
45) Email At CPU every student gets a college email address. Data collected by the college showed a negative association between student grades and the number of emails the student sent during the semester.
a. Briefly explain what "negative association" means in this context.
b. After seeing this study the college proposes trying to improve academic performance by limiting the amount of email students can send through the college address. As a statistician, what do you think of this plan? Explain briefly
46) Car commercials A car dealer investigated the association between the number of TV commercials he ran each week and the number of cars he sold the following weekend He found the correlation to be r = 0 56 During the time he collected the data he ran an average of 12 4 commercials a week with a standard deviation of 1 8, and sold an average of 30.5 cars with a standard deviation of 4.2. Next weekend he is planning a sale, hoping to sell 40 cars. Create a linear model to estimate the number of commercials he should run this week Write a sentence explaining your recommendation
47) Taxi tires A taxi company monitoring the safety of its cabs kept track of the number of miles tires had been driven (in thousands) and the depth of the tread remaining (in mm). Their data are displayed in the scatterplot They found the equation of the least squares regression line to be tread ^ = 36 - 0.6miles , with r2 = 0.74 .

a Draw the line of best fit on the graph (Show your method clearly )
b. What is the explanatory variable?
c. The correlation r =
d Describe the association in context
e Explain (in context) what the slope of the line means
f Explain (in context) what the y - intercept of the line means
g. Explain (in context) what R2 means.
h In this context, what does a negative residual mean?
MULTIPLE CHOICE. Choose the one alternative that best completes the statement or answers the question.
48) A silly psychology student gathers data on the shoe size of 30 of his classmates and their GPA’s. The correlation coefficient between these two variables is most likely to be
A) exactly –1.0
B) near +0.6
C) exactly +1.0
D) near 0
48)
49) researcher studied the relationship between family income and amount of money spent on an automobile She calculated that R 2 = 45% Which is the correct interpretaion?
A) The car price fluctuates 45% more than income
B) None of these
C) The probability of predicting the correct price of a car is 45%.
D) 45% of the variability in car price can be explained by using income.
E) 45% of the price of the car can be predicted by using income.
50) If r = -0.4 for the relationship between the time of day and amount of coffee in an office worker’s mug, which are true?
I. r2 = -16%
II. There is a linear relationship between time and amount of coffee. III 16% of the variability is correctly predicted by time of day
A) III
B) II and III only
C) I
D) II
E) none of these
51) The relationship between the longevity of an animal’s life and its gestation time is 0 70 If an animal is one standard deviation below average in life expectancy, the gestation time is predicted to be ? below average.
A) 1 SD
B) 0.49 SD
C) none of these
D) 0 7 SD
E) 1 4 SD
52) We can use the length of a man’s hand span to predict his height, with a correlation coefficient of r = 0 60 If change our measurements from cm to m, the new correlation will be
A) none of these
B) 0 006
C) 0 06
D) 6
E) 0.60
53) If a data set has a relationship that is best described by a linear model, than the residual plot will
A) have no pattern with a correlation near 0.
B) none of these
C) also have a linear pattern with a similar correlation.
D) be an unknown shape
E) have a curved pattern, like a parabola
54) A regression model examining the amount of distance a long distance runner runs (in miles) to predict the amount of fluid the runner drinks (ounces) has a slope of 4 6 Which interpretation is appropriate?
A) We predict 4 6 miles for every ounce that is drunk
B) The correlation is needed to interpret this value.
C) Each mile adds 4.6 more ounces.
D) We predict for every mile run, the runner drinks 4.6 more ounces.
E) A runner drinks a minimum of 4.6 oz.
55) A regression equation is found that predicts the increased cost of a home owner’s electricity bill given the number of holiday lights they put on the outside of their house The equation is dollars ^ =
2 5 + 0 02(light) If a house has 400 lights and a $15 increase in their electricity cost, find their residual
A) -$15 B) $5 C) $15 D) -$5 E) $20
56) Computer output in the scenario described in problem #8 reports that s = 2 3 Which is the correct interpretation of this value?
A) The slope of the regression line is 2.3 lights per dollar.
B) The correlation is 2.3.
C) The average prediction error of the regression line is $2.30.
D) The initial cost, even with no lights is $2.30
E) The slope of the regression line is $2.30 per light.
57) Using the equation in number #8 again, if a homeowner doubles the number of lights he uses from 500 to 1000, how much do we predict he will increase his electric bill by?
A) $2 B) $35 C) $12 50 D) $22 50 E) $10
SHORT ANSWER. Write the word or phrase that best completes each statement or answers the question.
58) Associations For each pair of variables, indicate what association you expect: positive linear(+), negative linear(-), curved(C ), or none(N).
a. the number of hours in the sun; the number of mold cultures on a piece of bread
b. the number of hours a store is open; the number of sales the store has
c the number of hours you practice golf; your golf score
d the price of gasoline; the number of families that take summer road trips
e the size of a front lawn; the number of children who live in the house
59) Put to Work Some students have to work part time jobs to pay for college expenses A researcher examined the academic performance of students with jobs versus those without. He found a positive association between the number of hours worked and GPA. Explain what “positive association” means in this context.
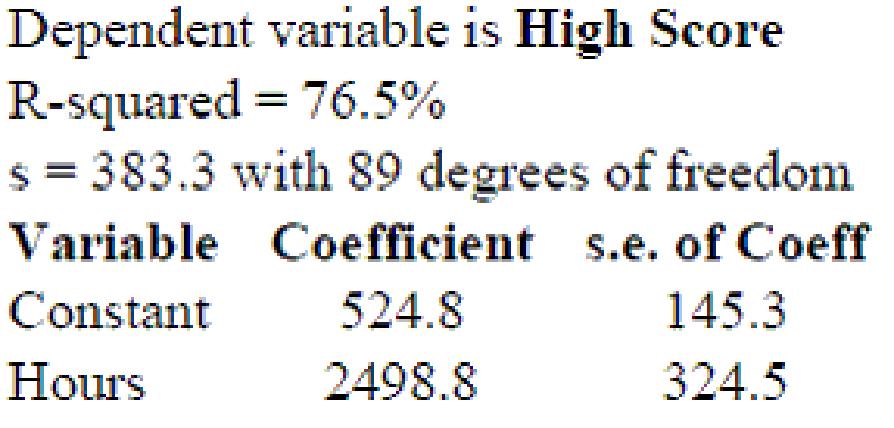
60) High Score The longer you play a video game, the higher score you can usually achieve An analysis of a popular game found the following relationship between the hours a player has played a game and their corresponding high score on that game.
58)
57)
59)
60)
a Write the regression equation and define the variables of your equation in context
b. Interpret the slope in context.
c. Interpret the y-intercept in context.
d. Interpret s in context.
61) Time Wasted A group of students decide to see if there is link between wasting time on the internet and GPA They don’t expect to find an extremely strong association, but they ’re hoping for at least a weak relationship Here are the findings
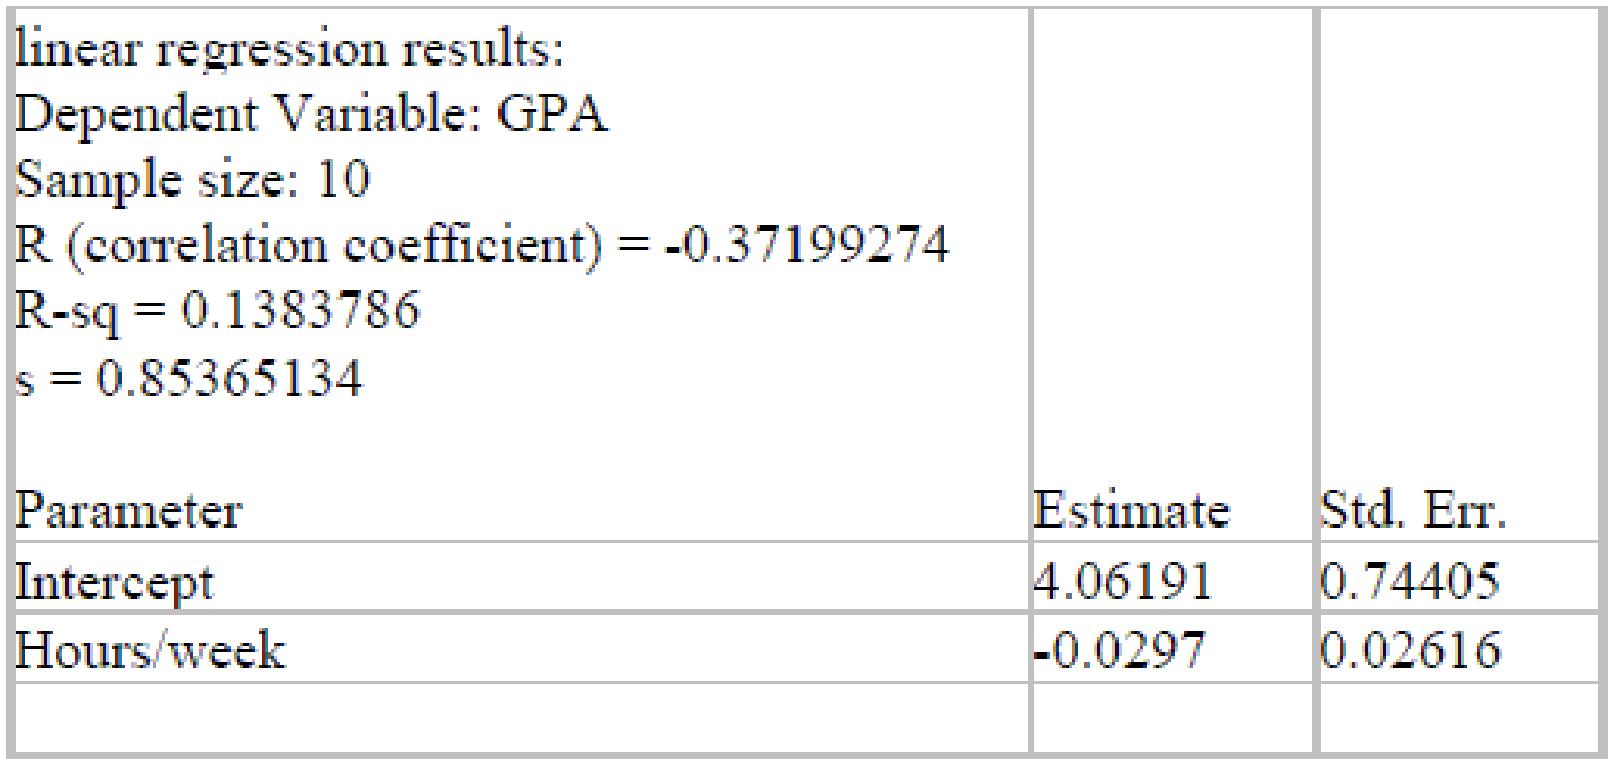
a How strong is the relationship the students found? Describe in context with statistical justification.
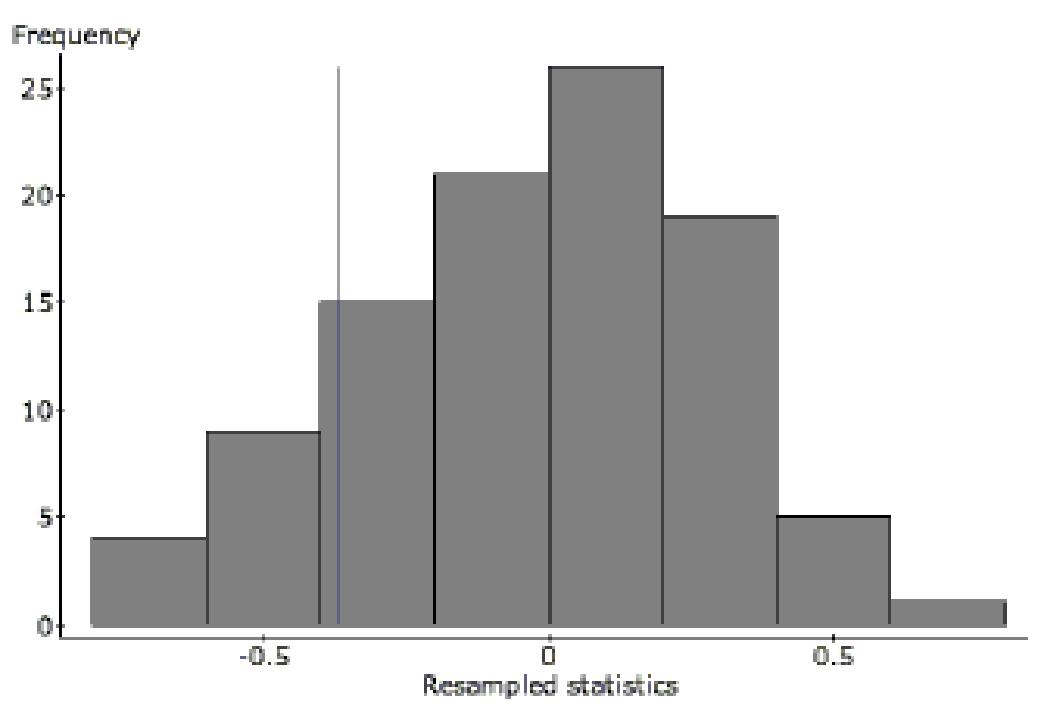
One student is concerned that the relationship is so weak, there may not actually be any relationship at all. To test this concern, he runs a simulation where the 10 GPA’s are randomly matched with the 10 hours/week. After each random assignment, the correlation is calculated. This process is repeated 100 times. Here is a histogram of the 100 correlations The correlation coefficient of -0 371 is indicated with a vertical line
b Do the results of this simulation confirm the suspicion that there may not be any relationship? Refer specifically to the graph in your explanation
An article in the Journal of Statistics Education reported the price of diamonds of different sizes in Singapore dollars (SGD) The following table contains a data set that is consistent with this data, adjusted to US dollars in 2004:
62) Make a scatterplot and describe the association between the size of the diamond (carat) and the cost (in US dollars).

63) Create a model to predict diamond costs from the size of the diamond.
64) Do you think a linear model is appropriate here? Explain
65) Interpret the slope of your model in context
66) Interpret the intercept of your model in context
67) What is the correlation between cost and size?
68) Explain the meaning of R2 in the context of this problem.
69) Would it be better for a customer buying a diamond to have a negative residual or a positive residual from this model? Explain
In an effort to decide if there is an association between the year of a postal increase and the new postal rate for first class mail, the data were gathered from the United States Postal Service. In 1981, the United States Postal Service changed their rates on March 22 and November 1. This information is shown in the table.

70) Make a scatterplot and describe the association between the year and the first class postal rate
71) Create a model to predict postal rates from the year
72) Do you think a linear model is appropriate here? Explain
73) Interpret the slope of your model in context 73)
74) Interpret the intercept of your model in context 74)
75) What is the correlation between year and postal rate?
76) Explain the meaning of R2 in the context of this problem.
77) Would it be better for customers for a year to have a negative residual or a positive residual from this model? Explain

A study examined the number of trees in a variety of orange groves and the corresponding number of oranges that each grove produces in a given harvest year Linear regression was calculated and the results are below
linear regression results:

Dependent Variable: oranges
Independent Variable: trees
Sample size: 9
R-sq = 0.886
s = 31394.7
78) Write the regression equation. Define all variables used in your equation.
79) Interpret the slope in context
81) Does the value of s concern you? How might you deal with this data differently to address this problem?
82) Since r2 is not 100%, there must be other factors in influencing the number of oranges harvested What percentage is that and what is another factor you think might be involved?
83) The farmer with 35 had 15,400 oranges; find the value of his residual Show your work
84) Is the farmer in problem #5 pleased or displeased with the value of his residual? Why?
85) Find the value of the correlation coefficient and interpret this value in context.
86) If these data were collected in California, would you feel confident in using this equation to make predictions about Florida orange groves also? Explain
Solve the problem.
87) The following is a scatterplot of the average final exam score versus midterm score for 11 sections of an introductory statistics class:
The correlation coefficient for these data is r = 0 829 If you had a scatterplot of the final exam score versus midterm score for all individual students in this introductory statistics course, would the correlation coefficient be weaker, stronger, or about the same? Explain.

88) A plot of the residuals versus the fitted values for record-breaking times of female marathon runners for the years 1998 - 2003 is:
Based on this residuals plot, does it seem reasonable to use linear regression for this model? Explain

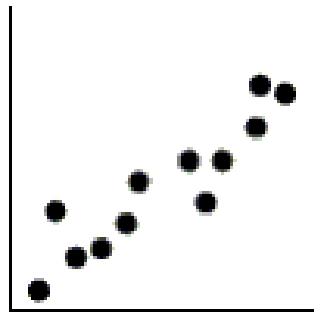
89) Here is a scatterplot of weight versus height for students in an introductory statistics class The men are coded as "1" and appear as circles in the scatterplot; the women are coded as "2" and appear as squares in the scatterplot.

89)
a Do you think there is a clear pattern? Describe the association between weight and height
b. Comment on any differences you see between men and women in the plot.
Current research states that a good diet should contain 20-35 grams of dietary fiber Research also states that each day should start with a healthy breakfast The nutritional information for 77 breakfast cereals was reviewed to find the grams of fiber and the number of calories per serving The scatterplot below shows the relationship between fiber and calories for the cereals

90) Do you think there is a clear pattern? Describe the association between fiber and calories
91) Comment on any unusual data point or points in the data set Explain
92) Do you think a model could accurately predict the number of calories in a serving of cereal that has 22 grams of fiber? Explain
Baseball coaches use a radar gun to measure the speed of pitcher's fastball They also record outcomes such as hits and strikeouts The scatterplot below shows the relationship between the average speed of a fastball and the average number of strikeouts per nine innings for each pitcher on the Bulldogs, based on the past season

93) Do you think there is a pattern? Describe the association between speed and the number of strikeouts 93)
94) Comment on any unusual data point or points in the data set Explain
95) Do you think the association would be stronger or weaker if we used data from one month of the season?
96) Do you think a model based on these data could accurately predict the average number of strikeouts for a pitcher with an average fastball speed of 70 mph ? Explain 96)
Halloween is a fun night It seems that older children might get more candy because they can travel further while trick-or-treating. But perhaps the youngest kids get extra candy because they are so cute. Here are some data that examine this question, along with the regression output.
Dependent Variable: candy
Sample size: 9
R (correlation coefficient) = 0.19534425
R-sq = 0.038159375
s = 11 297554
97) Based on the graph and the regression output, what conclusions do you draw regarding the relationship between age and the number of pieces of candy a trick-or-treater collects?

98) The next day, a young girl reveals that her older brother also went trick-or-treating, but didn’t want to admit that he participated He was added to the data set and these are the results
Dependent Variable: candy
Sample size: 10
R (correlation coefficient) = 0 76362369
R-sq = 0 58312115
s = 12 709041
Describe the effect of this new candy collector on the regression model

Solve the problem
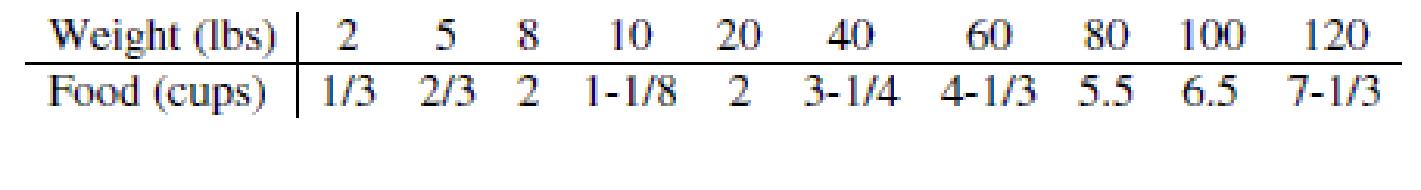
99) If you have a puppy who you are feeding Hill's Science Diet® original puppy food, the feeding guidelines for puppies who are 10 to 12 months old are as follows (Source: Hill's feeding guidelines):
99)
A scatterplot of the data is:
Does it seem reasonable to perform a linear regression to predict amount of food from the puppy's weight based on this data set? Explain

100) You are given the following costs to build a square deck for your house:
100)
a Use re-expressed data to create a model that predicts the cost of the deck based on the width
b Why do you think that your model is appropriate?
c. Find the predicted cost of a square deck that is 10.5 feet wide.

101) The average movie ticket prices in selected years since 1948 are listed in the table below

a. Use re-expressed data to create a model that predicts ticket prices. (Hint: scale the year)
b. Find the movie ticket price this model predicts for 2004.
102) During a chemistry lab, students were asked to study a radioactive element which decays over time The results are in the table

a Model the remaining mass of the element
b Find the predicted amount of the element remaining after thirty minutes
During a science lab, students heated water, allowed it to cool, and recorded the temperature over time They computed the difference between the water temperature and the room temperature The results are in the table

104) Newton's Law of Cooling suggests an exponential function is appropriate Re-express the data using logarithms and sketch a new scatterplot
105) Write the equation of the least-squares regression line for the transformed data Draw the regression line on the scatterplot in question 2 105)

106) Use the equation log(difftemp ^ ) = 2.057 0.025time to predict the difference in temperature after 45 minutes.
107) Use the equation log(difftemp ^ ) = 2.057 0.025time to predict the difference in temperature at time 0 minutes. What does this value represent? 107)
103) Sketch a scatterplot 103) 104)The bigger the stop sign, the more expensive it is Here is a graph of the height of a sign in inches versus its cost in dollars
108) Describe why performing linear regression with these data is not a good decision.


108)
To achieve linearity, the data was transformed using a square root function of cost Here are the results and a residual plot
Dependent Variable: sqrt(cost)
R (correlation coefficient) = 0.98946627
R-sq = 0.97904349
s: 0.2141
109) Do you think this transformation for linearity was successful? Why?
109)
110) Write the transformed regression equation Make sure to define any variables used in your equation
111) Interpret R-sq in the context of this problem
112) Use your equation to predict the cost of a 48" stop sign
MULTIPLE CHOICE. Choose the one alternative that best completes the statement or answers the question. Solve the problem.
113) All but one of these statements contain a mistake. Which could be true?
A) The correlation between the amount of fertilizer used and the yield of beans is 0.42.
B) The correlation between a football player's weight and the position he plays is 0.54.
C) There is a correlation of 0.63 between gender and political party.
D) The correlation between a car's length and its fuel efficiency is 0 71 miles per gallon
E) There is a high correlation (1 09) between height of a corn stalk and its age in weeks
114) Residuals are
A) the difference between observed responses and values predicted by the model
B) data collected from individuals that is not consistent with the rest of the group
C) none of these
D) variation in the data that is explained by the model.
E) possible models not explored by the researcher.
115) Which statement about influential points is true?
I. Removal of an influential point changes the regression line.
II. Data points that are outliers in the horizontal direction are more likely to be influential than points that are outliers in the vertical direction
III Influential points have large residuals
A) II and III
B) I and III
C) I, II, and III
D) I and II
E) I only
116) Which is true?
I Random scatter in the residuals indicates a model with high predictive power
II. If two variables are very strongly associated, then the correlation between them will be near +1.0 or -1.0.
III. The higher the correlation between two variables the more likely the association is based in cause and effect
A) II only
B) I, II, and III
C) none
D) I only
E) I and II
117) A company's sales increase by the same amount each year This growth is
A) linear
B) quadratic
C) power
D) logarithmic
E) exponential
118) Another company's sales increase by the same percent each year. This growth is . . .
A) logarithmic
B) quadratic
C) exponential
D) power
E) linear
119) A scatterplot of 1 y vs x shows a strong positive linear pattern It is probably true that
A) large values of X are associated with large values of Y
B) the residuals plot for regression of Y on X shows a curved pattern
C) the correlation between X and Y is near +1 0
D) the scatterplot of Y vs X also shows a linear pattern
E) accurate predictions can be made for Y even if extrapolation is involved
120) It's easy to measure the circumference of a tree's trunk, but not so easy to measure its height. Foresters developed a model for ponderosa pines that they use to predict the tree's height (in feet) from the circumference of its trunk (in inches): ln h ^ = 1.2 + 1.4(ln C) . A lumberjack finds a tree with a circumference of 60"; how tall does this model estimate the tree to be?
121) Two variables that are actually not related to each other may nonetheless have a very high correlation because they both result from some other, possibly hidden, factor. This is an example of
A) regression.
B) an outlier
C) a lurking variable
D) extrapolation
E) leverage
122) If the point in the upper right corner of this scatterplot is removed from the data set, then what will happen to the slope of the line of best fit (b) and to the correlation (r)?

A) both will increase
B) both will decrease
C) b will decrease, and r will increase
D) both will remain the same
E) b will increase, and r will decrease
SHORT ANSWER. Write the word or phrase that best completes each statement or answers the question.
123) Breaking strength A company manufactures polypropylene rope in six different sizes. To assess the strength of the ropes they test two samples of each size to see how much force (in kilograms) the ropes will hold without breaking The table shows the results of the tests We want to create a model for predicting the breaking strength from the diameter of the rope

123)
a Find a model that uses re-expressed data to straighten the scatterplot
b The company is thinking of introducing a new 25mm rope How strong should it be?
(Write a sentence in context based on one of your models )
124) Math and Verbal Suppose the correlation between SAT Verbal scores and Math scores is 0 57 and that these scores are normally distributed If a student's Verbal score places her at the 90th percentile, at what percentile would you predict her Math score to be?
(SHOW WORK)
124)
125) Penicillin Doctors studying how the human body assimilates medication inject some patients with penicillin, and then monitor the concentration of the drug (in units/cc) in the patients' blood for seven hours The data are shown in the scatterplot First they tried to fit a linear model The regression analysis and residuals plot are shown

a. Find the correlation between time and concentration.

b Using this model, estimate what the concentration of penicillin will be after 4 hours
c Is that estimate likely to be accurate, too low, or too high? Explain
Now the researchers try a new model, using the re-expression log(Concentration) Examine the regression analysis and the residuals plot below

d. Explain why you think this model is better than the original linear model.
e Using this new model, estimate the concentration of penicillin after 4 hours
MULTIPLE CHOICE. Choose the one alternative that best completes the statement or answers the question.
126) All but one of the statements below contain a mistake. Which one could be true?
A) The correlation between weight and length of foot is 0.488.
B) The correlation between the breed of a dog and its weight is 0.435.
C) The correlation between gender and age is -0.171.
D) If the correlation between blood alcohol level and reaction time is 0.73, then the correlation between reaction time and blood alcohol level is -0 73
E) The correlation between height and weight is 0 568 inches per pound
127) A correlation of zero between two quantitative variables means that
A) there is no linear association between the two variables
B) we have done something wrong in our calculation of r
C) there is no association between the two variables
D) re-expressing the data will guarantee a linear association between the two variables.
E) none of these
128) A residuals plot is useful because
I. it will help us to see whether our model is appropriate.
II. it might show a pattern in the data that was hard to see in the original scatterplot.

III. it will clearly identify influential points.
A) I, II, and III
B) I only
C) I and II only
D) II only
E) I and III only
129) Which of the following is not a goal of re-expressing data?
A) Make the scatter in a scatterplot spread out evenly rather than following a fan shape.
B) Make the spread of several groups more alike.
C) Make the form of a scatterplot more nearly linear.
D) Make the distribution of a variable more symmetric.
E) All of these are goals of re-expressing data.
130) The correlation coefficient between the hours that a person is awake during a 24-hour period and the hours that same person is asleep during a 24-hour period is most likely to be
A) exactly +1 0
B) near -0 8
C) near 0
D) exactly -1.0
E) near +0 8
131) The correlation coefficient between high school grade point average (GPA) and college GPA is 0.560. For a student with a high school GPA that is 2.5 standard deviations above the mean, we would expect that student to have a college GPA that is the mean
A) 0 56 SD above B) 2 5 SD above C) equal to D) 1 4 SD above
132) A regression analysis of students' college grade point averages (GPAs) and their high school GPAs found R2 = 0 311 Which of these is true?
I High school GPA accounts for 31 1% of college GPA
II 31 1% of college GPAs can be correctly predicted with this model
III 31 1% of the variance in college GPA can be accounted for by the model
A) I only
B) I and II
C) none of these
D) II only
E) III only
133) Although there are annual ups and downs, over the long run, growth in the stock market averages about 9% per year A model that best describes the value of a stock portfolio is probably:
A) linear
B) power
C) logarithmic
D) exponential
E) quadratic
134) When using midterm exam scores to predict a student's final grade in a class, the student would prefer to have a
A) positive residual, because that means the student's final grade is higher than we would predict with the model.
B) residual equal to zero, because that means the student's final grade is exactly what we would predict with the model
C) positive residual, because that means the student's final grade is lower than we would predict with the model
D) negative residual, because that means the student's final grade is lower than we would predict with the model
E) negative residual, because that means the students final grade is higher than we would predict with the model.
135) The model distance ^ = 3 30 + 0 235(speed) can be used to predict the stopping distance (in feet) for a car traveling at a specific speed (in mph) According to this model, about how much distance will a car going 65 mph need to stop?
A) 18.6 feet B) 4.3 feet
C) 729.0 feet
D) 345.0 feet
131)
132)
133)
134)
135)
SHORT ANSWER Write the word or phrase that best completes each statement or answers the question
136) Storks Data show that there is a positive association between the population of 17 European countries and the number of stork pairs in those countries
a Briefly explain what "positive association" means in this context
b Wildlife advocates want the stork population to grow, and jokingly suggest that citizens should be encouraged to have children As a statistician, what do you think of this suggestion? Explain briefly
137) Personal debt According to The World Almanac and Book of Facts 2004, the debt per capita for the years 1990-2001 gives the following scatterplot:

136)
Regression output gives the equation of the regression line as
Debt
^ = 2,231,226 +1128(Year ) with R2 = 98 8%
a What is the response variable?
b What is the correlation coefficient r?
c. Explain in context what the slope of the line means.
d Explain in context what R2 = 98 8% means
e. You decide to take a look at a residuals plot before making any predictions. Based on the following residuals plot, does linear regression seem appropriate for these data?
137)

138) Studying for exams A philosophy professor has found a correlation of 0 80 between the number of hours students study for his exams and their exam performance During the time he collected the data, students studied an average of 10 hours with a standard deviation of 2 5 hours, and scored an average of 80 points with a standard deviation of 7 5 points.
a. Create a linear model to estimate the number of points a student will score on the next exam from the number of hours the student studies

b If a student studies for 15 hours, what score should the student expect on the next exam? Show your work
139) Height and weight Suppose that both height and weight of adult men can be described with Normal models, and that the correlation between these variables is 0 65 If a man's height places him at the 60th percentile, at what percentile would you expect his weight to be?
140) Carbon dating QuarkNet, a project funded by the National Science Foundation and the U S Department of Energy, poses the following problem on its website: "Last year, deep within the Soudan mine, QuarkNet teachers began a long-term experiment to measure the amount of carbon-14 remaining in an initial 100-gram sample at 2000-year intervals. The experiment will be complete in the year 32001. Fortunately, a method for sending information backwards in time will be discovered in the year 29998, so, although the experiment is far from over, the results are in." Here is a portion of the data:
138)
A scatterplot of these data looks like:
a Straighten the scatterplot by re-expressing these data and create an appropriate model for predicting the mass from the year
b. Use your model to estimate what the mass will be after 7500 years.

c. Can you use your model to predict when 50 g of the sample will be left? Explain.
139)
MULTIPLE CHOICE Choose the one alternative that best completes the statement or answers the question
141) All but one of the statements below contain a mistake. Which one could be true?
A) The correlation between the species of tree and its height is r = 0 56
B) The correlation between age and weight of a newborn baby is r = 0 83 oz per day
C) The correlation between blood alcohol level and reaction time is r = 0 73
D) There is a high correlation between cigarette smoking and gender
E) The correlation between a person's age and vision (20/20?) is r = -1 04
142) Which statement about correlation is true?
I Regression based on data that are summary statistics tends to result in a higher correlation
II If r2 = 0 95, the response variable increases as the explanatory variable increases
III An outlier always decreases the correlation
A) I only
B) none of these
C) I, II, and III
D) II only
E) III only
143) Which statement about residuals plots is true?
I A curved pattern indicates nonlinear association between the variables
II A pattern of increasing spread indicates the predicted values become less reliable as the explanatory variable increases
III Randomness in the residuals indicates the model will predict accurately
A) I, II, and III
B) I only
C) II only
D) I and II only
E) I and III only
144) Which of the following is not a source of caution in regression between two variables?
A) an outlier
B) All of these are potential problems
C) subgroups with differences
D) a lurking variable
E) extrapolation
145) Which statement about re-expressing data is not true?
I Unimodal distributions that are skewed to the left will be made more symmetric by taking the square root of the variable
II. A curve in which the direction of the association changes from negative to positive will not benefit from re-expression.
III. One goal of re-expression may be to make the variability of the response variable more uniform.
A) II and III
B) I, II, and III
C) III only
D) II only
E) I only
146) Over the past decade a farmer has been able to increase his wheat production by about the same number of bushels each year His most useful predictive model is probably
A) exponential
B) power
C) linear
D) logarithmic
E) quadratic
147) Another farmer has increased his wheat production by about the same percentage each year. His most useful predictive model is probably…
A) linear
B) power
C) logarithmic
D) exponential
E) quadratic
148) The model str ^ = 12 + 20dia can be used to predict the breaking strength of a rope (in pounds) from its diameter (in inches) According to this model, how much force should a rope one-half inch in diameter be able to withstand?
A) 4 7 lbs B) 484 lbs C) 22 lbs D) 256 lbs E) 16 lbs
149) A scatterplot of log(Y) vs log(X) reveals a linear pattern with very little scatter It is probably true that

A) the correlation between X and Y is near +1.
B) the residuals plot for regression of Y on X shows a curved pattern.
C) the scatterplot of Y vs X shows a linear association.
D) the calculator's LnReg function will model the association between X and Y.
E) the correlation between X and Y is near 0
150) If the point in the upper left corner of the scatterplot is removed, what will happen to the correlation (r) and the slope of the line of best fit (b)?
148)
A) r will increase and b will decrease.
B) Both will decrease.
C) r will decrease and b will increase
D) Both will increase
E) They will not change
SHORT ANSWER Write the word or phrase that best completes each statement or answers the question
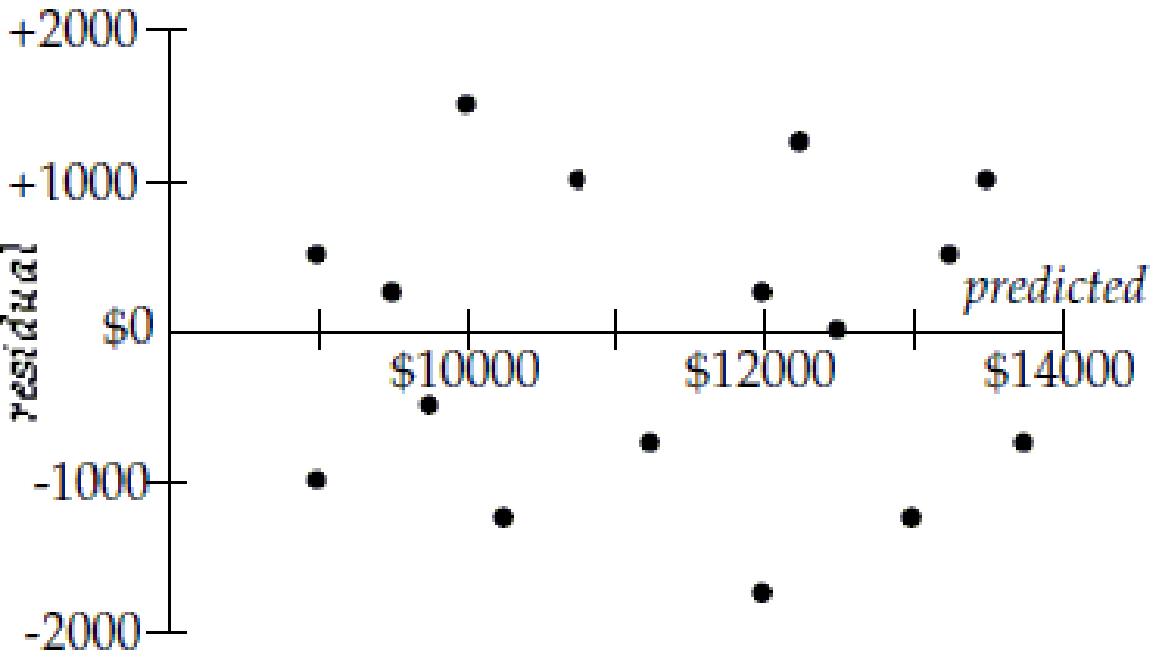
151) Subaru costs Data collected from internet ads for 1999 Subarus were used to create a model to estimate the asking price of the car based on the number of miles it had been driven. The model has r2 = 0.47 and equation Price ^ = 15,327 0.11(Miles) . The plot of residuals versus the predicted price is shown.
151)
a Do you think you could make accurate estimates of Subaru prices with this model? Explain.
b. Interpret the slope of the line.
c. One of the cars in the data set had been driven 42,000 miles. How much was the owner asking for it? (Show work )
152) Penicillin assimilation Doctors studying how the human body assimilates medication inject a patient with penicillin, and then monitor the concentration of the drug in the patient's blood for several hours The data are shown in the table

152)
a Straighten the scatterplot by re-expressing these data and create an appropriate model for predicting the concentration of penicillin
b. Use your model to estimate what the concentration of penicillin will be after 8 hours.
153) Blood pressure and cholesterol Suppose that both blood pressure and cholesterol levels of adult women can be described with Normal models, and that the correlation between these variables is 0.60. If a woman's blood pressure places her at the 88th percentile, at what percentile would you predict her cholesterol level to be?
154) Maple trees A forester would like to know how big a maple tree might be at age 50 years She gathers data from some trees that have been cut down, and plots the diameters (in inches) of the trees against their ages (in years) First she makes a linear model The scatterplot and residuals plot are shown
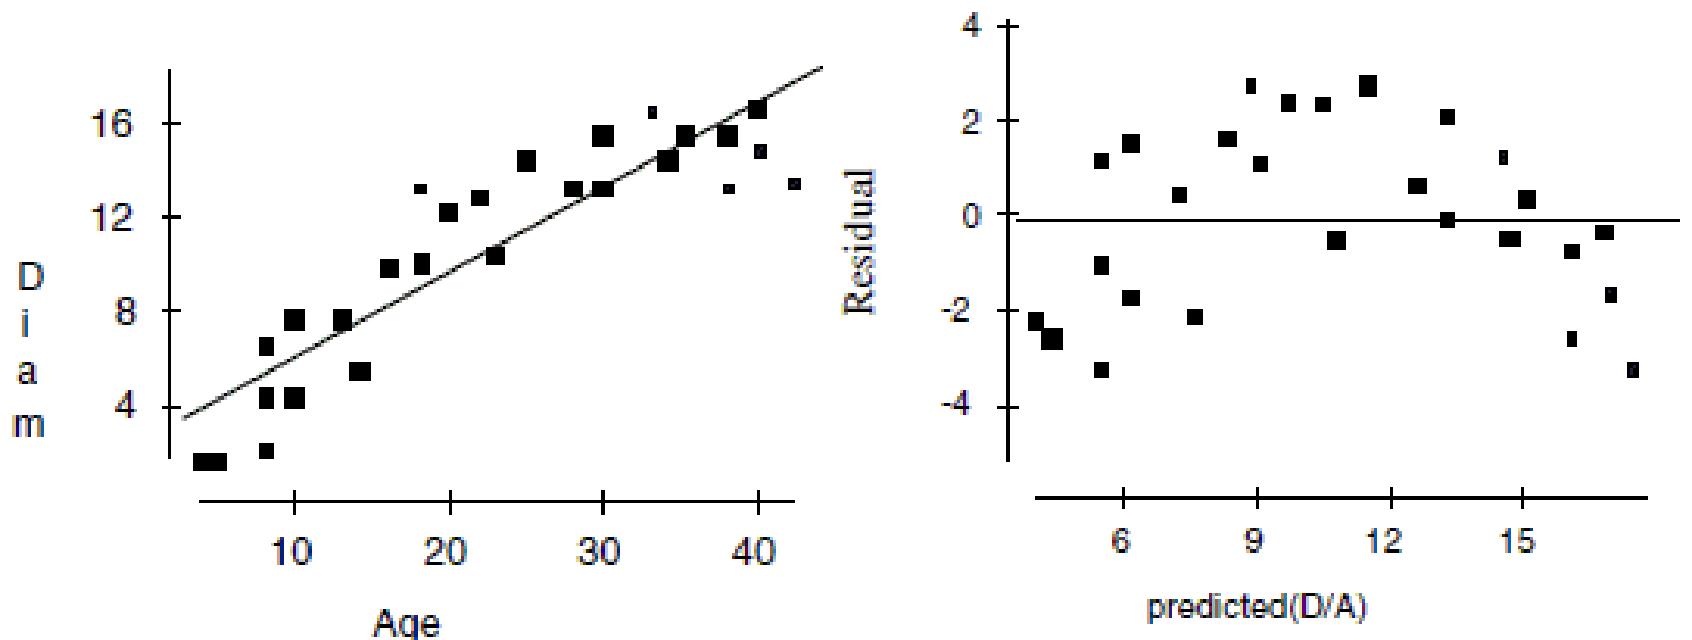
a. Describe the association shown in the scatterplot.

b Do you think the linear model is appropriate? Explain
c If she uses this model to try to predict the diameter of a 50-year old maple tree, would you expect that estimate to be fairly accurate, too low, or too high? Explain

Now she re-expresses the data, using the logarithm of age to try to predict the diameter of the tree Here are the regression analysis and the residuals plot
d Explain why you think this is a better model
e Using this model, predict the diameter of a maple tree at age 50 years
MULTIPLE CHOICE Choose the one alternative that best completes the statement or answers the question
155) All but one of the statements below contain a mistake. Which one could be true?
A) The number of apricots on a tree and the amount of fertilizer have a 1 12 correlation
B) There is a strong correlation between type of preferred pet and income level
C) The correlation between the height of a bean plant and the day is 0 78 in/day
D) The correlation between the time it takes to get ready in the morning and gender is 0 78
E) The correlation between your golf score and the number of hours you practice is -0 36
156) R-sq is a measure of
A) the change in the y-variable that corresponds with the change in the x-variable
B) the probability that the regression line makes a correct prediction
C) the initial predicted starting point of the response variable when x is zero
D) the percentage of the accuracy of the regression equation.
E) the proportion of the variability in the response variable that is explained by the explanatory variable
157) If a data point is influential it…
A) is guaranteed to be extreme in the vertical direction.
B) will change the slope of the regression equation
C) is guaranteed to be extreme in the horizontal direction
D) has a small residual
E) none of these
158) The relationship between the number of hours a person practices a task and the time it takes them to complete the task is calculated to have R-sq = 56 7% The value of the correlation coefficient is A) -0 753
-0 238
0 238
159) A residual plot that has no pattern is a sign that…
A) the model is not a good one, because there is no pattern.
B) the original data is curved and the regression line is a good model.
C) the original data is curved and the regression line is not a good model.
D) the original data is straight and the regression line is a good model.
E) the original data is straight and the regression line is not a good model.
160) The price of first class stamp has followed inflation over time and has increased at a constant percentage over time The most useful predictive model is probably
A) exponential
B) quadratic
C) linear
D) power
E) logarithmic
161) A business owner notes that for every extra hour his store is open, his total sales increase by a fixed amount. His most useful predictive model is probably...
A) linear
B) quadratic
C) power
D) exponential
160)
161)
162) In predicting the growth of the volume of a small bay by measuring the height of the water at a dock, a researcher is using a model of 3 volume ^ = 2.34 + 4.56(height), where height is measured in m and volume cubic miles If the height rises to 3 45 m, what is the predicted volume?
A) 7 × 10⁷ m 3
B) 2.62 m 3
C) 18.1 m 3
D) 5902 m 3
E) 1 2 × 10¹² m 3
An 8th grade class develops a linear model that predicts the number of cheerios (a small round cereal) that fit on the circumference of a plate by using the diameter in inches. Their model is cheerios ^ = 0.56 + 5.11(diameter).
163) The slope of this model is best interpreted in context as
A) For every 1 inch of diameter, the circumference holds about 0 56 more cheerios
B) It takes 5.11 cheerios to fill a plate's circumference.
C) A mistake, because π is about 3.14 and that should be the slope.
D) For every 5.11 inches of diameter, the circumference is about 1 cheerio bigger.
E) For every 1 inch of diameter, the circumference holds about 5.11 more cheerios.
164) If the diameter is increased from 4 inches to 14 inches, the predicted number of cheerios will increase by about…
A) 10
B) 51
C) 72
D) none of these
E) 21
SHORT ANSWER. Write the word or phrase that best completes each statement or answers the question. Solve the problem.
165) Mistakes. Describe the mistake made in the following analyses:
a Ten teachers compute their average test scores for all their students Then the superintendent collects their data and finds the school average He repeats this process for eight different schools and finds a positive correlation between the age of the school average age of the teachers at a school and their average score
165)
163)
164)