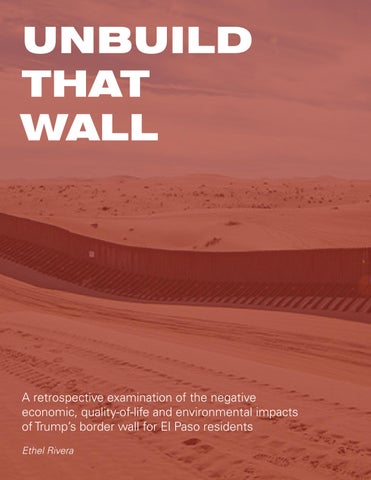
UNBUILD THAT WALL
A retrospective examination of the negative economic, quality-of-life and environmental impacts of Trump’s border wall for El Paso residents
Ethel Rivera
INTRODUCTION
Promoted as a definitive solution to immigration, the U.S.–Mexico border wall became one of the most visible legacies of the Trump administration, with over 700 miles constructed nationwide. Yet in El Paso—a city long characterized by cross-border interdependence— the wall has produced complex social, economic, and environmental consequences that extend far beyond its physical footprint. This project uses a multi-scalar spatial analysis to examine how the border wall has reshaped urban form, ecological systems, and everyday quality of life in El Paso, revealing how federal border policy materializes in—and disrupts—the lived environment of a border city.
CONTEXT
LOCATION
GREEN SPACE + WATER POPULATION
QUALITY OF LIFE
CANCER PREVALENCE
ACCESS TO CARE
HEALTH MCDA PARKS + RECREATION DIABETES PREVALENCE
ECONOMICS ECOLOGY
POVERTY
POPULATION 2014 POPULATION 2024 LATINX POPULATION BIVARIATE
POVERTY
QUALITY OF LIFE MCDA FLOOD ZONES
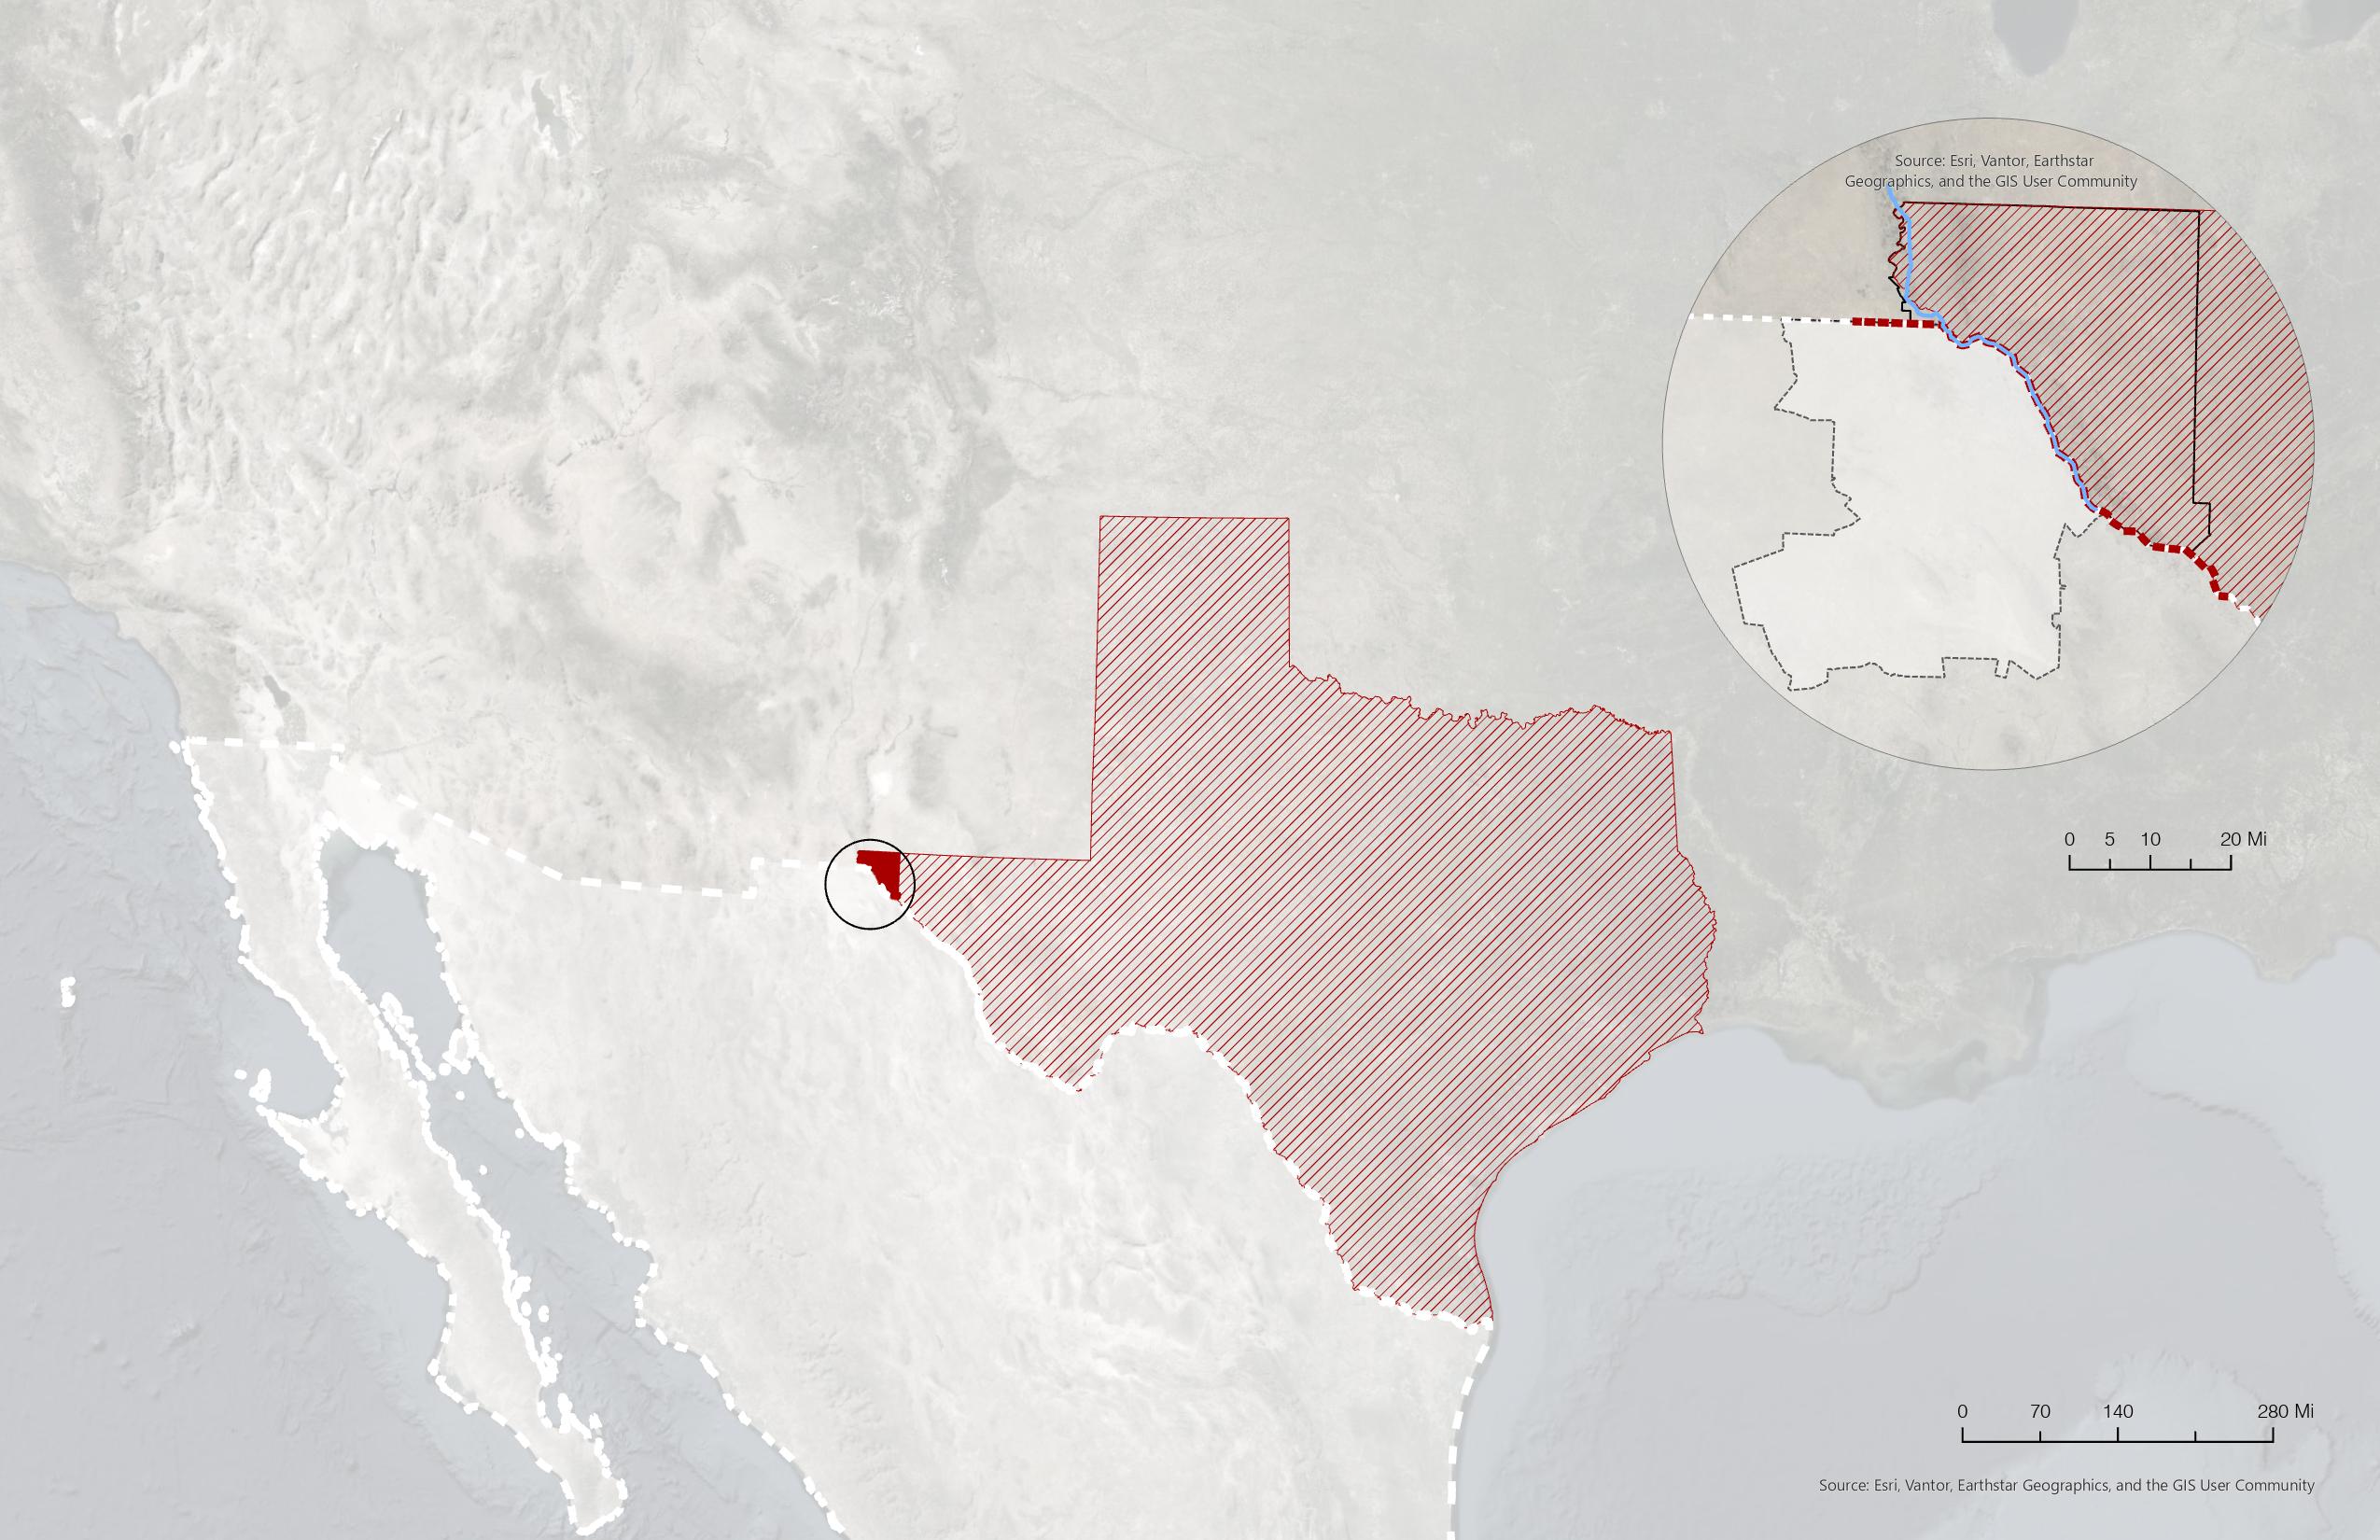
El Paso’s position along the U.S.–Mexico border and the Rio Grande has historically defined it as a space of movement, exchange, and interdependence. As a key crossing corridor for migrants and goods, the city’s urban and social fabric has evolved in direct relationship to the border landscape. The decision by the Trump administration to expand the border wall beginning in 2017 marked a significant shift, recasting this shared corridor as a hardened boundary with lasting spatial and social implications.
Texas
Border
wall
Sources: INEGI SCINCE (Mexico Data), US Census TIGERLine (US Data)
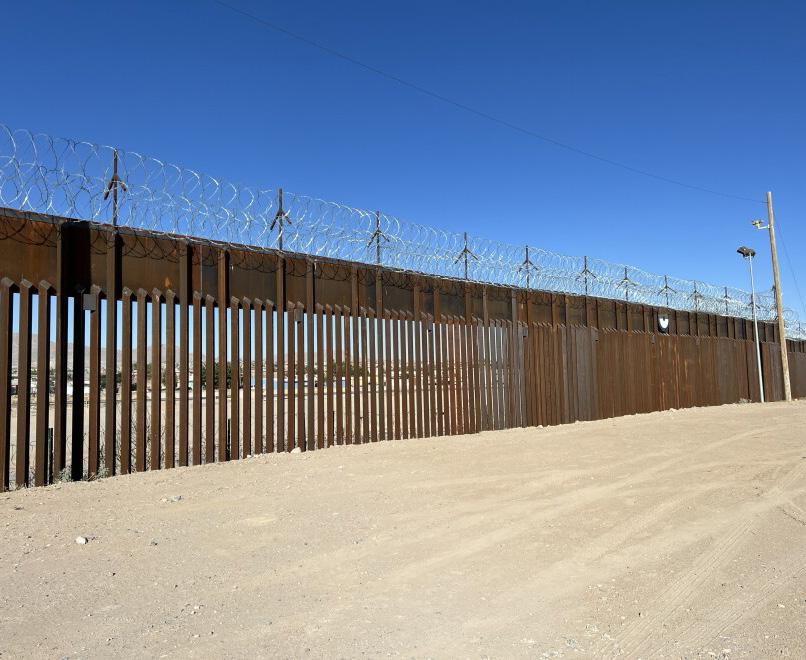
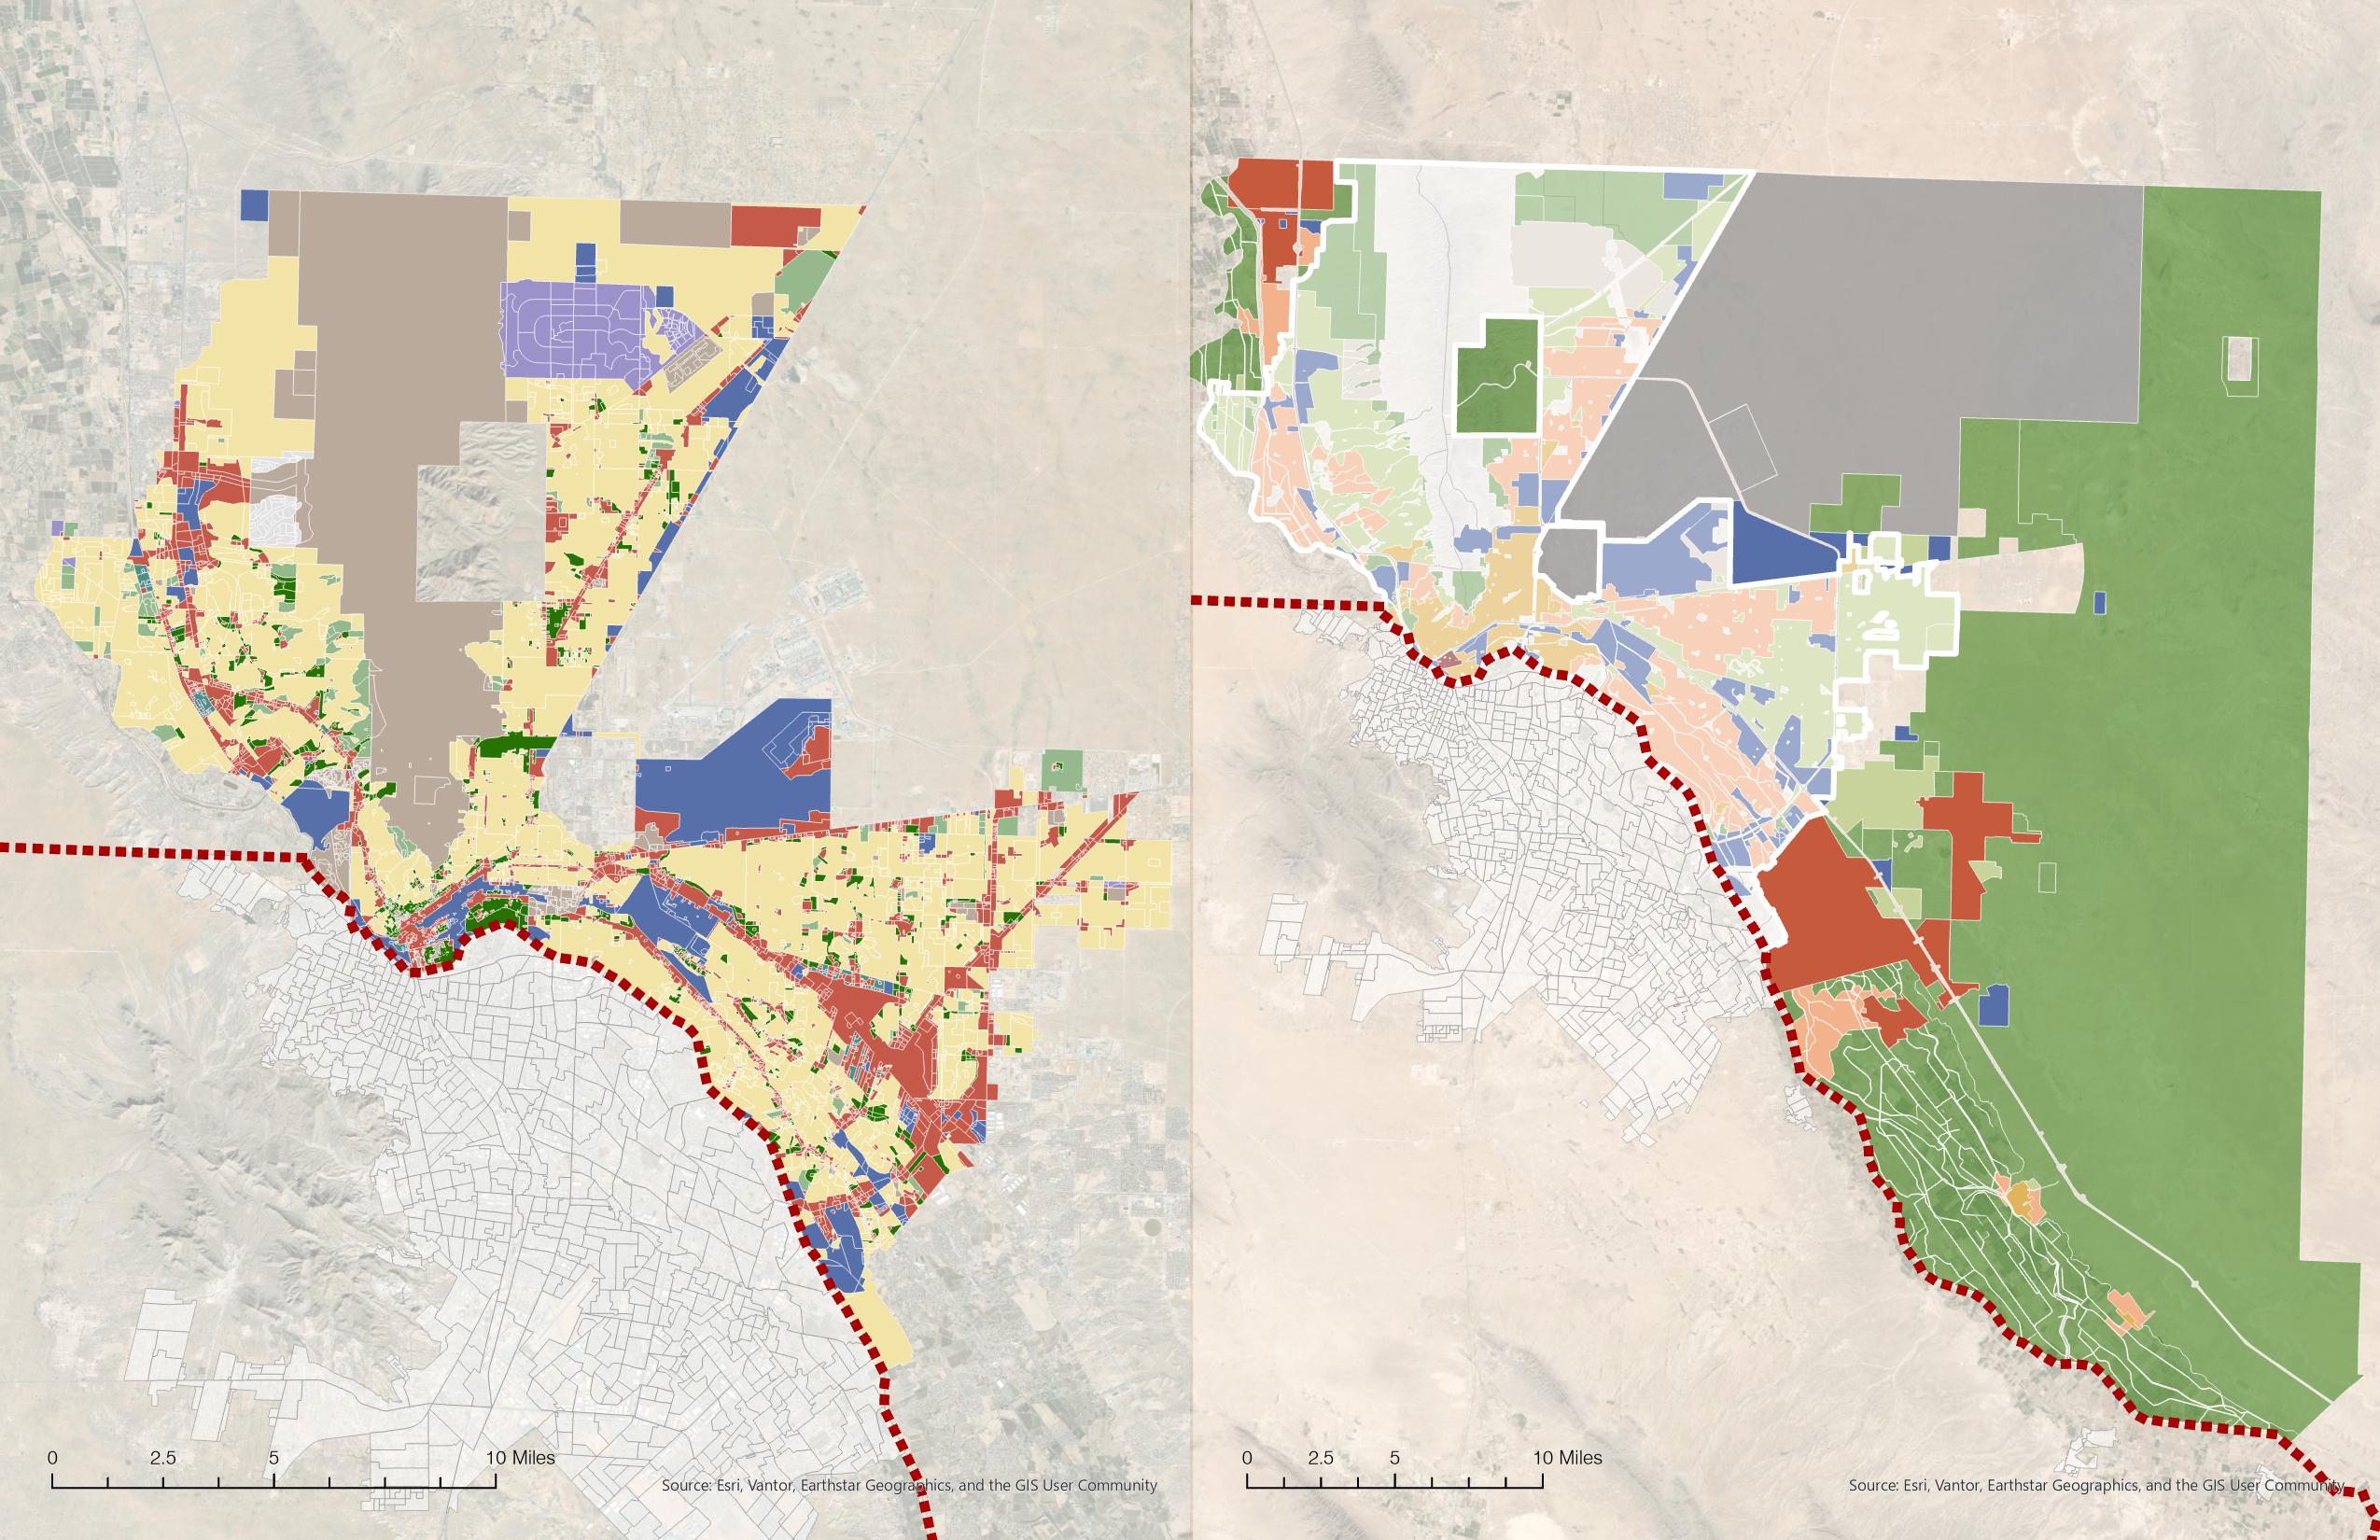
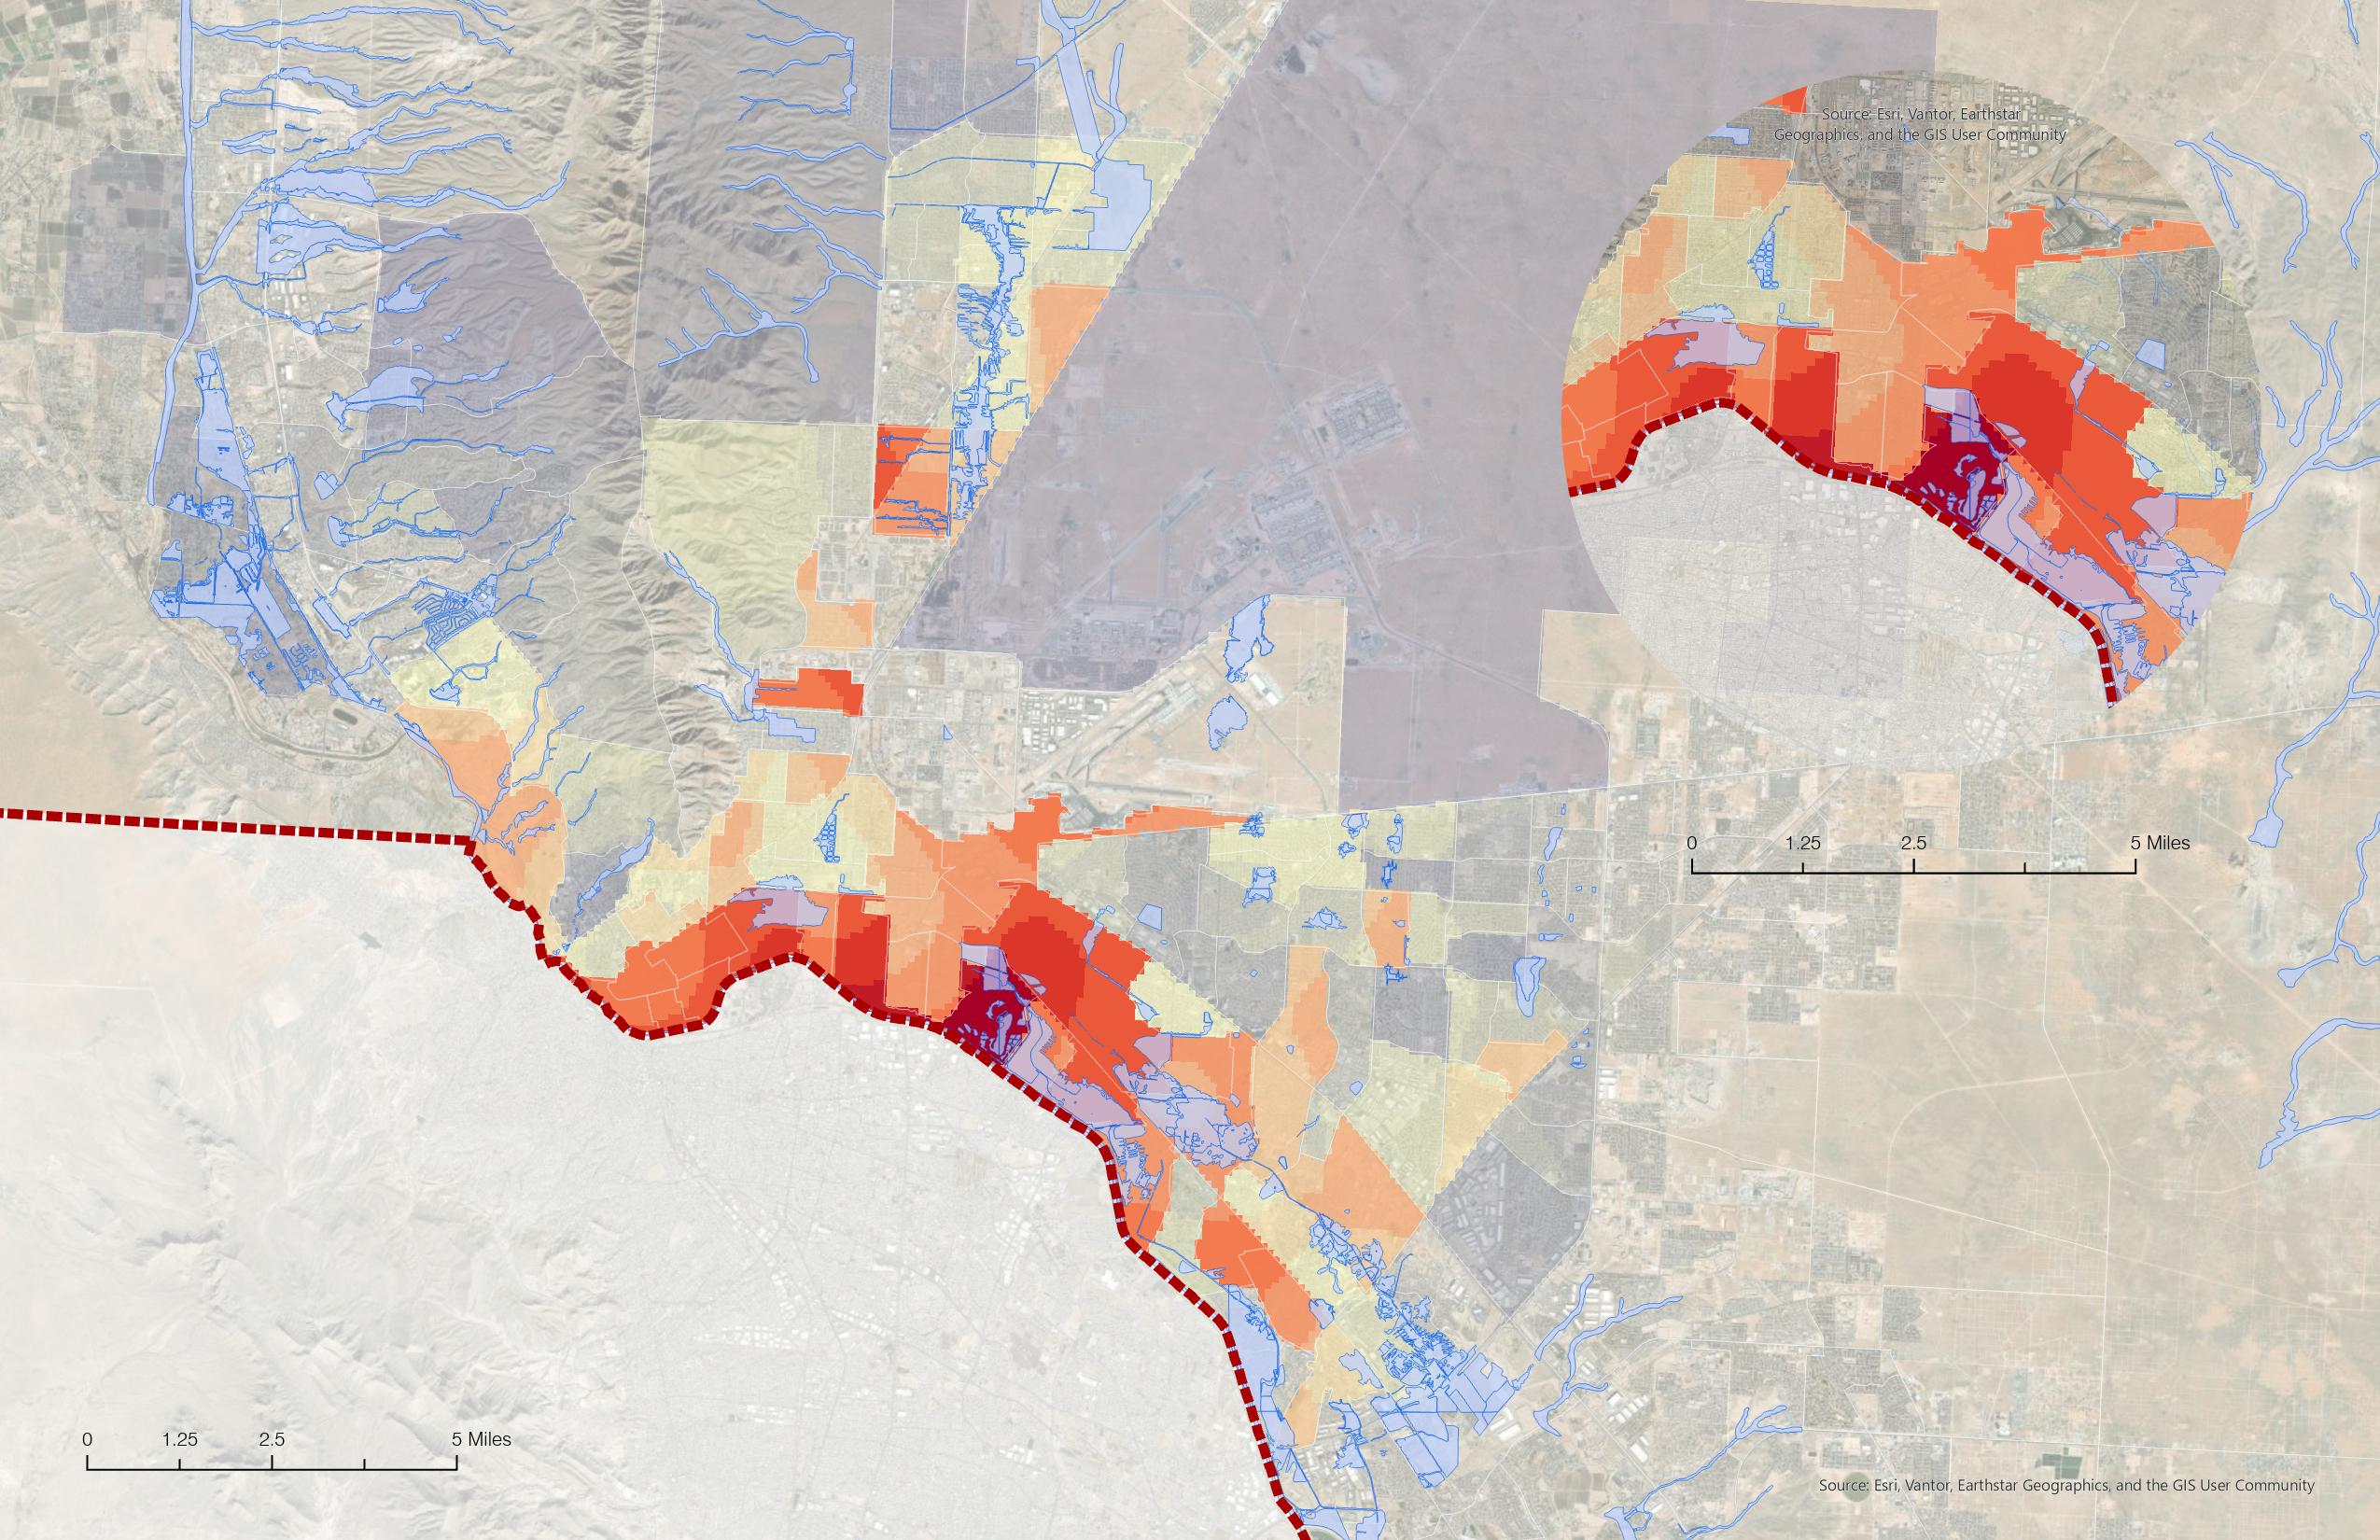
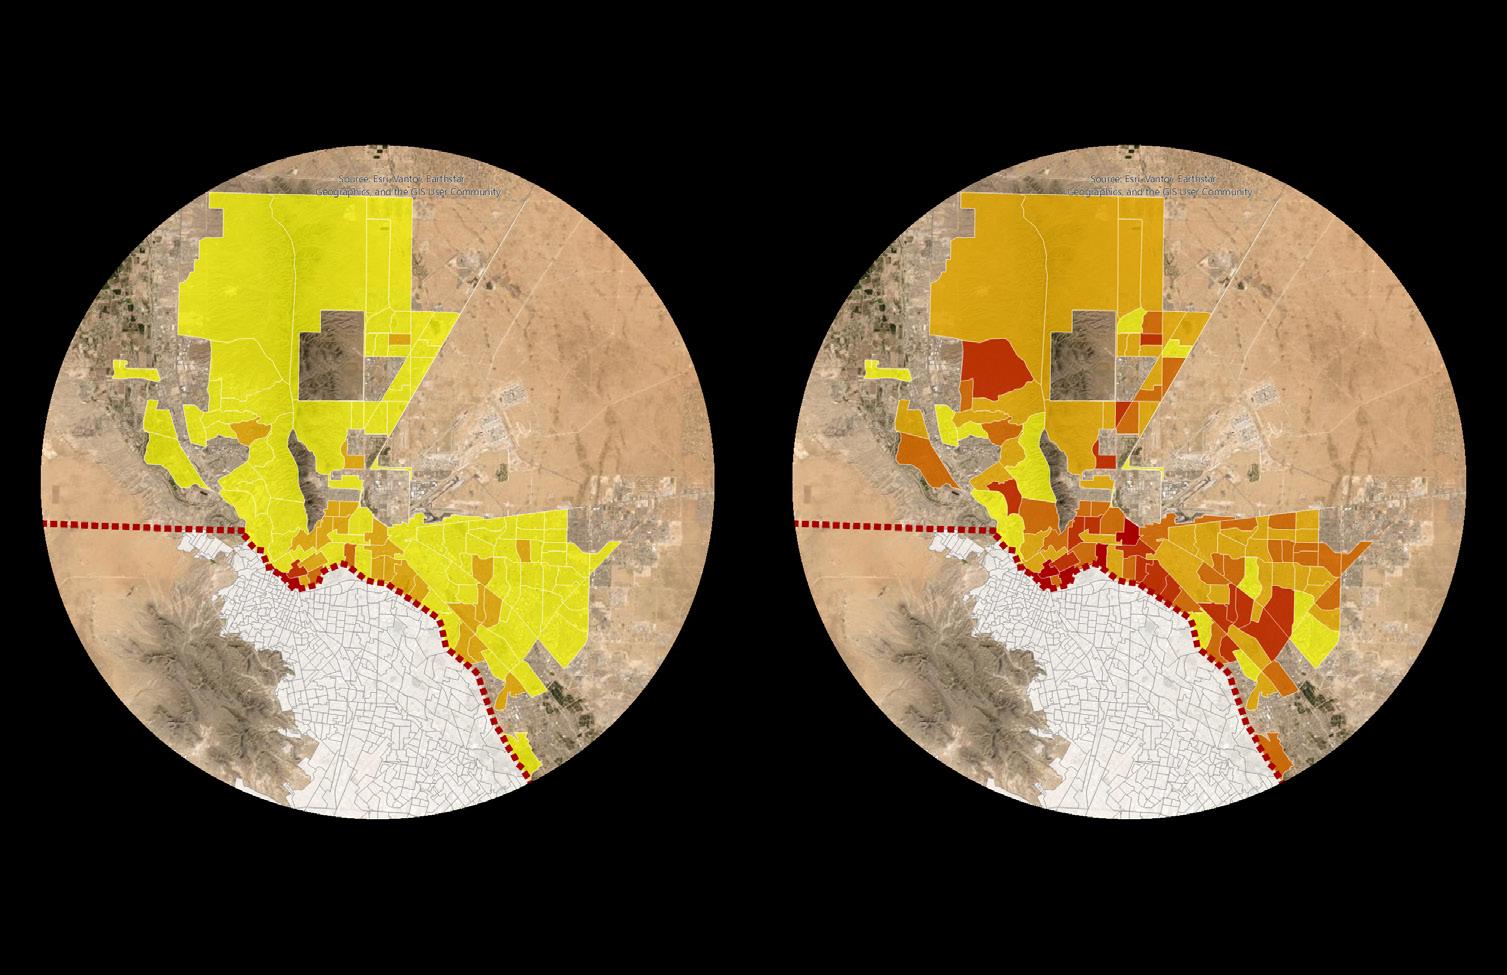
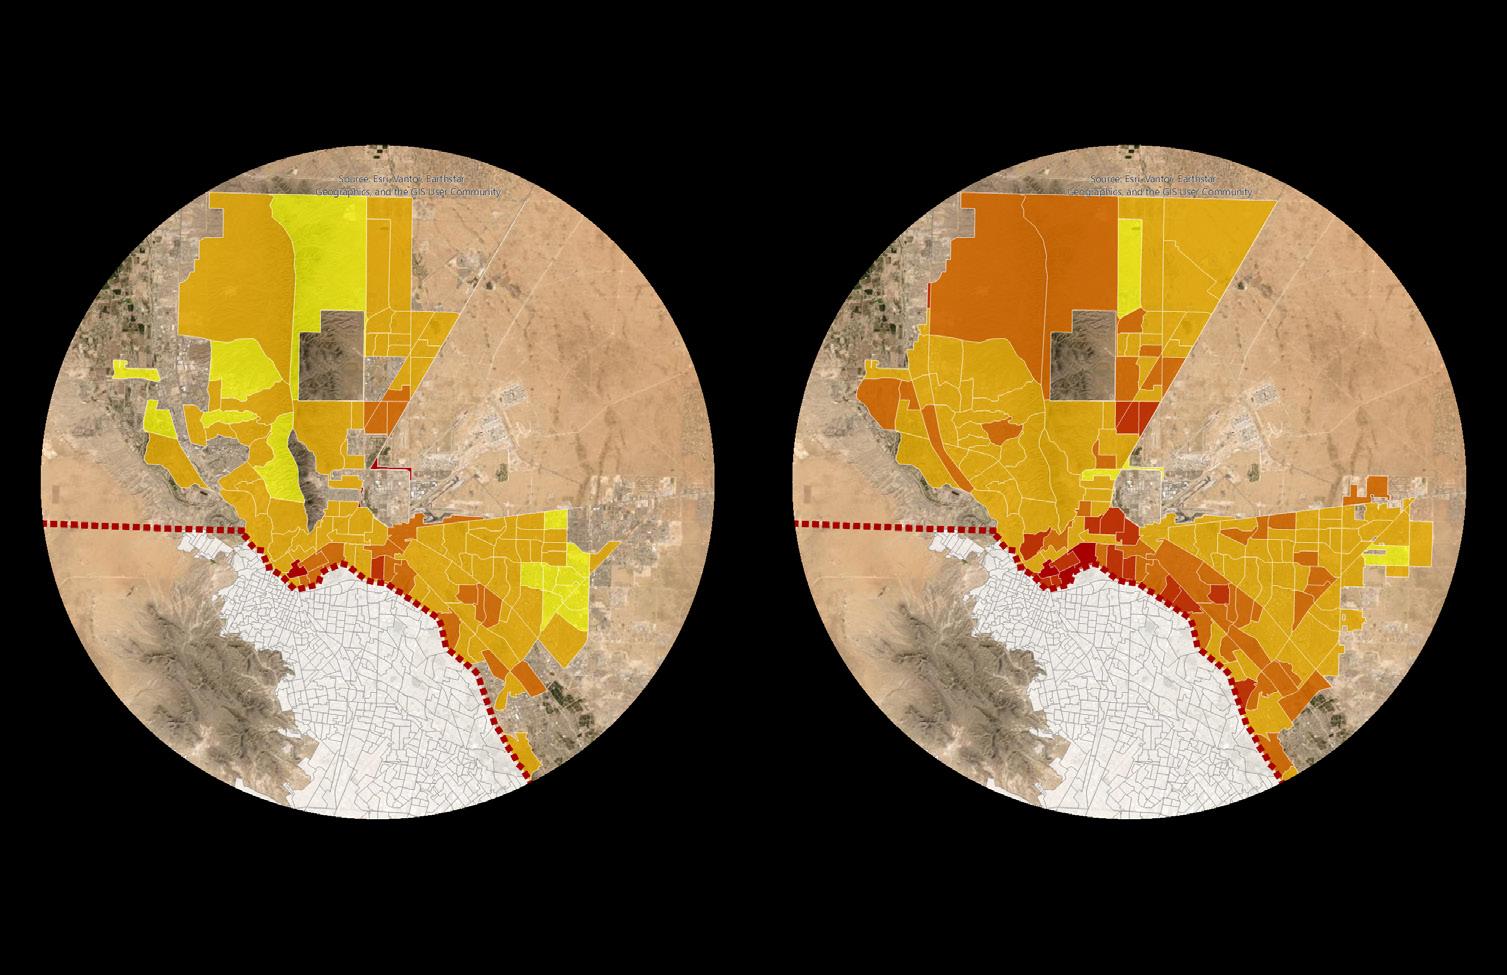
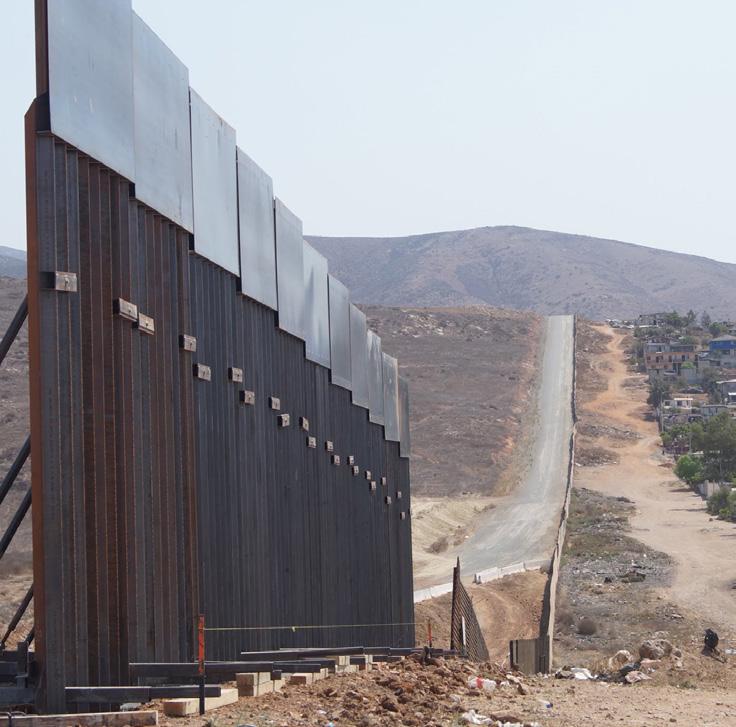
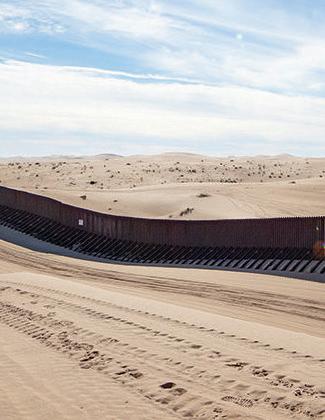
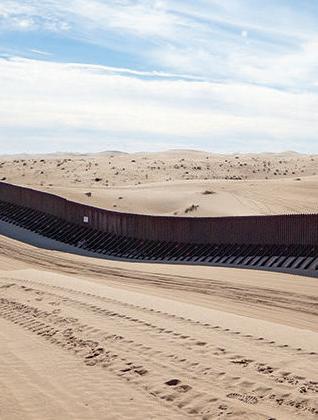
INHOSPITABLE LANDS
The physical landscape surrounding the border wall is characterized by arid, fragmented, and largely uninhabited terrain. As illustrated in the adjacent map, green space and surface water are notably scarce along the El Paso–Ciudad Juárez border corridor. While certain areas are classified as “green space” in spatial datasets, on-the-ground conditions reveal these spaces to be dry, vacant, and largely unusable. Together, these conditions produce a continuous buffer of inhospitable and, at times, unsafe urban space on both sides of the border wall.
Census tracts (US), AGEB (Mexico)
Open spaces
Rio Grande
US-MX Border wall
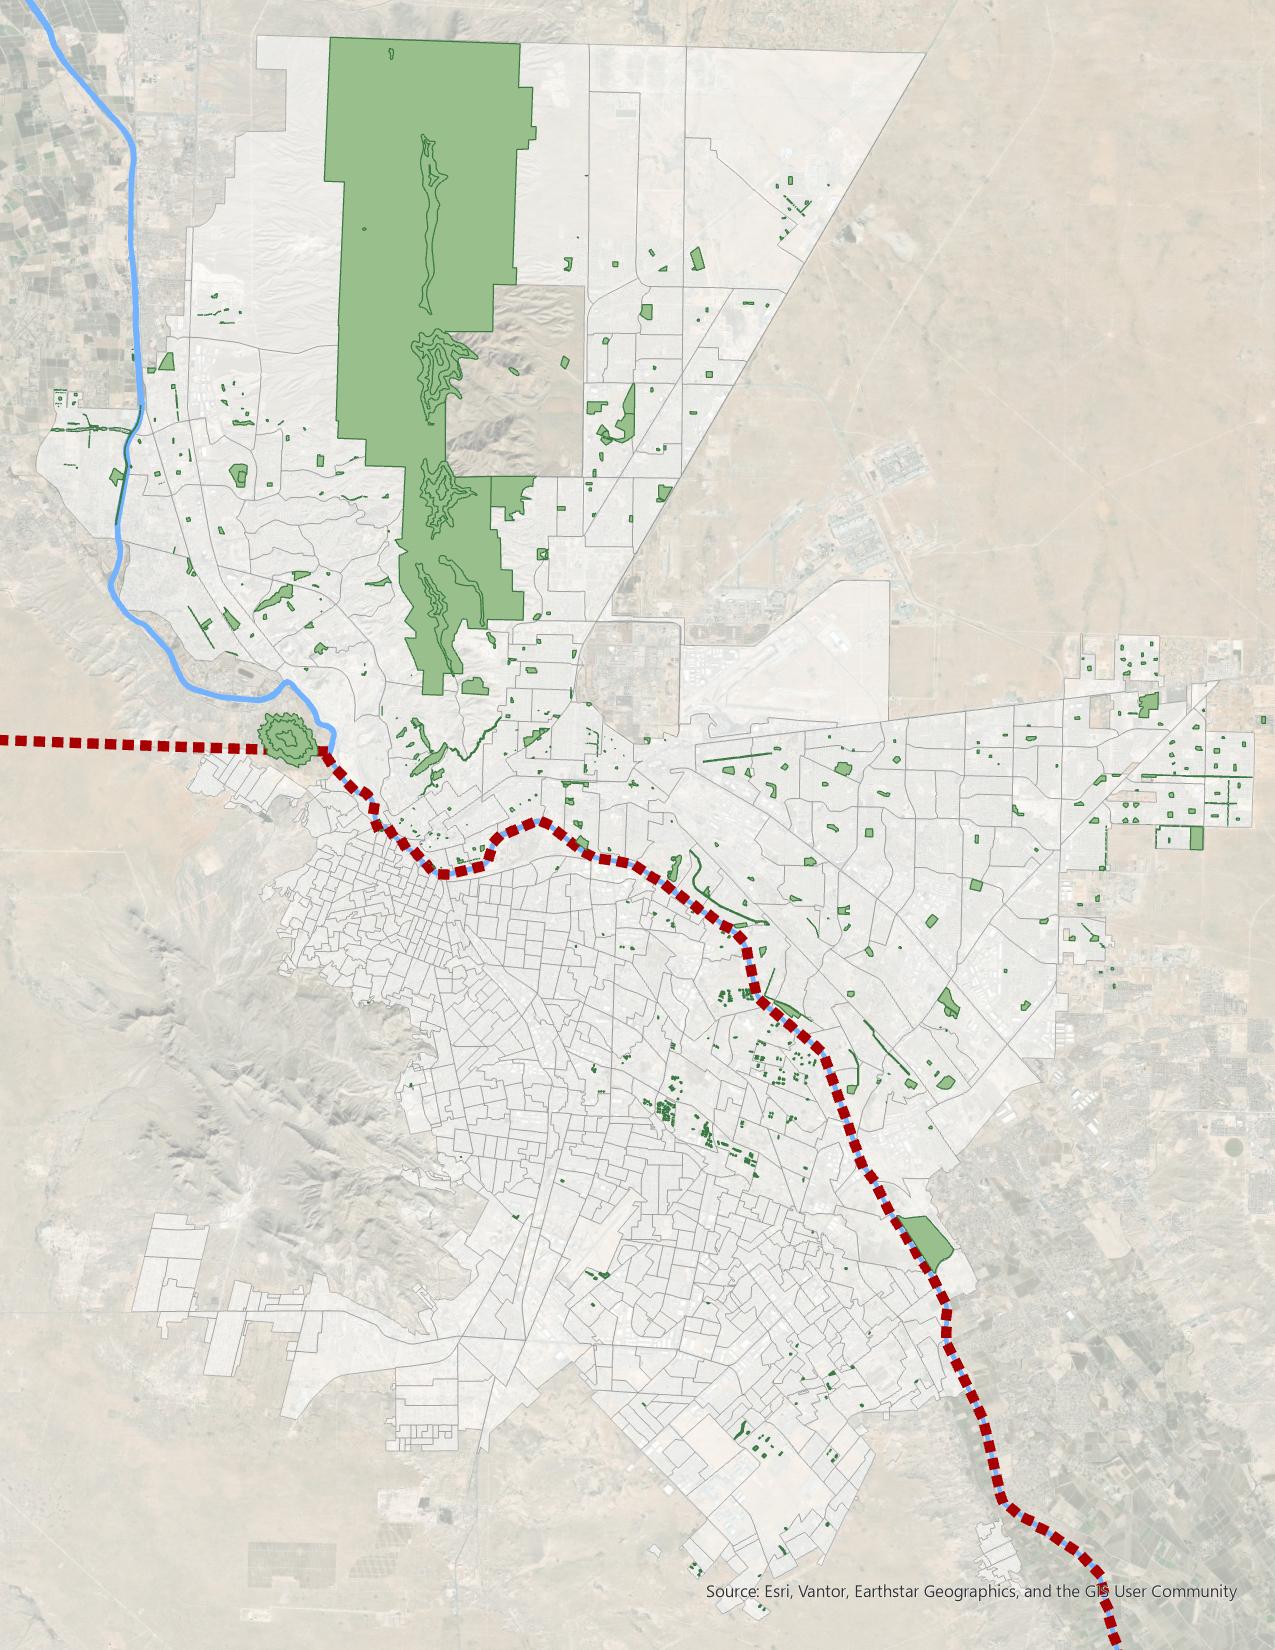
Sources: INEGI SCINCE (Mexico Data), US Census TIGERLine (US Data), El Paso Open Data
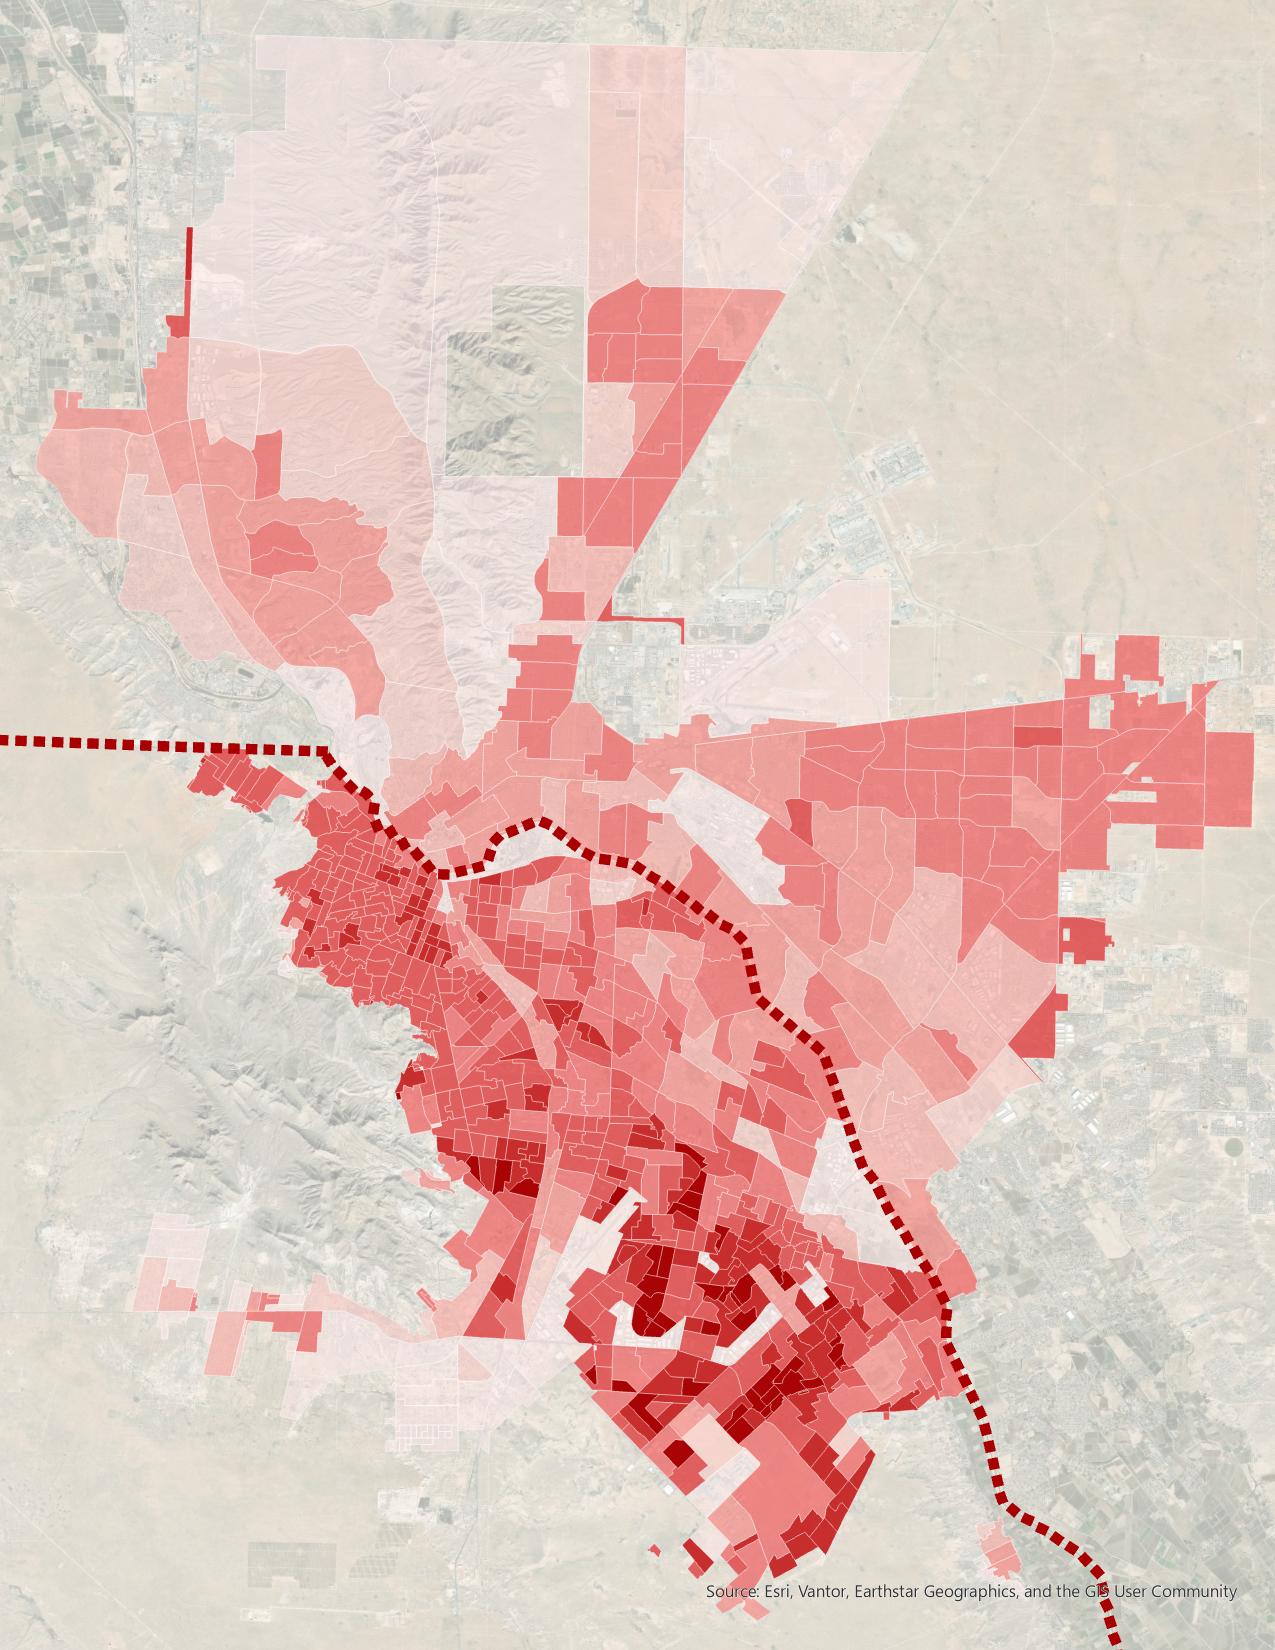
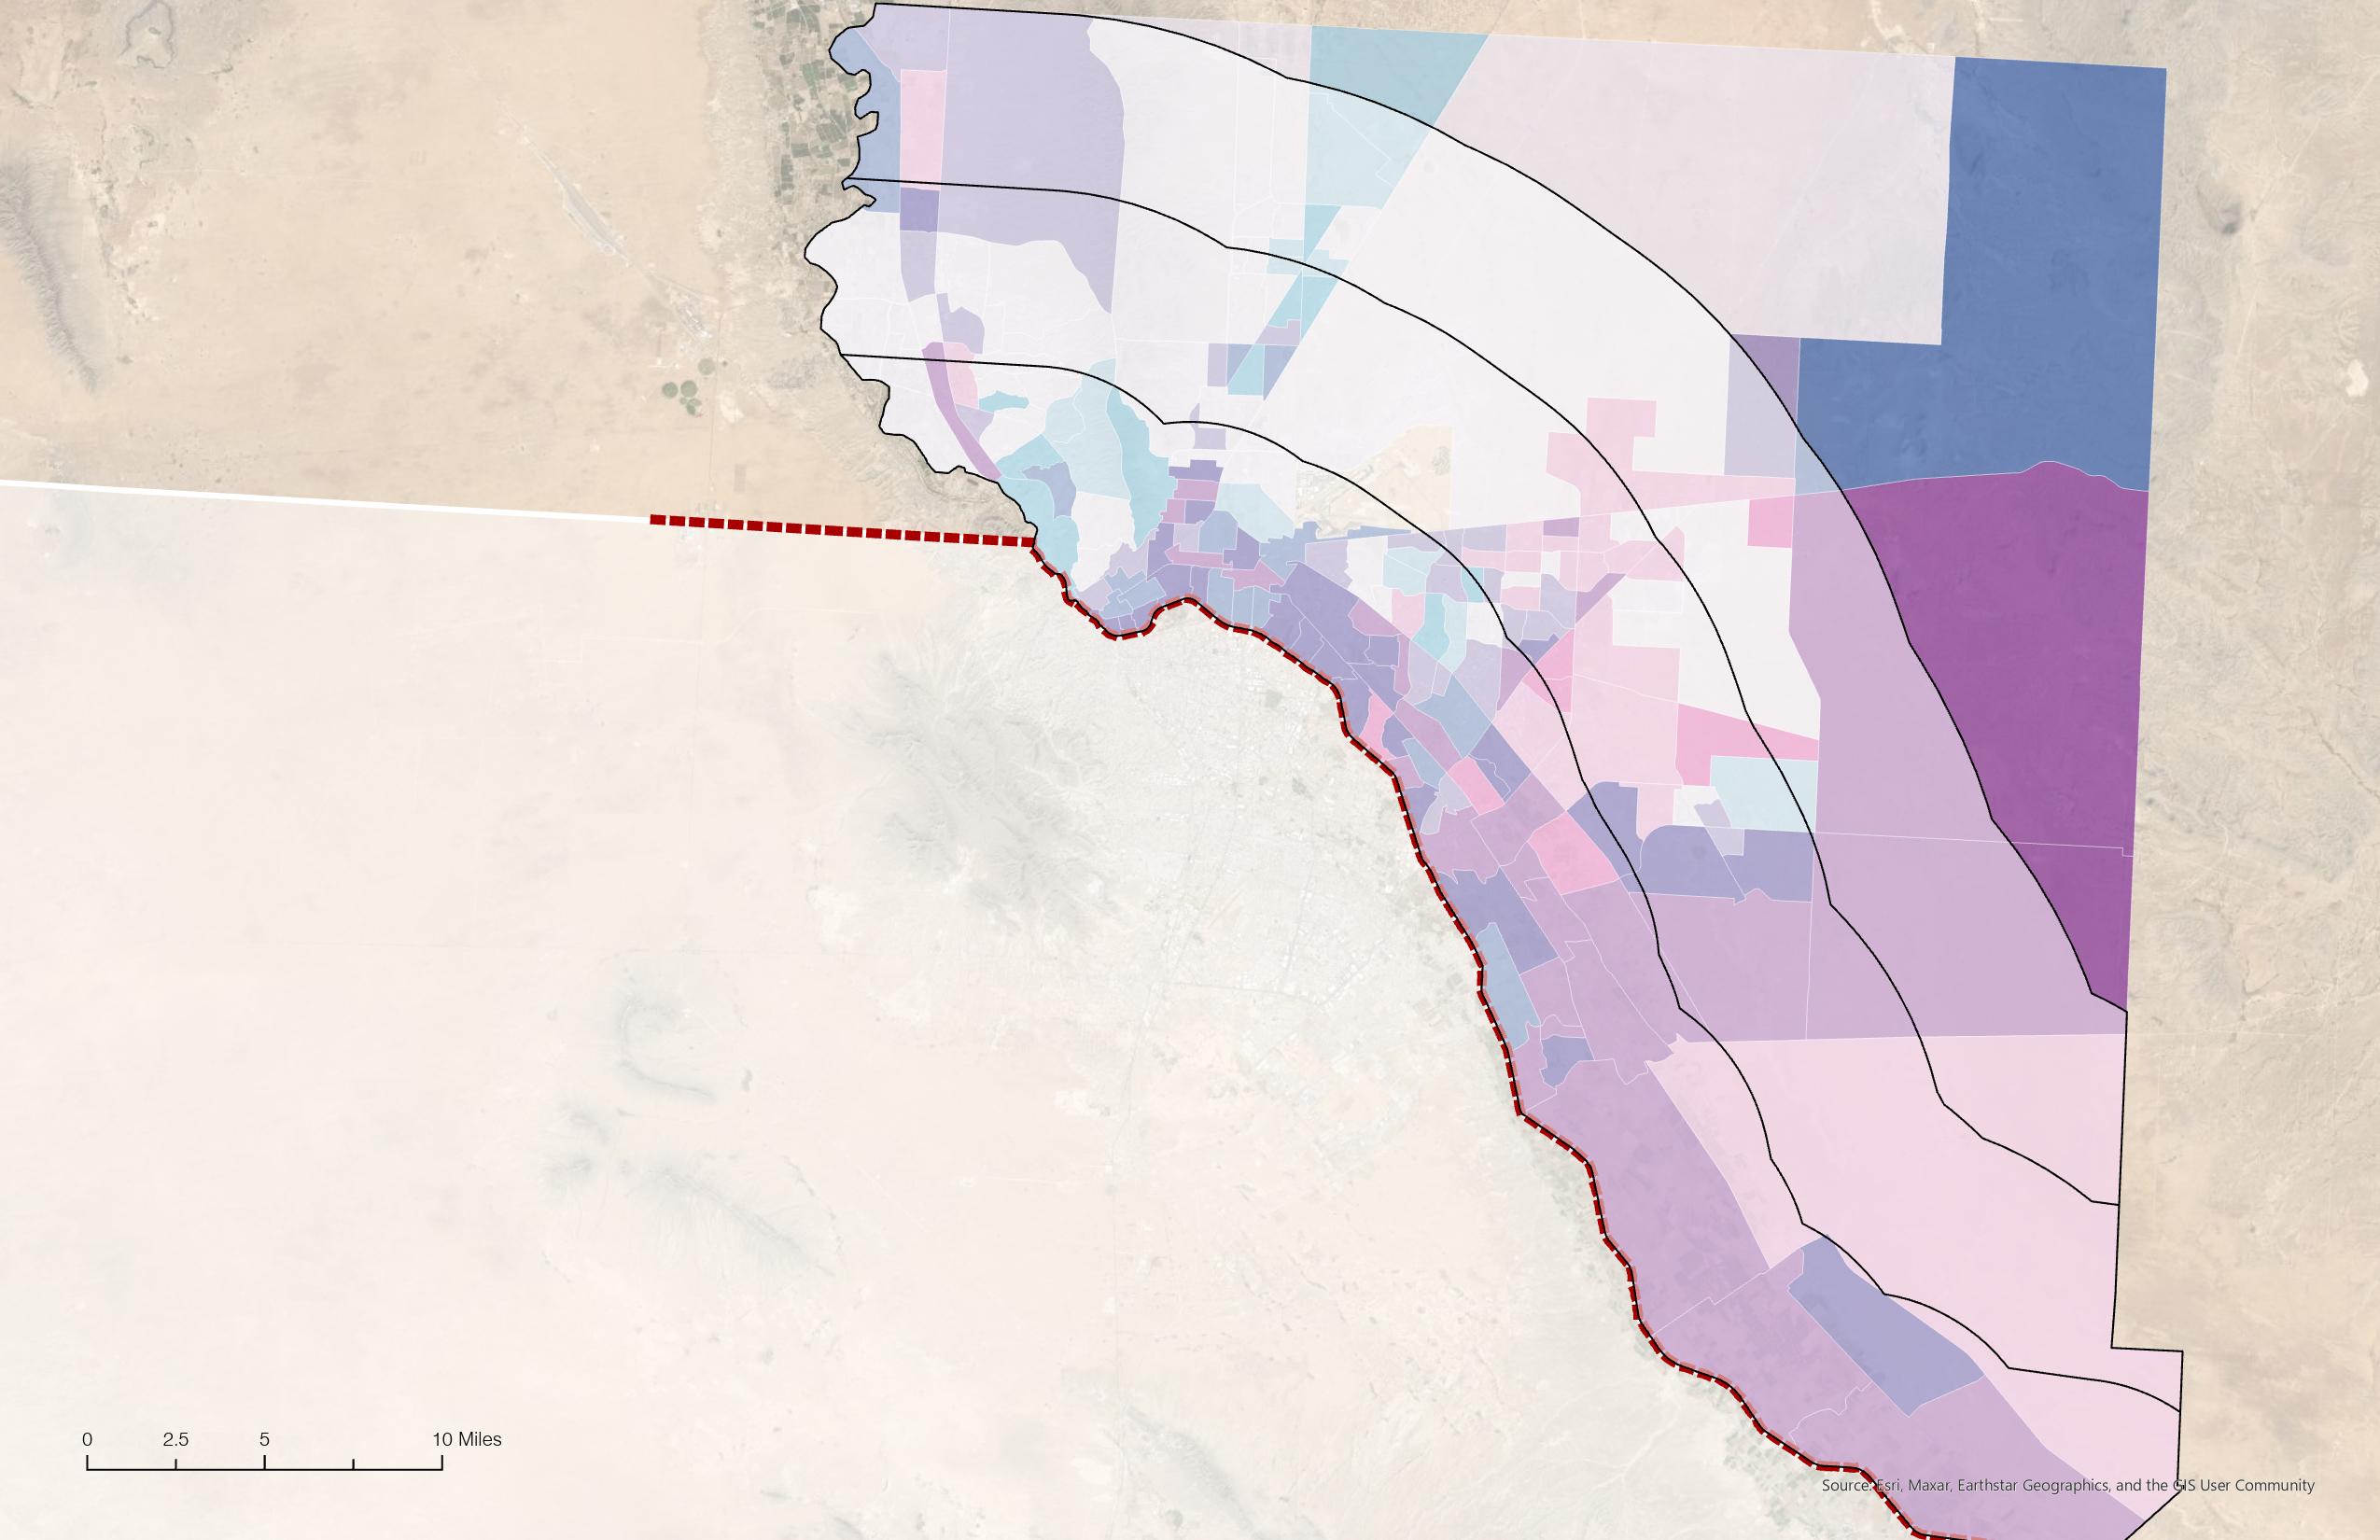
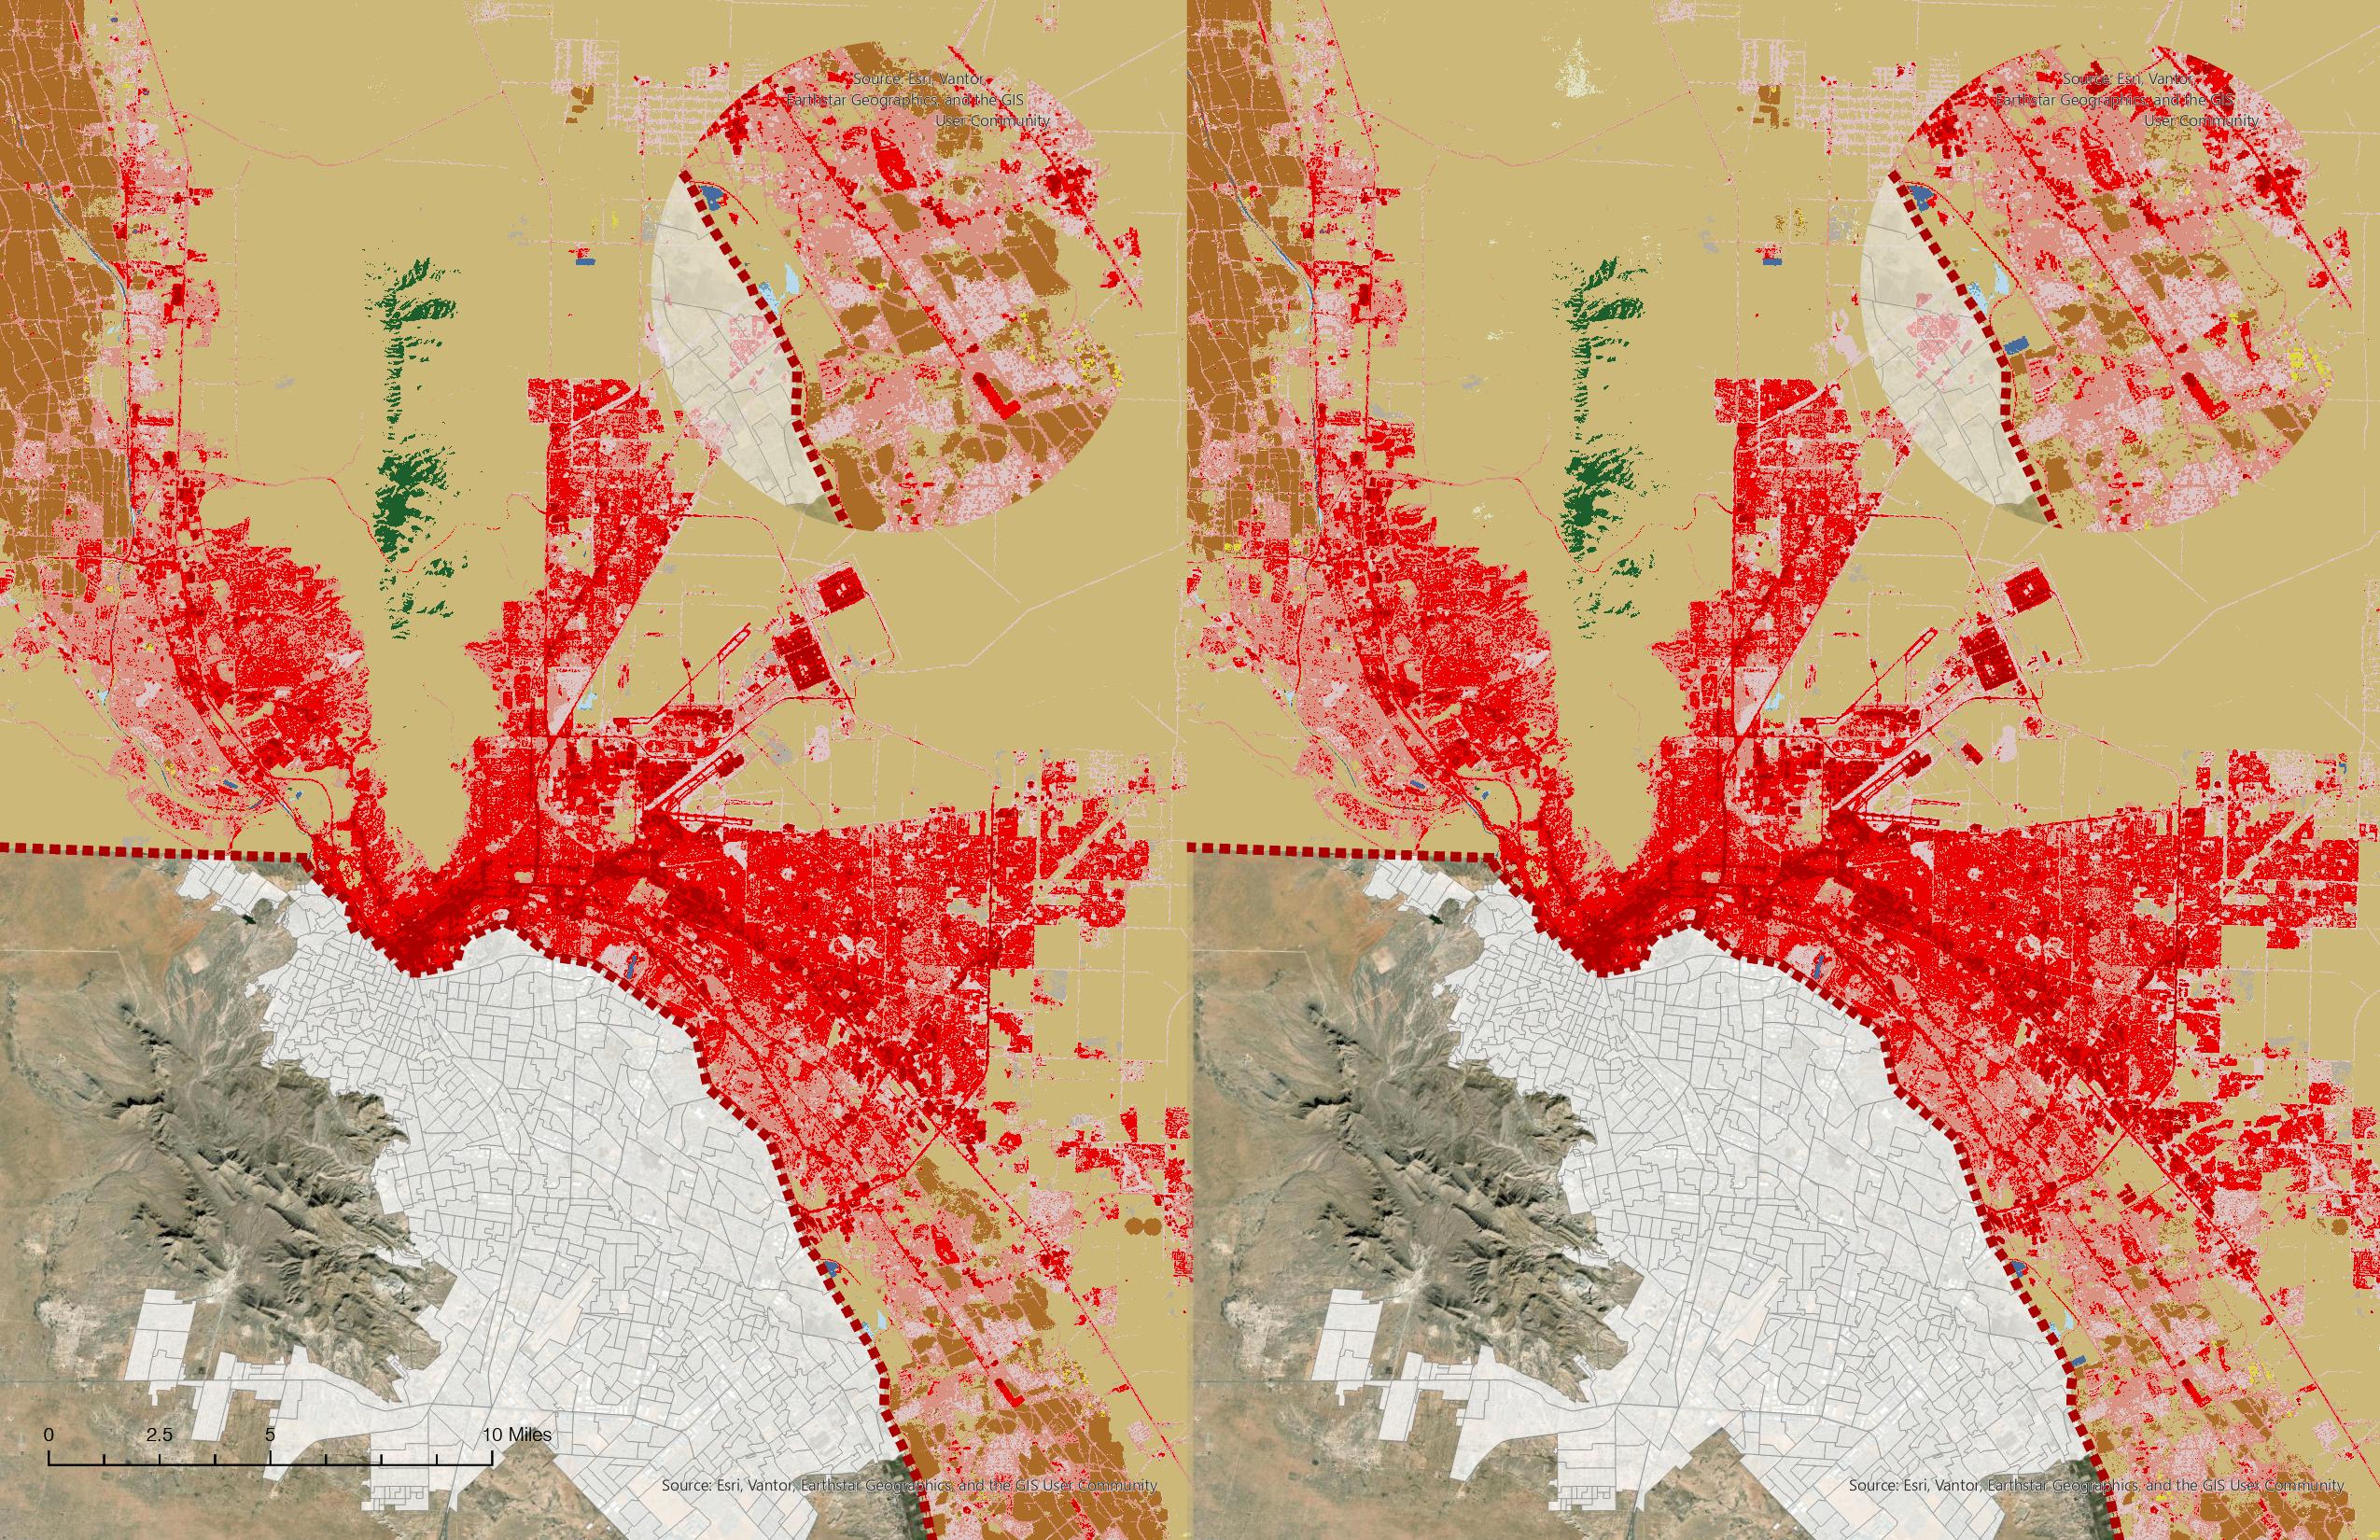
Inhabitants per sq mile
0-1,000
1,000-2,000
2,000-3,000
3,000-5,000
5,000-10,000
10,000-20,000
20,000-30,000
30,000-50,000
US-MX Border wall
Sources: INEGI SCINCE (Mexico Data), US Census TIGERLine (US Data), El Paso Open Data
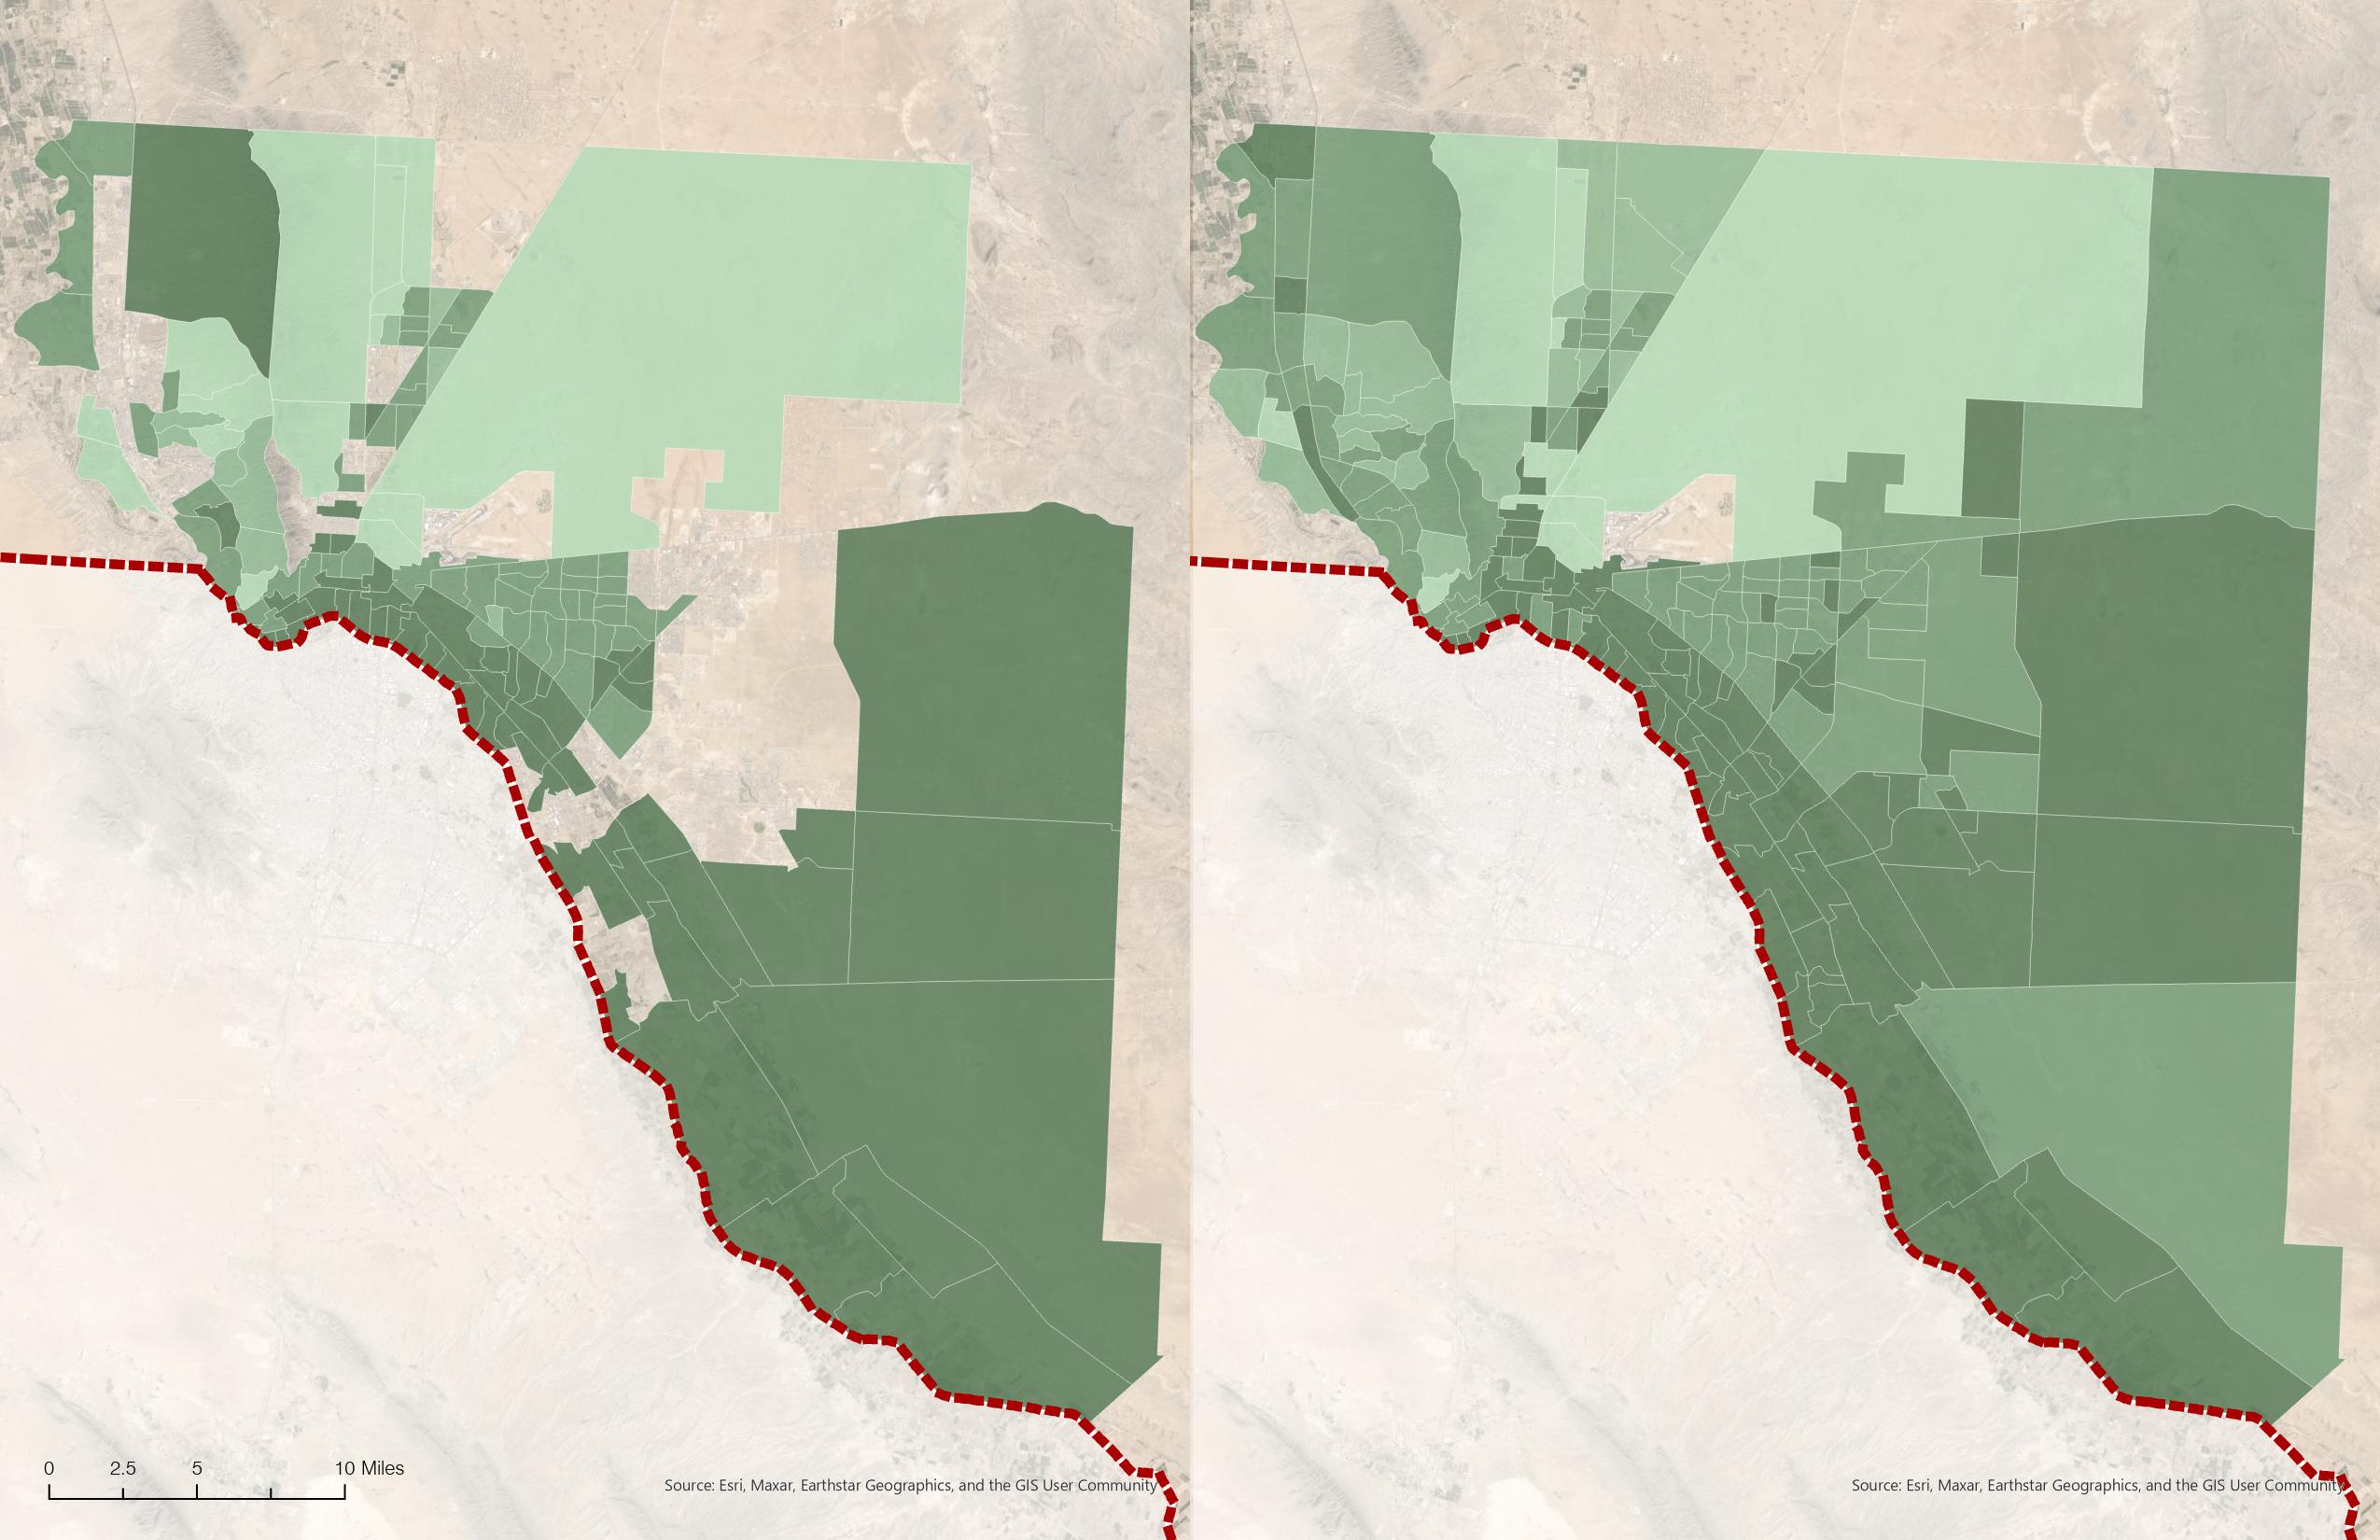
Bordering cities often reveal some of the most pronounced urban inequities, particularly within Global North–Global South contexts, where national boundaries sharply differentiate political power, economic opportunity, and policy regimes despite close geographic proximity. It is a recurring global phenomenon that cities situated directly adjacent to one another can exhibit dramatically divergent urban conditions, even as they remain functionally intertwined. Population density patterns, such as those illustrated in the adjacent map, offer one visible expression of this disparity; however, density alone is not the root cause. Rather, the border itself operates as a powerful structural mechanism that mediates access to capital, infrastructure investment, environmental regulation, and social services. Differences in national policy frameworks—ranging from labor protections and wage standards to environmental enforcement and public spending—produce uneven urban outcomes that become spatially legible at the border. In many cases, the prosperity and relative stability of the wealthier city are sustained, at least in part, through its proximity to a neighboring city where labor, services, and land are significantly cheaper. This asymmetrical relationship enables the extraction of economic value across the border while limiting reciprocal investment, reinforcing cycles of dependency and uneven development. As a result, one city often absorbs environmental burdens, infrastructural neglect, or overcrowding, while the other benefits from economic flexibility and consumption without fully accounting for the externalized costs. These dynamics complicate simplistic narratives of border cities as isolated or oppositional entities; instead, they function as interconnected urban systems shaped by deeply unequal political and economic conditions. Understanding these inequities is essential for evaluating how border policies, including physical infrastructure such as walls, do not merely divide space but actively reproduce and intensify existing disparities in urban form, quality of life, and long-term resilience.
Census tracts (US), AGEB (Mexico)
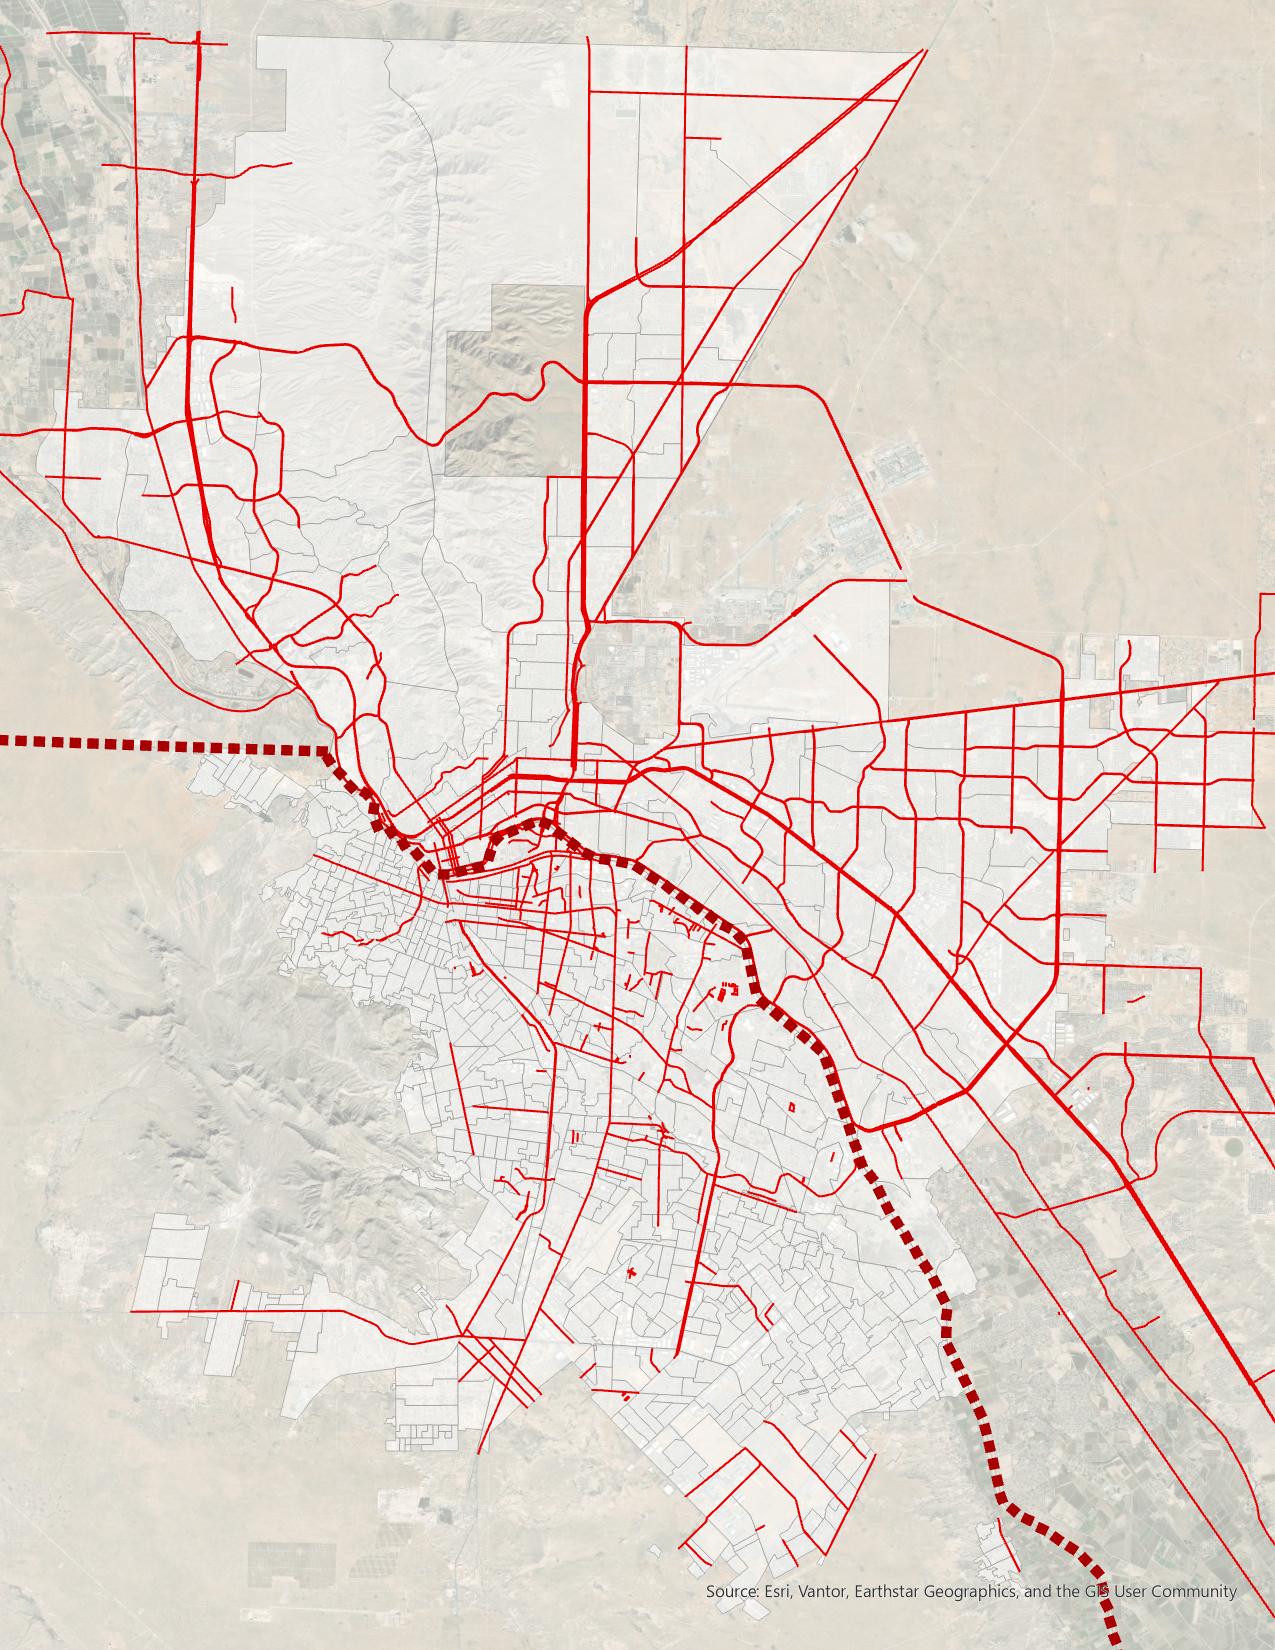
Primary roads
US-MX Border wall
Sources: INEGI SCINCE (Mexico Data), US Census TIGERLine (US Data), El Paso Open Data
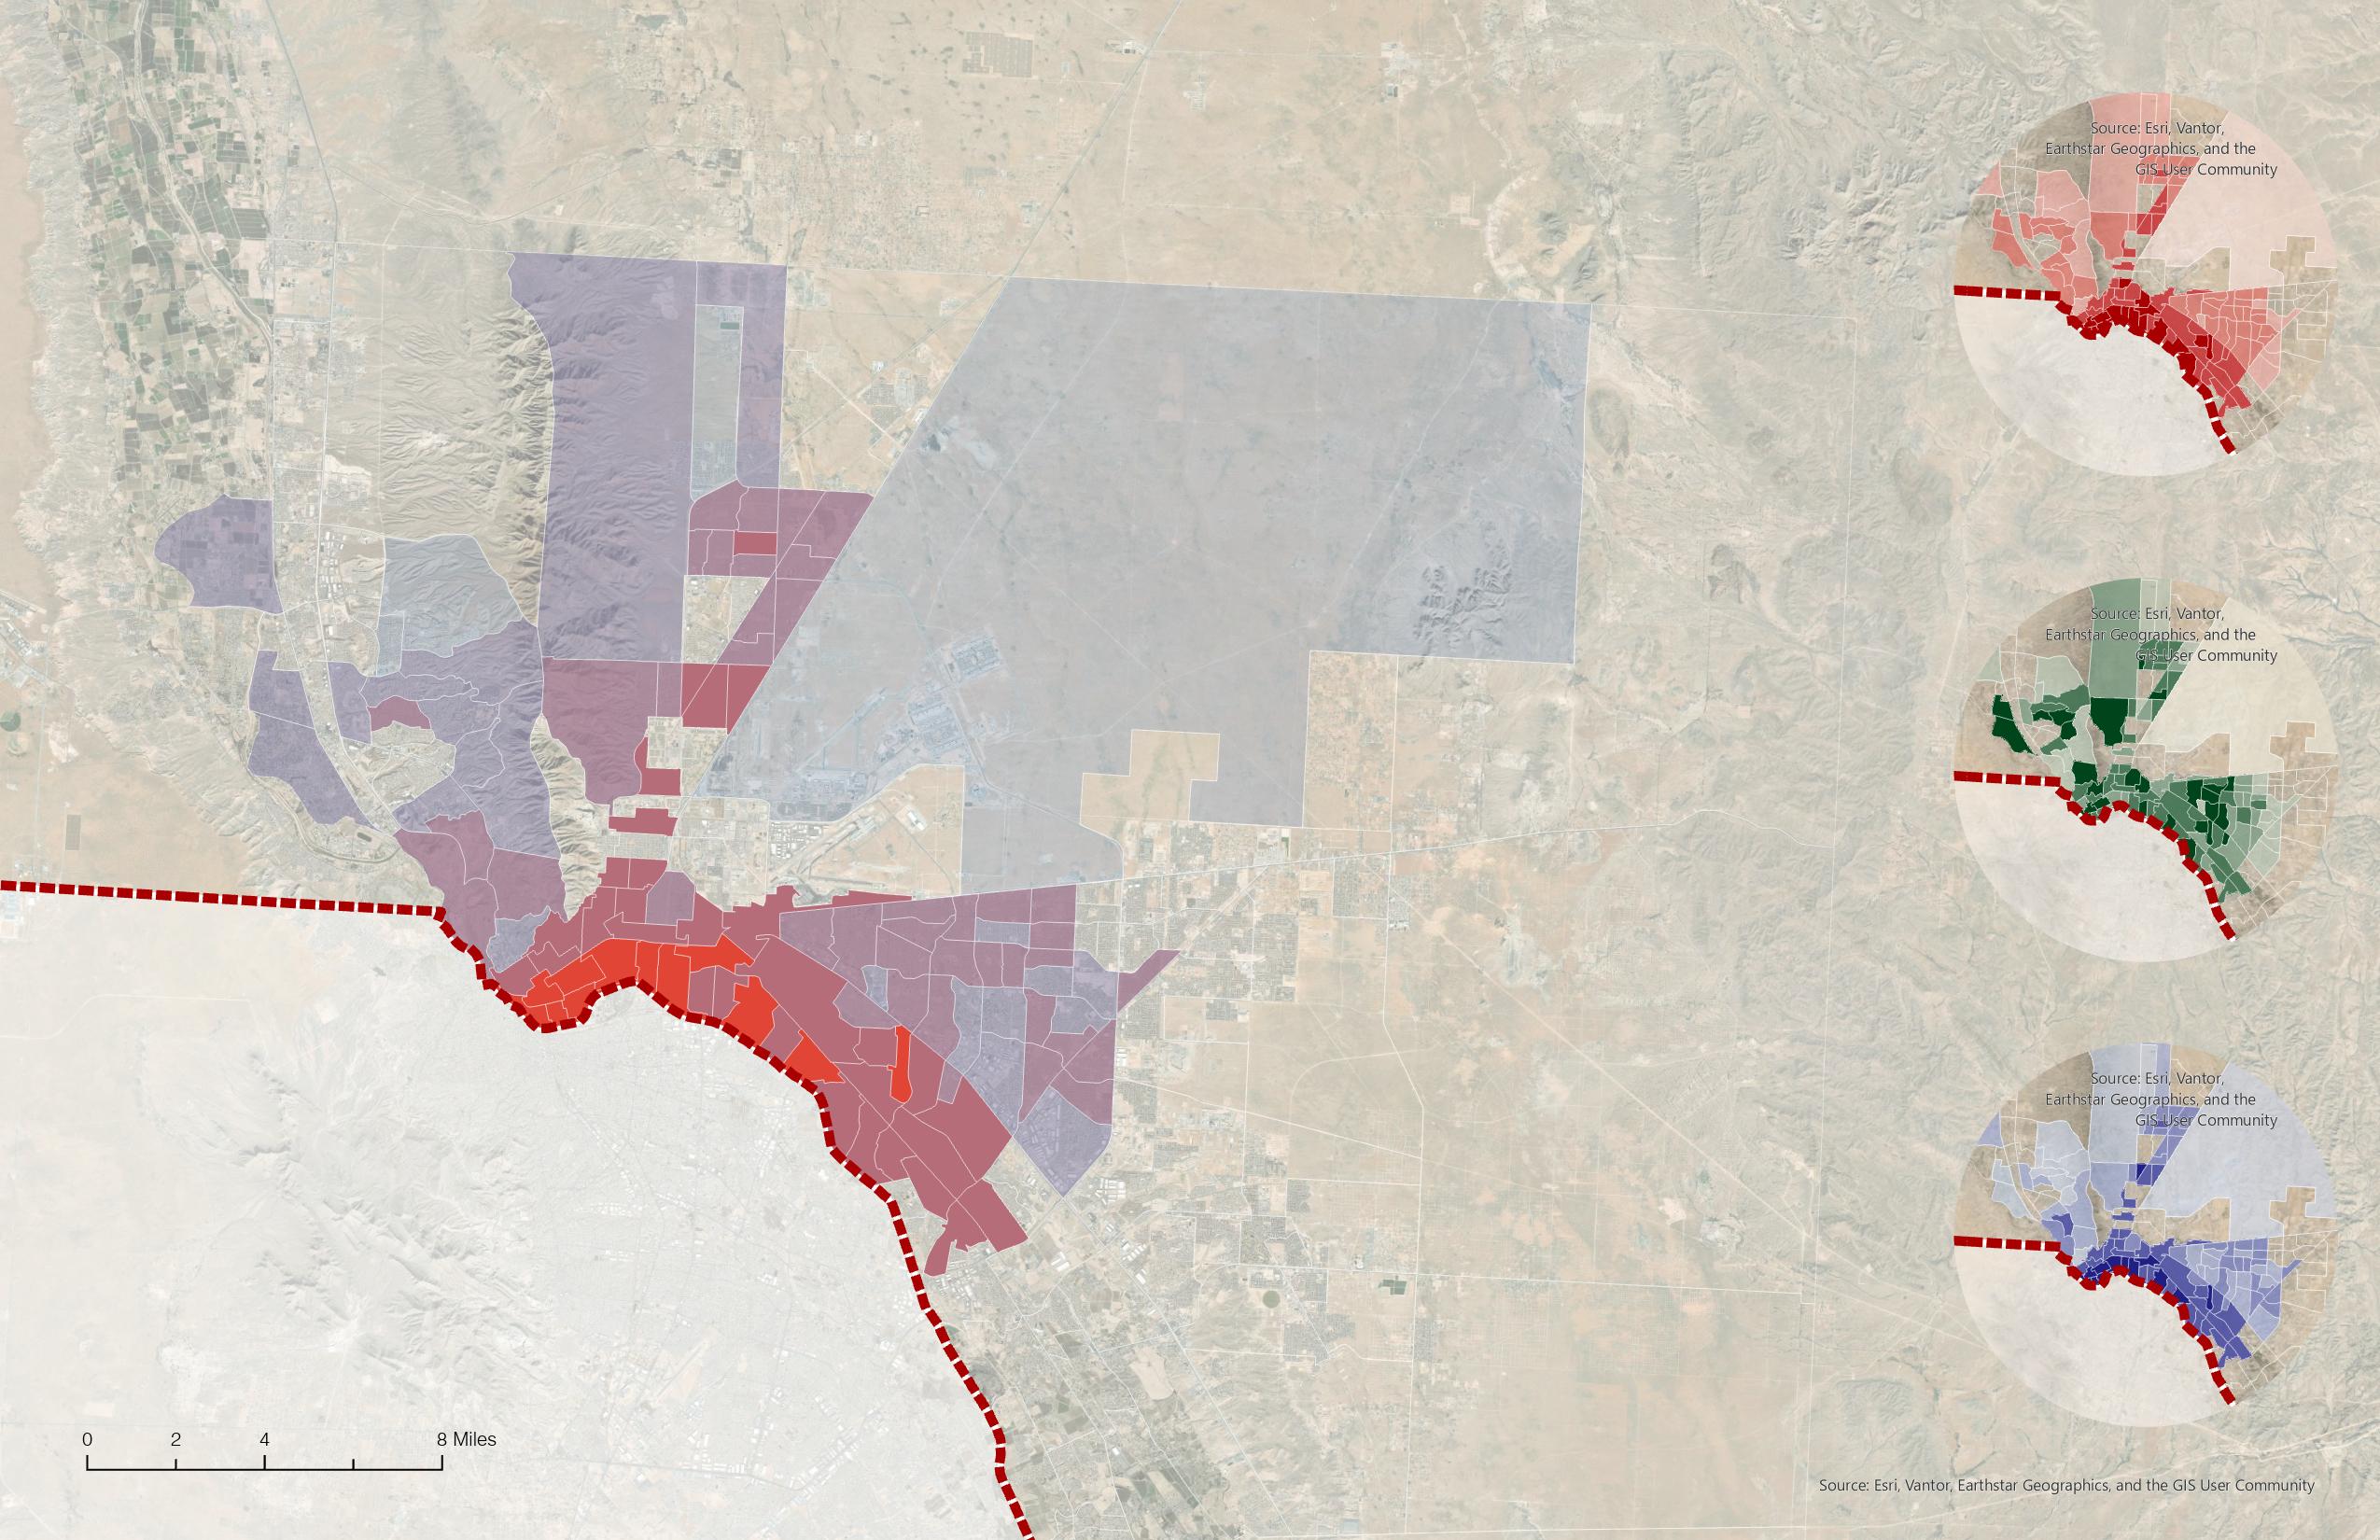
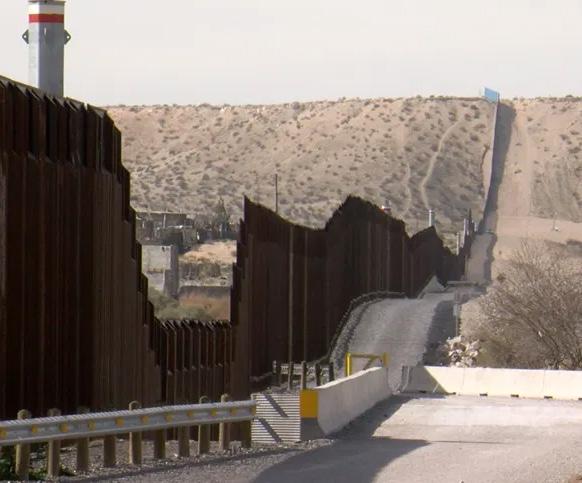
TWO CITIES: ONE NETWORK
Despite their markedly different urban morphologies, Ciudad Juárez and El Paso function as a deeply interconnected binational system. Daily flows of commuters, commerce, and services routinely cross the border, binding the two cities into a shared economic and social network that operates across national boundaries.