Team 10 MEGA 2021 Computational Design_Stella Pavlidou


 Floor Architectural Designer Architectural Designer
Climate Designer
Computational Designer
Facade Designer
Facade Designer Manager
Structural Designer
Structural Designer
Romeny
Jornt
Rik
Arend - Jan
Ewout
Eren
Stella
Randy
Floor Architectural Designer Architectural Designer
Climate Designer
Computational Designer
Facade Designer
Facade Designer Manager
Structural Designer
Structural Designer
Romeny
Jornt
Rik
Arend - Jan
Ewout
Eren
Stella
Randy
Team Skills
Workflow phases and Data flow
Sharing via speckle
Core Model via BIM 360
Reflection
Area Calculation
Form Studies
Atrium
Interdisciplinary numeric performance assesment and optimization
Atrium’ roof structural optimization
Atrium’s shaders_visibility, climate and daylight comfort optimization
Reflection
The intention of this report is to present the contribution of the the author Stella Pavlidou as a computational designer for Group 10 during the MEGA course at the Technical University of Delft, Faculty of Architecture and the Built Environment.
The report is structured in three chapters. The first explains computational Workflow for the communication and data sharing during the project. The second describes chapter includes the integrated and interactive parametric design process. The final chapter includes the interdisciplinary optimization of the design.
To choose the appropriate computational tools for our collaboration we noted our software skills but more importantly we looked into software we are interested to learn or improve our skills for. Rhino, grasshopper assets and Revit were on top of our list, but there was no clear agreement in a specific design software. Therefore the workflow was designed in a way that it would give the oppurtunity to choose the preferred one.
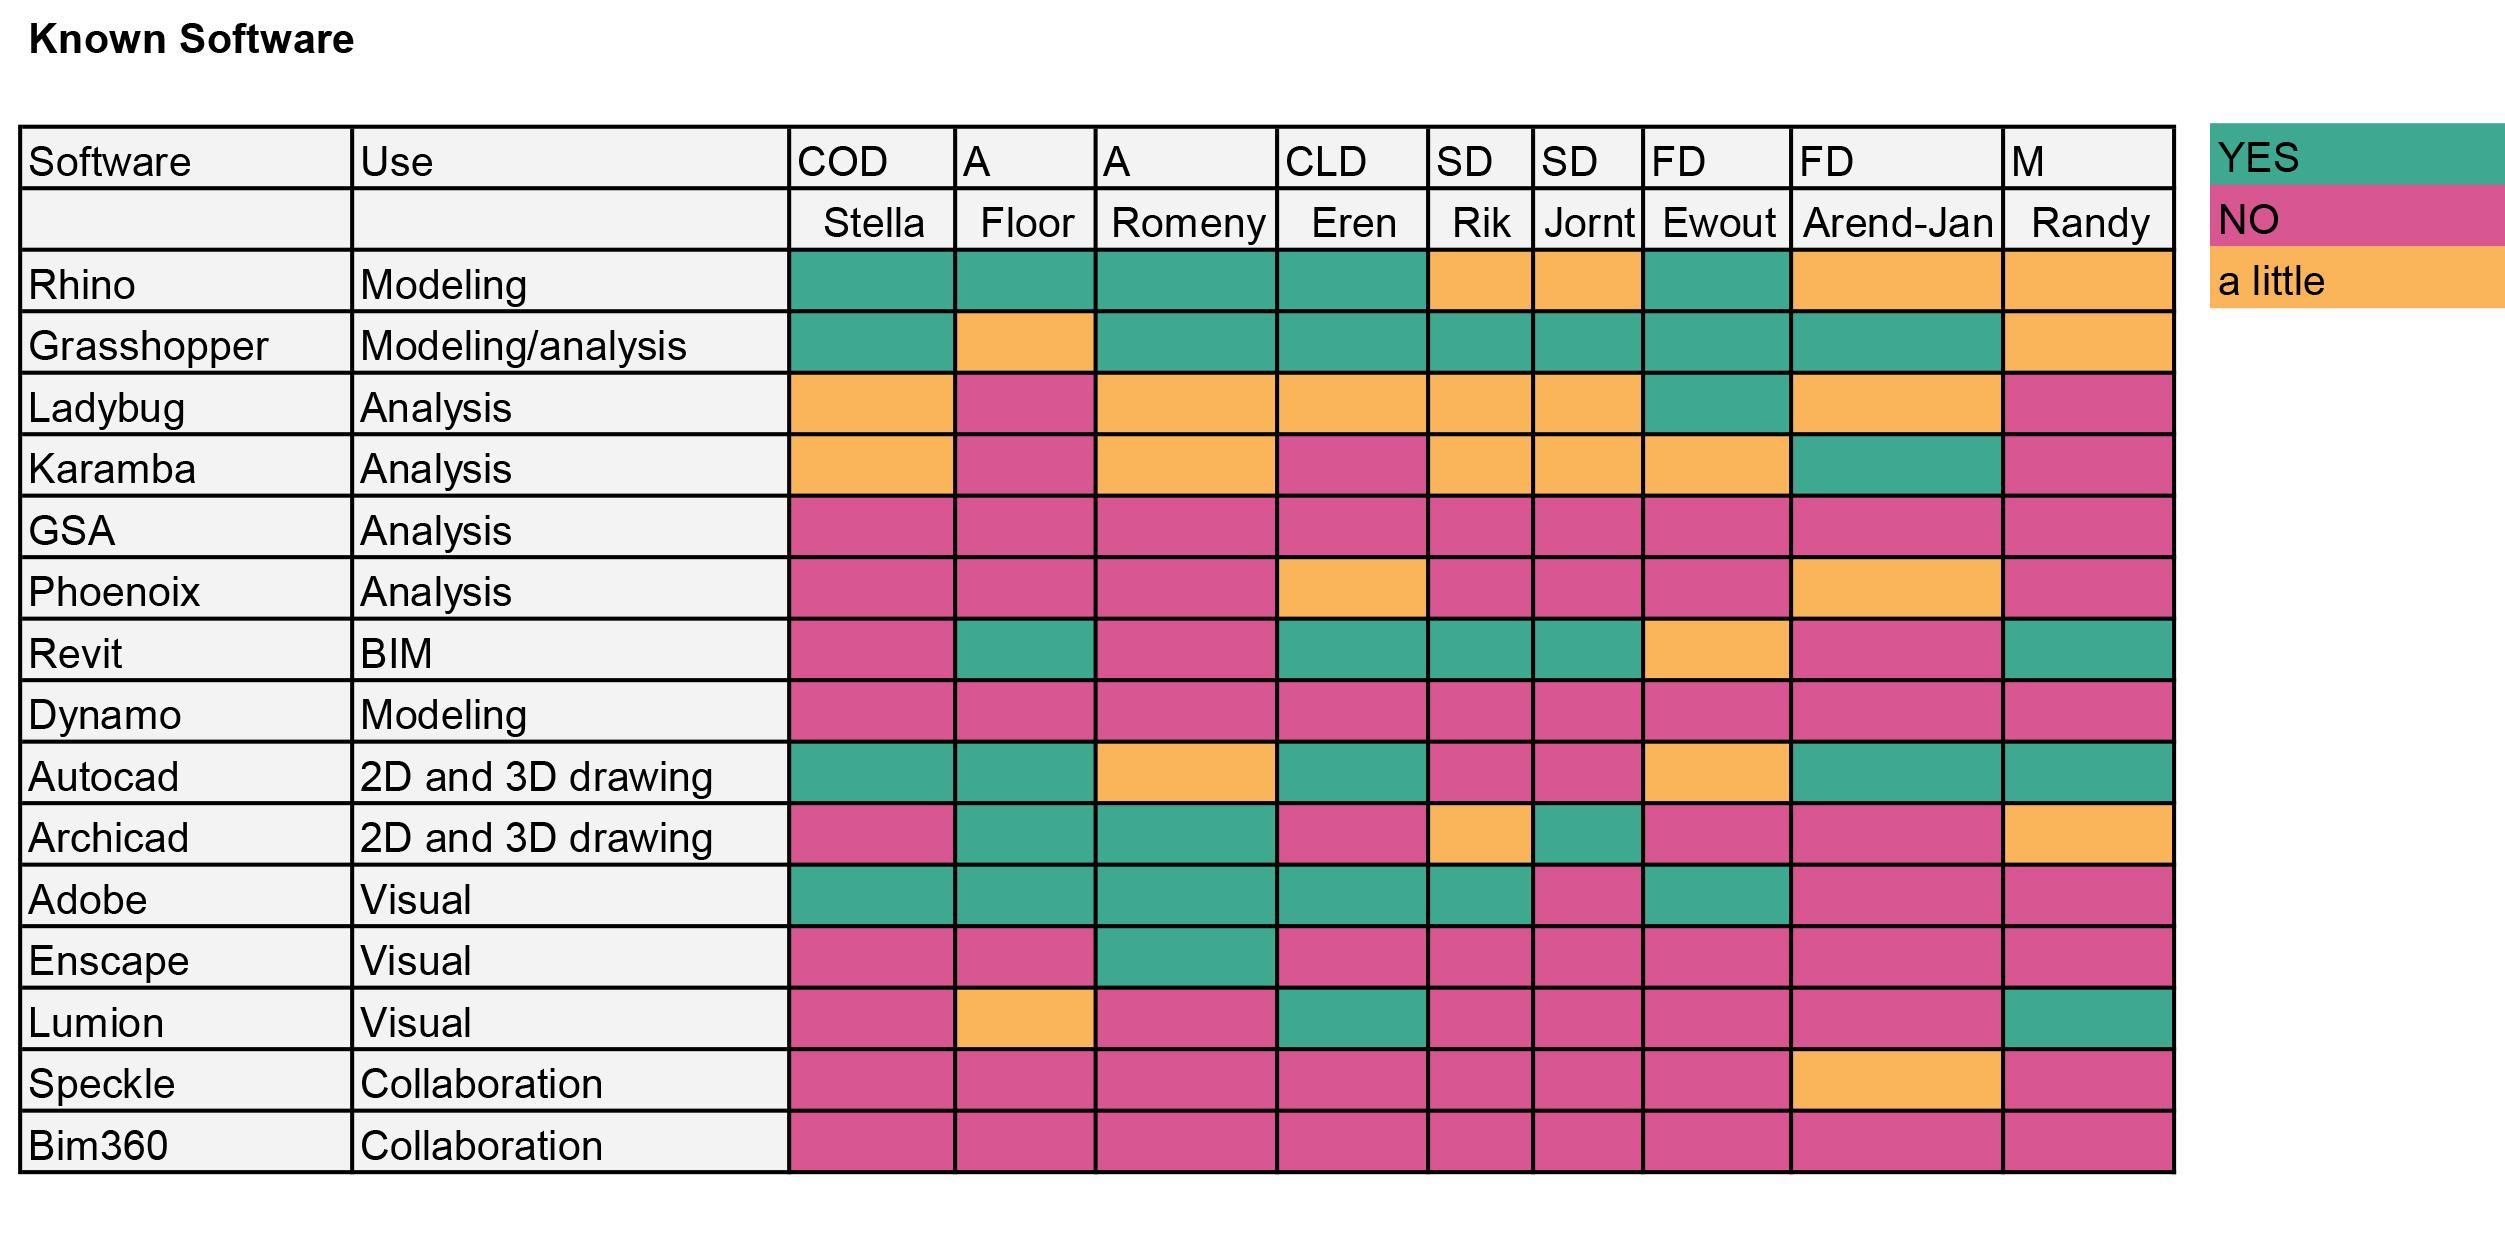
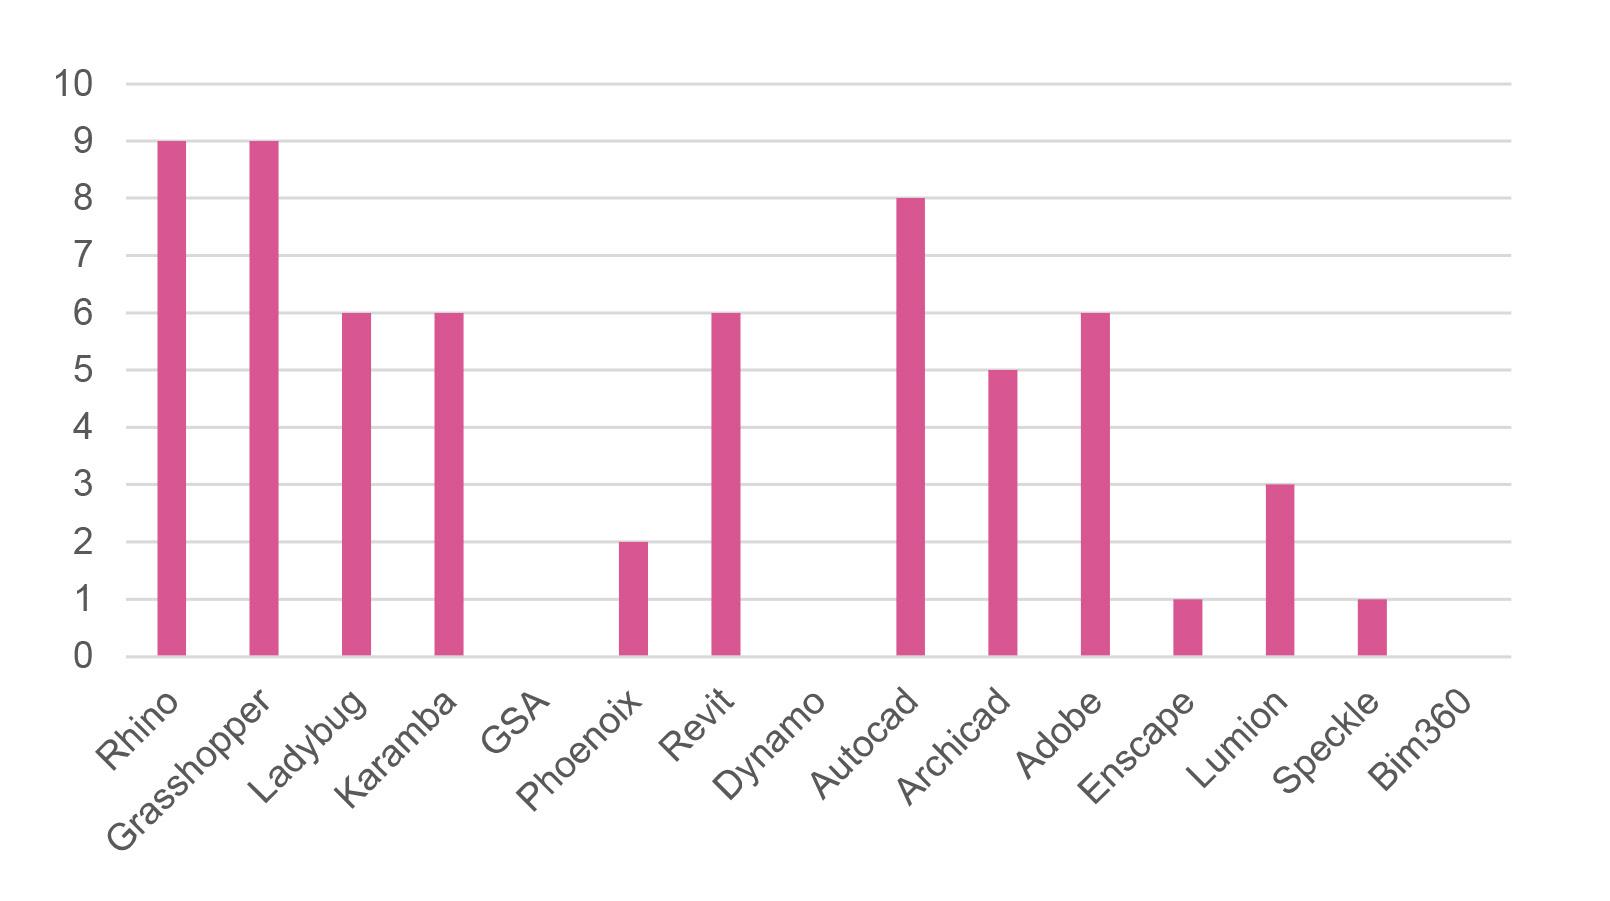
Most known software: Rhino and Autocad
Table 1.1 Known software Chart 1.1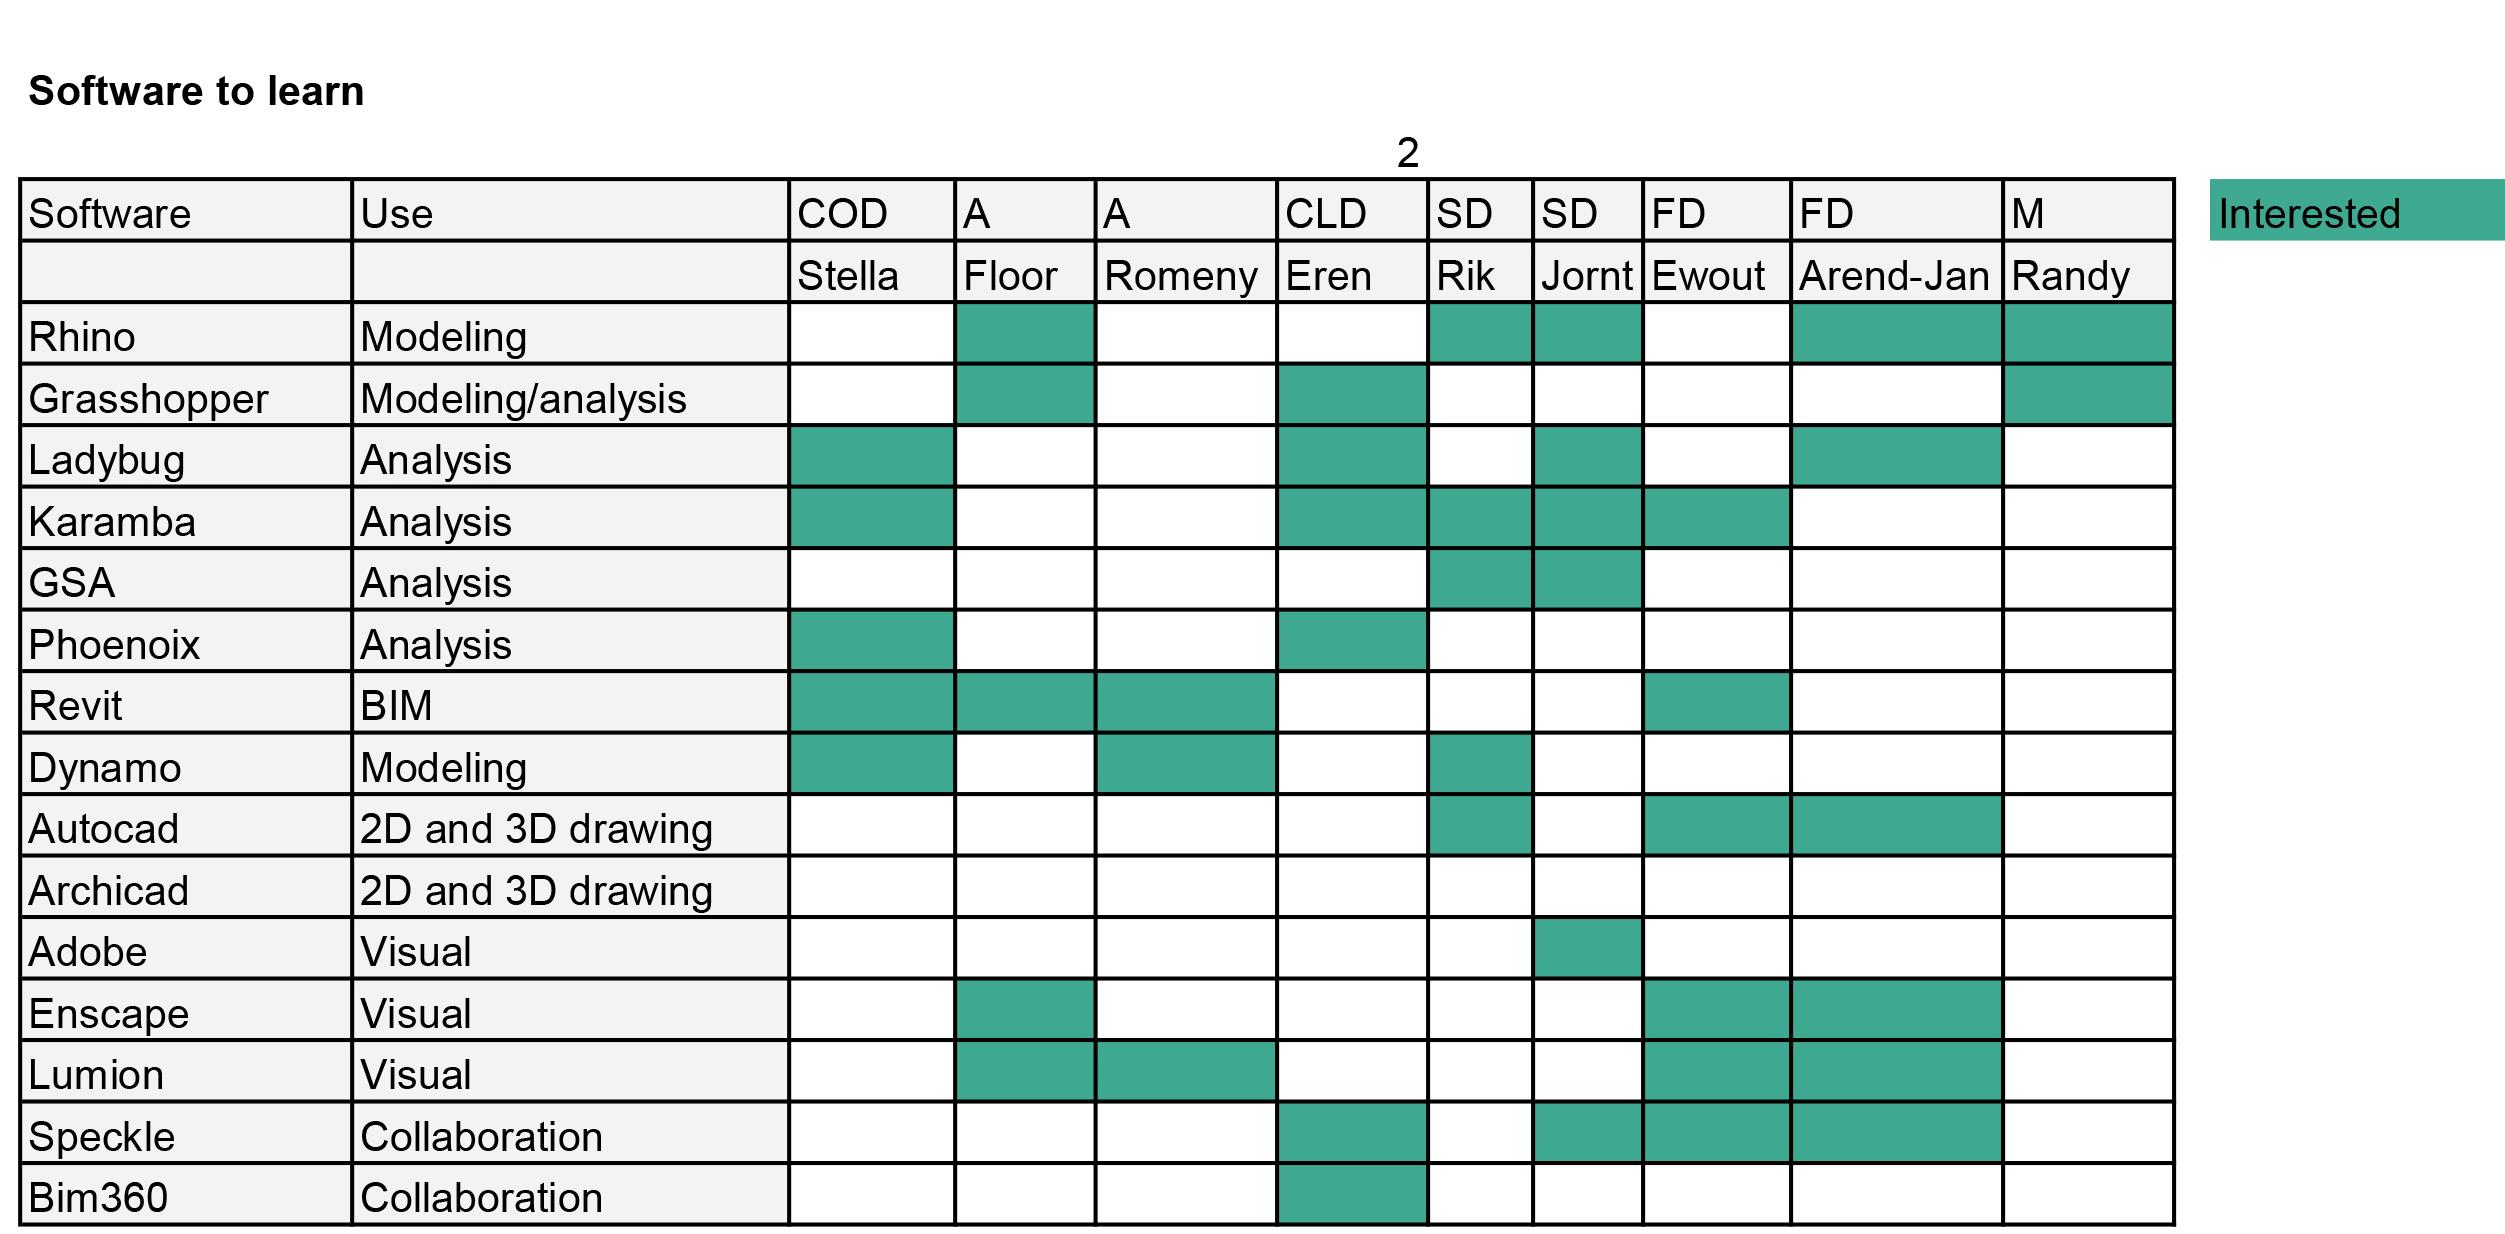

The workflow was divided in two phases. One was the “Conceptual Design phase” were Rhino was the main design tool along with plugins such as ladybug for climate simulation and karamba for structural design.
For the design development we used a central model in Revit. Team members were either working directly on Revit or via Rhino.Inside.
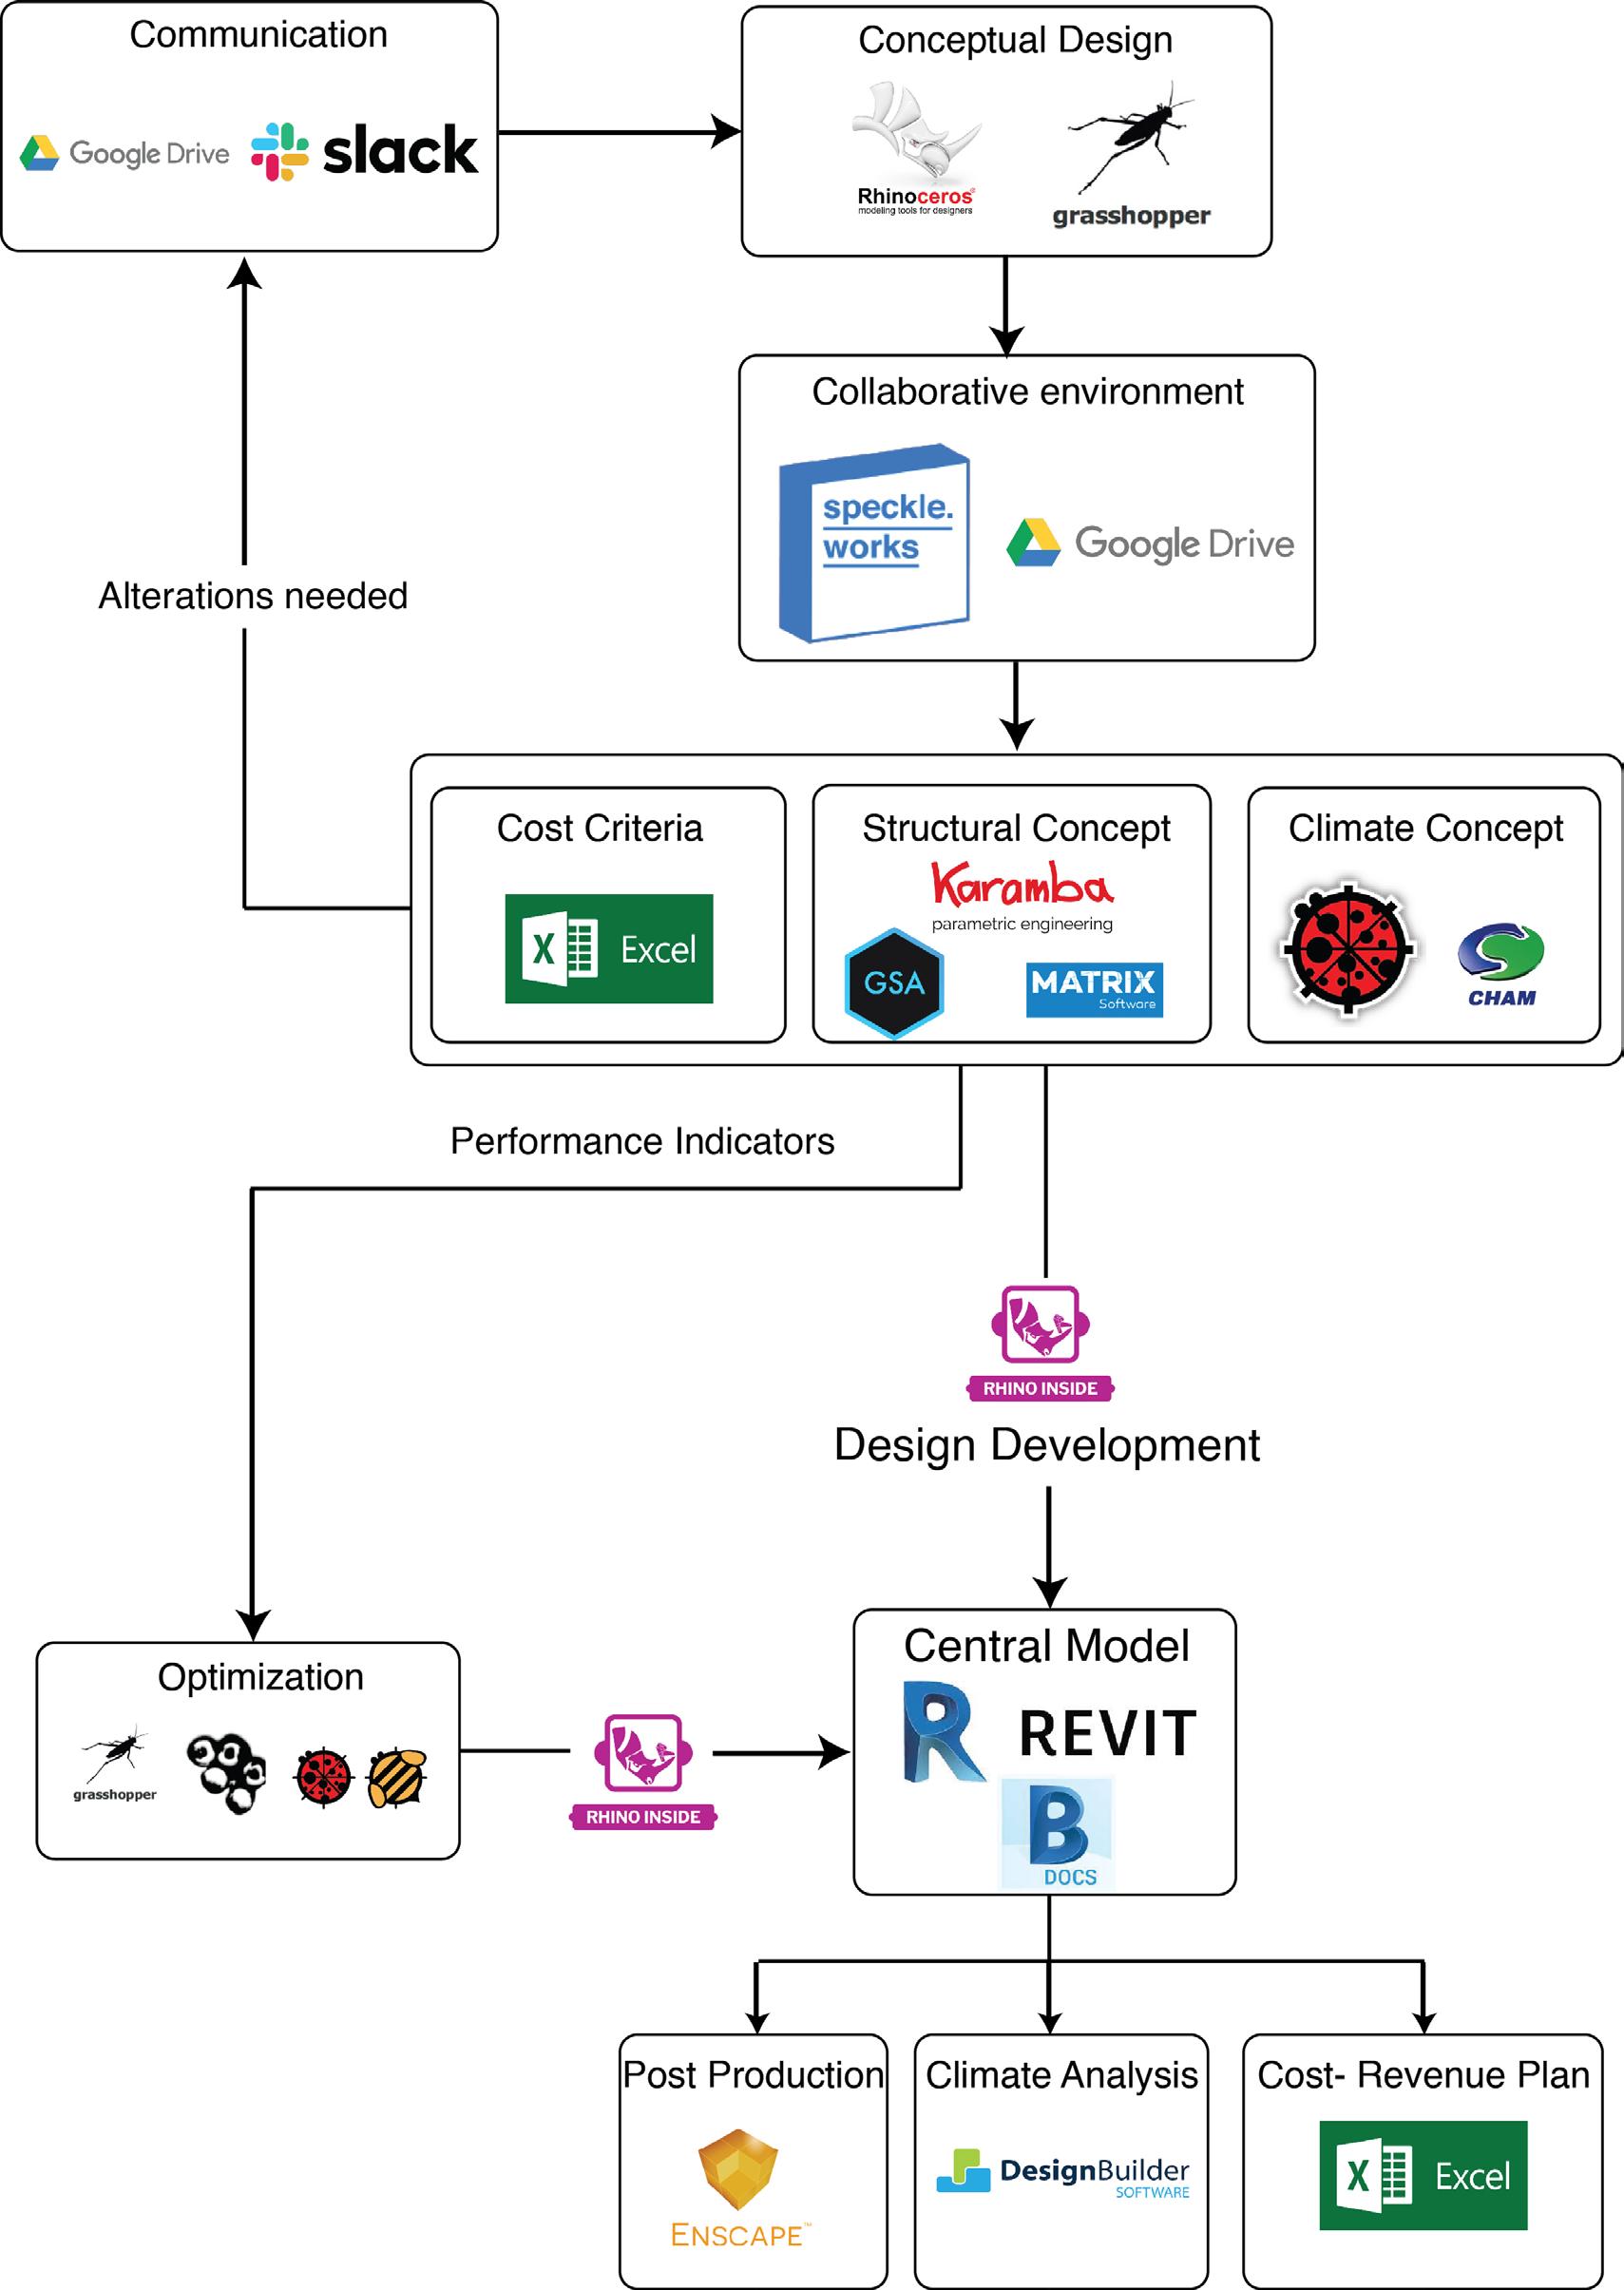
In the following diagram it is displayed how team members were updated on design decisions. During the Conceptual Design phase. zoom and slack were often used to update team members on design decisions. After the concept of the VIA towers was finalized then a central model on revit was used and team members were updated in real time on the changes that were occuring.
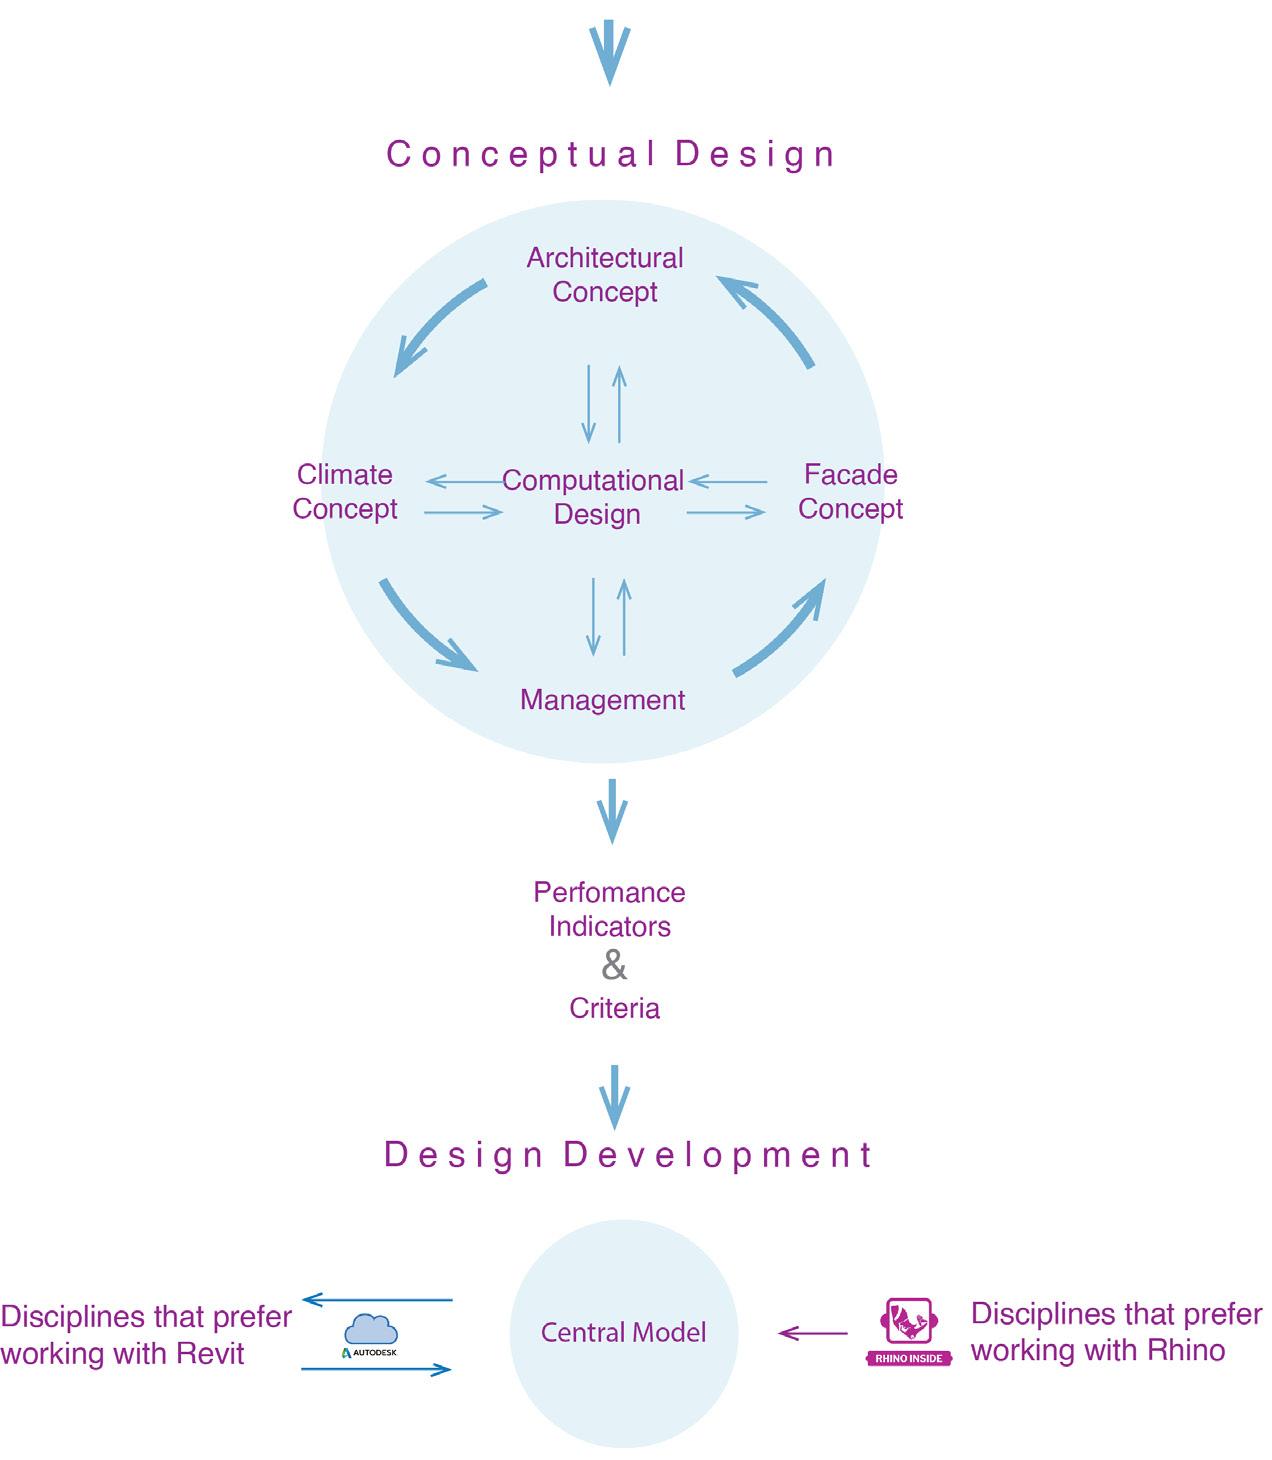 Figure 1.1 Schematic Collaboration workflow
During the first weeks the team members downloaded Google Drive on their dekstops along with a shared folder.
The organizing system was designed according to the design phases. 01_GENERAL included references, sketches, 02_MID: Included the Conceptual Design phase and was organized by week deliveries. O3_WIP included the Design Development phase and was organized per discipline. Inside the folder of each discipline only the latest files were kept. 04_FINAL included only final submittions.
01_GENERAL
02_MID
week01
01_rhino
02_definitions
03_images
04_excel
05_presentations
06_others
week02
03_WIP
00_Presentation
01_Architecture
02_Climate
03_Computational Design
04_Facade Design
05_Management
06_Structural Design
04_FINAL
00_Presentation
01_Architecture
02_Climate
03_Computational Design
04_Facade Design
05_Management
06_Structural Design
07_Report
 Figure 1.3 Organizing system
Figure 1.4 02_MID Folder
Figure 1.3 Organizing system
Figure 1.4 02_MID Folder
After the midterm presentation the design development started with all disciplines working on 02_WIP folder. To make a dinstinction between the different disciplines there is a specific code assigned per discipline:
ARC: Architectural Designers
STR: Structural Designers
FAC: Facade Designers
CLM: Climate Designers
COD: Computational Designers
MAN: Managers
The name of the Documents follows a specific order:
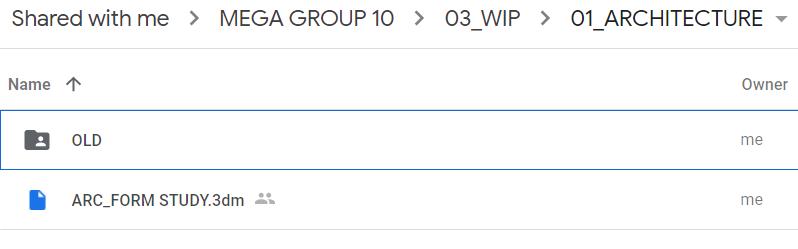
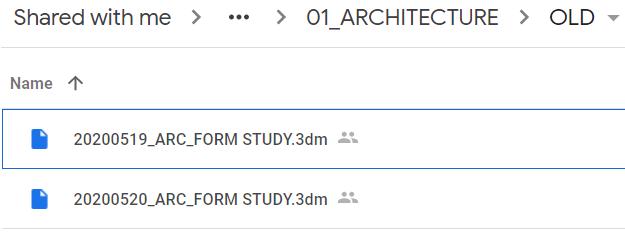
The updated document stayed always in the same location with the same name as it may be an external link for another discipline. Older revisions were stored in an OLD_folder with the date of the last saving on their before their doc_ name.
Also a central Revit Model was created using dekstop connector and shared among disciplines. Every day a back-up file was created inside OLD folder. At the end of Tuesdays (the day of physical meetings) the OLD folder was cleaned-up

A grasshopper definition was provided for the team members with the speckle IDs of the sending disciplines. Each member could receive information from the desired discipline. For instance, floor boundaries could be received by the facade designers and a nd send back to the stream.
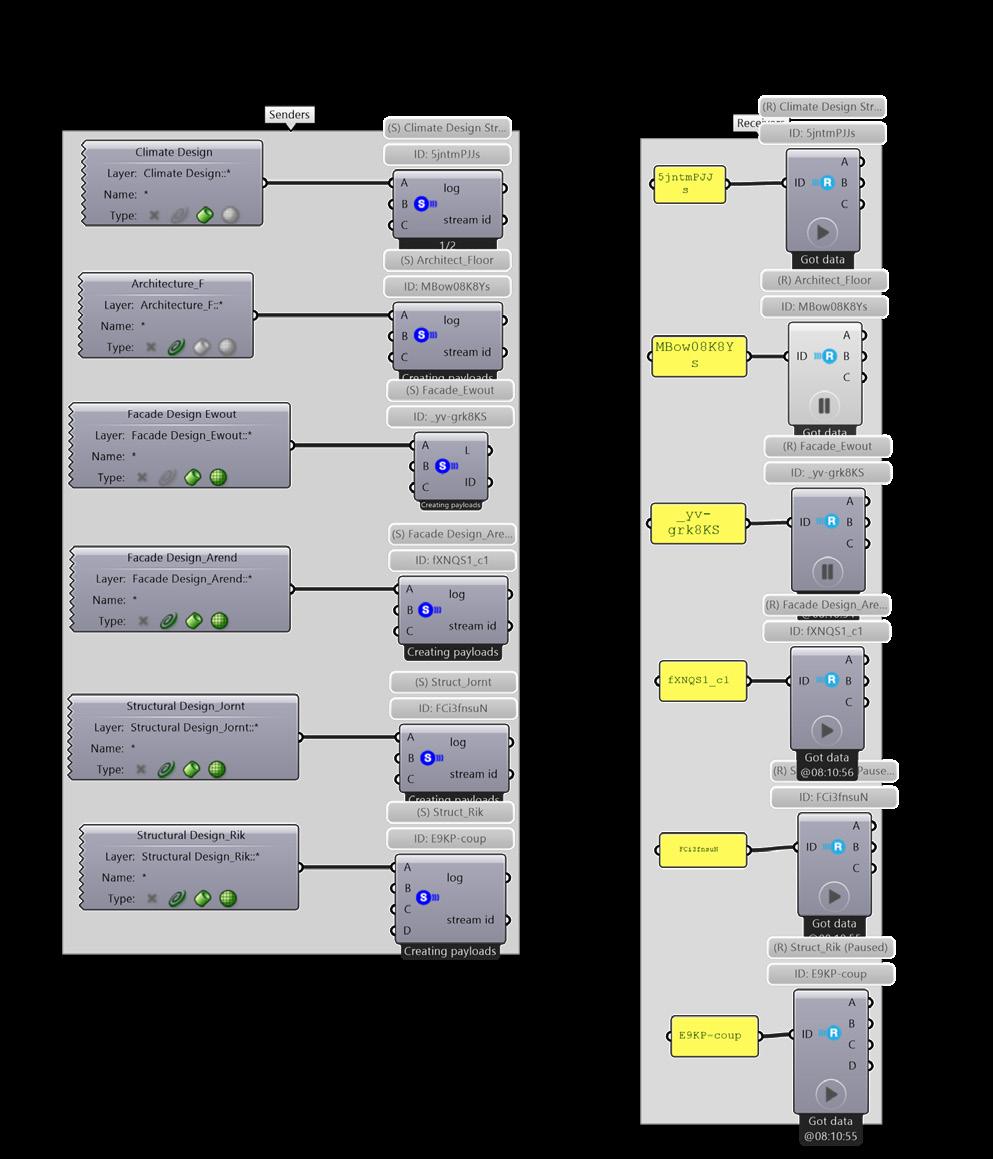
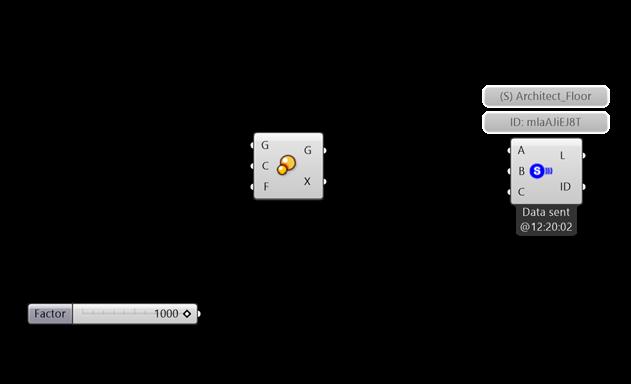
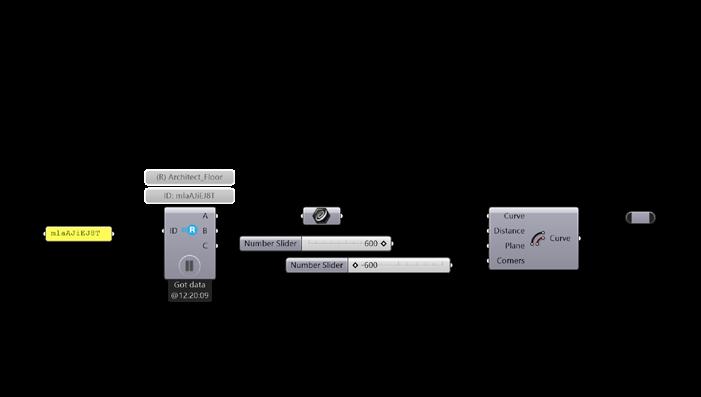
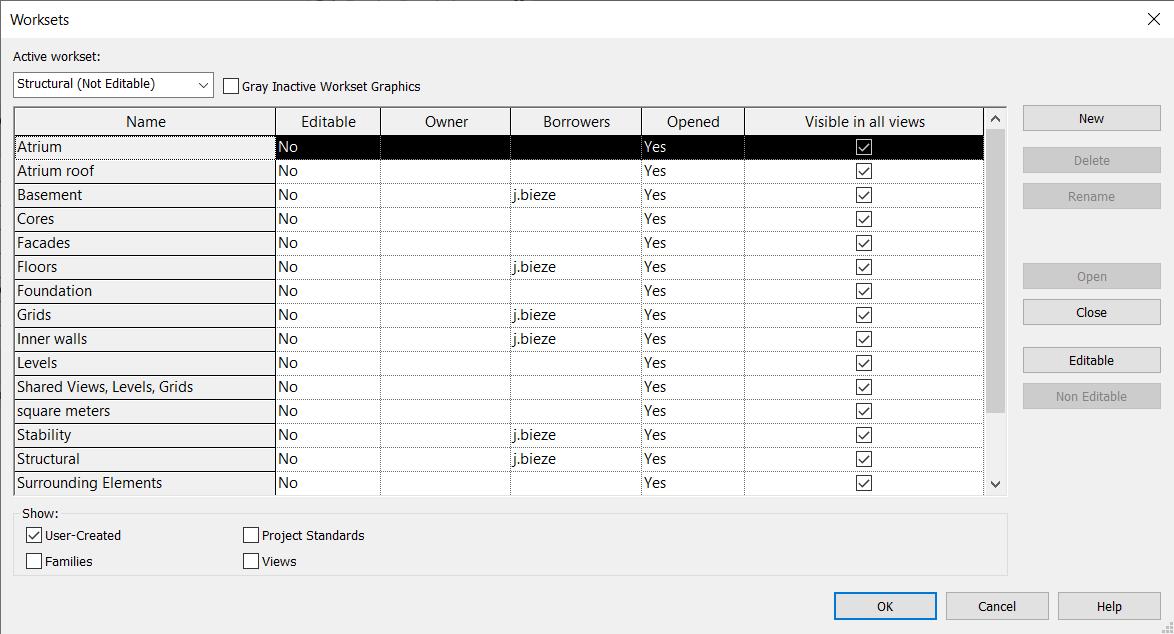
Sharing was operated either via Speckle for members that chose to proceed with Rhino or via BIM 360 for those that preferred Revit. The disciplines got a template with layers of their discipline (APPENDIX COD-04). Each member had to work in the layer of his discipline and create sublayers if need be.
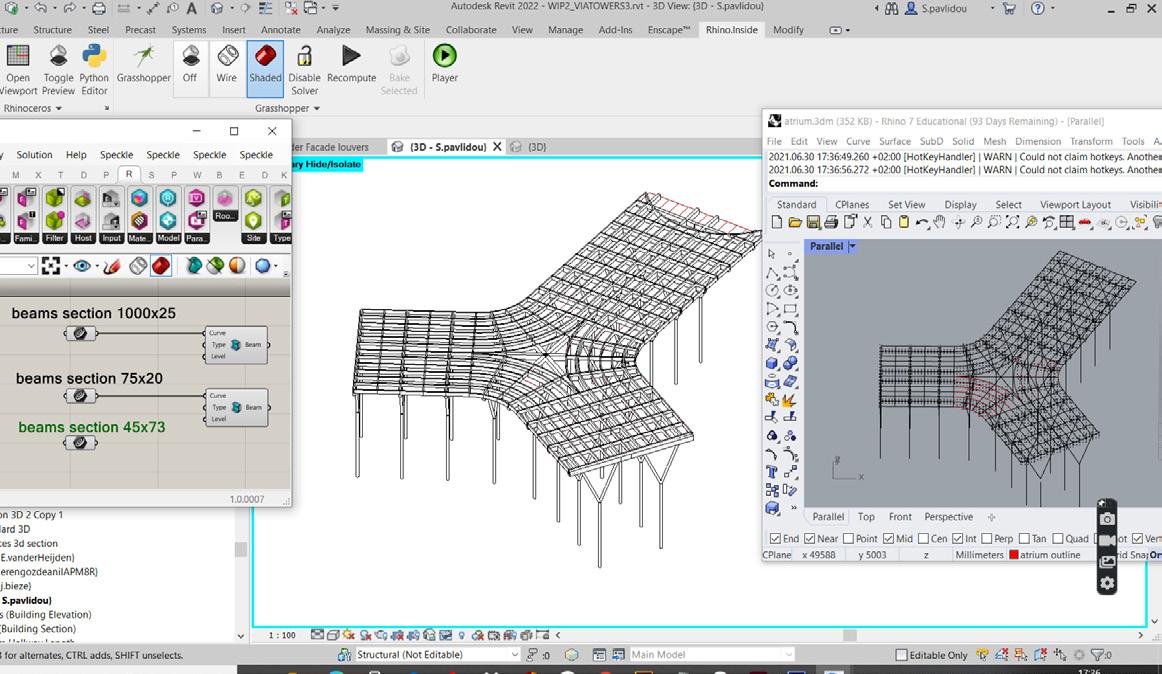
At the Design Development phase most disciplines worked inside a single core model in Revit. Facade Designers and Computational Designer worked in rhino, using the floor boundaries and then transferred elements back in revit via Rhino.Inside.
Figure 1.8 Sharing Template Figure 1.9 Floor boundaries sent to the stream Figure 1.10 Floor boundaries received to design facade elements ChapterChapter
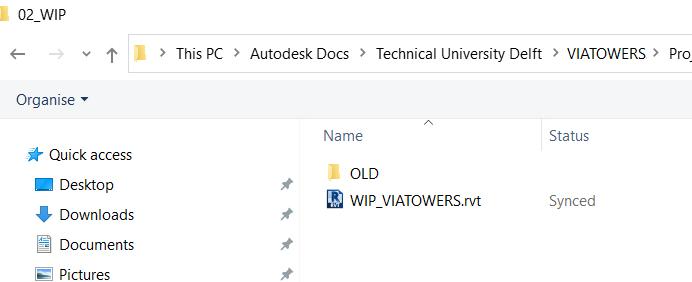
The core model could be accessed through Autodesk Dekstop Connector. After the installation a folder was accessible through quick access. Every day after 18:00 a back up file was created and named as DATE_WIP_VIATOWERS.
Every Tuesday after the main meeting this folder is cleaned up.
Inside the core model various workshets were created according to disciplines and specific focus areas. For team members that chose to work with Rhino Rhino.Inside. was used. The rhino objects were guide lines converted to revit elements, like walls, floors and beams.
In the conceptual design phace Rhinoceros was used. Therefore the file sharing was operated via Speckle. The team-members were either familiar with grasshopper or willing to learn it, so speckle through grasshopper was used. This strategy however suggested that design would be parametrically performed. For instance architects designed floor boundaries, computationa designer refined them and facade designers parametically designed the facade. For convenience reasons, there were times that geometry was designed in rhino as baked geometry that had to be linked again in grasshopper speckle. Speckle was abandoned after a point due to the extra effort that team members had to do and due to the bugs of the software.
The Computational Workflow was also designed based on software that team-members wanted to learn.Two main design softwares were used for the Design Development, Rhino and Revit. Rhino.Inside was used to connect Rhino users with the central model. However, the interaction of the two softwares was problematic and slow, causing Revit to often crash. Rhino. Inside.worked better in the preliminary stages, when geometry was simpler and the document was lighter, for instance when transferring floor boundaries from Rhino. Therefore it is assumed that the two softwares collaborate better when the document is lighter.
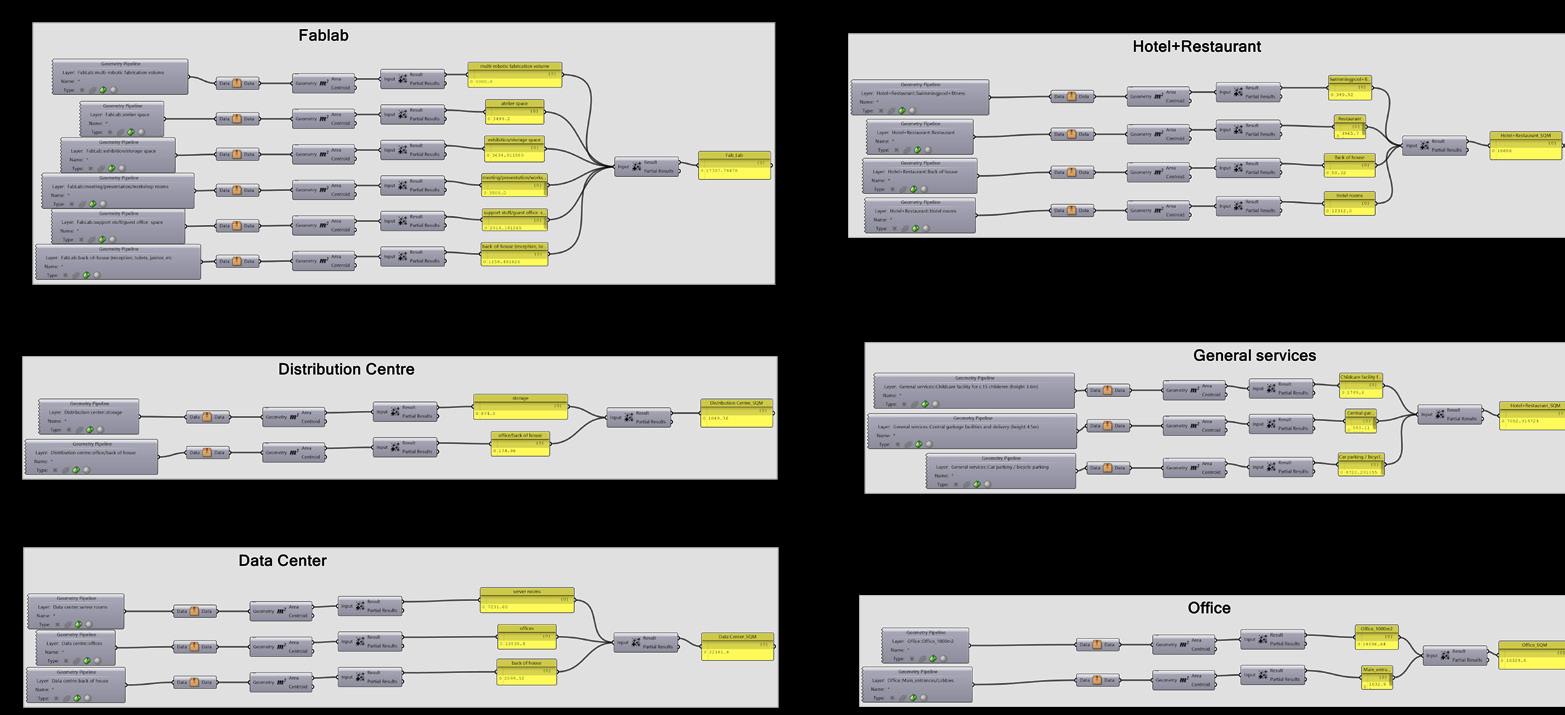
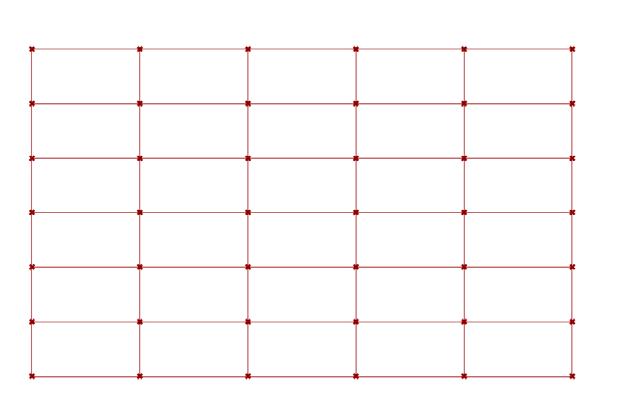
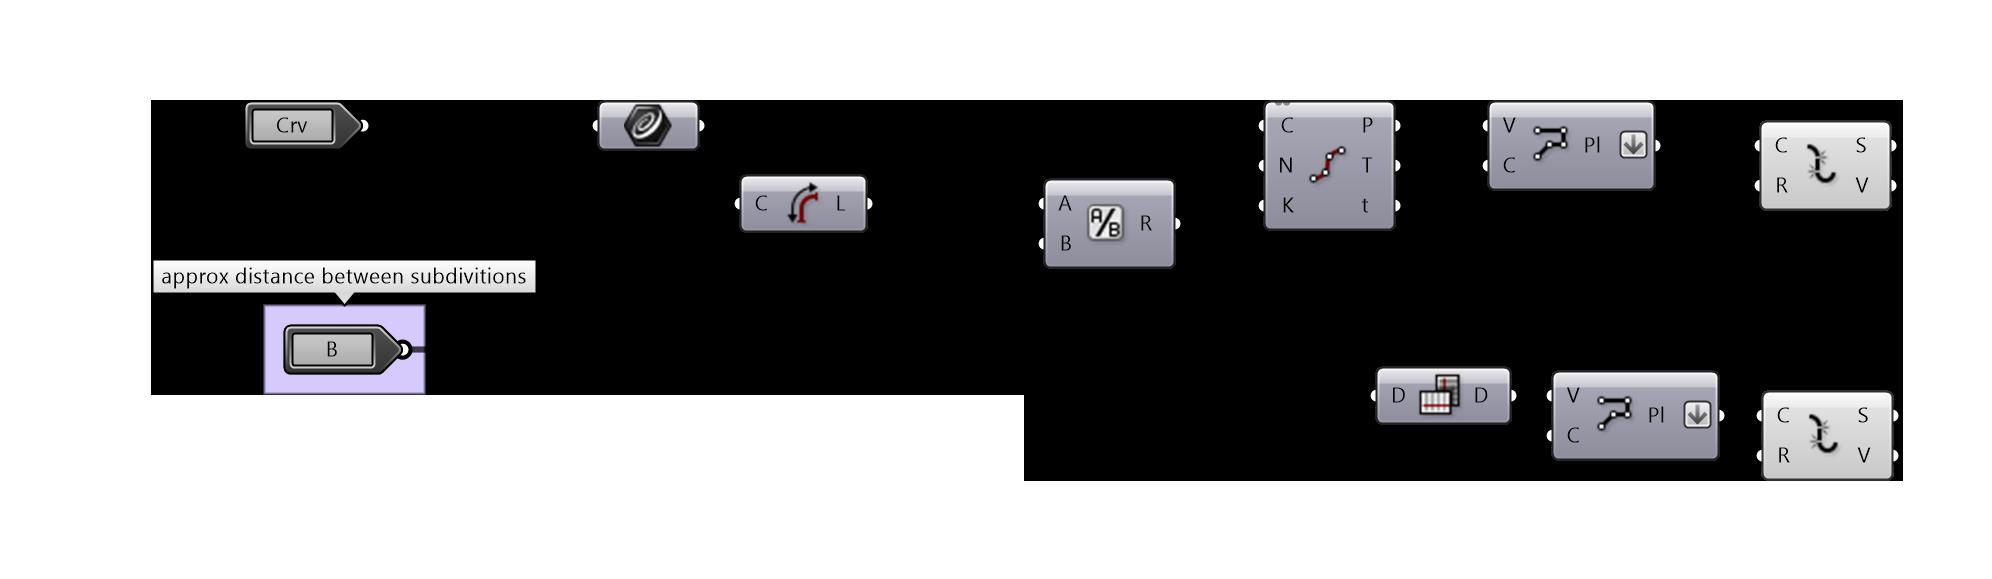
For the volume studies a definition in grasshopper was provided to ease the calcution of the built area. The definition linked the layered objects measured their coverage surface. The layers represented the different uses.
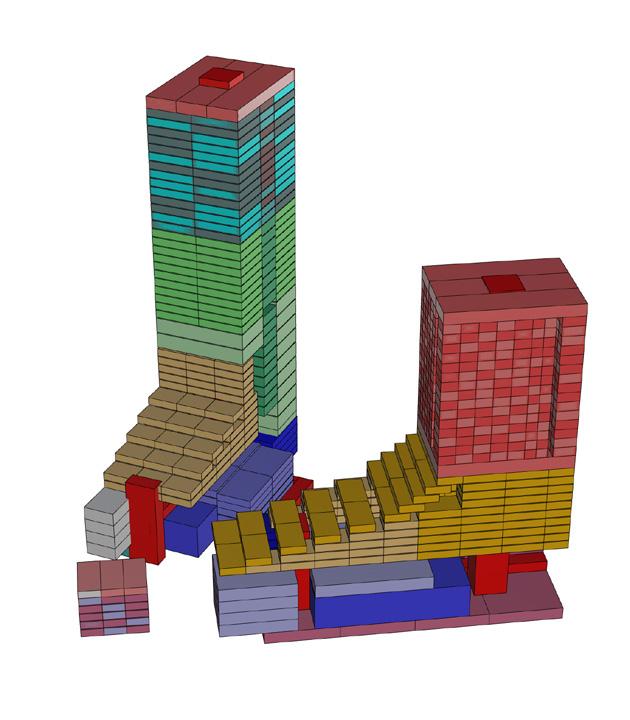
During the first weeks the computational workflow assisted in the form finding process
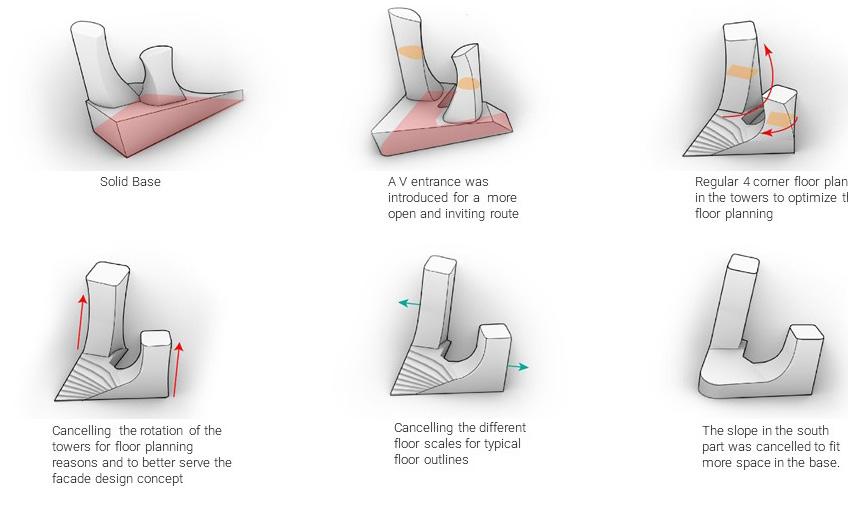 Figure 2.1 Example of lego study. Colors correspond to different layers. With any addition or modfication the panels showing the constructed area were updated.
Figure 2.2 Volumetric studies
Chapter 4.2 Interdisciplinary and interactive parametric design
Figure 2.1 Example of lego study. Colors correspond to different layers. With any addition or modfication the panels showing the constructed area were updated.
Figure 2.2 Volumetric studies
Chapter 4.2 Interdisciplinary and interactive parametric design
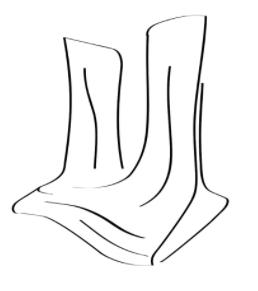
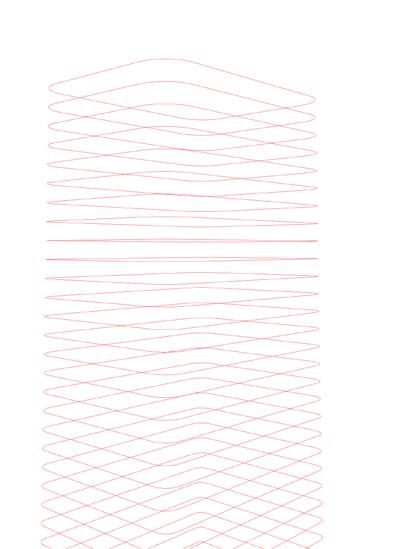
The architectural concept demostrated a particular preference to curved facades and organic shapes. To ease the form finding process clustered definitions were provided to the designing team (APPENDIX COD-01, COD-02, COD-03).
These definitions allowed the architects to find the desired form but also the climate designer to simulate the impact of the shape to the resulting shadows and wind speeds in the facade.
The clustered definition refined the form of the building, through smooth development of the floors using the graphmapper remap techniques.
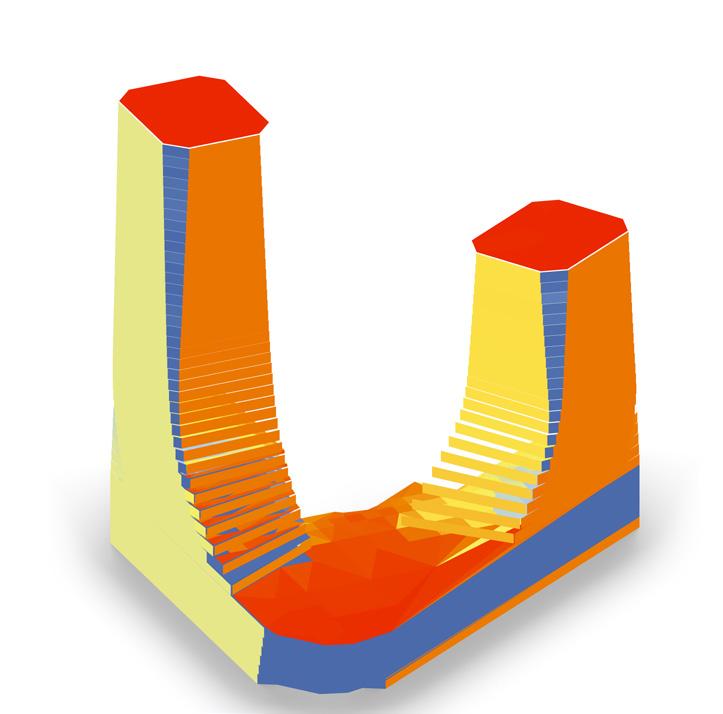
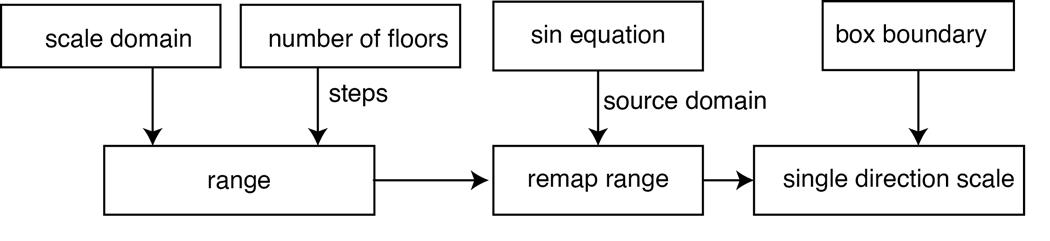
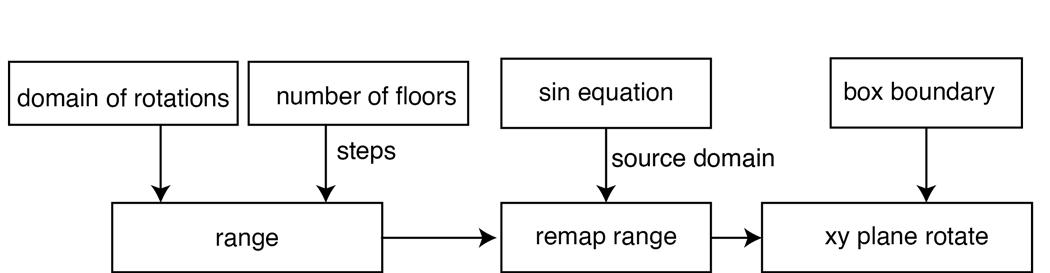

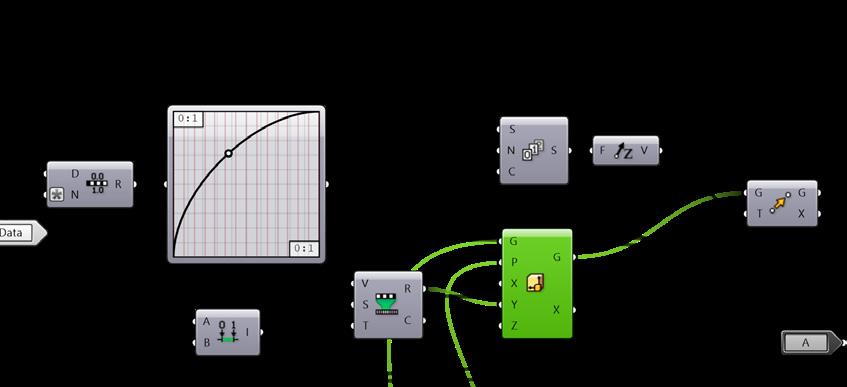 Figure 2.7 Part of the clustered definition with graph mapping r emap
Figure 2.6 Form refinement
Smooth bottom scale
Smooth rotation
Figure 2.5 Solar exposure on facade (produced by climate designer)
Chapter 4.2 Interdisciplinary and interactive parametric design
Figure 2.7 Part of the clustered definition with graph mapping r emap
Figure 2.6 Form refinement
Smooth bottom scale
Smooth rotation
Figure 2.5 Solar exposure on facade (produced by climate designer)
Chapter 4.2 Interdisciplinary and interactive parametric design
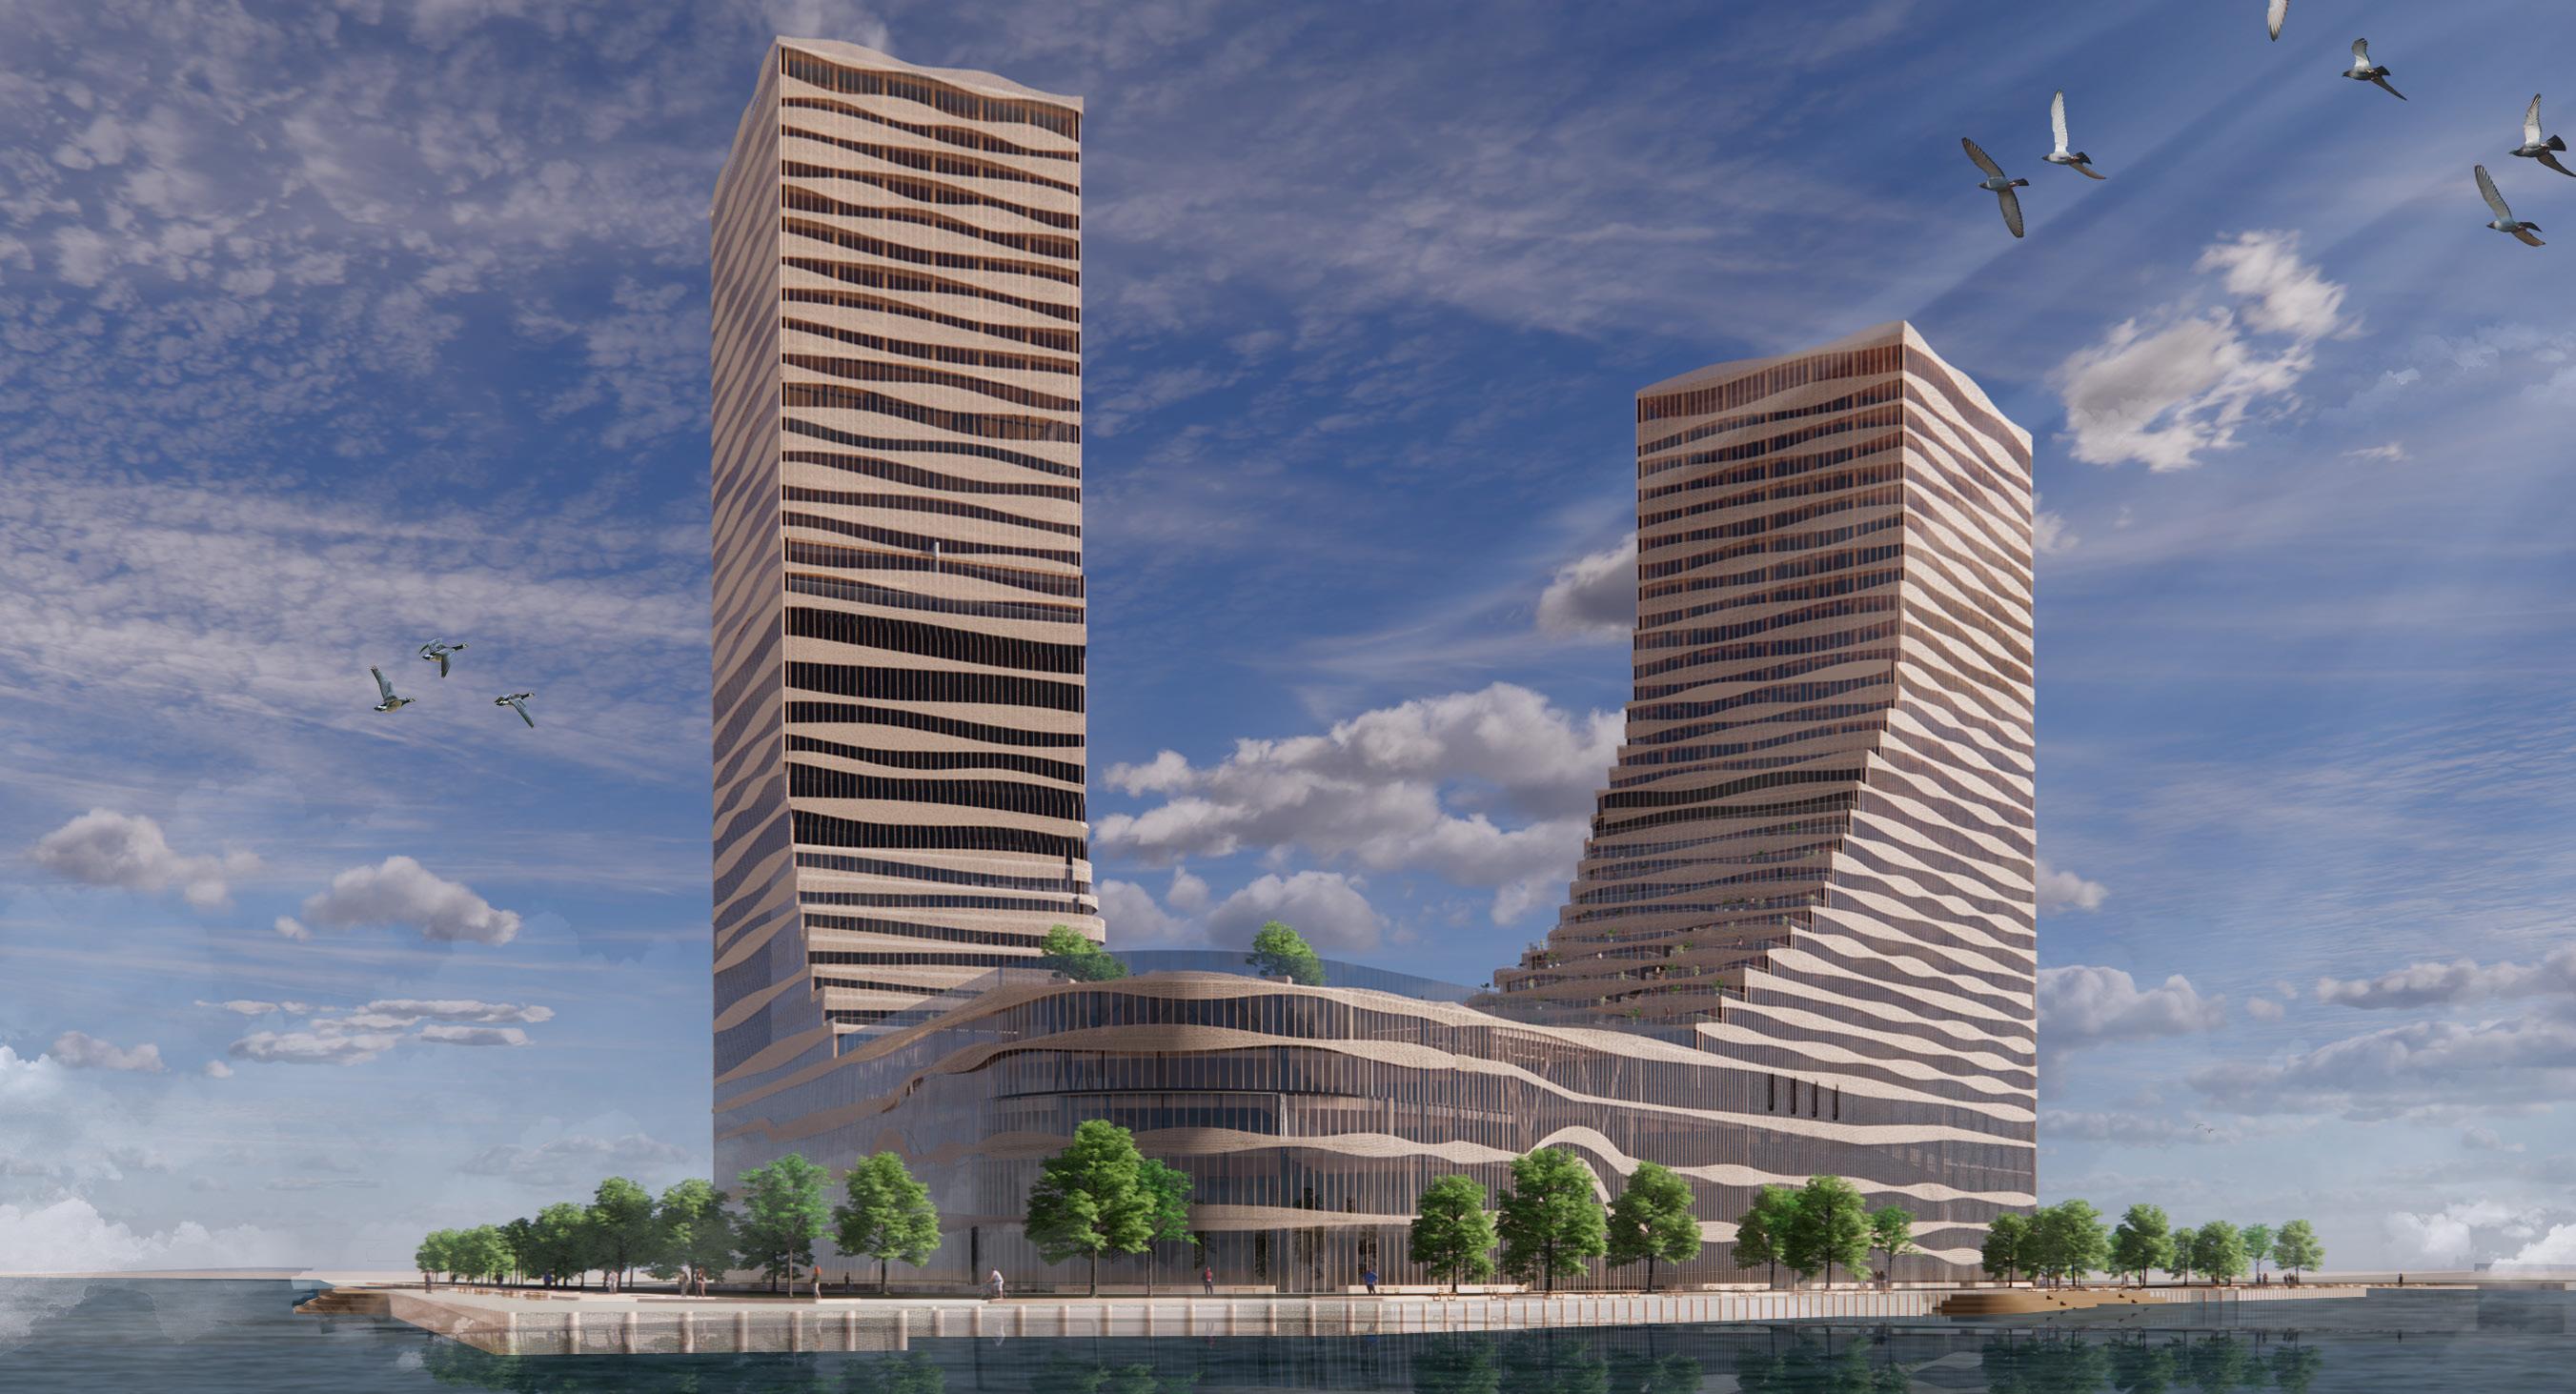
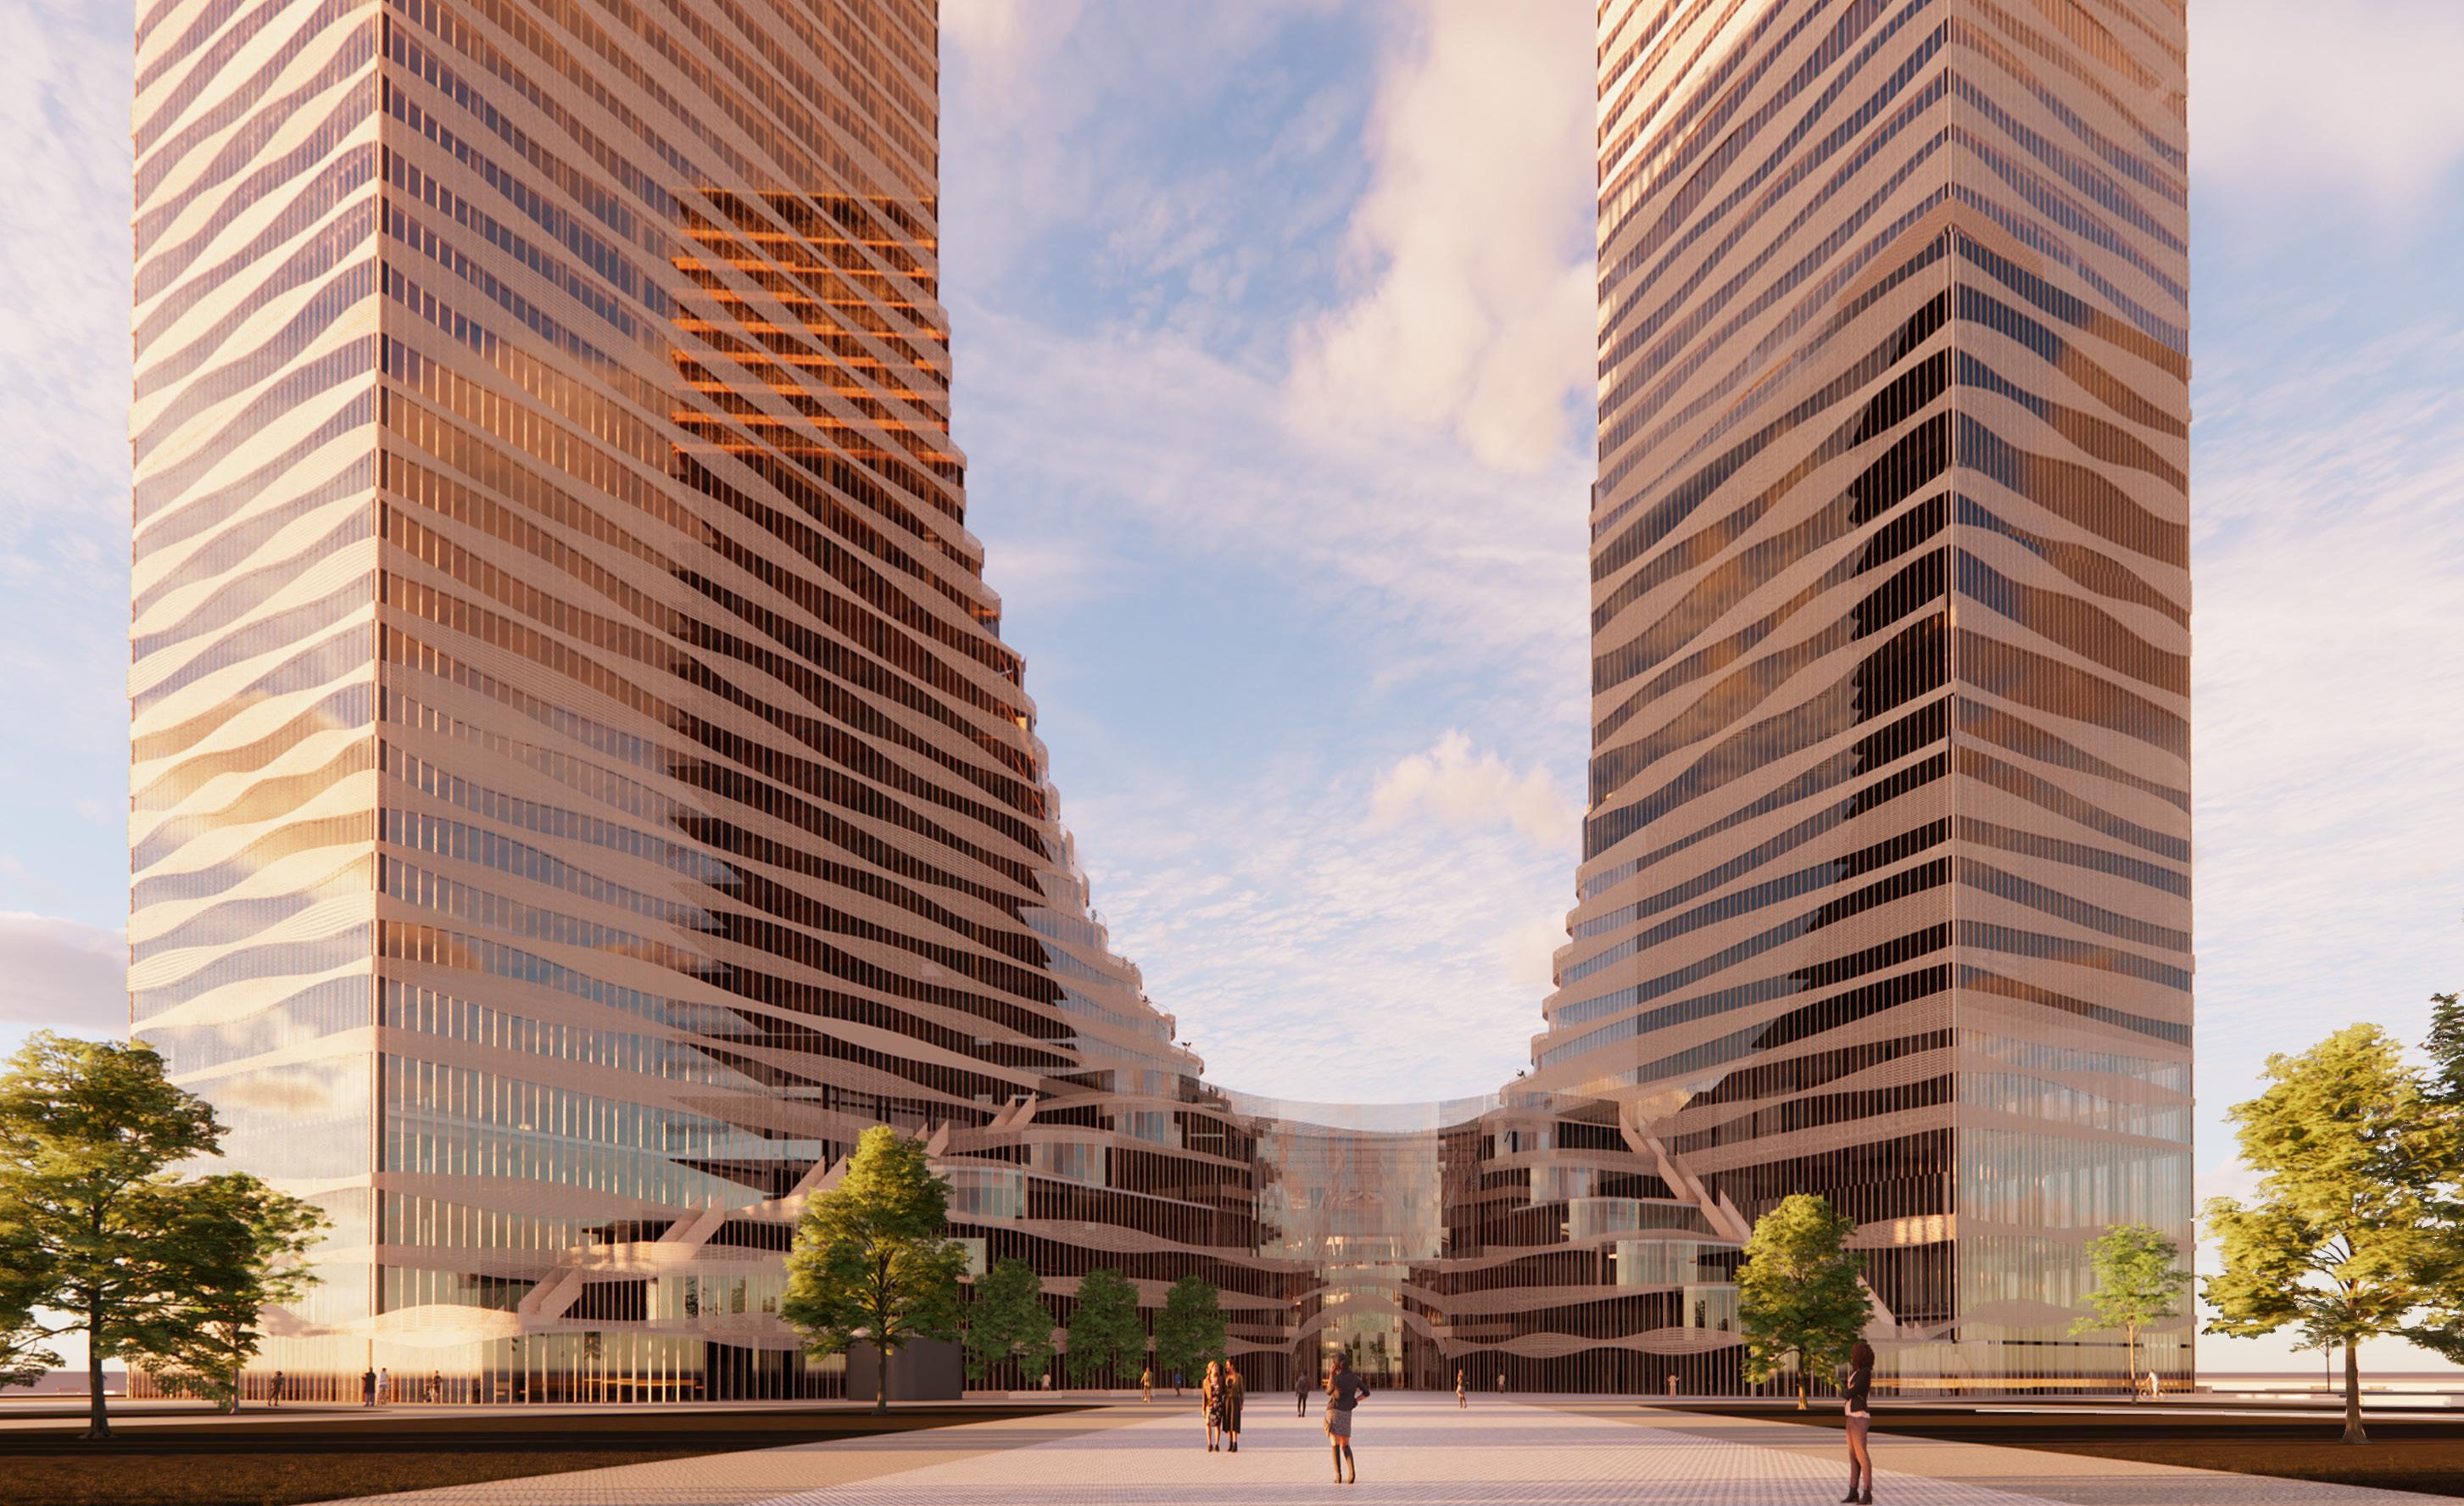
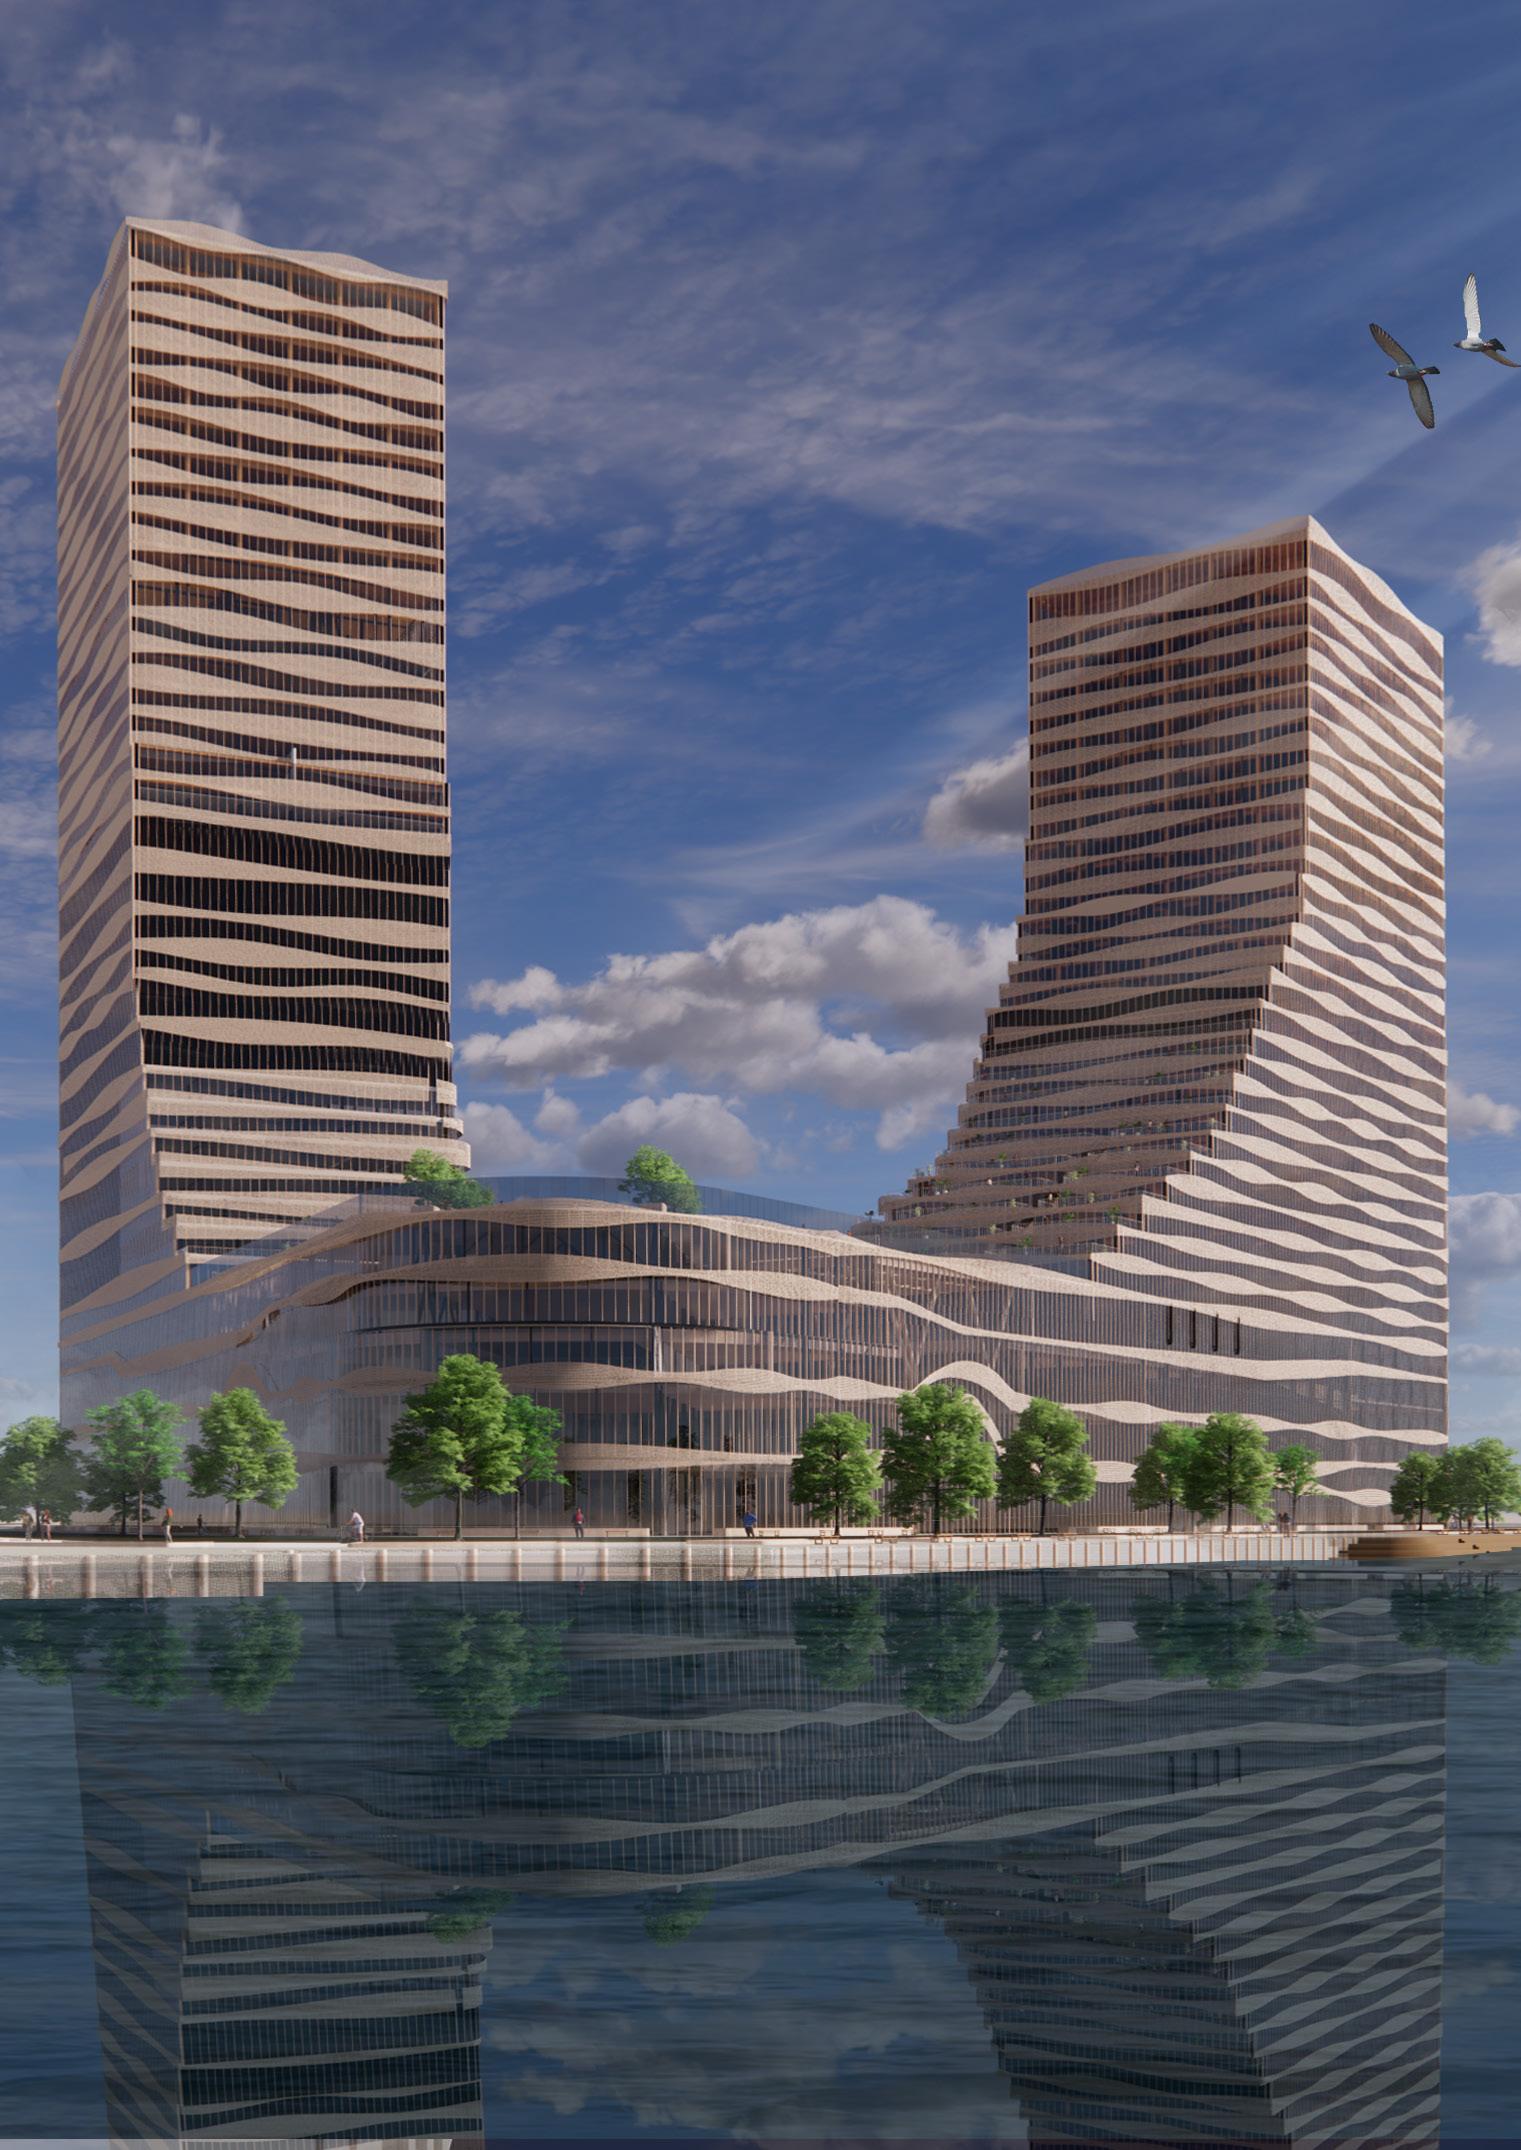
 Figure 2.10 Final render made by the architects
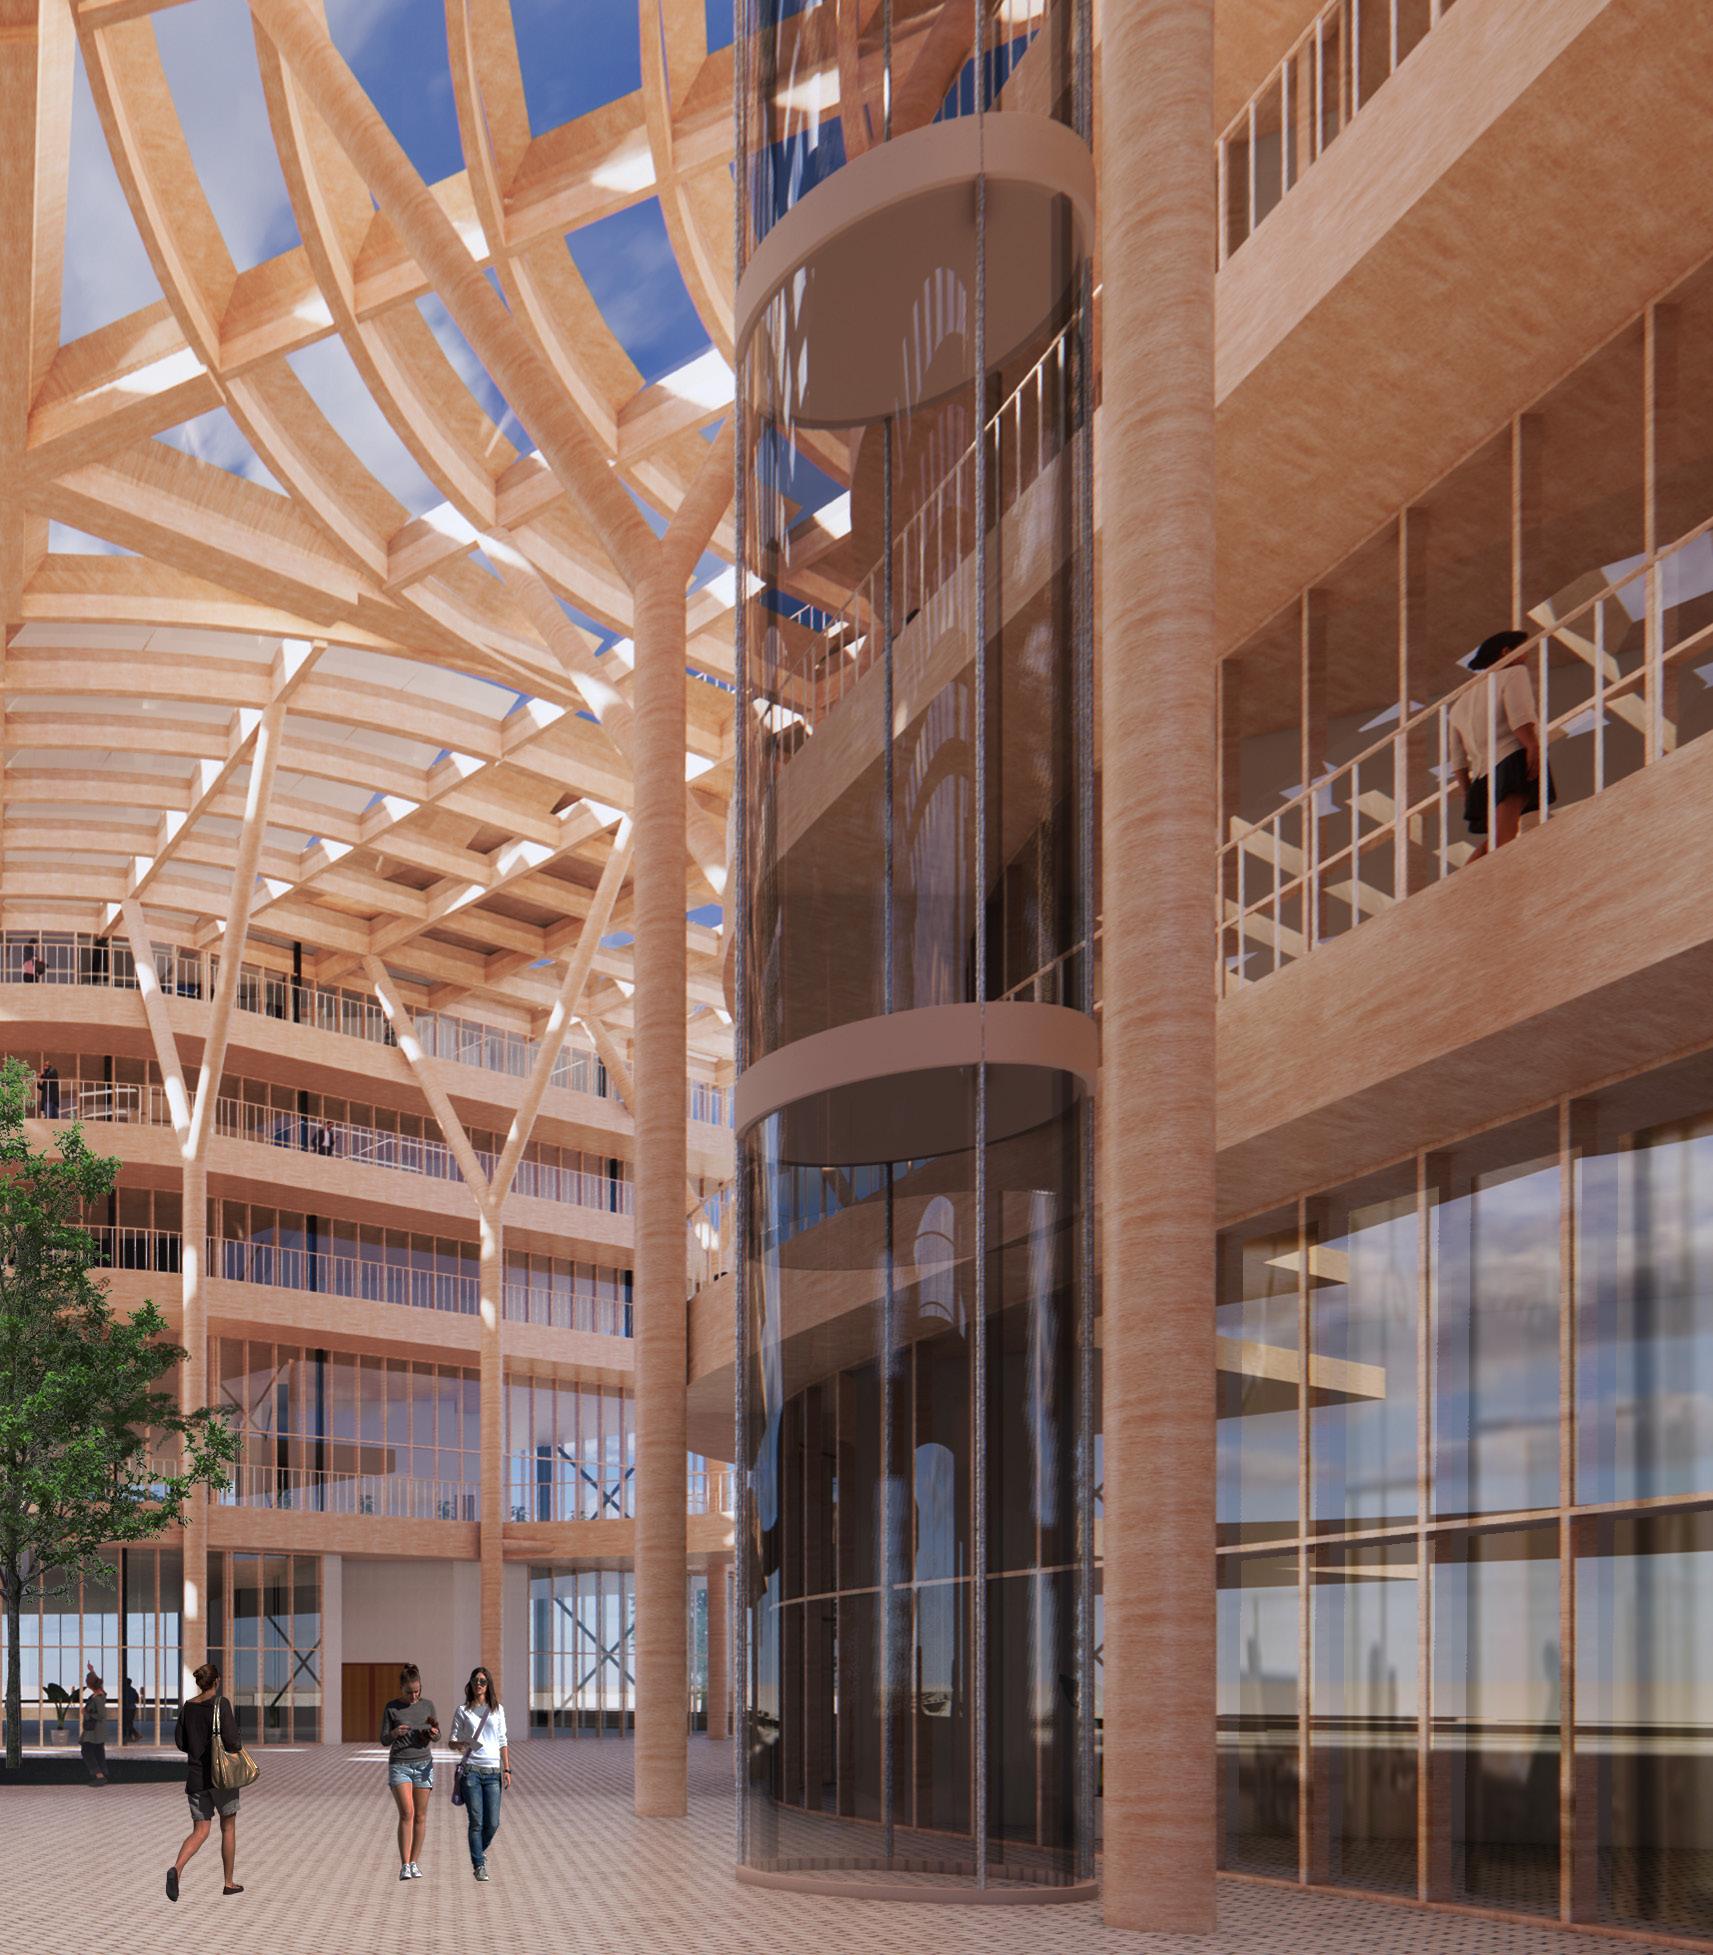
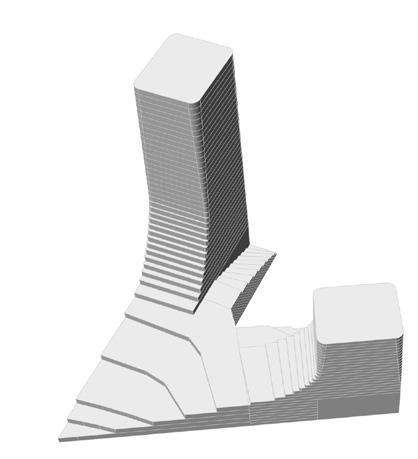
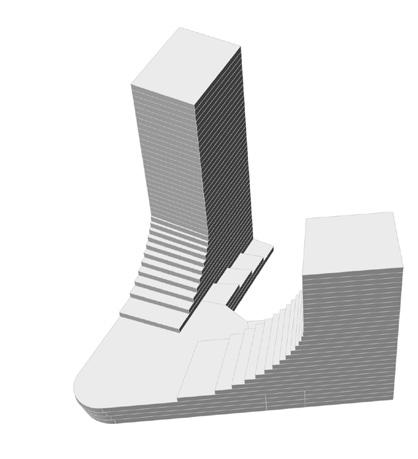
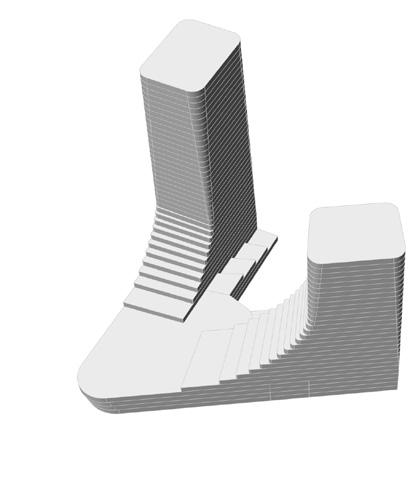
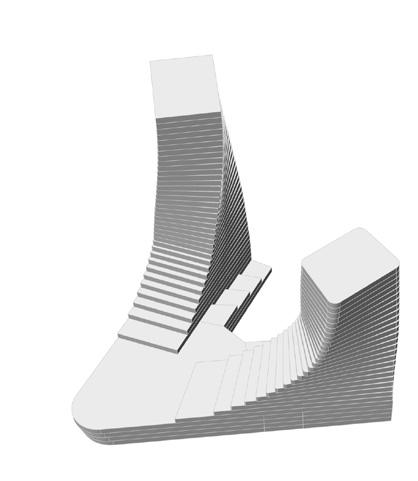
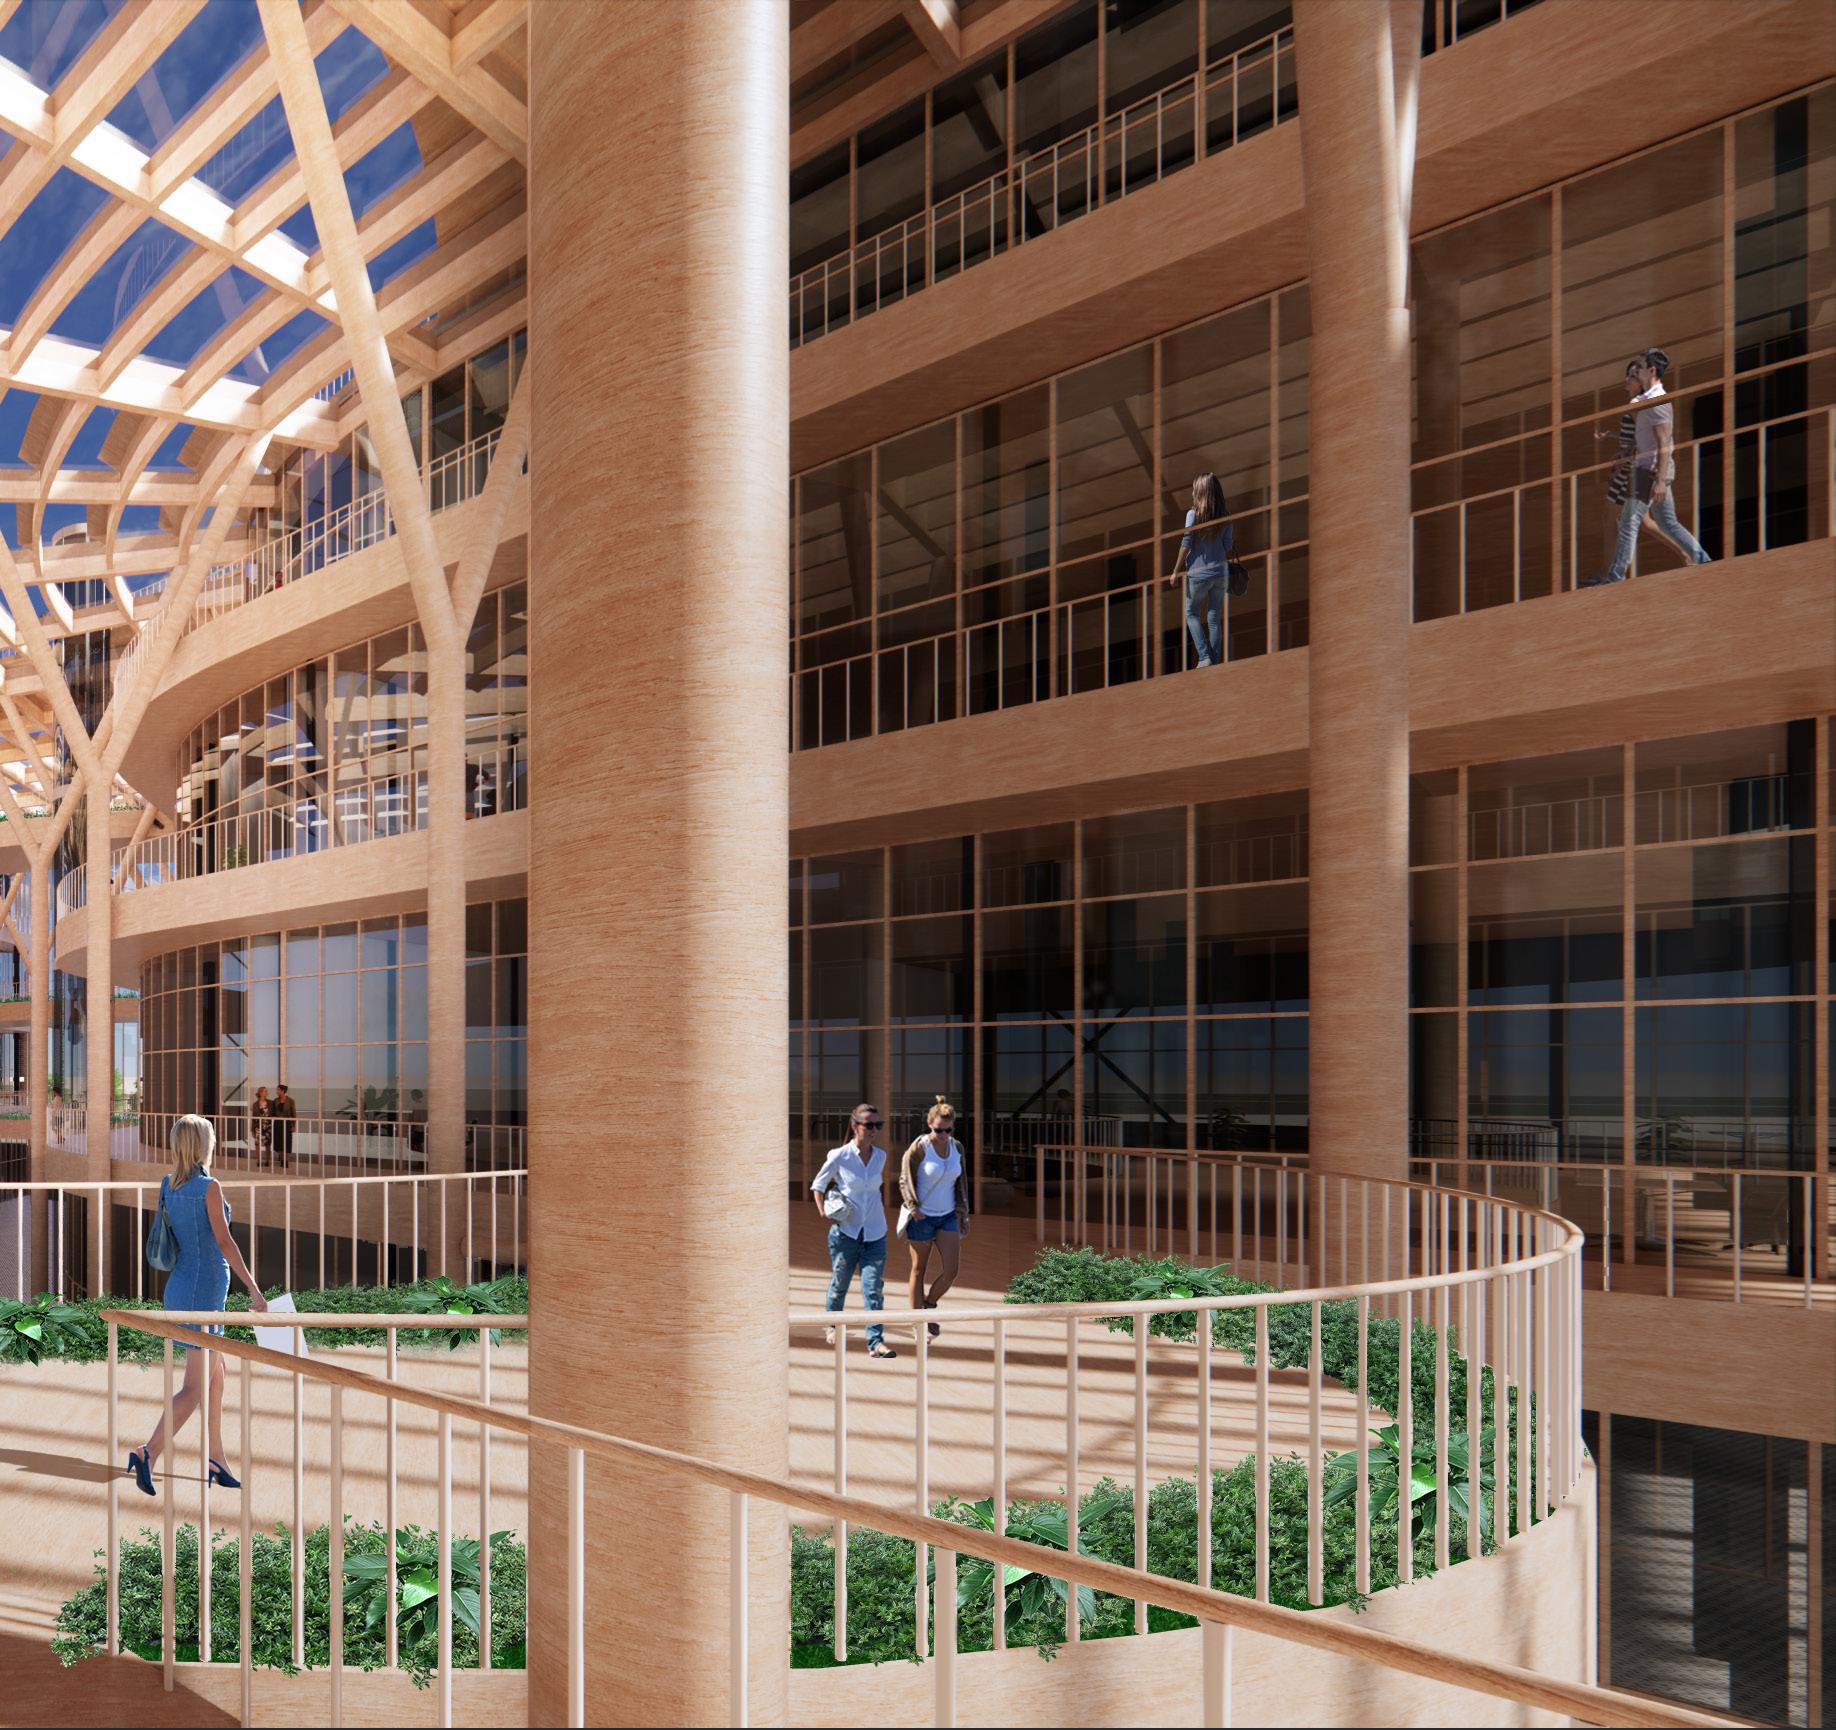
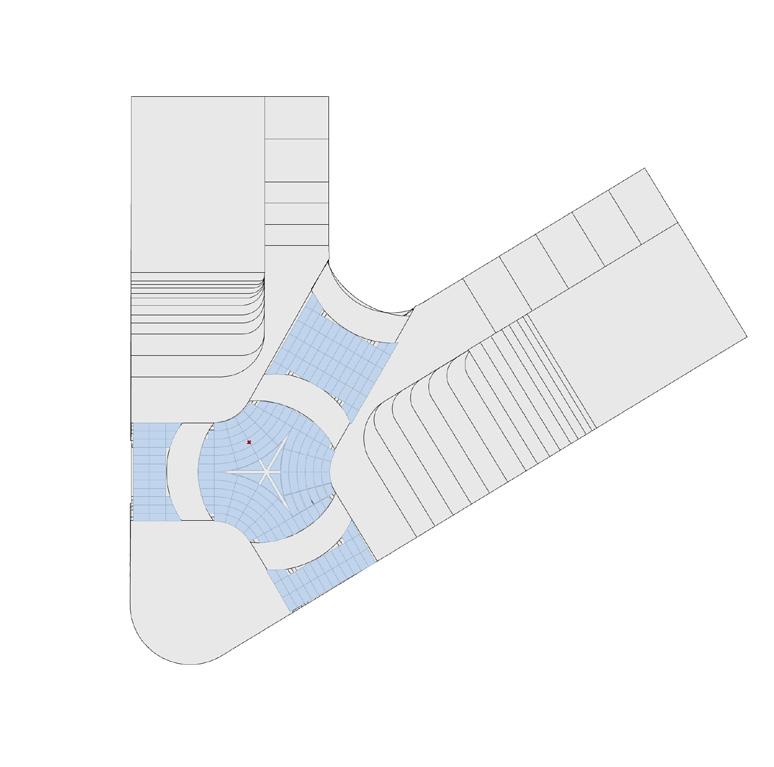
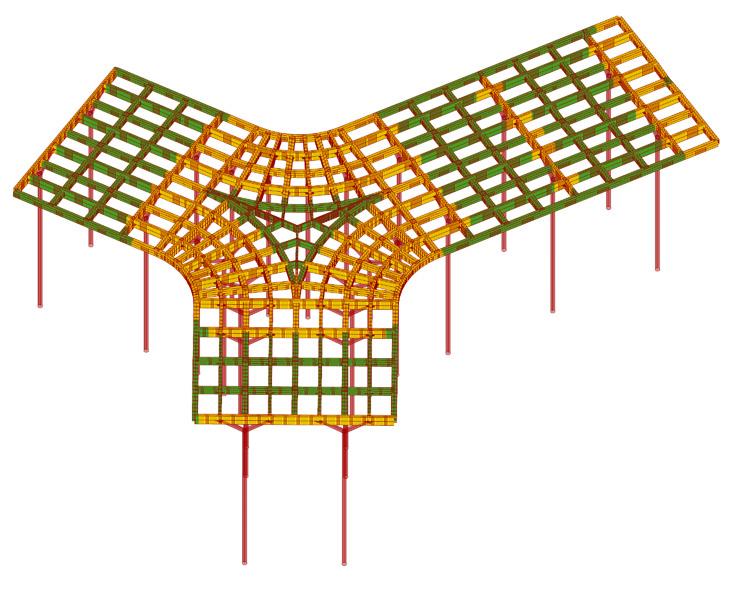
The atrium is the central area of the VIA Towers, and therefore it is a solid product of integration and collaboration across all different disciplines. Consequently, the atrium became the space where everything came together, both visually and functionally The atrium serves as the central orientation point for spatial identification for our multifunctional building. It has different areas along and
through the atrium with different programs. The atrium is used to control the activities within the areas in order to make the circulation clear to all users. It also provides a destination space for social activities and events. This space allows for future fluctuations of the programme and consequently is designed to be as flexible as possible.
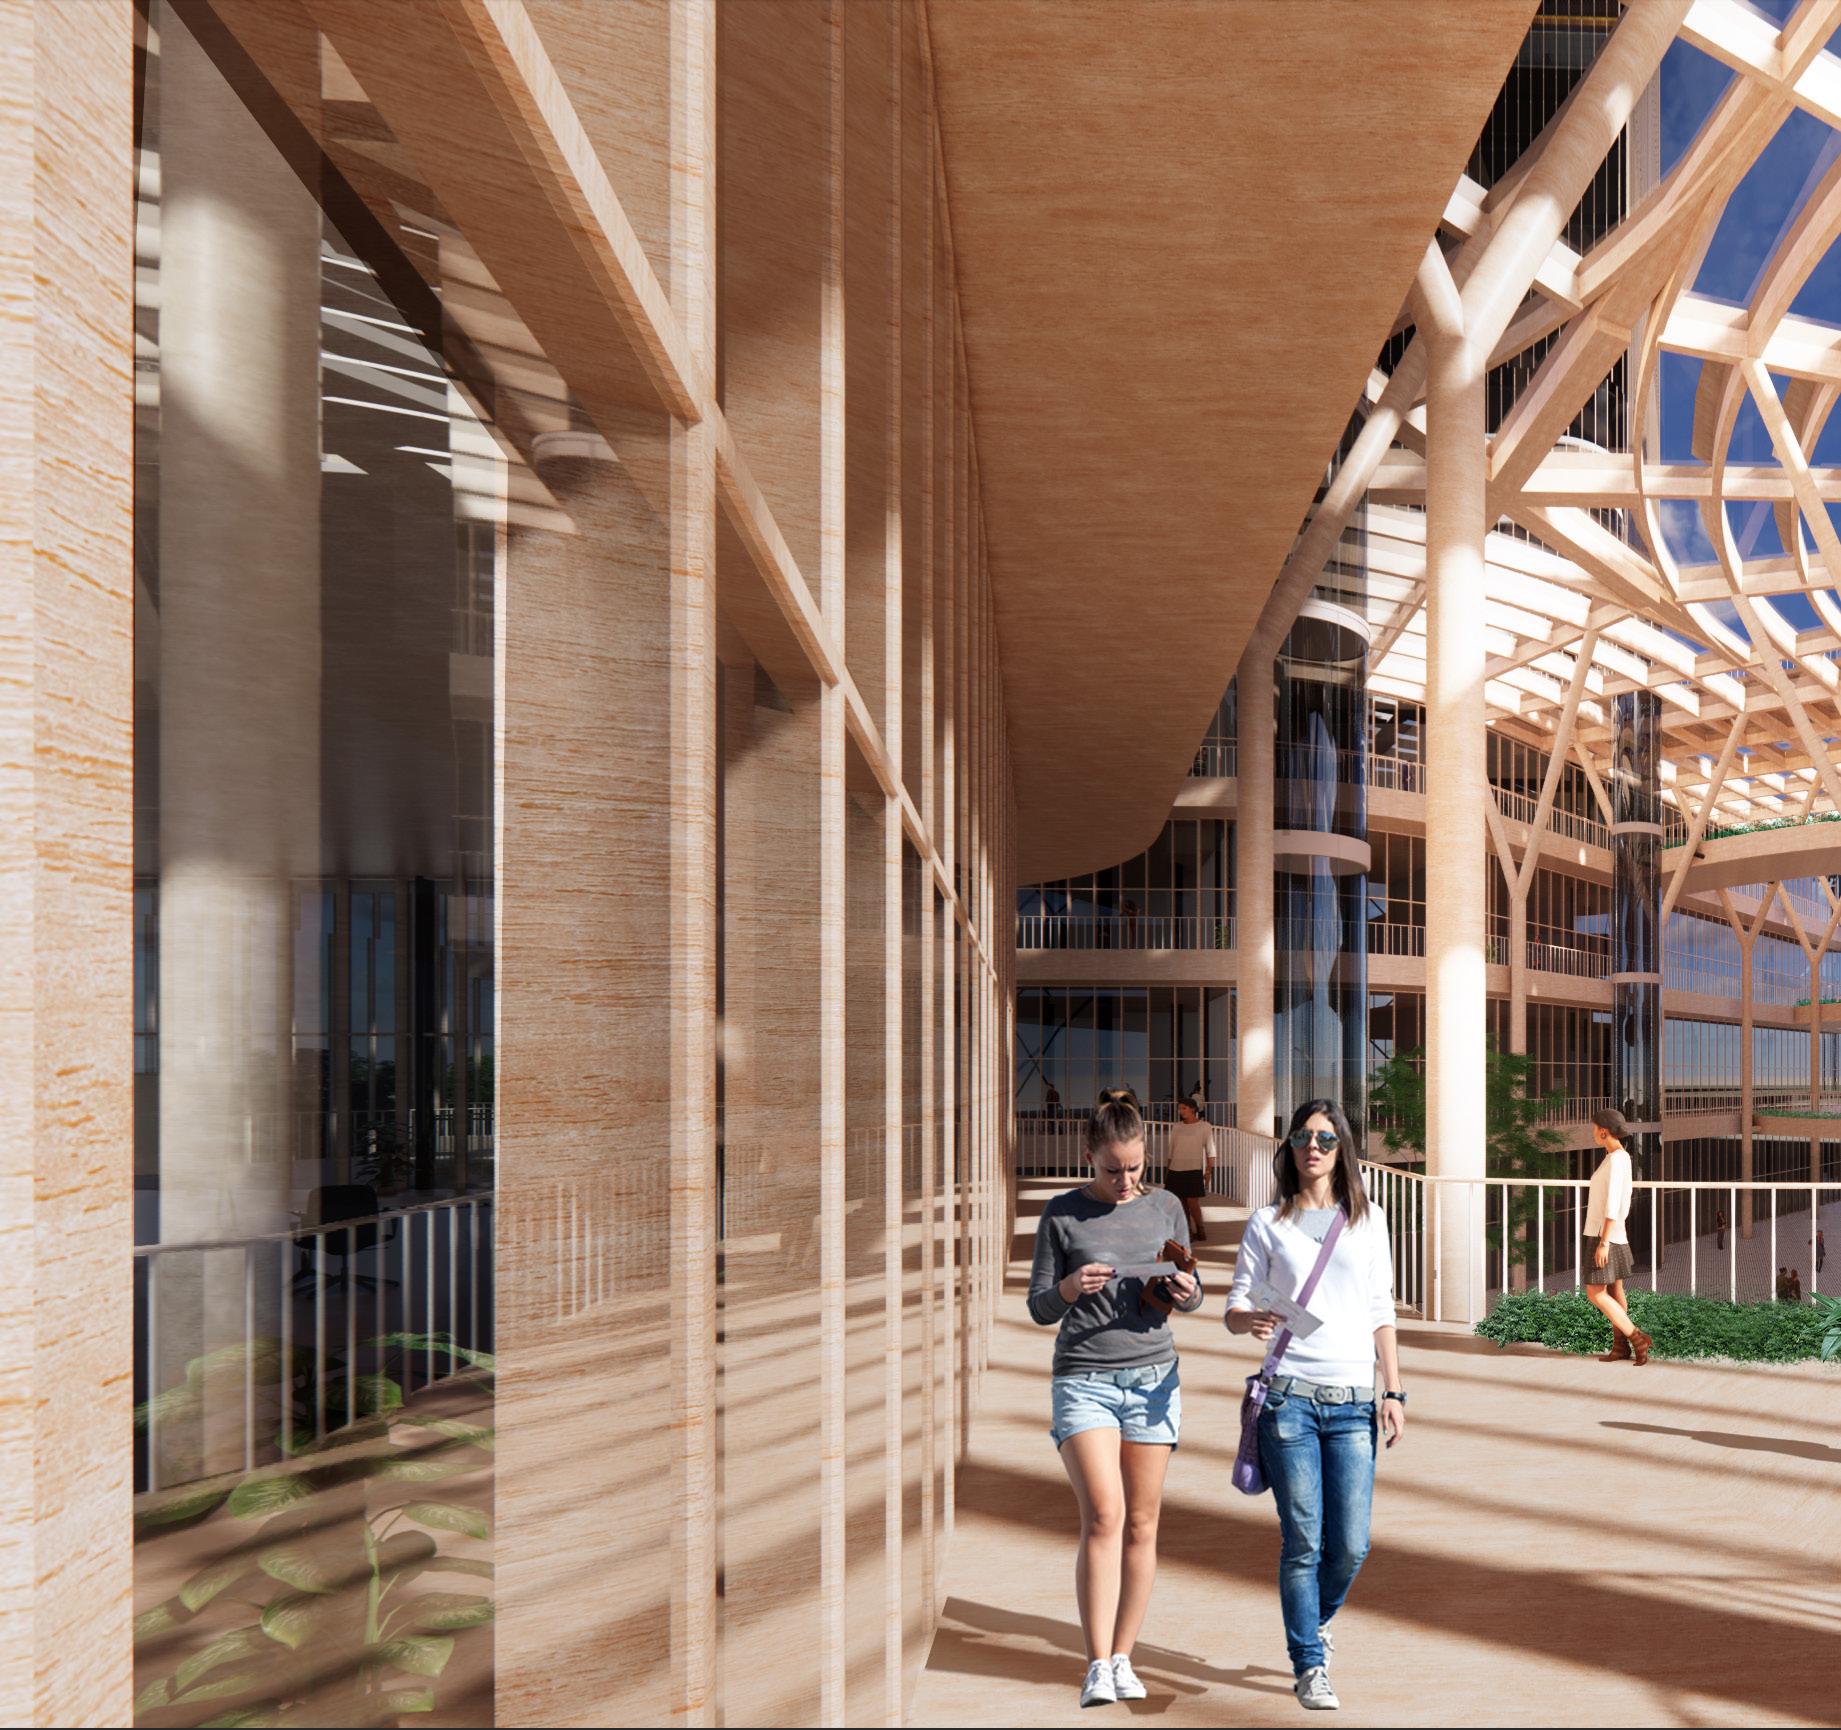 Figure 2.10 Final render made by the architects
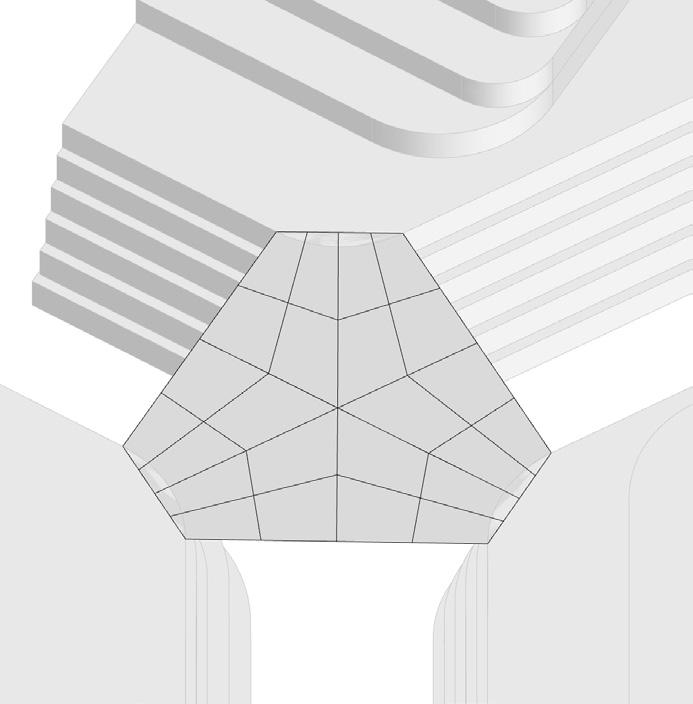
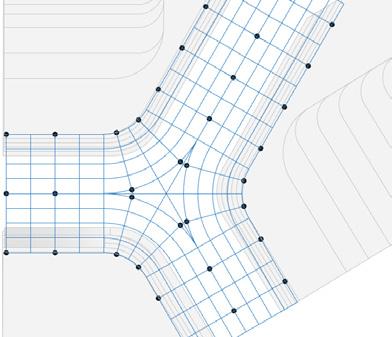
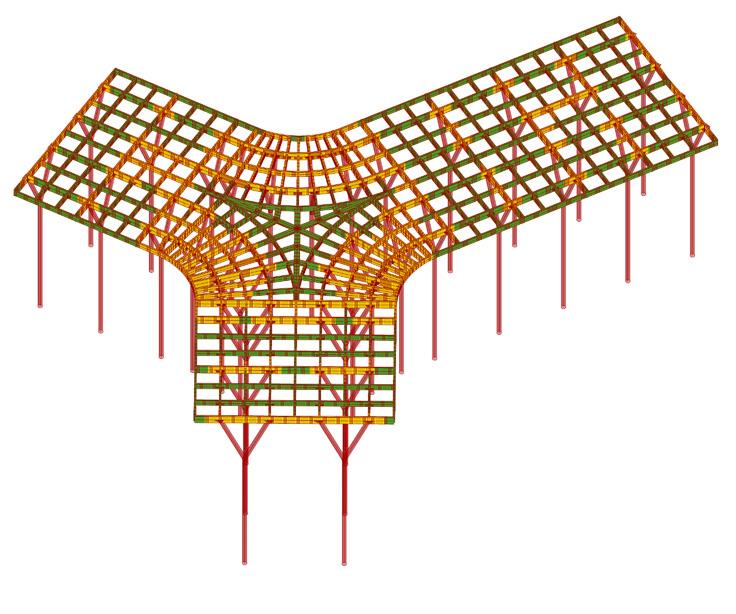
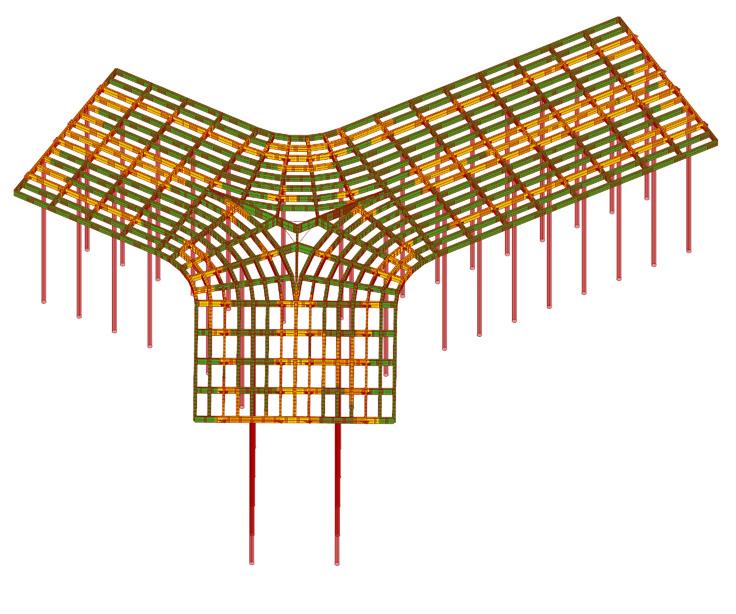
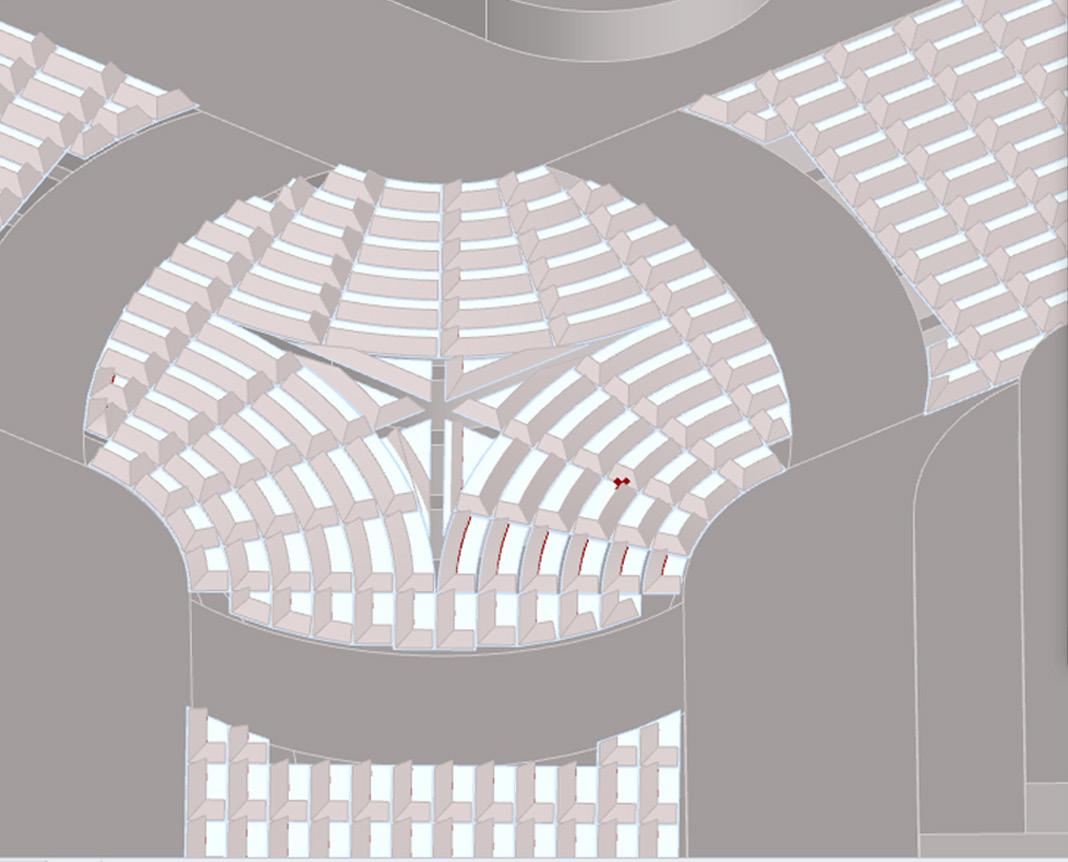
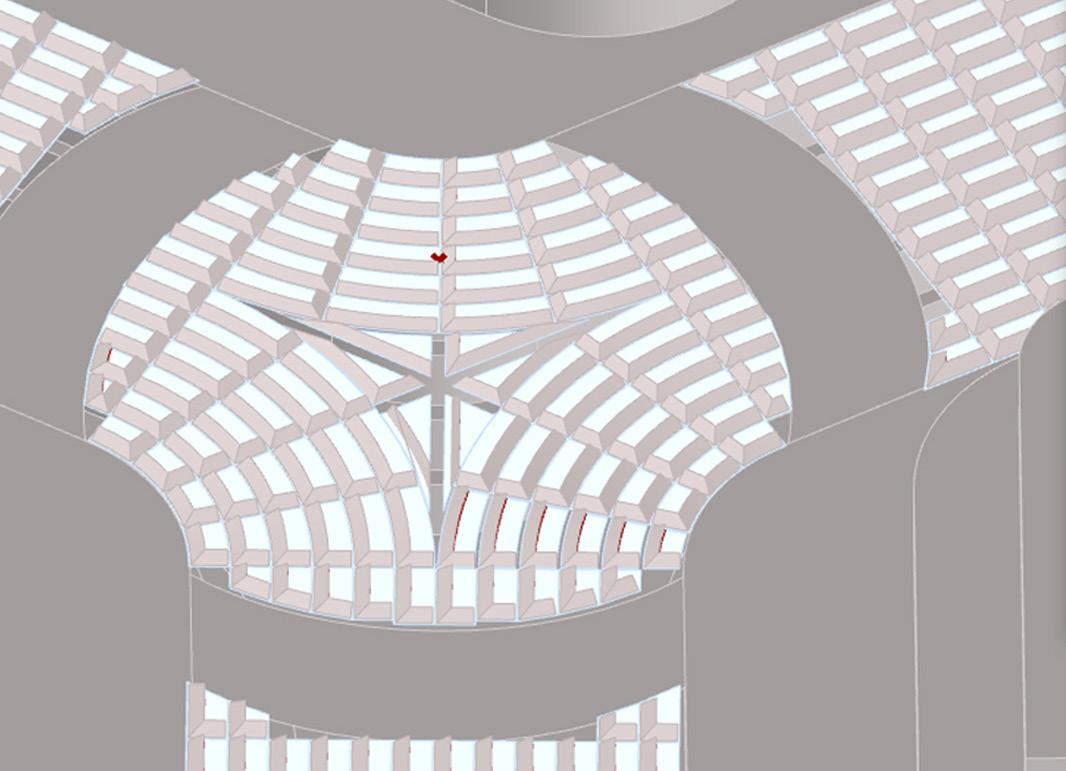
As a first attempt to design the atrium’s beam structure, mesh subdivitions and mesh relaxation using kangaroo physics were used. The mesh relaxation resulted in a beam structure that aligned with building boundaries and in a smooth transition of the offset lines. At this point, the structural designers reported that numerous columns in the circulation space would be required. The definition can be found in APPENDIX COD-05.
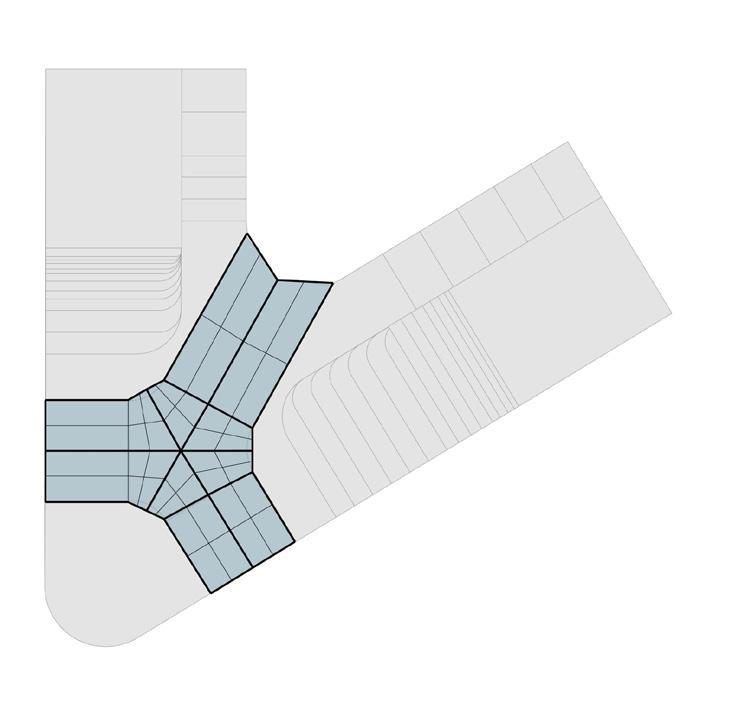

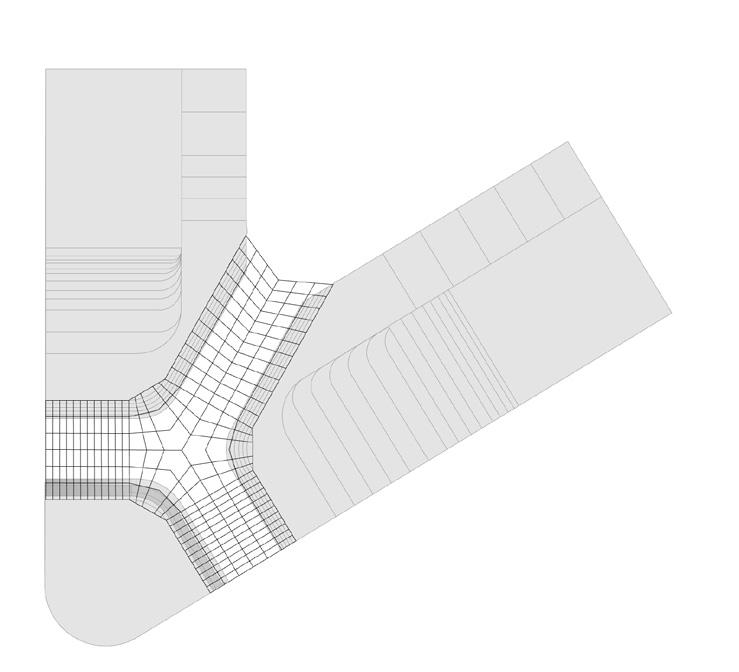
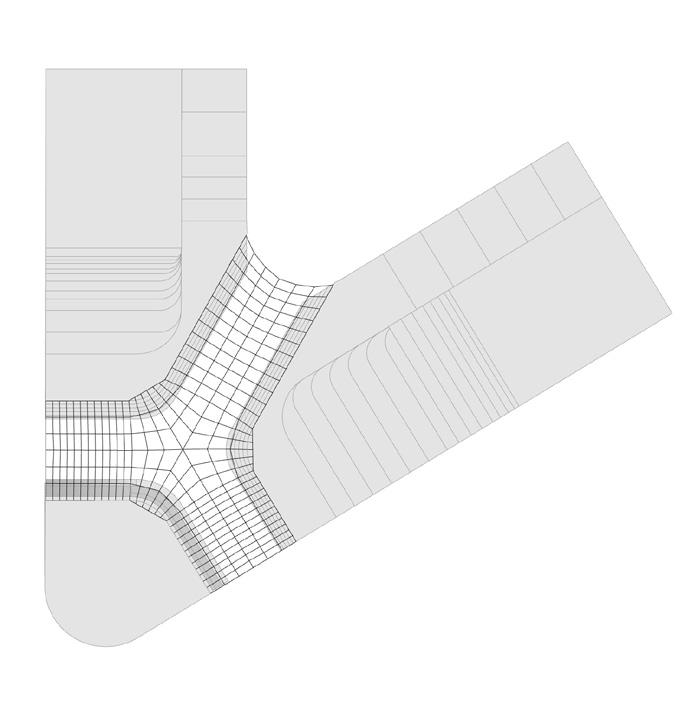 Figure 2.11 Initial meshes with four edges
Figure 2.13 Anchor Points
Figure 2.14 Mesh Relaxation
Figure 2.12 Mesh subdivition
Figure 2.11 Initial meshes with four edges
Figure 2.13 Anchor Points
Figure 2.14 Mesh Relaxation
Figure 2.12 Mesh subdivition
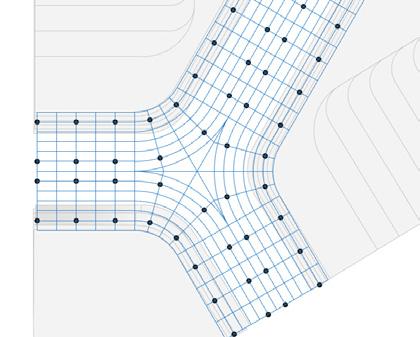
A space truss structure was also proposed by structural designers to minimize the population of the columns and to avoid placing them in the open space. To visualize the space frame mesh subdivition was used again.

After tested in karamba, with a mesh load of 6kN (walking people and roof cover ) the space frame structure made out of timber material did not exceed the allowable deflections and did not required the placement of columns in the open space underneath it.
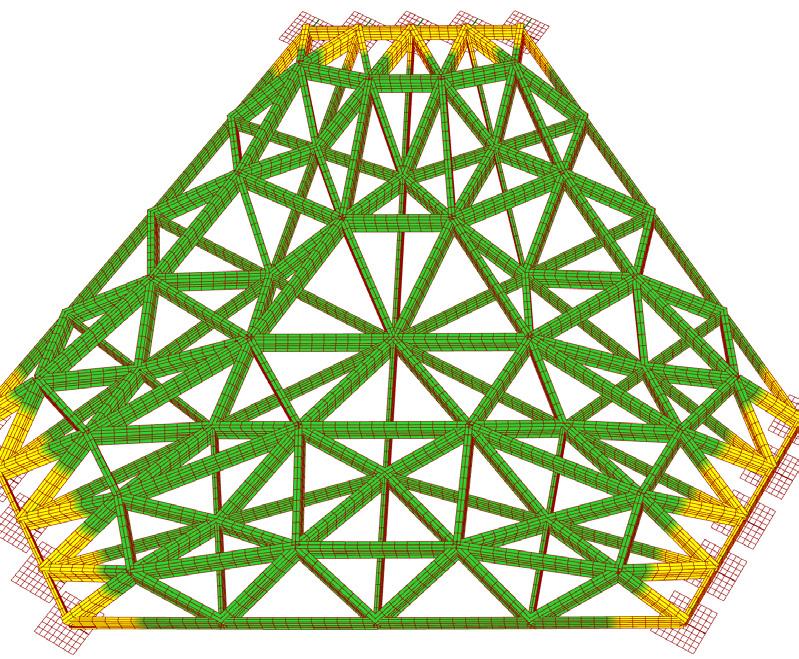
The space truss structure did not meet the design criteria of the architects and facade designers from the beginning, however it was not to be rejected without testing. Therefore to speed up the design process, it was only designed in the centre of the atrium, were deflections were at maximum. The deflections were tested and indeed it was a good structurally perfoming roof structure. However, the space frame idea was abandonned as it did not align with the aesthetics of the atrium’s design.
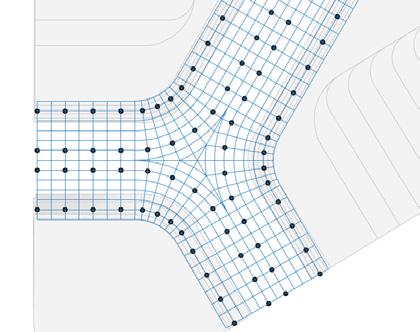
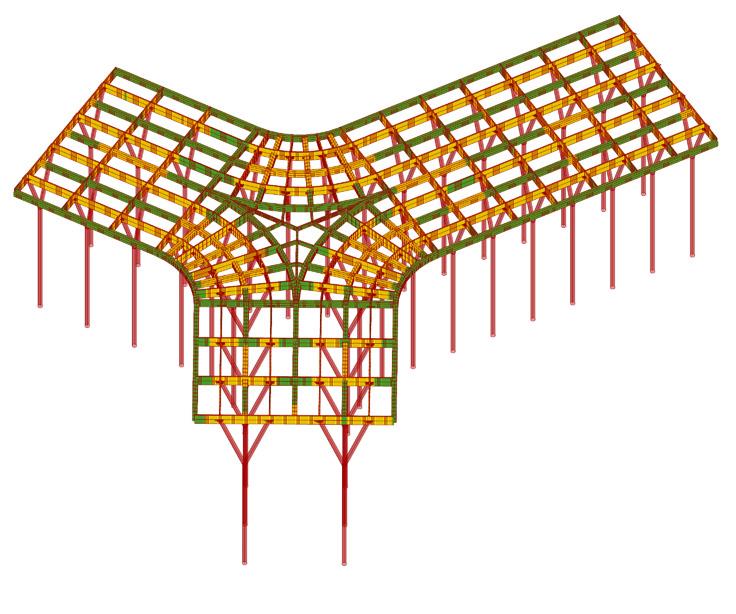
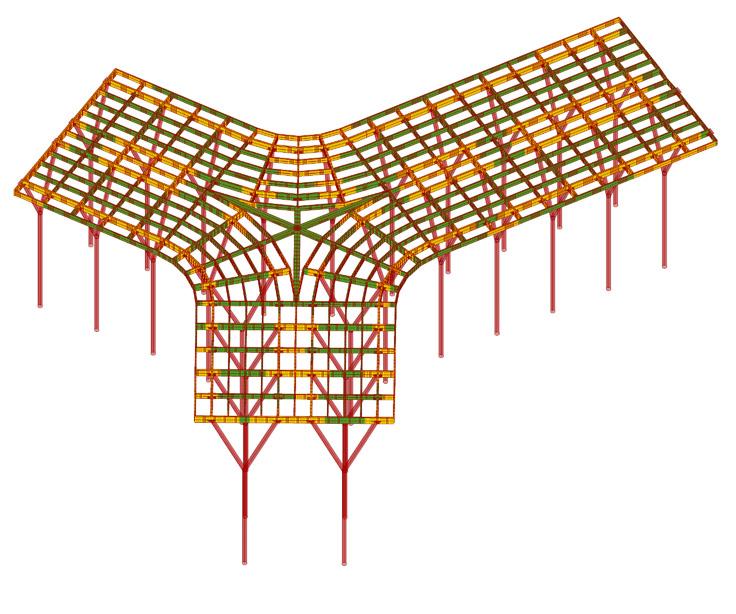
It was decided that a planar beam structure was preferred. Also curved beams were proposed. Therefore a mesh subdivition and relaxation could be used anymore. A structural concept was designed by the structural designers and design variables were created in a grasshopper definition providing various configurations of the concept.
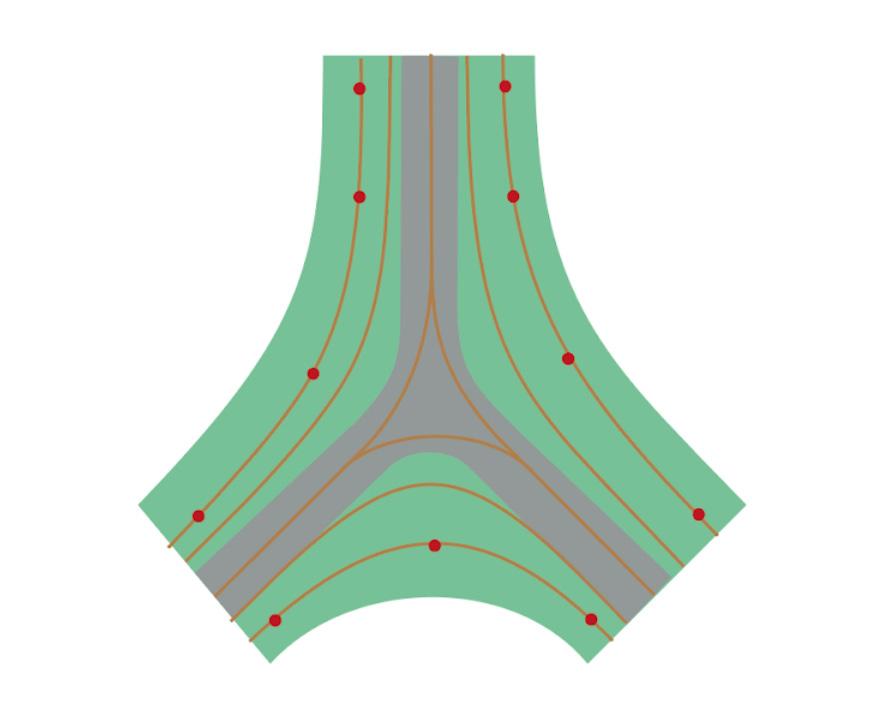

 Figure 2.19 Karamba simulation tested for deflections ( APPENDIX COD-06)
Figures 2.21 Structural concepts made from the structural designers
Figure 2.20 Karamba simulation for the timber space frame
Chapter 4.2 Interdisciplinary and interactive parametric design
Figure 2.19 Karamba simulation tested for deflections ( APPENDIX COD-06)
Figures 2.21 Structural concepts made from the structural designers
Figure 2.20 Karamba simulation for the timber space frame
Chapter 4.2 Interdisciplinary and interactive parametric design
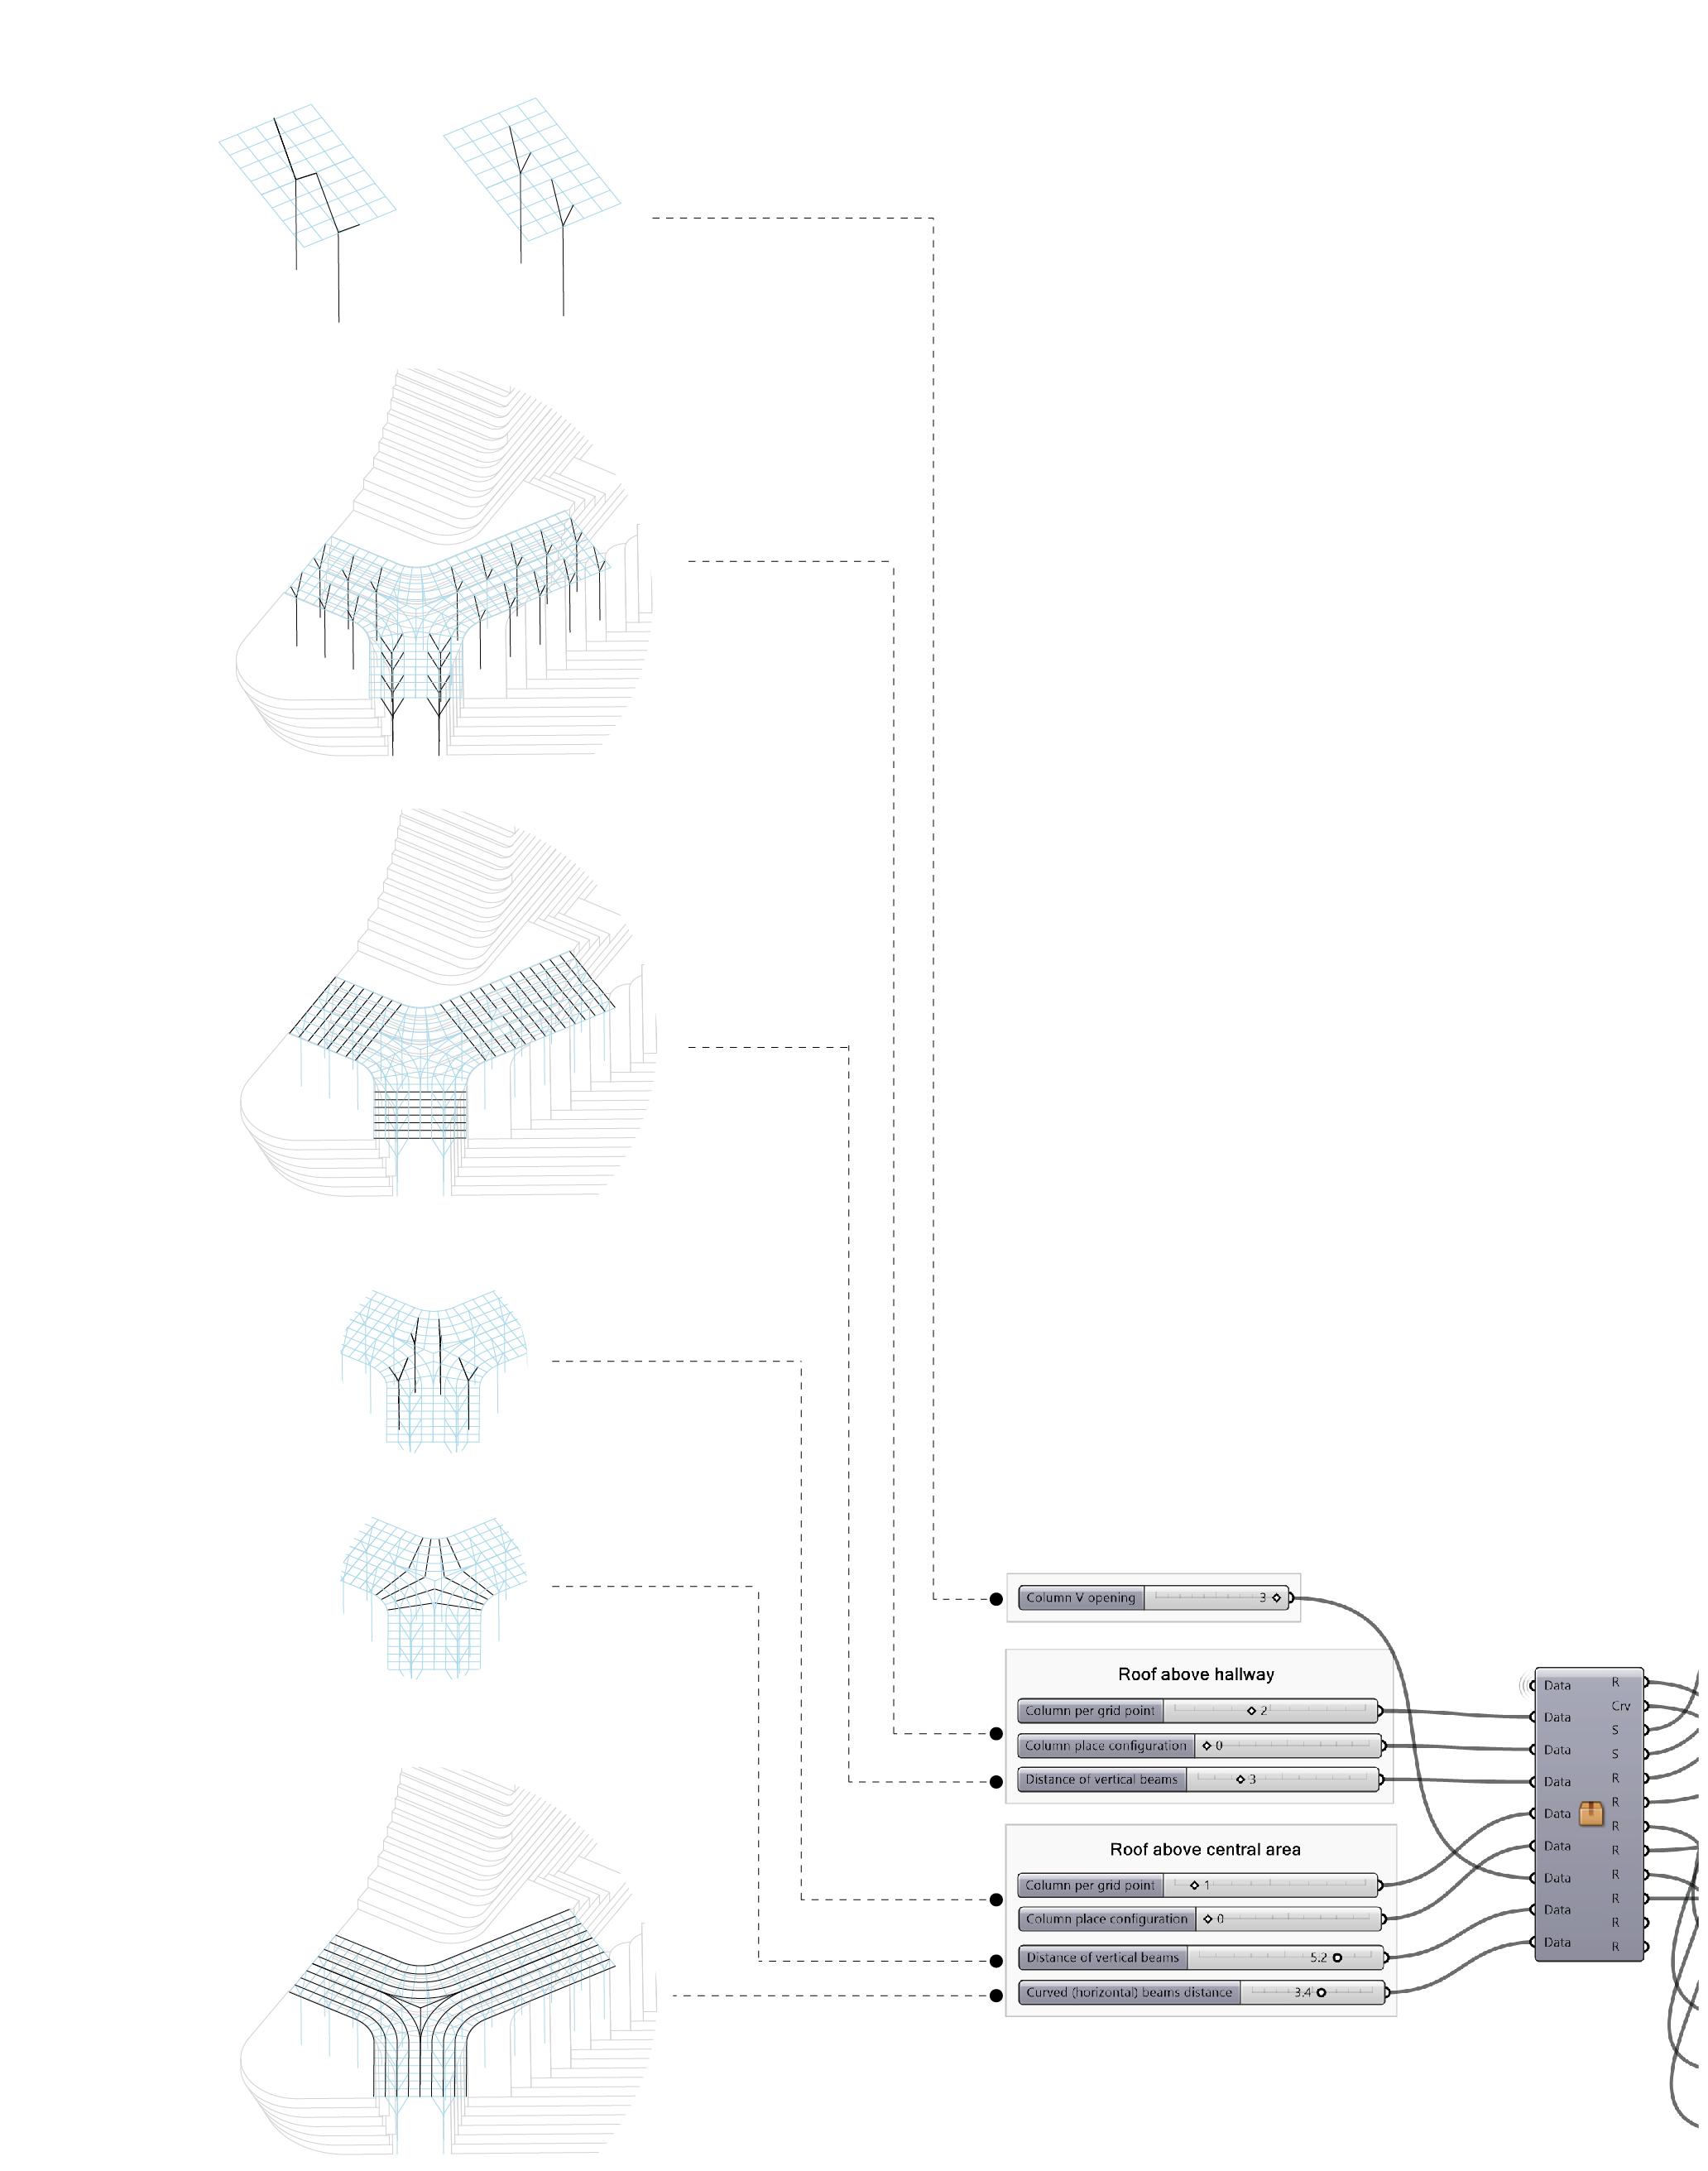
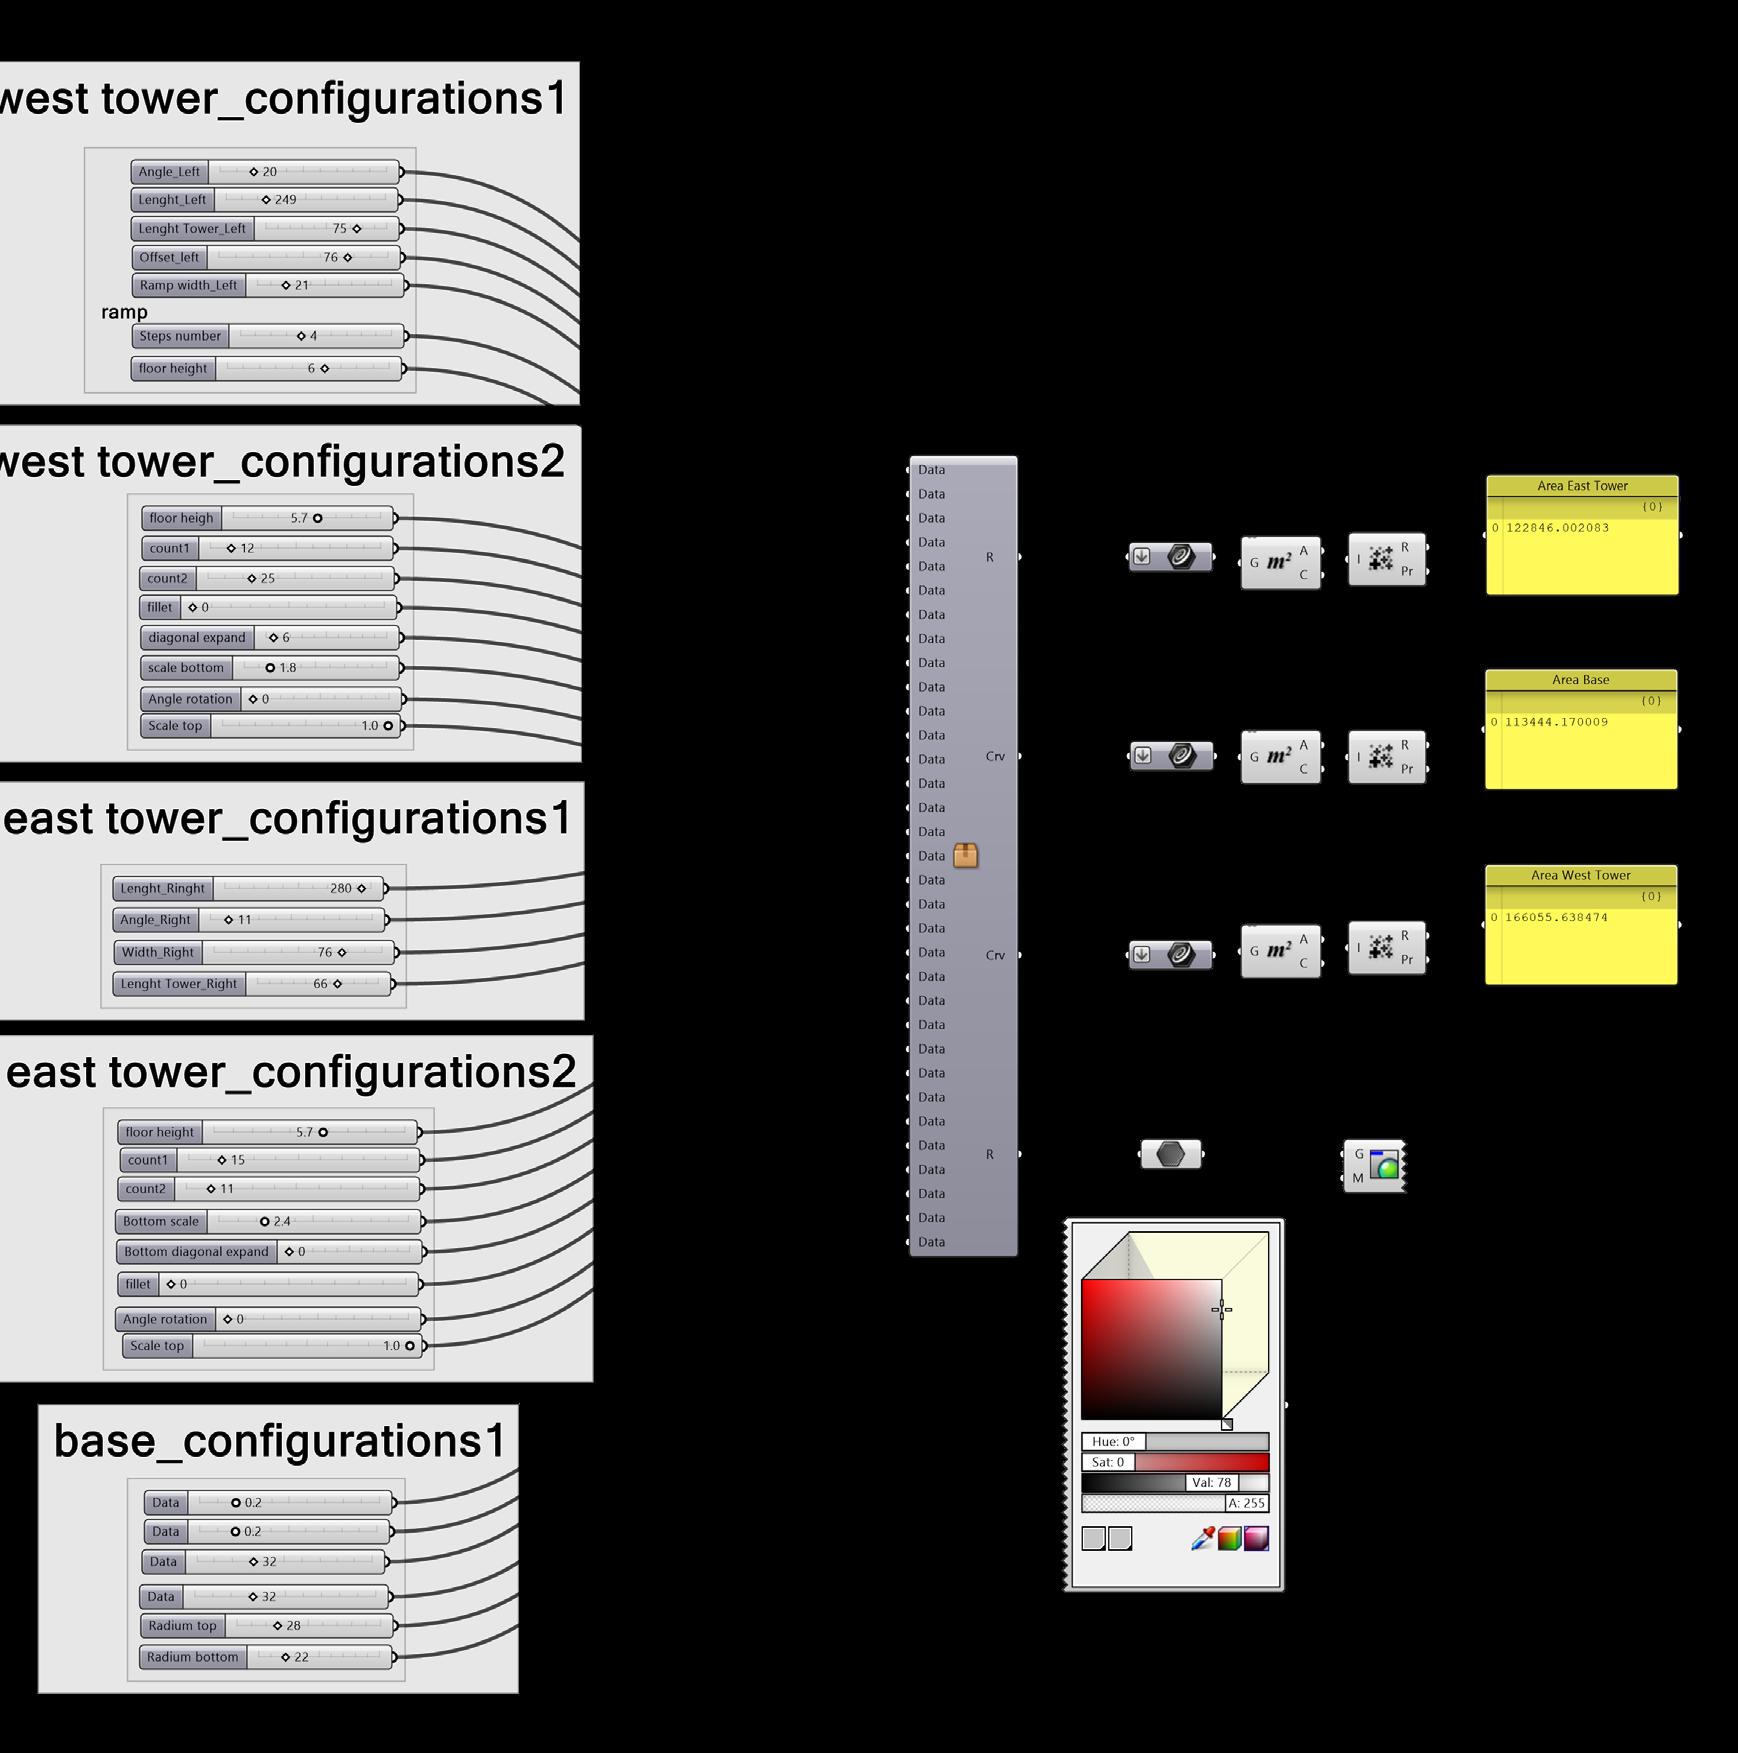
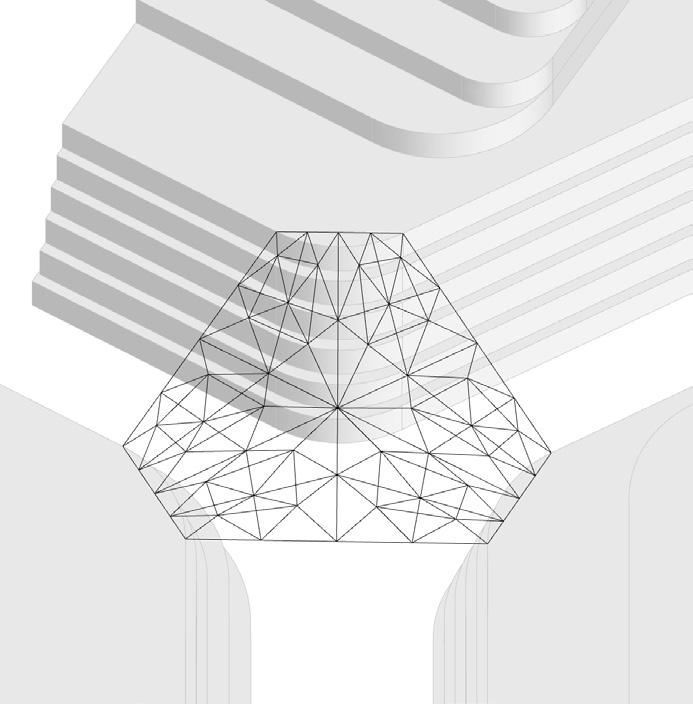
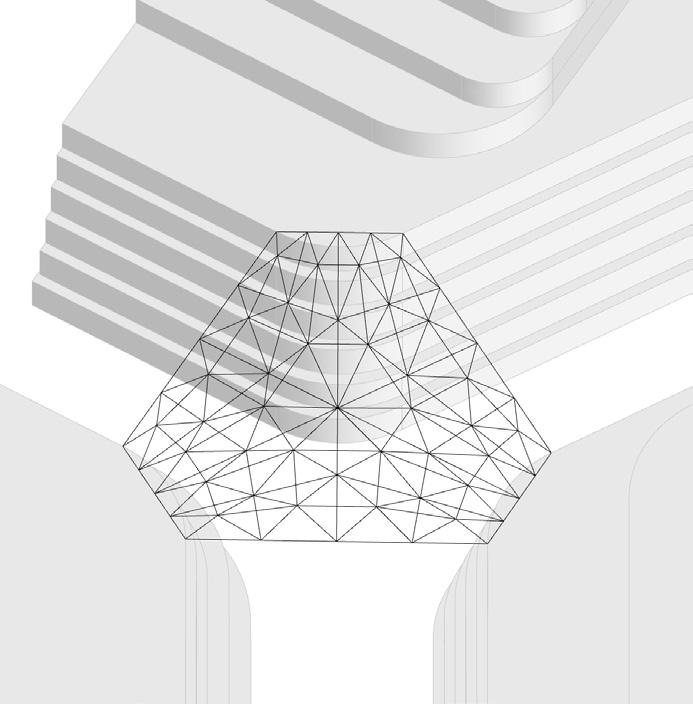
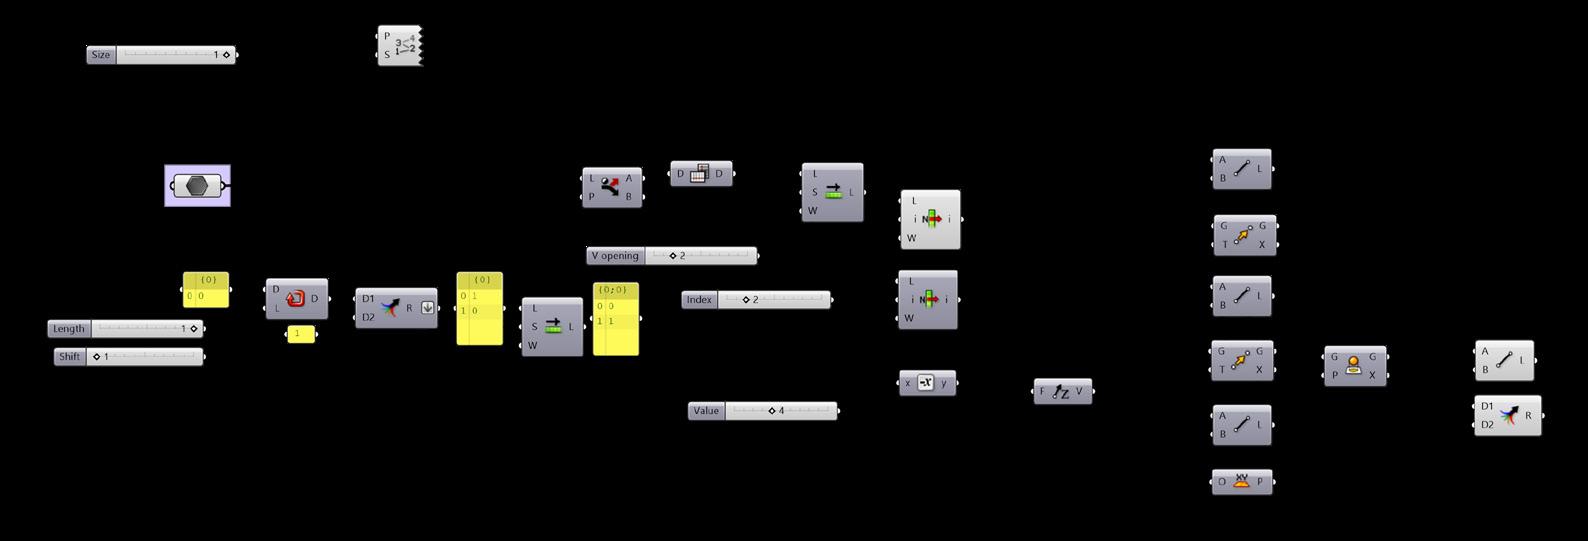
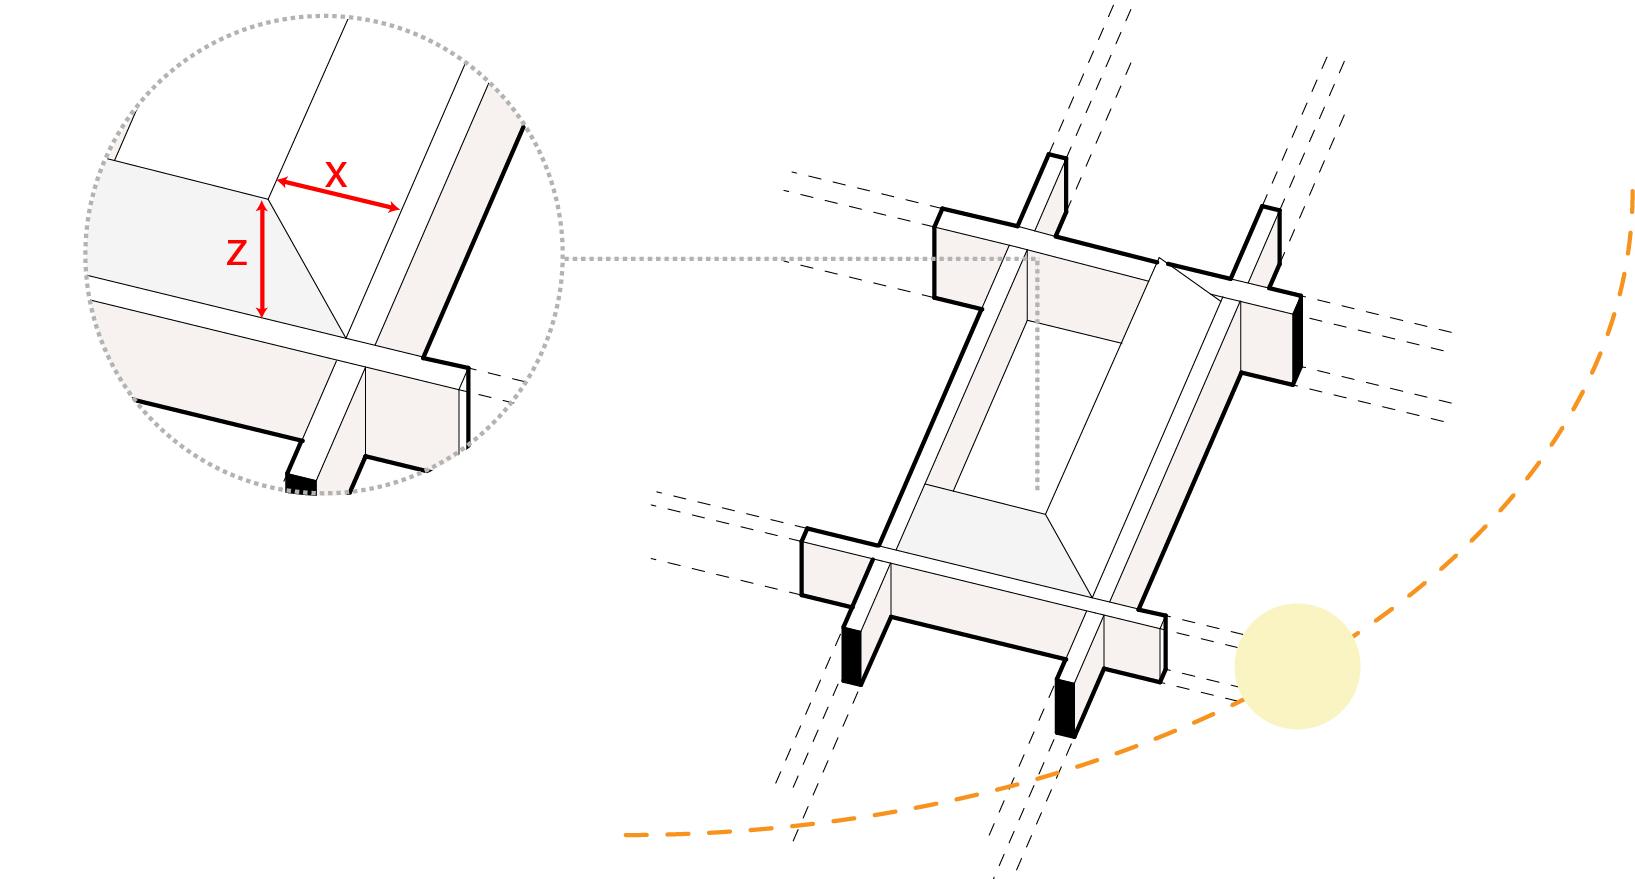
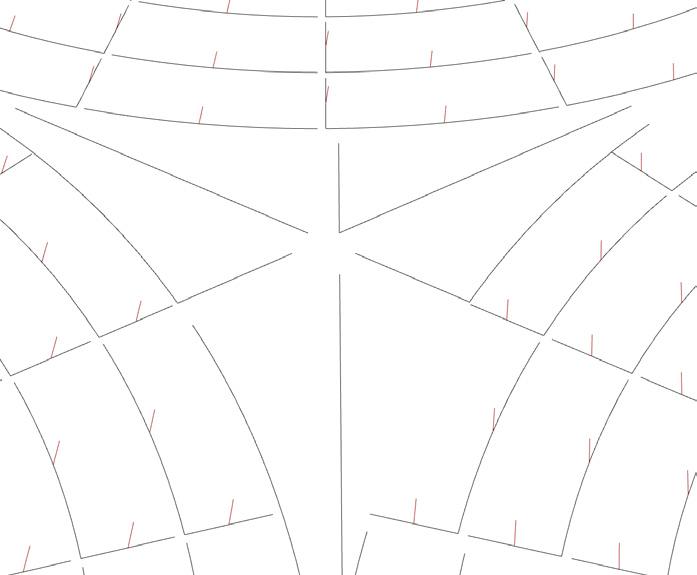
The definition that was built used curve references which were offseted. To test for structural performance the curves had to be spitted at the joint nodes. The resulting definition was complicated as it took into account various configurations and made sure that the end points of the beam curves were at the joint nodes. Therefore it was clusterred so that it could be easily used by the rest of the team members.
Two strategies followed inside the cluster are mentioned, as they are applied in many parts of the definition. The full definition can be found in APPENDIX COD-07B.
The curves were divided by lenght. Then the points were oined in a polyline which was exploded. The list of the points is flipped and then new polylines were created (flipped polylines ), which were also being exploded.
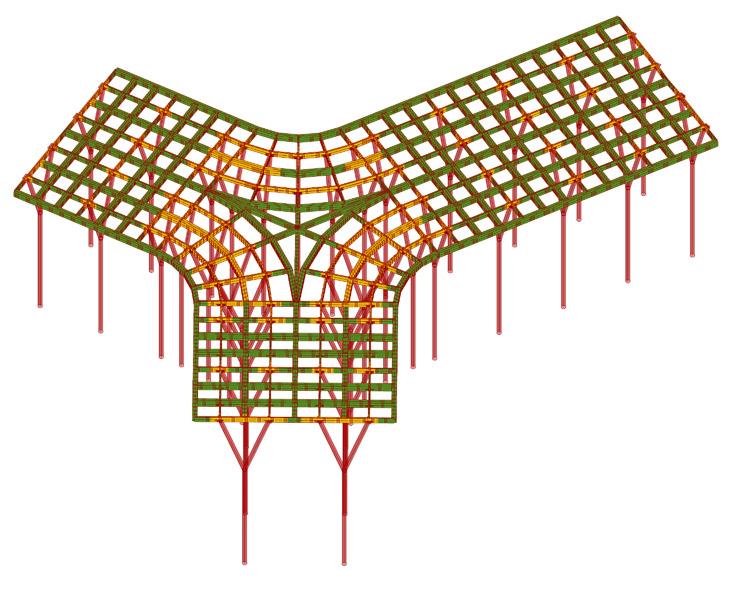
A list of “0” and “1” values was formed in the following patterns: {0,1} , {0,0,1} , {0,0,0,1}. These patterns were used to dispatch points that represented the centre of the columns. These lists could be shifted, resulting to other positions of the columns.
The same logic was being used to define the opening of the columns. The list of the points was shifted to the extremes of the list selecting, defining the endpoints of the V shaped columns.

 Figures 2.26
Density configurations
Figure 2.27
Column removal
Figure 2.28
Different position
Figure 2.29 V opening
Figure 2.25 Definition fragment ( the full definition can be found in the appendix)
Figure 2.24 Definition fragment (the full definition can be found in the appendix)
Chapter 4.2 Interdisciplinary and interactive parametric design
Figures 2.26
Density configurations
Figure 2.27
Column removal
Figure 2.28
Different position
Figure 2.29 V opening
Figure 2.25 Definition fragment ( the full definition can be found in the appendix)
Figure 2.24 Definition fragment (the full definition can be found in the appendix)
Chapter 4.2 Interdisciplinary and interactive parametric design
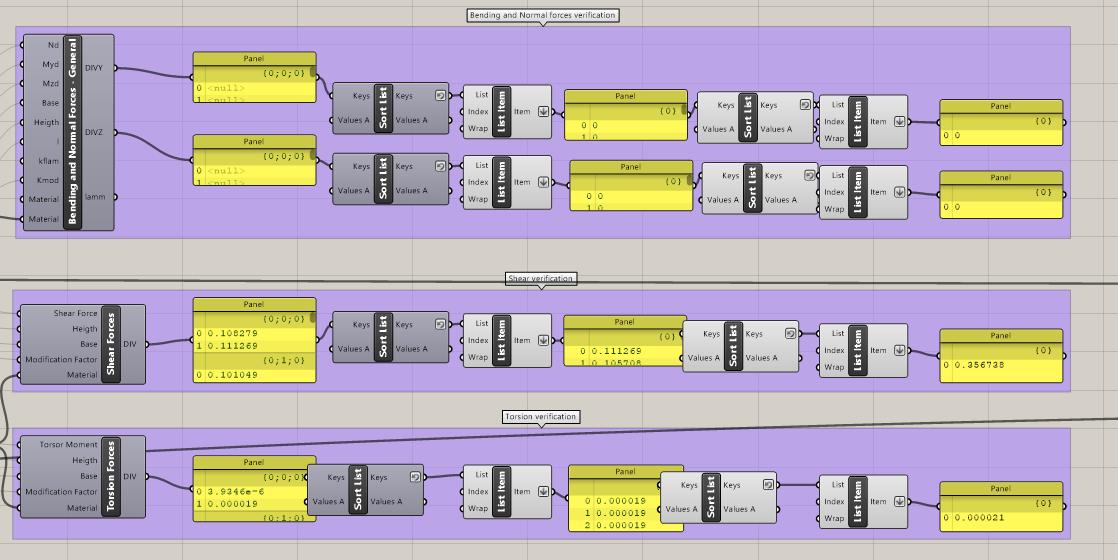
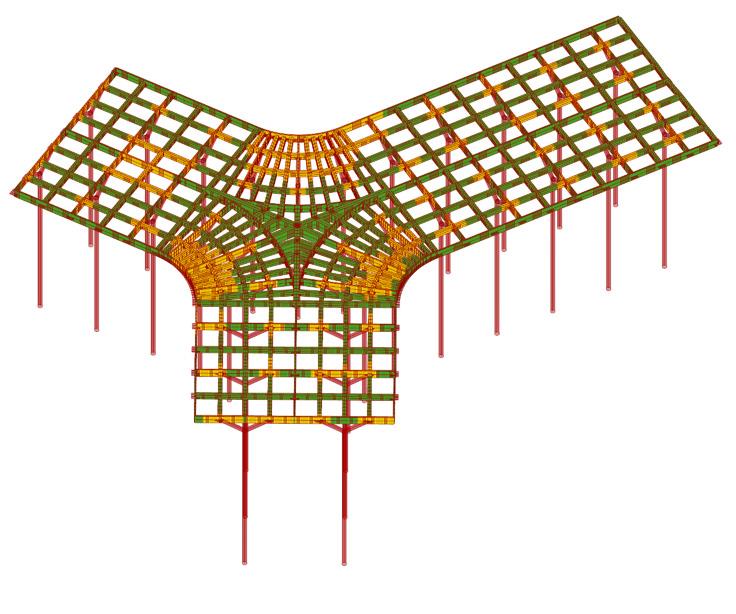
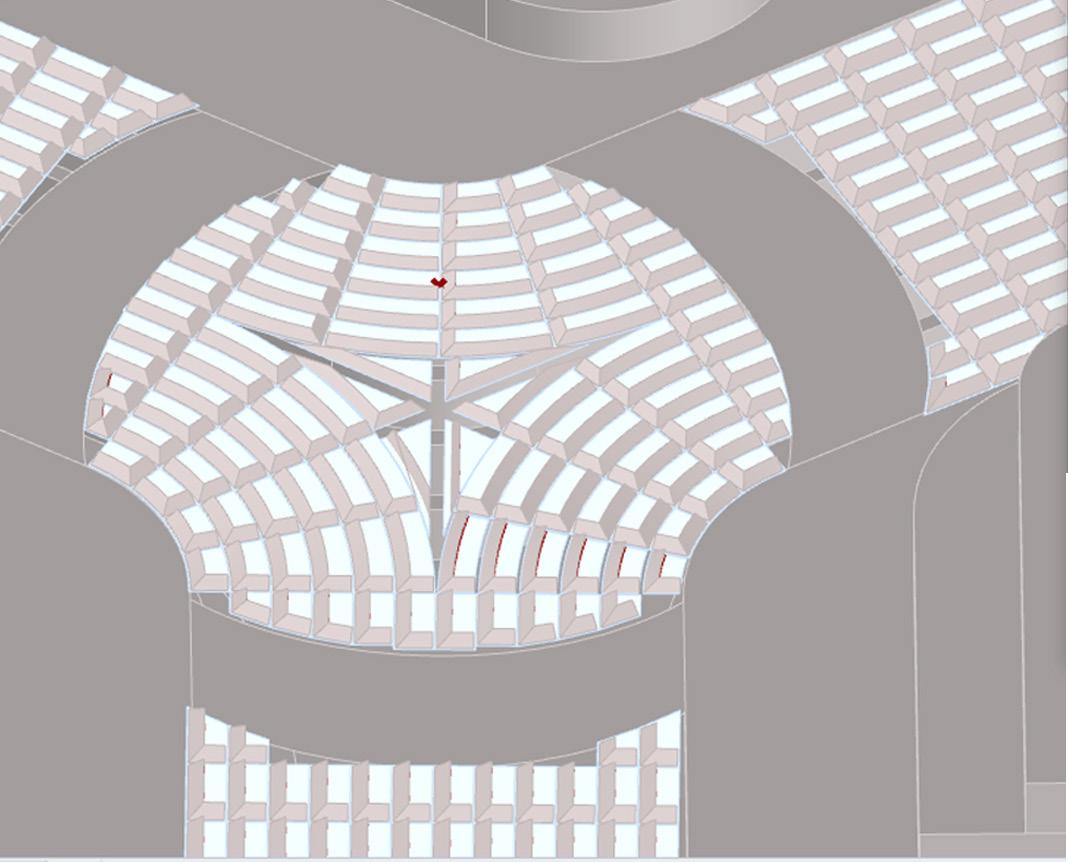
For aesthetic reasons as well as to highlight the building’s character, structural timber was chosen for the atrium’s roof. Timber however is an anisotropic material that requires further examination for failure.Timber beams were first optimized for serviceability limit state (SLS). Then after the SLS was checked the ultimate limit state (ULS) should be checked. This was operated via a grasshopper asset, the “Beaver”. Beaver correlates timber service class (3 in this project), characteristic actions for each load case and action types according to EN1995. In our timber structure we had 3 load cases: the structure’s own weight, the roof covers , mechanical installations(2,5kN/m2) and congregation of people (5kN/m2). Stresses due to 1) bending and normal forces, 2)Shear forces, 3) Torsion forces for the aboved mentioned load cases are divided with the stress limits. The result must remain bellow 1.
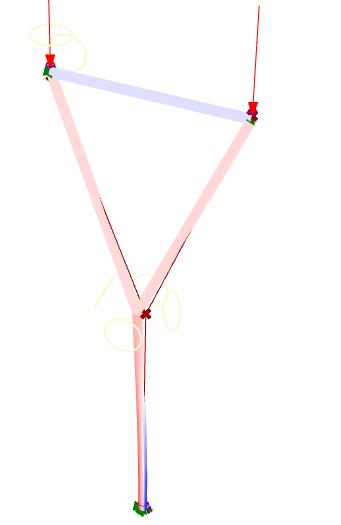
The resulted reaction forces to the column’s joints were provided to the structural designers who optimized the column and chose steel as the appropriate material .
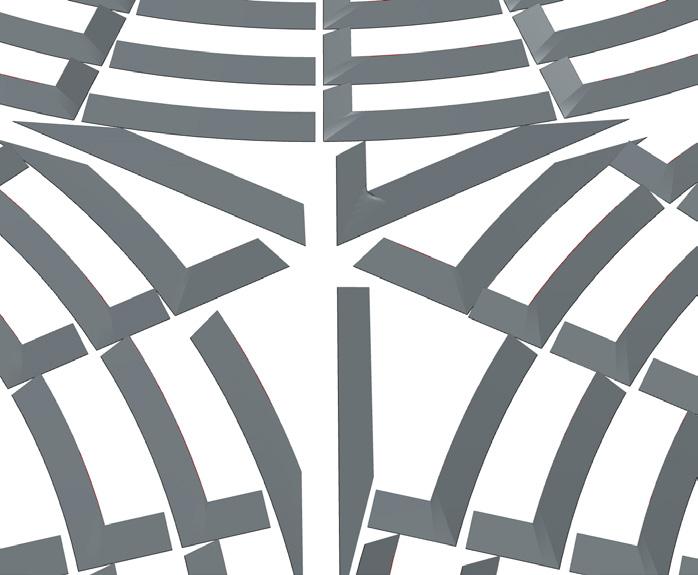
A shading system was proposed that would block the direct sunlights from the south and east direction during the warm months. This system should also allow diffuse light to enter and not block the view towards the towers.
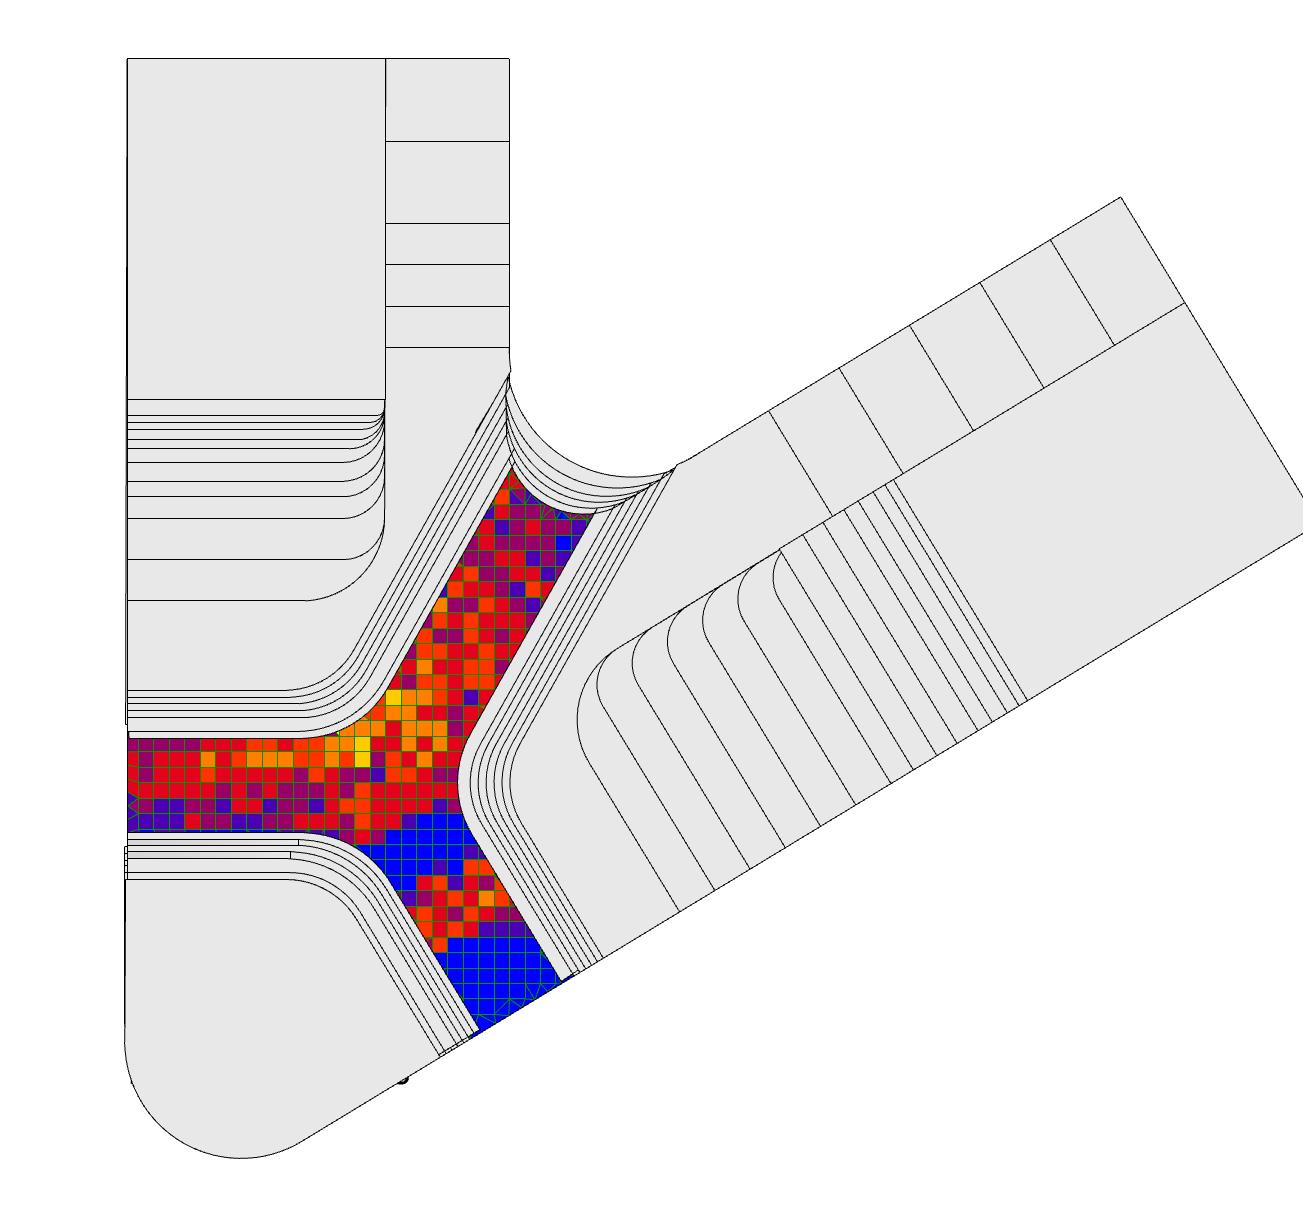
 Figure 2.33 Concept for the shading system of the roof
Figure 2.34 Mean direct sun hours for month of June simulated with ladybug tools. The simulation uses as context the overall building and the timber beams.
Chapter 4.2 Interdisciplinary and interactive parametric design
Figure 2.33 Concept for the shading system of the roof
Figure 2.34 Mean direct sun hours for month of June simulated with ladybug tools. The simulation uses as context the overall building and the timber beams.
Chapter 4.2 Interdisciplinary and interactive parametric design
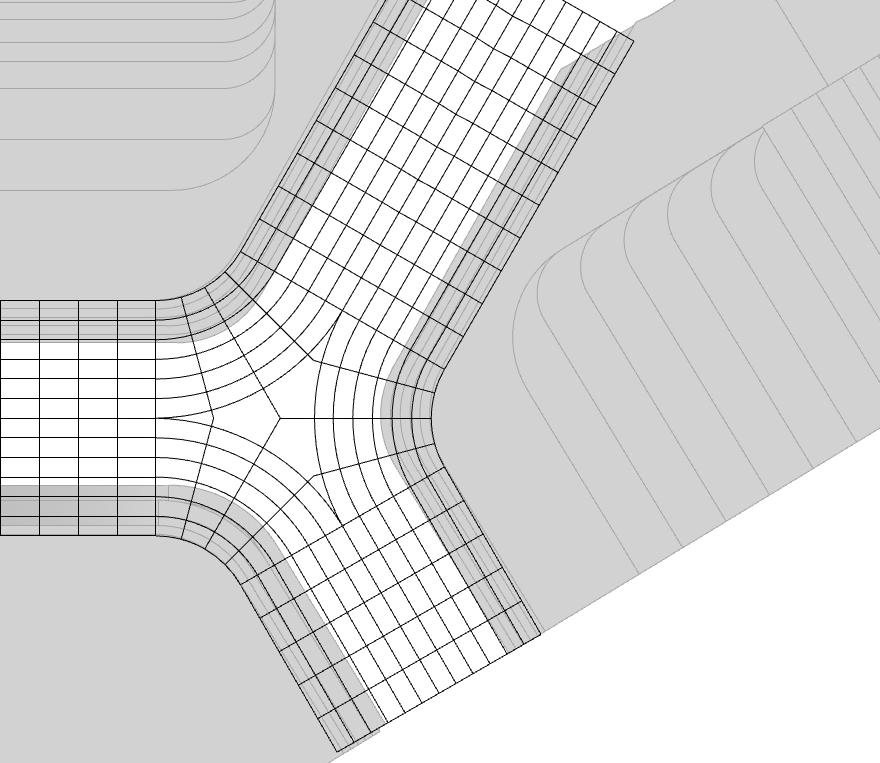
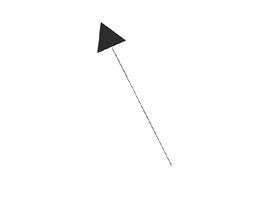
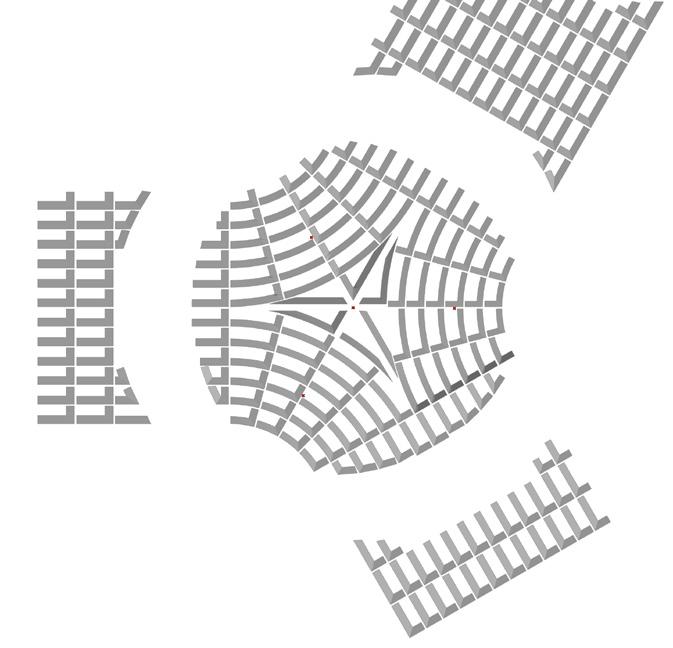
The definition is being built on subsurfaces that represented the boundaries of the structure’s grid. First the sides that would block the south and east solar penetration should be defined. For that the vector of north’s direction is needed.
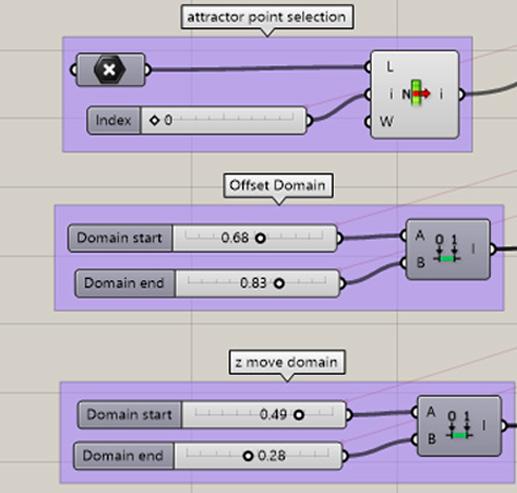
The vector of the north is drawn in the middlepoint of each side curve. If the vector falls inside the surface then the curve is being used to form a shader.
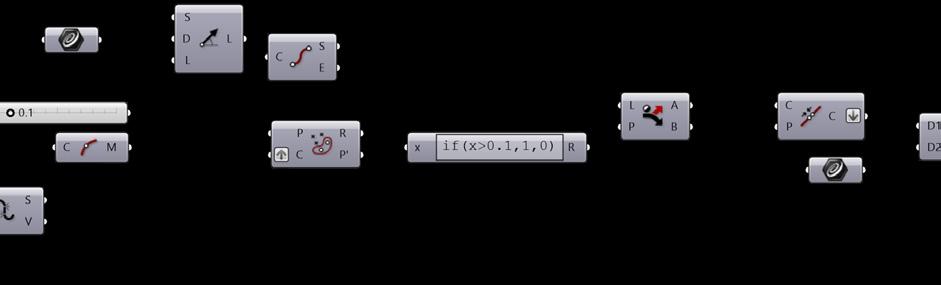
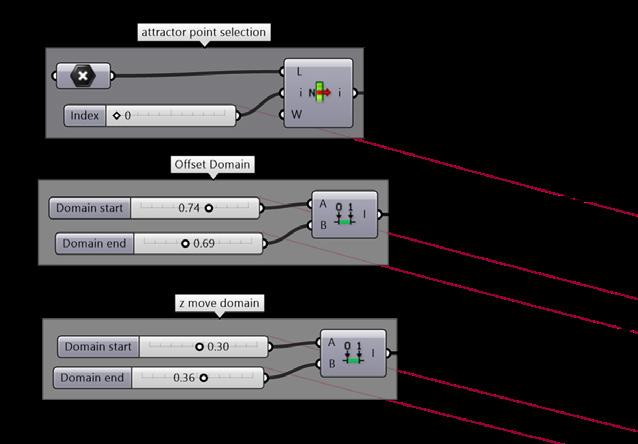
A domain for offsetting the curve and move it in the z axis is defined. A point attractor is also used to define a range of values for both domains. Τhe importance of the point attractor will be explained in section b8.

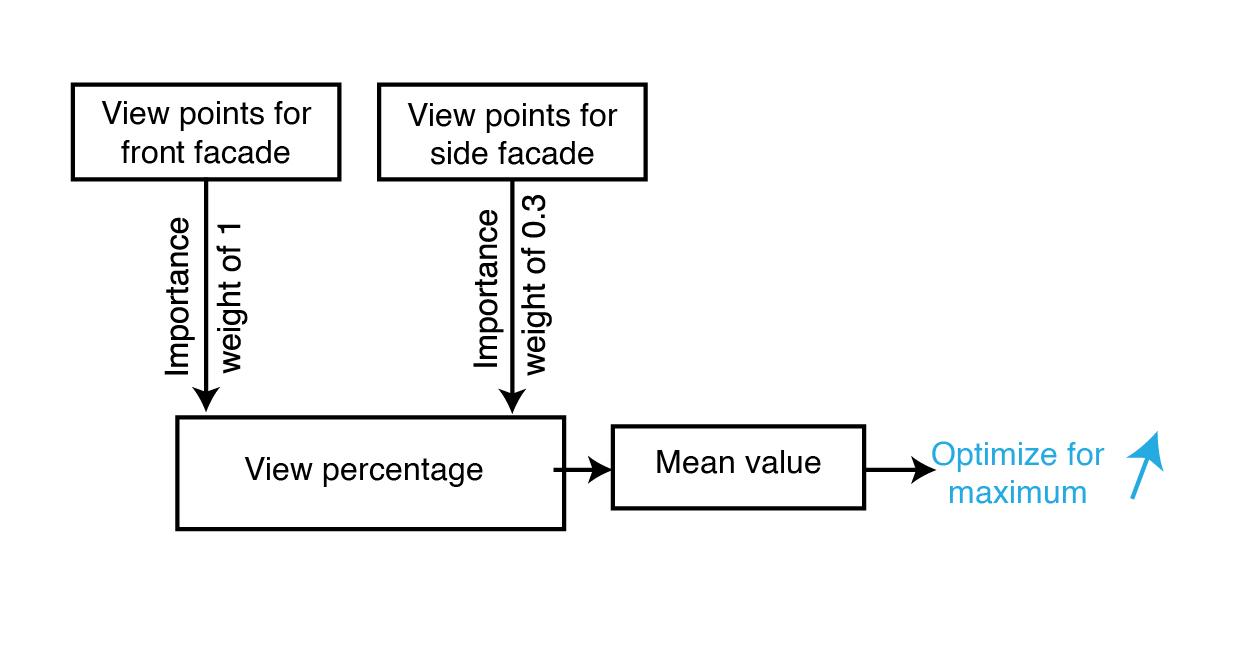
The shading system of the atrium was designed so as to block direct sunlight during warm months and allow diffuse light. Its design should not also block the visibility of the two towers. Before finalizing the design the visibility percentage is first s imulated.
Points were populated in the facade of the towers. Front facade points are assigned a weight importance of 1 and side facade points a weight importance of 0.3.
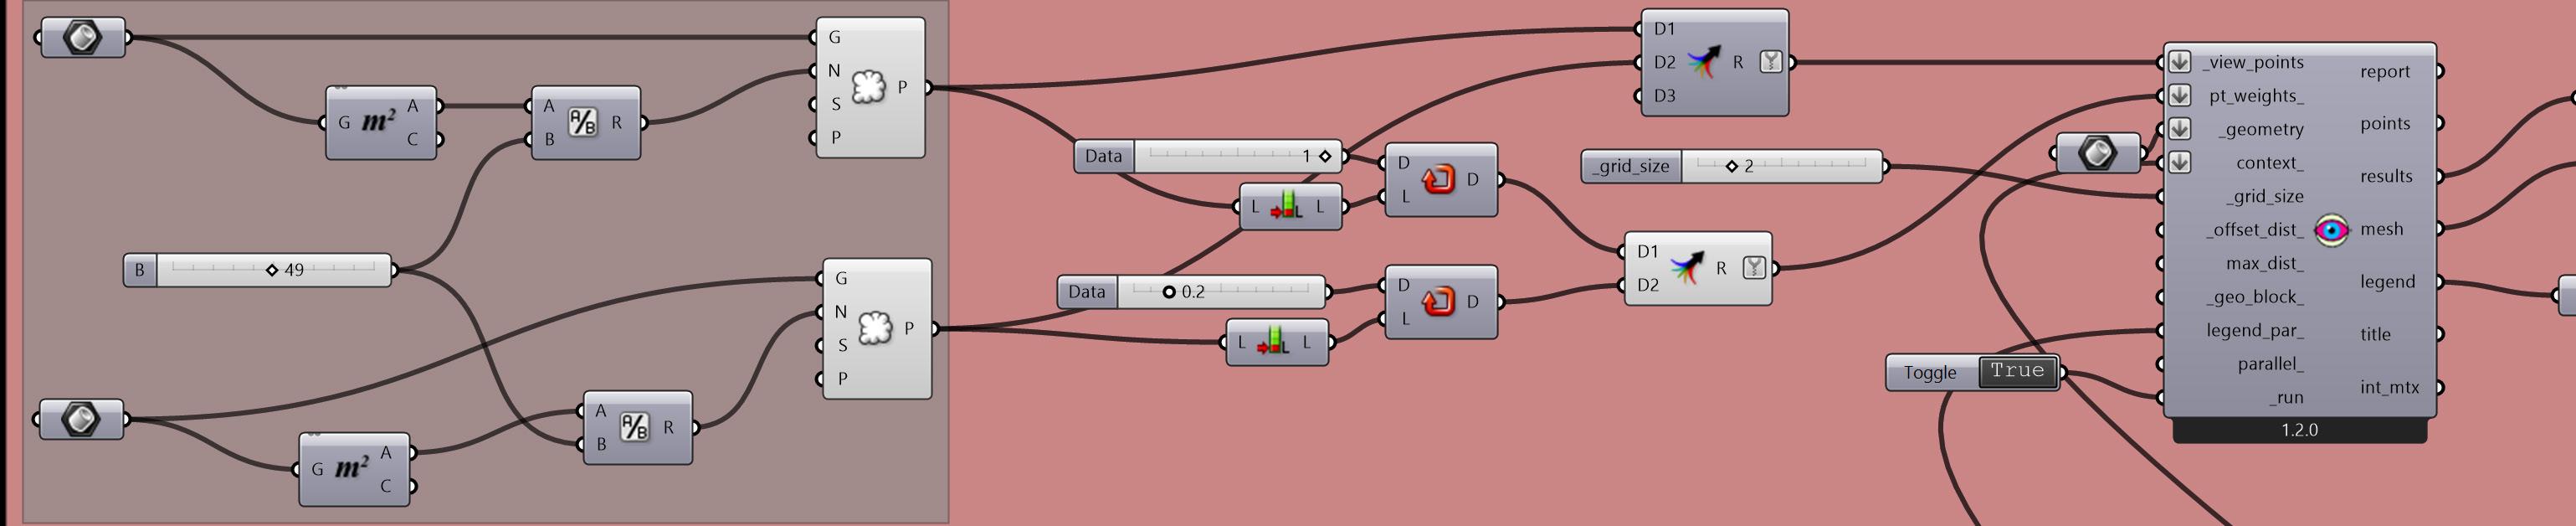
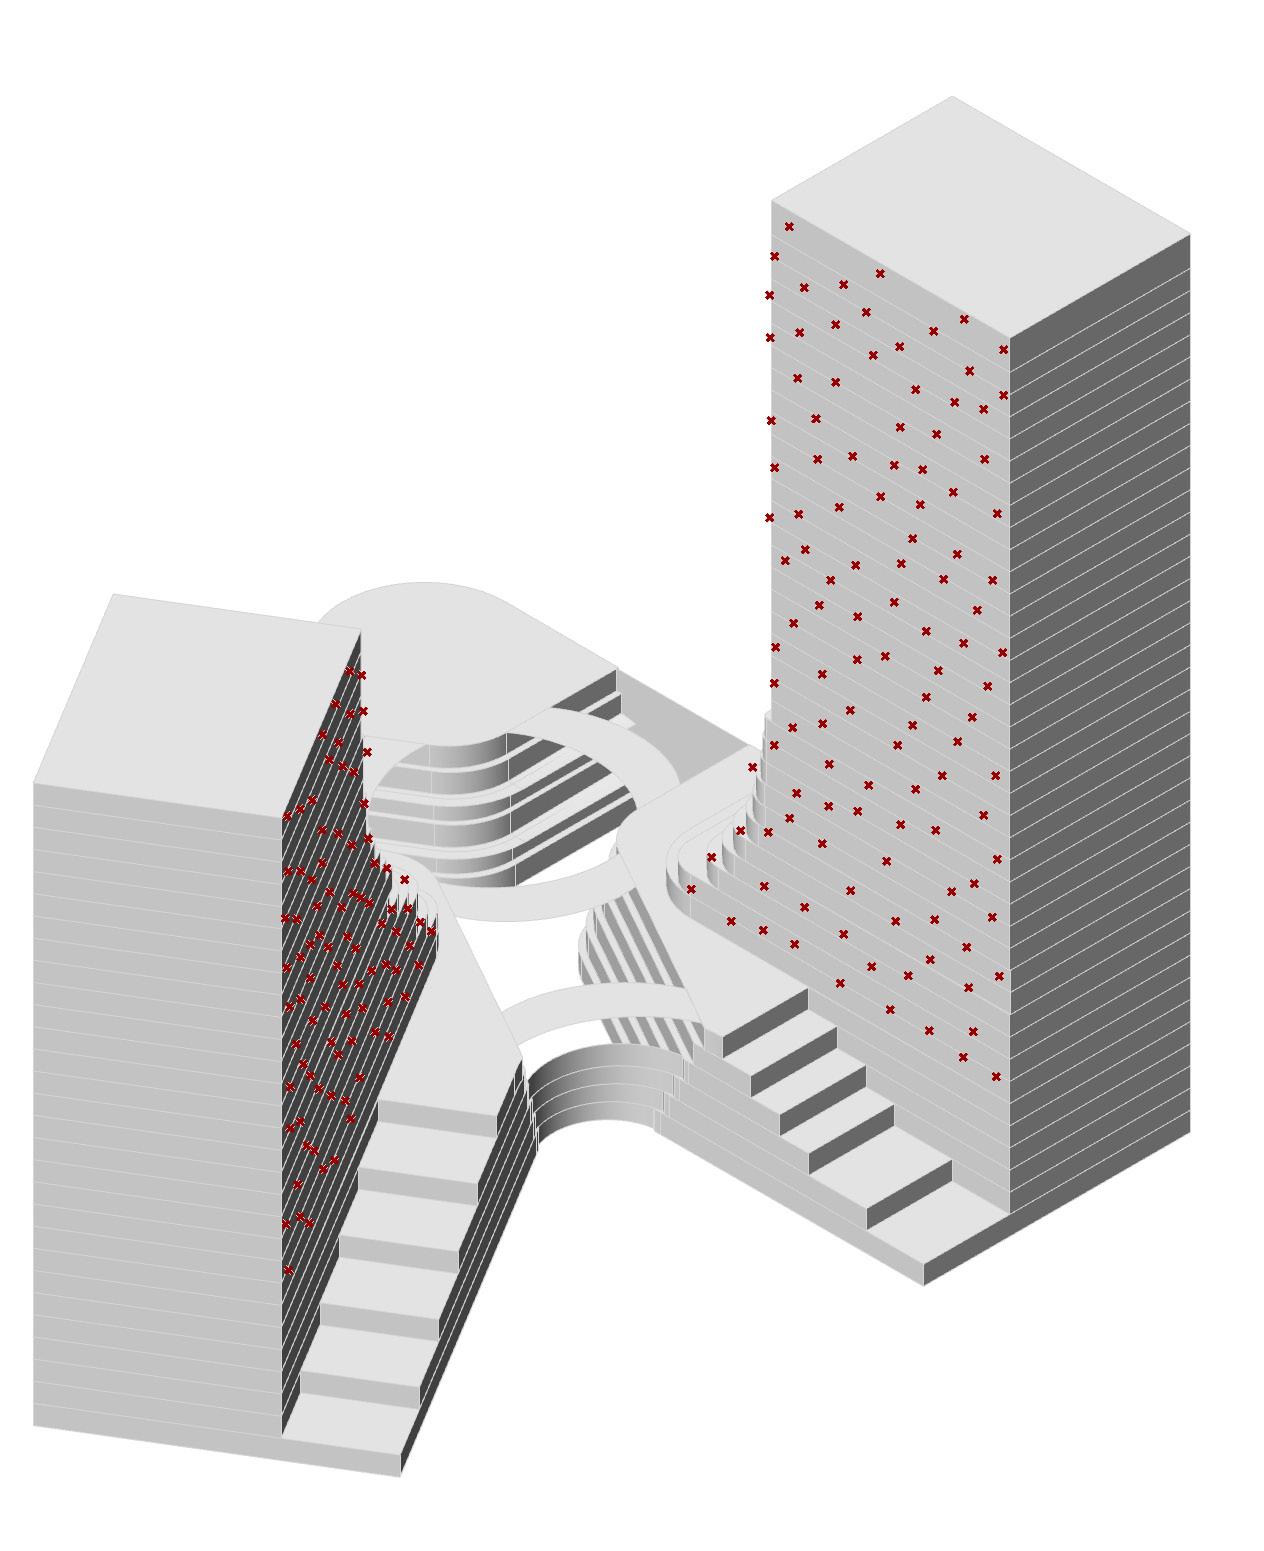
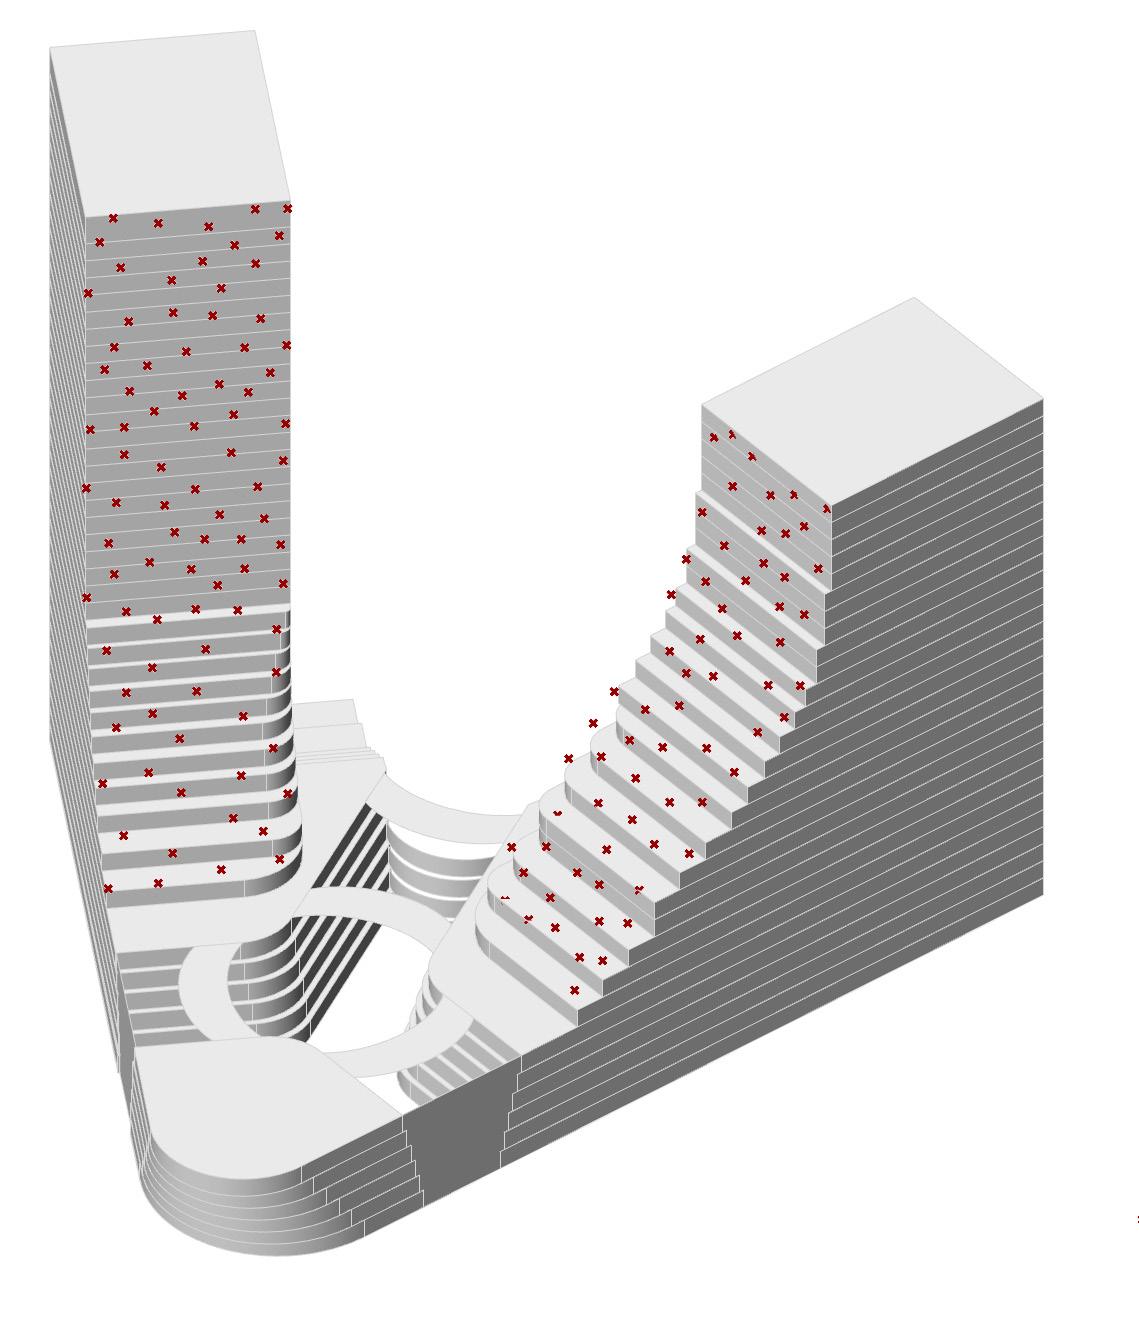 Figure 2.42 Points with weight importance of 0.3
Figure 2.43 Points with weight importance of 1
Figure 2.41 Diagram for the generation of the visibility points and their weight oof importance.
Figure 2.40 Ladybug visibility analysis (the full definition can be found in the APPENDIX COD-9)
Chapter 4.2 Interdisciplinary and interactive parametric design
Figure 2.42 Points with weight importance of 0.3
Figure 2.43 Points with weight importance of 1
Figure 2.41 Diagram for the generation of the visibility points and their weight oof importance.
Figure 2.40 Ladybug visibility analysis (the full definition can be found in the APPENDIX COD-9)
Chapter 4.2 Interdisciplinary and interactive parametric design
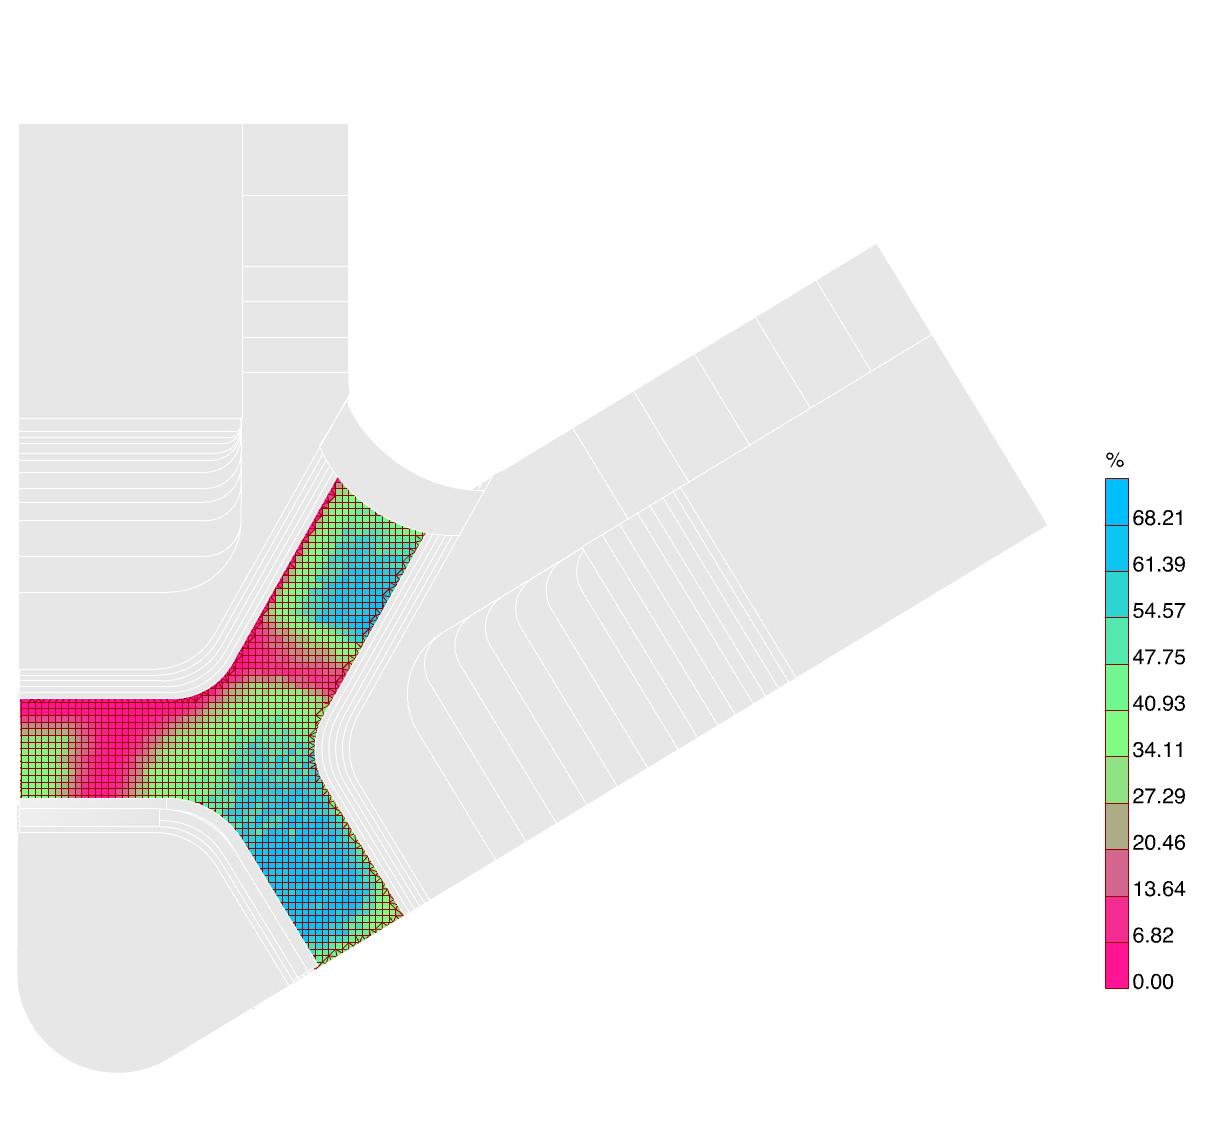
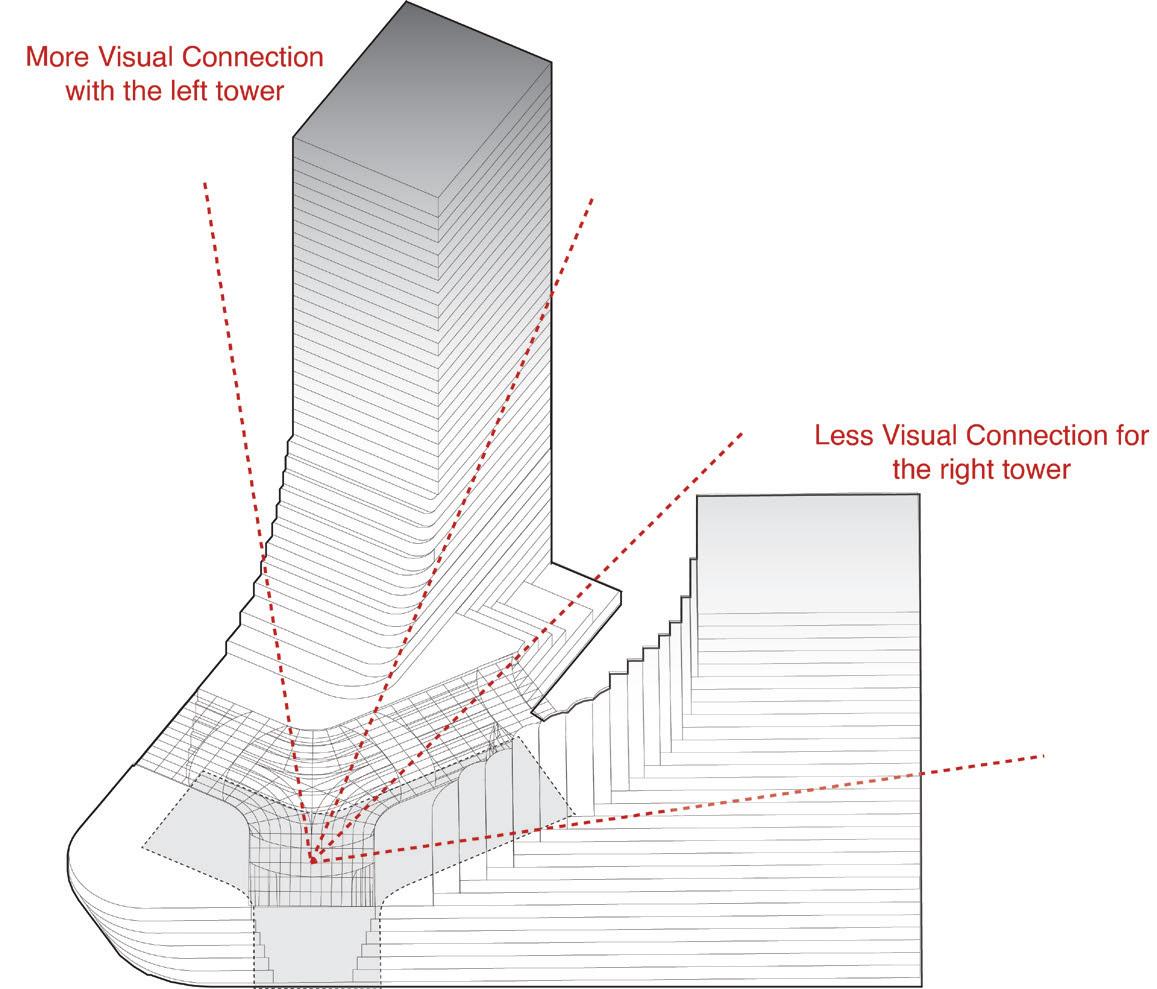
Assumed that there is no shading system in the atrium, it is clear that the west tower is more visible from the atrium’s open space than the east tower.
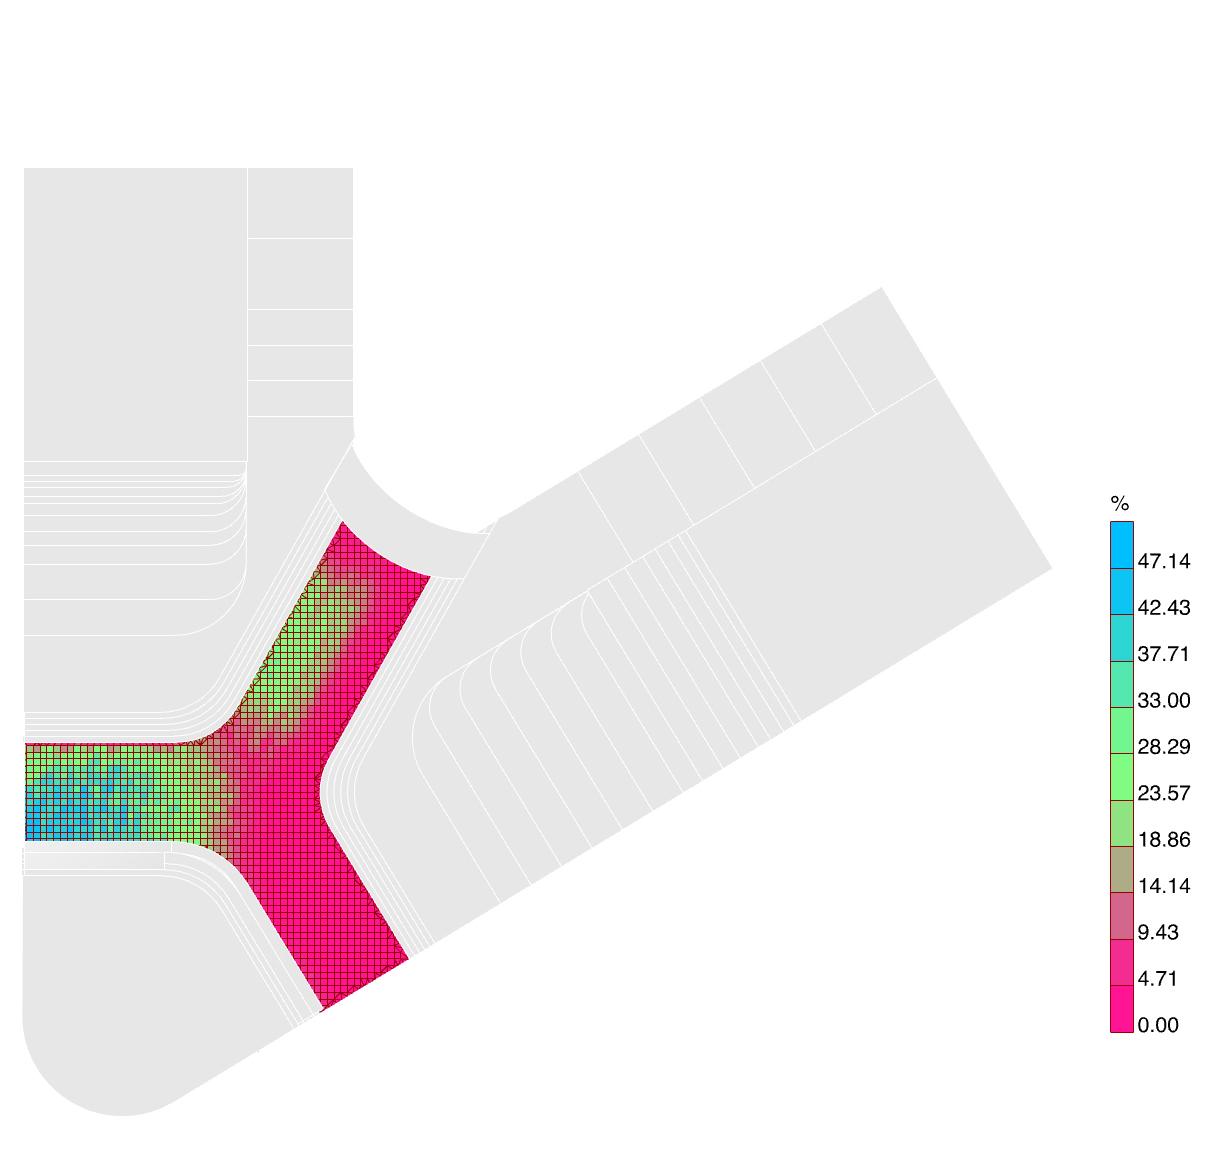
The impact of the transparency in roof areas needs to be analyzed to achive the desired visibility results
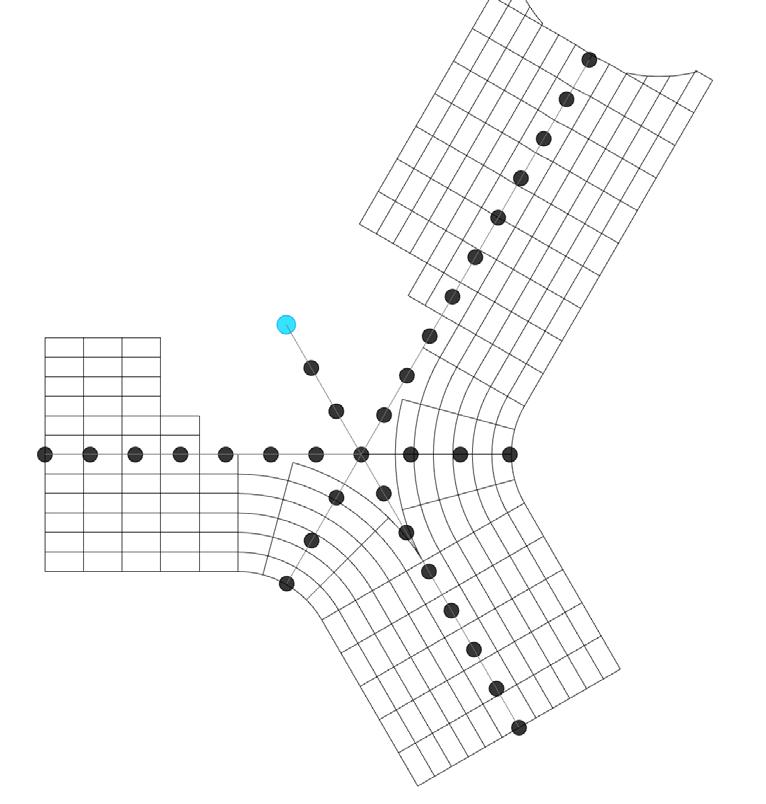
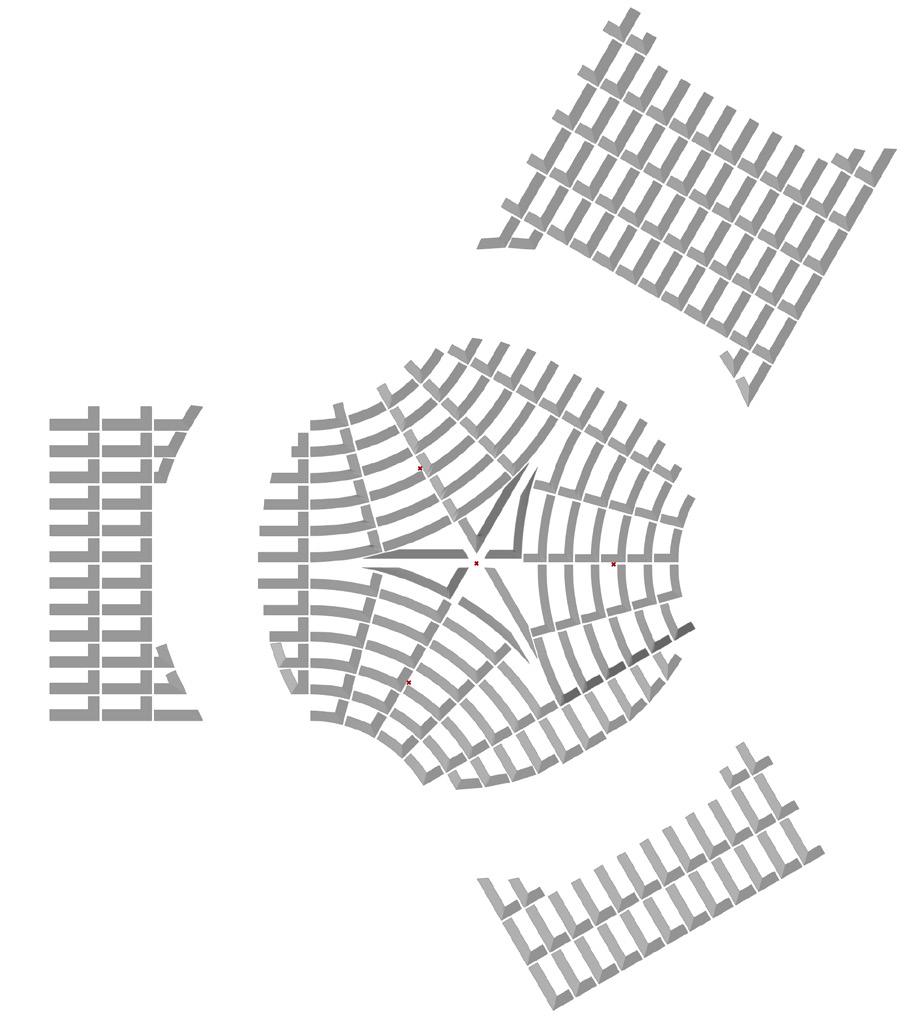
To define the visibility impact of the roof the visibility simulation was perfomed by substracting the subsurfaces according to their distance from an an attractor point.
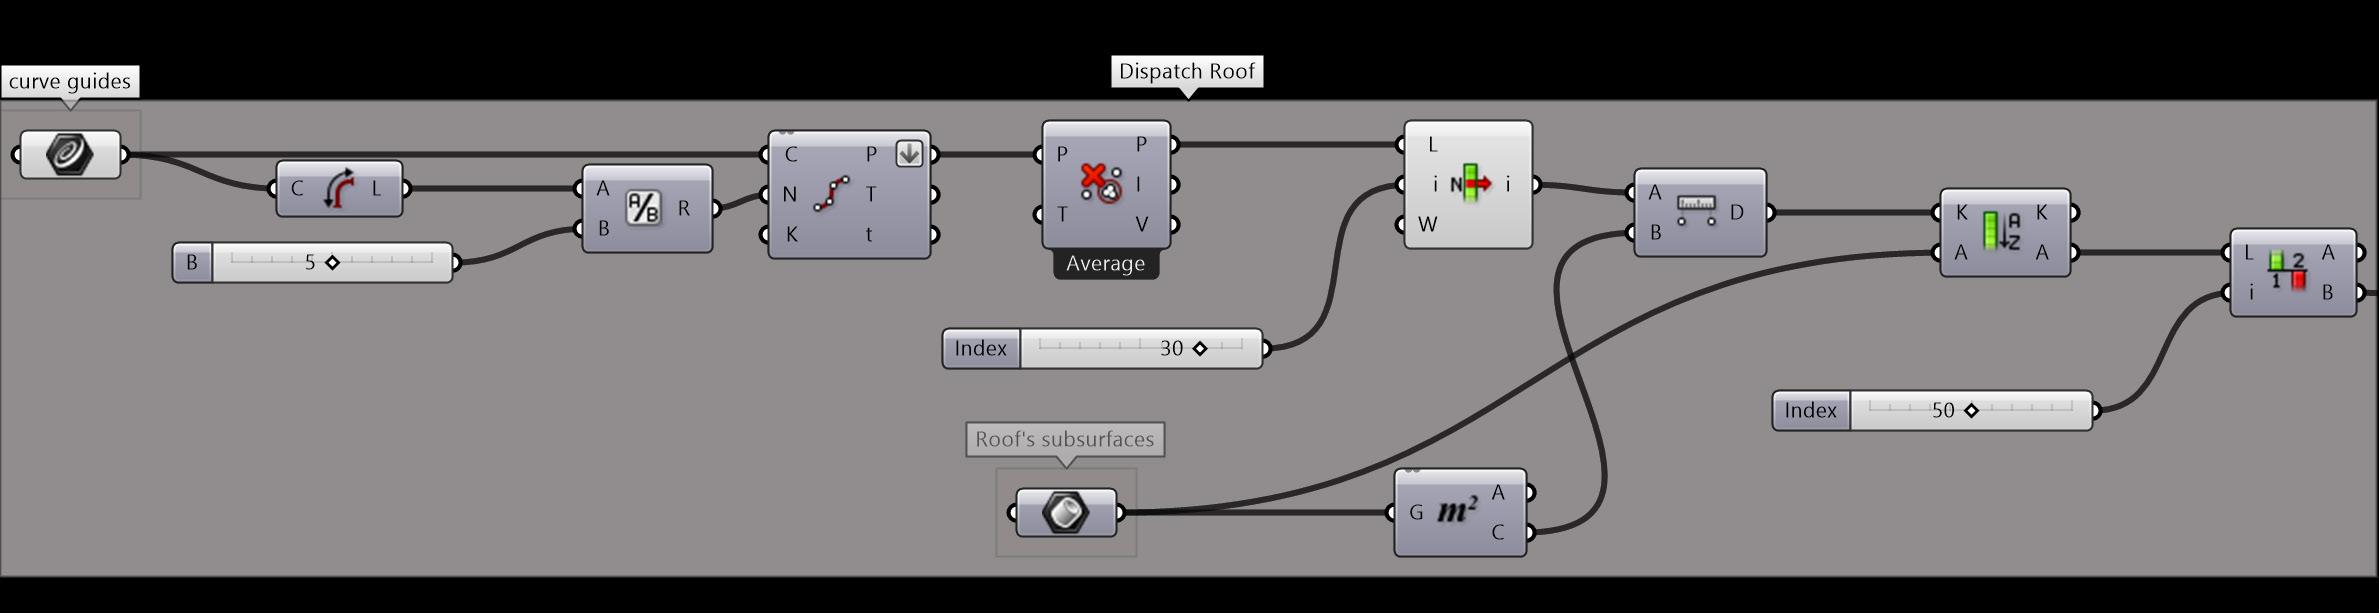
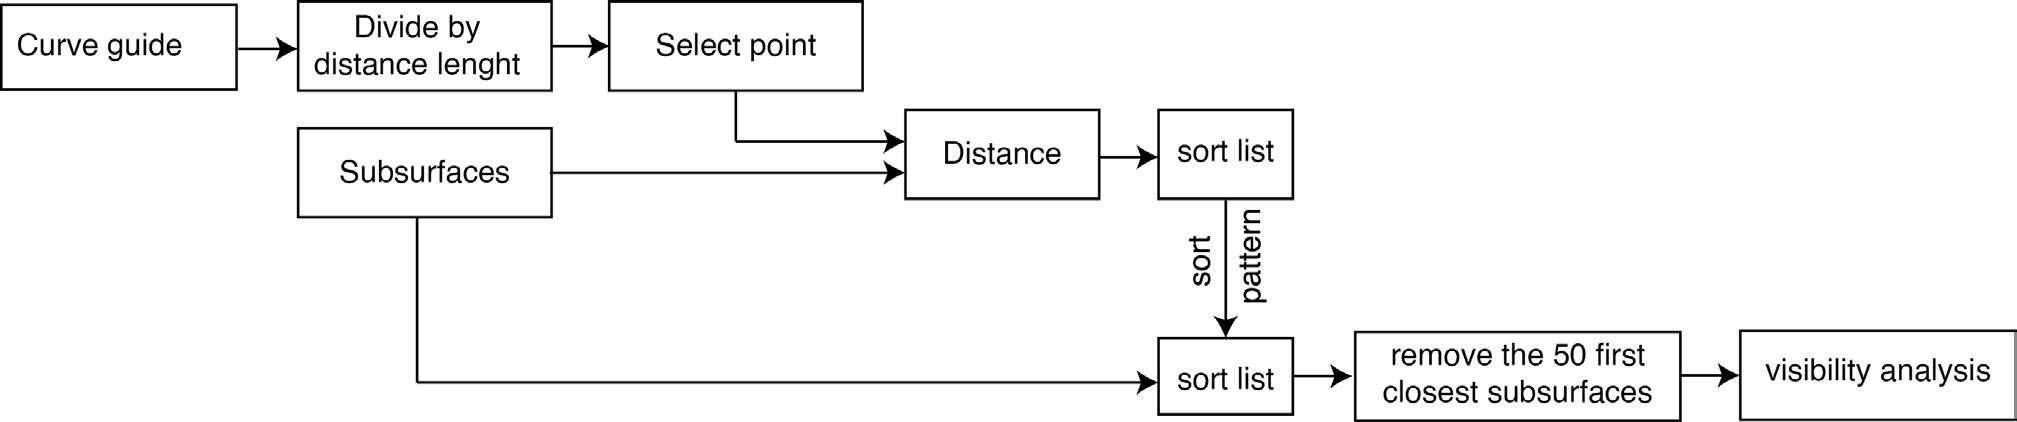
The following diagrams present the visibility results to both towers after removing the subsurfaces of the roof.
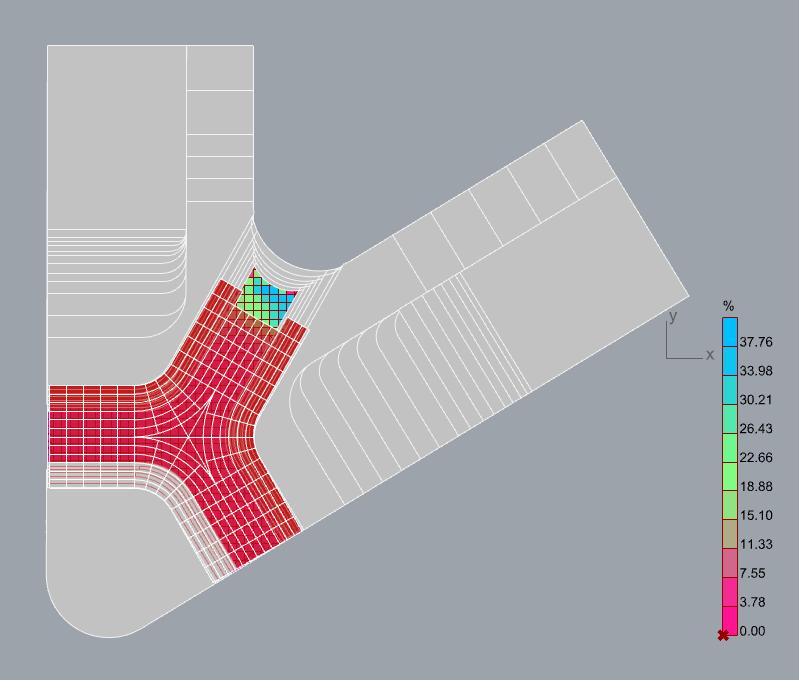
 Figure 2.48 Diagram for substracting the 50 closest subsurfaces to an attractor point
Figure 2.47 Definition’s part for substracting subsurfaces (APPENDIX COD-08)
1.
2.
Chapter 4.2 Interdisciplinary and interactive parametric design
Figure 2.48 Diagram for substracting the 50 closest subsurfaces to an attractor point
Figure 2.47 Definition’s part for substracting subsurfaces (APPENDIX COD-08)
1.
2.
Chapter 4.2 Interdisciplinary and interactive parametric design


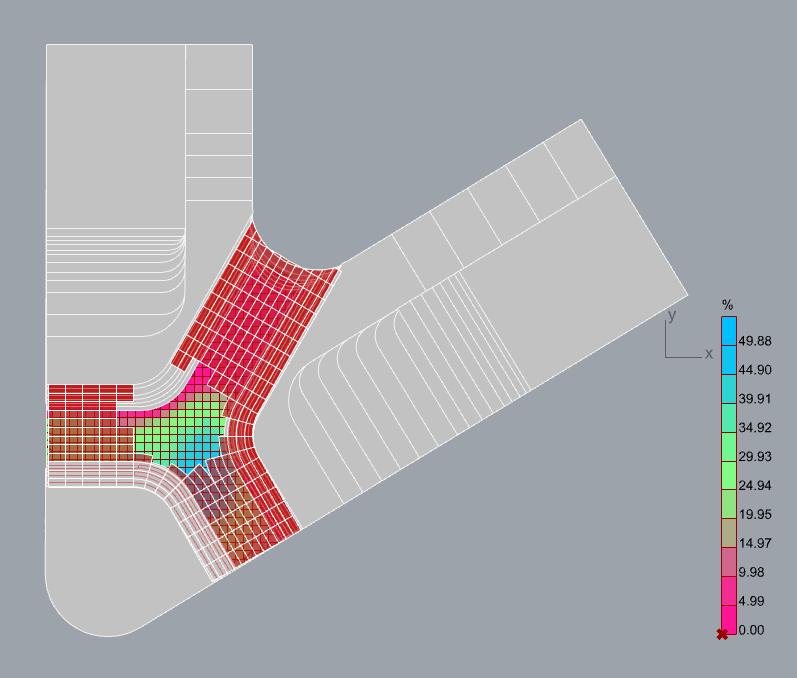
Central - west substrafaces, when substructed, result in higher visibility results. Therefore it is concluded that centre-west orientated subsurfaces have also a different visibility impact (49% highest visbility percentage, 17% average visbility percentage). This conclusion was also apparent throught the 3d model.
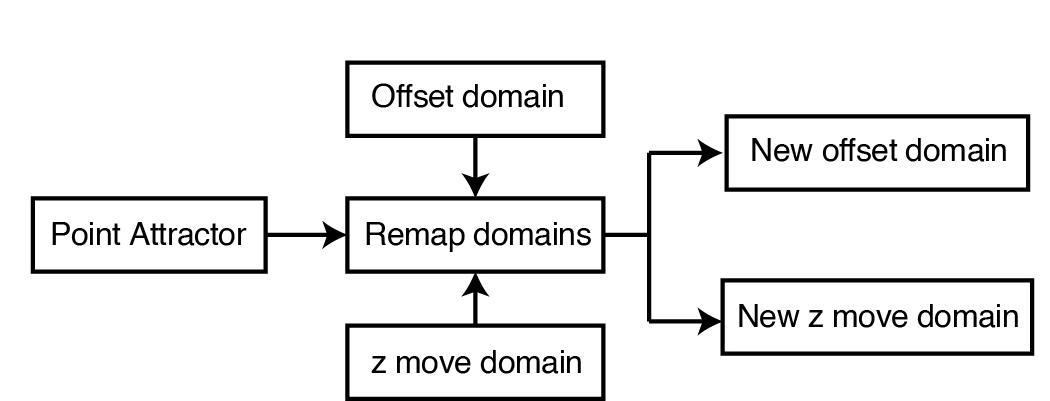
As an additional parameter to the shader’s offset and extrution domain, central placed attractors were added the considered during the optimization (A PPENDIX COD-09).
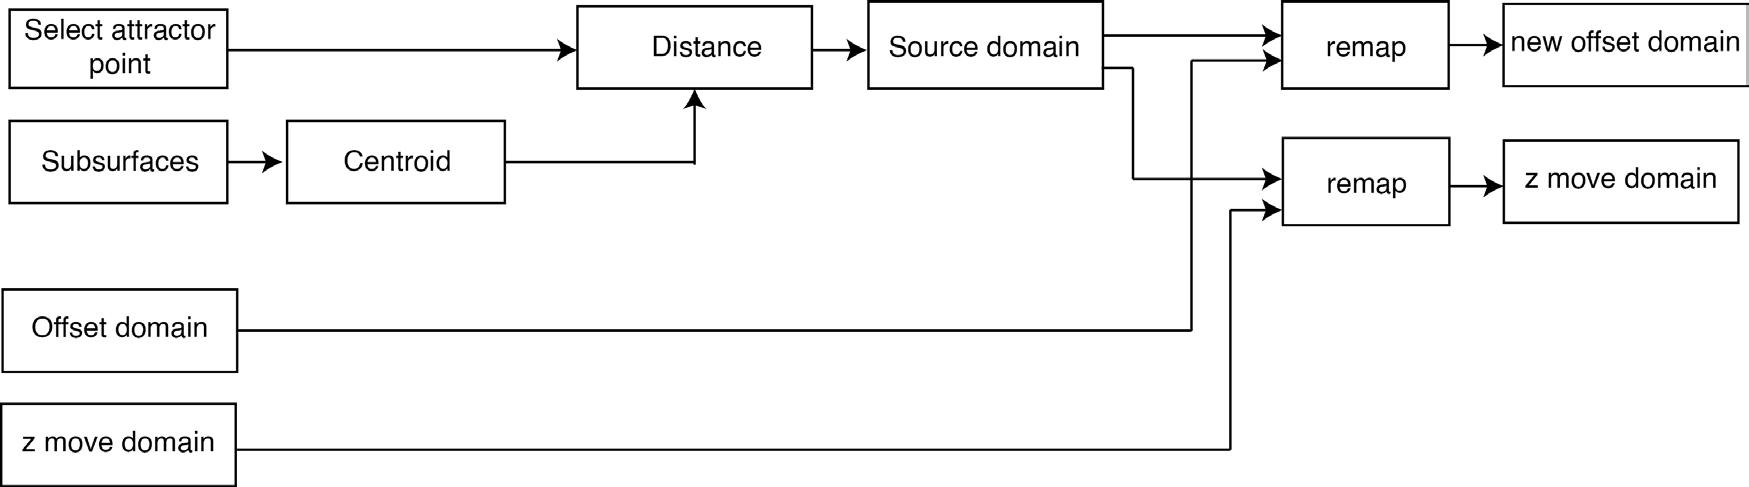
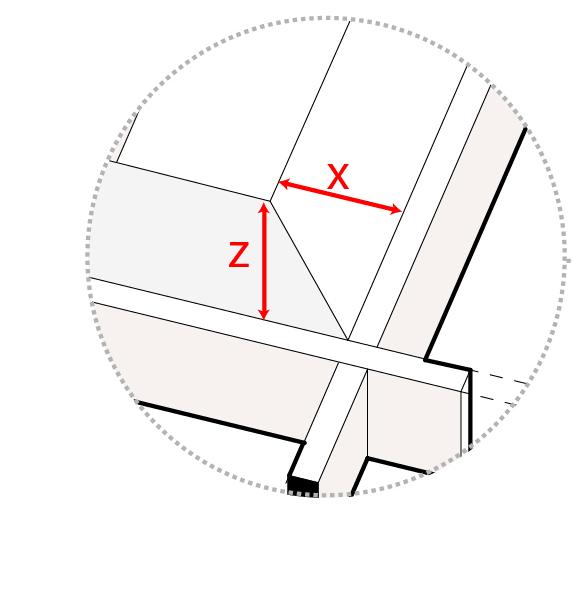
offset domain vertical move
Figure 2.49 Subsurfaces with the highest visibility impact Figure 2.50 Attractor points used for the domains of extrusion and offset of the shaders Figure 2.51 Explanatory diagram for remapping the offset and vertical move domains Chapter 4.2 Interdisciplinary and interactive parametric designParametric design aimed to ease the form finding process and to refine the building’s volume. There were a couple of form finding definitions that were provided to the team members to experiment with the volume of the building. Also a lot of computational design was operated by facade designers. Here, the computational designer assisted only in providing consultation.
A large part of the parametric design was focused on the atrium. Here, the computational design aimed to combine the architect’s vision with the rest of the disciplines. A big part of its contribution was analysing the visual and light conditions of the atrium and providing conclusions that would lead to design decisions. Furthermore, the parametric design provided alternative solutions and inserted design variable, that were crucial for solving forcoming problems related to structural design, climate performance and design vision.
The atrium was one of the most integrated parts in the VIA towers project and that was due to the collaborative design among the team members. The computational design played an important role in communication among disciplines and design decisions.
Finally, it must be mentioned that inserting computational methods to the concept design stage was challenging for the majority of the team members. Integrating computational design in this stage was a new experience for all the designers. However, we did manage to collaborate via computational means and we are overall pleased with the results.
3.
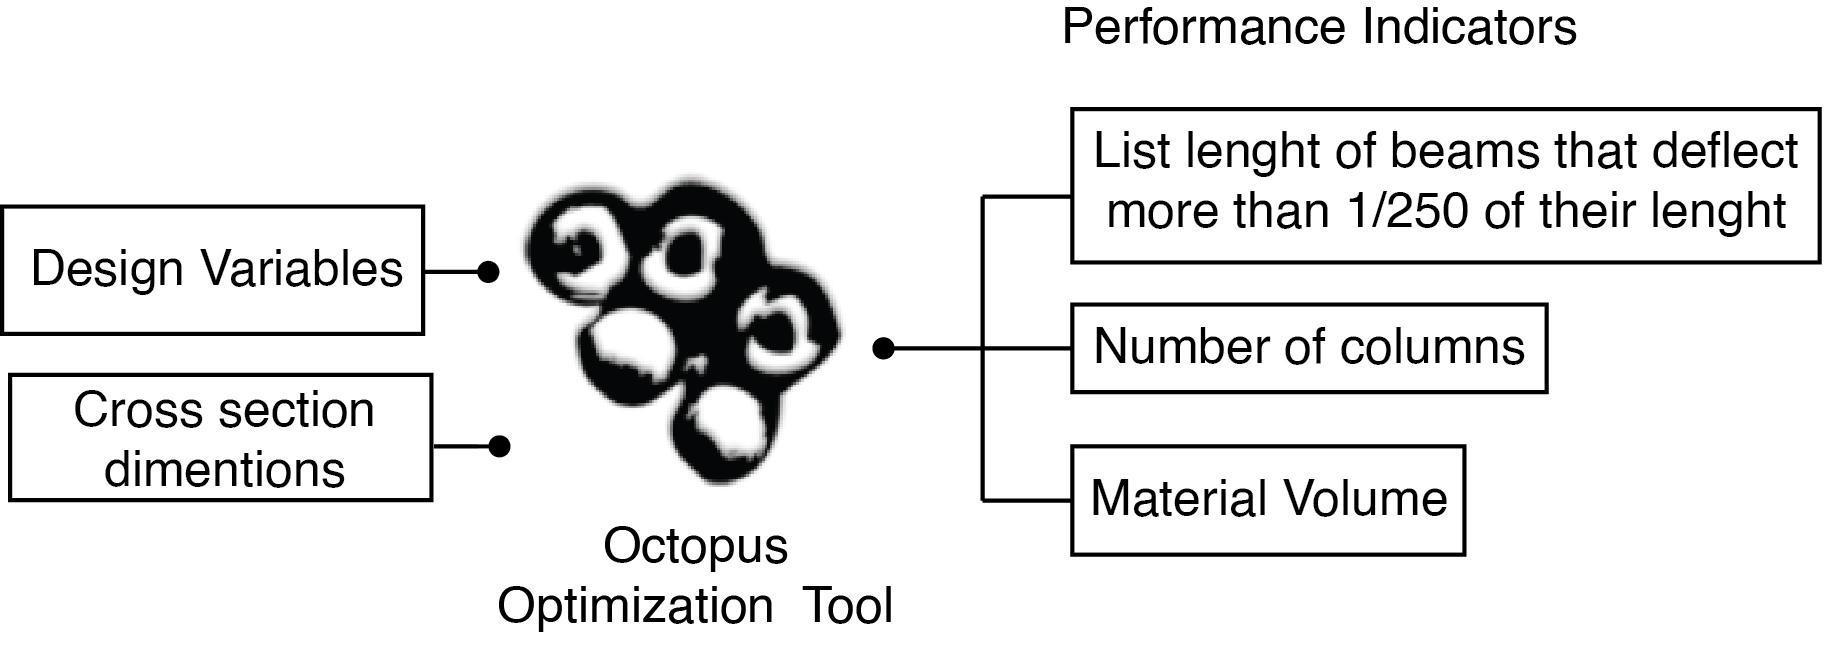
The atrium was the an important section in the VIA Towers. Design Criteria were defined during its design and converted to design variables. The structure was then optimized for structural and climate performance taking into account the visibility factors.
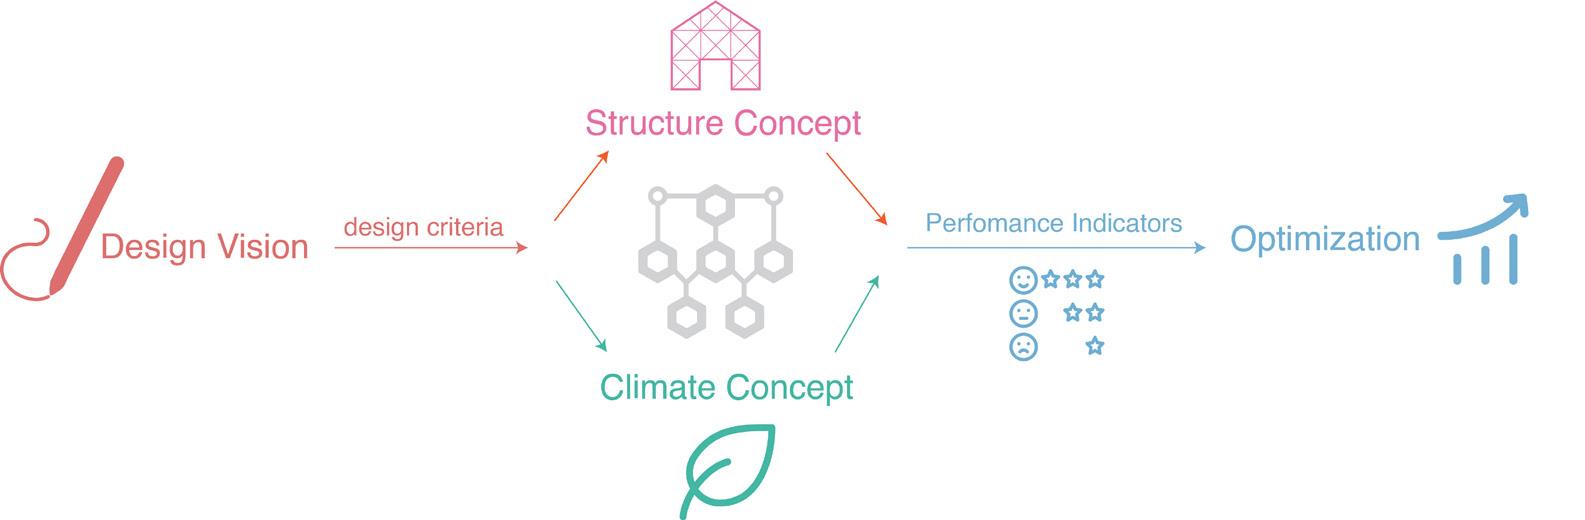
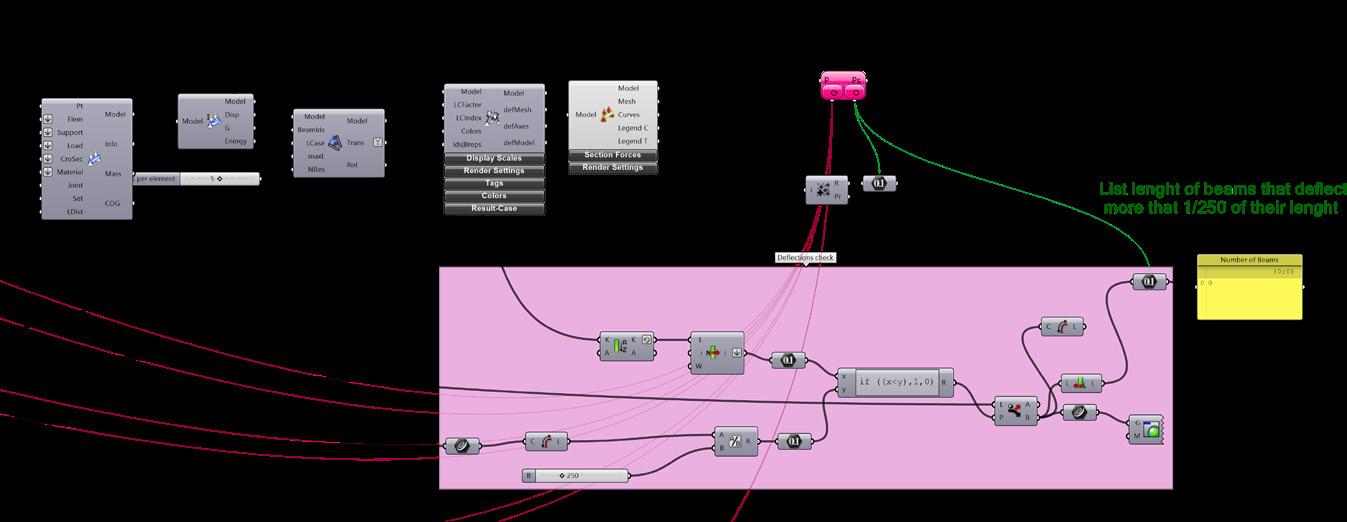
The atrium’s roof was optimized for serviceability limit state(SLS), by measuring the deflection of the beams due to loads cases. The deflection should not exceed ed the 1/250 of the beam’s lenght. The number of beams that exceeded this lenght had to be zero. Other performance indicators were the total volume of the material and the number of the columns.
The definition provided numerous design variables that defined the number of the beams, their cross section’s dimentions and configurations for the placement of the columns (explained in detail in chapter 4.2 section b3.).
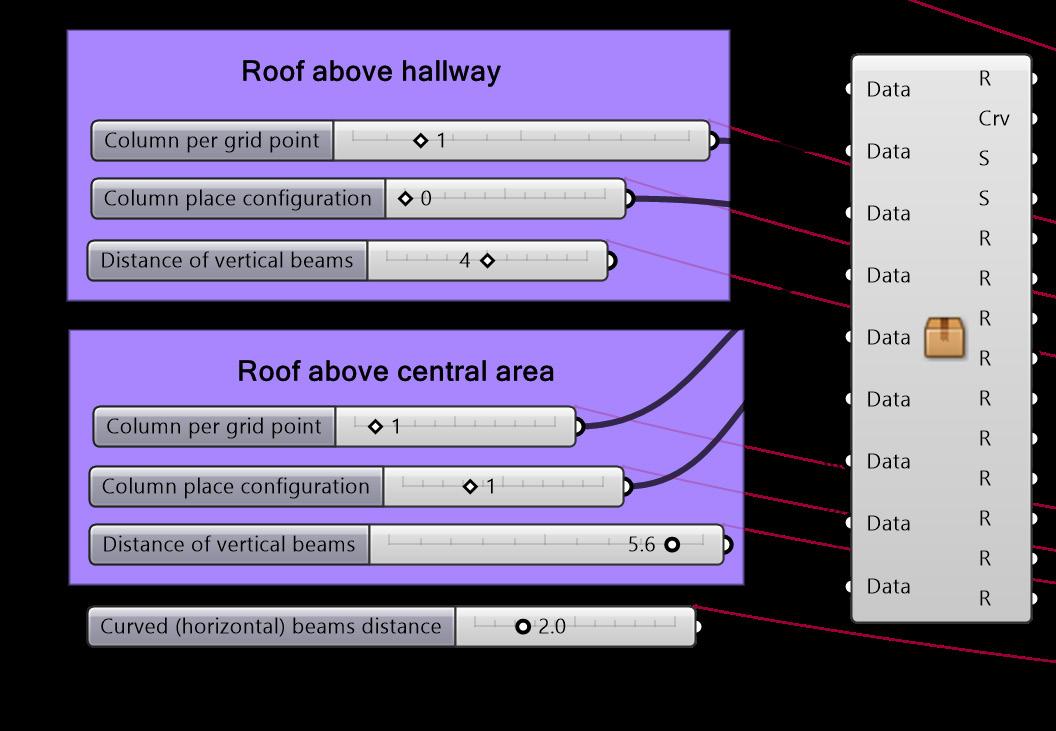
Preferred configuration
Columns Population
The following configurations present the results that meet the s erviceability limit state


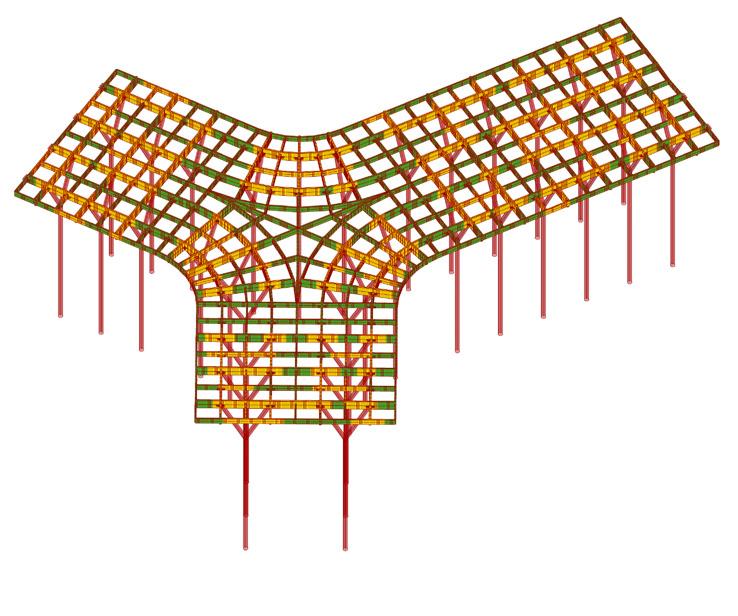
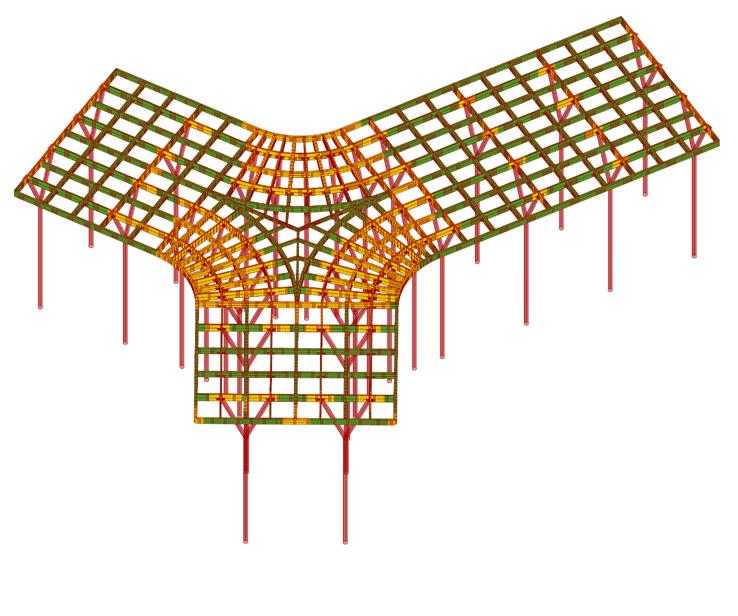
 Figure 3.3 Configurations that meet the serviceability limit state
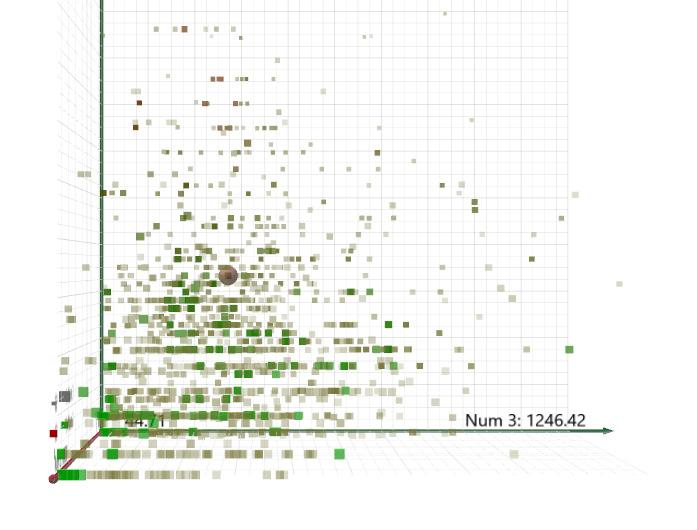
Figure 3.2
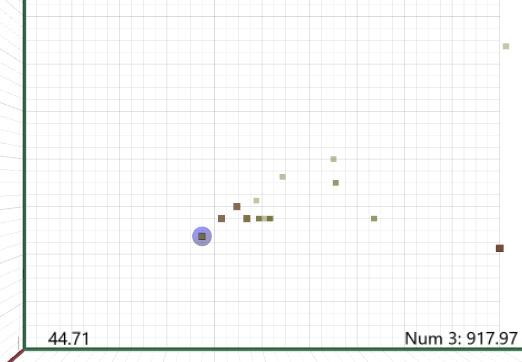
3d Graph of tested configurations
Figure 3.3 Configurations that meet the serviceability limit state
Figure 3.2
3d Graph of tested configurations
Note: Though the optimization runned with the column’shape as a parameter the simulation took the columns extreme edges as supports.
Results:
The first diagram meets the 1/250 lenght deflection rule and was the configuration with the less material volume and columns population, therefore it was the pr eferred configuration

Chapter 4.3 - Interdisciplinary numeric performance assessment and optimization:
The full analysis of the parameters that were optimized are mentioned in chapter 4.2 in section b8. Those are:
1. Selection of attractor points
2. Original domain for offset values
3. Original domain for z axis move values
vertical move
offset domain
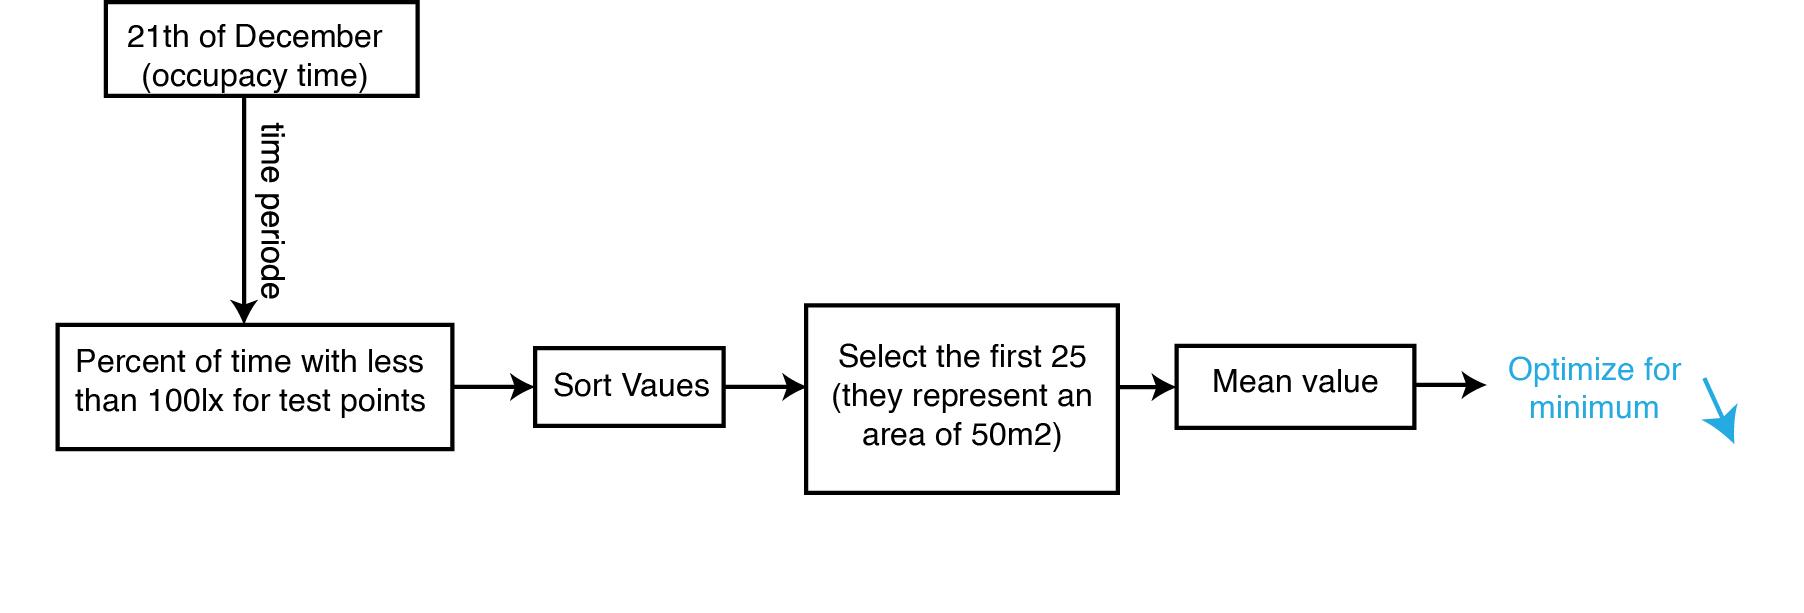
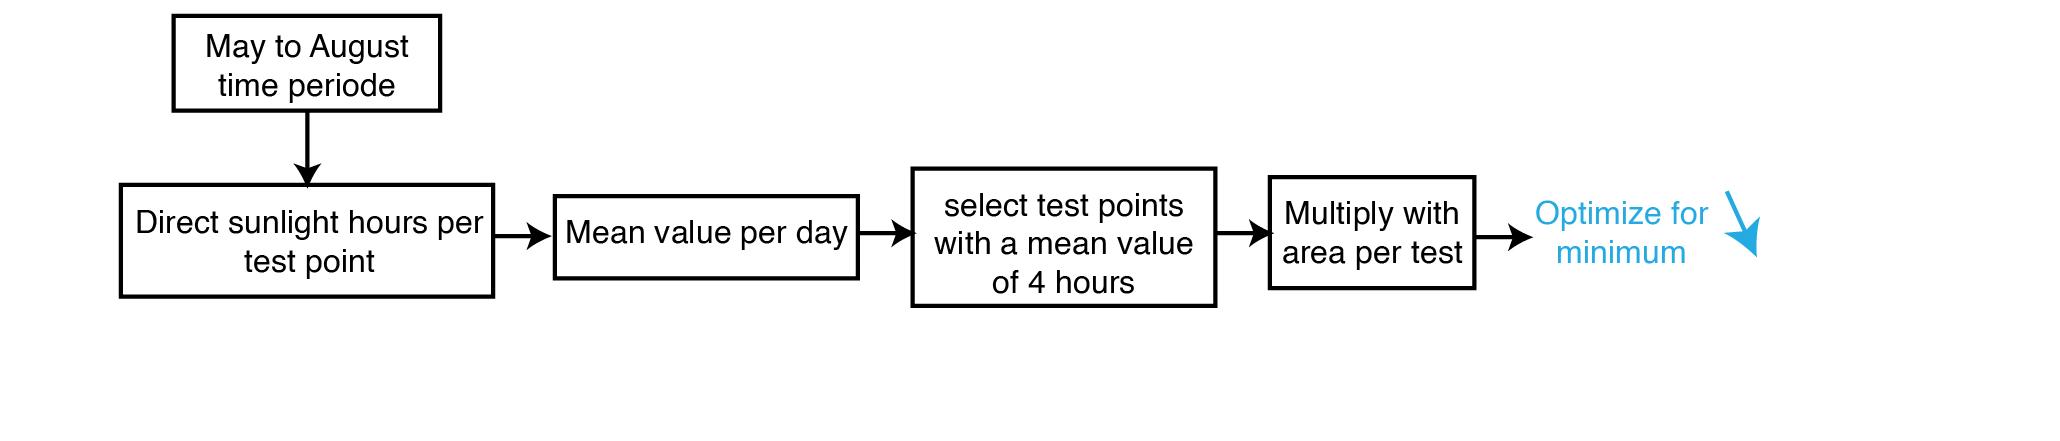
Figure 3.6 Attractor points used to remap the domains of extrusion and offset of the shaders. Figure 3.7 Offset and z axis move domains1. Reduce the percentage of time during the active occupacy hours that the test points receive less that 100 lux: The optimization should not run based on the smallest value, since that could be a single test point, neither the average value since large difference in the resulted domain could occurred. Therefore 25 test points, which represented an area of 50m2, with the smallest results were chosen. Their average resulted percentage of time was optimized to minimum. This strategy took into account both the area and their numerical result.
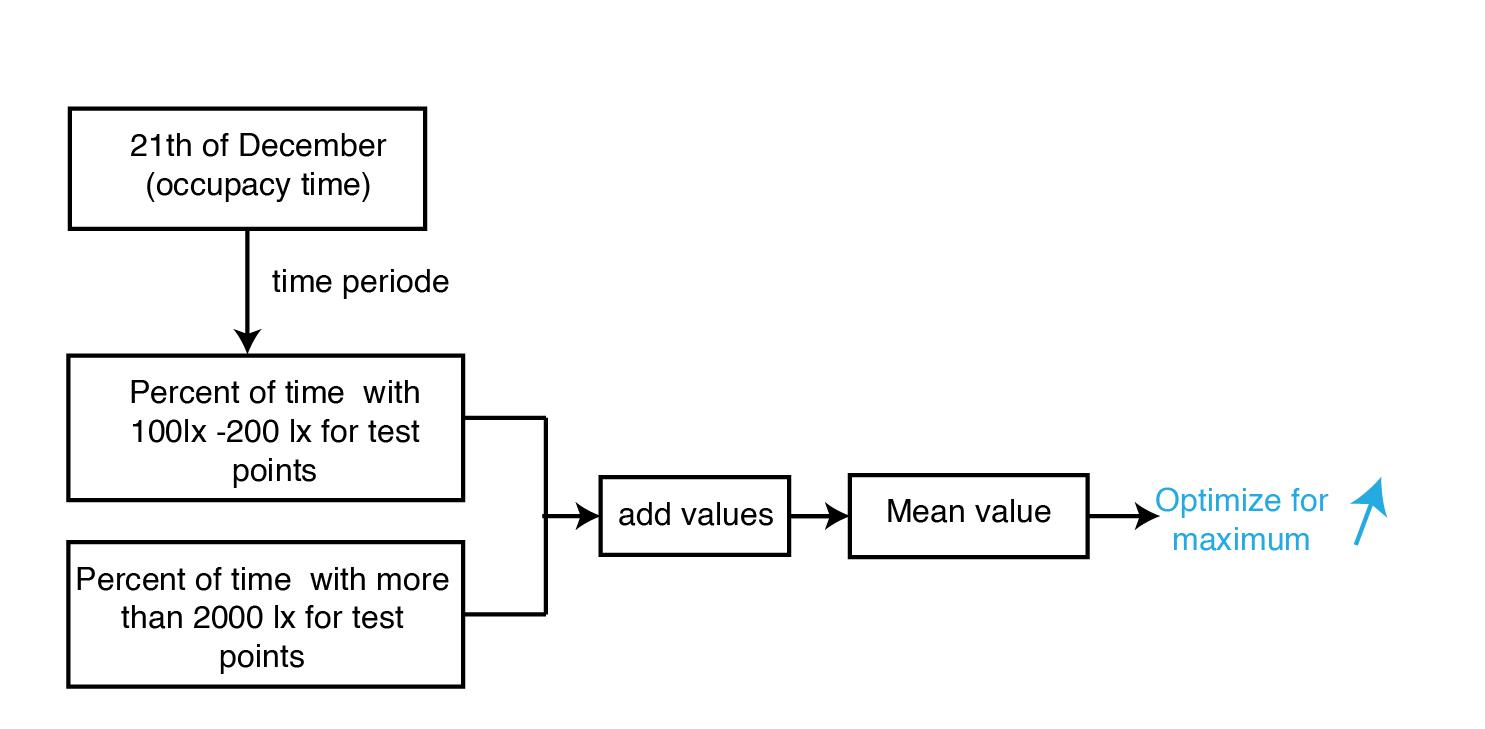
2. Increase the percentage of time during the active occupacy hours that the test points receive more that 100 lx: For that the average value is optimized. Note: This strategy could be improved by optimizing the list lenght of the resulted list. This would result in maximizing the area that receives more tha n 100lc.
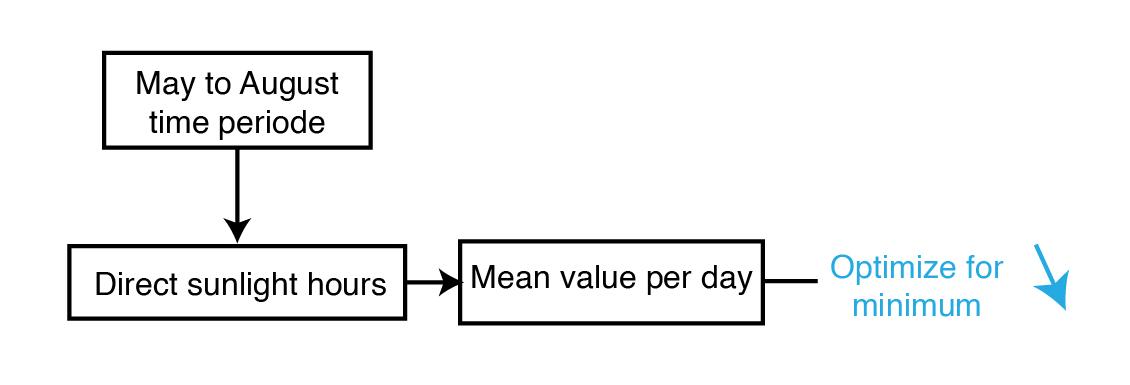
3. Decrease maximum direct Light sun hours during the warm months (May to August). This improves glare effect and prevent the generation of heat inside the atrium.
Chapter 4.3 - Interdisciplinary numeric performance assessment and optimization:
4. Decrease area that receives more than 4 direct Light sun hours per day during the warm months (May to August).
5. Increase Visibility towards the towers: As explained in chapter 4.2 the visibility towards the towers is optimized by taking into accoungt the roof’s impact and domains that affect the shading’s systems shape.
The simulation showed that most configurations do not face a big problem with daylight comform ,as the test points that receive less than 100lx for only 14% of the occupacy time. Visibility towards the towers and direct light conditions were inversely proposional. Therefore, the next step was to set constraints for direct light conditions and optimize for maximum visibility.
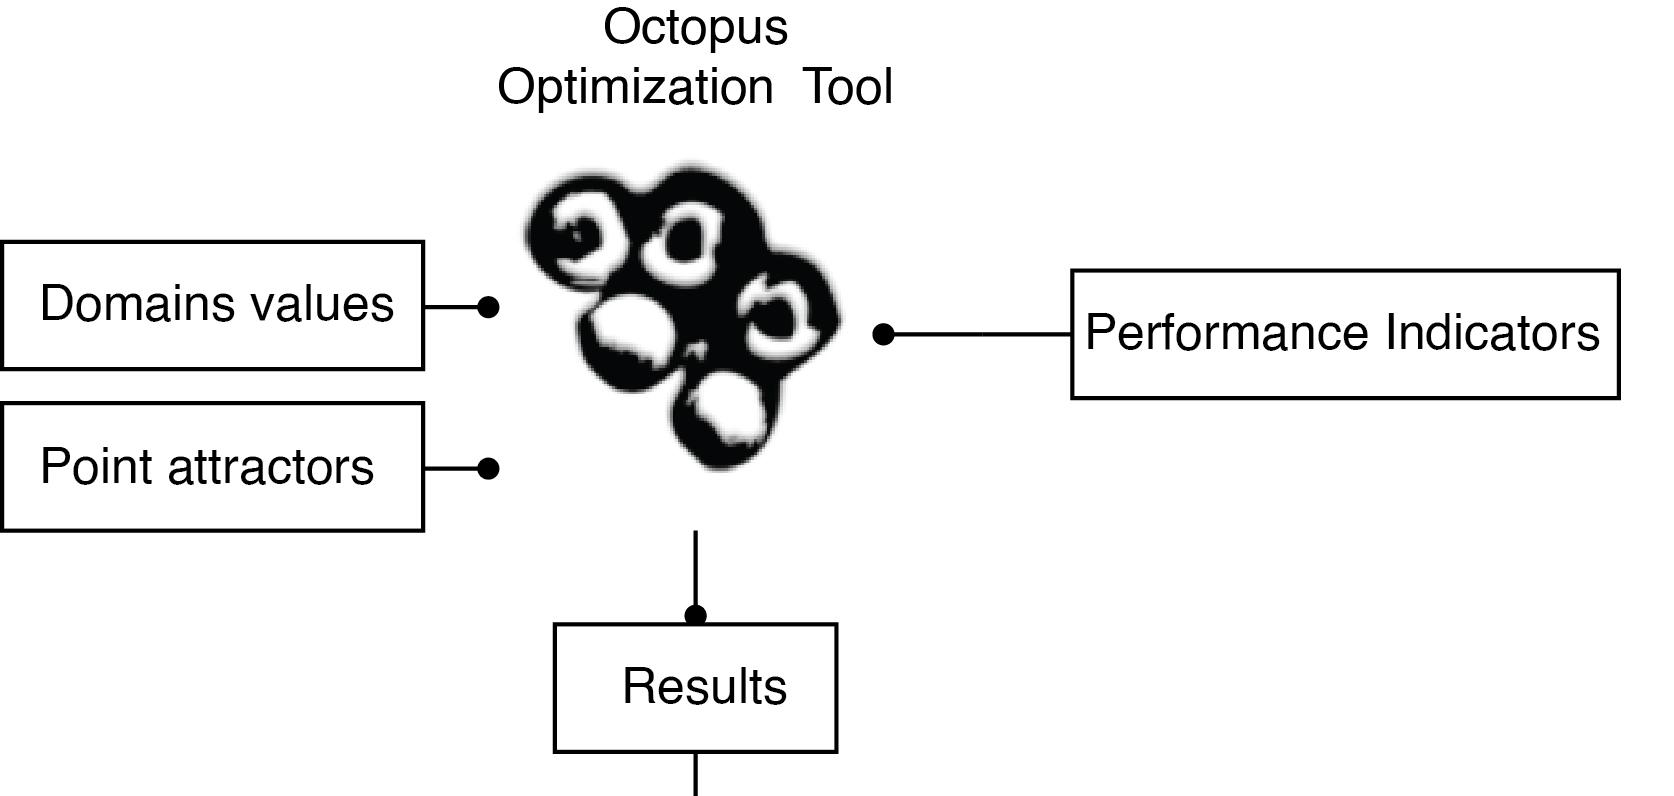
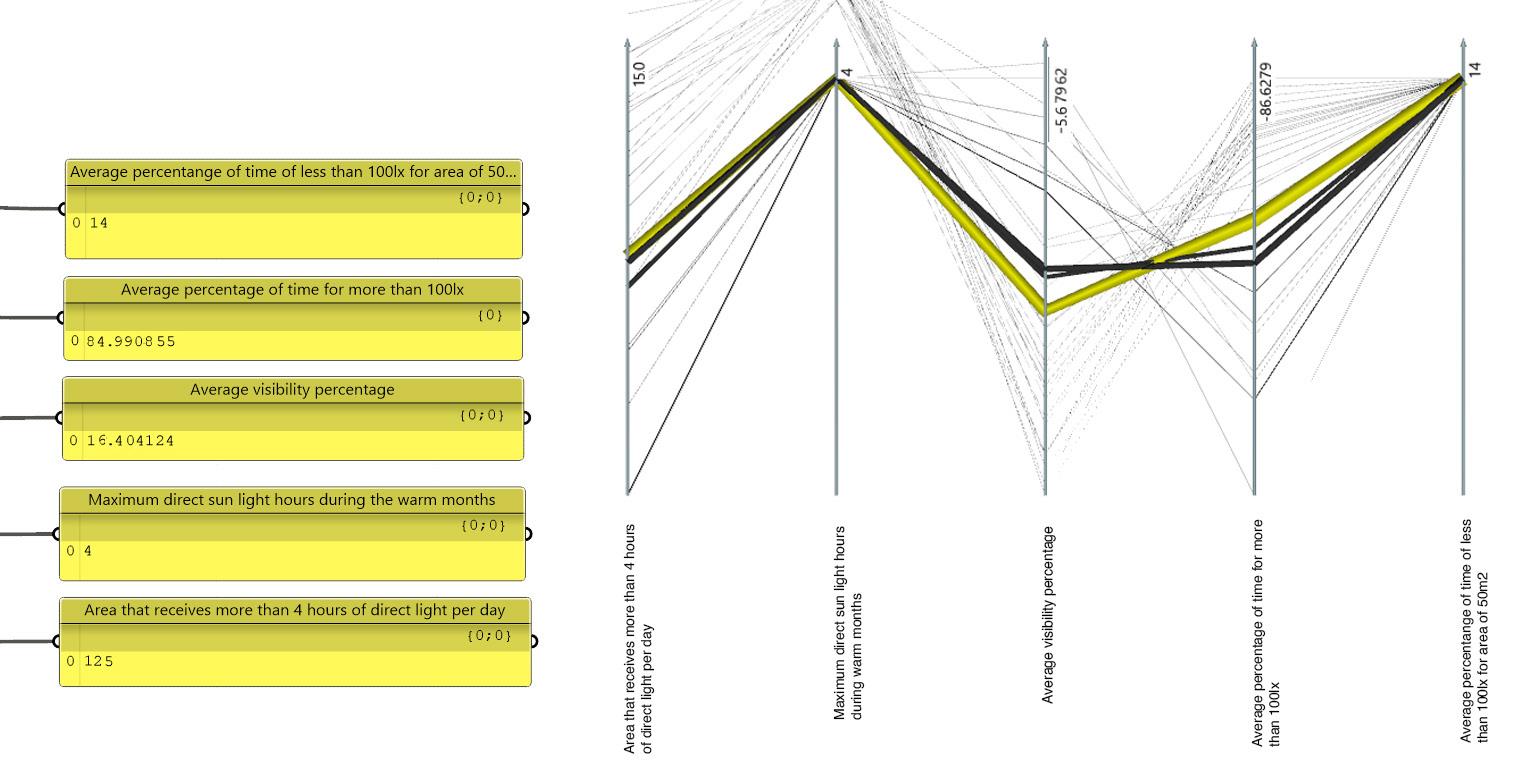
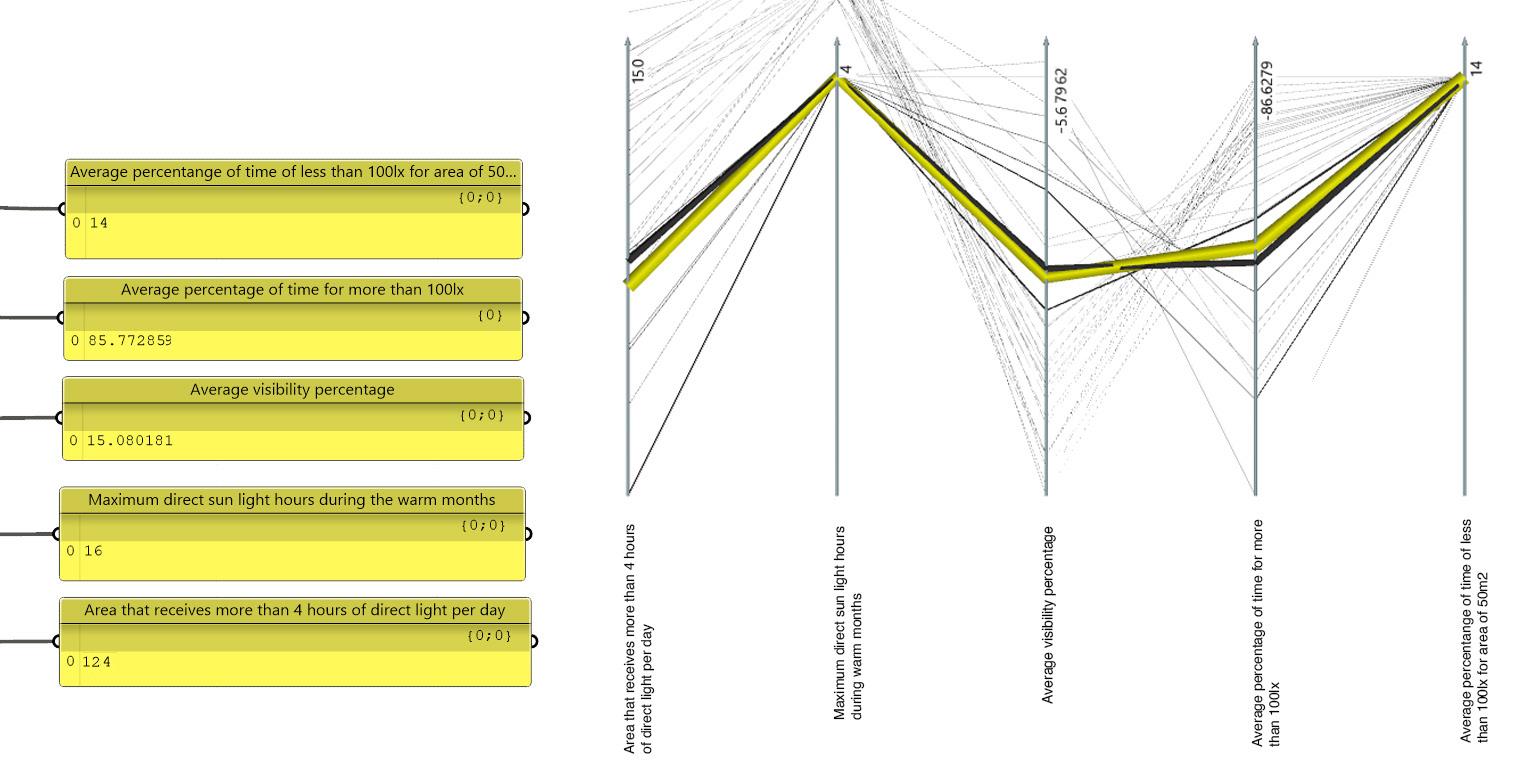
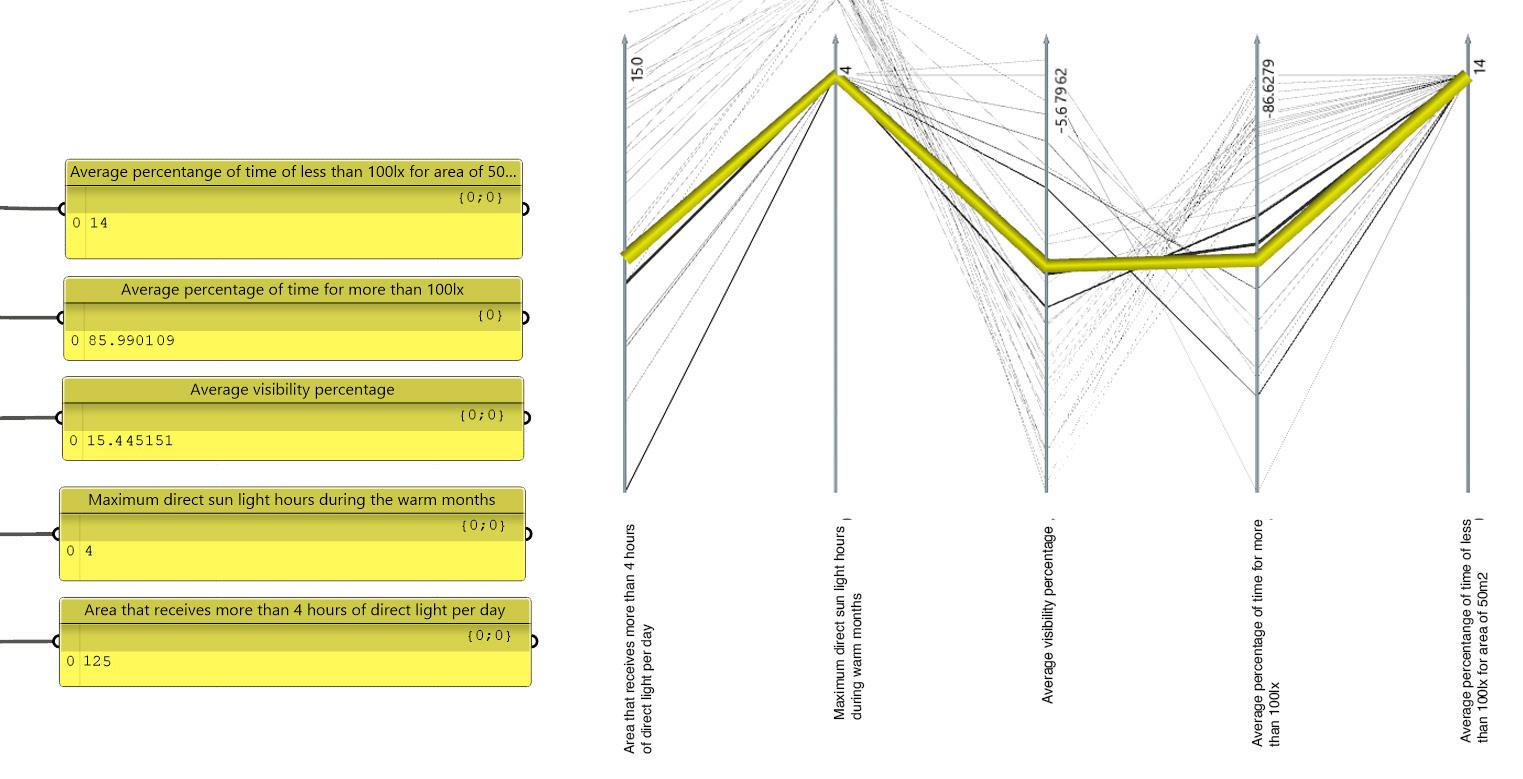
Also it must be noted that octopus only optimizes for minimum values. Therefore all performance indicators that needed to be optimized for maximum performance were multiplied with -1. This is why in the multi- axis diagram lower values represent better configurations.
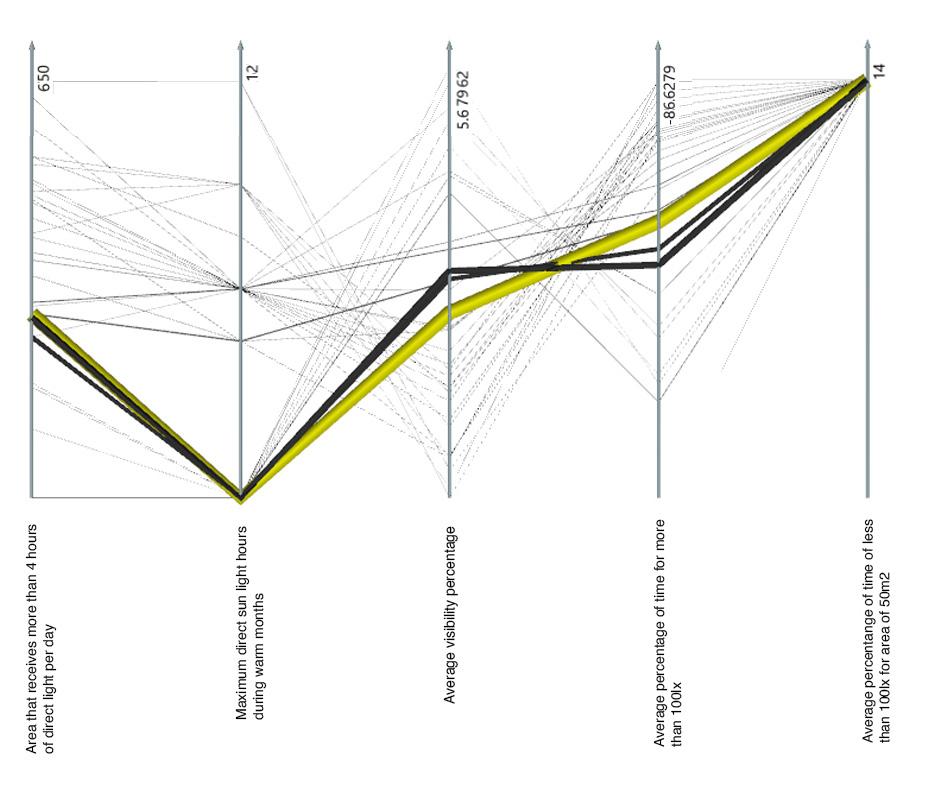 Figure 3.8 Solutions presented in the Multi-axes diagram. The yellow line presents the final preferred solution
The following constraints were applied:
1. Area that receives more than 4 hours of direct light during warm months: 150 m2
2. Maximum direct Light sun hours during the warm months: 4 hours

After the optimization a sunlight, visibility and daylight comfort analysis verified the optimized results
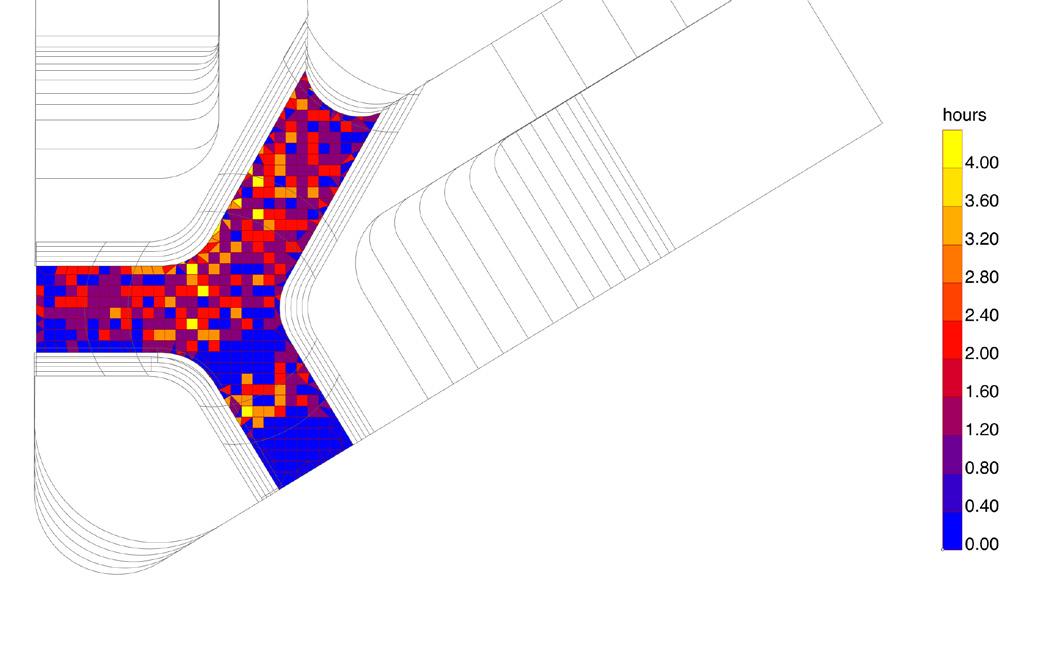
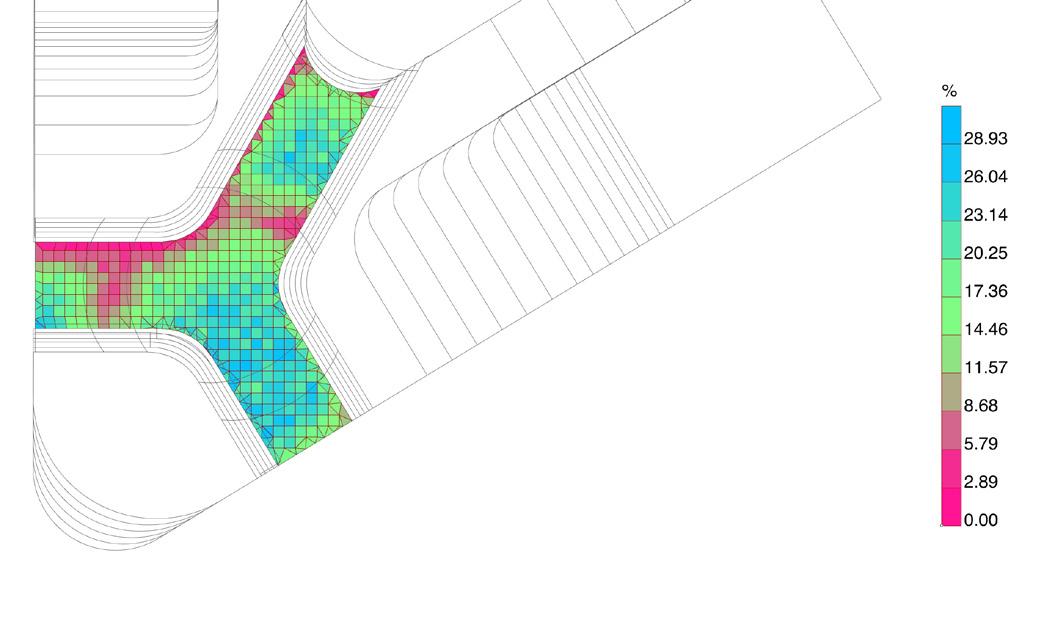
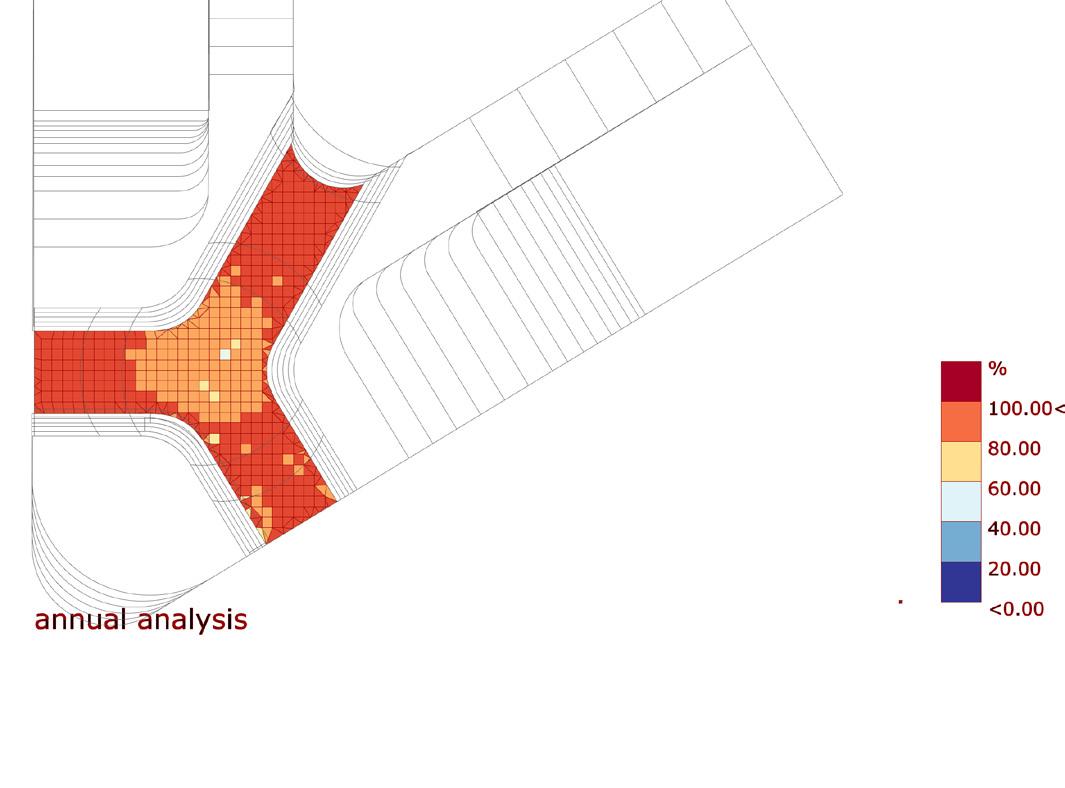
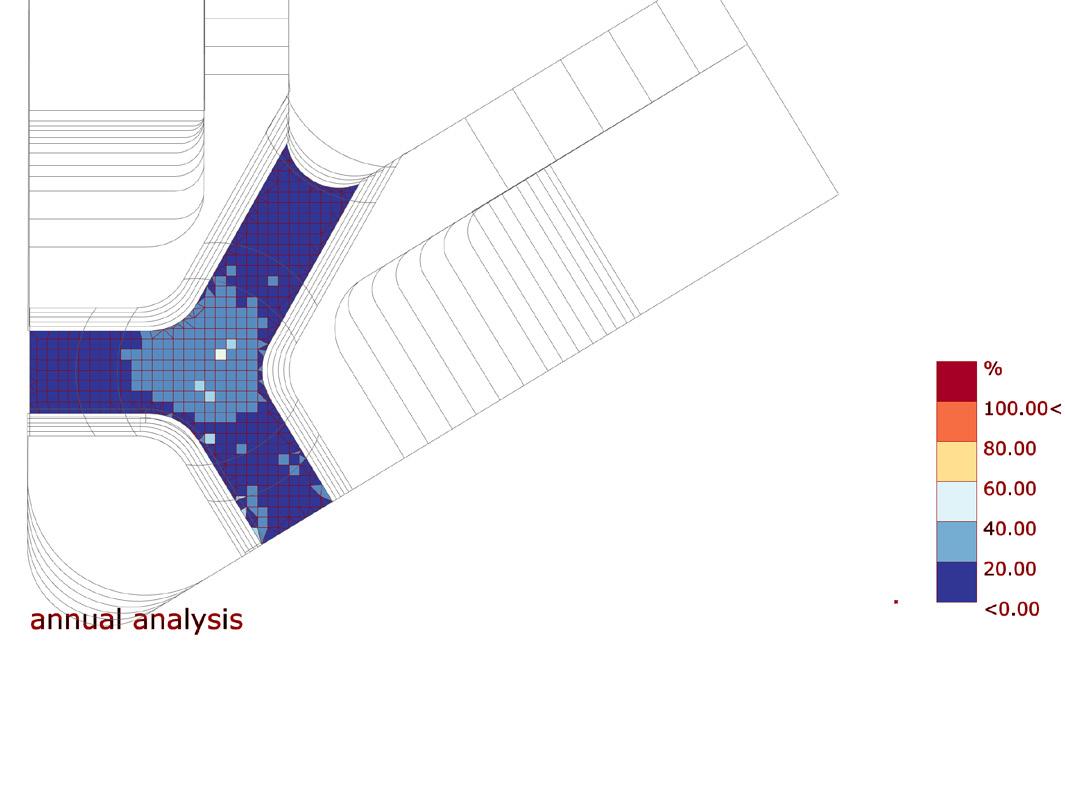 Figure 3.10 Preferred solution
Figure 3.11 Final Domains
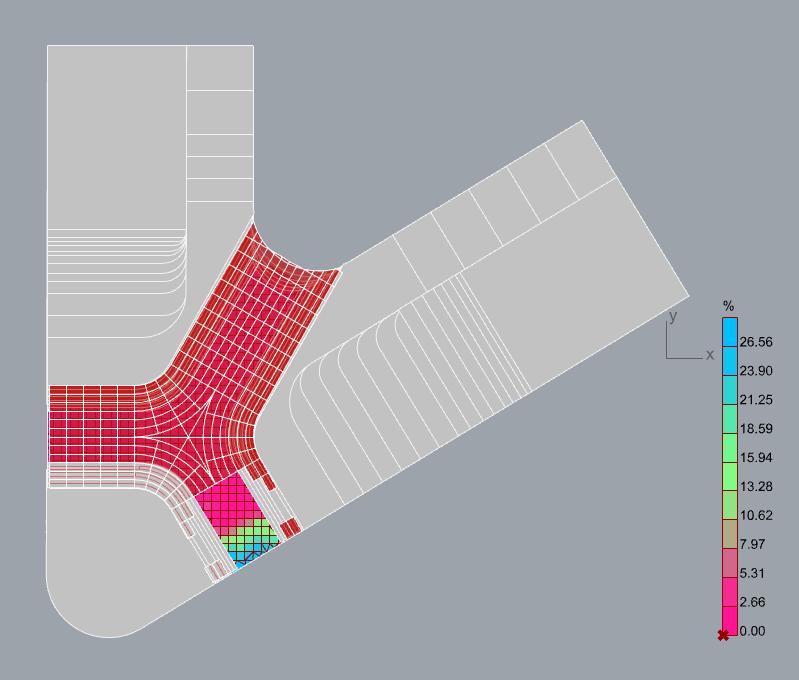
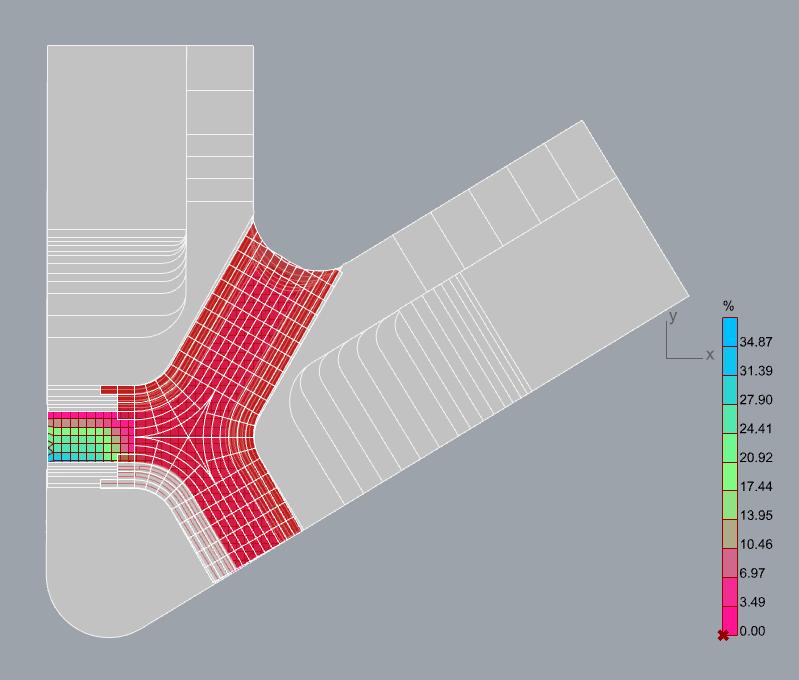
Figure 3.14 Average percentage of active occupacy time with 100- 2000lx for the 21th of December
Figure 3.15 Average percentage of active occupancy time with 100- 2000lx for the 21th of December
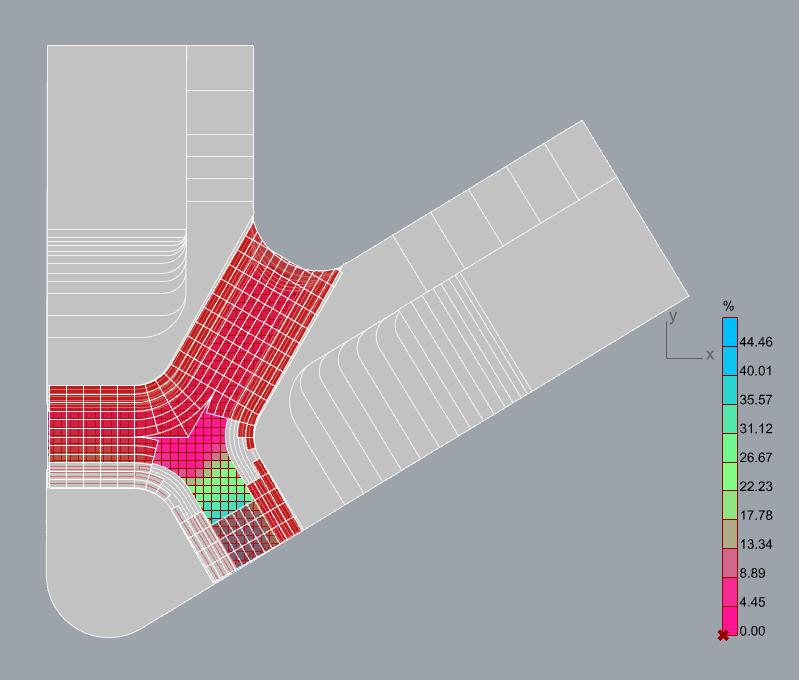
Figure 3.13 Visibility Percentage
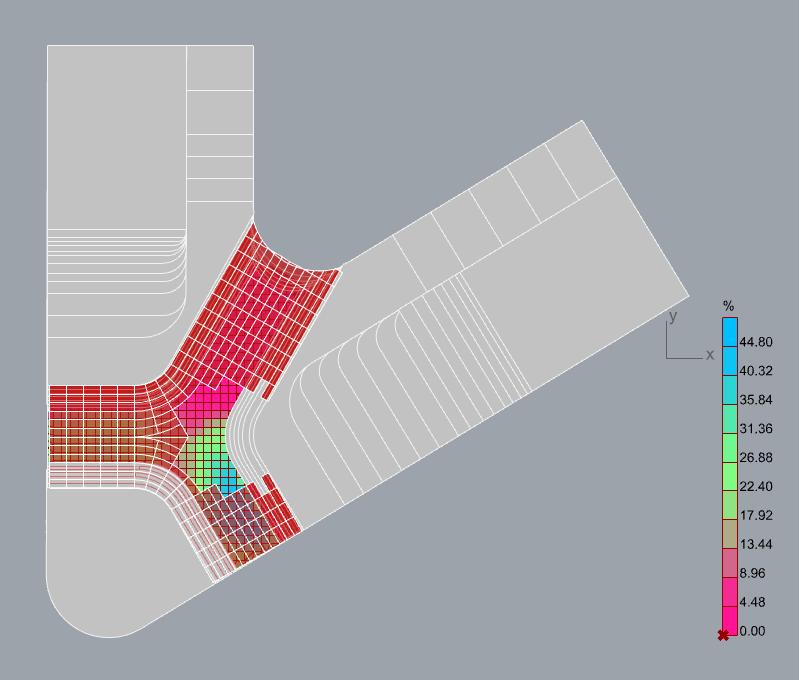
Figure 3.12 Mean direct sunlight hours during the warm months
Chapter 4.3 - Interdisciplinary numeric performance assessment and optimization:
Figure 3.10 Preferred solution
Figure 3.11 Final Domains
Figure 3.14 Average percentage of active occupacy time with 100- 2000lx for the 21th of December
Figure 3.15 Average percentage of active occupancy time with 100- 2000lx for the 21th of December
Figure 3.13 Visibility Percentage
Figure 3.12 Mean direct sunlight hours during the warm months
Chapter 4.3 - Interdisciplinary numeric performance assessment and optimization:
Chapter 4.3 - Interdisciplinary numeric performance assessment and optimization:
While the structural optimization was thorough and verified by the Structural Designers there is room for further improvements. At first the optimization showed no results because of the column’s buckling effect that affected the total deflection. For this reason the optimization runned by taking the joints (columns with roof) as supports. The column was optimized by the structural designers by giving them the reaction forces. However the optimization runned with the columns shape as a parameter which did not affect the result but was unecessary.
Also, one performance indicator is the list lenght of the beams that fail to meet the SLS criteria. An improvement would be to optimize for the minimum total lenght of these beams. This is because the optimization may result in smaller subdivision of the roof’s grid since that also results in less overall beams. This alteration may accererate the optimization.
The simulation tools that were used for the computational operations were grasshopper assets. That included honeybee and ladybug tools. All these components runned slow, especially honeybee. There were a number of parameters that were simplified to accererate the optimization process. That included simplifying the roof ,optimizing for spesific seazons and removing the reflection effect from the materials.
An example that should be mentioned is the case of the first performance indicator “Reduce the percentage of time during the active occupacy hours that the test points receive less that 100 lux”. Here the shortest day of the year was chosen as the simulation’s period. Taking into account the average values of more days would give more accurate results. The same strategy was followed for the “Decrease Direct Light during the warm months (May to August)” performance indicator.
Another improvent would be to take into account the balconies and the spaces around the atrium. For simplification reasons there were excluded from the optimization process. Finally, for a single configuration, even though there were simplifications, at least one minute was needed. This resulted into less results. Running the optimization for more time might have gived other results.