DEVELOPMENT OF FENCING MATCH ANALYSIS SOFTWARE

Page 1

TALLINN UNIVERSITY OF TECHNOLOGY School of Information Technologies

Ruslan Eskov 179527IAIB

DEVELOPMENT OF FENCING MATCH ANALYSIS SOFTWARE Bachelor’s thesis

Supervisor: Sven Nõmm, PhD

Tallinn 2020


TALLINNA TEHNIKAÜLIKOOL Infotehnoloogia teaduskond

Ruslan Eskov 179527IAIB

VEHKLEMISMATŠI ANALÜÜSIVA TARKVARA LOOMINE

Bakalaurusetöö

Juhendaja: Sven Nõmm, PhD

Tallinn 2020


Author’s declaration of originality I hereby certify that I am the sole author of this thesis. All the used materials, references to the literature and the work of others used here have been referenced to. This thesis has not been presented for examination anywhere else. Author: Ruslan Eskov 18.05.2020

3


Abstract Fencing is currently one of the most successful sports in Estonia. To date, fencing analysis is conducted only manually in this country. 
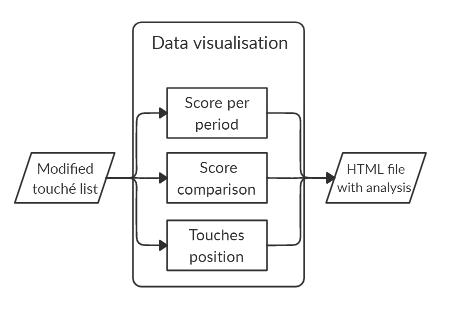
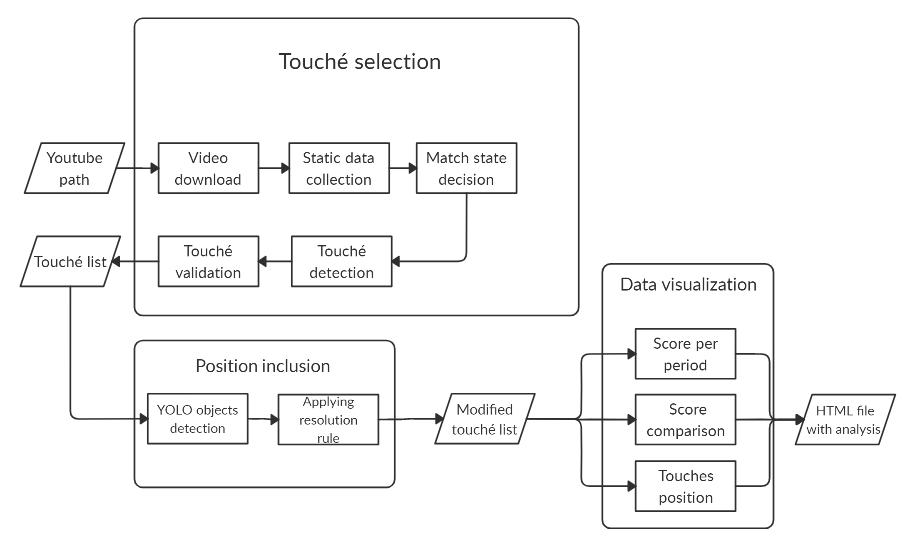
The main goal of this thesis is to develop software capable of calculating the statistics of a bout based on the analysis of a video document. The processed video should use Fencing Vision technology for its data visualisation. As a result, the software should be able to recognise information about fencers, such as their names and the abbreviations of countries. Information about valid touchés should also be identified. The software should also be able to create an output file with all the captured data. The current thesis is different to other research on same theme because none of these have analysed videos directly from YouTube. This thesis reports on the creation of a software solution for analysing an epee bout. This software accesses a YouTube fencing video and downloads the video. It then reads information about the fencers from the video, finds all touchés made during the bout with information such as period, type and frame, which part of the piste each touché was made, displays the score after each period and the difference between the scores during the match, and touché positions per period, and saves all this information in the output file. The thesis is in English and contains 34 pages of text, 6 chapters, 24 figures, 2 tables.

4


Annotatsioon Tänapäeval vehklemine on Eesti üheks edukamaks spordialaks. Praeguseks hetkeks selles riigis vehklemise analüüsi viiakse läbi ainult käsitsi. Käesoleva lõputöö peamiseks eesmärgiks oli arendada tarkvara, mis analüüsiks vehklemismatše video alusel. Töödeldatud video peaks kasutama Fencing Vision tehnoloogiat andmete kujutlemiseks. Tulemusena tarkvara peaks leidma vehklejate nimesid ning nende riikide lühendeid. Informatsioon loetud torgete kohta peaks olema leitud. Väljundiks peaks olema loodud fail leitud andmetega. Antud lõputöö erinevus teistest uuringutest seisneb selles, et ükski nendest pole analüüsinud videosid otse Youtube'st. Tulemusena epee vehklemismatši analüüsiv tarkvara oli loodud. See tarkvara saab sisendina Youtube vehklemisvideo lingi ning laadib alla video masina peale; loeb informatsiooni vehklejate kohta videost; leiab kõik matši ajal tehtud torked informatiooniga mis perioodil oli torge tehtud, mis tüüpi on torge, torge kaadri ning lisab informatsiooni mis raja osas oli torge tehtud; näitab seisu pärast igat perioodi, seisu muutust matši jooksul ning torgete asukohti vehklemisrajal perioodi kohta väljundfaili. Lõputöö on kirjutatud inglise keeles ning sisaldab teksti 34 leheküljedel, 6 peatükki, 24 joonist, 2 tabelit.

5


List of abbreviations and terms DPI

Dots per inch

OCR

Optical character recognition

YOLO

You Only Look Once, object detection algorithm

HTML

HyperText Markup Language

6


Table of contents 1 Introduction ............................................................................................................. 11 1.1 Workflow .......................................................................................................... 12 1.2 Observational data ............................................................................................. 12 1.3 Tools ................................................................................................................. 13 2 Background.............................................................................................................. 14 2.1 Introduction to fencing ...................................................................................... 14 2.2 Problem statement ............................................................................................. 16 3 Methodology ............................................................................................................ 17 3.1 YOLO object detection...................................................................................... 17 3.2 Tesseract OCR .................................................................................................. 19 3.3 Validation ......................................................................................................... 20 3.3.1 Precision..................................................................................................... 20 3.3.2 Recall ......................................................................................................... 20 3.3.3 F1 measure ................................................................................................. 20 4 Implementation ........................................................................................................ 20 4.1 Touché selection................................................................................................ 21 4.1.1 Video download ......................................................................................... 21 4.1.2 Static data collection ................................................................................... 21 4.1.3 Match state decision ................................................................................... 22 4.1.4 Touché detection ........................................................................................ 22 4.1.5 Touché validation ....................................................................................... 23 4.2 Position inclusion .............................................................................................. 23 4.2.1 YOLO training with fencing bout data ........................................................ 23 4.2.2 YOLO object detection ............................................................................... 25 4.2.3 Resolution rule ........................................................................................... 26 4.3 Data visualisation .............................................................................................. 27 4.4 Match score per period ...................................................................................... 27 4.5 Score comparison per period ............................................................................. 28 7


4.6 Touché positions per period ............................................................................... 29 5 Main results ............................................................................................................. 30 6 Summary ................................................................................................................. 32 References .................................................................................................................. 33

8


List of figures Figure 1. Full workflow .............................................................................................. 12 Figure 2. Fencing bout frame ...................................................................................... 13 Figure 3. Lunge........................................................................................................... 15 Figure 4. Fleche .......................................................................................................... 15 Figure 5. Bounding box with location and dimension. ................................................. 17 Figure 6. Darknet-53. .................................................................................................. 18 Figure 7. Object information in image. ........................................................................ 18 Figure 8. Data file content ........................................................................................... 18 Figure 9. Architecture of the Tesseract flow ................................................................ 19 Figure 10. Simple workflow. ....................................................................................... 20 Figure 11. Frame selection workflow. ......................................................................... 21 Figure 12. YouTube-dl use from command line. ......................................................... 21 Figure 13. Fencing Vision bout statistics. .................................................................... 22 Figure 14. Country abbreviation detection using Tesseract OCR. ................................ 22 Figure 15. Left touché made in Fencing Vision program. ............................................ 22 Figure 16. Position inclusion workflow. ...................................................................... 23 Figure 17. Launch of YOLO training. ......................................................................... 24 Figure 18. YOLO annotation tool. ............................................................................... 24 Figure 19. YOLO object detection algorithm training. ................................................. 25 Figure 20. YOLO detection result. .............................................................................. 26 Figure 21. Data visualisation. ...................................................................................... 27 Figure 22. Match score per period. .............................................................................. 28 Figure 23. Score comparison per period. ..................................................................... 29 Figure 24. Touché position per period. ........................................................................ 30

9


List of tables Table 1. Characteristics of the different fencing weapons ............................................ 14 Table 2. Precision and recall ....................................................................................... 31

10


1 Introduction Fencing is a combat sport with three different disciplines: the foil, the epee, and the sabre. To win points fencers should contact an opponent through their weapon. Competitions are organised into preliminary pool bouts (of 5 touchés) and direct elimination bouts (of 15 touchés) with a maximum time allowed [1]. Fencing is currently one of the most successful sports in Estonia and Estonian fencers often bring medals home from European and World Championships. In 2013, Estonians won both the men’s and women’s epee World Championship titles. In 2016, the Estonian women’s epee team won gold medals in the European Championships. Most of the international fencing competitions are available on the YouTube videosharing platform. At the moment, fencing analysis software, which processes videos from YouTube, does not exist. The Japanese fencing federation released software capable of visual motion capture, technique analysis and biometric data display for the Tokyo 2020 Olympics fencing event [2]. To the best of the author’s knowledge, the availability of such a software solution could help coaches and fencers analyse fencing bouts. To date, Fencing Vision is the most common system for displaying data during the match. The above system provides names, scores and the time of the current bout. The main goal of the present thesis is to develop epee bout video analysis software. The input videos must all use the Fencing Vision system. To satisfy the main goal, the following sub-problems should be addressed: a) Develop a Machine Learning algorithm capable of reading fencing bout data from video and determine whether the bout has been stopped by the referee. Text values should be read using Tesseract OCR;

11


b) Distinguish which part of the piste each touché was made using YOLO object detection; c) Apply Plotly data analytics tools to visualise the results of the analysis after the match has been processed.

1.1 Workflow

Figure 1. Full workflow

The workflow applied during the current research is performed in 3 phases. 1. Reading bout frames and choosing the frames in which touchés were made. 2. Position inclusion to the touché frames. 3. Bout results visualisation.

1.2 Observational data The data used in the present thesis is taken from epee bout videos using Fencing Vision technology to display scores and times. The videos are accessed through the YouTube 12


video-sharing platform. An example frame of the selected fencing video is shown in Figure 2. The chosen videos are from international competitions such as the World cup, European Championships and World Championships. In selecting the videos, the novelty of the competitions has been prioritised. In total, during the research 50 fencing bouts were analysed and the accuracy of each video analysis was verified.

Figure 2. Fencing bout frame

1.3 Tools The software this thesis presents was developed using Python for several reasons, including its potential for using a wide range of machine learning libraries and artificial neural networks. NumPy was used to process the video frames. PyTesseract OCR was used for text recognition. The YOLO algorithm was used to detect touché positions. The Plotly library was used for visualising the analysis results. The OpenCV library was used to save and remove frames. The PIL module was used for loading images. The OS module was used to launch the YOLO algorithm and manage the directories.

13


2 Background 2.1 Introduction to fencing Fencing is an open skilled combat sport practiced indoors, in which two athletes fight using weapons. Fencing is practiced with three weapons; the foil, the sabre and the epee. Each weapon has different rules. For safety, fencers wear specific fencing dress, mask, gloves and plastrons [3]. Fencing has featured at every modern Olympic games. Fencing takes place on a strip called a piste, which measures 14  2 metres [4]. Fencing competition is divided into two rounds – the preliminary round and the direct elimination round. To win the bout in the preliminary round, the fencer must score 5 touchés, and in the direct elimination round, the winner should reach 15 hits. During the preliminary pools, bouts last 3 minutes. However, the direct elimination bouts can last 3 rounds of 3 minutes with a 1-minute rest before each new round starts [4]. International tournaments may last more than 9 hours. Bouts represent less than one fifth of the total time of the competition [3]. Table 1. Characteristics of the different fencing weapons [3].

Epee

Foil

Sabre

How to hit the target

All the body

Trunk

Upper body

How to hit the target

Tip

Tip

Blade (cutting) and

Force for detecting (N)

>7.36

>4.9

Only contact

Priority

No

Yes

Yes

14


The lunge is the most frequently used action during an attack in fencing (Figure 3). This technical action starts from the on-guard position, then the arm accelerates and the front foot becomes active, and it ends when the point of the epee touches the target [5]. During the movement, a horizontal thrust phase can be distinguished. When the centre of the mass of the fencer accelerates forwards, this leads to a flight phase that ends when the front foot makes contact with the floor [6].

Figure 3. Lunge [4].

The fleche is another common form of attack in fencing (Figure 4), which is not used with the sabre. The best description of this action is a “running” attack. During the fleche, the back leg is powerfully driven forward of the front leg. The action is finished before the front leg lands. As a result of the momentum generated, the fencer cannot stop right after the touché has been made, and therefore the fencer needs time to stop [4].

Figure 4. Fleche [4].

The main aspects of fencer preparation are psychology, technique, tactics and the development of physical ability. The fencer should choose the most effective tactics for each competitive situation and every movement should be technically correct.

15


Tactics in fencing are expressed in the form of making decisions about when and how to attack the opponent, the ability to choose the correct distance for an action, and confident decision-making. The choice of tactic is complicated by the fact that the fencer does not know what his opponent is planning to do. In addition, while the fencer is trying to hide his or her intentions, his or her opponent is doing just the same. The fencer must manage within the limitations of the fencing piste (14m  1.5-2m) and time. Fencer should be courageous, purposeful, consistent, disciplined, in control and be able to use their initiative [1].

2.2 Problem statement The main goal of the current thesis is to develop software to analyse fencing matches based on YouTube videos. A fencing match should normally use Fencing Vision technology to display information about the identity of the fencers and the scores and timing. To date, this system is the most common. To achieve the goal of this thesis, several problems should be solved. An algorithm should be used to detect when the fencing bout is in an active state because the match could also be halted by the referee and there are also minute breaks after each period. In addition, all the touchés counted by the referee should be captured, which is a complicated task due to the fact that valid and non-valid touchés should both be distinguished. The following data should be identified from the video: a) The names of the fencers in the bout; b) The abbreviations of the names of the countries the fencers are representing; c) All touchés counted by the referee; d) The position in the piste in which the touchés were made.

16


3 Methodology 3.1 YOLO object detection YOLO (You Only Look Once) is a real-time object detection system (Figure 5). YOLO applies a neural network to the image and predicts a rectangle bounding box with a probability using linear regression. Each bounding box predicts a separate pretrained class. The centre coordinates are predicted using a sigmoid function, and the width and height from cluster centroids. If the probability of a bounding box appearing is smaller than the threshold, then the bounding box is not displayed [7].

Figure 5. Bounding box with location and dimension [7].

Feature extraction is achieved using the Darknet-53 neural network, which has 53 convolutional layers. The network uses 3x3, 1x1 layers and has shortcut connections (Figure 6) [7].

17


Figure 6. Darknet-53 [7].

Using Darknet 53 it is possible to train the YOLO object detection system using custom data. This process requires training weights, and these are available from the Darknet-53 model. YOLO requires a .txt file for each image with information about object location in the image (Figure 7). All predicted class names should be written to a .names file. Depending on how many classes there are, the training parameters should be edited in a .cfg file. Then, images should be divided into training data and test data. Information about the location of the training and test images as well as the paths and amount of classes should also be written to the .data file (Figure 8).

Figure 7. Object information in image.

Figure 8. Data file content [8].

18


3.2 Tesseract OCR Tesseract Open Source OCR (Tesseract) is an optical character recognition engine. The software can be used directly or using an API [9]. The Tesseract flow can be seen below in Figure 9. At the first step, the input image is transformed into a binary image using adaptive thresholding. Adaptive thresholding is used here because the image could have different lighting in some areas. This technology calculates the threshold for each pixel based on the region around it, which is used while thresholding [10]. Then, using connected component analysis, the character outlines are obtained. Connected component analysis is a graph theory application. This application makes subsets of connected components uniquely labelled [11]. As a result, using the connected component analysis application, the character outlines are identified. Character recognition from the image is done using the Convolutional Neural Network (CNN). If there are many characters in an image, then a recurrent neural network is used. The success of character/word recognition depends on the size of the training dataset [12].

Figure 9. Architecture of the Tesseract flow [13].

Tesseract OCR has several limitations. Among these are problems associated with an input image where the contrast level is low. Image DPI should be larger than 70. If the Tesseract OCR software has not been trained to recognise language or font, the user will need to train Tesseract using his or her own data. [12] 19


3.3 Validation To evaluate the current work there is a need to calculate and assess the accuracy of the developed software on observational data. To deal with the precision of the estimates of accuracy (also known as sensitivity), recall and F-measure values should be computed. 3.3.1 Precision Precision is expressed as the fraction of all positive predictions that are actual positives [14]. 𝑃𝑟𝑒𝑐𝑖𝑠𝑖𝑜𝑛 =

True positive True positive + False positive

3.3.2 Recall Recall is defined as the proportion of real positive cases that are correctly predicted as positive [14]. 𝑅𝑒𝑐𝑎𝑙𝑙 =

True positive True positive + False negative

3.3.3 F1 measure The F1 measure is the harmonic mean of precision and recall values [14]. 𝐹1 𝑚𝑒𝑎𝑠𝑢𝑟𝑒 =

2 𝑥 𝑃𝑒𝑟𝑠𝑖𝑠𝑖𝑜𝑛 + 𝑅𝑒𝑐𝑎𝑙𝑙 True positive + False positive

4 Implementation

Figure 10. Simple workflow.

20


The main workflow can be divided into three major parts: frame selection, position inclusion and data visualisation. This chapter presents the flow of the work step by step.

4.1 Touché selection

Figure 11. Frame selection workflow.

4.1.1 Video download The input for the fencing analysis software is a YouTube video path. The software downloads the video from the given path using the YouTube-dl program and saves it to the machine (Figure 12). All videos are downloaded at a resolution of 720 dpi.

Figure 12. YouTube-dl use from command line.

4.1.2 Static data collection Static data in this work means both the names of the fencers and the abbreviations of their countries. The optical character recognition engine Tesseract OCR is used to capture the text (Figure 13). It is also essential to set a list of allowed characters within Tesseract OCR before using it. When reading names, letters, dots and hyphen punctuation marks are allowed. In country abbreviations only letters are allowed (Figure 14). In some instances, Tesseract OCR does not recognise all data after a single scan, therefore if the

21


result is inappropriate, the software will scan again to collect the desired data from the next frame.

Figure 13. Fencing Vision bout statistics.

Figure 14. Country abbreviation detection using Tesseract OCR.

4.1.3 Match state decision A fencing bout has three possible match states: active, halted and paused. A fencing bout lasts 15 touchés or 3 periods of 3 minutes. A bout is by default halted and changes to the active state only when the time on the clock is changing. While a match is in the active state, corresponding frames are saved to the frames list as objects. The frames are saved as objects with the parameters: image, period and position. Position is added in the frame position inclusion part. If the period of a fencing bout finishes, then the match state is switched to pause and the subsequent frames will not be processed. When the pause is ended, the match state value is switched to halted and the period counter increased. 4.1.4 Touché detection In epee fencing there are three types of touché: left, right and the double. Left and right are named due to the corresponding position of the fencers in relation to the referee. The Fencing Vision program uses touché visualisation to show the touchés. When a fencer makes a touché, the lower area is coloured with red or green depending on the side (Figure 15). If both fencers make touchés simultaneously, then both lower areas are coloured. The software detects the touchés by checking the lower areas of the video. If a touché is made, then the frame will be saved to the touché list. The touché is saved as an object with the parameters: touché type, match period, image path and position of the touché.

Figure 15. Left touché made in Fencing Vision program.

22


4.1.5 Touché validation A referee has the right to count or not to count touchés according to FIE (International Fencing Federation) rules. When the fencer has made a touché, the match state is changed to halted. When the state is active again, the software will check if the score has changed. To do that the software has saved the score image before the touché was made and compares that image with the score when the match state changes again. The comparison is done by subtracting the black and white score images. If the numeric result of the subtraction is bigger than the chosen threshold, the touché is proper and possible, and the frame will not be deleted from the touché list.

4.2 Position inclusion

Figure 16. Position inclusion workflow.

The frame selection part prepares the touché list with touché type, period and path to the frame on the machine. The position of the touchés in the piste is unavailable, so there is a need to determine them. 4.2.1 YOLO training with fencing bout data To complement the touché lists from the previous part and add the positions, we need to use the YOLO object detection algorithm. Unfortunately, YOLO does not recognise fencers and the other objects appearing in fencing bouts. The only solution is to train YOLO to recognise the relevant objects (Figure 17).

23


Figure 17. Launch of YOLO training.

The following classes were created: border, border-flat, centre, fencer, line, signallingunit, signalling-unit-two. The images for training were processed using the YOLO annotation tool [15], and as a result a file was created for each image with bounding box parameters for each object in the picture (Figure 18). The images were divided into training images and test images. Training was done for a total of 260 images and completed 11,000 iterations (Figure 19).

Figure 18. YOLO annotation tool.

24


Figure 19. YOLO object detection algorithm training.

Despite the fact that YOLO developers suggest training YOLO over 2,000 iterations for each class the training stopped earlier. This decision was made due to the fact that the neural network reached a loss parameter which was not getting any lower even after a while. As a result, YOLO created a weights file which is used during image processing. 4.2.2 YOLO object detection To modify the touché list, we need to launch YOLO for each frame and find which objects it has detected (Figure 20). YOLO creates a text file with the resulting object detection in each frame. In some cases, it is possible to see more than one fencing bout in the frame because of the camera position in the fencing hall. So, we need to filter all the recognised objects. The solution is to identify the coordinates of each controversial object and only keep those with lower coordinates. For convenience, the filtered objects are sorted by 25


abscissa coordinates so it is possible to make a decision on the position of the touché.

Figure 20. YOLO detection result.

4.2.3 Resolution rule To identify the touché position, the search used the resolution rule of inference. The resolution has to have a list of axioms against which the sorted object can be checked to make sure it satisfies the axioms in the list. In this research, the following axioms were used for position detecting: 1. If both fencers are left/right of the signalling-unit/centre line, then the position of the touché is left/right. 2. If one fencer is left of signalling-unit/centre line and the other fencer is to the right of it, then position of the touché is in the centre. 3. If both fencers are to the left/right of the first/second line, then the position of the touché is left/right. 4. If one fencer is to the left/right of first/second line and the second fencer is to the right/left of it, then the position of the touché is in the centre. If none of the axioms was satisfied, the software is not capable of detecting the position of the touché. The frame parameter with the name of the position will remain without value.

26


4.3 Data visualisation

Figure 21. Data visualisation.

The fencing analysis software creates an HTML page with results as its output and saves this to the given directory path. The components of the page are created using Plotly data and visualisation tools. The HTML page contains the following components: a table of match scores per period, a graph of the score comparison, a pie chart of the touché positions.

4.4 Match score per period The table that displays the points earned by the fencers after each period has the names of the fencers written at the top. The periods are listed down the left column forming a row for each period. The points earned per fencer during each period are then indicated in columns under each name (Figure 22).

27


Figure 22. Match score per period.

4.5 Score comparison per period The graph shows the difference between the fencers in terms of the points they have scored throughout the match. If the left fencer is leading, then the line is green and it is upper than the abscissa. Otherwise the line is red and lower than the abscissa. When the abscissa value is equal to zero the score is equal. The vertical dashed lines indicate pauses. (Figure 23).

28


Figure 23. Score comparison per period.

4.6 Touché positions per period The pie charts show the proportion of touché positions in the bout per period. If software could not recognise the bout part during some touchés, then the pie chart will include the value N/A, which shows the proportion of non-recognised touché positions (Figure 24).

29


Figure 24. Touché position per period.

30


5 Main results In this section the main result of the research is considered. To test the accuracy of the software 50 suitable fencing bout videos were chosen randomly from international competitions. Using these, the precision, recall and F-measure were calculated (Table 2.). Bouts from the following competitions bouts were used: Budapest Grand Prix 2020, Junior World Championship 2018, Senior World Championship 2019, Senior World Cup Tallinn 2019, Senior World Cup Bern 2019, Senior European Championship 2019, Doha Grand Prix 2019, Senior World Cup Dubai 2019. The following features were developed: a) Reading fencers names from the video b) Reading country abbreviations from the video c) Capturing all touchés correctly during the bout d) Identifying each touché position Table 2. Precision and recall.

Condition

Feature

Precision

Recall

F-measure

1.

Name detection

0.96

1

0.98

2.

Country detection

0.91

1

0.95

3.

Touché detection

0.96

1

0.98

4.

Touché position

0.98

0.98

0.93

inclusion

31


6 Summary The aim of this thesis is to develop software capable of analysing fencing matches. The software should read information about fencers, recognise all the valid touchés and visualise the results on an HTML page. Software for analysing fencing matches from videos was successfully created. The processed video should use the Fencing Vision score visualising system. The only input for the software is fencing bouts via the YouTube video path. The fencers names and countries (as abbreviations) are read using OCR technology. All the touchés made during the bout are captured with their match period, type and piste position using a YOLO algorithm. The output file is in HTML format and uses Plotly analytical tools to display information about the final score and score after each period; the difference in the score during the match; and touché positions per period. To evaluate the accuracy of the software, precision and recall results were calculated for each developed feature. The results show that all features are appropriate for use. In future, the software could be improved by adding new features. These could include applying kinematics analysis for the fencers during the fencing match; this would make it possible to compare technique and movement.

32


References

[1]

D. Tyshler, Fehtovanije. ХХI vek. Tehnika. Taktika. Psihologia Upravlenie trenirovkoi, Moskva: Chelovek, 2013.

[2]

Fencing Visualized for 2020. [Film]. Japan: Japan Fencing Federation, 2019.

[3]

G. Roi and D. Bianchedi, "The Science of Fencing, Implications for Performance and Injury Prevention," Education and Research Department Isokinetic, Bologna, Italy, 2008.

[4]

A. Turner , “Determinants of olympic fencing performance,” Middlesex University, London Sport Institute, London, 2014.

[5]

M. Gutierrez-Davila, F. Rojas, R. Antonio and E. Navarro, "Response timing in the lunge and target change in elite," European Journal of Sport Science, no. Vol. 13, No. 4,, pp. 364-371, 2013.

[6]

S. Stewart and B. Kopetka, “The kinematic determinants of speed in the fencing lunge,” Journal of Sports Sciences, p. 111, 2005.

[7]

A. Farhadi and J. Redmon, “YOLOv3: An Incremental Improvement,” 2018. [Online].

Available:

https://pjreddie.com/media/files/papers/YOLOv3.pdf.

[Accessed 17 April 2020]. [8]

A. Farhadi and J. Redmon, “YOLO: Real-Time Object Detection,” 2018. [Online]. Available: https://pjreddie.com/darknet/yolo/. [Accessed 29 April 2020].

[9]

S.

Weil,

“Github,”

30

January

2020.

[Online].

Available:

https://github.com/tesseract-ocr/tesseract/wiki. [Accessed 5 April 2020]. [10] O.

CV,

“Image

Thresholding,”

2020.

[Online].

Available:

https://docs.opencv.org/master/d7/d4d/tutorial_py_thresholding.html. [Accessed 20 April 2020].

33


[11] B. K. P. Horn, “Connected-component labeling,” in Robot Vision, MIT Press, 1986, pp. 69-71. [12] A. Sable and F. Zelic, “A comprehensive guide to OCR with Tesseract, OpenCV and Python,” January 2020. [Online]. Available: https://nanonets.com/blog/ocrwith-tesseract/#technologyhowitworks. [Accessed 5 April 2020]. [13] N. Kashyap, “International Journal of Computer Application,” April 2015. [Online].

Available:

https://www.researchgate.net/publication/276108387_Optical_Character_Recogn ition_on_Handheld_Devices. [Accessed 20 April 2020]. [14] D. Powers, “Evaluation: from precision, recall and f-measure to roc,” Journal of Machine Learning Technologies, Bedford Park, South Australia, 2011. [15] M.

Murugavel,

March

2019.

[Online].

Available:

https://github.com/ManivannanMurugavel/Yolo-Annotation-Tool-New-. [Accessed 18 April 2020].

34


Issuu converts static files into: digital portfolios, online yearbooks, online catalogs, digital photo albums and more. Sign up and create your flipbook.