
Sponsors for the 2025 Innovative Housing Showcase
ERIC LAWRENCE FRAZIER MBA
CALIFORNIA
REAL ESTATE BROKER

PUBLISHER:
ERIC LAWRENCE FRAZIER
PRODUCTION TEAM:
• Alvin Magua
• Leonna Rose Berame
• Sharon Rose Barellano
• Michael Mbugua
SCAN


Sponsors for the 2025 Innovative Housing Showcase
CALIFORNIA
REAL ESTATE BROKER

PUBLISHER:
ERIC LAWRENCE FRAZIER
PRODUCTION TEAM:
• Alvin Magua
• Leonna Rose Berame
• Sharon Rose Barellano
• Michael Mbugua
SCAN


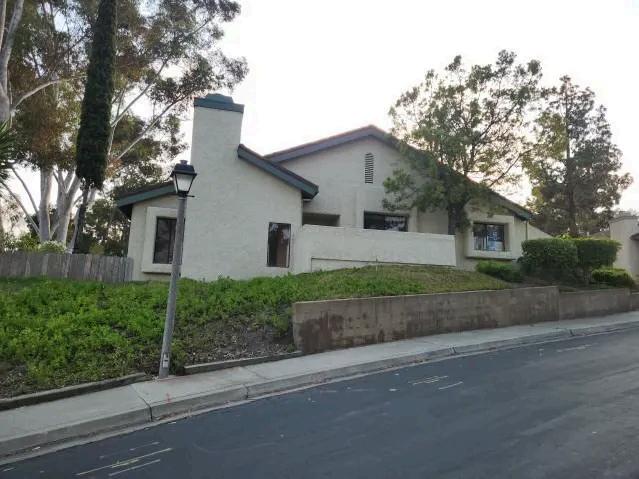
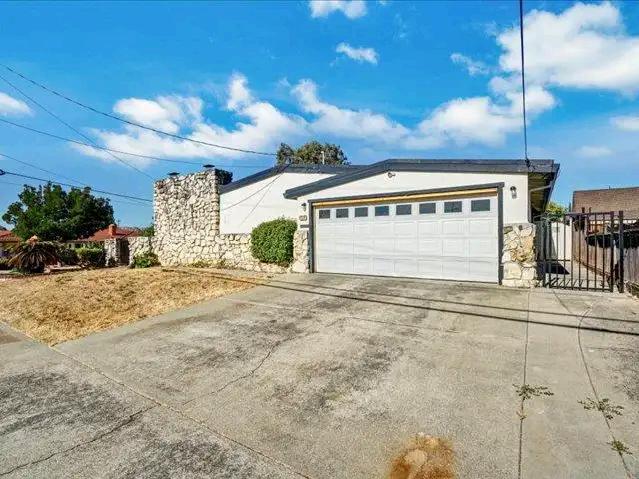
• 1693 N LOS ROBLES AVE
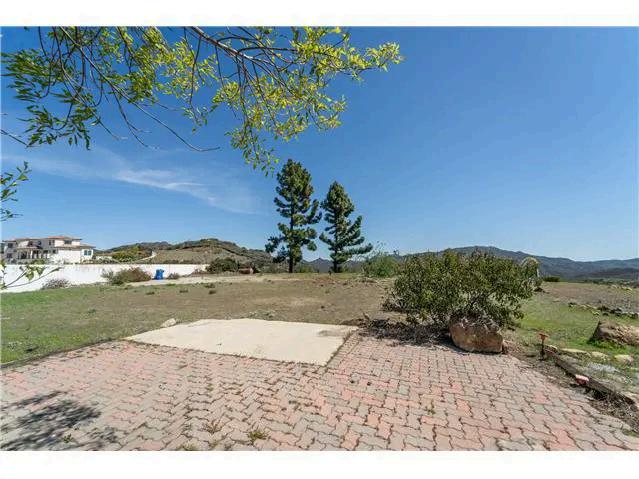
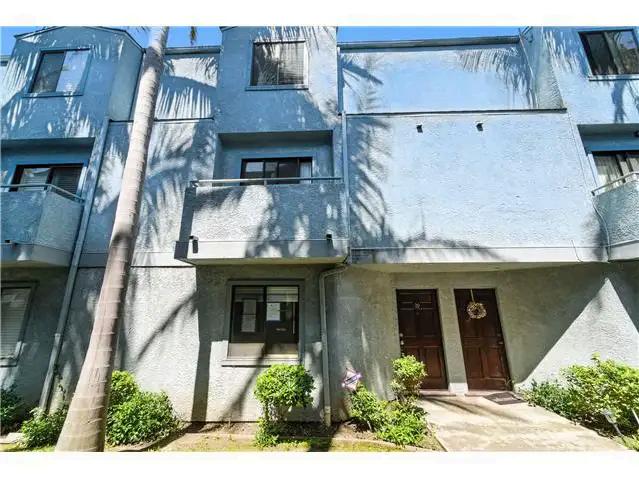
• 3838 TERRA GRANADA DR
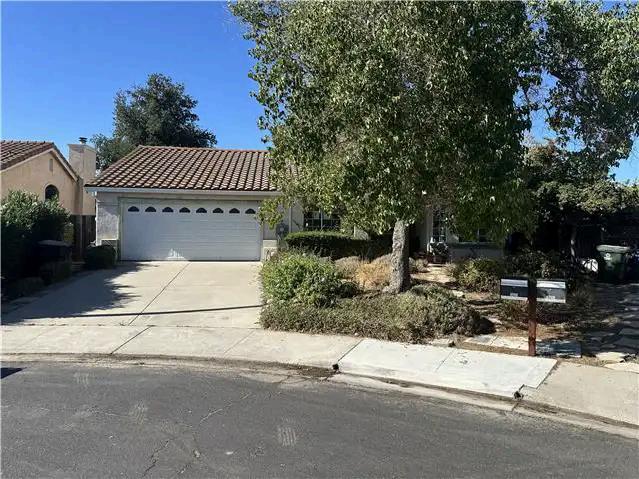
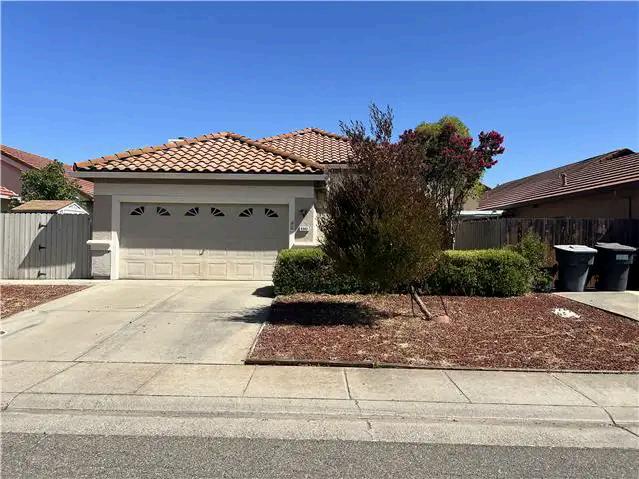
• 1330 STONEWOOD CT
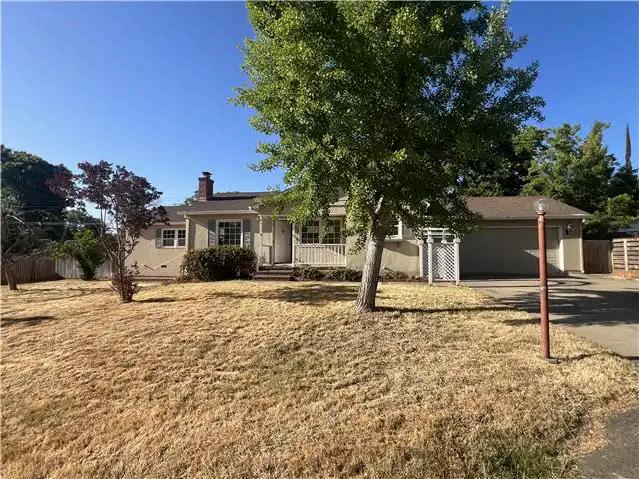
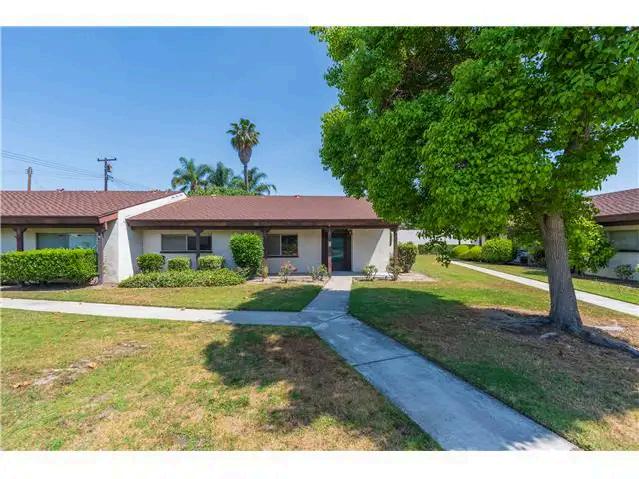
• 820 CHERVIL CT
• 20381 PET HILL DR
• 1542 DECKER CANYON
• 732 SPRECKELS RD
• 113 ASBURY DR
• 2637 COFFEE TREE
• 7310 CARDINAL RD
• 2823 STATE HIGHWAY
• 9 BEEDE WAY
• 204 E PLYMOUTH ST
• 9363 BOSCASTLE WAY
• 2011 W KATELLA AVE
• 411 E LINE ST
• 22600 SUNRISE CT
• 10014 RIVER BLUFF LN
• 441 STEIN WAY
• 739 NOB CIR
• 23273 ISABELLA ST

• 329 BROCKTON PL
• 1563 QUIET CRK
• 19240 MIDDLE CAMP
• 9600 WARWICK DR
• 12690 AUGUSTA WY
• 2786 PLEASANT ST
• 15776 CANDLEWOOD
• 1517 CHRISTINA AVE
• 2101 W TOKAY ST
• 15776 CANDLEWOOD
• 643 W BELLEVIEW
• 2418 DRILLER AVE
• 6370 HARBOUR TOWN
• 10776 TOLLIVER ST
• 3246 SHAMROCK
• 14870 WILDLIFE D
• 566 1ST STREET
• 16780 GREENRIDGE RD
• 447112 ROAD 620
• 2059 COUNTRY CLUB
• 26200 REDLANDS
• 2114 PALM AVE
• 10978 OAK RUN
• 10280 CIMARRON TRL
• 20882 3RD ST
• 43334 32ND ST
• 401 PILOT AVE
• 8173 VIBURNUM AVE
• 1274 DOS PALOS AVE

• 995 SANTA TERESA
• 18635 DOUGLAS DR
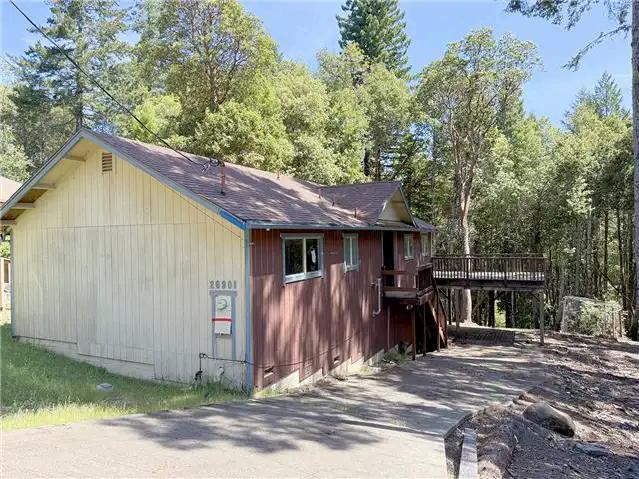
• 26901 BEAR DRIVE
• 14530 COLTER WAY
• 46390 ALAMOSA RD
• 570 S LYON AVE
• Editor’s Note
• What is my Home Worth?
• Eric Frazier Contact Information
• Eric Lawrence Frazier MBA - Principal Advisor

• 2025 Loan Limits
• 2/1 Buydown Rate Program
• Credit
• First Time Home Buyer
• For Realtors
• Foreclosure
• Informational
• Moving Up
• Rent vs Own
• Self Promotion
• Government: FHA
• Government: Streamline
• Government: USDA
• Government: VA

• HUD and Census Bureau Report New Residential Sales in July 2025
• HUD Unveils Exhibitors for the 2025 Innovative Housing Showcase on the National Mall
• HUD Announces Sponsors for the 2025 Innovative Housing Showcase
• ICYMI | HUD Regional Administrator Quinonez on HUD’s Support for Foster Youth in Texas
• Southern California Rentals in 2025: The Hidden Upside for OC Landlords Amid Supply Constraints
• Insurance & Climate Resilience: The New Hidden Costs of Owning in Orange County
• Mortgage Rate Psychology: OC Buyers Finding Their Balance Above 7%
• Regional Ripples: How LA and Inland Empire Housing Trends Are Reshaping Orange County
• The 40-Day Rule: What 40 Days on Market Means for Orange County Sellers and Buyers
• High-End Homes, Higher Expectations: What’s Driving OC’s Luxury Buyer Preferences in 2025
• Winter ‘Slow Start’: Timing Your Move for Orange County’s Spring Real-Estate Surge
• Investor Ownership Surge: Are Renters or Buyers Losing Ground in OC’s Tight Market?
• The CEQA Rollback Effect: What New State Laws Mean for Infill Housing in Orange County
• Luxury Coastal Adjustments: How Mid-2025 Pricing Realignment Opens New Buyer Opportunities in OC
Dear Reader,
September has arrived, and with it comes both a new season and a renewed sense of possibility The year is moving quickly, but there is still time to take meaningful steps toward your goals before 2025 winds down. In real estate, as in life, waiting for “perfect conditions” is often a trap what matters most is being prepared, informed, and willing to act when opportunity knocks
That’s where HUD Homes Magazine continues to play its role: to serve as your trusted resource, bringing clarity and direction in a housing market that can feel overwhelming.
Across the nation, HUD homes remain one of the most overlooked yet strategic entry points to homeownership. Whether you’re a first-time buyer eager to stop renting, a family searching for a new beginning, or an investor looking for value in today’s market, HUD properties offer advantages that are hard to replicate elsewhere. Many of these homes are priced below market value, and they’re available in communities of every kind urban neighborhoods, suburban developments, and even rural areas where affordability can stretch further.
In this issue, we’ve gathered everything you need to position yourself for success:
Current HUD listings from across the United States, complete with photos, pricing, and property details.
Direct access to HUDHomestore.gov, where you can track availability, learn bidding deadlines, and review updates in real time.
Expert insights to help you navigate the process, avoid common mistakes, and move strategically toward your goals
But more than just listings, September’s issue is an invitation. It’s a call to take stock of where you are today and where you want to be by year’s end Too many potential buyers hesitate because they believe the market is stacked against them, or because they are waiting for rates, prices, or circumstances to “settle ” The truth? There is no perfect moment The best moment is the one when you are informed, prepared, and ready to act with purpose.
Eric Lawrence Frazier, MBA - Principal advisor
That’s why I encourage you to approach this month’s magazine with both curiosity and determination Browse the listings carefully Share this resource with a friend, family member, or colleague who is tired of renting or missing opportunities Most importantly, don’t stop at browsing reach out. Let’s have a conversation about your unique circumstances, your financial readiness, and your long-term goals Together, we can build a plan that fits your vision and moves you closer to homeownership or investment success.
September is also a month of turning points. Children are back in school, workplaces are back in full swing, and households across the country are shifting gears from the pace of summer to the structure of fall It’s a natural moment to refocus and reset. Why not apply that same discipline to your real estate journey? With the right preparation now, you could finish this year stronger than you began.
This is still your time. HUD homes continue to provide real opportunities for those who are willing to take action and opportunities don’t last forever
So as you flip through this issue, don’t let it be just another magazine. Let it be the start of your next chapter Because the reality is simple: homeownership builds stability, creates generational wealth, and provides the peace of mind that renting rarely can. With HUD homes, that path may be closer than you think.
To your future, your home, and the life you’re building
Warm regards,
Eric Lawrence Frazier, MBA
Your HUD Homes Specialist & Trusted Advisor
CA DRE #01143484 | NMLS #451807
�� www ericfrazier com | www thepowerisnow com | www ericrazier net
�� Schedule your consultation: calendly.com/ericfrazier/real-estate-mortgageconsultation-clients
Eric Lawrence Frazier, MBA - Principal
advisor


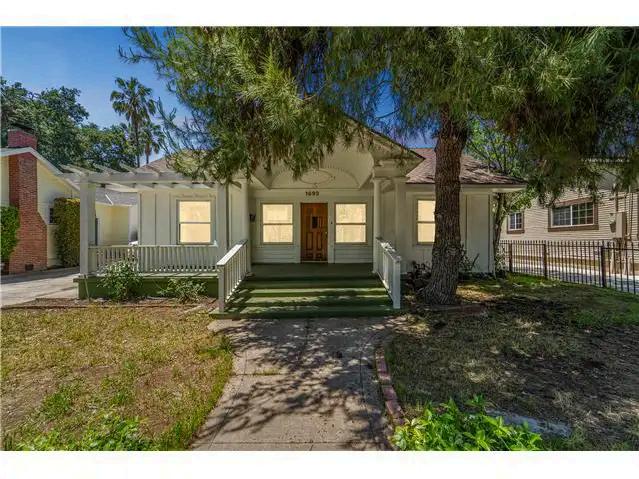


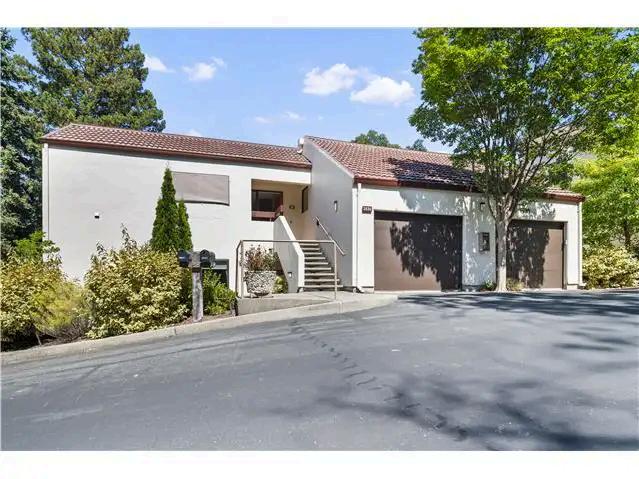


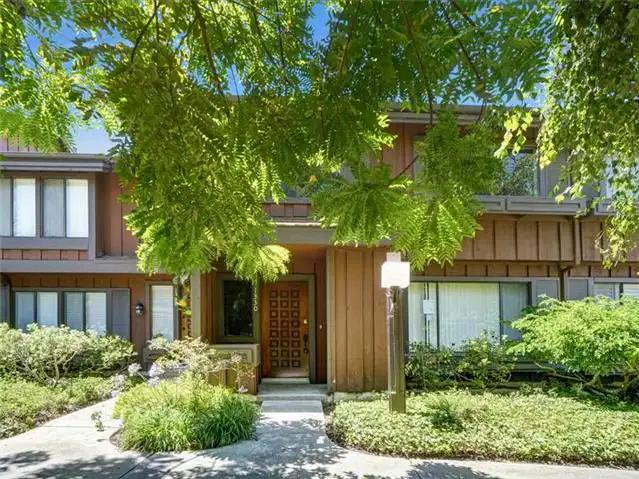


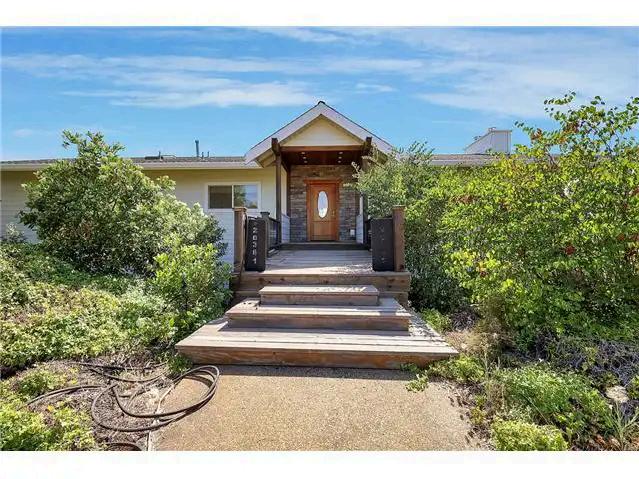




Eric Lawrence Frazier, MBA - Principal advisor












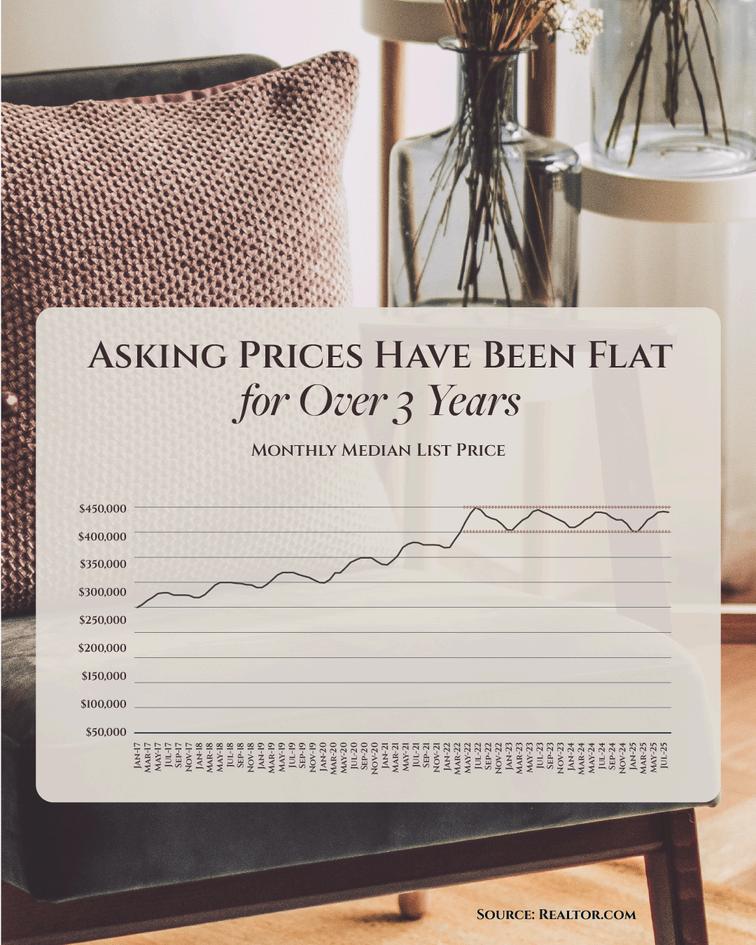

If your listing isn’t getting traction, here's what you need to realize Homes are sitting longer today And one of the reasons why?
Overpricing like it’s 2021 again. Unlike a normal market where list prices keep rising, they’ve actually been flat for over 3 years. And that’s a change worth paying attention to
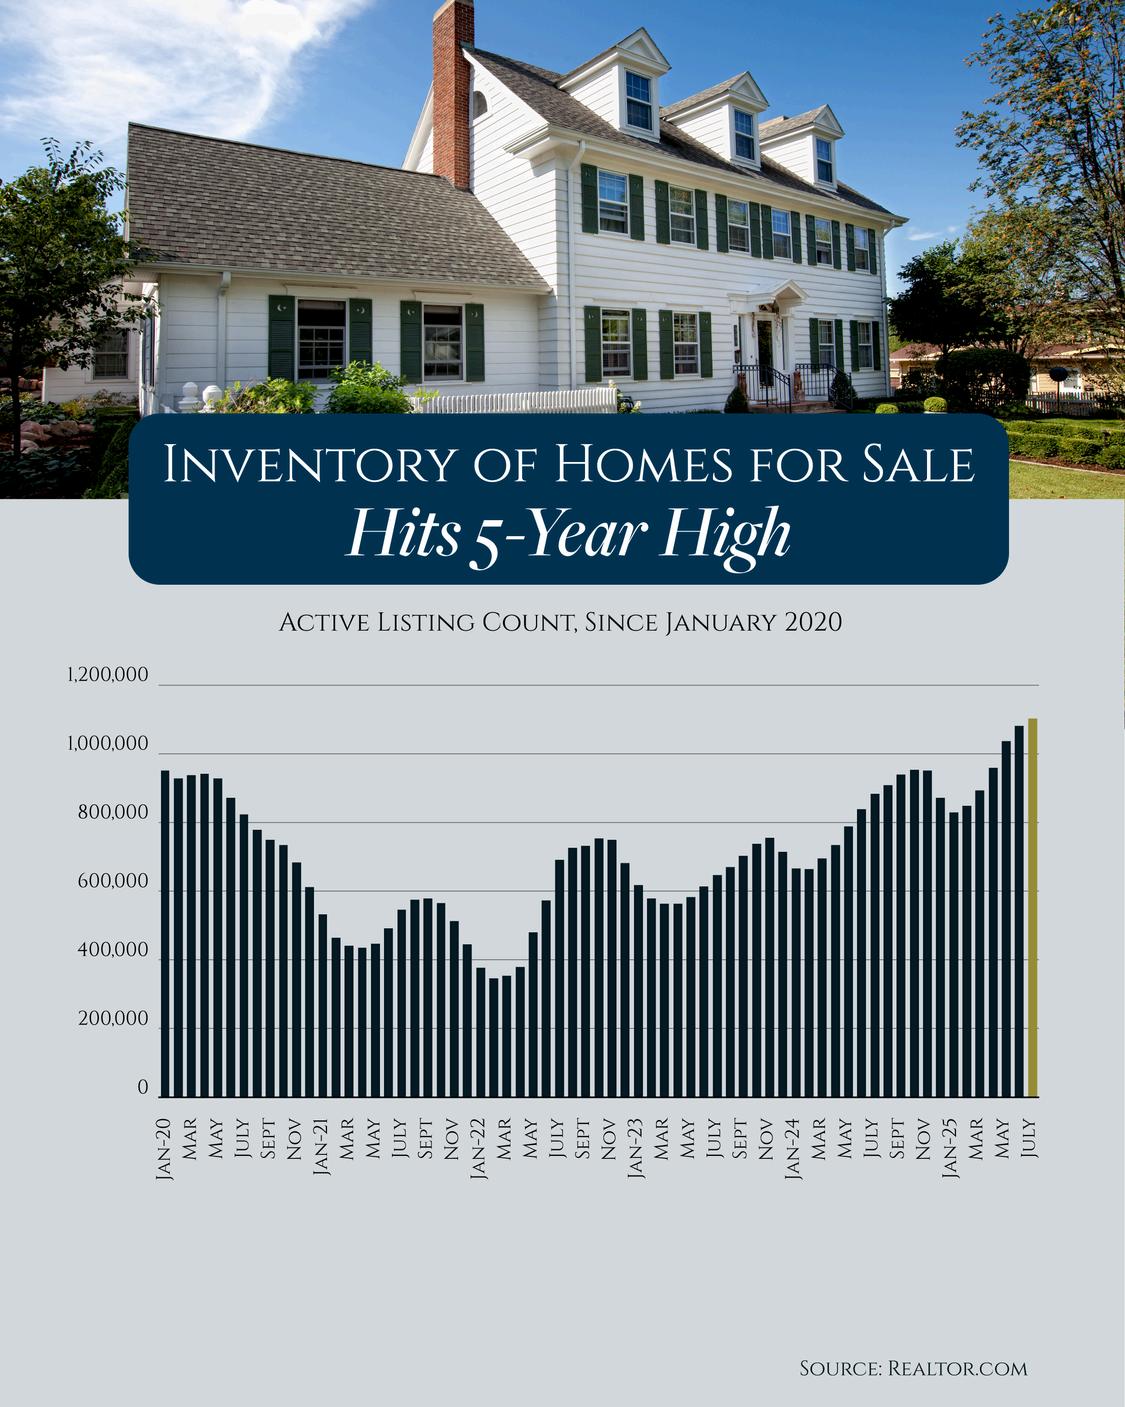
List prices have leveled off because buyers are being more selective as inventory has grown over the past few years There are more homes on the market, and sellers need to take note.
So, if your home isn’t getting showings or offers, take it as a sign to check in with your agent A small price adjustment could be the move that gets buyers through the door
Because in a market like this you can’t just wait it out and hope for the best. Patience won’t sell your house. But the right price will.

Eric Lawrence Frazier, MBA - Principal advisor












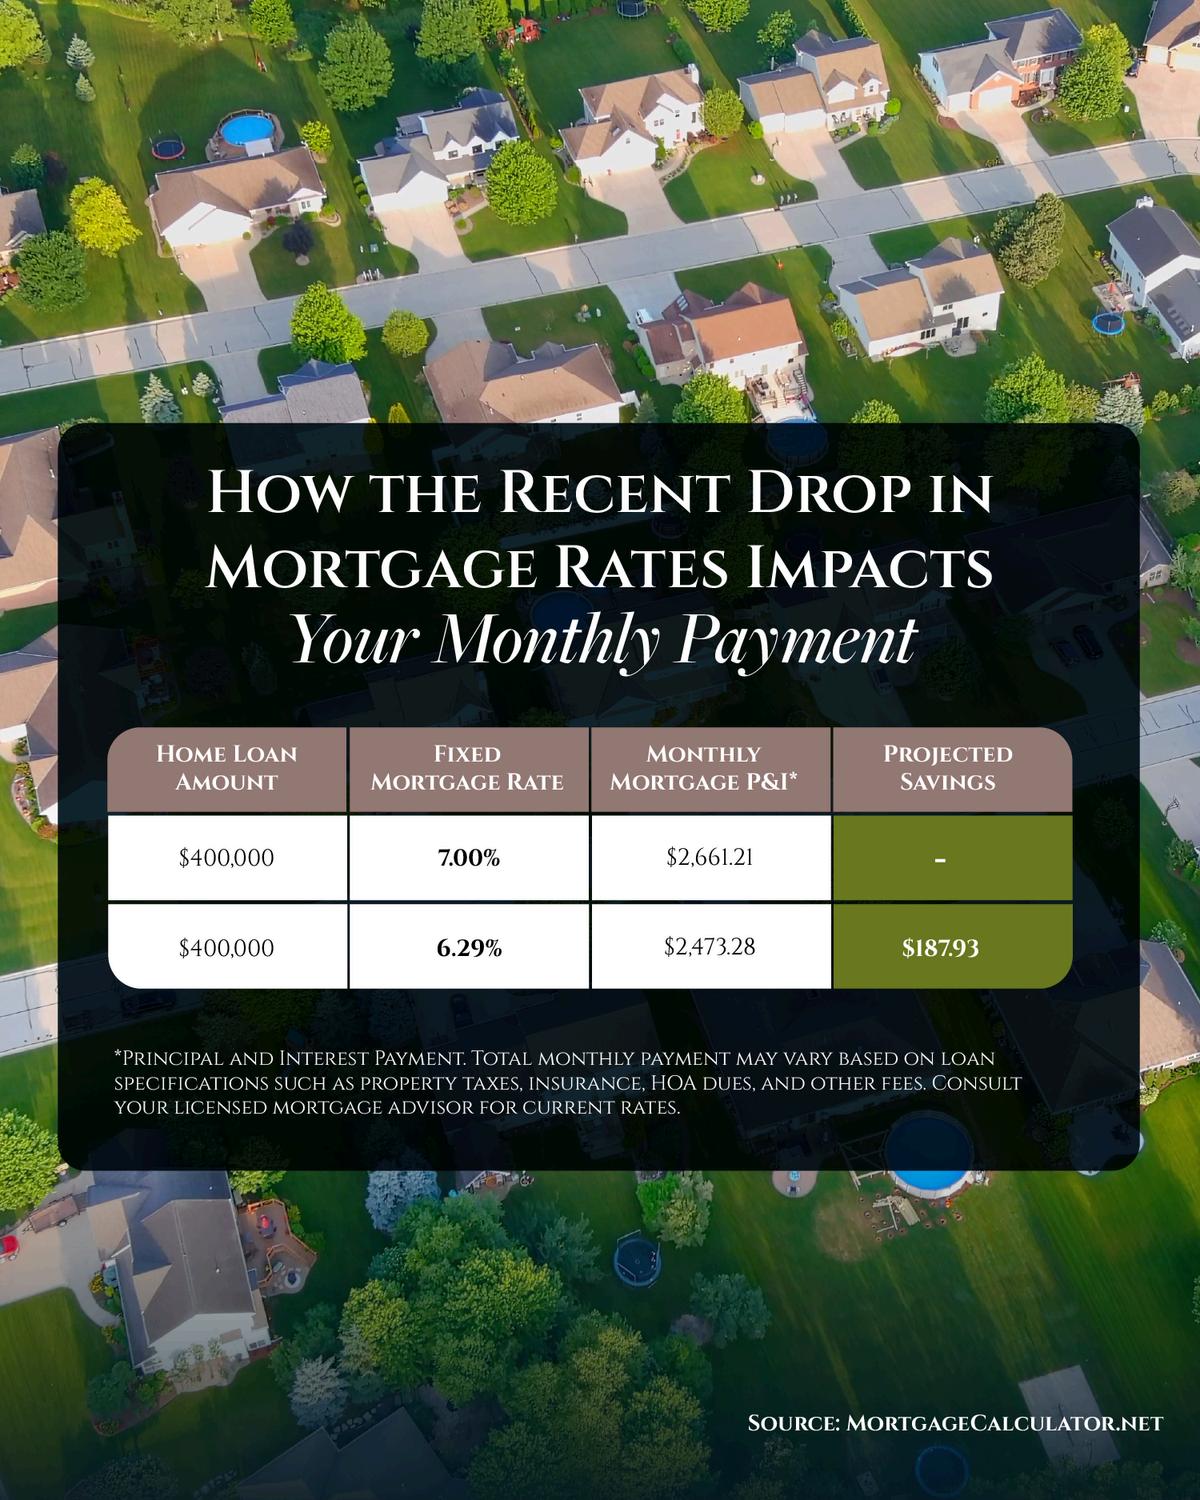
Mortgage rates just had their biggest one-day drop in over a year.
They fell to the lowest they've been since last October.
And that shift matters. Compared to when rates were at 7% earlier this year, that could mean your future monthly payment is now about $200 lower
Want to know how much you could save if you’re looking to buy? Message me and let’s talk it over.

Eric Lawrence Frazier, MBA - Principal advisor
mortgage


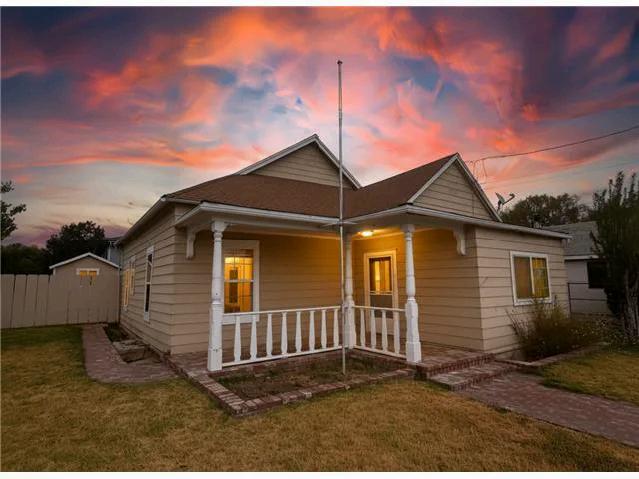


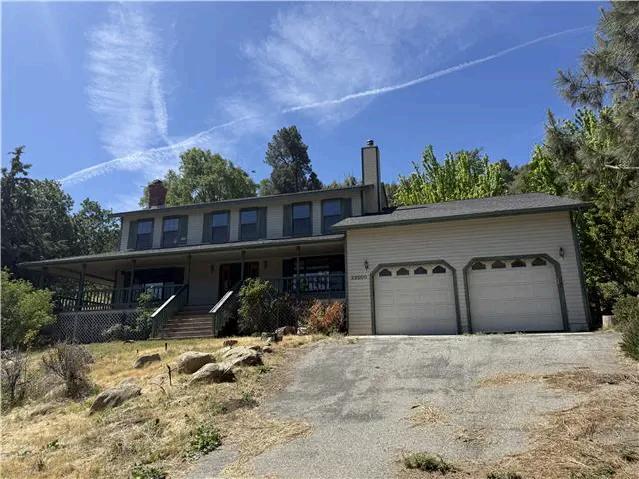


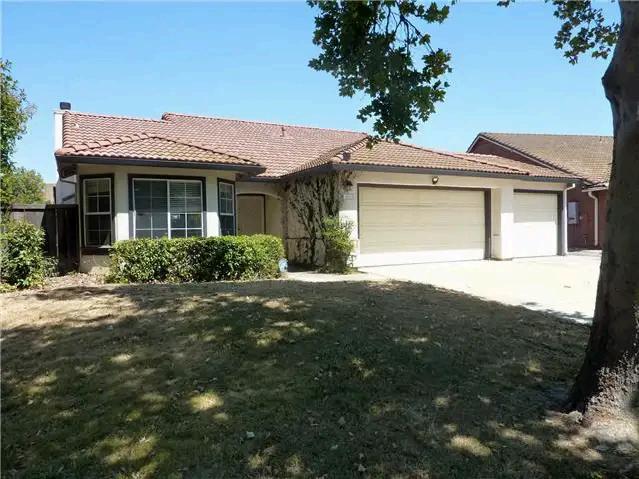







Eric Lawrence Frazier, MBA - Principal advisor




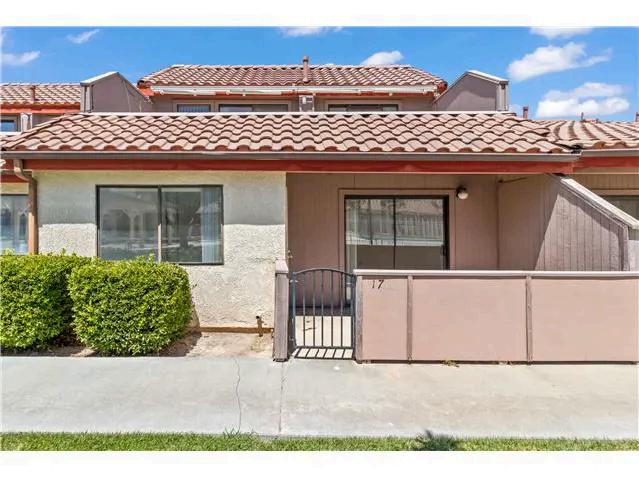


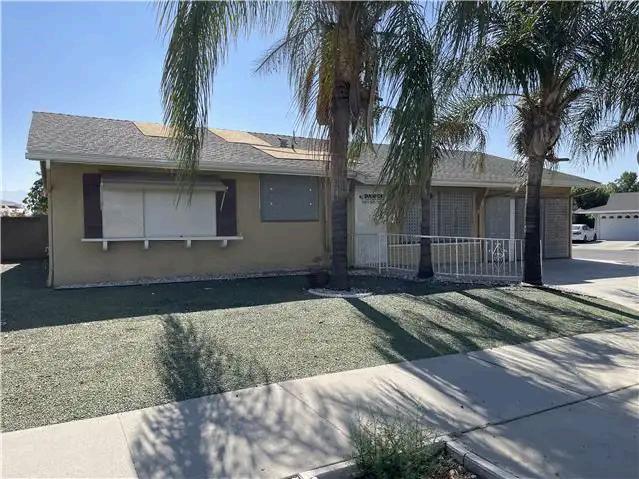


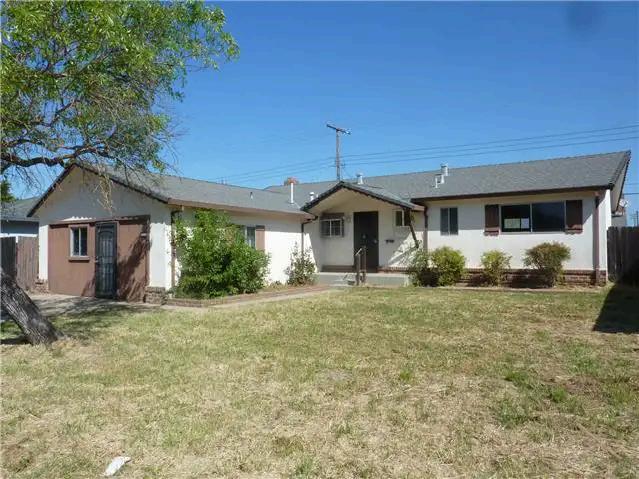


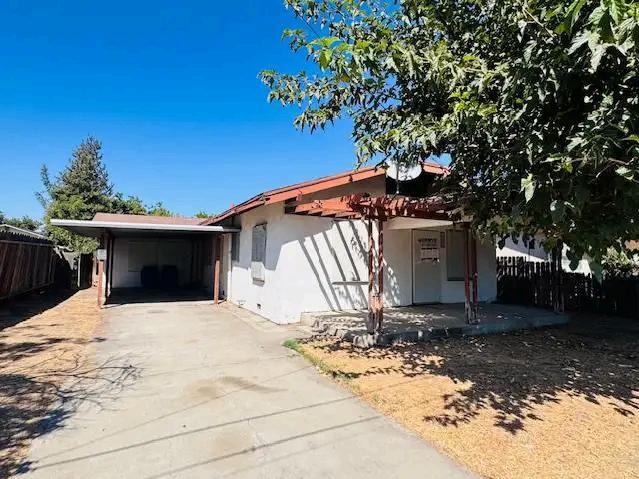


About half of homes are selling for under their asking price right now
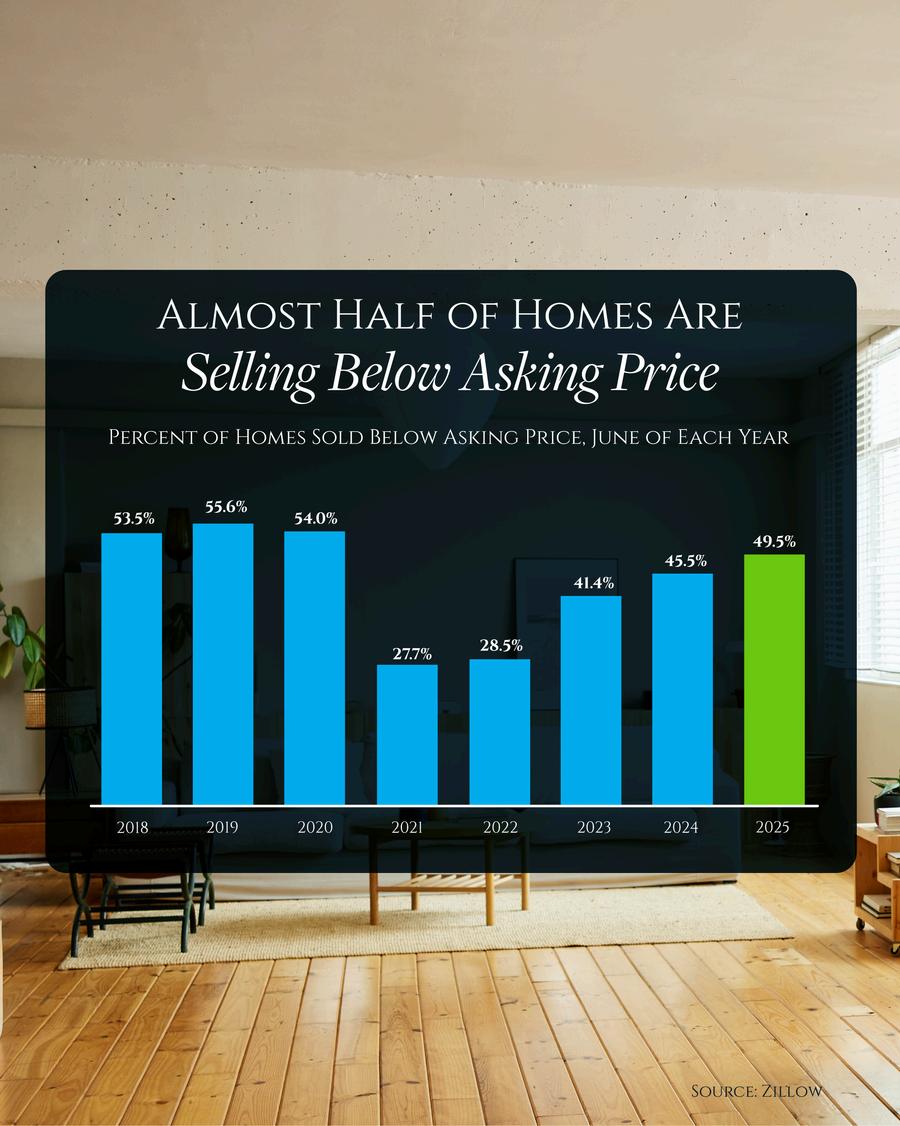
While that feels very different from the past few years, it’s actually a return to what’s considered normal for the market.
And the sellers who succeed today are the ones who recognize this shift. They price smart from day one, make their home stand out, and stay flexible when buyers ask for give-and-take.
You need to plan for the market we’re in, not the one we saw a few years back. And I can help

Eric Lawrence Frazier, MBA - Principal advisor













Reach out today for your digital copies
Your fall move just got easier The Fall Buyer & Seller Guides just dropped
These guides unpack the latest data, forecasts, and strategies you’ll need to make the right move in today’s market.
Find out what’s changing, what’s not, and what it all means for you as a buyer or seller this season
If you want the information serious buyers and sellers are using to stay ahead? DM me and I’ll send the guides your way.

Eric Lawrence Frazier, MBA - Principal advisor








Lawrence Frazier, MBA - Principal advisor






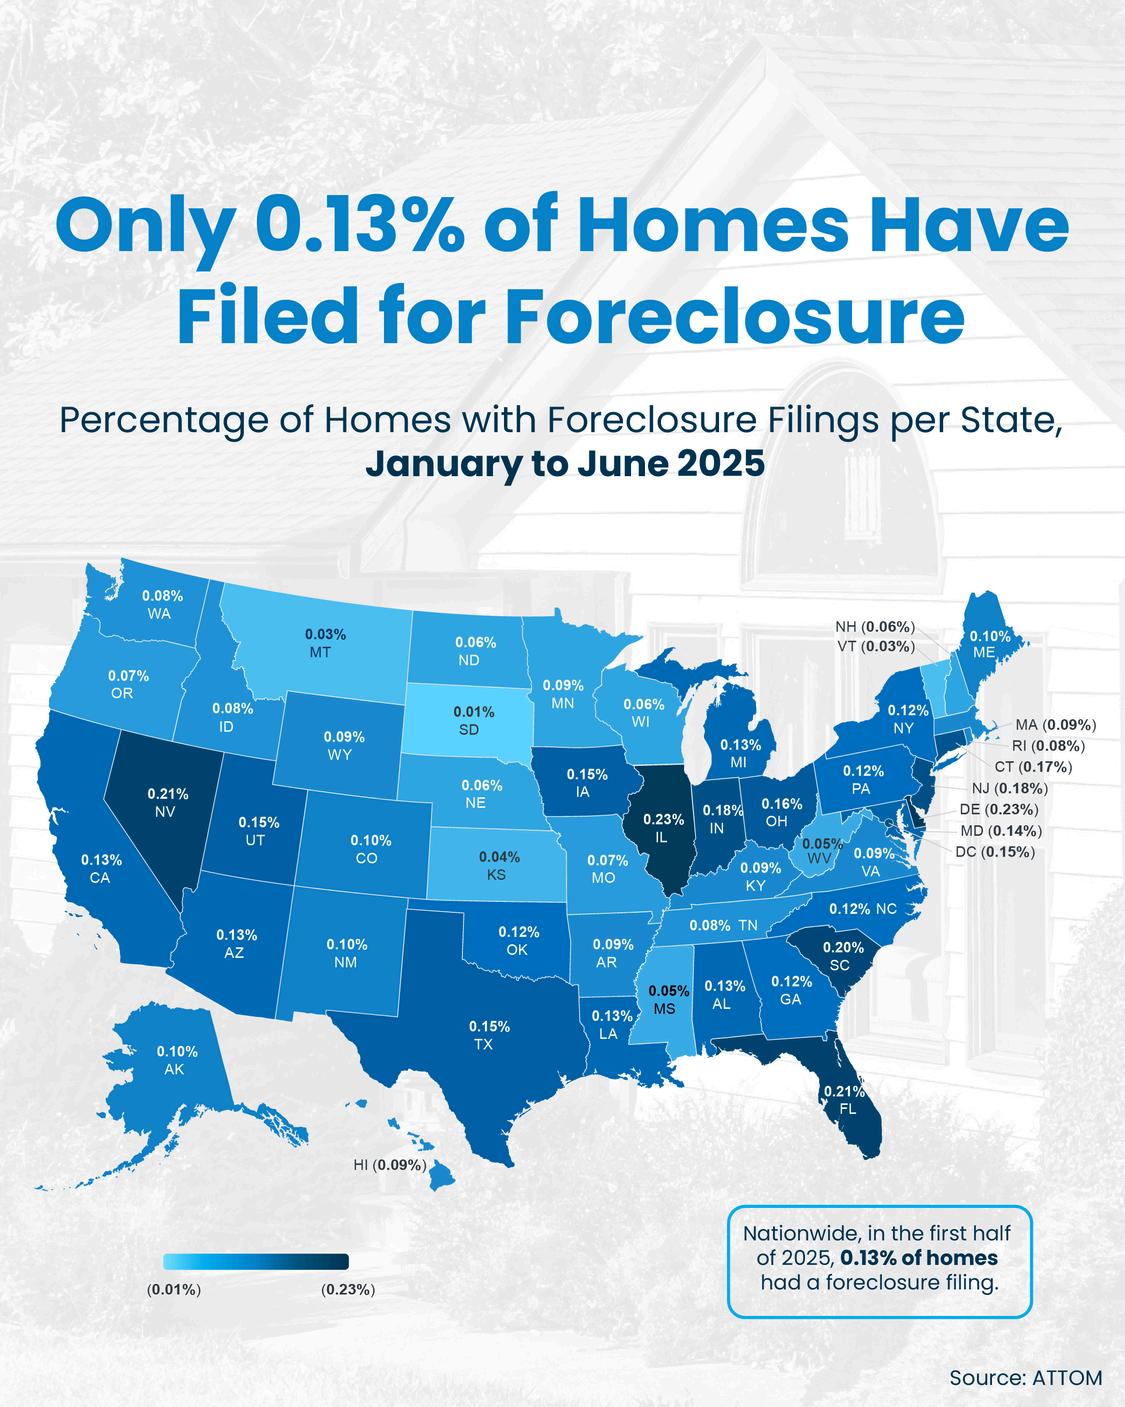
) g , g g y y y That’s a big difference.


So, don’t let the headlines scare you. I’ve got the data that can replace fear with facts. This isn’t a sign of trouble – and we’re nowhere near crash levels, no matter what the headlines seem to say.

Eric Lawrence Frazier, MBA - Principal advisor Real estate & mortgage | business | finance | CA


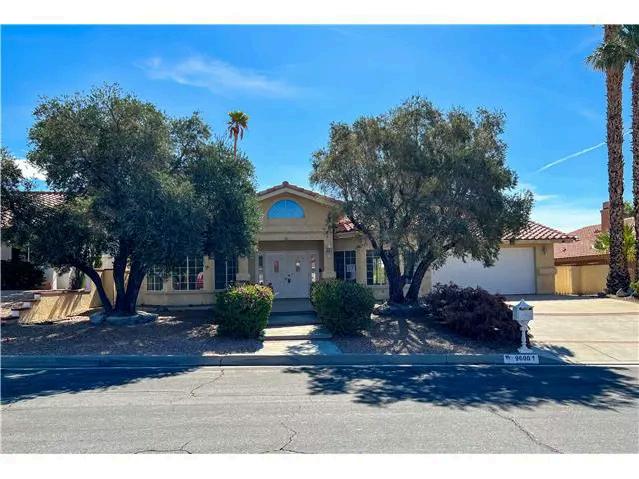


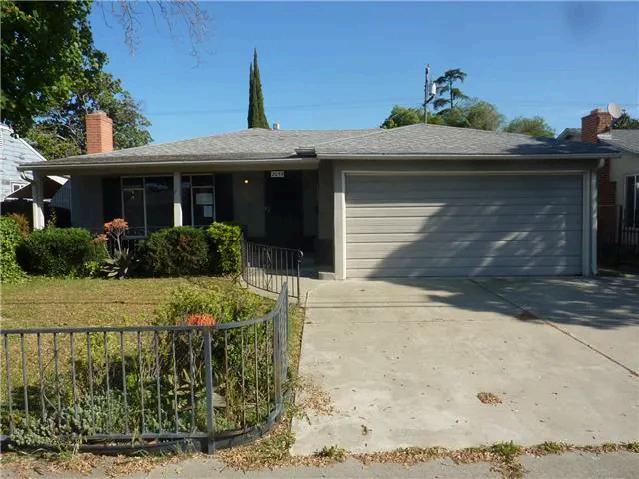


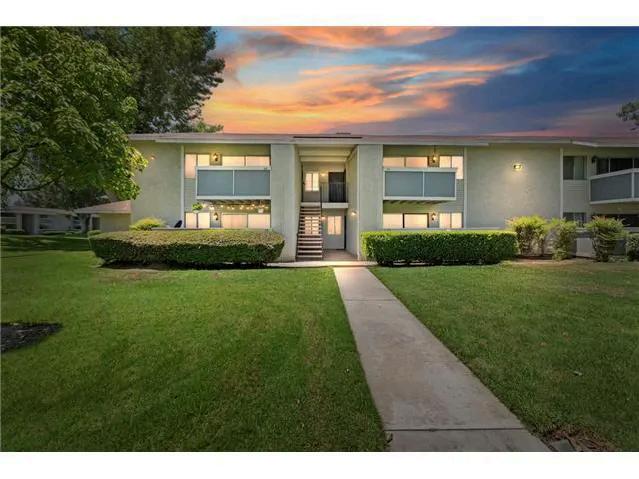


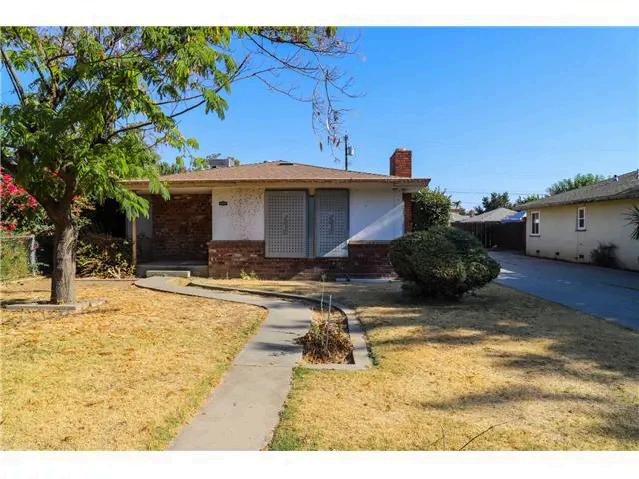


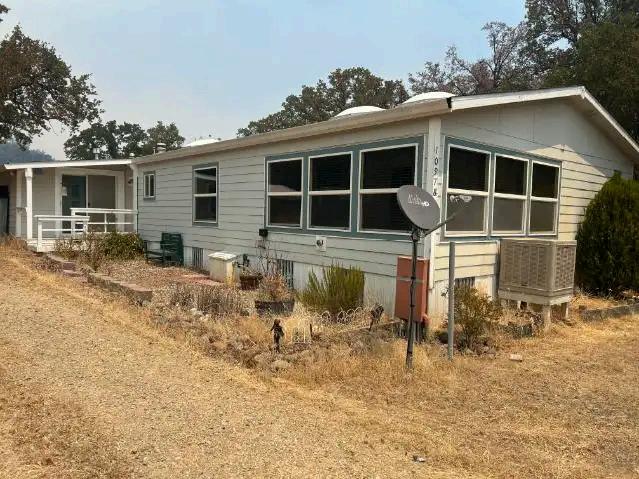


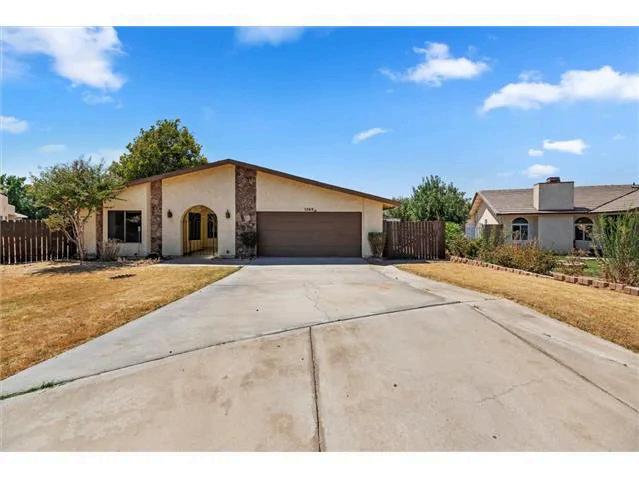


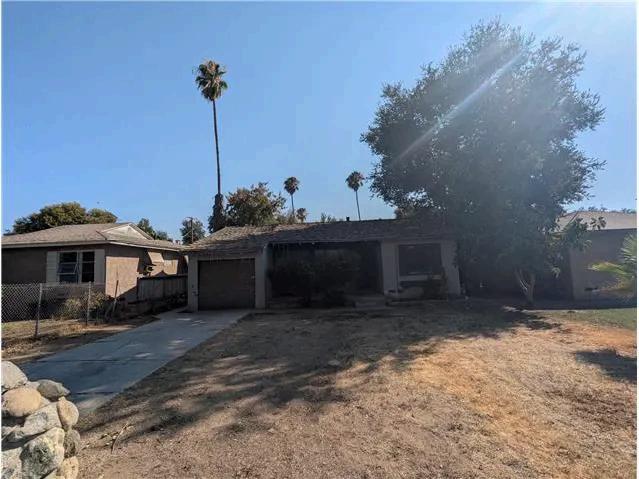


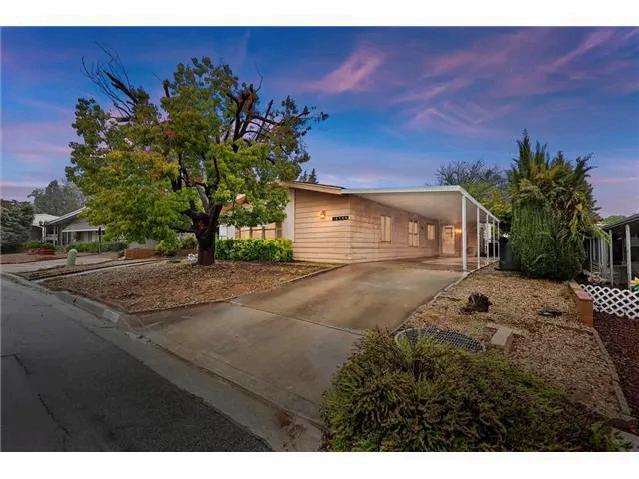


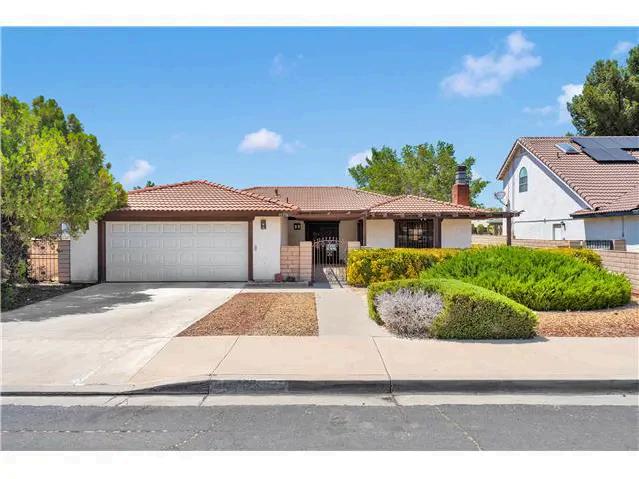


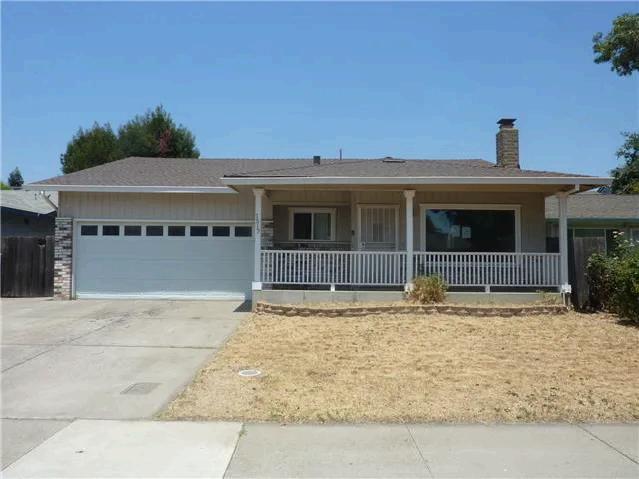


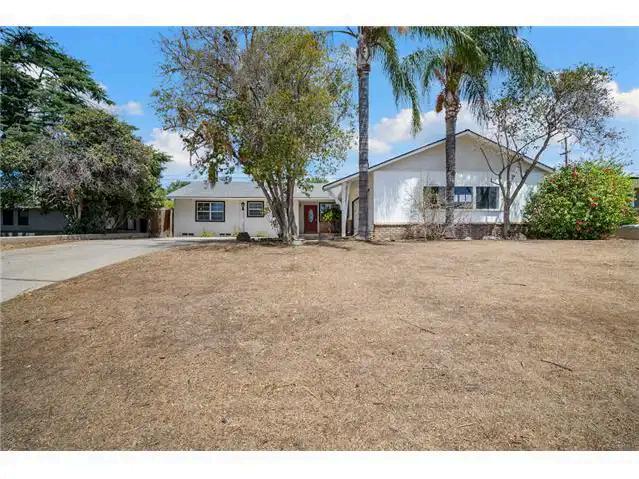


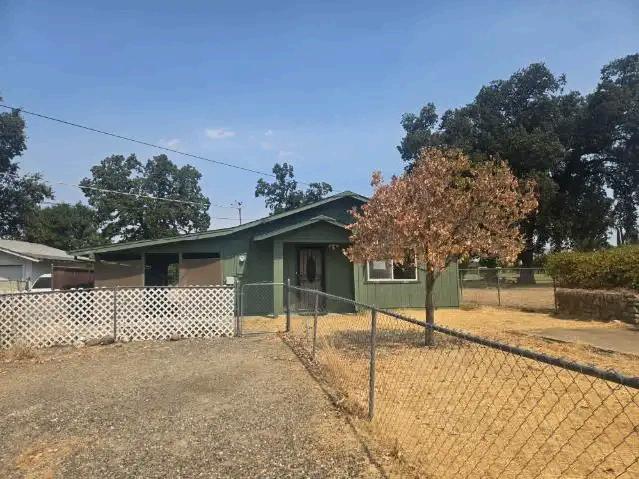


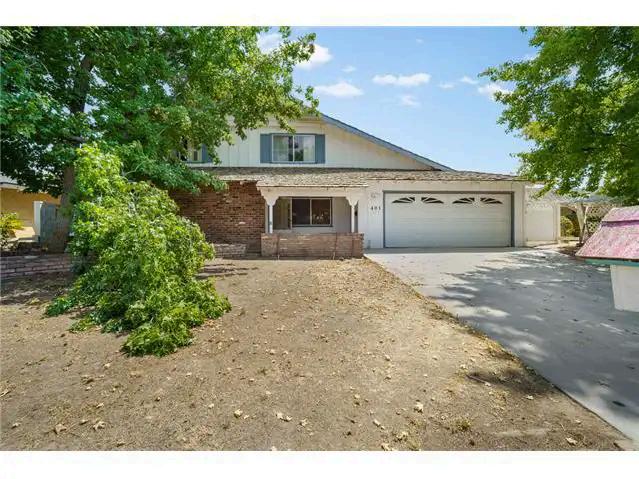


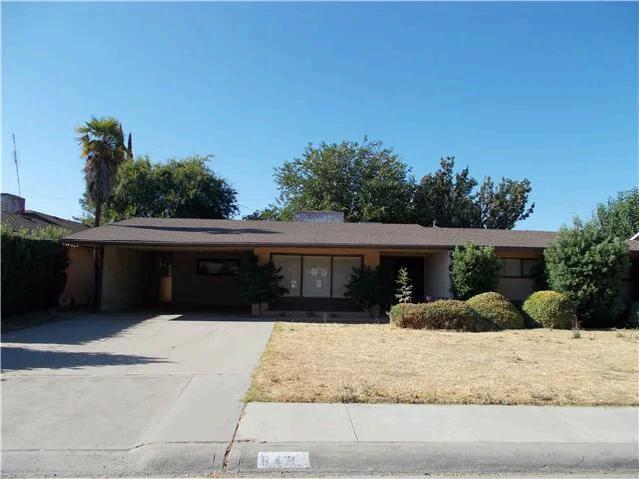





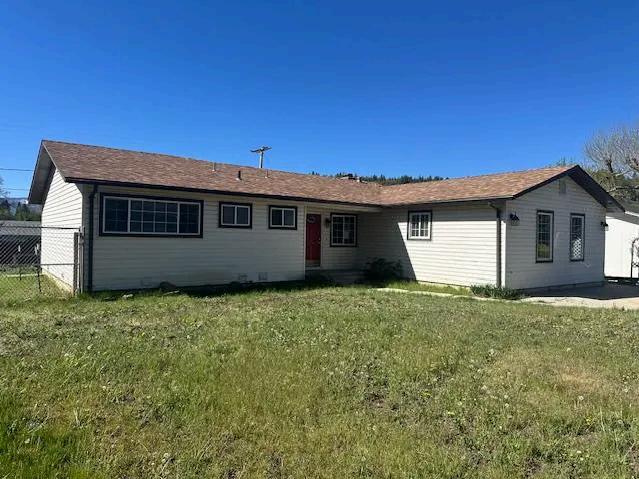


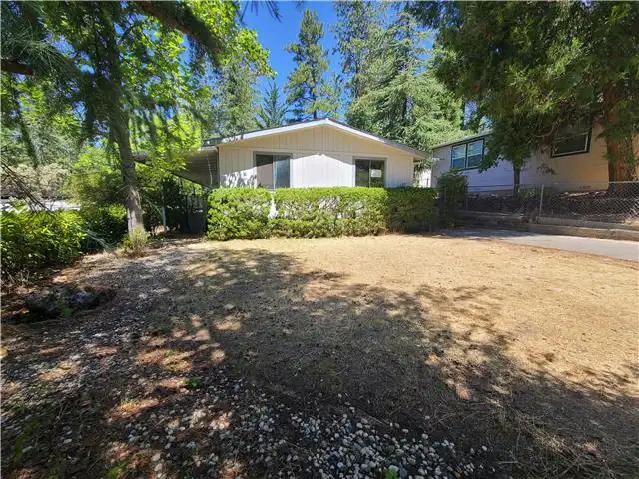






Lawrence Frazier, MBA










WASHINGTON (August 25, 2025) - The U.S. Census Bureau and the U.S. Department of Housing and Urban Development jointly announced the following new residential sales statistics for July 2025:
Sales of new single-family houses in July 2025 were at a seasonally-adjusted annual rate of 652,000, according to estimates released jointly today by the U.S. Census Bureau and the Department of Housing and Urban Development. This is 0.6 percent (±15.5 percent)* below the June 2025 rate of 656,000, and is 8.2 percent (±14.0 percent)* below the July 2024 rate of 710,000.
The seasonally-adjusted estimate of new houses for sale at the end of July 2025 was 499,000. This is 0.6 percent (±1.2 percent)* below the June 2025 estimate of 502,000, and is 7.3 percent (±5.7 percent) above the July 2024 estimate of 465,000. This represents a supply of 9.2 months at the current sales rate. The months' supply is virtually unchanged (±16.7 percent)* from the June 2025 estimate of 9.2 months, and is 16.5 percent (±19.0 percent)* above the July 2024 estimate of 7.9 months.
The median sales price of new houses sold in July 2025 was $403,800.

This is 0 8 percent (±5 9 percent)* below the June 2025 price of $407,200, and is 5.9 percent (±8.5 percent)* below the July 2024 price of $429,000. The average sales price of new houses sold in July 2025 was $487,300. This is 3.6 percent (±8.0 percent)* below the June 2025 price of $505,300, and is 5 0 percent (±8.6 percent)* below the July 2024 price of $513,200.
The August report is scheduled for release on September 24, 2025. View the full schedule in the Economic Briefing Room. The full text and tables for this release can be found here.
These statistics are estimated from sample surveys. They are subject to sampling variability as well as nonsampling error including bias and variance from response, nonreporting, and undercoverage. Estimated average relative standard errors of the preliminary data are shown in the tables. Whenever a statement such as “2.5 percent (±3.2%) above” appears in the text, this indicates the range (-0.7 to +5.7 percent) in which the actual percent change is likely to have occurred. All ranges given for percent changes are 90-percent confidence intervals and account only for sampling variability. If a range does not contain zero, the change is statistically significant. If it does contain zero, the change is not statistically significant; that is, it is uncertain whether there was an increase or decrease. The same policies apply to the confidence intervals for percent changes shown in the tables. Changes in seasonally adjusted statistics often show irregular movement. It takes 3 months to establish a trend for new houses sold. Preliminary new home sales figures are subject to revision due to the survey methodology and definitions used. The survey is primarily based on a sample of houses selected from building permits. Since a “sale” is defined as a deposit taken or sales agreement signed, this can occur prior to a permit being issued

An estimate of these prior sales is included in the sales figure On average, the preliminary seasonally adjusted estimate of total sales is revised about 3.2 percent. Changes in sales price data reflect changes in the distribution of houses by region, size, etc., as well as changes in the prices of houses with identical characteristics. Explanations of confidence intervals and sampling variability can be found on our website.
The Census Bureau has reviewed SOC monthly and quarterly tables to ensure appropriate access, use, and disclosure avoidance protection of the confidential source data (Disclosure Review Board (DRB) approval number: CBDRBFY25-0286).
The Census Bureau’s application programming interface lets developers create custom apps to reach new users and makes key demographic, socio-economic and housing statistics more accessible than ever before.
Receive the latest updates on the nation’s key economic indicators by downloading the FRED App for both Apple and Android devices. FRED, the signature database of the Federal Reserve Bank of St. Louis, now incorporates the Census Bureau’s 13 economic indicators.
* The 90 percent confidence interval includes zero. In such cases, there is insufficient statistical evidence to conclude that the actual change is different from zero.


Showcase Returns on September 6th-10th to Celebrate 250 Years of the American Home
WASHINGTON - The U.S. Department of Housing and Urban Development (HUD) announced more than 25 exhibitors that will showcase innovative housing and construction technologies on the National Mall during HUD’s annual Innovative Housing Showcase, taking place September 6th-10th.
“HUD is proud to champion public-private partnerships across the nation,” said HUD Secretary Scott Turner. “This year’s Innovative Housing Showcase is historic. We look forward to welcoming thousands of attendees as they join us in celebrating American ingenuity, endurance, and free market innovation to see firsthand how Americans are making housing great again – all as part of the America 250 Initiative.”
This year’s theme, “The American Home Is the American Dream,” spotlights the American Dream of homeownership, the future of housing innovation, and history-defining events in housing. Part of the America 250 Initiative, the showcase commemorates America’s 250th birthday and the American values of independence and opportunity.

Founded in 2019 by former HUD Secretary Ben Carson, the showcase will feature a variety of full-scale housing models including manufactured, 3D printed, and modular homes built by American companies from across the nation To view the list of 2025 exhibitors, click here: https://www.huduser.gov/portal/ihs/Exhibitors-2025.html.
A family-friendly event, the showcase is open to the public on the National Mall and expected to attract thousands of attendees, including Members of Congress, industry leaders, and community stakeholders. Visitors can view and enter exhibits on the Mall and attend expert-led panel discussions highlighting housing innovations. The panels are open to the public for in-person or virtual attendance. Register here: https://www.huduser.gov/portal/event/ihs2025.html
To view photos from past showcases, please visit IHS Past Showcases | HUD USER. For more information, please visit the Innovative Housing Showcase webpage.

The Historic Showcase Returns to the National Mall September 6th - 10th Highlighting 250 Years of Innovation in American Housing
WASHINGTON - Today the U.S. Department of Housing and Urban Development (HUD) announced the presenting sponsors for the 2025 Innovative Housing Showcase: The International Code Council (ICC), The Manufactured Housing Institute (MHI), The Structural Building Components Association (SBCA), and The Home Depot.
As a proud part of the America 250 Initiative, the showcase will feature the theme, “The American Home Is The American Dream,” celebrating the evolution of homeownership over 250 years and how the American home is representative of the American values of independence, opportunity, and the unshakable drive to build a better life.
“This year’s Innovative Housing Showcase puts the spotlight on American grit and free market innovation - a powerful reminder that free enterprise, not big government, drives the American Dream of Homeownership,” said HUD Secretary Scott Turner. “HUD will continue to spotlight solutions that support quality, affordable homeownership opportunities for hardworking Americans. Together, we will usher in the Golden Age of American Homeownership.”

Founded in 2019 by former HUD Secretary Ben Carson, the showcase will feature a variety of full-scale housing models including manufactured, 3D printed, and modular homes from across the country displayed on the National Mall.
“The International Code Council is committed to supporting and facilitating the innovations necessary to make housing more affordable,” said John Belcik, Chief Executive Officer, International Code Council (ICC). “We are pleased to join HUD and other sponsors to highlight what is currently possible, and the policies, codes and standards that will continue to facilitate future progress.”
“MHI is excited to partner again with HUD to bring the 2025 Innovative Housing Showcase to the National Mall in celebration of the Showcase’s fifth year running and America’s 250th birthday. HUD Code manufactured homes have been bringing quality, attainable homeownership to Americans nationwide for fifty years MHI welcomes the opportunity to demonstrate the beauty and innovation in design, scalability, and efficiency of today’s manufactured homes and the solutions they offer to address the nation’s housing supply needs,” said Lesli Gooch, Chief Executive Officer, Manufactured Housing Institute (MHI).
“SBCA is excited to return to the National Mall as a co-sponsor and exhibitor for HUD’s Innovative Housing Showcase," said Jess Lohse, Executive Director, Structural Building Components Association (SBCA).
“This event is a powerful platform for sharing solutions to the housing challenges our country faces. As the voice of the structural building components industry, SBCA is proud to demonstrate how trusses and wall panels provide scalable, efficient building methods supporting greater housing availability, accessibility, and affordability. We’re honored to join HUD and our fellow co-sponsors in presenting methodologies and technologies that are moving construction and housing forward.”
“We’re proud to sponsor the Department of Housing and Urban Development’s Innovative Housing Showcase,” said Chip Devine, Senior Vice President of Pro Sales, The Home Depot. “At The Home Depot, we’re dedicated to driving growth in the housing industry by equipping professionals with the resources, tools, and partnerships they need to succeed. This event underscores the importance of advancing housing solutions nationwide, and addressing challenges like the skilled trades gap, which continues to be a barrier to progress.”
A family-friendly event, the showcase is open to the public on the National Mall and expected to attract thousands of attendees, including Members of Congress, industry leaders, and community stakeholders. Visitors can view and enter exhibits on the Mall and attend expert-led panel discussions highlighting housing innovations. In years past, the showcase has attracted thousands of attendees from across the country. To view photos from past showcases, please visit IHS Past Showcases | HUD USER For more information, please visit the Innovative Housing Showcase webpage.


HUD Celebrates the Sixth Anniversary of the Foster Youth to Independence Initiative
TEXAS - U.S. Department of Housing and Urban Development (HUD) Southwest Regional Administrator Ashlea Quinonez penned an opinion piece discussing the continued impact of HUD’s investment in youth transitioning out of foster care in Texas. This year marks the sixth anniversary of HUD’s Foster Youth to Independence program, which gives these vulnerable youth the tools and resources they need to achieve success and selfsufficiency as they transition to adulthood.
“[HUD] has delivered more than $5 million in investment nationwide since President Trump returned to the White House,” wrote HUD Southwest Regional Administrator Ashlea Quinonez. “Nearly $250,000 of that investment went to Texas foster youth, providing them with stable temporary housing and supportive services as they build their futures.”

Read the full op-ed below:
Each year, more than 20,000 young Americans transition from foster care, many with no safety net, no stable housing, and no clear path forward. It’s estimated a quarter of them become homeless shortly after leaving the foster care system. For these youth, the transition from foster care to adulthood marks a crossroads one that can either lead to opportunity or derail their chance to achieve the American Dream.

The U.S. Department of Housing and Urban Development (HUD) recognizes that this transition point is critical. It’s a moment when targeted investment can transform futures.
That’s why, in 2019, HUD launched the Foster Youth to Independence (FYI) initiative. FYI provides local public housing authorities funding to help young Americans transitioning from foster care avoid homelessness and begin their new chapters as responsible adults. In addition to temporary rental assistance, the program includes support for services like skills training and job preparation. HUD’s investment in foster youth is equipping them with tools for success so they can enjoy housing stability, dignity, and independence.
This year, we are celebrating the sixth anniversary of this important program, which has delivered more than $5 million in investment nationwide since President Trump returned to the White House. Nearly $250,000 of that investment went to Texas foster youth, providing them with stable temporary housing and supportive services as they build their futures.
As HUD’s Southwest Regional Administrator, I have witnessed firsthand the impact HU


Southern California’s housing market has always been a complex mix of opportunity and challenge. In 2025, that balance is leaning in favor of landlords especially in Orange County. Sales activity has stabilized, home prices continue to edge upward, and rental demand shows no signs of slowing down. While affordability pressures are hitting renters hard, they are also creating an environment where rental properties are increasingly valuable assets.
Orange County landlords today find themselves in a position of strength, supported by low vacancy rates, rising rents, and limited new supply. For investors looking at where to place their capital, Orange County offers both stability and growth potential This article will explore the key drivers shaping this market, including rental demand, supply constraints, affordability challenges, and the implications for landlords and new investors alike.
Vacancy rates are often the clearest measure of rental market health. As of 2025, Orange County’s multifamily vacancy rate has dropped to 3.6%, a sharp decline from mid2023 levels of 5.4% (Matthews, 2025). Such a low figure indicates that most available rental units are quickly occupied, giving landlords greater leverage in setting prices.
Alongside shrinking vacancies, rents have soared. Average asking rents in Orange County reached $2,730 per month by Q2 2025 representing a 25% jump since late 2019 (Matthews, 2025). This growth not only reflects scarcity but also the enduring appeal of the region, from its economic opportunities to its quality of life. For landlords, this translates into stronger, more reliable income streams.

While affordability challenges make renting more common, the home sales market in Orange County hasn’t weakened it has stabilized. Median listing prices hovered around $1.3 million in late 2024, posting steady year-over-year growth of about 4% (ManageCasa, 2025). Properties still move quickly, often in a matter of weeks, showing that buyer demand remains intact at higher price points.
Statewide, the median home value reached $884,350 in March 2025, up 3.5% from the previous year (ManageCasa, 2025). For landlords, this dual trend of strong sales and persistent affordability barriers creates a “sweet spot”: property values are appreciating, while renters unable to buy ensure a stable tenant base.
Orange County continues to suffer from underbuilding relative to need. Over the past year, 633 apartment units were absorbed, but only 465 new units were delivered to the market (Matthews, 2025) That imbalance keeps vacancy rates tight and demand consistently high.
For landlords, this is a critical factor. Limited new construction means less competition from fresh rental stock. Unlike in some markets where an influx of new units puts pressure on rents, Orange County landlords benefit from a constrained pipeline that helps keep rents climbing and turnover low.
Orange County’s affordability challenges are significant, and they feed directly into rental demand. The average renter would now need to earn nearly $55 per hour—more than three times the state’s minimum wage to avoid being cost-burdened (Matthews, 2025).
With home values averaging over $1.6 million and rents topping $3,000 per month, the region ranks among the most expensive places to live in the country.
These pressures force many households, including middle-income earners, to remain renters longer than they might prefer. For landlords, this reality ensures a steady pipeline of demand across income brackets. The rental market has become less of a stepping stone to ownership and more of a long-term housing solution for a growing segment of the population.
Several key advantages stand out for landlords and new investors entering the Orange County rental market in 2025:
Predictable income: Low vacancies and rising rents guarantee more reliable monthly cash flow.
Asset appreciation: With steady home price growth, property owners benefit from equity gains in addition to rental income
Limited competition: Tight supply keeps market conditions favorable, ensuring less downward pressure on rents.
Investment opportunities: New investors can still find strong returns by targeting smaller multifamily properties or strategically located single-family rentals that remain in high demand.
The combination of rental demand and limited supply creates a market where landlords can maintain strong performance even in an environment marked by affordability stress.
The Southern California rental market in 2025 offers clear advantages for Orange County landlords. Home prices continue to rise, sales remain stable, and vacancies are at their lowest levels in years. While affordability pressures create challenges for renters, those same pressures reinforce long-term demand for rentals.
For existing landlords, the environment promises sustained income and appreciation. For new investors, opportunities still exist for those who recognize the strength of this market and are prepared to act. In short, 2025 may be remembered as a year when affordability constraints turned into hidden upside for Orange County property owners.
If you’re considering how these trends could benefit your real estate portfolio, expert guidance can make all the difference. Let’s talk strategy, explore opportunities, and position you for success in today’s market

Eric Lawrence Frazier, MBA - Principal advisor


Homeownership in Orange County has long been a symbol of stability sunlit neighborhoods, strong community ties, and a landscape that draws in families and professionals alike. But beneath the serene surface, a complex financial burden is quietly growing Rising insurance premiums, expanding wildfire and flood risks, and shifting state regulations are imposing hidden costs that buyers and sellers must now factor into every deal. The stakes are especially high in Orange County, where high-value coastal and inland properties face escalating environmental threats.
In this article, I’ll explain how three major forces insurance cost hikes, heightened climate risk, and evolving regulations—are reshaping ownership expenses in Orange County. I’ll break down what each trend means for both sellers and buyers and offer practical strategies to navigate these challenges. Let’s get into it.
Home insurance rates across California, including Orange County, are climbing sharply. A new regulatory shift permits insurers to use forward-looking catastrophe models incorporating wildfire, flood, and other climate data to set premiums more precisely. Companies like CSAA have already filed for rate increases around 6.9% citing wildfire severity and inflation.
Further pressure comes from allowing insurers to pass their own reinsurance costs to consumers. Analysts estimate potential premium increases of up to 40%, especially in high-risk areas. The FAIR Plan California’s insurer of last resort is stretched thin, pushing more homeowners toward expensive and limited statewide coverage

Orange County properties are increasingly exposed to wildfire risk and, in some coastal pockets, flood hazard. California’s Sustainable Insurance Strategy addresses this by requiring insurers who use catastrophe models to commit to writing policies in high-risk zones closing gaps in coverage but also paving the way for targeted rate increases. Before this, many insurers withdrew from high-risk markets entirely.
While these models help insurers price risk more precisely, they also mean homeowners living in vulnerable areas now face sharply higher costs driven by real risk, not just market corrections.
California’s Insurance Commissioner, Ricardo Lara, has launched a Sustainable Insurance Strategy that integrates catastrophe modeling and mandates increased policy writing in wildfire-prone areas up to 85% of an insurer’s market share in those zones. The goal is to restore access to private insurance, reducing reliance on the FAIR Plan. But the tradeoff is clear: homeowners may bear higher premiums in exchange for coverage availability.
While these reforms aim for long-term market stability, the short-term impact is rising costs for homeowners, especially those unwilling or unable to invest in home-hardening and mitigation
Homeowners and buyers can take concrete steps:
Invest in wildfire and flood mitigation like fire-resistant materials or improved drainage to qualify for discounts under new insurer programs. Shop multiple insurers and compare policies carefully coverage, rates, and mitigation credits vary widely.
For coastal or inland flood-prone properties, consider supplemental flood insurance beyond standard home policies.
Sellers should:
Disclose known rising insurance costs and climate risk implications to set realistic expectations.
Highlight any home-hardening improvements as selling points mitigation measures can attract more buyers and help secure better rates.
Owning property in Orange County today means weighing more than just location and design Rising insurance premiums, driven by climate-informed risk modeling and shifting state regulation, are quietly elevating ownership costs. At the same time, increasing wildfire and flood threats make mitigation an essential investment not a luxury.
Buyers and sellers who understand these financial forces and take proactive steps can better manage costs and maintain property value in a changing landscape. The key is staying informed, acting strategically, and treating resilience as both a shield and a selling point.
Let’s navigate these challenges together. As your trusted advisor in business and wealth, I’m here to help you understand the financial landscape of real estate with clarity and confidence.

Eric Lawrence Frazier, MBA - Principal advisor Real estate
mortgage


Orange County’s housing scene is known for its pace and price but today, it's the psychology behind the market that’s capturing attention. With mortgage rates climbing above 7 percent, prospective buyers in OC are rethinking not just if they’ll buy but how they’ll buy. The jump in financing costs has forced a shift in mindset: rather than waiting indefinitely for an ideal rate, many are embracing new strategies to secure homes despite elevated rates
In this article, we'll explore how OC buyers are adapting to what’s become a new normal. We’ll examine how they're comparing loan options more carefully, choosing to “marry the house and date the rate,” and making smart use of tools like buydowns and adjustable-rate mortgages (ARMs) to manage affordability. This isn’t about navigating a short-term hiccup it’s about evolving buyer behavior in response to a lasting shift in conditions.
By the end, you’ll understand the practical adjustments OC buyers are making—and why those bold moves may define the current market landscape.
For years, buyers chased the stability of 30-year fixed-rate loans. But with rates now above seven percent, that certainty comes at a steep cost. Orange County homebuyers accustomed to ultra-low financing are now exploring alternative paths Temporary buydowns, where buyers or sellers pay up-front to reduce the interest rate for the first years of the loan, are seeing renewed interest. In some cases, the rate is reduced by 1%–3% in early years lowering initial payments while buyers adjust financially.

Similarly, ARMs are gaining traction again. These start with a lower rate, fixed for a set period (5, 7, or 10 years), before adjusting. If rates stabilize or fall during that time, buyers can refinance or ride the lower payments before resets. This “marry the house, date the rate” mindset is appealing to many buyers in fast-moving OC markets giving them time to lock in pricing while maintaining flexibility.
Some buyers are choosing to act quickly closing on homes even with higher rates rather than wait for an uncertain dip. They’re locking in purchases while prices remain competitive, then refinancing later if rates fall or their finances improve. A recent Bank of America survey shows rising mortgage rates have made buyers uncertain, yet many believe rates will drop and are ready to revisit financing after closing.
An often-overlooked psychological factor is the “lock-in effect.” Many OC homeowners who secured ultra-low rates during the pandemic are reluctant to move because selling means giving up that rate for a new mortgage above 7%. This reluctance reduces housing supply, pushing prices higher despite cooling demand. Meanwhile, limited new construction and steep borrowing costs for developers further tighten inventory, sustaining a market that demands creative financing solutions.
In OC’s high-cost environment, even small rate changes have big real-world effects. On a $1.5 million loan, going from 6% to 7% raises monthly payments by nearly $1,000 making affordability a powerful driver of buyer behavior. It’s no surprise that buyers are turning to buydowns or ARMs to shrink that monthly burden, at least initially.
We’re seeing more than just a market reaction to higher mortgage rates in Orange County. Buyers are intentionally adapting: shifting focus to alternative loan structures, choosing to move forward now and refine later, or leveraging temporary rate relief tools to keep homes within reach. And sellers locked into low-rate mortgages are reducing inventory, adding another layer to these behaviors.
If you’re thinking about buying in OC, the message is clear: flexibility and strategy matter now more than perfect timing Don’t wait for rates to fall; instead, plan for them Explore financing options like buydowns or ARMs, lock in a home, then revisit the rate when conditions improve.
If you’re ready to explore your options with someone who understands both the numbers and the psychology behind today’s OC mortgage market, I’d love to help.

Eric Lawrence Frazier, MBA - Principal advisor


Southern California’s housing market extends well beyond county borders its shifts reverberate across the entire region. Rising prices and limited availability in Los Angeles have propelled residents outward, with the Inland Empire picking up much of the overflow. Yet, affordability there is slipping too, driving further ripple effects into Orange County.
Understanding these shifts is crucial for anyone with a stake in OC’s housing scene homeowners, renters, developers, or just curious locals. This article unpacks how affordability crunches, job growth, and development trends across LA and the Inland Empire are shaping Orange County home values, rental demand, and migration patterns. We’ll examine the indicators of spillover, explore how OC is responding, and consider what lies ahead.
1. Rising Pressure from Los Angeles
LA County's persistent lack of affordable housing continues to push buyers and renters to look beyond its boundaries. While OC offers attractive living environments and job opportunities, skyrocketing prices in LA spill into Orange County, elevating demand and pricing even in areas previously immune to such pressures.
2. Inland Empire: The First Destination, Now Feeling the Pinch
The Inland Empire (IE) historically served as a more affordable alternative rent in IE remains notably lower than in OC and LA As of mid-2025, average IE rentals were approximately 21% below Orange County and just slightly below Los Angeles, sustaining its draw for budget-conscious renters and buyers.

Yet affordability in IE is eroding. Once 43% cheaper in home prices than LA and OC, the gap has narrowed to 38%. Homeownership is slipping out of reach even for IE locals: only about 31% can afford a median-priced home, down sharply from 39% a year earlier UCR News. Alongside this, IE continues to experience intense demand vacancy rates remain tight, absorption of new units is high, and rent growth persists.
These shifts mean IE is no longer the easy pressure-release valve it once was. As housing affordability constricts, Orange County increasingly becomes a next stop for those priced out.
OC’s multifamily market offers further insight: population growth is modest around 0.3% annually—and household formation is rising even when net migration slows. In fact, between 2017 and 2022, many residents moved out toward more affordable regions, including IE, Arizona, and Texas but more recently, that trend is easing. This signals a stabilizing but still pressured demand for housing.
Rental stats underscore the challenge: OC remains the priciest rental market in Southern California. Despite slight cooling in forecasted rent growth (around 2%) and moderate vacancy projections (~4 5%), high costs continue to push residents out 2023 saw a record 37,500 people leaving OC, the population equivalent of a city like Dana Point.
Meanwhile, rentals and homes in more affordable inland OC submarkets AnaheimSanta Ana, North County—have seen relatively more development, while coastal areas face chronic under-supply.
What this all shows is that Southern California functions as one interconnected housing ecosystem. Limited housing units statewide (millions short of needed supply), combined with affordability gaps across the region, means demand flows outward from LA to IE and now, increasingly, to OC. OC’s high cost of living means it's both recipient and competitor in this regional housing squeeze.
OC’s market response has included measured growth in multifamily and workforce housing, particularly inland. Yet supply remains insufficient to meet demand, and continued outflows could persist unless broader regional solutions reduce pressure across all connected markets.
In summary, housing shifts in LA and the Inland Empire are increasingly influencing Orange County’s housing landscape As affordability deteriorates, demand moves inward from LA to IE, and increasingly into OC. For those watching property values or seeking rentals, the key message is clear: OC can no longer stand apart it’s ensnared in a regional ripple effect.
Looking ahead, OC’s market trajectory will depend on mortgage rates, supply growth, and broader affordability changes across Southern California. Understanding these connections is vital for making informed housing decisions or investments in a region shaped by interlinked market pressures.
Take action with confidence. Your next move matters, and planning with insight is essential—let’s connect and explore how these market forces shape your opportunities:

Eric Lawrence Frazier, MBA - Principal advisor


In January 2025, homes in Orange County averaged 40 days on the market before securing a buyer. At first glance, that figure may not seem extraordinary, but in a region where properties often receive multiple offers within weeks or even days this shift raises important questions. Does the longer selling window signal a cooling trend? Or does it represent a more sustainable balance between sellers’ expectations and buyers’ realities?
For both sellers and buyers, the average Days on Market (DOM) is more than just a number; it reflects the pace, competition, and psychology of a marketplace. It informs pricing strategies, staging decisions, and even the best time to list a property. In this article, we’ll explore what the 40-day average means for Orange County real estate, why it matters, and how you can use it to your advantage.
January traditionally records longer DOM due to holiday distractions and lower buyer traffic. However, 2025’s 40-day average also reflects broader economic influences. With mortgage rates hovering just above 7% through the winter, many buyers remained cautious, running affordability calculations before committing to offers. This created longer decision-making timelines—even as overall demand stayed steady.

A year ago, in January 2024, homes averaged closer to 32 days on the market. Stretching to 40 days in 2025 signals a moderate shift toward balance, where sellers no longer hold all the leverage and buyers gain breathing room. Historically, pre-pandemic norms in OC saw DOM averages between 45 and 60 days, so today’s numbers still reflect a relatively brisk pace compared to long-term trends.
Despite the longer window, prices in January held firm at a median of $1.165 million. Transaction volume topped $3.9 billion with over 1,200 closed sales. These figures highlight that while homes are taking longer to move, serious buyers remain in the market and they’re paying for quality and location.
In fast markets, ambitious pricing sometimes works. But when the average DOM stretches past a month, buyers interpret an overpriced listing as “stale.” To avoid chasing the market downward, sellers should anchor pricing decisions on recent, comparable sales preferably those closed within the past 90 days.
With a 40-day average, a home that hasn’t received strong interest within three weeks may require a course correction A slight reduction or buyer incentive (such as covering closing costs) can spark renewed attention without sacrificing overall value. Planning these “if-then” scenarios with your agent in advance ensures you’re ready to act if needed.
The first two weeks of a listing often generate the most activity. High-quality photography, decluttering, neutral color palettes, and curb appeal improvements should be finalized before the home goes live. Buyers want move-in ready presentation and the better the staging, the faster the offers.
When homes stay listed longer, consistent upkeep matters. Refreshing décor, rotating staging pieces, or even adding seasonal touches can prevent a property from feeling overlooked. With average DOM at 40 days, presentation must remain sharp from day 1 to day 40.
Timing: When to List in a Shifting Market
Late January through March often marks the unofficial start of OC’s “spring market.” Buyers emerge from the holiday pause with fresh pre-approvals in hand. Listing just ahead of this surge positions sellers to capture renewed demand.
Buyers today are more deliberate than they were during the 2021–2022 bidding wars. Many want extra time to compare properties, negotiate terms, and secure financing. Aligning your listing with this reality allowing for thoughtful consideration can prevent frustration and ensure your property stays competitive without appearing desperate.
The 40-day average is neither a warning sign nor a celebration Instead, it signals a healthier balance where buyers gain space to act thoughtfully, and sellers must sharpen their strategies. Homes priced appropriately, staged effectively, and listed at the right time continue to move at strong values For sellers, this means patience paired with preparation. For buyers, it means opportunity without panic.
Orange County’s 40-day DOM in January tells a story of moderation. The market remains competitive, but buyers no longer feel forced into snap decisions. Sellers, meanwhile, must lean on pricing discipline, strong staging, and smart timing to achieve results. In a landscape where 40 days is the new normal, those who adapt stand to benefit most.
Ready to take the next step?
The 40-day rule doesn’t have to work against you it can work for you when you understand it. Whether you’re preparing to sell or planning to buy, having an experienced guide makes all the difference.


Orange County’s luxury real estate scene in 2025 is witnessing more than just rising prices it’s undergoing a meaningful change in what buyers truly want. With a blend of international investors seeking prestige and stability, remote-work executives prioritizing both productivity and relaxation, and younger affluent buyers demanding smart, stylish living, OC’s luxury market is being reshaped by diverse expectations. Coastal scarcity and steady demand reinforce the value of ocean-view estates, but it’s the evolving lifestyle standards technology integration, wellness design, and customizable, modern layouts that are rewriting the high-end home playbook.
This article takes a closer look at the forces driving these changes We’ll explore how global buyers, hybrid workers, and affluent Gen Z and Millennials are influencing demand for tailored new builds, smart-home functionality, and seamless indoor-outdoor experiences. From gated coastal enclaves to eco-focused architecture, we’ll cover the details that real estate professionals and buyers alike need to know in Orange County’s luxury market of 2025.
Orange County’s limited coastline and tight inventory create an inherent luxury appeal especially for ocean-front estates in places like Laguna Beach, Newport Coast, and Corona del Mar. Reports highlight that ultra-luxury properties in the $20–30 million range are defined not just by price, but by panoramic views, bespoke architecture, and exclusive locations. At the same time, rising buyer expectations mean that square footage alone no longer defines value; it’s innovation, quality, and lifestyle fit that do.

Global investors continue to see OC as a stable and prestigious destination for luxury real estate. With demand rooted in lifestyle, schools, and community, they often favor brand-new homes that reflect both modern design and long-term value. Their activity sustains demand even in fluctuating market conditions and adds a layer of cross-cultural preference design that blends indoor-outdoor living, multigenerational utility, and a sense of local connection.
While interest rates hover in the mid-6% range, more buyers are looking for homes that accommodate both focus and leisure Remote-work executives in 2025 want dedicated office zones with high tech support, yet they also prioritize layouts that flow to terraces, pools, or gardens. Custom new builds are increasingly prized because they allow buyers to tailor floor plans to evolving work-from-home needs, while maintaining luxury finishes.
Younger buyers are redefining what “premium” means favoring eco-friendly systems, flexible spaces, wellness features, and smart-home integration. Trends show that multifunctional rooms, home offices, and technology-driven living are replacing sheer scale as top priorities. These buyers have little patience for outdated design, meaning newly constructed homes with contemporary finishes, indoor-outdoor flow, and built-in smart features are more desirable than older, larger estates with dated layouts
Orange County’s luxury real estate market is being redefined by a perfect storm of sophistication, functionality, and scarcity. International investors bring prestige and longterm demand. Remote-work professionals push for homes that adapt to both productivity and relaxation. Affluent Millennials and Gen Z redefine luxury around innovation, sustainability, and lifestyle fit rather than sheer size.
For developers, agents, and buyers navigating this landscape, the key lies in understanding that high-end expectations are now about intelligent design, customizable comfort, and seamless experience especially in ocean-view, technology-enhanced, and newly built homes. As OC evolves in 2025, luxury is less about display and more about delivering a refined, future-ready lifestyle
Uncover how OC’s evolving luxury market aligns with your vision of elevated living. Partner with an expert who understands trends, values, and opportunity in high-end real estate.
Connect with confidence and clarity start the conversation today.
Orange County often greets the calendar year with a muted real-estate scene—results from chilly weather, holiday hangover, and alarmingly high mortgage rates. January saw 30-year fixed mortgage rates hovering near 7.1 percent, marking one of the steepest entry points in over two decades. This combination of subdued buyer activity and unaffordable borrowing costs creates a temporary opening for buyers who are ready with strategy.
In this guide, we’ll walk through how January’s slowdown isn’t a signal to wait indefinitely. Rather, it’s an opening for strategic planning. We’ll explore when and how the spring market traditionally heats up across Orange County, what to watch for locally in areas like Irvine, Tustin, Laguna Beach, and Newport Coast, and how buyers can smartly position their offers once momentum returns. If you’re in the market this year, understanding this winter dip and exactly how to capitalize on the coming rebound can make a significant difference in affordability and outcome.
At the start of the year, mortgage rates averaged around 7.1 percent a level that hasn’t been seen since 2001. This steep cost of borrowing significantly dampened buyer enthusiasm. Pending home sales across the U.S. dipped to historic lows in January, with signed contracts falling due to affordability constraints and lingering winter slow-down. Shrugging off the chill of the holidays, many waited for better conditions (Context based on national market trends and Orange County data)

The biggest advantage is the pricing HUD wants to get foreclosures off their books and into the hands of homeowners fast. They don’t haggle like private sellers do. They set a fair price, adjust it if needed, and accept sealed bids that meet their minimum net.
Local HUD REO data shows that in California, buyers regularly pick up homes 5%–20% below neighborhood comparables. That means a house that would sell for $450,000 in a typical listing might show up as a HUD home for $400,000 or less — especially if it needs some repairs.
Don’t let the word “discount” fool you — there is no free lunch. HUD homes are sold strictly as-is. They want to move the property; they’re not fixing it for you. If you plan ahead, these costs are manageable and they usually still keep your total price well under market. Here’s what to expect:
HUD provides a Property Condition Report (PCR) always read it. But you should also hire your own professional inspector. Depending on the size of the home, expect to spend $400–$700.
Why it matters: If the roof leaks or the plumbing needs repair, it’s better to find out before you close. Unlike a retail seller, HUD won’t credit you for these costs.
Your biggest variable. Some HUD homes just need paint and carpet. Others need a new roof, upgraded HVAC, or major systems work
Typical rule of thumb: budget 1%–3% of the purchase price for immediate repairs.
A great option is the FHA 203(k) renovation loan, which lets you finance repairs as part of your mortgage but that’s another strategy altogether
HUD does not keep the utilities on. If you need the gas, water, or electricity activated for your inspection or appraisal, that’s on you. Expect deposits of $100–$500 depending on local utility companies
Closing costs are similar to any other purchase escrow, title insurance, recording fees, loan origination fees. HUD may allow you to roll up to 3% of your closing costs into your offer but only if your net bid meets their minimum. Always budget your share.
Here’s how this might look in real life.
Let’s say a buyer in Corona, CA finds a HUD home listed for $410,000. Comparable homes in that neighborhood sell for about $445,000 but this one needs a bit of work.
This buyer might budget like this:
Professional home inspection: $650
Utility activation: $250
Basic repairs and updates: $8,000 (paint, carpet, minor plumbing fixes)
Closing costs: standard 2%–3% range
The “hidden costs” total around $9,000–$12,000. But because the buyer started with a price that’s $35,000 below market, they’re still ahead even after upgrades. That’s the power of buying smart, not just cheap.
Too many first-time HUD buyers focus only on the list price and overlook the real costs that come after. Here are three mistakes to avoid:
✅ Skipping the Inspection
Yes, you save a few hundred dollars but risk a $5,000 repair surprise.
✅ Lowballing the Bid
HUD won’t counter If you don’t meet their minimum net, your offer is rejected no doovers until they re-list or adjust the price.
✅ Not Budgeting for Repairs
A paint-and-carpet fixer might be simple, but bigger issues like HVAC or roofs need real money Know your numbers

This strategy isn’t unique to Riverside or SoCal. HUD REOs are sold this way in all 50 states. Whether you’re buying in the Inland Empire, Sacramento, Arizona, or Texas, the “as-is,” sealed-bid system works the same way. The only difference is how local market prices and repair costs pencil out.
• Equity Potential: Your real gain is that built-in equity when you close. A modest fixer might be worth $10K–$30K more than you paid once you update it.
• No Seller Drama: No seller pulling out at the last second HUD wants it sold
• Fewer Surprises: The clear PCR, standard contracts, and structured bids mean fewer “he said/she said” conflicts.
Recent data from HUDUser.gov shows that in 2024, HUD sold over 1,200 homes in California alone with average discounts ranging from 10%–20% compared to comparable retail listings. In Riverside County specifically, buyers using the owneroccupant period saved thousands by bidding smart, inspecting carefully, and budgeting for realistic repairs.
✔ Always compare the all-in cost (purchase + repairs + closing costs) to local comps.
✔ Use a trusted inspector who understands older properties.
✔ If the repairs are bigger than you can cover, ask about a 203(k) loan or negotiate contractor bids up front.
✔ Never assume your regular agent knows HUD. Always work with a HUD Buyer’s Broker who’s NAID-certified and familiar with the sealed bid process.
✅ Get pre-approved before you bid.
✅ Read the Property Condition Report line by line.
✅ Hire an inspector, even if it costs you.
✅ Budget for repairs double-check with a contractor if needed.
✅ Work with a HUD Buyer’s Broker to guide you through the bid, escrow, and closing
HUD foreclosures can be your best opportunity to get into a neighborhood you love, with instant equity and a monthly payment you can afford But your real savings come when you know exactly what you’re buying and what it costs to bring it up to your standard.
✅ Scan the QR Code to schedule your free HUD Cost & Savings Strategy Session.
• Learn how much you could save vs. retail listings
• Get local estimates for real repair costs
• See how to bid smart and keep more equity in your pocket
�� Want to run numbers and browse listings first?
Scan the second QR Code to download my Mobile App your all-in-one hub for calculators, local HUD REOs, and videos that show you step-by-step how to win.
The power is now. Let’s make sure you’re saving wisely, not guessing blindly.

Eric Lawrence Frazier, MBA - Principal advisor
Real estate & mortgage | business | finance | CA DRE #01143484 - NMLS ID #461807


The California housing market has always been competitive, but the rising share of investor-owned homes is adding a new layer of intensity particularly in Orange County (OC). Recent data shows that nearly one in five homes statewide about 19% is now owned by investors In OC, investor ownership reaches approximately 16% of single-family homes, translating to nearly 88,000 properties across the county. This trend isn’t just a statistic it represents a shift in who gets access to homes and how they’re used. As investor purchases outpace the ability of traditional buyers to compete, the question becomes: who’s being squeezed out? In this article, we’ll examine how growing investor control affects affordability, home availability, and the experiences of OC’s regular homebuyers and renters. We'll explore the broader context, assess local impacts, and consider what lies ahead. Welcome to a deep, grounded look at a changing housing landscape in OC.
Recent research highlights that 19% of California’s homes are investor-owned, amounting to approximately 1.45 million properties statewide. In certain rural and tourism-driven counties like Sierra, that share surpasses 80%, whereas OC aligns more with urban areas at around 16%. Investor activity isn’t slowing; in early 2025, investors accounted for more than 25% of home purchases nationally, a jump from 18.5% just a few years prior.
In Orange County, investor-held single-family homes now number around 87,928 properties 16% of that market. `This elevated level of investor participation reduces the pool of homes available for traditional buyers. Many of these investor purchases are allcash offers, creating stiff competition for families and first-time buyers who rely on mortgages and financing.

Investor-dominated markets often see rising prices and reduced affordability. When investors, especially those with cash on hand, buy homes in bulk, they can drive up prices and limit the inventory available to owner-occupants. Even in markets where small investors dominate as is the case in California, where up to 91% own fewer than five properties these purchases still intensify competition.
It's important to note that most investors in California are “mom-and-pop” landlords, rather than large corporations, though the result is similar: fewer homes for residents to buy, and potentially higher rents. While institutional investors represent only a small slice under 2% of homes statewide their influence is often top of mind in policy discussions.
Rising investor ownership in Orange County means more renters might be dealing with higher rents or shorter lease terms, especially if properties are managed for profit rather than long-term tenancy. Traditional buyers may find themselves in bidding wars against investors, limiting opportunities to build equity through homeownership. With OC’s housing demand already high, this shift in ownership dynamics could further block the pathway to stability for many OC families.
The growing share of investor-owned homes now approaching one in five statewide, and 16% in Orange County is reshaping the local housing landscape. Investors bring capital and liquidity, but their presence narrows choices for homebuyers and may accelerate affordability pressures for renters. While many investors are small-scale, their collective impact is notable and growing. As OC faces tightening supply and rising demand, those seeking to buy or rent must navigate a more challenging market. Awareness and informed dialogue are key understanding how investor activity affects your choices is the first step in adapting strategies, whether you're looking for a home or working toward financial stability in a shifting market.
Ready to take control of your housing journey?

California’s housing crisis has long been intensified by regulatory hurdles now, a major shift is underway. Two new state laws signed on June 30, 2025 AB 130 and SB 131 dramatically loosen environmental review requirements for certain housing projects. At the core is a sweeping exemption for infill developments projects that bring housing into already built-up areas opening the door for faster mid-density construction.
In Orange County, where land is scarce and demand is pressing, this legal adjustment could mark a turning point. Developers, real estate professionals, and local governments are now equipped to pursue residential and mixed-use projects with fewer delays. Coupled with streamlined review processes, the reforms may encourage more creative, transit-oriented design and efficient use of urban land.
This article will explain how these laws reshape CEQA review paths, highlight what kinds of projects benefit, consider practical implications specifically for Orange County, and offer a balanced view of the opportunities and risks ahead.

AB 130 introduces a statutory exemption under CEQA for qualifying infill housing developments meaning certain residential and mixed-use projects no longer require an environmental review, provided they meet specific standards. To be eligible, a project must:
Be located on a site of 20 acres or less (5 acres or less for special “builder’s remedy” projects).
Sit within an incorporated city or an urban area previously developed or surrounded primarily by urban uses.
Comply with local zoning, general plan, and not involve sensitive or hazardous land such as prime farmland, wetlands, high-fire-severity zones, or historical structures
Achieve at least half of the applicable density under the housing element. These changes vastly broaden the scope beyond the prior Class 32 categorical exemptions, offering more flexibility in scale and location.
Additional streamlined processes include:
A ministerial review framework meaning approvals no longer rely on discretionary decisions that invite delays.
Tight deadlines for example, agencies must act within 30 days on exempt projects. Continued tribal consultation and environmental assessments (e.g., Phase I reports) remain mandatory but on accelerated timelines.
SB 131 kicks in when a project nearly qualifies but fails due to a single condition. In such cases, CEQA review is limited only to the narrow issue that disqualified the project. This avoids broader environmental documentation and litigation. It also extends exemptions to:
Infrastructure, community-serving facilities, rezones implementing housing element commitments, and advanced manufacturing sites.
However, projects that fall under excluded categories like oil and gas infrastructure, distribution centers, or natural and protected lands remain subject to full review.
Orange County, a highly urbanized region with transit corridors and redevelopment potential, stands to benefit significantly:
Mid-density projects such as apartments over retail or small condominium developments in infill areas—can now move forward faster. The reforms favor transit-oriented opportunities, as zoning near transit stations often matches density thresholds and urban context requirements.
Developers and agents can craft creative designs, knowing that projects meeting objective standards may avoid CEQA entirely or gain streamlined review. That said, challenges remain. Litigation risk persists, particularly over interpretation of terms like “urban use” or site sensitivity. Additionally, while CEQA is relaxed, other approvals such as building permits, design reviews, community outreach still apply
Proponents view the CEQA reforms as a long-overdue solution to delays, high housing costs, and inconsistent approvals. Housing advocates hail the changes as transformative even labeling them the most significant housing legislation in a generation.
Critics warn that rolling back environmental review may weaken protections and limit community input, particularly in vulnerable areas or low-income neighborhoods. For Orange County, a carefully balanced approach will be essential: advancing housing while ensuring thoughtful planning and oversight.
AB 130 and SB 131 mark a significant shift in California's housing landscape particularly in urbanized counties like Orange County. By exempting well-designed infill housing from CEQA and offering streamlined review for near-miss projects, these laws could accelerate mid-density development and unlock innovative, transit-oriented opportunities. Yet success will depend on clear implementation by agencies, careful site selection by developers, and informed engagement by communities.
Ultimately, this legislative change may help bridge Orange County’s housing gap without sacrificing smart growth or local accountability. If stakeholders move with clarity and purpose, the CEQA rollback effect could become a catalyst for inclusive and efficient infill housing.
Ready to explore how these CEQA reforms can benefit your next project?


When most buyers hear “HUD home,” they think of programs for first-time buyers and families who plan to live in the property and they’re right, mostly. HUD’s mission is to get foreclosed homes back into the hands of owner-occupants. But what many people don’t realize is that HUD homes are open to investors, too — just not right away.
If you’re a first-time buyer or move-up buyer in Riverside County or anywhere in Southern California, you need to understand how investors play the game. Because when the 15day exclusive owner-occupant window closes, the competition changes overnight and cash buyers are ready to swoop in Knowing how they buy helps you act smarter and faster.
HUD sells foreclosed FHA properties in a structured way Every new listing starts with an exclusive listing period:
For most single-family homes, it’s the first 15 days.
During this window, only owner-occupants, nonprofits, and government agencies can submit bids.
No investors no flippers no outbidding by cash buyers with no intention of living there.
Once the exclusive window ends and the property hasn’t sold, investors can submit offers. HUD accepts the highest net bid, whether it comes from a homeowner or an investor
Why Investors Love HUD Foreclosures

Watch New Listings Daily: Great deals don’t last long. Work with your HUD Buyer’s Broker to check the HUD Homestore every day.
Bid Realistically: Investors don’t waste time lowballing and neither should you. Submit your strongest bid during the exclusive period
Have Financing Ready: You need a rock-solid pre-approval letter and proof of funds for your earnest money. If your offer is incomplete, HUD will reject it.
Understand HUD’s Net: If you ask for closing cost assistance, remember that lowers HUD’s net proceeds. Your broker can help estimate if your offer still meets HUD’s minimum
If you’re an investor, the rules are clear:
You can only bid after the exclusive owner-occupant period ends. You must use cash or investor financing no FHA owner-occupant loans
You cannot occupy the property to get around the rules that’s fraud.
Investor FAQ
Q: Can an investor submit a bid during the owner-occupant period if they plan to live there “later”?
A: No you must certify that you’ll occupy the home as your primary residence for at least 12 months. False certification is mortgage fraud.
Q: What loan types can an investor use?
A: Investors typically use conventional investor loans, private lending, or cash. FHA loans require owner-occupancy.
Q: How do investors calculate if a HUD home is worth it?
A: They compare the list price + repair costs + closing costs to the neighborhood’s afterrepair value (ARV) and expected rental income.
Many buyers think they’ll have time forever — but once the exclusive window closes, they face competition from investors who can close fast.
Underestimating the Sealed Bid
If you bid too low, HUD won’t counter. Investors know how to bid to win you should too.
Only a registered broker can submit your bid. Many general agents don’t know HUD’s process don’t risk it.
According to HUDUser.gov, about 70% of HUD homes in California are sold to owneroccupants but that means 30% still go to investors. In Riverside County, where median prices have grown steadily, more flippers and buy-and-hold investors are eyeing HUD homes every year. Acting smart during your exclusive window is your best move.
These rules hold true in every market from Riverside County to Phoenix to Atlanta. If there’s a HUD REO listed, the same system applies: owner-occupants first, investors later. Knowing how the timeline works is the key to staying ahead.
Work with a HUD Buyer’s Broker who’s NAID-certified
Check new HUD listings daily
Have pre-approval and funds lined up
Read the Property Condition Report and budget for repairs
Submit a realistic offer during the exclusive window don’t wait for day 16
Know your numbers: purchase price, repairs, ARV, rent potential
Have financing or cash lined up for a quick close
Work with a broker who understands investor timelines and bid strategies
Remember: you can only bid after the exclusive owner-occupant period ends
A lot of buyers miss out because they underestimate the competition waiting in the wings. The investor window opens on day 16 and your dream home can vanish overnight if you’re not prepared.
Whether you’re an owner-occupant who wants to lock in a great deal or an investor looking for your next opportunity, understanding how HUD’s timeline works is your best edge

Scan the QR Code to schedule your free HUD Buyer or Investor Strategy Session.
• Learn when to bid, how much to bid, and how to win
• Get daily local listings and real-time status updates
• Understand your options for financing and repairs
Want to compare numbers and learn on your own?
Scan the second QR Code to download my Mobile App your all-in-one tool for calculators, listings, and educational videos about buying HUD homes smartly.
The power is now. Don’t get left behind when the window closes let’s make your next move together.


Eric Lawrence Frazier, MBA - Principal advisor
mortgage


