the power is now
magazine NOVEMBER 2025
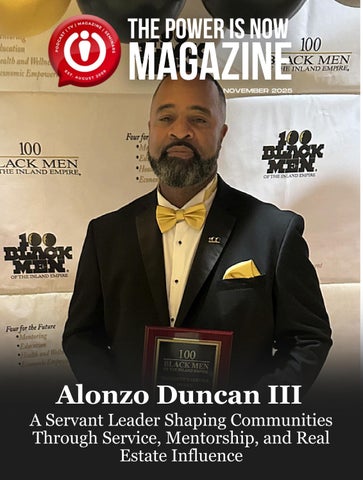
Alonzo Duncan III A Servant Leader Shaping Communities Through Service, Mentorship, and Real Estate Influence
the power is now
magazine NOVEMBER 2025
Alonzo Duncan III A Servant Leader Shaping Communities Through Service, Mentorship, and Real Estate Influence