Quarterly investment report

October 2025

October 2025
The past quarter has been a surprisingly calm one from an investment perspective.
Generally, stock markets have been steadily ticking up since we published our last report in July of this year. Corporate bonds have made some small gains, with government bonds being essentially flat. Of the main asset classes we consider for portfolios, only real estate has fallen over the quarter. We don’t currently hold any real estate.
That means all of Equilibrium’s portfolios have produced positive returns. For example, the Balanced portfolio has gained 3.9% over the quarter (beginning 5 July 2025) and is up 6.98% so far in 2025 (Source: FE Analytics to 5 October 2025).
These returns are perhaps quite surprising when we think back to the turbulence around “Liberation Day” in April, when US President Donald Trump announced most of his trade tariffs. At that point, markets sold off sharply, concerned that those tariffs would be inflationary and would slow the economy.
What’s more amazing is that those announced tariffs largely remain in place!
Markets have clearly decided tariffs aren’t too much of a problem and are once again more focused on the prospect for artificial intelligence (AI) which is back to being one of the main drivers of stock markets. Once more, big US tech stocks are outperforming the rest, after falling sharply in April.

As we’ll explore later, capital investment by tech companies is very much driving the US economy as well as driving the market. We’ll look at the pros and cons of this and also explore how we are using AI to enhance our processes.
We’ll ask whether markets are really right to forget about tariffs, or whether the impact has just been delayed.
We’ll also look at one of the other key drivers of returns, which is the actions of central banks. In particular, we’ll consider the impact that Trump’s attempt to remodel the Federal Reserve is having and consider where interest rates might go, with inflation still higher than we’d like it to be.
Despite the high inflation, which has averaged more than 3.3% p.a. over the last 10 years, portfolios have still produced positive real returns and beaten various benchmarks over the long term, as shown in Table one . This is despite the disruption over Liberation Day, as well as other periods of volatility such as the cost-of-living crisis, Covid, Brexit and many more periods of turbulence over the past decade!
On this page, we look at some key economic indicators and how they have changed over the last five years, focusing on the UK and the US, which have the most significant impact on portfolios.
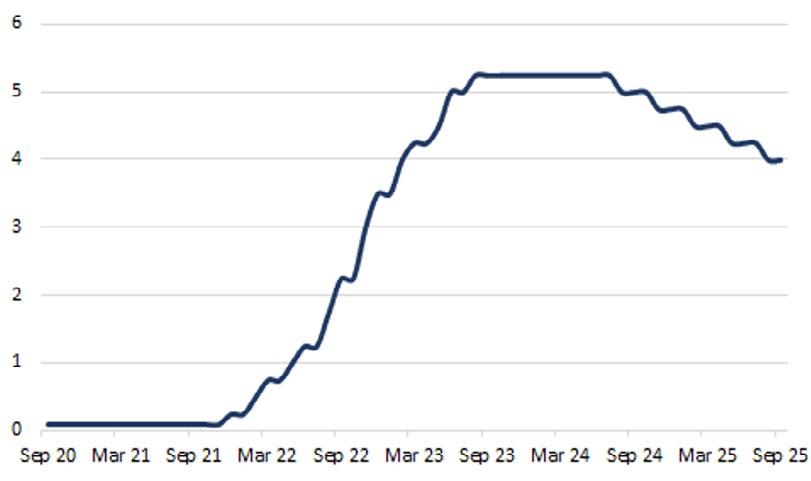
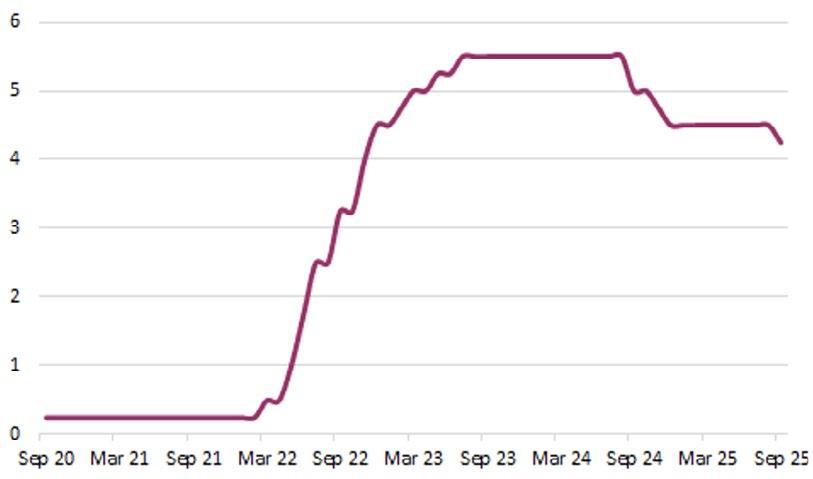
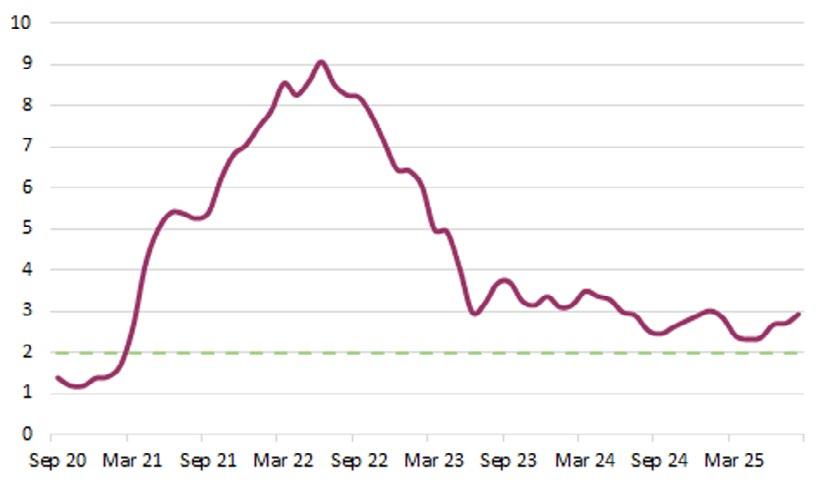
Interest rates in both the UK and US went up rapidly in 2022 and the first half of 2023, as prices rose sharply after the beginning of the Ukraine war. Since last summer, both the Bank of England and the US Federal Reserve have then cut rates by 1.25%, despite inflation remaining above the 2% level which they target.
The Fed is now predicted to cut rates by another 1% or so over the next year, partly because of pressure from the Trump administration. However, rates in the UK are only expected to be cut one or two times in that period, given the UK’s relatively higher inflation.
p.a. (Consumer Prices Index)
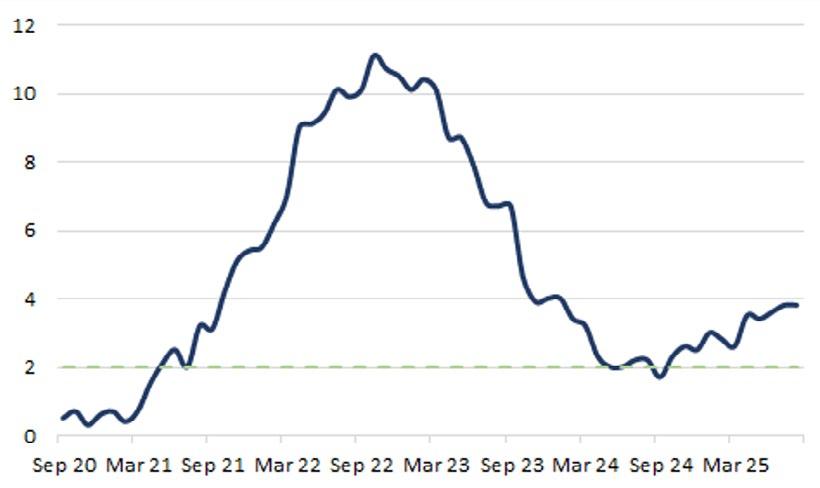
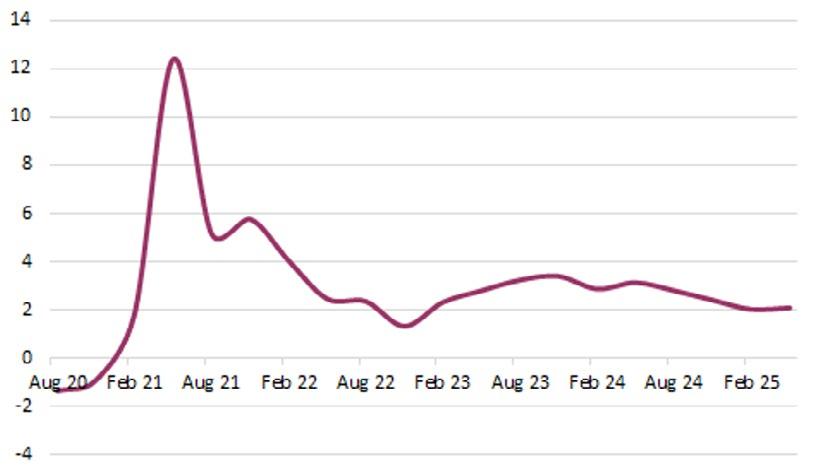
After the sharp rise in prices in 2022, inflation gradually fell throughout 2023 and 2024. However, in the UK, we only briefly got back below 2% before inflation rebounded, and in the US, it never got back to the target. Both are now heading in the wrong direction.
The Bank of England believes we are near the peak at around 4% CPI, after which we may gradually fall back towards 2%. In the US, it is possible that inflation may continue to climb as trade tariffs have an effect on prices.
The UK economy continues to grow at a relatively anaemic pace, around 1.3% p.a. In the US, despite a negative quarter around the tariff announcements, growth has generally been stronger and remains above 2% p.a. However, this is down from the 3% p.a. we were seeing this time last year.
The US economy has been helped by huge investments in artificial intelligence from the big technology companies, which is now contributing more to US GDP than the consumer.
The table below shows the returns of some of the major asset classes over the last 10 years, and so far in 2025 (up to 5 October). It is colour coded with the darker green showing the better performers in each calendar year, the darker the red, the worse the performer; yellow shows mid-range returns.
The standout performer over the past decade has undoubtedly been US equities, which has been green in most of the years shown here. However, so far this year it is lagging in Sterling terms, at less than a 7% return, partly because the dollar has weakened. By contrast many other stock markets are showing double digit returns, with Europe, and Emerging Markets returning more than 20% so far this year, with the UK market not far behind.
The most challenged asset shown has been UK Real Estate, which has been the worst performer in 6 of the 10 calendar years, as well as so far this year. It tends to be “feast or
famine” as it was also the best performer in 2019 and 2021. We don’t currently hold any in portfolios but are reconsidering the position as the asset looks relatively cheap. Perhaps it is due another sharp recovery?
Gilts also stand out with a number of red periods, performing particularly poorly in 2022. However, there have been periods - 2018, for example - when gilts delivered positive returns even as many other asset classes declined.
The tables below show our portfolios over various time periods, compared to other funds with similar objectives and risk tolerances.
Calendar year returns over 10 years relative to other funds to 3 October 2025

The tables below show our portfolios over various time periods, compared to wealth manager portfolios that have similar objectives and risk tolerances, as calculated by Asset Risk Consultants (ARC). Green numbers denote outperformance of the sector.
Various time periods to 30 September 2025
We are pleased with recent performance, with all portfolios outperforming the sector during 2024, in most cases with less risk than benchmarks.
In the very short term, our somewhat cautious approach at present means some of our portfolios are not currently capturing as much of the stock market gains as some, but in sell-off in the spring, our funds were generally protected well relative to competitors.
Relative to other Wealth Managers’ portfolios, our Cautious, Balanced and Adventurous portfolios are outperforming so far in 2025. However, all of our portfolios are outperforming over the long term. More importantly, after a period of very high inflation we can see that the real returns of the portfolio are now positive over the past three years, as well as over the long term (10 years).
A year ago, we had a relatively high cash allocation, after some defined return kick outs and with interest rates above 5%. As rates have come down, we’ve reduced cash levels, and have also slightly reduced fixed interest, with bond yields also moving lower over the past year. In particular, we have switched out of some of our high-yield bonds after a good run, as well as reducing the duration of our portfolio, by switching more into shorter-dated bonds. These still offer a good yield at present and with less risk given their shorter nature.
Whilst we hold the same amount of real assets as a year ago, we have switched our exposure from real estate to infrastructure. We have focused on the utilities sector which tends to be very defensive in a downturn, can provide something of an inflation hedge (as utility prices tend to go up with inflation), and can also benefit from increased electricity demand from AI and data centres.
We have increased defined returns by 2% over the 12 months. These structured products based on equity markets continue to provide headline returns in the region of 11% p.a., which we think compares favourably with the potential returns of direct exposure to stock markets. The products also only need markets to move sideways in order to produce the returns, providing a higher degree of confidence in these returns compared to stocks which require growth in order to achieve returns.
We have doubled alternatives exposure over the year. In particular, we’ve topped up absolute return strategies, which aim for slow and steady returns with low correlation to bond and equity markets. We think increasing diversification in portfolios is a sensible move after a good run for both equity and corporate bonds.
Table two shows the performance of each of our core asset class portfolios over the past 12 months, along with the current asset allocation of the Balanced portfolio and its allocation a year ago. We have made similar changes in other portfolios to a greater or lesser extent. Source: LSEG
We have largely kept equity exposure the same over 12 months. As markets move up, they are looking somewhat expensive, notably in the US, and therefore we think there is an increased risk of a pull back. Rather than dramatically reduce exposure and potentially miss out on some gains, we’ve instead introduced some portfolio hedges, buying assets which we expect could increase if stocks fell, and offset some of the losses. We have also introduced new structured products to gain exposure to Japanese and European equity markets, which are designed to provide a geared upside but with some capital protection built in.
If you were just to compare markets at the start of this year with where they are now, you would think it had been a nice, quiet period!
Stock markets around the world are up, in some cases pretty strongly, with government bonds fairly flat, and corporate bonds providing slow and steady positive returns.
Of course, in reality 2025 has been anything but calm as you can see from Chart one . Stocks fell sharply in March and April, after Donald Trump announced his trade tariffs.
In particular, US stocks were hit hard with the S&P 500 Index falling around 20% from mid-February to mid-April (red line). The so-called Magnificent Seven big tech stocks (green line) fared even worse, falling around 30% over the same period. Even non-US stocks fell (the blue line shows the MSCI World ex USA Index – the biggest companies in the world NOT listed in the US), although less than their American counterparts.
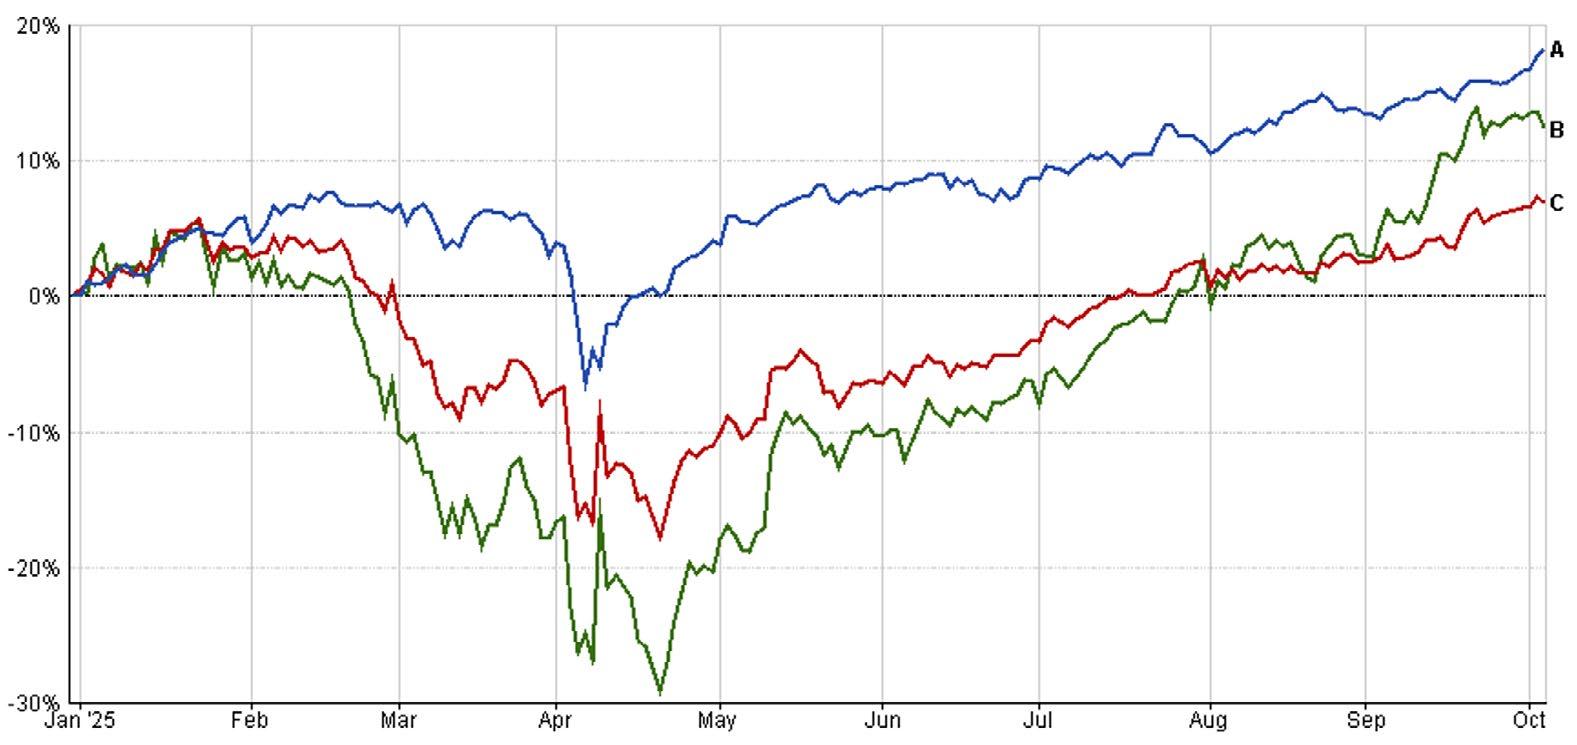
Source: FE Analytics, 31/12/2024 - 03/10/2025.
However, after Trump then delayed or rolled back some of the tariffs, markets returned to business as usual.
All the markets bounced back, with the Magnificent Seven absolutely roaring back. Non-US stocks remain ahead so far this year after a strong start, but the gap has narrowed substantially. What’s remarkable is that those tariffs – the cause of a 20% sell off – largely remain in place!
Remember that in essence, a tariff is a tax paid on imports, so will either make the price of those goods more expensive when sold to consumers (inflation), or the company importing the goods will make less profit. It is largely US companies or consumers that pay the tariffs, not the exporting company or country.
Chart two shows the current effective US tariff rate in blue, which is just a shade under 20%. The purple bar shows what was announced on Liberation Day, which was just over 24%, so the tariffs are somewhat lower than they were in April.
However, the chart also shows how tariffs have changed since 1930. The tariff regime is worlds apart from what we’ve been used to, with an effective level last year of around 3%. Tariffs are now at the highest since 1934 – a huge increase.
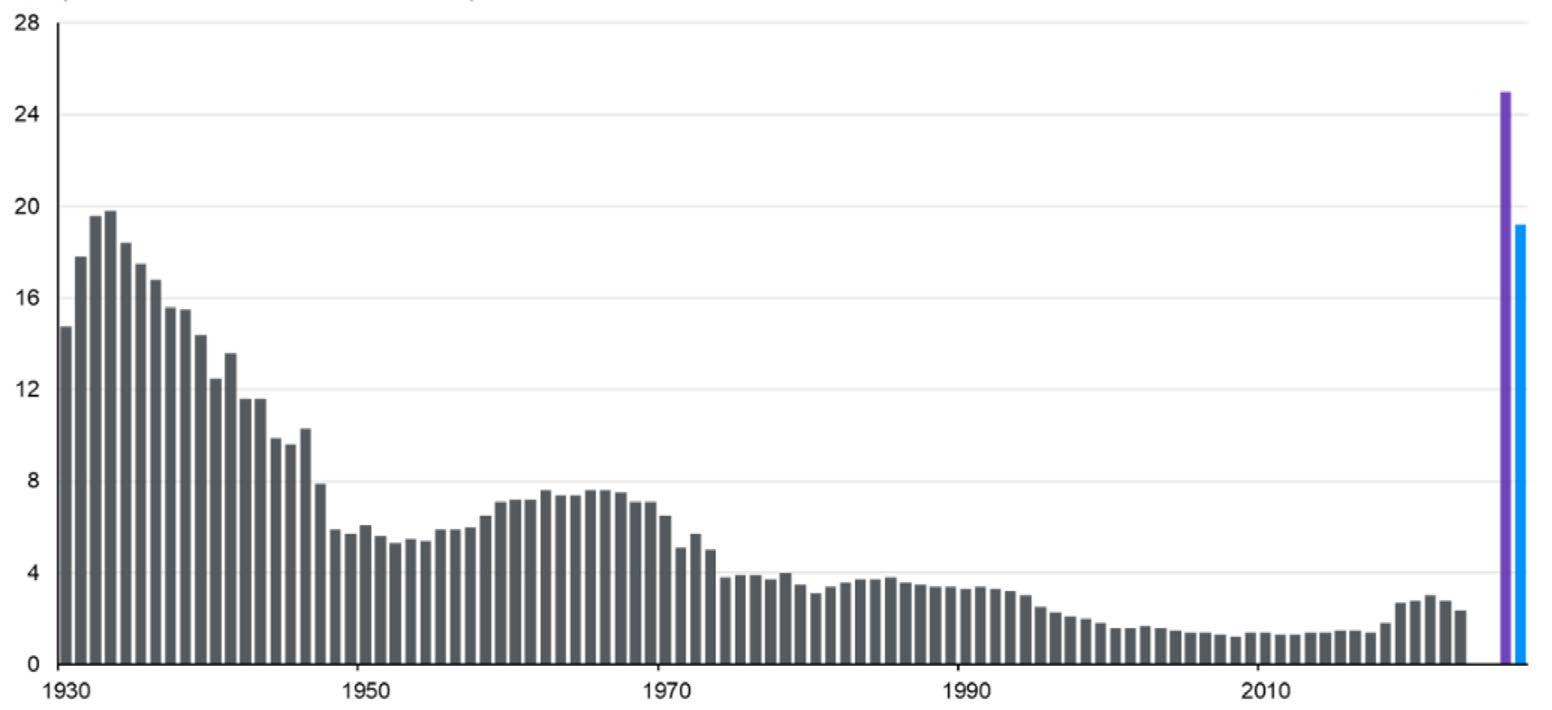
Source: JP Morgan Asset Management as of 31/08/2025.
Tariffs have not gone away. Markets have just got used to them and seem to have decided they don’t really matter after all! That’s partly because economic growth has also bounced back after a dip earlier this year.
In the first quarter of this year, the US economy shrank. This was mainly due to net trade, with companies trying to get ahead of tariffs by importing a lot more goods than usual (which has a negative effect on GDP).
Part of the reason investors are relaxed about this is that there is another big driver of economic growth which may be taking up some of the slack.
Spending by the big tech companies has accelerated, as they invest in artificial intelligence (AI). Excitement about AI is, of course, one of the reasons why big tech stocks have done so well and rebounded so sharply.
Their profits are generally growing more quickly than companies in other sectors, and so in many senses their performance is justified. However, it is their investment spending, which is driving economic growth in the US, as they invest in research, data centres, and processing power.
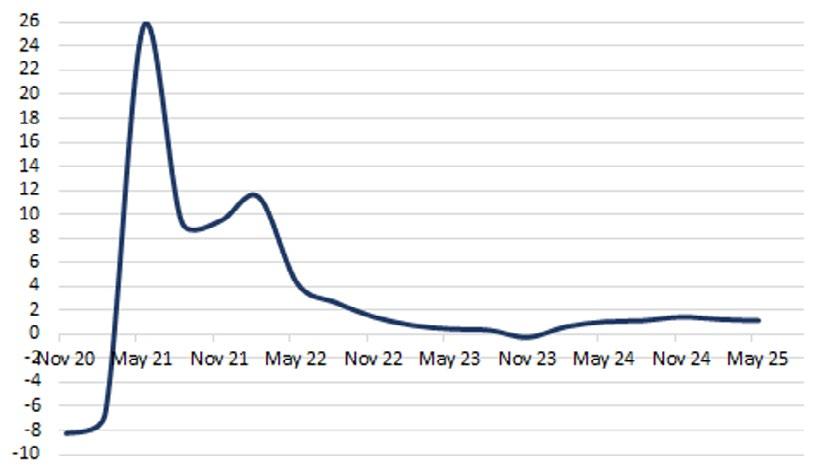
Chart three illustrates just how important this has been for the US economy. In the most recent quarters, the economy would have barely grown at all without tech spending.
This investment has helped the economy to keep on performing, but there is only a finite length of time that the tech companies can keep spending at these levels. At some point it must slow, and if it does, that could have a negative effect on both the economy, as well as on the profits of some of the companies.
As we’ve noted before, a large proportion of the spending from some of the big tech firms like Meta and Alphabet is finding its way into Nvidia’s coffers; Nvidia make the chips required to run powerful AI systems being built by the other big tech firms. Nvidia is now the largest company in the world, with a market capitalisation of more than $4 trillion!
The economy bounced back in quarter two (Q2) which saw net trade turn positive, implying there were a lot fewer imports than usual. These trade figures imply that most of the goods being sold in Q2 were still largely based on the pre-Liberation Day tariffs.
In essence, we still don’t know what impact tariffs will have on the real economy. We think the impact of tariffs will likely be spread out, but that doesn’t mean there won’t be an impact. It was also notable in both quarters that consumer spending was weaker compared to previous periods, which perhaps may demonstrate a note of caution given all the uncertainty.
Hopefully when the upfront investment does inevitably slow, the current capital expenditure will be showing a return as AI makes us more efficient and productive.
real GDP growth (% quarter-over-quarter, seasonally adjusted annual rate)
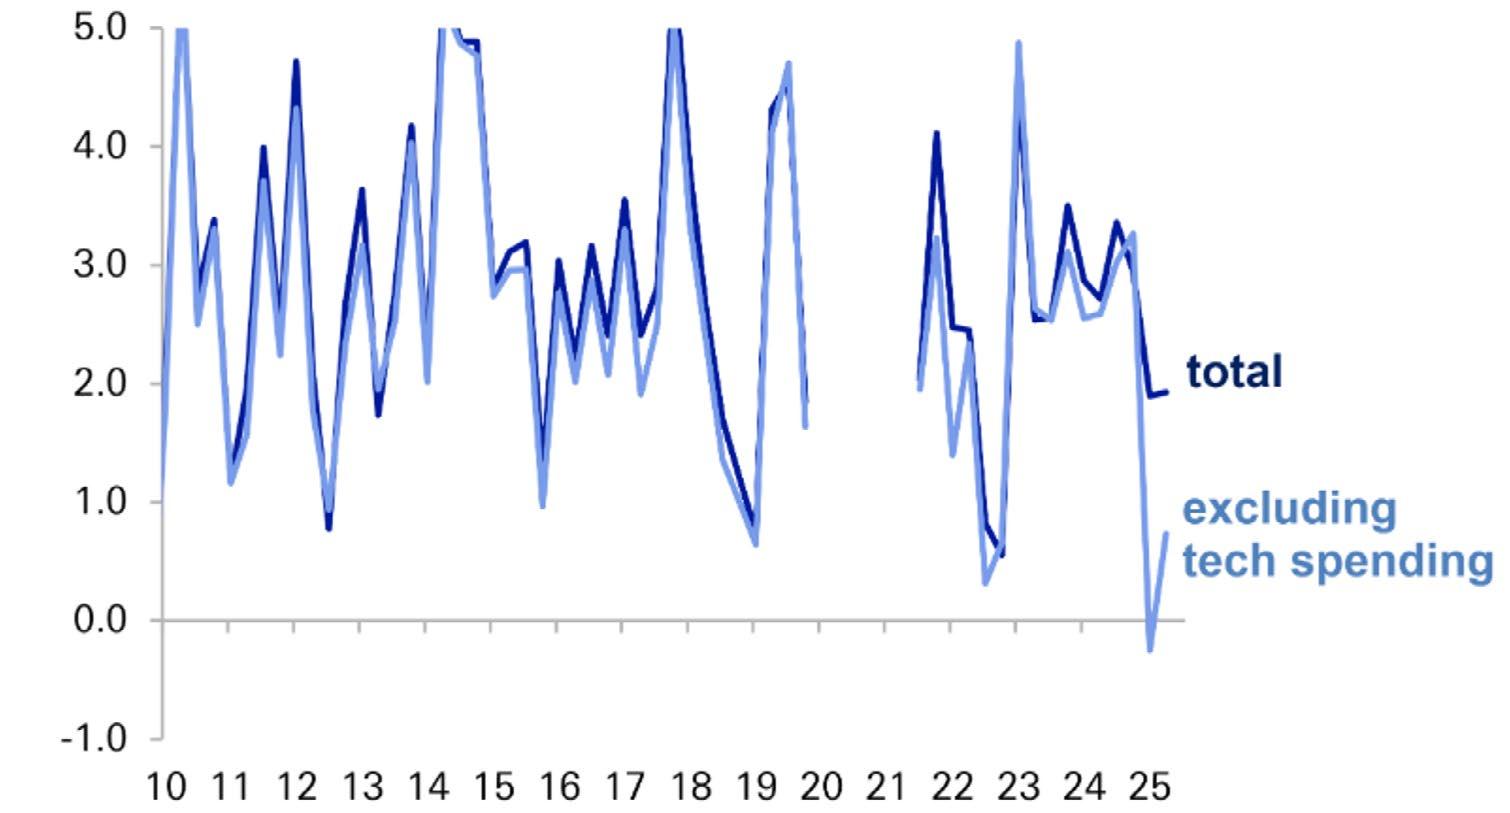
Source: Deutshe Bank Research; underlying GDP measured as real final sales to private domestic purchasers; tech spending includes the software and IT equipment components of fixed investment and domestic sales.
One asset that has not rebounded since April is the US dollar.
Chart four shows the dollar in blue and the euro in red against the pound, so far this year.
The euro is more than 5% up, whilst the dollar is over 7% down against sterling (and about 12% against the euro). This seems quite unusual, given the US continues to grow strongly. The performance of its stock markets indicates that overseas investors are still putting money into the US which normally would keep the dollar strong.
What seems to be happening is that investors are hedging the currency, as they fear a major devaluation.
So why might they expect the dollar to keep weakening? Well, the Trump administration has made no secret of the fact that they would like the dollar to come down in value, which
would help American exporters to be competitive (but all things being equal, could make imports - already hit by tariffs - more expensive).
The Trump administration have also made no bones about the fact that they would like interest rates to be lower. This could also mean a weaker dollar, as the return on cash in dollars might be lower relative to returns on cash in other countries, encouraging investment in other currencies.
Trump has been explicit that he would like to fire Jerome Powell, Chair of the Federal Reserve, who has not cut interest rates as fast as Trump would like. The president has also tried to fire another governor, Lisa Cook, claiming she has committed mortgage fraud (at present, the courts have prevented her from being fired).
One voting member of the Federal Reserve has also resigned recently and Trump has replaced him with Stephen Miran, who was previously a member of Trump’s economic advisory council.
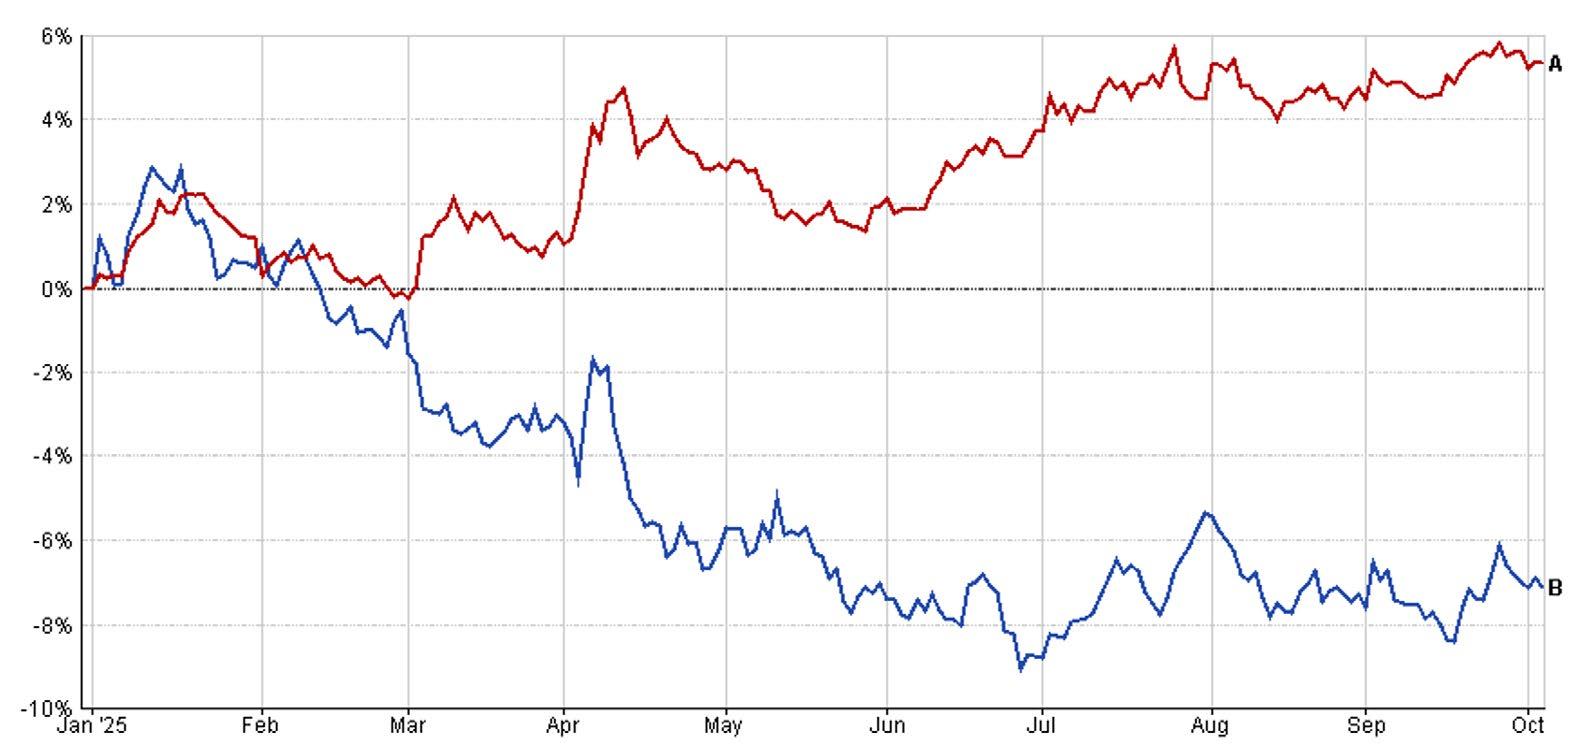
four: Euro vs US dollar (2025 so far) B
Source: FE Analytics, 31/12/2024 - 03/10/2025.

At the latest Federal Reserve meeting, there was one member of the committee whose opinions stood out from all the others. Whilst the voting was anonymous, it seemed likely that this person was Miran.
If Trump succeeds in replacing one or two governors (as well as the Chair) with others more aligned to his way of thinking, then this perhaps gives us a clue about what might happen to rates going forward.

Chart five shows what we call the “dot plot”. Every member of the Fed’s rate-setting committee is asked where they think rates ought to be at the end of this year, the next two years, and in the longer run.
These are then plotted on a chart, with each dot representing a different member’s views.
The blue line shows the median expectation, which tells us where the committee as a whole sees rates going.
There is one obvious outlier in 2025 whose expectations are a full 0.5% lower than anyone else’s (as shown by the orange line) – we assume that is Stephen Miran. In the following years, there is more of a spread of view, but again the lowest dot is about 0.5% below the median.
Chart five: The Fed’s rate-setting committee dot plot
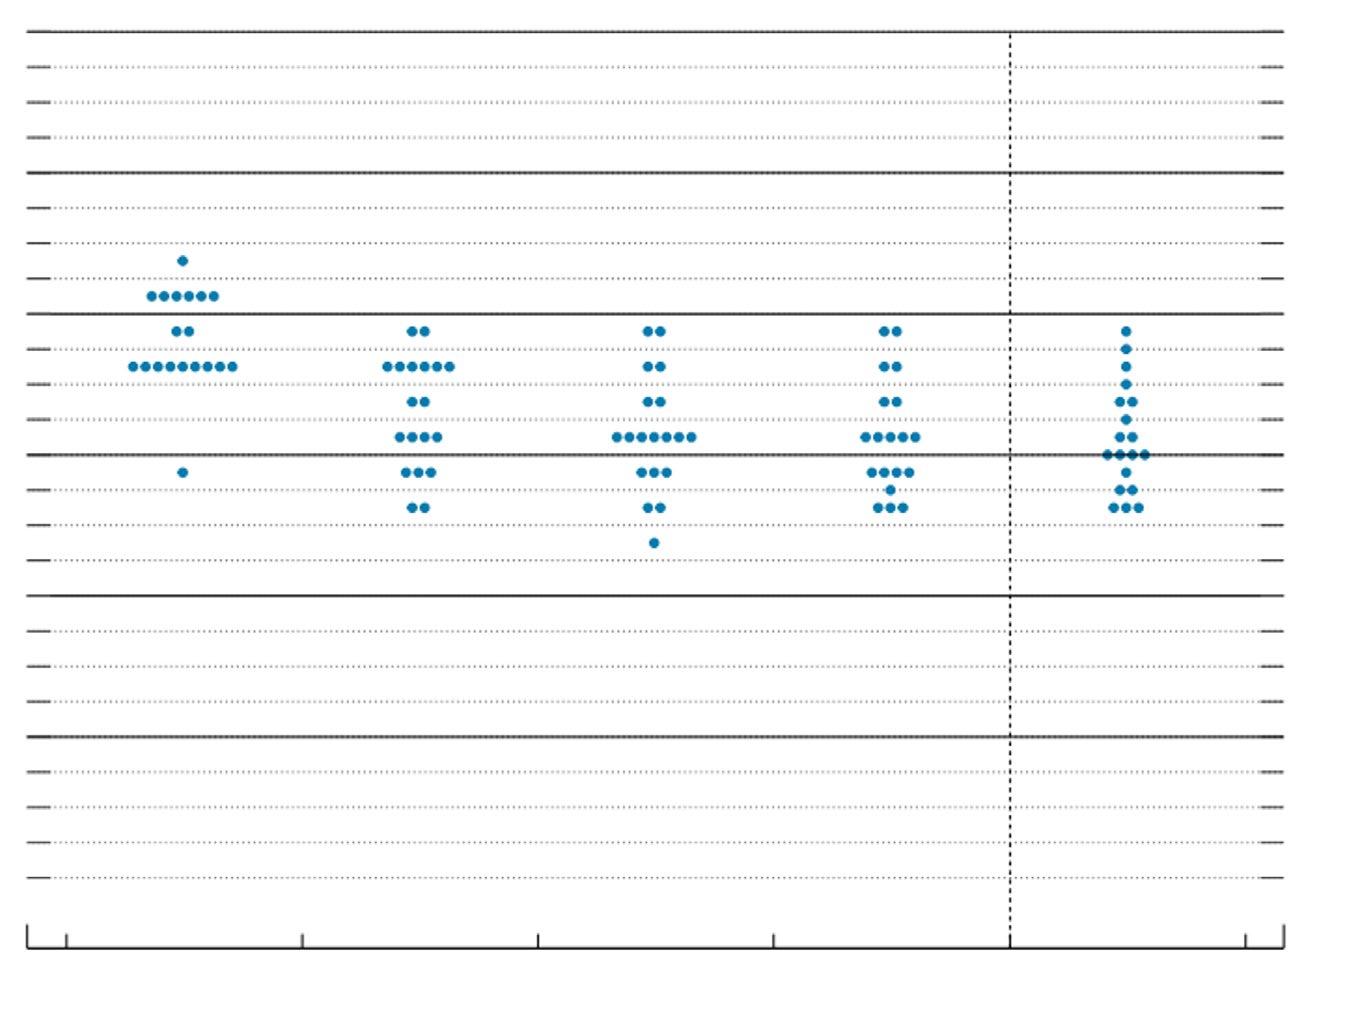
Miran?
Source: Federal Reserve September 2025.
If Trump can fill the committee with those aligned to his view, we can assume the committee as a whole might move closer to these outliers. As a result, there is a reasonable chance that interest rates in the US could move substantially lower.
What effect might this have? In the short term, this could be a boost for the economy, allowing consumers and businesses to borrow money at lower rates.
It might help the performance of both bonds and equities, both of which tend to respond well to rate cuts.
However, if rates are too low in the short term, this might lead the economy to overheat –if/when that happens, it is usually followed by a sharp downturn. Low rates might also allow inflation to climb even higher. As a result, low rates in the short term might actually lead to higher rates in the long term.
This is exacerbating a trend we’ve seen globally, which is that long-dated government bond yields keep rising. This is partly due to demographic trends where aging populations mean government spending on pensions, health and social care is expected to increase over coming decades. Unless governments can cut spending or increase taxes substantially, this means many countries are going to need to borrow more in the future. This was covered in September’s edition of The Pulse (from a UK perspective).

What does all this mean for portfolios?
We are wary about long-term government bonds given the above trends. On the other hand, we think short-term corporate bonds look attractive as they have decent yields for the amount of risk taken, with corporate balance sheets looking relatively healthy.
We think it makes sense to be lighter than usual in US assets. Notably equities, which are expensive relative to history, but also the dollar more generally.
However, rather than just reduce or avoid US equity exposure, instead we are investing in a “hedged” way.
For example, we’d rather buy a defined returns product based on the S&P 500 index, which we’d expect to provide a double-digit return if the market simply goes sideways, than buy direct US market exposure where we’re relying on future growth.
We also think it makes sense to use “portfolio insurance” – essentially allocating a small portion of our portfolios to assets that are expected to rise if markets fall, helping to cushion the blow. Doing so allows us to keep exposure higher than otherwise and therefore we should continue to benefit if markets rise in the short term.
Next month, we will publish our latest long-term investment assumptions. Initial results show we might expect lower equity returns going forward than we’ve seen over the last
decade or so. However, on the other hand, we might expect higher returns from fixed interest than we’ve seen historically. In essence, we expect, perhaps, similar levels of return from the two asset classes, but with less uncertainty in bonds than in equities. If correct, this is positive for our more cautious portfolios and means we’ll typically hold a bit more in bonds and a bit less in equities in our core portfolios.
Carrying out this study each year helps us decide how much we should allocate to each asset class. This year, we’ve utilised AI both to try and improve our forecasting capabilities, but also to help determine what might be the optimal asset allocation for each level of risk. This has been helpful in many ways but has also highlighted the limitations and challenges still to be overcome.
AI is driving stock market returns in the short term, and will no doubt change the way we work over the long term. Hopefully, it will help make us all more productive, boosting economic growth and helping governments to deal with their debt issues as a result. We are optimistic about the potential benefits, but wary that markets may have got ahead of themselves in their excitement, ignoring some of the risks that remain present.
Past performance is never a guide to future performance. Investments will fall as well as rise.
Any performance targets shown are what we believe are realistic long-term returns. They are never guaranteed.
None of the information in this document constitutes a recommendation. Please contact your adviser before taking any action.
Unless stated otherwise:
• All performance statistics are from Financial Express Analytics on a bid-bid basis with income reinvested.
• All performance data is to 5 October 2025.
• Model portfolio performance is stated after a 0.5% investment management fee with no adjustment for financial planning or platform charges.
• Your own performance may vary from that shown due to dividend pay dates, transaction dates, contributions and withdrawals.
• Actual performance may also differ slightly due to constraints over how we can reflect fees and discounts from fund managers. These are assumed not to change over the whole investment period. In reality, discount levels change as we change the funds in which we invest.
• Individual sector portfolios are shown with no charges taken off or fund manager discounts applied.
For details of your own portfolio performance, please refer to your half-yearly statement from the wrap platform in which you are invested. We will also provide personalised performance information at your regular reviews.

Head Office
Ascot House, Epsom Avenue, Handforth, Wilmslow, Cheshire SK9 3DF
Chester Office 19a Telford Court, Chester Gates Business Park, Chester CH1 6LT
New enquiries: 0161 383 3335
Existing clients: 0161 486 2250 askus@equilibrium.co.uk www.equilibrium.co.uk