DAILY REPORT 20th AUGUST 2014
Global markets at a glance Asian stocks were steady on Wednesday after strong U.S. housing data lifted Wall Street shares, helping nudge Treasury yields higher and keeping the dollar well bid against the euro and yen. The U.S. Federal Reserve, will continue to retain their easy money policies for a while. Tokyo's Nikkei gained 0.1 %. MSCI's broadest index of Asia-Pacific shares outside Japan was flat. European shares rose in early trading on Tuesday, extending the previous session's rally, as investor concern over the conflict in Ukraine began to ease. Germany's DAX outperformed on Tuesday, up 1%. The index has gained nearly 4 % in the past 10 days but is still down 7% since mid-June. Wall Street US stocks ended higher for the second straight session on Tuesday, as robust housing data and strong earnings from Dow component Home Depot overshadowed lingering concerns about the conflict in Ukraine. With the day's gains, the S&P 500 ended within 10 points of its all-time intraday high of 1,991.39 reached on July 24. The Nasdaq ended on Tuesday at yet another 14-year high. The Dow Jones industrial average rose 80.85 points, or 0.48%, to close at 16,919.59. The S&P 500 gained 9.86pts, or 0.50%, to end at 1,981.60. The Nasdaq added 19.20 pts, or 0.43%, to finish at 4,527.51. Previous day Roundup Equity benchmarks saw yet another record closing high with the Nifty hitting 7900 level intraday on Tuesday, maintaining upward move for the sixth consecutive session supported by positive global cues and easing geo-political tensions. The 30-share BSE Sensex rose 29.71 pts to 26420.67 while the Nifty hit a record high of 7918.55, before ending the day at 7897.50, up 23.25 points compared to previous day’s closing value. The broader markets outperformed benchmarks with the BSE Midcap and Smallcap indices climbing over a % each.
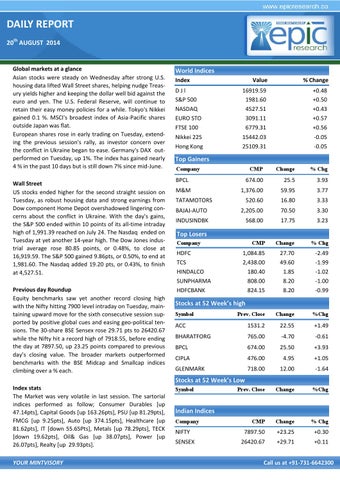
World Indices Index DJl S&P 500 NASDAQ EURO STO FTSE 100 Nikkei 225 Hong Kong
Value
% Change
16919.59 1981.60 4527.51 3091.11 6779.31 15442.03 25109.31
+0.48 +0.50 +0.43 +0.57 +0.56 -0.05 -0.05
Top Gainers Company
CMP
Change
% Chg
674.00
25.5
3.93
1,376.00
59.95
3.77
520.60
16.80
3.33
BAJAJ-AUTO
2,205.00
70.50
3.30
INDUSINDBK
568.00
17.75
3.23
CMP
Change
% Chg
1,084.85 2,438.00 180.40 808.00 824.15
27.70 49.60 1.85 8.20 8.20
-2.49 -1.99 -1.02 -1.00 -0.99
Prev. Close
Change
%Chg
ACC
1531.2
22.55
+1.49
BHARATFORG
765.00
-4.70
-0.61
BPCL
674.00
25.50
+3.93
CIPLA
476.00
4.95
+1.05
GLENMARK
718.00
12.00
-1.64
Prev. Close
Change
%Chg
CMP
Change
% Chg
7897.50
+23.25
+0.30
26420.67
+29.71
+0.11
BPCL M&M TATAMOTORS
Top Losers Company
HDFC TCS HINDALCO SUNPHARMA HDFCBANK
Stocks at 52 Week’s high Symbol
Stocks at 52 Week’s Low Index stats The Market was very volatile in last session. The sartorial indices performed as follow; Consumer Durables [up 47.14pts], Capital Goods [up 163.26pts], PSU [up 81.29pts], FMCG [up 9.25pts], Auto [up 374.15pts], Healthcare [up 81.62pts], IT [down 55.65Pts], Metals [up 78.29pts], TECK [down 19.62pts], Oil& Gas [up 38.07pts], Power [up 26.07pts], Realty [up 29.93pts]. YOUR MINTVISORY
Symbol
Indian Indices Company
NIFTY SENSEX
Call us at +91-731-6642300