Special Report 27-Jun-2018
Global markets at a glance An escalating trade dispute between the United States and other leading economies battered US stocks on Monday, handing the S&P 500 and Nasdaq their steepest losses in more than two months. The Dow Jones Industrial Average ended the session below its 200-day moving average for the first time since June 2016.The S&P 500 tumbled as much as 2 percent early Monday on reports that the U.S. Treasury Department was drafting curbs that would block firms with at least 25 percent Chinese ownership from buying U.S. tech firms.
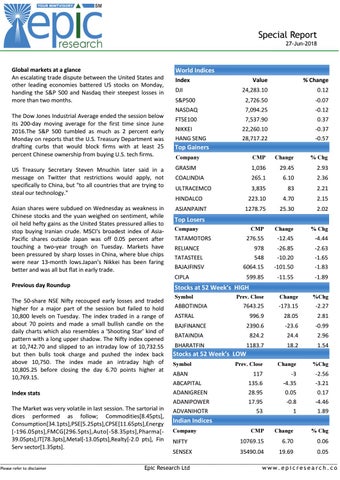
World Indices Index
Value
% Change
24,283.10
0.12
S&P500
2,726.50
-0.07
NASDAQ FTSE100
7,094.25 7,537.90
-0.12 0.37
22,260.10 28,717.22
-0.37 -0.57
DJI
NIKKEI HANG SENG
Top Gainers Company
CMP
Change
% Chg
US Treasury Secretary Steven Mnuchin later said in a message on Twitter that restrictions would apply, not specifically to China, but "to all countries that are trying to steal our technology."
GRASIM
1,036
29.45
2.93
COALINDIA
265.1
6.10
2.36
ULTRACEMCO
3,835
83
2.21
223.10
4.70
2.15
Asian shares were subdued on Wednesday as weakness in Chinese stocks and the yuan weighed on sentiment, while oil held hefty gains as the United States pressured allies to stop buying Iranian crude. MSCI's broadest index of AsiaPacific shares outside Japan was off 0.05 percent after touching a two-year trough on Tuesday. Markets have been pressured by sharp losses in China, where blue chips were near 13-month lows.Japan's Nikkei has been faring better and was all but flat in early trade.
ASIANPAINT
1278.75
25.30
2.02
CMP
Change
% Chg
276.55
-12.45
-4.44
978 548 6064.15
-26.85 -10.20 -101.50
-2.63 -1.65 -1.83
599.85
-11.55
-1.89
HINDALCO
Top Losers Company
TATAMOTORS RELIANCE TATASTEEL BAJAJFINSV CIPLA
Previous day Roundup The 50-share NSE Nifty recouped early losses and traded higher for a major part of the session but failed to hold 10,800 levels on Tuesday. The index traded in a range of about 70 points and made a small bullish candle on the daily charts which also resembles a 'Shooting Star' kind of pattern with a long upper shadow. The Nifty index opened at 10,742.70 and slipped to an intraday low of 10,732.55 but then bulls took charge and pushed the index back above 10,750. The index made an intraday high of 10,805.25 before closing the day 6.70 points higher at 10,769.15. Index stats The Market was very volatile in last session. The sartorial in dices performed as follow; Commodities[8.45pts], Consumption[34.1pts],PSE[5.25pts],CPSE[11.65pts],Energy [-196.05pts],FMCG[296.5pts],Auto[-58.35pts],Pharma[39.05pts],IT[78.3pts],Metal[-13.05pts],Realty[-2.0 pts], Fin Serv sector[1.35pts].
Stocks at 52 Week’s HIGH Symbol
Prev. Close
Change
%Chg
7643.25
-173.15
-2.27
996.9
28.05
2.81
BAJFINANCE
2390.6
-23.6
-0.99
BATAINDIA
824.2
24.4
2.96
BHARATFIN
1183.7
18.2
1.54
ABBOTINDIA ASTRAL
Stocks at 52 Week’s LOW Symbol
ABAN ABCAPITAL ADANIGREEN ADANIPOWER ADVANIHOTR
Prev. Close
Change
%Chg
117 135.6 28.95 17.95 53
-3 -4.35 0.05 -0.8 1
-2.56 -3.21 0.17 -4.46 1.89
Indian Indices Company
CMP
Change
% Chg
NIFTY
10769.15
6.70
0.06
SENSEX
35490.04
19.69
0.05
_____________________________________________________________________________________________________________________ Please refer to disclaimer Epic Research Ltd www.epicresearch.co